2012 california infrastructure report card - … · 5/1/2017 · 2012 california infrastructure...
TRANSCRIPT

2012 California Infrastructure Report Card
Yazdan (Yaz) Emrani, P.E.Yazdan (Yaz) Emrani, P.E.
CC Ch i C lif i R t C d E ti Ch i C lif i R t C d E ti CoCo--Chair, California Report Card Executive Chair, California Report Card Executive CommitteeCommittee
Senior VP/Principal, Hall & Foreman, Inc.Senior VP/Principal, Hall & Foreman, Inc.
February 20, 2014

InfrastructureInfrastructureReport Card?Report Card?
Why Do We Need Why Do We Need One?One?yy

To Assess the State of Our To Assess the State of Our InfrastructureInfrastructure
To Properly Plan for the FutureTo Properly Plan for the Future To Properly Plan for the FutureTo Properly Plan for the Future
To Develop Timely &To Develop Timely &p yp yAdequate FundingAdequate FundingOpportunitiesOpportunitiesOpportunitiesOpportunities
To have a Uniform & and To have a Uniform & and Consistent MessageConsistent Message
To Educate and To Educate and To Educate and To Educate and CommunicateCommunicate

Historical Reluctance to FundHistorical Reluctance to FundHistorical Reluctance to Fund Historical Reluctance to Fund Infrastructure Renewal Infrastructure Renewal
“Out of Sight, Out of Mind”Attit d L d t T B d O tAttitude Leads to Two Bad Outcomes:
Unexpected Failures
M j R t I Major Rate Increases

Over the next 27 years, California’s Over the next 27 years, California’s l dl dPopulation is Expected to Grow at a Population is Expected to Grow at a
Rapid Pace. It is Estimated that by Rapid Pace. It is Estimated that by h h ll bh h ll bthe Year 2040, there will be More the Year 2040, there will be More
than 54,000,000 People that will Call than 54,000,000 People that will Call C l fC l fCalifornia HomeCalifornia Home
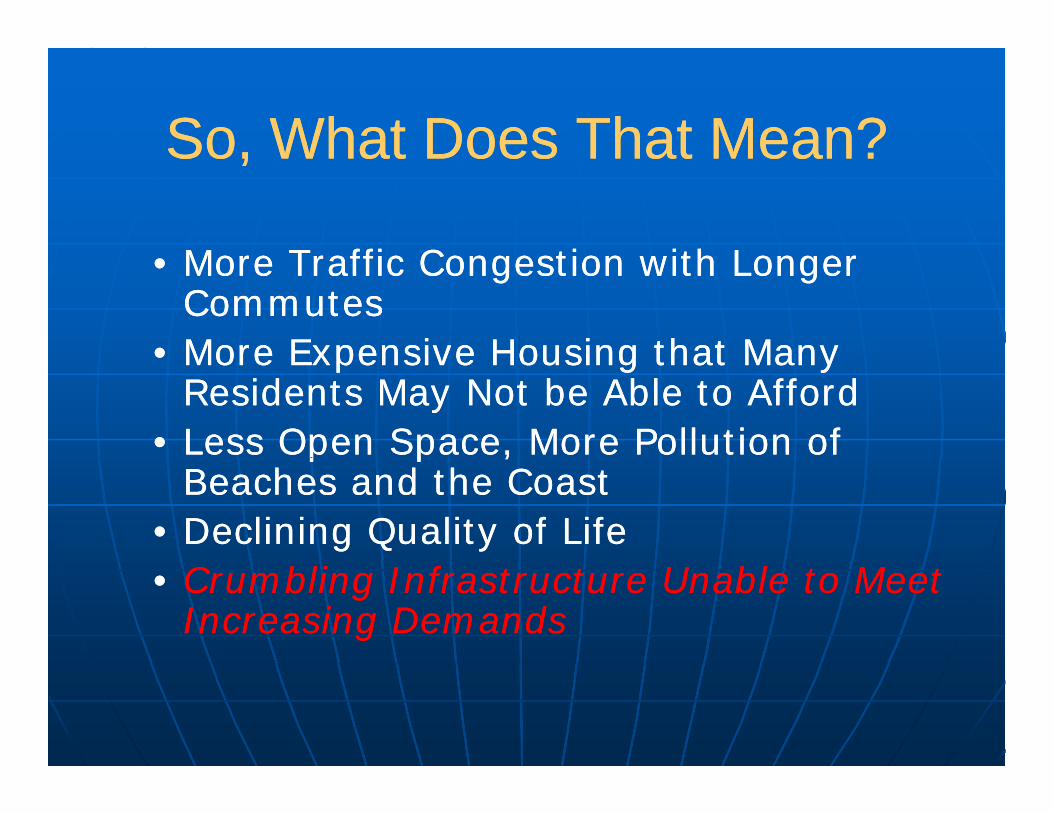
So What Does That Mean?So What Does That Mean?So, What Does That Mean?So, What Does That Mean?
M T ffi C ti ith L M T ffi C ti ith L •• More Traffic Congestion with Longer More Traffic Congestion with Longer CommutesCommutes
•• More Expensive Housing that Many More Expensive Housing that Many •• More Expensive Housing that Many More Expensive Housing that Many Residents May Not be Able to AffordResidents May Not be Able to Afford
•• Less Open Space, More Pollution of Less Open Space, More Pollution of p p ,p p ,Beaches and the CoastBeaches and the Coast
•• Declining Quality of LifeDeclining Quality of Life•• Crumbling Infrastructure Unable to Meet Crumbling Infrastructure Unable to Meet
Increasing DemandsIncreasing Demands

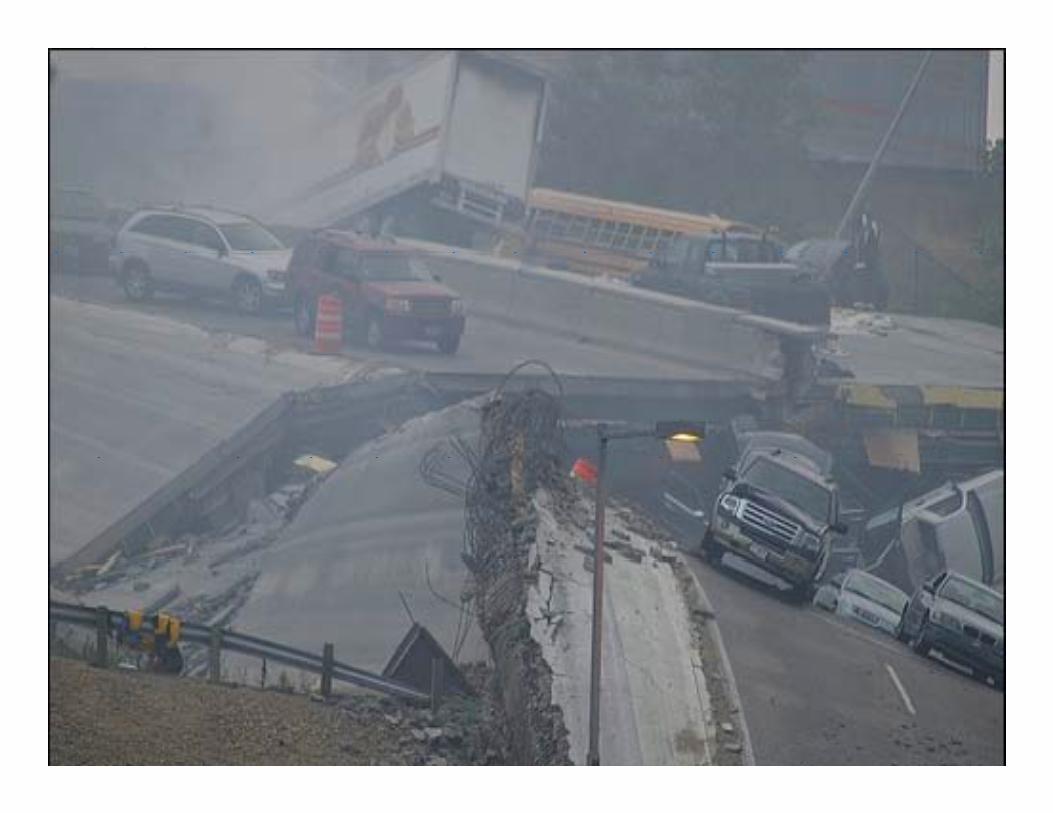
Crumbling InfrastructureCrumbling InfrastructureSlide ShowSlide ShowSlide ShowSlide Show


Minnesota IMinnesota I--35W Bridge 35W Bridge 2007200720072007


Valley Village in Los AngelesValley Village in Los AngelesValley Village in Los AngelesValley Village in Los AngelesSeptember 2009September 2009pp

Los Angeles Sept. 2009

Pacific Coast HighwayPacific Coast HighwayPacific Coast HighwayPacific Coast HighwayBig Sur Big Sur
March 2011March 2011


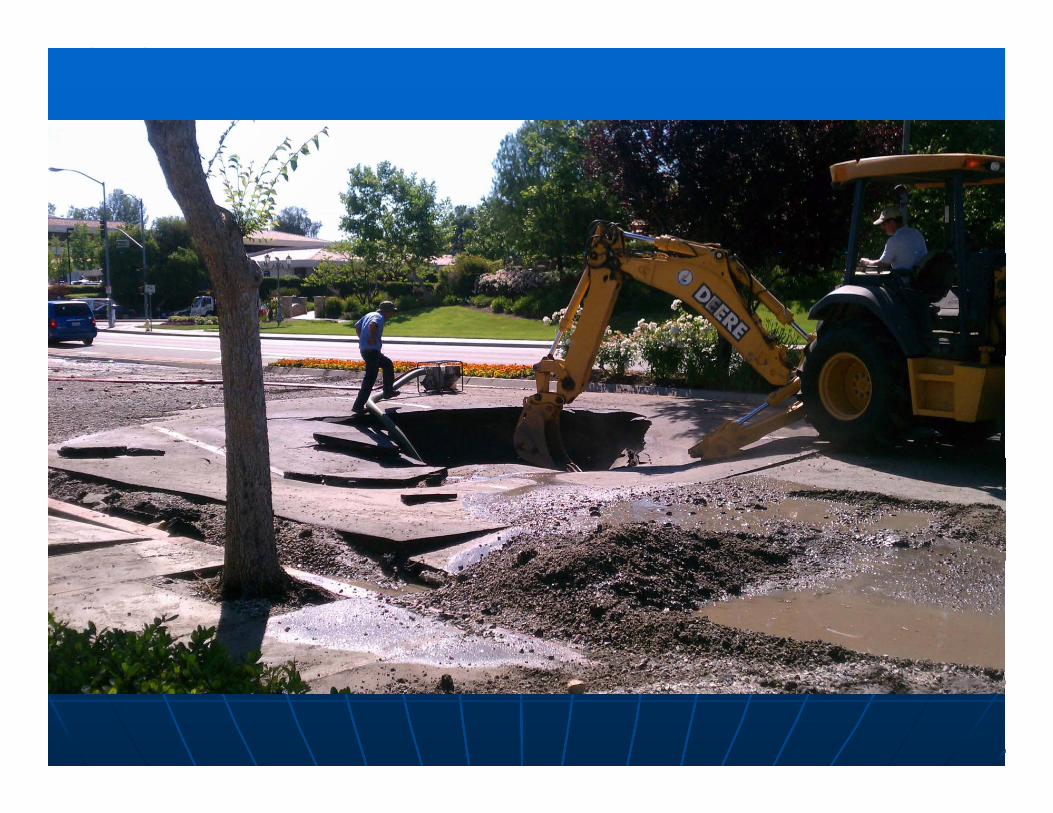
W t H ll dW t H ll dWest HollywoodWest HollywoodJune 2012June 2012June 2012June 2012

West Hollywood June

City of CalabasasCity of CalabasasMay 2013May 2013May 2013May 2013


OUR GOALOUR GOALOUR GOALOUR GOAL
HELP TO IMPROVE HELP TO IMPROVE CALIFORNIA’S CALIFORNIA’S
INFRASTRUCTUREINFRASTRUCTUREINFRASTRUCTUREINFRASTRUCTURE
FORFORFORFOR
A HIGHER QUALITY OF LIFEA HIGHER QUALITY OF LIFE

California Infrastructure ReportCalifornia Infrastructure ReportCalifornia Infrastructure Report California Infrastructure Report Card (CAIRC)Card (CAIRC)
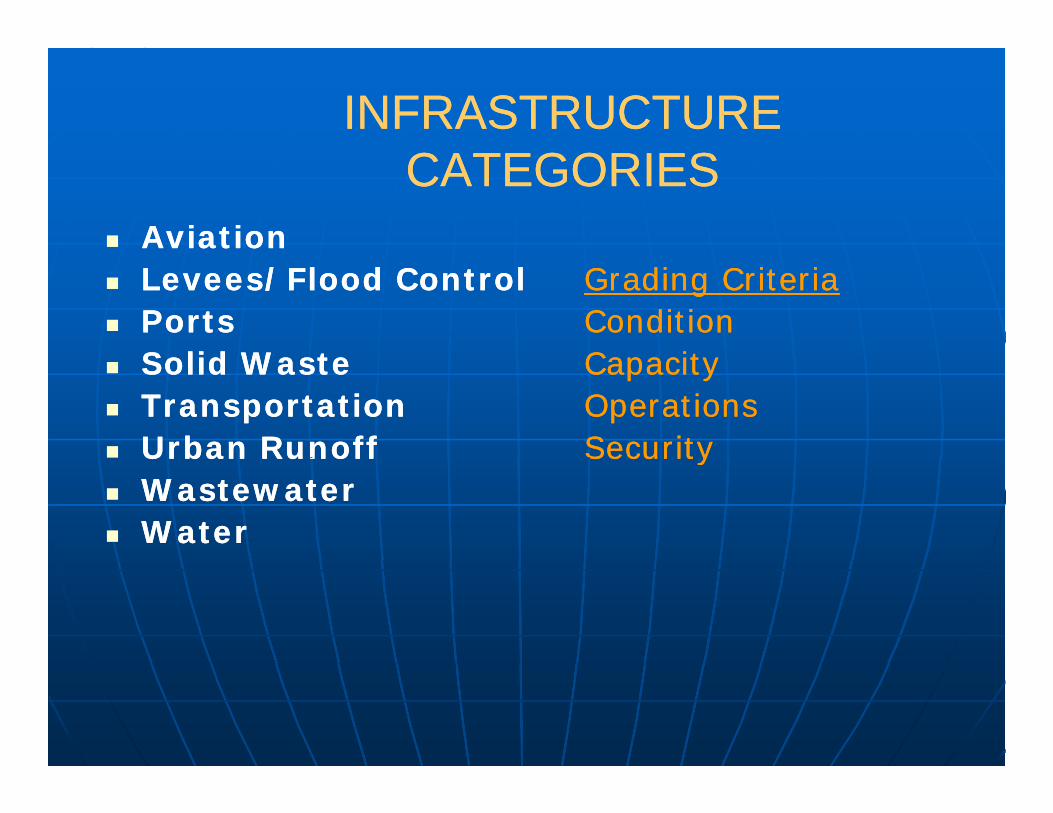
INFRASTRUCTURE INFRASTRUCTURE CATEGORIESCATEGORIES
AviationAviation Levees/Flood ControlLevees/Flood Control Grading CriteriaGrading Criteria PortsPorts ConditionCondition
S lid W tS lid W t C itC it Solid WasteSolid Waste CapacityCapacity TransportationTransportation OperationsOperations Urban Runoff Urban Runoff SecuritySecurityUrban Runoff Urban Runoff SecuritySecurity Wastewater Wastewater Water Water

So, How Did CA Do?So, How Did CA Do?
$65 Billion$65 BillionAnnual Need

This is not good is it??This is not good is it??This is not good, is it??This is not good, is it?? We must aim to remedy these problems in the We must aim to remedy these problems in the y py p
short term. short term.
Emergency repairs can cost anywhere from 5Emergency repairs can cost anywhere from 5--16 16 times more than ontimes more than on--time and preventive time and preventive maintenancemaintenancemaintenancemaintenance
In 2006 we projected an annual need of $ 37 In 2006 we projected an annual need of $ 37 billion. In 2012 that number is $ 65 billion. We billion. In 2012 that number is $ 65 billion. We are kicking the can down the road.are kicking the can down the road.

Wastewater C+ C+Wastewater C+ C+
100,000 Miles of Sewers & 900 Wastewater 100,000 Miles of Sewers & 900 Wastewater Treatment PlantsTreatment Plants
4 billion gallons of Wastewater Generated Every 4 billion gallons of Wastewater Generated Every 4 billion gallons of Wastewater Generated Every 4 billion gallons of Wastewater Generated Every Day by California’s Citizens & BusinessesDay by California’s Citizens & Businesses
SWRCD’s WDRs have helped highlight and SWRCD’s WDRs have helped highlight and stabilize collection systems conditionsstabilize collection systems conditionsstabilize collection systems conditionsstabilize collection systems conditions
State database shows efforts being made to State database shows efforts being made to improve collection systemsimprove collection systems
Annual InvestmentAnnual InvestmentNeed of $4.5 billionNeed of $4.5 billionNeed of $4.5 billionNeed of $4.5 billion

Wastewater BMPsWastewater BMPsWastewater BMPsWastewater BMPs1. Cities, counties, and special districts responsible for
wastewater system collection, conveyance, and or treatment have to be willing to review their rate system and revise it upward, if needed, to pay for much needed capital
dit d f iliti ’ O&Mexpenditures and facilities’ O&M
2. Reduce costs through effective management, efficient operations, and innovative use of technology such as GIS and Computerized Maintenance Management Systems or CMMS
3. Do more with less. Develop optimized decision making processes by applying the principles of effective asset management for delivering desired service levels at lowest life-cycle costs

Water C+ CWater C+ CWater C CWater C C
Water is Vital to Life for all CaliforniansWater is Vital to Life for all Californians
California’s Delta California’s Delta -- A Vital Role in Water DeliveryA Vital Role in Water Delivery
Continuing Need for Renewal & Replacement, Continuing Need for Renewal & Replacement, Maintenance, Security & Reliability FundingMaintenance, Security & Reliability Funding
Th I t t illTh I t t ill These Investments willThese Investments willIncrease Sustainability &Increase Sustainability &Ensure Future WaterEnsure Future WaterSupply & ReliabilitySupply & Reliability
Annual InvestmentAnnual Investment Annual InvestmentAnnual InvestmentNeed of $4.6 BillionNeed of $4.6 Billion

Evaluation ProcessEvaluation ProcessEvaluation ProcessEvaluation Process Compile and Review Compile and Review
Water Infrastructure Water Infrastructure Reports and Grades Reports and Grades Reports and Grades Reports and Grades
Compile and Review Compile and Review State Regional and State Regional and State, Regional and State, Regional and Federal reports on CA Federal reports on CA water infrastructurewater infrastructure
Review past CA report Review past CA report card materials and card materials and recent ASCE National recent ASCE National recent ASCE National recent ASCE National Report CardReport Card
Review ASCE “Failure Review ASCE “Failure Review ASCE “Failure Review ASCE “Failure to Act” Report on to Act” Report on Water InfrastructureWater Infrastructure

But Wait, Do We have Any But Wait, Do We have Any Challenges with Our Drinking Challenges with Our Drinking
Water Sources?Water Sources?Water Sources?Water Sources?


Delta is not sustainableDelta is not sustainable


$11.1 B Water Bond Highlights$11.1 B Water Bond Highlights $455 million for drought relief projects,
disadvantaged communities, small community wastewater treatment improvements and safewastewater treatment improvements and safe drinking water revolving fund.
$1.4 billion for "integrated regional water management projects"
$2.25 billion for projects that "support delta sustainability options"sustainability options .
$3 billion for water storage projects $1.7 billion for ecosystem and watershed protection $1.7 billion for ecosystem and watershed protection
and restoration projects in 21 watersheds. $1 billion for groundwater protection and cleanup. $1.25 billion for "water recycling and advanced
treatment technology projects".

BayBay‐‐Delta Delta Conservation Conservation
PlanPlanPlan Plan
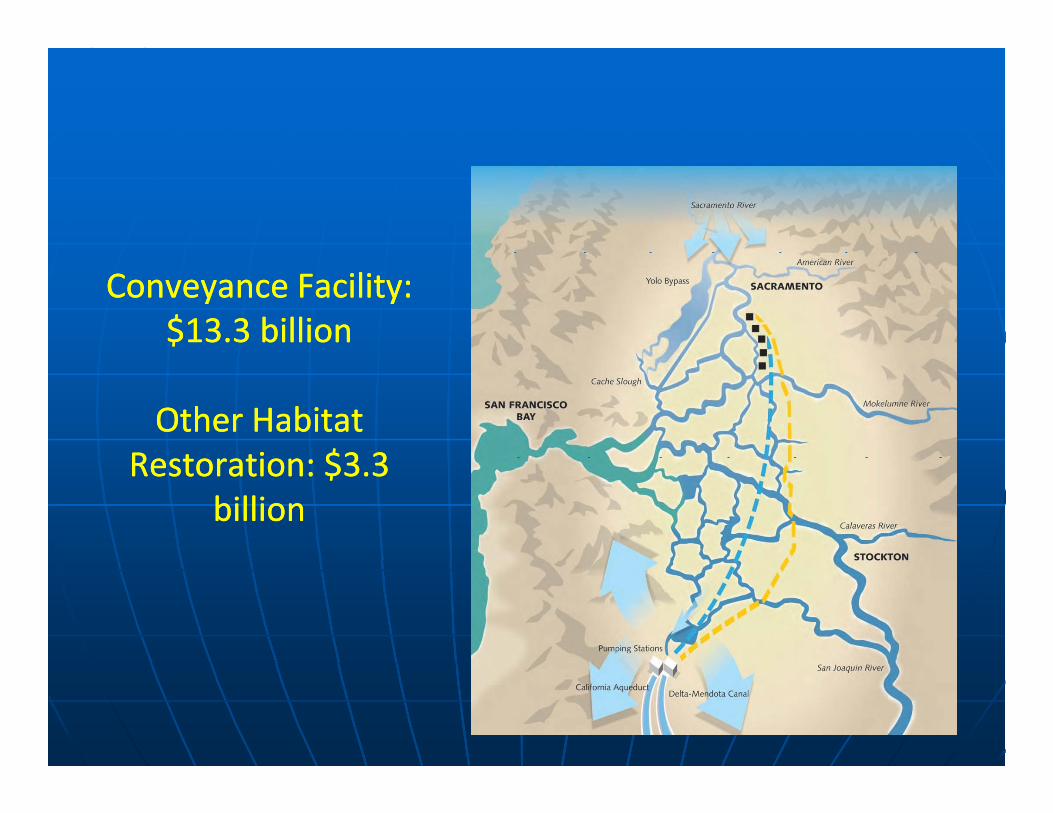
Conveyance Facility: Conveyance Facility: $13.3 billion $13.3 billion
Other Habitat Other Habitat R t ti $3 3R t ti $3 3Restoration: $3.3 Restoration: $3.3
billionbillion
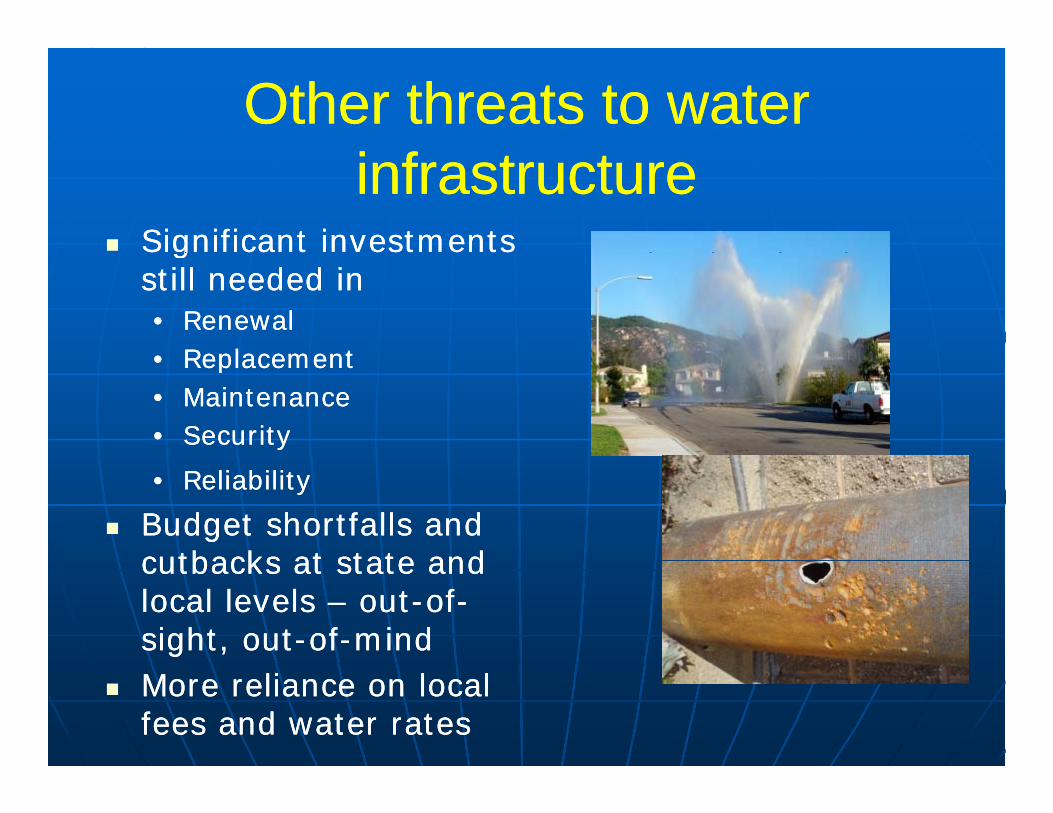
Other threats to water Other threats to water infrastructureinfrastructure
Significant investments Significant investments ggstill needed in still needed in •• RenewalRenewal•• ReplacementReplacement•• ReplacementReplacement•• MaintenanceMaintenance•• SecuritySecurity
•• ReliabilityReliability
Budget shortfalls and Budget shortfalls and cutbacks at state and cutbacks at state and cutbacks at state and cutbacks at state and local levels local levels –– outout--ofof--sight, outsight, out--ofof--mindmind
More reliance on local More reliance on local fees and water ratesfees and water rates

Recommended ActionsRecommended Actions Address short and Address short and
long term threats to long term threats to long term threats to long term threats to DeltaDelta
Additional Additional groundwater and groundwater and surface water storagesurface water storage
Seawater and brackish Seawater and brackish Seawater and brackish Seawater and brackish water desalinationwater desalination
Implement water use Implement water use efficiency practicesefficiency practices
Support integrated Support integrated regional water regional water regional water regional water managementmanagement

Water Infrastructure Funding NeedWater Infrastructure Funding Need DWR projects $1 billion capital DWR projects $1 billion capital
improvement through 2020improvement through 2020 Delta improvements Delta improvements -- $16 $16 Delta improvements Delta improvements -- $16 $16
billion, $11 billion over next 10 billion, $11 billion over next 10 yearsyears
7 regional report card 7 regional report card statewide estimate statewide estimate -- $32 billion$32 billion
Total 10 year investment need Total 10 year investment need -- $46 billion or $4.6 billion per $46 billion or $4.6 billion per $ $ p$ $ pyear to improve gradeyear to improve grade

How Do we Fund These How Do we Fund These Recommendations?Recommendations?Recommendations?Recommendations?
1.1. The “SelfThe “Self--Help” Model Help” Model
2.2. Pay As You GoPay As You Go
3.3. Public Private Partnership (PPP)Public Private Partnership (PPP)
4.4. Reinvigorate the State Revolving Loan Fund (SRF) Reinvigorate the State Revolving Loan Fund (SRF)
programprogramprogramprogram
5.5. Explore the potential for aExplore the potential for a Water Infrastructure Water Infrastructure
Finance Innovations AuthorityFinance Innovations Authority
6.6. Establish a state Water Infrastructure Trust Fund, Establish a state Water Infrastructure Trust Fund,
i.e., Proposition 53 from 2003i.e., Proposition 53 from 2003

Proposition 53Proposition 53 California Proposition 53California Proposition 53, or the, or the California TwentyCalifornia Twenty--California Proposition 53California Proposition 53, or the, or the California TwentyCalifornia Twenty
First Century Infrastructure Investment Fund ActFirst Century Infrastructure Investment Fund Act, , was on thewas on the October 7, 2003October 7, 2003 special election ballot special election ballot inin CaliforniaCalifornia as aas a legislativelylegislatively--referred constitutional referred constitutional amendmentamendment. .
Proposition 53 would have increased the amount of Proposition 53 would have increased the amount of California's General Fund revenue committed to payCalifornia's General Fund revenue committed to pay--asas--youyou--go capital outlay projects for both state and local go capital outlay projects for both state and local governments.governments.
Some of the specific provisions of Proposition 53 were:Some of the specific provisions of Proposition 53 were:•• Specified percentages of General Fund revenues Specified percentages of General Fund revenues to be setto be set--aside for aside for
acquisition, construction, rehabilitation, modernization, or renovation acquisition, construction, rehabilitation, modernization, or renovation of infrastructure.of infrastructure.
•• Expenditures would have to be divided equally between state projects Expenditures would have to be divided equally between state projects •• Expenditures would have to be divided equally between state projects Expenditures would have to be divided equally between state projects and local projectsand local projects, other than school and community college district , other than school and community college district projects, including local street, transportation, water, park, and open projects, including local street, transportation, water, park, and open space projects.space projects.
•• The amount of first setThe amount of first set aside scheduled for 2006aside scheduled for 2006 07 would have been 07 would have been •• The amount of first setThe amount of first set--aside scheduled for 2006aside scheduled for 2006--07 would have been 07 would have been 1%; increasing 0.3% annually to 3% and then remaining fixed1%; increasing 0.3% annually to 3% and then remaining fixed. Set. Set--asides would have been subject to increase, decrease, or suspension asides would have been subject to increase, decrease, or suspension with revenue increases and decreases.with revenue increases and decreases.

Water BMPsWater BMPs1. Support funding for and implement those projects
throughout the state required to address the local d i l i f t t d id tifi d i thiand regional infrastructure needs identified in this
report.2. Improve the reliability of California’s water supply by2. Improve the reliability of California s water supply by 3. Aggressively support public education, technical
assistance, and economic incentives aimed at ti d t i i b h i l h tcreating and sustaining behavioral changes to
wisely use our limited water resources.4. Implement appropriate security measures to protect4. Implement appropriate security measures to protect
our infrastructure and drinking water quality from the potential impacts of natural disasters and/or terrorists attacksterrorists attacks.


““Just invest in those infrastructure Just invest in those infrastructure that you want to keep!!!”that you want to keep!!!”

[email protected]@hfinc.com714714 665665 45224522714714--665665--45224522
www.ascecareportcard.orgwww.ascecareportcard.org
Questions?Questions?Questions?Questions?
