2012 desjardins group annual report · group’s communications corporate division and finance...
TRANSCRIPT

ANNUAL REPORT
2012
EDUCATION
CREATIVITY
DREAMS
SUCCESS
PROJECTS
COOPERATING
EVERY DAY
TO SUPPORT YOUR
GOALS
VALUES

TABLE OF CONTENTSMessage from the President 3
Corporate highlights 4
Management’s Discussion and Analysis 14
Financial Statements 98
Corporate governance 183
Glossary of financial terms 203
HEAD OFFICEFédération des caisses Desjardins du Québec 100 Des Commandeurs Street Lévis, QC G6V 7N5 Canada Telephone: 418-835-8444 Toll-free: 1-866-835-8444 Fax: 418-833-5873
Graphic design: lg2 Production: Graphic Design, Communications, Desjardins Group
This Annual Report was produced by Desjardins Group’s Communications Corporate Division and Finance Executive Division and Office of the CFO (Finance Division).
2

REACHING OUT TO OUR MEMBERS AND CLIENTSAt Desjardins Group, our mission is first and foremost to serve our members and clients and to help them reach their financial goals and achieve their projects.
Our every effort is focused on this mission.
We always put people first—it’s what’s at the core of our cooperative difference. In the same vein, we must look forward and plan for future generations by giving ourselves a long-term vision.
STRONG FINANCIAL RESULTSIn 2012, for the second year in a row, our surplus earnings reached $1.6 billion.
We’ve also kept our capital ratios above regulatory requirements—Tier 1 capital ratio at 16.8% and total capital ratio at 19.3%—thereby making sure the Desjardins Group foundations stay strong.
Desjardins Group’s assets increased by 3.5% in 2012, to stand at close to $200 billion. We are continuing to pursue our development initiatives, both in Quebec and in other parts of Canada.
DRAWING ON OUR FINANCIAL FLEXIBILITYWe’re proud of our 2012 results for one simple reason: A strong and growing Desjardins is a Desjardins that can contribute even more to the economy, to society and to individuals.
And Desjardins contributed a great deal in 2012. We gave back the equivalent of $1 million a day to members and communities in the form of donations, scholarships and financial support for numerous projects in the fields of education, healthcare, culture and cooperation.
This past year we also introduced new financial products and tools designed for our members and clients–individuals and businesses alike. To ensure the growth of Desjardins Group and to improve our services, we’ve continued to invest in our IT systems and infrastructure.
A REMARKABLE YEAR THAT HAS MOVED US FORWARDDesjardins played a significant role in promoting the 2012 International Year of Cooperatives. Backed by our partners, we co-organized the International Summit of Cooperatives, which brought together 2,800 people from over 90 countries in Quebec City and Lévis.
It was a truly inspiring event for all of us at Desjardins and for all the participants! During the Summit, we discussed and debated different ways to enhance the performance of cooperative organizations, as well as their potential to innovate, for the benefit of their members. It also served as a platform where we shared best practices and strengthened ties, with a view to developing our businesses.
WORKING TOGETHER TO SERVE OUR MEMBERSThank you to all our Desjardins members and clients.
It’s by striving to serve these members and clients better and making their satisfaction our priority that we are able to rethink and improve all aspects of the services we provide.
I would like to commend all Desjardins Group officers, managers and employees on their sustained efforts. Their unwavering commitment makes it possible for us to work together day in and day out to achieve a common objective—to improve our members’ and clients’ relationships with Desjardins. Ultimately, our cooperative financial group will continue to carry out its mission for generations to come.
MONIQUE F. LEROUX, c.m., fcpa, fcaChair of the Board, President and Chief Executive Officer of Desjardins Group
MESSAGE FROM THE PRESIDENT32012 DESJARDINS GROUP ANNUAL REPORT – MESSAGE FROM THE PRESIDENT

CORPORATE HIGHLIGHTS
DESJARDINS GROUP IS: $196.7 billion in assets
Nearly 5.6 million members
The largest cooperative financial group in Canada, with
- 397 caisses, 897 service centres and 43 business centres across Quebec and Ontario
- 44,942 employees and 5,268 elected officers
- A strong advisory team of representatives and experts
More than $85 million reinvested in the community through sponsorships, scholarships and charitable partnerships
$1,591 million in surplus earnings
Tier 1 capital ratio of 16.8%
$11.3 billion in operating income
NAMED BEST CORPORATE CITIZEN IN CANADA
RANKED FOURTH SAFEST FINANCIAL INSTITUTION IN NORTH AMERICA AND 23RD WORLDWIDEMADE THE LIST OF THE WORLD’S 50 SAFEST BANKS 2013 PUBLISHED BY NEW YORK–BASED MAGAZINE GLOBAL FINANCE
NAMED ONE OF CANADA’S TOP 100 EMPLOYERS
THE FIFTH LARGEST COOPERATIVE FINANCIAL GROUP IN THE WORLD ACCORDING TO THE WORLD CO-OPERATIVES MONITOR, October 2012
NEARLY
5,6MILLION MEMBERS
$196.7BILLION IN ASSETS
ENTHUSIASTIC MEMBER RESPONSE TO OUR CAPITAL SHARE ISSUE In June 2012, Desjardins Group issued its first capital shares of the Fédération des caisses Desjardins du Québec. Within just six months, we achieved 85% of our objective, with share sales totalling over $1 billion at year-end.
5th
4 2012 DESJARDINS GROUP ANNUAL REPORT – CORPORATE HIGHLIGHTS
FOR THOSE IN SEARCH OF SIMPLICITY
EVERYTHING UNDER ONE ROOF
Caisse members have access to a full range of financial services—all in one place. Desjardins is the only financial institution in Canada that can offer all of this under one roof: banking services, investment products, life and health insurance, and property and casualty insurance.
THE READY-TO-DRIVE LOAN: ONE OF A KIND IN ITS FIELD
The Desjardins Ready-to-Drive Loan is a financing product for automobiles and recreational vehicles. In addition to having competitive rates and repayment terms, it comes with insurance coverage and some great discounts. That means substantial savings, plus:
• Life insurance included at no additional cost• Your choice of fixed or variable interest rate• The option to pay off your loan early, in part or in
full, with no penalty • Free roadside assistance
MEMBER AND CLIENT ADVANTAGES
141,000LIKES ON OUR FACEBOOK PAGE
FOR TECH-SAVVY CONSUMERS
A GROWING SOCIAL MEDIA PRESENCE
Desjardins joined the world of social media in 2009 and is continuing to increase its presence.
• With nearly 141,000 “likes” on December 31, 2012, Desjardins Group’s Facebook page ranked second among financial institutions in Canada (www.facebook.com/desjardins).
• Desjardins has the third most-visited YouTube account among Canadian financial institutions, with more than 350,000 views on its videos on December 31, 2012.
TOUCH SCREEN ATMs: YOUR ACCOUNT AT YOUR FINGERTIPS
Desjardins introduced a new generation of touchscreen ATMs in 2012 that allow members to view information about their accounts, read personalized messages from their caisse, and have their transaction receipts emailed to them.
MOBILE APPS: STAY CONNECTED ON THE GO
In 2012, Desjardins introduced new mobile apps and smartphone features. Members can now view and manage pending transactions, add new service providers for bill payments, manage their budgets, and program payment reminder alerts.
52012 DESJARDINS GROUP ANNUAL REPORT – CORPORATE HIGHLIGHTS

FOR EXISTING AND FUTURE CO-OPS
FONDS ESSOR ET COOPÉRATION
In 2012, Desjardins joined forces with a number of partners to set up the Fonds Essor et coopération. The purpose of the fund is to provide cooperative and mutualist enterprises with patient capital, which is capital intended to generate long-term growth rather than immediate profit.
A TEAM OF EXPERTS HELPING QUEBEC COOPERATIVES
As a preferred partner of Quebec’s 3,300 cooperatives, Desjardins put together a team dedicated to supporting cooperative groups and ensuring their long-term growth. They provide a range of services for cooperatives and their members, including payroll services, card and payment services, life and health insurance, property and casualty insurance, development capital, and other specialized services.
FOR THE BUSINESS-MINDED
PRÊT À ENTREPRENDRE: A PROGRAM FOR PEOPLE WHO WANT TO START THEIR OWN BUSINESS
Prêt à entreprendre is a financing program with a three-year budget of $7 million that provides new entrepreneurs with interest-free loans, technical support and mentorship. It is designed to assist entrepreneurs during the first five years of their business—the most critical stage.
CAPITAL CROISSANCE PME
The Capital croissance PME program reached a milestone in 2012: providing assistance to its 125th Quebec business. The program is designed to help small- and medium-sized businesses pursue their development and growth goals in Quebec, other parts of Canada and abroad.
THE PREFERRED PARTNER OF
3,300COOPERATIVES
IN QUEBEC
6 2012 DESJARDINS GROUP ANNUAL REPORT – CORPORATE HIGHLIGHTS

A ONE-OF-A-KIND ADVISORY TEAM AT YOUR SERVICEAs a member or client of Desjardins, you have access to the expertise and support of:
• More than 1,400 financial planners• 313 investment advisors• Nearly 7,500 group savings representatives • 3,000 personal finance advisors • 259 life insurance representatives• 212 mortgage representatives • 892 business account managers • Close to 1,200 general insurance agents
INVESTMENT PRODUCTS THAT PROMOTE CORPORATE SOCIAL RESPONSIBILITYDesjardins Group offers investment products from companies that ascribe to socially responsible and environmentally friendly practices. In 2012, the assets of our socially responsible funds made up 5.5% of total Desjardins Fund assets, surpassing our 2010–2012 objective of 4.7%.
Value of our socially responsible funds: $831.2 million
GLOBAL EQUITY GUARANTEED INVESTMENT
The Global Equity Guaranteed Investment is an investment product whose criteria have been taking into account the effects of climate change since March 2009. It is composed of stocks of environmentally conscious companies that are actively working to combat climate change.
Value of the Global Equity Guaranteed Investment: $130.5 million
SOCIALLY INSPIRED FINANCIAL PRODUCTSIn addition to the range of traditional financial products we offer our members and clients, Desjardins also has a selection of solidarity-based financial products. Some examples:
DESJARDINS MUTUAL ASSISTANCE FUNDS
These funds are designed to help individuals in financial difficulty who don’t have access to mainstream credit by giving them access to:
• Independent advisory services from budgeting consultants
• Emergency interest-free loans, repayable within 24 months, ranging from $500 to $1,500
THE CRÉAVENIR PROGRAM
CRÉAVENIR is a financing program that supports 18- to 35-year-olds who have a business idea by providing start-up assistance and flexible financing, tailored to the specific needs of each entrepreneur.
CRÉAVENIR provides:
• Up to $7,200 in grants• Up to $15,000 in loans, repayable in three to five
years, with no payments due in the first year
CLOSE TO OUR MEMBERS AND CLIENTS
14,776EXPERTS TO SERVE OUR MEMBERS AND CLIENTS
$831.2MILLION
IN SOCIALLY RESPONSIBLE FUNDS
72012 DESJARDINS GROUP ANNUAL REPORT – CORPORATE HIGHLIGHTS

INTERNATIONAL BUSINESS DEVELOPMENT AND KNOWLEDGE SHARINGBUSINESS DEVELOPMENT
A FOOTHOLD IN EUROPE THROUGH OUR PARTNERSHIP WITH CRÉDIT MUTUEL
In early 2012, Desjardins opened a European representative office in Paris. Operating out of the offices of Crédit Mutuel, our Paris team provides expertise to Canadian companies who need support for their business development activities in Europe. In reciprocation, Desjardins also offers support to European companies that want to do business in North America.
PART OF A CONSORTIUM EYEING TORONTO STOCK EXCHANGE PURCHASE
Desjardins Group has joined the Maple Group Acquisition Corporation, a consortium interested in acquiring all the shares of TMX Group Inc., which owns the Toronto Stock Exchange. Keeping the Toronto Stock Exchange in Canadian hands is important to Desjardins, as it will contribute to maintaining and developing advanced expertise here at home, in Canada’s flourishing financial industry. In addition, TMX derivatives are currently traded on the Montreal Exchange, which puts Quebec in a unique leadership position in the international derivatives market.
STAPLES/BUREAU EN GROS CREDIT CARD PORTFOLIO INTEGRATION
After signing an agreement to acquire the Staples/Bureau en Gros credit card portfolio in 2011, Desjardins Group integrated its operations in 2012. As part of the integration, Desjardins began introducing Accord D financing in Staples/Bureau en Gros stores across Canada, providing our new business partner’s customers with innovative credit solutions.
GLOBAL KNOWLEDGE SHARING
DÉVELOPPEMENT INTERNATIONAL DESJARDINS (DID)
When DID was created, it was a pioneer in the distribution and development of microfinance. Today, DID is a worldwide leader in the burgeoning field, with roughly 100 employees. The approach taken by DID ensures local communities maintain control over their own development projects, which is what sets it apart from other microfinance organizations.
In 2012• 8,836,983: the number of DID partner institution
members and clients• $2,645 million: savings volume held by these
institutions• $3,158 million: volume of credit granted• Nearly $22 million has been invested in the various
funds managed by DID.
Since 2006, DID’s community finance institution partners have been part of the Proxfin international network. With the support of the Canadian International Development Agency and network facilitation services provided by DID, Proxfin works to:
• Foster communication and exchange among its 29 member institutions
• Advance microfinance best practices
Proxfin members played an active role in the International Summit of Cooperatives, where five of their representatives were invited to speak about their innovations.
8 2012 DESJARDINS GROUP ANNUAL REPORT – CORPORATE HIGHLIGHTS
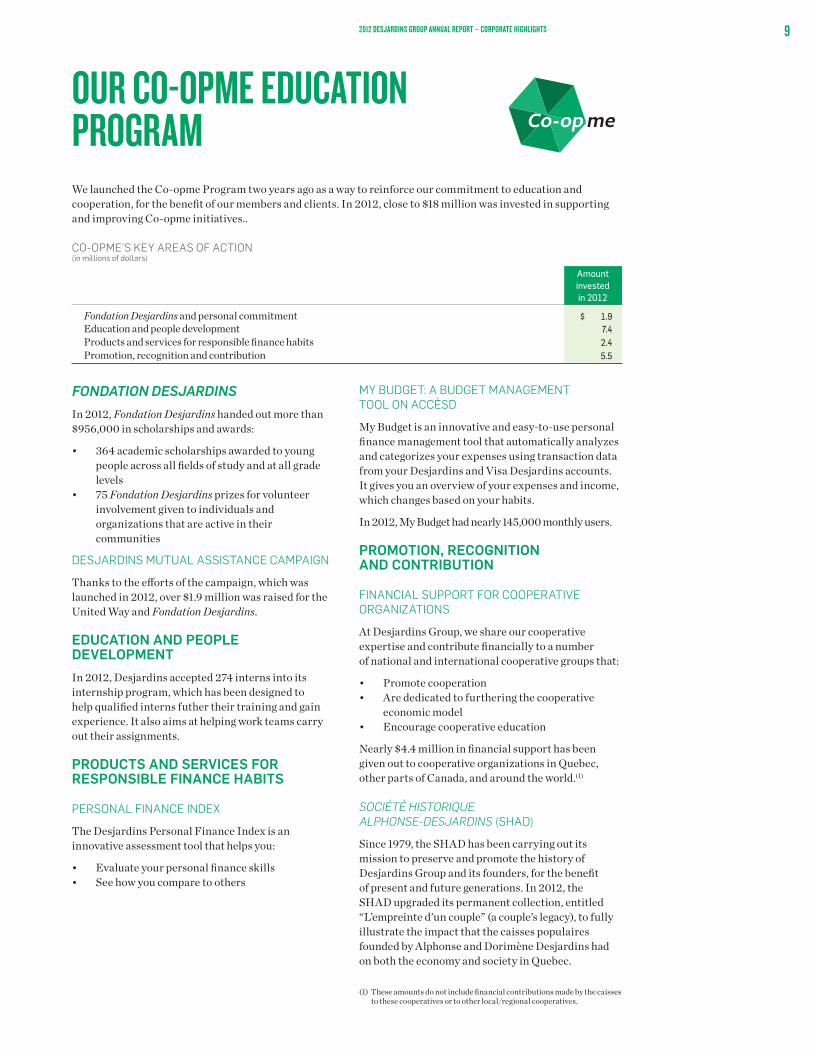
We launched the Co-opme Program two years ago as a way to reinforce our commitment to education and cooperation, for the benefit of our members and clients. In 2012, close to $18 million was invested in supporting and improving Co-opme initiatives..
CO-OPME’S KEY AREAS OF ACTION (in millions of dollars)
Amount invested in 2012
Fondation Desjardins and personal commitment $ 1.9 Education and people development 7.4 Products and services for responsible finance habits 2.4 Promotion, recognition and contribution 5.5
OUR CO-OPME EDUCATION PROGRAM
FONDATION DESJARDINS In 2012, Fondation Desjardins handed out more than $956,000 in scholarships and awards:
• 364 academic scholarships awarded to young people across all fields of study and at all grade levels
• 75 Fondation Desjardins prizes for volunteer involvement given to individuals and organizations that are active in their communities
DESJARDINS MUTUAL ASSISTANCE CAMPAIGN
Thanks to the efforts of the campaign, which was launched in 2012, over $1.9 million was raised for the United Way and Fondation Desjardins.
EDUCATION AND PEOPLE DEVELOPMENTIn 2012, Desjardins accepted 274 interns into its internship program, which has been designed to help qualified interns futher their training and gain experience. It also aims at helping work teams carry out their assignments.
PRODUCTS AND SERVICES FOR RESPONSIBLE FINANCE HABITS
PERSONAL FINANCE INDEX
The Desjardins Personal Finance Index is an innovative assessment tool that helps you:
• Evaluate your personal finance skills• See how you compare to others
MY BUDGET: A BUDGET MANAGEMENT TOOL ON ACCÈSD
My Budget is an innovative and easy-to-use personal finance management tool that automatically analyzes and categorizes your expenses using transaction data from your Desjardins and Visa Desjardins accounts. It gives you an overview of your expenses and income, which changes based on your habits.
In 2012, My Budget had nearly 145,000 monthly users.
PROMOTION, RECOGNITION AND CONTRIBUTION
FINANCIAL SUPPORT FOR COOPERATIVE ORGANIZATIONS
At Desjardins Group, we share our cooperative expertise and contribute financially to a number of national and international cooperative groups that:
• Promote cooperation• Are dedicated to furthering the cooperative
economic model• Encourage cooperative education
Nearly $4.4 million in financial support has been given out to cooperative organizations in Quebec, other parts of Canada, and around the world.(1)
SOCIÉTÉ HISTORIQUE ALPHONSE-DESJARDINS (SHAD)
Since 1979, the SHAD has been carrying out its mission to preserve and promote the history of Desjardins Group and its founders, for the benefit of present and future generations. In 2012, the SHAD upgraded its permanent collection, entitled “L’empreinte d’un couple” (a couple’s legacy), to fully illustrate the impact that the caisses populaires founded by Alphonse and Dorimène Desjardins had on both the economy and society in Quebec.
(1) These amounts do not include financial contributions made by the caisses to these cooperatives or to other local/regional cooperatives.
92012 DESJARDINS GROUP ANNUAL REPORT – CORPORATE HIGHLIGHTS

SPONSORSHIPS AND CHARITABLE PARTNERSHIPS Every year, Desjardins Group maintains strong involvement in the communities we serve. In 2012, more than $85 million was reinvested in the community in the form of sponsorships, scholarships and charitable partnerships, including $41.3 million from the Community Development Fund in support of local initiatives.
VOLUNTEERISM – OUR EMPLOYEES STEP UP!The volunteer spirit is alive and well in Desjardins employees, many of whom are involved in humanitarian causes, such as:
DESJARDINS CARD AND PAYMENT SERVICES’ COOPÉRACTION PROGRAM
Launched in 2011, the Coopéraction Program promotes cooperation and recognizes employees who work with charitable organizations. In 2012, more than $151,000 in donations was collected by Card and Payment Services and distributed among 62 charities.
MONTREAL CANADIENS CHILDREN’S FOUNDATION
For the past 10 years, Desjardins Securities has been a partner of the Montreal Canadiens Children’s Foundation, which helps and supports children in need. In 2012, Desjardins Securities held its annual fundraising day for the charity, raising nearly $342,000 and bringing the total amount raised in the past decade to more than $3 million.
COMMUNITY WELL-BEING
NAMED BEST CORPORATE CITIZEN IN CANADA
10 2012 DESJARDINS GROUP ANNUAL REPORT – CORPORATE HIGHLIGHTS
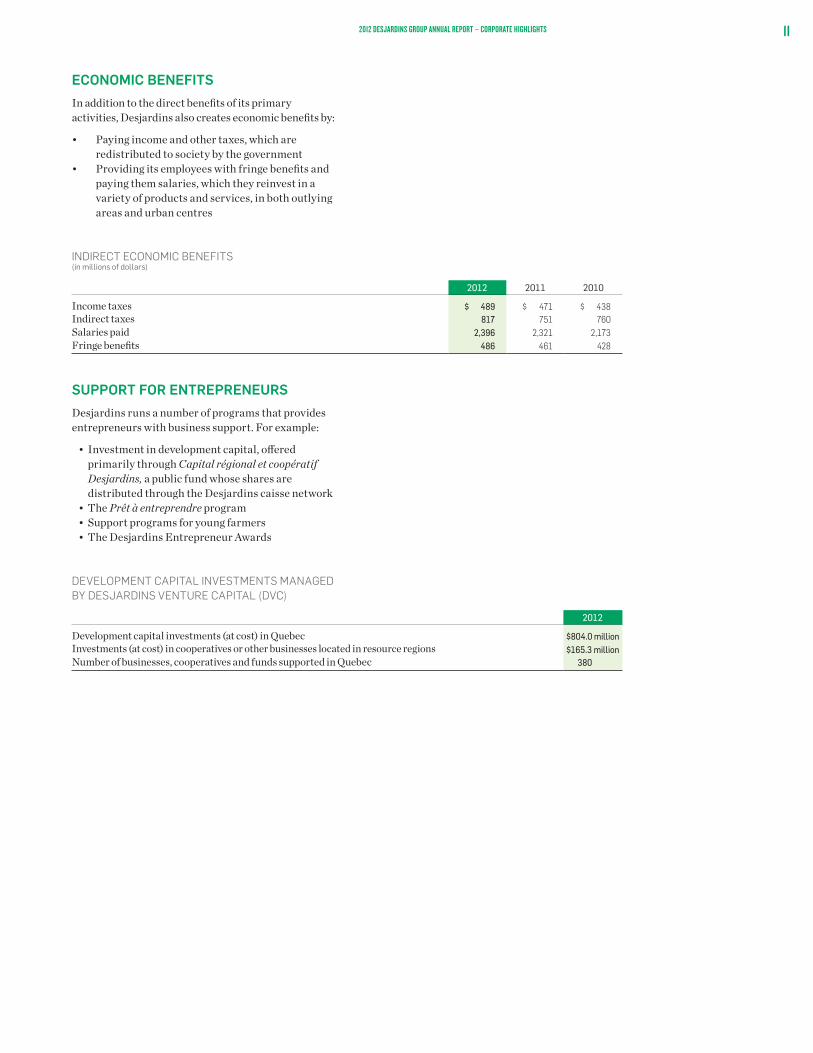
ECONOMIC BENEFITS In addition to the direct benefits of its primary activities, Desjardins also creates economic benefits by:
• Paying income and other taxes, which are redistributed to society by the government
• Providing its employees with fringe benefits and paying them salaries, which they reinvest in a variety of products and services, in both outlying areas and urban centres
INDIRECT ECONOMIC BENEFITS (in millions of dollars)
2012 2011 2010
Income taxes $ 489 $ 471 $ 438Indirect taxes 817 751 760Salaries paid 2,396 2,321 2,173Fringe benefits 486 461 428
SUPPORT FOR ENTREPRENEURS Desjardins runs a number of programs that provides entrepreneurs with business support. For example:
• Investment in development capital, offered primarily through Capital régional et coopératif Desjardins, a public fund whose shares are distributed through the Desjardins caisse network
• The Prêt à entreprendre program• Support programs for young farmers• The Desjardins Entrepreneur Awards
DEVELOPMENT CAPITAL INVESTMENTS MANAGED BY DESJARDINS VENTURE CAPITAL (DVC)
2012
Development capital investments (at cost) in Quebec $804.0 millionInvestments (at cost) in cooperatives or other businesses located in resource regions $165.3 millionNumber of businesses, cooperatives and funds supported in Quebec 380
112012 DESJARDINS GROUP ANNUAL REPORT – CORPORATE HIGHLIGHTS

A STIMULATING WORK ENVIRONMENTA career at Desjardins means excellent work conditions and exciting advancement opportunities.
Desjardins has been named:
• One of Canada’s Top Family-Friendly Employers• One of Canada’s Top Employers for Young People• One of the Top Employers for Canadians Over 40
We make every effort to create a stimulating work environment, and it shows in our employee retention and promotion rates.
RETENTION RATE FOR MANAGEMENT AND NON-MANAGEMENT EMPLOYEES
(as a percentage)
2012
Percentage of the workforce retained 95.7% Promotion rate for managers and employees 7.0%
Desjardins takes great pride in the skills and expertise of its workforce.
AGE DISTRIBUTION (as a percentage)
2012 2011 2010
Under 30 16.3% 16.7% 16.9%Age 30 to 45 38.5 35.3 35.2Over 45 45.2 48.0 47.9
PROPORTION OF WOMEN (as a percentage)
2012 2011 2010
Executive management 23.1% 22.3% 20.7%Other management 58.6 57.2 58.3Employees 75.9 76.7 77.7
TRAINING AND DEVELOPMENTThe Desjardins Cooperative Institute (DCI) provides professional development training to Desjardins Group officers, managers and employees. The DCI offers programming that’s tailored to Desjardins’s priority issues and needs.
In 2012, in collaboration with the Conseil québécois de la coopération et de la mutualité, the DCI launched an initiative to develop practical university-level courses on the cooperative model. For the first time, the DCI also opened its courses up to officers from other cooperative groups.
In 2012, $62.7 million, or 2.46%, of total payroll, was invested in training and personal development activities.
OUR EMPLOYEES, OUR DRIVING FORCE
12 2012 DESJARDINS GROUP ANNUAL REPORT – CORPORATE HIGHLIGHTS
One of the sources Desjardins Group turns to for guidance on its environmental decisions and actions is its sustainable development policy.
We also strive to incorporate life cycle thinking(2) into our business and management practices, which is why we have renewed our partnership with the Polytechnique Montréal International Life Cycle Chair for the next five years. Desjardins is a founding organization of the Chair, which is one of the world’s largest research centres in the life cycle field.
REPORT ON GREENHOUSE GAS EMISSIONSEvery year, we evaluate the climate-change impact of our activities based on the ISO 14064 standard. Some figures from our 2012 report on direct and indirect emissions:
Total greenhouse gas emissions: 37,342 tonnes of CO2 equivalent
Intensity of emissions: 0.86 tonne of CO2 equivalent per employee
Reduction in emission intensity since 2008: 9%
BUILDING EFFICIENCYFour of our buildings are certified by BOMA BESt (Building Environmental Standards), a voluntary national program designed to evaluate the environmental performance and management of existing buildings.
Additionally, 48 of our work sites met the criteria of the ICI ON RECYCLE! program, a provincial government initiative that recommends implementing measures based on the 4 Rs (reduce, reuse, recycle and recover) and organizing information and awareness activities.
We are also working toward achieving LEED (Leadership in Energy and Environmental Design) Gold certification for our new Lévis office. Construction will be completed in 2013. LEED certification is an international standard for evaluating the design, construction and operation of high-performance green buildings.
A NEW ROUTE FOR YOUR COMMUTE!Our alternative transportation program, “A new route for your commute!”, encourages employees to use other modes of transportation, such as carpooling or public transit, and to limit work-related travel.
In 2012:
• 460 discount codes were handed out to BIXI users, giving them 25% off an annual membership
• 61 drivers were given three-month free trial transit passes
• 105 carpool-only parking spots were added at the Lévis office (pilot project)
• 15,416 employees travelled between Montreal and Lévis on the Desjardins shuttle. If each of these employees had made the trip in their own vehicle, more than 585 tonnes of greenhouse gas would have been released into the atmosphere.
ECO-FRIENDLY EVENTS
In 2012, Desjardins Group held 11 eco-friendly events certified under Quebec standard BNQ 9700:
• More than 760 leftover meals were distributed to community organizations through our partnership with La Tablée des chefs
• 81.4% of waste was recycled or recovered• 357 tonnes of greenhouse gases were offset by
carbon credits
INTERNATIONAL SUMMIT OF COOPERATIVES: A CARBON-NEUTRAL EVENT
Following the International Summit of Cooperatives in October 2012, we purchased carbon credits from Carbone Boréal to offset the 741 tonnes of greenhouse gases produced by Desjardins and other event partners that had not already offset their own emissions. These credits are certified as compliant with the ISO 14064-3 standard by the Bureau de normalisation du Québec. The total of the offset emissions is equivalent to taking 741 cars off the road for one year.
PROTECTING THE ENVIRONMENT
(2) Life cycle thinking involves looking at the environmental, economic and social considerations of a product or service for the duration of its lifecycle. [http://www.ciraig.org/en/lca.php]
132012 DESJARDINS GROUP ANNUAL REPORT – CORPORATE HIGHLIGHTS

14 2012 DESJARDINS GROUP ANNUAL REPORT – MANAGEMENT’S DISCUSSION AND ANALYSIS14
TABLE OF CONTENTS
Note to the reader 15
1.0 Desjardins Group 18
1.1 Profile and structure 18
1.2 Monitoring of financial objectives 22
1.3 Changes in the economy and the industry 23
2.0 Review of financial results 25
2.1 Analysis of 2012 results 25
2.2 Analysis of business segment results 32
2.2.1 Personal Services and Business and Institutional Services 33
2.2.2 Wealth Management and Life and Health Insurance 37
2.2.3 Property and Casualty Insurance 40
2.2.4 Other category 44
2.3 Analysis of fourth quarter results 45
3.0 Balance sheet review 50
3.1 Balance sheet management 50
3.2 Capital management 55
3.3 Analysis of cash flows 60
3.4 Off-balance sheet arrangements 61
4.0 Risk management 64
4.1 Risk management 64
4.2 Risk factors that could impact future results 83
4.3 Additional information related to exposure to certain risks 85
5.0 Additional information 86
5.1 Controls and procedures 86
5.2 Related party disclosures 87
5.3 Material events 87
5.4 Critical accounting policies and estimates 88
5.5 Future accounting changes 93
5.6 Five-year statistical review 96
DESJARDINS GROUP MANAGEMENT’S DISCUSSION AND ANALYSIS

152012 DESJARDINS GROUP ANNUAL REPORT – MANAGEMENT’S DISCUSSION AND ANALYSIS
Desjardins Group (hereinafter also referred to as Desjardins) comprises the caisse network in Quebec and Ontario (the Desjardins caisse network), the Fédération des caisses Desjardins du Québec (the Federation) and its subsidiaries, (including Capital Desjardins inc.), Caisse centrale Desjardins, the Fédération des caisses populaires de l’Ontario Inc. and the Fonds de sécurité Desjardins.
This Management’s Discussion and Analysis (MD&A), dated February 21, 2013, presents the results of the analysis of the key elements of and changes to Desjardins Group’s balance sheet for the year ended December 31, 2012, in comparison to previous fiscal years. The MD&A should be read in conjunction with the Audited Combined Financial Statements (the Combined Financial Statements), including the Notes, as at December 31, 2012.
Additional information about Desjardins Group is available on the SEDAR website at www.sedar.com (under the Capital Desjardins inc. profile), where the Annual Information Forms of Capital Desjardins inc., Caisse centrale Desjardins (under the Caisse centrale Desjardins profile) and the Federation (under the Fédération des caisses Desjardins du Québec profile) can also be found. More information is also available on the Desjardins website at www.desjardins.com/en/a_propos/investisseurs; however, none of the information presented on these sites is incorporated by reference into this report.
BASIS OF PRESENTATION OF FINANCIAL INFORMATION Desjardins Group issues its Combined Financial Statements in accordance with Canadian generally accepted accounting principles (GAAP) and the accounting requirements of the Autorité des marchés financiers in Quebec (AMF), which do not differ from GAAP.
The International Financial Reporting Standards (IFRS) constitute GAAP for Desjardins Group. Therefore, Desjardins Group’s Combined Financial Statements have been prepared in accordance with IFRS, as issued by the International Accounting Standards Board (IASB). For more information about accounting policies, see the Combined Financial Statements.
This MD&A was prepared in accordance with the Regulation in force on continuous disclosure obligations issued by the Canadian Securities Administrators. Unless otherwise indicated, all amounts are presented in Canadian dollars ($) and are primarily from Desjardins Group’s Combined Financial Statements.
To assess its performance, Desjardins Group uses and presents both IFRS measures and various non-IFRS financial measures.
Effective December 31, 2012, Desjardins Group used the concept of operating income to analyze its financial results. This information allows for better structuring of financial data and makes it easier to compare operating activities from one period to the next by excluding investment income. The analysis therefore breaks down Desjardins Group’s income into two parts, namely operating income and investment income, which make up total income. This measure is not directly comparable to similar measures used by other companies.
Operating income includes net interest income, net premiums and other operating income such as deposit and payment service charges, lending fees and credit card service revenues and brokerage, investment fund and trust services income, as well as other income. These items, taken individually, correspond to those presented in the Combined Financial Statements.
Investment income includes net income on securities at fair value through profit or loss, net income on available-for-sale securities and net other investment income. These items, taken individually, correspond to those presented in the Combined Financial Statements. Investment income also includes income from the insurance subsidiaries’ matching activities and from derivatives not designated as part of a hedging relationship.
Non-IFRS financial measures, other than the regulatory ratios, do not have a standardized definition and are not directly comparable to similar measures used by other companies and may not be directly comparable to any prescribed IFRS measures. The non-IFRS measures may be useful to investors to analyze financial performance, among other things. These measures are defined as follows:
Productivity index
The productivity index is used to measure efficiency and is equal to the ratio of non-interest expense to total income, net of claims, benefits, annuities and changes in insurance and investment contract liabilities, expressed as a percentage. A lower ratio indicates greater productivity.
Section 1.0 Desjardins Group This section gives a brief overview of Desjardins Group and its 2012 financial highlights. It presents the results related to its priority financial objectives and the financial outlook for 2013. It also includes a description of the economic environment in 2012, industry trends and the economic outlook for 2013.
Section 2.0 Review of financial results This section provides an analysis of Desjardins Group’s results for the year ended December 31, 2012. It contains information on Desjardins Group’s business segments, including a profile of each segment, a description of the industry, financial highlights of 2012, the segment’s strategy and priorities for 2013, and an analysis of financial results, including fourth quarter results and quarterly trends.
Section 3.0 Balance sheet review This section provides commentary on Desjardins Group’s balance sheet. It mainly addresses financing activities and recruitment of savings, including capital management, analysis of cash flows and off-balance sheet arrangements.
SECTION 4.0 Risk management This section focuses on the risk management framework and presents the various risks associated with Desjardins Group’s operations. It also presents risk factors that could impact future results.
SECTION 5.0 Additional information This section presents controls and procedures, related party disclosures, material events, critical accounting policies and estimates, future accounting changes and various annual statistics.

16 2012 DESJARDINS GROUP ANNUAL REPORT – MANAGEMENT’S DISCUSSION AND ANALYSIS
Return on equity
Return on equity, which is expressed as a percentage, is equal to surplus earnings before member dividends, excluding the non-controlling interests’ share, divided by average equity before non-controlling interests.
Growth in operating income
Growth in operating income is equal to the percentage change in operating income in relation to the corresponding period of the previous year.
Gap between income growth and expense growth
The gap, expressed as a percentage, between income growth and expense growth is equal to the difference between the growth in total income, net of claims, benefits, annuities and changes in insurance and investment contract liabilities, compared to the corresponding period of the previous year, and the growth in non-interest expense from the corresponding period of the previous year.
Average assets – Average loans – Average deposits – Average equity
The average balance for these items is equal to the average of the amounts at the end of the previous five quarters, calculated starting from December 31.
REGULATORY CONTEXT AND CAUTION CONCERNING FORWARD-LOOKING STATEMENTSREGULATORY CONTEXTDesjardins Group’s operations are governed in particular by the Act respecting financial services cooperatives and the Act respecting the Mouvement Desjardins. The AMF is the main government agency that oversees and monitors deposit-taking institutions (other than banks) that do business in Quebec, including the caisses and the Federation. Other regulations, including those developed by the Office of the Superintendent of Financial Institutions Canada (OSFI), may also govern some operations of Desjardins Group entities, such as those related to insurance or securities brokerage.
Moreover, Desjardins Group complies with the minimum regulatory capital requirements issued by the AMF, which are adapted to reflect the provisions of the Basel II Accord. While Desjardins Group is not a reporting issuer under AMF Regulation 52-109 respecting Certification of Disclosure in Issuers’ Annual and Interim Filings, it has chosen to apply the practices provided in the regulation to demonstrate its willingness to comply with best practices in financial governance. Desjardins Group’s financial and corporate governance are discussed on pages 86 and 87 of this MD&A and pages 183 to 202 of the 2012 Desjardins Group Annual Report.
It should also be mentioned that Desjardins Bank, National Association, a subsidiary of Caisse centrale Desjardins incorporated under U.S. federal laws, is supervised by the Office of the Comptroller of the Currency of the United States (OCC), and that Caisse centrale Desjardins‘s operations in the U.S., as a bank holding company, are subject to the supervisory and regulatory authority of the Board of Governors of the Federal Reserve System. Caisse centrale Desjardins US Branch, the branch of Caisse centrale Desjardins operating in the State of Florida and incorporated under the U.S. federal laws, is also supervised by the OCC.
CAUTION CONCERNING FORWARD-LOOKING STATEMENTSDesjardins Group’s public communications often include verbal or written forward-looking statements. Such forward-looking statements are contained in this MD&A and may be incorporated in other filings with Canadian regulators or in any other communications. Forward-looking statements in this MD&A include, but are not limited to, comments about Desjardins Group’s objectives regarding financial performance, priorities, operations, the review of economic conditions and markets, as well as the outlook for the Canadian, U.S., European and other international economies. These forward-looking statements include those appearing under sections 1.2, “Monitoring of financial objectives”, 1.3, “Changes in the economy and the industry”, 2.2, “Analysis of business segment results”, 3.0, “Balance sheet review”, and 5.0, “Additional information”. Such statements are typically identified by words or phrases such as “believe”, “expect”, “anticipate”, “intend”, “estimate”, “plan”, and “may”; words and expressions of similar import; and future and conditional verbs.

172012 DESJARDINS GROUP ANNUAL REPORT – MANAGEMENT’S DISCUSSION AND ANALYSIS
By their very nature, such statements involve assumptions, uncertainties and inherent risks, both general and specific. It is therefore possible that, due to many factors, these predictions, forecasts or other forward-looking statements as well as Desjardins Group’s objectives and priorities may not materialize or may prove to be inaccurate and that actual results differ materially. A number of factors beyond Desjardins Group’s control could influence the accuracy of the forward-looking statements in this MD&A. These factors include those discussed in section 4.0 “Risk management”, such as credit, counterparty and issuer, market, foreign exchange, liquidity, operational, insurance, strategic and reputation risk. Additional risk factors include environmental risk, legislative or regulatory developments in Quebec, Canada or globally, such as changes in fiscal and monetary policies; liquidity reporting and regulatory guidance, or interpretations thereof, and amendments to and new interpretations of capital guidelines.
There are also factors linked to changes in economic and financial conditions in Quebec, Canada or globally, including the unemployment rate; the geographic concentration of economic activity; changes in interest rates and exchange rates; trade between Quebec and the United States; the ability of third parties to comply with their obligations to Desjardins Group; consumer spending; credit demand; the effects of increased competition in a market open to globalization; and competition from new entrants and established competitors. There is also fraud, including fraud resulting from the use of new technologies in unprecedented ways against Desjardins Group, its members or its clients; legal or regulatory procedures and lawsuits; consumer saving habits; the effects of possible natural disasters or international conflicts, including terrorism; and new developments.
Furthermore, there are also operational risk factors, such as risk management models with intrinsic limitations, technological issues, service disruptions caused by the Internet or other technological issuse, the ability to design new products and services and
bring them to market in a timely fashion, the ability to collect complete and accurate information on clients and counterparties, and the ability to perform and integrate strategic acquisitions and alliances. Lastly, there are also changes to the accounting policies Desjardins Group uses to present its balance sheet and operating results, including the uncertainties associated with significant accounting assumptions and estimates, as well as changes to estimates, the impact of applying future accounting changes, the ability to recruit and retain key management personnel, including senior management and management’s ability to foresee and manage the risk factors.
It is important to note that the above list of factors that could influence future results is not exhaustive. Other factors could have an adverse effect on results. Additional information about these and other factors is found in section 4.0, “Risk management”. Although Desjardins Group believes that the expectations expressed in these forward-looking statements are reasonable, it cannot guarantee that these expectations will prove to be correct. Desjardins Group cautions readers against placing undue reliance on forward-looking statements when making decisions.
Any forward-looking statements contained in this report represent the views of management only as at the date hereof, and are presented for the purpose of assisting members and analysts in understanding Desjardins Group’s balance sheet as at the dates indicated or its results for the periods then ended, as well as its strategic priorities and objectives. These statements may not be appropriate for other purposes. Desjardins Group does not undertake to update any verbal or written forward-looking statements that may be made from time to time by or on behalf of Desjardins Group, except as required under applicable securities legislation.

18 2012 DESJARDINS GROUP ANNUAL REPORT – MANAGEMENT’S DISCUSSION AND ANALYSIS
1.0SECTION 1.1
PROFILE AND STRUCTUREWHO WE AREDesjardins Group is the largest cooperative financial institution in Quebec, with assets of $196.7 billion. We are also the leading cooperative financial group in Canada, bringing together 397 caisses in Quebec and Ontario, the Fédération des caisses Desjardins du Québec and its subsidiaries (including Capital Desjardins inc.), Caisse centrale Desjardins, the Fédération des caisses populaires de l’Ontario Inc. and the Fonds de sécurité Desjardins. A number of our subsidiaries and components are active across Canada. Our Personal Services and Business and Institutional Services, Wealth Management and Life and Health Insurance, and Property and Casualty Insurance business segments offer a full range of financial products and services adapted to the needs of our members and clients, individuals and businesses alike. As one of the largest employers in the country, Desjardins Group capitalizes on the skills of 44,942 employees and the commitment of 5,268 elected officers.
The tasks of carrying out treasury operations and acting as the official Desjardins representative with the Bank of Canada and the Canadian banking system are assumed by Caisse centrale Desjardins, also a cooperative financial institution which is an integral part of Desjardins Group.
MISSIONTo contribute to improving the economic and social well-being of people and communities within the compatible limits of its field of activity:
By continually developing an integrated cooperative network of secure and profitable financial services, owned and administered by the members, as well as a network of complementary financial organizations with competitive returns, controlled by the members.
By educating people, particularly members, officers and employees, about democracy, economics, solidarity, and individual and collective responsibility.
WHAT MAKES US DIFFERENTAt Desjardins Group we stand out from other Canadian financial institutions because of our cooperative nature. Our mission and strong values reflect our cooperative nature and are championed by our officers, managers and employees. Our mission and our values are echoed in our priorities and help us achieve our vision to promote sustainable prosperity within the communities we serve. Since the inception of the first caisse in 1900 in Lévis, Quebec, Desjardins Group has been a key player in financial education. We believe that the cooperative business model is key to sustainable prosperity and is more relevant than ever.
What guides us in our actions is the desire to be close to our members and clients. Thanks to our varied distribution channels, numerous intermediary networks and personnel who strive to deliver the highest quality of service, we are able to stay close to our members and the communities. In order to best meet our members’ increasingly diverse needs, we pay special attention to the number of caisses and our range of service delivery methods. We also seek, in this way, to support and enhance the cooperative nature of the caisses, in terms of democracy, representation, education and training, intercooperation and support for community development.
Another hallmark of Desjardins Group is the active participation of elected officers in the caisses and in the organization’s decision-making structure through the regional general meetings and the councils of representatives.
VISIONDesjardins, the leading cooperative financial group in Canada, inspires trust around the world through the commitment of its people, its financial strength and its contribution to sustainable prosperity.
DESJARDINS GROUP

192012 DESJARDINS GROUP ANNUAL REPORT – MANAGEMENT’S DISCUSSION AND ANALYSIS
STRUCTURE OF DESJARDINS GROUPDesjardins Group’s structure has been designed to take into account the needs of our members and clients, as well as those of the markets in which we operate. The caisse network in Quebec and Ontario has the support of three main business segments (Personal and Business and Institutional Services, Wealth Management and Life and Health Insurance, and Property and Casualty Insurance), which reinforces our ability to build on our products and services.
MEMBERS
REGIONAL GENERAL MEETINGS CAISSES
COUNCILS OF REPRESENTATIVES GENERAL MEETING
ASSEMBLY OF REPRESENTATIVES BOARD OF DIRECTORS MONITORINGDesjardins Group Monitoring Office
PRESIDENT AND CHIEF EXECUTIVE OFFICER OF DESJARDINS GROUP
DESJARDINS GROUP CORPORATE EXECUTIVE DIVISION
BUSINESS SECTORS
Personal Services
Business and Institutional Services
Wealth Management and Life and Health Insurance
Property and Casualty Insurance
CAISSE NETWORK Regular, convenience and savings transactions
Regular, convenience and savings transactions
Insurance for individuals and business people
Automobile insurance
Cooperative Development and Democratic Governance Support
Financing Integrated offer for businesses
Group insurance plans
Motorcycle and recreational vehicle insurance
Cooperative Network Support Card and payment services
Integrated offer for the agricultural and agri-food industries
Savings for individuals and business people
Home insurance
DESJARDINS GROUP FUNCTIONS
Telephone and Internet access services
Specialized services
Specialized savings Business insurance
Capital markets
Group retirement savings
Pet insurance
Development capital and business ownership transfers
Brokerage and private management
Distribution of financial products
Payroll services
Finance and Office of the CFO
Risk Management
Technology and Shared Services
Treasury, Investor Relations and Compliance
People and Culture
Communications

20 2012 DESJARDINS GROUP ANNUAL REPORT – MANAGEMENT’S DISCUSSION AND ANALYSIS
HIGHLIGHTS Combined surplus earnings before member dividends of $1,591 million, a result comparable to 2011 A total of $364 million returned to members and the community, which includes the member dividend expense,
sponsorships and donations Growth of 3.3% in operating income, which totalled $11.3 billion Increase in the number of credit cards issued, for a total of more than 5 million cards outstanding In-force group insurance premiums hit the $2.0 billion mark Productivity index of 71.3%, comparable to the 2011 ratio Tier 1 capital ratio of 16.8% as at December 31, 2012 Annual growth of 3.5% in total assets, which amounted to $196.7 billion as at December 31, 2012 Residential mortgage loans outstanding up $6.2 billion over the year, to total $85.9 billion Quality loan portfolio, with a gross impaired loans ratio of 0.35% Increase of 5.0% in savings recruitment, which amounted to $129.6 billion Year-over-year growth of $32.1 billion in assets under administration to total $313.1 billion at the end of 2012 Sales of capital shares of the Federation reached $1 billion during 2012 US $1.5 billion in medium-term covered bonds issued by Caisse centrale Desjardins on the U.S. market $800 million in medium-term notes issued by Caisse centrale Desjardins on the Canadian market Redemption, on June 1, 2012, by Capital Desjardins inc. of all its outstanding Series C Senior Notes due in 2017, in the amount of
$300 million Acquisition of an interest in Maple Group Acquisition Corporation, representing a commitment of $98 million Acquisition of several insurance brokers by Western Financial Group Inc.:
– Hodges & Company Insurance Services Ltd., a British Columbia-based brokerage network specializing in commercial insurance – Brown & Ward Insurance Ltd., a leading property and casualty insurance broker in Alberta – Roblin Insurance Travel and Realty Agencies Ltd., based in Manitoba – BC Yacht Insurance Brokers Inc., a company based in Sidney, British Columbia – Orion Insurance Brokers Ltd., with offices in Winnipeg, Manitoba
On February 4, 2013, Desjardins Group, through Desjardins Financial Corporation Inc., entered into a final agreement, to purchase between 25% and 40% of the outstanding shares of Qtrade Canada Inc.
TABLE 1 – BALANCE SHEET AND RATIOS As at December 31 (in millions of dollars, as a percentage and as a coefficient)
2012 2011 2010
Balance sheet Assets $ 196,706 $ 190,137 $ 178,931 Loans 132,576 125,154 118,258 Deposits 129,624 123,403 114,663 Equity 16,041 14,027 12,156
Ratios Tier 1 capital ratio(1) 16.8% 17.3% 17.7% Total capital ratio(1) 19.3% 19.3% 18.7% Gross impaired loans/gross loans ratio 0.35% 0.41% 0.43% Gross loans/deposits 1.03 1.02 1.04
(1) See section 3.2, “Capital management”.

212012 DESJARDINS GROUP ANNUAL REPORT – MANAGEMENT’S DISCUSSION AND ANALYSIS
TABLE 2 – FINANCIAL RESULTS AND RATIOS For the years ended December 31 (in millions of dollars and as a percentage)
2012 2011 2010
Results Net interest income $ 3,848 $ 3,921 $ 3,892 Net premiums 5,126 4,851 4,360 Other operating income(1) Deposit and payment service charges 499 512 535 Lending fees and credit card service revenues 517 483 451 Brokerage, investment fund and trust services 700 676 656 Other 610 493 240
Operating income(1) 11,300 10,936 10,134
Investment income(1)
Net income on securities at fair value through profit or loss 674 1,706 984 Net income on available-for-sale securities 268 299 174 Net other investment income 236 264 251
1,178 2,269 1,409
Total income 12,478 13,205 11,543
Provision for credit losses 241 237 203Claims, benefits, annuities and changes in insurance and investment contract liabilities 4,397 5,292 4,136Non-interest expense 5,760 5,623 5,380Income taxes on surplus earnings 489 471 438
Surplus earnings before member dividends $ 1,591 $ 1,582 $ 1,386
Contribution to combined surplus earnings by business segment Personal Services and Business and Institutional Services $ 889 $ 987 $ 934 Wealth Management and Life and Health Insurance 241 280 249 Property and Casualty Insurance 205 144 131 Other 256 171 72
$ 1,591 $ 1,582 $ 1,386
Amount returned to members and the community Provision for member dividends $ 279 $ 320 $ 299 Sponsorships and donations 85 81 80
$ 364 $ 401 $ 379
Ratios Return on equity(1) 10.4% 12.2% 12.2% Productivity index(1) 71.3 71.1 72.6
(1) See “Basis of presentation of financial information” on page 15.
TABLE 3 – OTHER INFORMATION As at December 31 and for the years then ended
2012 2011 2010
Number of members 5.581 million 5.617 million 5.723 millionNumber of elected officers 5,268 5,366 5,877Number of employees 44,942 44,645 42,641Number of caisses 397 422 451Number of service centres 897 888 924Number of automated teller machines 2,508 2,559 2,652Number of automated transactions 783,648,717 677,329,852 596,344,721 Including transactions made using mobile devices (1) 68,517,593 23,230,629 2,090,008
(1) The transaction service for mobile devices was launched in September 2010.

22 2012 DESJARDINS GROUP ANNUAL REPORT – MANAGEMENT’S DISCUSSION AND ANALYSIS
REVIEW OF 2012 FINANCIAL RESULTSThe priority financial objectives for 2010-2012 were established based on the orientations and initiatives that supported Desjardins Group’s 2010-2012 Strategic Plan. During this period, Desjardins Group grew its surplus earnings before member dividends from $1,091 million as at December 31, 2009, to close to $1,591 million as at December 31, 2012. This increase in surplus earnings was achieved while implementing various measures that helped Desjardins Group strengthen its financial stability and resilience to a less favourable future economic context.
More specifically in 2012, Desjardins Group posted a higher-than-expected financial performance, with surplus earnings before member dividends of $1,591 million, comparable to the previous year. In spite of strong pressure on its income base resulting from slower economic growth and persistent low interest rates, which had a direct impact on net interest income, Desjardins Group’s initiatives made it possible to continue to work at improving productivity. In addition, it made major investments in its information technology transformation program and in continuing various strategic development initiatives.
FINANCIAL OUTLOOK FOR 2013–2016In January 2013, the Board of Directors adopted Desjardins Group’s strategic goals for 2013–2016, which were established to contribute to Desjardins’s business development by focusing on service, growth and efficiency as major priorities.
In spite of less favourable forecasts for economic and financial conditions for the next few years, Desjardins Group has maintained most of its financial objectives for the 2013–2016 period, but it lowered its growth in operating income and return on equity objectives slightly. In these still uncertain economic conditions, the current low interest rate environment will last for some time and put pressure on net interest income and, consequently, on Desjardins Group’s surplus earnings. Furthermore, significant additional expenses related to pension plans and the harmonizing of sales taxes will put downward pressure on Desjardins’s profitability starting in 2013.
Building on its achievements from the 2010–2012 Strategic Plan, Desjardins Group will undertake its strategic initiatives for 2013–2016 on a solid footing so it is better prepared to meet the new Basel III regulatory requirements taking effect on January 1, 2013, which will affect both capitalization and liquidity. Raising productivity remains a top priority for Desjardins Group so that it can hold on to the competitive positioning of its service offer for its members and clients, achieve its profitability and growth targets, and strengthen its capitalization over 2013–2016.
SECTION 1.2
MONITORING OF FINANCIAL OBJECTIVES TABLE 4 – PROGRESS REPORT ON 2012 RESULTS For the year ended December 31 (as a percentage)
Financial objectivesfor 2010-2012
Resultsfor 2012
Financial objectivesfor 2013-2016
Growth and development Growth in operating income(1) Greater than 8% 3.3% Between 5% and 10%
Profitability and productivity Productivity index(1) Less than 70% in 2012 71.3% Less than 70% in 2016 Gap between income growth and expense growth(1) Greater than 2% in 2012 (0.3) Greater than 2% Growth in surplus earnings after income taxes Between 5% and 10% 0.6 Between 5% and 10% Return on equity(1) Greater than 9% 10.4 Greater than 8%
Financial stability and risk management Tier 1 capital ratio Greater than 15% 16.8% Greater than 15%
(1) See “Basis of presentation of financial information” on page 15.
232012 DESJARDINS GROUP ANNUAL REPORT – MANAGEMENT’S DISCUSSION AND ANALYSIS
SECTION 1.3
CHANGES IN THE ECONOMY AND THE INDUSTRY
CHANGES IN THE CANADIAN DOLLAR VS. THE U.S. DOLLAR (Canadian dollars/U.S. dollars)
0.80
0.85
0.90
0.95
1.00
1.05
20122011201020092008
0.82
0.95
1.00
0.98
1.01
CHANGES IN THE UNEMPLOYMENT RATE (as a percentage)
3.0
5.0
7.0
9.0
11.0
20122011201020092008
6.1
7.3
6.5
8.3 8.59.0
8.0 7.9
8.6
7.5 7.7 7.87.3
7.8 7.8
n Canadan Quebecn Ontario
CHANGES IN THE PRIME RATE (as a percentage)
1.00
2.00
3.00
4.00
5.00
20122011201020092008
3.50
2.25
3.00 3.00 3.00
CHANGES IN GDP (as a percentage)
-4.0
-2.0
0.0
2.0
4.0
20122011201020092008
1.11.4
3.2
2.5
3.2
2.6
1.9 1.8 1.8
0.8
1.8
-0.2-0.5
-2.8
-3.5
n Canadan Quebecn Ontario
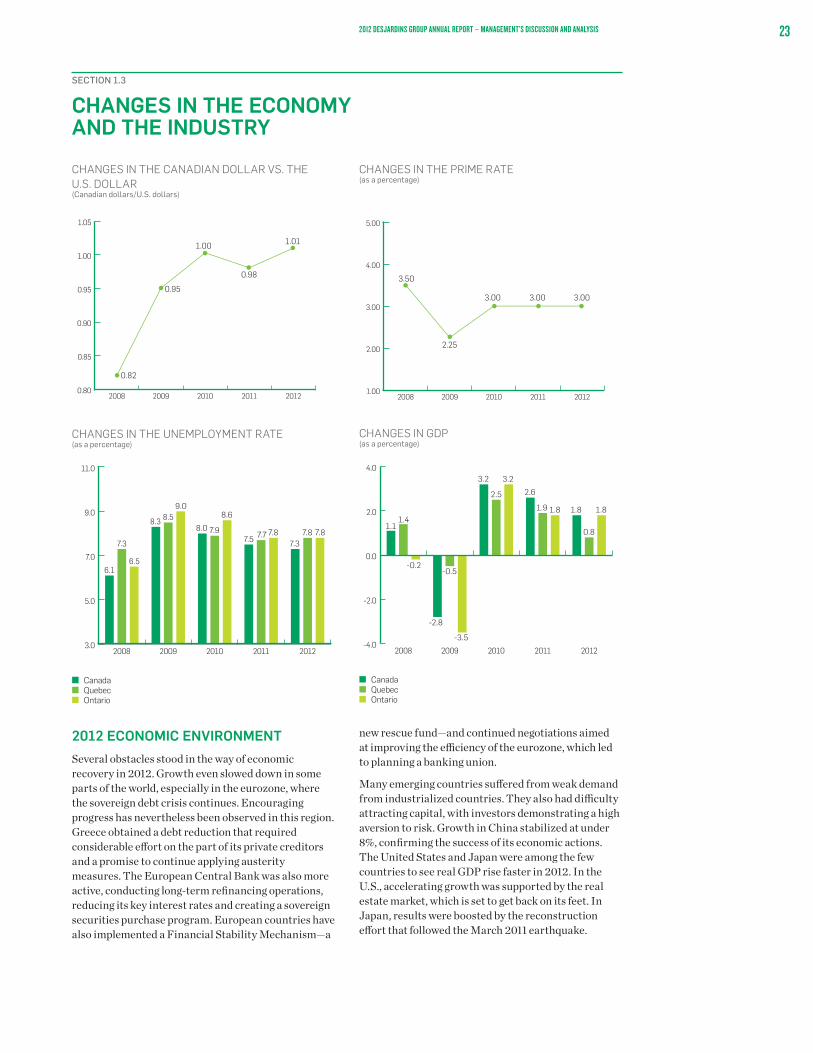
2012 ECONOMIC ENVIRONMENTSeveral obstacles stood in the way of economic recovery in 2012. Growth even slowed down in some parts of the world, especially in the eurozone, where the sovereign debt crisis continues. Encouraging progress has nevertheless been observed in this region. Greece obtained a debt reduction that required considerable effort on the part of its private creditors and a promise to continue applying austerity measures. The European Central Bank was also more active, conducting long-term refinancing operations, reducing its key interest rates and creating a sovereign securities purchase program. European countries have also implemented a Financial Stability Mechanism—a
new rescue fund—and continued negotiations aimed at improving the efficiency of the eurozone, which led to planning a banking union.
Many emerging countries suffered from weak demand from industrialized countries. They also had difficulty attracting capital, with investors demonstrating a high aversion to risk. Growth in China stabilized at under 8%, confirming the success of its economic actions. The United States and Japan were among the few countries to see real GDP rise faster in 2012. In the U.S., accelerating growth was supported by the real estate market, which is set to get back on its feet. In Japan, results were boosted by the reconstruction effort that followed the March 2011 earthquake.

24 2012 DESJARDINS GROUP ANNUAL REPORT – MANAGEMENT’S DISCUSSION AND ANALYSIS
In Canada, growth slowed somewhat from 2011 to 2012. Foreign trade continued to be affected by the strength of the Canadian dollar and the weakness of global demand. Quebec and Ontario were directly impacted by these factors, but provincial economies more dependent on natural resources also suffered as a result of weaker commodity prices. The Canadian economy as a whole was affected by government measures aimed at reducing deficits and by more moderate consumption of goods by households. The real estate market also showed signs of losing momentum after several years of rising prices and sustained activity.
INDUSTRY DESCRIPTION AND TRENDSDespite the tentative economic environment that prevailed in the past year, there were no major changes in the Canadian financial industry. Canada has over 800 savings and loan cooperatives, of which slightly less than half are part of Desjardins Group, as well as some 70 Canadian and foreign banks. Insurance companies are another major industry player. In 2012, more than 300 were in operation across Canada. Although some were present in both property and casualty insurance and life and health insurance, most of them, almost two-thirds, specialized in property and casualty insurance, while the remaining third operated in life and health insurance.
There were a few key players in life and health insurance, with the top three accounting for close to 60% of premiums collected in this industry in Canada. Desjardins Group, through its subsidiary Desjardins Financial Security Life Assurance Company, ranked fifth in this market in 2012. The property and casualty sector is less concentrated, with a higher number of large institutions. The top three companies therefore accounted for only about 30% of the industry. However, consolidation appears to be underway in this sector due to the merger of Intact and AXA at the end of 2011. Through its subsidiary Desjardins General Insurance Group Inc., Desjardins Group ranked eighth in 2012, up from ninth in 2011
Canadian financial institutions stayed on course despite the many concerns preoccupying financial markets in 2012. They had to deal with an uncertain economic climate that did not encourage business and household confidence as well as profit margins under pressure from low interest rates. Despite conditions that could have tested their mettle, such as a slowdown in residential real estate markets and the state of Canadians’ personal finances, these financial institutions remained stable. The World Economic Forum has rated the Canadian banking industry the strongest in the world for a fifth consecutive year. While this does not mean it is invincible, it does have certain advantages over other banking systems the world over.
ECONOMIC OUTLOOK FOR 2013
Economic conditions are expected to remain precarious in many parts of the world in 2013, especially in the eurozone. Austerity measures should still hinder growth for the next few quarters. The European Central Bank may intervene again to support the economy and the financial system by lowering key interest rates one last time and by buying sovereign bonds of countries experiencing difficulty. However, as a prerequisite to such intervention, these countries will have to formally request assistance from the European Stability Mechanism. Spain may make this move. Greece could still undermine the markets, and more and more participants are recommending a second debt restructuring, one that would be assumed by the public sector this time.
Elsewhere in the world, the economies of emerging countries should improve as the situation turns around in Europe and the United States. The outcome of the fiscal cliff negotiations at the end of 2012 should reduce U.S. growth by approximately 1% in 2013, and the need to raise the debt ceiling remains a major source of concern. Other factors will offset the government’s negative contribution to growth. Consumption will be supported by improving household finances and a lower unemployment rate. In addition, the real estate market should continue its new upward trend. The pace of growth in the U.S. economy as a whole should nevertheless slow down somewhat in 2013. This should prompt the U.S. Federal Reserve to maintain its key interest rates at low levels until the mid-2015 and extend its quantitative easing program until at least fall 2013.
The Canadian economy may benefit from growing global demand and a slight rise in commodity prices. On the other hand, the Canadian dollar is expected to remain above parity with the U.S. dollar, which will continue to harm exports, in particular for manufacturers mainly based in Quebec and Ontario. Most public spending cuts and tax increases seem to be behind us. Consumption will probably continue to keep pace with improvements in the labour market and rising income levels, but caution is still called for, given the already high debt levels. The real estate market should continue to stabilize gradually. Overall, economic growth for 2013 should approach 2% in Canada as well as in Ontario and 1.5% in Quebec. Economic activity will likely not, however, be strong enough to bring inflation back above the Bank of Canada’s target range, and so the Bank is not expected to raise key interest rates.

252012 DESJARDINS GROUP ANNUAL REPORT – MANAGEMENT’S DISCUSSION AND ANALYSIS
2.0HIGHLIGHTS
Combined surplus earnings before member dividends of $1,591 million, which is comparable to 2011 results
A total of $364 million returned to members and the community, which includes member dividends, sponsorships and donations
Growth of 3.3% in operating income, which totalled $11.3 billion Increase in the number of credit cards issued, for a total of more than 5 million cards outstanding A $73 million, or 1.9%, decrease in net interest income Net premium growth of $275 million, or 5.7% In-force group insurance premiums hit the $2.0 billion mark A $162 million, or 7.5%, increase in other operating income A $1,091 million, or 48.1%, decrease in investment income A $895 million, or 16.9%, decrease in expenses related to claims, benefits, annuities and changes
in insurance and investment contract liabilities A $137 million, or 2.4%, increase in non-interest expense Productivity index of 71.3%, comparable to the 2011 ratio
REVIEW OF FINANCIAL RESULTS
SECTION 2.1
ANALYSIS OF 2012 RESULTSSURPLUS EARNINGS BEFORE MEMBER DIVIDENDS (in millions of dollars)
1,200
1,400
1,600
1,800
201220112010
1,591
1,386
1,582
SEGMENT CONTRIBUTIONS TO SURPLUS EARNINGS BEFORE MEMBER DIVIDENDS IN 2012
16.1%
15.1%
12.9%
55.9%
n Personal Services and Business and Institutional Services
n Wealth Management and Life and Health Insurance
n Property and Casualty
n Other

26 2012 DESJARDINS GROUP ANNUAL REPORT – MANAGEMENT’S DISCUSSION AND ANALYSIS
2012 SURPLUS EARNINGSFor 2012, Desjardins Group reported surplus earnings before member dividends of $1,591 million, which is comparable to 2011 results. Return on equity was 10.4%, compared to 12.2% in 2011. The lower return was due to the increase in equity as a result of the issue of $1.0 billion in capital shares by the Federation and growth in undistributed surplus earnings.
These results include the contribution of $889 million, or 55.9% of surplus earnings, made by the Personal Services and Business and Institutional Services segment. The Wealth Management and Life and Health Insurance segment and the Property and Casualty Insurance segment contributed $241 million and $205 million, respectively, representing 15.1% and 12.9% of surplus earnings. The operations grouped under the Other category made a contribution of $256 million, or 16.1%, of surplus earnings.
Desjardins Group’s approach to distributing its surplus earnings is to ensure an appropriate balance between development, capitalization and sustainability. With that in mind, for fiscal 2012, the amount provisioned as a liability for member dividends, calculated based on caisse network surplus earnings, was $305 million, compared to $331 million in 2011. A $26 million downward adjustment was made in the 2012 member dividend expense to take into account the reversal of the amount provisioned in 2011. Between member dividends, donations and sponsorships, the total amount returned to members and the community in 2012 was $364 million, compared to $401 million in 2011.
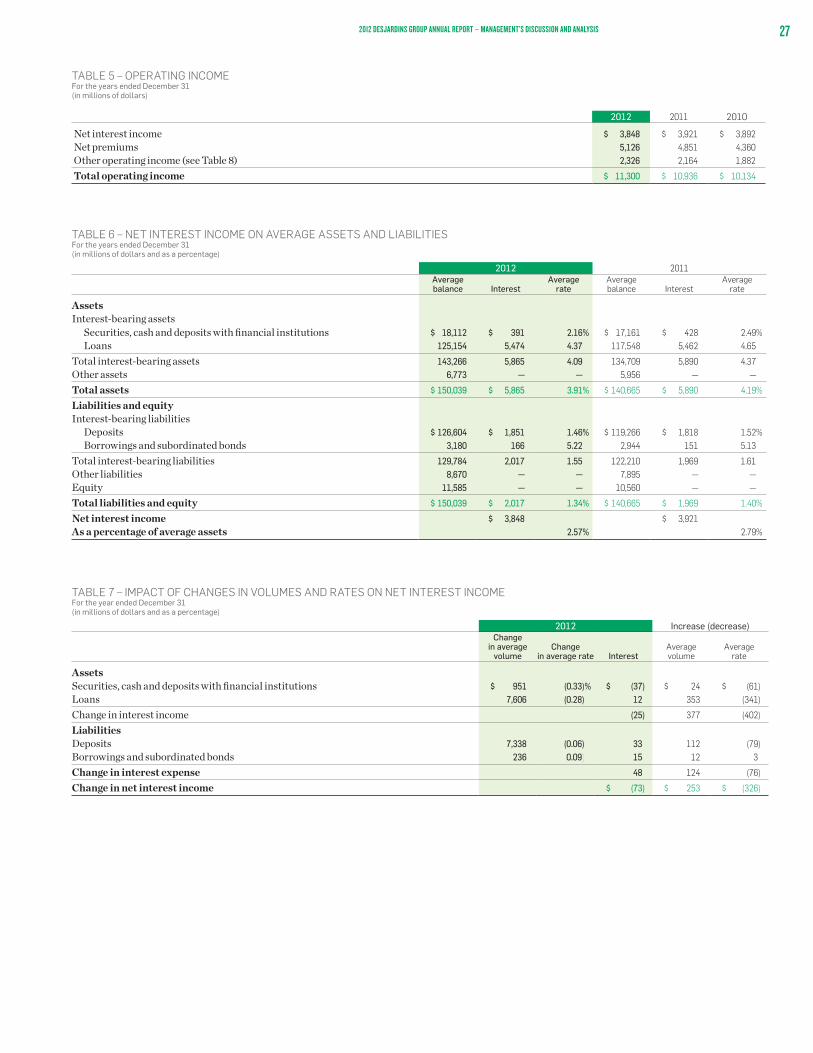
OPERATING INCOME Operating income includes net interest income, net premiums and other operating income, as presented in Table 5. Operating income totalled $11,300 million, up $364 million, or 3.3%, compared to 2011.
NET INTEREST INCOME
Net interest income is the difference between interest income earned on assets, such as loans and securities, and the interest expense related to liabilities, such as deposits, borrowings and subordinated bonds. It is affected by interest rate fluctuations and funding strategies, as well as by the composition of both interest-bearing and non-interest-bearing financial instruments.
For analysis purposes, Table 6 shows the changes in net interest income for the main asset and liability classes. Table 7 details how net interest income was affected by changes in volume and interest rates for the main asset and liability classes.
For 2012, net interest income was $3,848 million, down $73 million, or 1.9%, from the previous year. Expressed as a percentage of average assets, this net margin was down 22 basis points. Accordingly, the change in interest rates and its effect on the credit, investment and savings products and maturities selected by members shaved 28 basis points off the average return on loans, while the average cost of deposits decreased 6 points. The negative change in net interest income is explained in Table 7.
Interest income amounted to $5,865 million in 2012, a decrease of $25 million, or 0.4%, compared to the previous year. Overall, the $8.6 billion, or 6.4%, growth in the average volume of total interest bearing assets boosted interest income by $377 million, while the 28-basis-point decrease in the average return on these assets reduced it by $402 million.
As at December 31, 2012, Desjardins Group’s loan portfolio outstanding, net of the allowance for credit losses, stood at $132.6 billion, compared to a volume of $125.2 billion as at December 31, 2011, for an increase of $7.4 billion, or 5.9%. All the main loan categories offered by Desjardins contributed to this increase, but its home financing market activities stand out as the biggest contributor. Desjardins Group was able to capitalize on the strong performance of the housing market in Quebec and Ontario during that period. As a result, its mortgage loans outstanding reached a volume of $85.9 billion, up $6.2 billion, or 7.8%, compared to the $5.2 billion, or 7.0%, increase recorded in 2011. In addition, the increase in consumer, credit card and other personal loans since the end of 2011 was $535 million, or 3.0%, resulting in outstanding loans totalling $18.5 billion as at December 31, 2012, compared to growth of $481 million, or 2.7%, the previous year.
Loans to businesses and governments grew by $596 million, or 2.1%, in 2012 to total $28.5 billion, compared to an increase of $1.2 billion, or 4.4%, in 2011.
272012 DESJARDINS GROUP ANNUAL REPORT – MANAGEMENT’S DISCUSSION AND ANALYSIS
TABLE 5 – OPERATING INCOME For the years ended December 31 (in millions of dollars)
2012 2011 2010
Net interest income $ 3,848 $ 3,921 $ 3,892Net premiums 5,126 4,851 4,360Other operating income (see Table 8) 2,326 2,164 1,882
Total operating income $ 11,300 $ 10,936 $ 10,134
TABLE 6 – NET INTEREST INCOME ON AVERAGE ASSETS AND LIABILITIES For the years ended December 31 (in millions of dollars and as a percentage)
2012 2011Averagebalance Interest
Averagerate
Averagebalance Interest
Averagerate
AssetsInterest-bearing assets Securities, cash and deposits with financial institutions $ 18,112 $ 391 2.16% $ 17,161 $ 428 2.49% Loans 125,154 5,474 4.37 117,548 5,462 4.65
Total interest-bearing assets 143,266 5,865 4.09 134,709 5,890 4.37Other assets 6,773 — — 5,956 — —
Total assets $ 150,039 $ 5,865 3.91% $ 140,665 $ 5,890 4.19%
Liabilities and equityInterest-bearing liabilities Deposits $ 126,604 $ 1,851 1.46% $ 119,266 $ 1,818 1.52% Borrowings and subordinated bonds 3,180 166 5.22 2,944 151 5.13
Total interest-bearing liabilities 129,784 2,017 1.55 122,210 1,969 1.61Other liabilities 8,670 — — 7,895 — —Equity 11,585 — — 10,560 — —
Total liabilities and equity $ 150,039 $ 2,017 1.34% $ 140,665 $ 1,969 1.40%
Net interest income $ 3,848 $ 3,921As a percentage of average assets 2.57% 2.79%
TABLE 7 – IMPACT OF CHANGES IN VOLUMES AND RATES ON NET INTEREST INCOME For the year ended December 31 (in millions of dollars and as a percentage)
2012 Increase (decrease)Change
in average volume
Change in average rate Interest
Average volume
Average rate
AssetsSecurities, cash and deposits with financial institutions $ 951 (0.33)% $ (37) $ 24 $ (61)Loans 7,606 (0.28) 12 353 (341)
Change in interest income (25) 377 (402)
LiabilitiesDeposits 7,338 (0.06) 33 112 (79)Borrowings and subordinated bonds 236 0.09) 15 12 3
Change in interest expense 48 124 (76)
Change in net interest income $ (73) $ 253 $ (326)

28 2012 DESJARDINS GROUP ANNUAL REPORT – MANAGEMENT’S DISCUSSION AND ANALYSIS
Interest expense stood at $2,017 million, up $48 million, or 2.4%, over 2011. The $7.6 billion, or 6.2%, growth in average funding from deposits, borrowings and subordinated bonds pushed up interest expense by $124 million, while the 6-basis-point decrease in the average cost of deposits reduced interest expense by $79 million.
At the end of 2012, Desjardins Group’s deposits outstanding had increased by $6.2 billion, or 5.0%, to total $129.6 billion. The composition of the deposit portfolio did not change significantly during the year. Savings from its members and clients—individuals, businesses and governments—still make up the main source of financing to support Desjardins’s development. It forms a solid base that alone accounted for 98.3% of Desjardins Group’s deposit liabilities at the end of 2012, compared to 98.5% in 2011. These savings were up $5.9 billion, or 4.8%, to total $127.4 billion as at December 31, 2012.
To round out its main sources of financing, other types of deposits, such as deposits by deposit-taking institutions and other sources, represented 1.7% of Desjardins Group’s deposit liabilities at the end of 2012. These deposits were up $363 million over the year to total $2.2 billion.
NET PREMIUMS
Net premiums, comprising life and health insurance, property and casualty insurance, and annuity premiums, rose $275 million, or 5.7%, to total $5,126 million for the year ended December 31, 2012.
WEALTH MANAGEMENT AND LIFE AND HEALTH INSURANCE SEGMENT
The overall insurance operations of the Wealth Management and Life and Health Insurance segment posted net insurance and annuity premium income of $3,366 million for 2012, compared to $3,261 million for 2011, representing a 3.2% increase. Net insurance premiums were up 5.3% over 2011 to total $3,099 million. They increased by 4.5% in Quebec and 6.1% in the other provinces.
Premium volume for individual insurance was $533 million, a $34 million increase over 2011. Premium volume from the network of financial security advisors assigned to Desjardins caisses increased by 4.3% over the previous year. After remarkable sales growth from the distribution networks in recent years, premiums cashed increased by $23 million, or 7.6%, over 2011. Furthermore,
the volume of premiums related to products marketed via direct distribution posted 6.9% growth to stand at $88 million.
Premiums for group insurance purchased by Desjardins Group members increased by 4.6% and group insurance premiums from other client bases were up 5.1%.
PROPERTY AND CASUALTY INSURANCE SEGMENT
The overall operations of the Property and Casualty Insurance segment generated net premium income of $1,982 million in 2012, compared to $1,785 million in 2011, an 11.0% increase stemming from, among other things, the increase in policies issued due to growth initiatives targeting mass market clients and groups both in Quebec and across Canada, the development of white label partnerships, the development of the insurance offer for businesses and higher average premiums in certain activity sectors. Western Financial Group Inc. contributed $109 million to net premium revenue in 2012.
NET PREMIUMS(1)
(in millions of dollars)
0
500
1,000
1,500
2,000
2,500
3,000
3,500
4,000
201220112010
3,015
1,524
3,261
1,785
3,366
1,982
n Life and health Insurancen Property and casualty insurance
(1) The difference between total results and the sum of business segment results is due to intersegment transactions.

292012 DESJARDINS GROUP ANNUAL REPORT – MANAGEMENT’S DISCUSSION AND ANALYSIS
OTHER OPERATING INCOME
TABLE 8 – OTHER OPERATING INCOME For the years ended December 31 (in millions of dollars)
2012 2011 2010
Deposit and payment service charges $ 499 $ 512 $ 535Lending fees and credit card service revenues 517 483 451Brokerage, investment fund and trust services 700 676 656Other 610 493 240
Total other operating income $ 2,326 $ 2,164 $ 1,882
Other operating income stood at $2,326 million for fiscal 2012, up $162 million, or 7.5%, over 2011.
Income from deposit and payment service charges decreased by $13 million, or 2.5%. Income from lending fees and credit card service revenues, consisting mainly of income from payment solutions offered by Card and Payment Services, totalled $517 million in 2012, up by 7.0%, or $34 million, over 2011, as a result of growth in business volume. Income from brokerage, investment fund and trust services
amounted to $700 million, an increase of $24 million, or 3.6%, chiefly due to growth in average assets under management.
Income under the Other category increased by $117 million, or 23.7%, over 2011, to total $610 million. The increase was partly due to higher commission income from the insurance sales generated by Western Financial Group Inc., a subsidiary acquired in the second quarter of 2011.
INVESTMENT INCOME
TABLE 9 – INVESTMENT INCOME For the years ended December 31 (in millions of dollars)
2012 2011 2010
Net income on securities at fair value through profit or loss $ 674 $ 1,706 $ 984Net income on available-for-sale securities 268 299 174Net other investment income 236 264 251
Total investment income $ 1,178 $ 2,269 $ 1,409
Investment income stood at $1,178 million for fiscal 2012, down $1,091 million, or 48.1%, compared to 2011.
Net income on securities at fair value through profit or loss was down $1,032 million, or 60.5%, to $674 million in 2012. The decrease was chiefly due to the reduction in investment income related to life and health insurance operations resulting from the $1,073 million change in the fair value of assets backing liabilities, which was partly offset by changes in actuarial liabilities. This decrease was mitigated by the $162 million favourable change in the fair value of the asset-backed term note (ABTN) portfolios net of hedging positions. Net income on available-for-sale
securities and net other investment income decreased as realized gains on disposal of investments were lower in 2012 than the previous year.
TOTAL INCOME Total income, comprising net interest income, net premiums, other operating income and investment income, amounted to $12,478 million, a decrease of $727 million, or 5.5%, compared to 2011.

30 2012 DESJARDINS GROUP ANNUAL REPORT – MANAGEMENT’S DISCUSSION AND ANALYSIS
PROVISION FOR CREDIT LOSSES Desjardins Group’s loan portfolio continued to be of excellent quality. As at December 31, 2012, gross impaired loans outstanding stood at $466 million, down $54 million since December 31, 2011. The ratio of gross impaired loans, as a percentage of the total gross loan portfolio, was 0.35% as at December 31, 2012, an improvement over the ratio of 0.41% as at December 31, 2011. Desjardins Group’s ratio in this regard remains one of the best in the Canadian banking industry.
The provision for credit losses totalled $241 million, up $4 million, or 1.7%, over 2011, mainly as a result of the increase in loans outstanding for credit card financing in 2012, which was offset by adjustments related to changes in the parameters of the provision.
CLAIMS, BENEFITS, ANNUITIES AND CHANGES IN INSURANCE AND INVESTMENT CONTRACT LIABILITIES
CLAIMS, BENEFITS, ANNUITIES AND CHANGES IN INSURANCE AND INVESTMENT CONTRACT LIABILITIES(1)
(in millions of dollars)
0
1,000
2,000
3,000
4,000
5,000
201220112010
3,081
1,056
3,994
1,299
3,065
1,343
n Life and health insurancen Property and casualty insurance
(1) The difference between total results and the sum of business segment results is due to intersegment transactions.
Expenses related to claims, benefits, annuities and changes in insurance and investment contract liabilities decreased $895 million, or 16.9%, to $4,397 million for the year ended December 31, 2012.
WEALTH MANAGEMENT AND LIFE AND HEALTH INSURANCE SEGMENT
The Wealth Management and Life and Health Insurance segment had expenses of $3,065 million, down $929 million, or 23.3%, compared to 2011, mainly as a result of a $987 million decrease in changes in actuarial liabilities included under “Insurance and investment contract liabilities”, attributable in particular to the fluctuation in the
fair value of investments. Changes in valuation assumptions in the normal course of business pushed expenses up by $60 million, whereas they had decreased by $43 million in 2011. Gains related to underwriting experience in individual insurance narrowed the unfavourable difference created by these changes in assumptions.
PROPERTY AND CASUALTY INSURANCE SEGMENT
Expenses for the Property and Casualty Insurance segment were $1,343 million, compared to $1,299 million in 2011, for an increase of $44 million, or 3.4%. The loss ratio was 69.1% in 2012, compared to 73.1% in 2011.
NON-INTEREST EXPENSENon-interest expense totalled $5,760 million compared to $5,623 million in 2011, an increase of $137 million, or 2.4%, essentially reflecting the increase in salaries and fringe benefits as a result of business growth and annual indexing. This increase was offset, however, by a reduction in provisions related to the investment portfolio.
PRODUCTIVITY INDEX
The productivity index, calculated as the ratio of non-interest expense to total income, net of expenses related to claims, benefits, annuities and changes in insurance and investment contract liabilities, was 71.3% in 2012, comparable to the index in 2011.
SALARIES AND FRINGE BENEFITS
Salary and fringe benefit expenses rose $100 million, or 3.6%, to $2,882 million in 2012, mainly reflecting growth and salary indexing. This expense item represented 50.0% of Desjardins Group’s total non-interest expense, which is comparable to the 2011 percentage. For 2012, salaries amounted to $2,396 million, up 3.2% over $2,321 million in 2011.
The ratio of fringe benefits to total base compensation remained relatively stable, going from 19.9% in 2011 to 20.3% in 2012.
OTHER EXPENSES
For 2012, expenses related to premises, equipment and furniture (including depreciation) totalled $415 million, compared to $428 million in 2011, a decrease of $13 million, or 3.0%. Service agreement and outsourcing fees were down $42 million, or 15.6%, compared to the previous year, to stand at $228 million. This decrease was partly attributable to the synergies resulting from the creation of Desjardins Technology Group Inc. Communications expenses, which include telephone systems, advertising, courier services and stationery costs, rose $24 million, or 9.7%, from 2011 to stand at $271 million in 2012.

312012 DESJARDINS GROUP ANNUAL REPORT – MANAGEMENT’S DISCUSSION AND ANALYSIS
Other expense categories totalled $1,964 million, for an increase of $68 million, or 3.6%, compared to 2011. This increase is largely due to the operations of the subsidiaries acquired during 2011 and higher professional fees. Higher expenses related to the BONUSDOLLARS Rewards Program and asset revaluation also contributed to expense growth. However, the reduction in provisions related to the investment portfolio offset the increase in non-interest expense.
NON-INTEREST EXPENSE (in millions of dollars)
4,000
4,500
5,000
5,500
6,000
6,500
201220112010
5,760
5,380
5,623
TABLE 10 – NON-INTEREST EXPENSE For the years ended December 31 (in millions of dollars and as a percentage)
2012 2011 2010
Salaries and fringe benefits Salaries $ 2,396 $ 2,321 $ 2,173 Fringe benefits 486 461 428
2,882 2,782 2,601
Premises, equipment and furniture, including depreciation 415 428 425Service agreements and outsourcing 228 270 363Communications 271 247 258Other 1,964 1,896 1,733
Total non-interest expense $ 5,760 $ 5,623 $ 5,380
Desjardins Group productivity index(1) 71.3% 71.1% 72.6%
(1) See “Basis of presentation of financial information” on page 15.
INCOME TAXES AND INDIRECT TAXESDesjardins Group is a cooperative financial group, and each of its entities that operate as a financial services cooperative—mainly the caisses, Caisse centrale Desjardins, the Fédération des caisses Desjardins du Québec and the Fédération des caisses populaires de l’Ontario—is considered a private and independent company. This distinguishes Desjardins Group from most other financial institutions, which are large public corporations. Each caisse is therefore subject to the tax regulations applicable to private companies. Legislators have adapted these regulations to allow the caisses to accumulate a sufficient general reserve to serve as a capital base for the protection of members’ deposits. When the general reserve reaches the legislated limit, the caisse is subject to the same tax rates as a large corporation.
Desjardins entities that are not financial services cooperatives are subject to the tax regulations that apply to large corporations.
Income taxes on surplus earnings include income taxes on the operations of Desjardins Group’s various entities.
Indirect taxes consist of property and business taxes, payroll and social security taxes, the goods and services tax, and sales taxes. Indirect taxes are included in non-interest expense.
For fiscal 2012, the entities of Desjardins Group paid $817 million in indirect taxes.
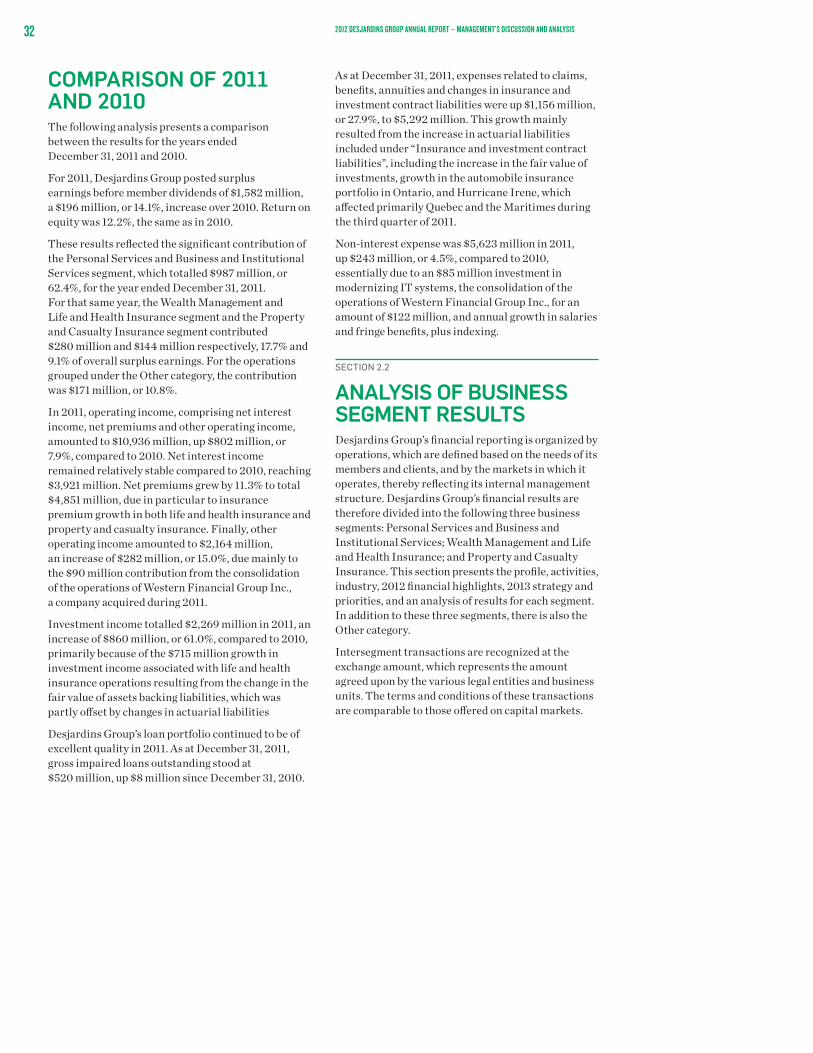
32 2012 DESJARDINS GROUP ANNUAL REPORT – MANAGEMENT’S DISCUSSION AND ANALYSIS
COMPARISON OF 2011 AND 2010The following analysis presents a comparison between the results for the years ended December 31, 2011 and 2010.
For 2011, Desjardins Group posted surplus earnings before member dividends of $1,582 million, a $196 million, or 14.1%, increase over 2010. Return on equity was 12.2%, the same as in 2010.
These results reflected the significant contribution of the Personal Services and Business and Institutional Services segment, which totalled $987 million, or 62.4%, for the year ended December 31, 2011. For that same year, the Wealth Management and Life and Health Insurance segment and the Property and Casualty Insurance segment contributed $280 million and $144 million respectively, 17.7% and 9.1% of overall surplus earnings. For the operations grouped under the Other category, the contribution was $171 million, or 10.8%.
In 2011, operating income, comprising net interest income, net premiums and other operating income, amounted to $10,936 million, up $802 million, or 7.9%, compared to 2010. Net interest income remained relatively stable compared to 2010, reaching $3,921 million. Net premiums grew by 11.3% to total $4,851 million, due in particular to insurance premium growth in both life and health insurance and property and casualty insurance. Finally, other operating income amounted to $2,164 million, an increase of $282 million, or 15.0%, due mainly to the $90 million contribution from the consolidation of the operations of Western Financial Group Inc., a company acquired during 2011.
Investment income totalled $2,269 million in 2011, an increase of $860 million, or 61.0%, compared to 2010, primarily because of the $715 million growth in investment income associated with life and health insurance operations resulting from the change in the fair value of assets backing liabilities, which was partly offset by changes in actuarial liabilities
Desjardins Group’s loan portfolio continued to be of excellent quality in 2011. As at December 31, 2011, gross impaired loans outstanding stood at $520 million, up $8 million since December 31, 2010.
As at December 31, 2011, expenses related to claims, benefits, annuities and changes in insurance and investment contract liabilities were up $1,156 million, or 27.9%, to $5,292 million. This growth mainly resulted from the increase in actuarial liabilities included under “Insurance and investment contract liabilities”, including the increase in the fair value of investments, growth in the automobile insurance portfolio in Ontario, and Hurricane Irene, which affected primarily Quebec and the Maritimes during the third quarter of 2011.
Non-interest expense was $5,623 million in 2011, up $243 million, or 4.5%, compared to 2010, essentially due to an $85 million investment in modernizing IT systems, the consolidation of the operations of Western Financial Group Inc., for an amount of $122 million, and annual growth in salaries and fringe benefits, plus indexing.
SECTION 2.2
ANALYSIS OF BUSINESS SEGMENT RESULTSDesjardins Group’s financial reporting is organized by operations, which are defined based on the needs of its members and clients, and by the markets in which it operates, thereby reflecting its internal management structure. Desjardins Group’s financial results are therefore divided into the following three business segments: Personal Services and Business and Institutional Services; Wealth Management and Life and Health Insurance; and Property and Casualty Insurance. This section presents the profile, activities, industry, 2012 financial highlights, 2013 strategy and priorities, and an analysis of results for each segment. In addition to these three segments, there is also the Other category.
Intersegment transactions are recognized at the exchange amount, which represents the amount agreed upon by the various legal entities and business units. The terms and conditions of these transactions are comparable to those offered on capital markets.

332012 DESJARDINS GROUP ANNUAL REPORT – MANAGEMENT’S DISCUSSION AND ANALYSIS
SECTION 2.2.1
PERSONAL SERVICES AND BUSINESS AND INSTITUTIONAL SERVICES
PERSONAL SERVICES
PROFILE
Personal Services offers a range of products and services to members and clients through the caisse network, including regular and convenience transactions, variable and term savings, financing, and payment and credit cards.
It also makes its products and services available through complementary distribution networks and mortgage representatives, by phone, online, via mobile applications, and at ATMs.
ACTIVITIES
Regular, convenience and savings activities include transactions carried out at the caisse counter, requests for information and specialty services (drafts, safety deposit boxes, etc.). They also include variable savings (chequing accounts, regular savings accounts, etc.) and term savings.
Financing activities include the following:
•Residential mortgage loans: for the purchase of new or existing homes and for renovations
•Consumer loans: such as loans for the purchase of automobiles and durable goods, advances to credit card holders, personal lines of credit and student loans
The activities of Card and Payment Services include card payment services for individuals and businesses, merchant payment services, financing solutions (Accord D) and point-of-sale financing for automobiles and durable goods.
AccèsD Services activities involve making products and services available at any time, anywhere in the world, by phone, online and via mobile applications.
INDUSTRY
The Canadian banking services industry represents an outstanding volume of $1,683 billion in financing and $1,113 billion in on-balance sheet savings, both variable- and fixed-rate.
The already widespread competition has only intensified in the industry, particularly in the mortgage market. The key success factors for thriving in the current low interest rate environment are service quality, productivity, and tailoring products to the specific needs of individual client segments.
The year was characterized by regulators’ constant concerns over the fragile state of the economy and consumer debt levels. Key rates in Canada have not budged since September 2010, and even if the Bank of Canada intends to eventually raise rates, they will likely remain where they are for now, given the current economic climate in Canada. As a result, the Bank of Canada is not expected to start raising its key rates until early 2014.
It should also be mentioned that for the fourth time in as many years, the federal government has changed mortgage lending rules. The following are some of the changes that took effect in 2012:
•Themaximumamortizationperiodformortgages insured by Canada Mortgage and Housing Corporation was reduced from 30 to 25 years.
•Themaximuminsurableloanamountformortgage loan refinancings was reduced from 85% to 80% of home value .
Finally, the OSFI and the AMF have issued guidelines intended to limit borrower indebtedness and the risk of persistence of outstanding balances.
The purpose of these new measures is to prevent the real estate market from overheating and to combat over-indebtedness.
2012 FINANCIAL HIGHLIGHTS
Desjardins is Quebec’s leader in residential mortgages and consumer loans, including point-of-sale financing, with market shares of 35.8% and 22.9% respectively.
Desjardins.com is a pioneer and leader in online services in Quebec, holding the title of most visited financial website in Quebec and one of the most visited in Canada. Desjardins Group has 2.3 million individual members who use AccèsD Internet.
Desjardins is the number one credit and debit card issuer in Quebec. Personal Services has more than 5.1 million credit card holders and 5.6 million debit card holders in Canada.
Residential mortgage loans grew by $6.3 billion, helping Desjardins keep its Quebec market share at 35.8%.
On-balance sheet savings grew by $2.3 billion in Quebec, helping Desjardins keep its Quebec market share at 42.7%.
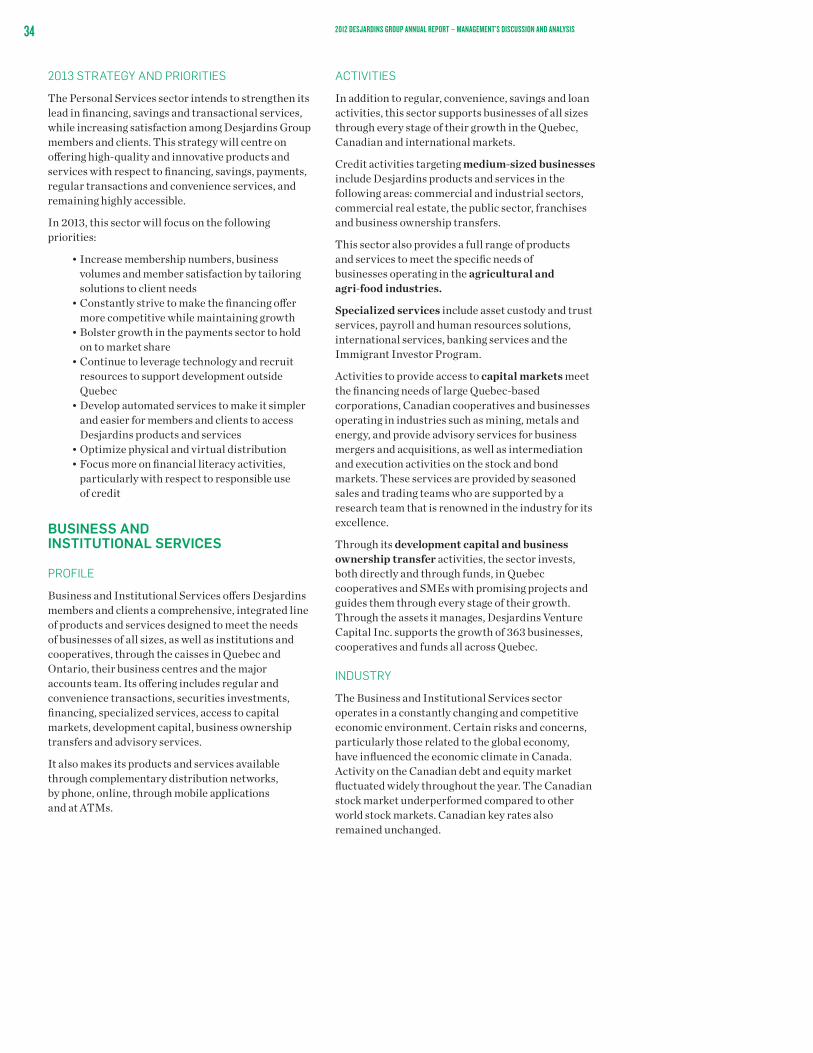
34 2012 DESJARDINS GROUP ANNUAL REPORT – MANAGEMENT’S DISCUSSION AND ANALYSIS
2013 STRATEGY AND PRIORITIES
The Personal Services sector intends to strengthen its lead in financing, savings and transactional services, while increasing satisfaction among Desjardins Group members and clients. This strategy will centre on offering high-quality and innovative products and services with respect to financing, savings, payments, regular transactions and convenience services, and remaining highly accessible.
In 2013, this sector will focus on the following priorities:
•Increasemembershipnumbers,businessvolumes and member satisfaction by tailoring solutions to client needs
•Constantlystrivetomakethefinancingoffermore competitive while maintaining growth
•Bolstergrowthinthepaymentssectortoholdon to market share
•Continuetoleveragetechnologyandrecruitresources to support development outside Quebec
•Developautomatedservicestomakeitsimplerand easier for members and clients to access Desjardins products and services
•Optimizephysicalandvirtualdistribution •Focusmoreonfinancialliteracyactivities,
particularly with respect to responsible use of credit
BUSINESS AND INSTITUTIONAL SERVICES
PROFILE
Business and Institutional Services offers Desjardins members and clients a comprehensive, integrated line of products and services designed to meet the needs of businesses of all sizes, as well as institutions and cooperatives, through the caisses in Quebec and Ontario, their business centres and the major accounts team. Its offering includes regular and convenience transactions, securities investments, financing, specialized services, access to capital markets, development capital, business ownership transfers and advisory services.
It also makes its products and services available through complementary distribution networks, by phone, online, through mobile applications and at ATMs.
ACTIVITIES
In addition to regular, convenience, savings and loan activities, this sector supports businesses of all sizes through every stage of their growth in the Quebec, Canadian and international markets.
Credit activities targeting medium-sized businesses include Desjardins products and services in the following areas: commercial and industrial sectors, commercial real estate, the public sector, franchises and business ownership transfers.
This sector also provides a full range of products and services to meet the specific needs of businesses operating in the agricultural and agri-food industries.
Specialized services include asset custody and trust services, payroll and human resources solutions, international services, banking services and the Immigrant Investor Program.
Activities to provide access to capital markets meet the financing needs of large Quebec-based corporations, Canadian cooperatives and businesses operating in industries such as mining, metals and energy, and provide advisory services for business mergers and acquisitions, as well as intermediation and execution activities on the stock and bond markets. These services are provided by seasoned sales and trading teams who are supported by a research team that is renowned in the industry for its excellence.
Through its development capital and business ownership transfer activities, the sector invests, both directly and through funds, in Quebec cooperatives and SMEs with promising projects and guides them through every stage of their growth. Through the assets it manages, Desjardins Venture Capital Inc. supports the growth of 363 businesses, cooperatives and funds all across Quebec.
INDUSTRY
The Business and Institutional Services sector operates in a constantly changing and competitive economic environment. Certain risks and concerns, particularly those related to the global economy, have influenced the economic climate in Canada. Activity on the Canadian debt and equity market fluctuated widely throughout the year. The Canadian stock market underperformed compared to other world stock markets. Canadian key rates also remained unchanged.

352012 DESJARDINS GROUP ANNUAL REPORT – MANAGEMENT’S DISCUSSION AND ANALYSIS
Nonetheless, commercial and industrial loans showed some vigour, with 7.7% growth, as a result of an increase in non-capital expenditure by businesses. In agricultural loans, Quebec recorded 4.2% growth. With a 24.2% market share of the Quebec business loan market, estimated to be worth some $85 billion, Desjardins Group is a leader in the entrepreneurial sector.
The competition among commercial lenders continued to be fierce in 2012. Since the end of the financial crisis, there has been a general easing in the credit conditions offered to Canadian businesses.
The business segment of the financial services industry has remained concerned with customer satisfaction. Customers have become more and more demanding, especially since the financial crisis, and expect close, high-quality relationships with their financial institutions, competitively priced products and services, and easier access to credit.
The industry is also investing considerable effort in technology in order to better meet the needs of customers. A number of players have been investing heavily in their online products and services, particularly those directly related to savings and loan transactions and specialized services. In addition, online tools are being introduced for businesses to improve the management of their own operations and thereby increase their productivity.
2012 FINANCIAL HIGHLIGHTS
Net interest income from activities designed to access equity markets and loans to medium-sized businesses increased by $19 million compared to 2011.
Caisse centrale Desjardins’s average outstandings rose 13.5% to $6.3 billion as at December 31, 2012:
– Income from mergers and acquisitions was up 20.0% compared to 2011.
– Net growth in agricultural sector outstandings totalled $5.5 billion as at December 31, 2012, or an increase of 1.9% compared to the same date in 2011.
Assets under management at Desjardins Venture Capital Inc. grew to $1.4 billion at the end of 2012, compared to $1.2 billion at the end of 2011.
2013 STRATEGY AND PRIORITIES
The Business and Institutional Services sector aims to contribute to the sustainable economic growth of the businesses and communities it serves. Its strategy is based on establishing relationships of trust with its members, clients and partners, and on a sustainable development philosophy. The strategy is supported by strong foundations in the regions and long-standing commitments in the socio-economic community.
The sector’s priorities in 2013 are to deliver superior services to its members and clients, to achieve sustained growth, particularly in certain high-potential markets, and continue its efforts to enhance efficiency.
More specifically, this sector will aim to:
•Postthestrongestgrowthintheindustryformedium-sized business financing
•Maximizeitsbusinessownershiptransferoffering, particularly through better support to entrepreneurs (buyers and sellers)
•Maintainstrongleadershipinfinancingfortarget segments by:
– Enhancing support to small and very small businesses, and developing business with specific agricultural client bases
– Providing cooperatives with the best offer on the market
•Developtheinternationalproductandserviceoffering for Canadian businesses
•Createvalueforitsmembersandclientsandbuild sustainable and flexible relationships with them
•Continueeffortstoboostefficiency,particularly through continued investments in technology and process optimization
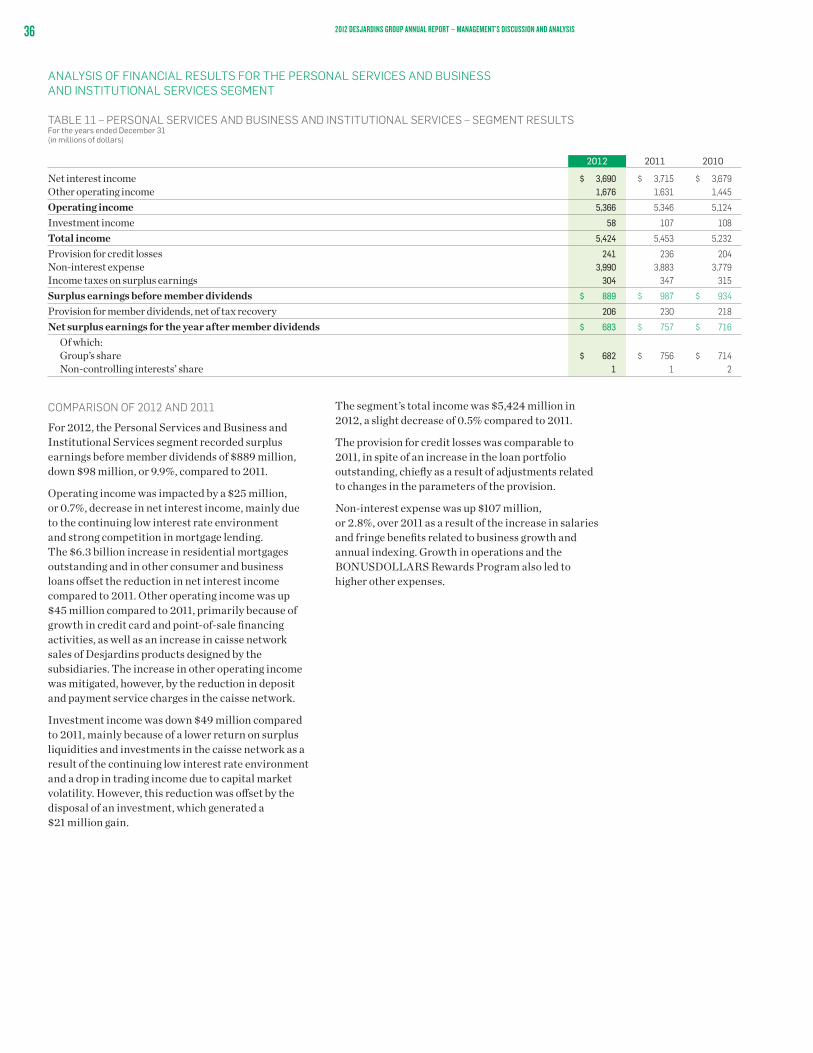
36 2012 DESJARDINS GROUP ANNUAL REPORT – MANAGEMENT’S DISCUSSION AND ANALYSIS
ANALYSIS OF FINANCIAL RESULTS FOR THE PERSONAL SERVICES AND BUSINESS AND INSTITUTIONAL SERVICES SEGMENT
TABLE 11 – PERSONAL SERVICES AND BUSINESS AND INSTITUTIONAL SERVICES – SEGMENT RESULTS For the years ended December 31 (in millions of dollars)
2012 2011 2010
Net interest income $ 3,690 $ 3,715 $ 3,679Other operating income 1,676 1,631 1,445
Operating income 5,366 5,346 5,124
Investment income 58 107 108
Total income 5,424 5,453 5,232
Provision for credit losses 241 236 204Non-interest expense 3,990 3,883 3,779Income taxes on surplus earnings 304 347 315
Surplus earnings before member dividends $ 889 $ 987 $ 934
Provision for member dividends, net of tax recovery 206 230 218
Net surplus earnings for the year after member dividends $ 683 $ 757 $ 716
Of which: Group’s share $ 682 $ 756 $ 714 Non-controlling interests’ share 1 1 2
COMPARISON OF 2012 AND 2011
For 2012, the Personal Services and Business and Institutional Services segment recorded surplus earnings before member dividends of $889 million, down $98 million, or 9.9%, compared to 2011.
Operating income was impacted by a $25 million, or 0.7%, decrease in net interest income, mainly due to the continuing low interest rate environment and strong competition in mortgage lending. The $6.3 billion increase in residential mortgages outstanding and in other consumer and business loans offset the reduction in net interest income compared to 2011. Other operating income was up $45 million compared to 2011, primarily because of growth in credit card and point-of-sale financing activities, as well as an increase in caisse network sales of Desjardins products designed by the subsidiaries. The increase in other operating income was mitigated, however, by the reduction in deposit and payment service charges in the caisse network.
Investment income was down $49 million compared to 2011, mainly because of a lower return on surplus liquidities and investments in the caisse network as a result of the continuing low interest rate environment and a drop in trading income due to capital market volatility. However, this reduction was offset by the disposal of an investment, which generated a $21 million gain.
The segment’s total income was $5,424 million in 2012, a slight decrease of 0.5% compared to 2011.
The provision for credit losses was comparable to 2011, in spite of an increase in the loan portfolio outstanding, chiefly as a result of adjustments related to changes in the parameters of the provision.
Non-interest expense was up $107 million, or 2.8%, over 2011 as a result of the increase in salaries and fringe benefits related to business growth and annual indexing. Growth in operations and the BONUSDOLLARS Rewards Program also led to higher other expenses.

372012 DESJARDINS GROUP ANNUAL REPORT – MANAGEMENT’S DISCUSSION AND ANALYSIS
SECTION 2.2.2
WEALTH MANAGEMENT AND LIFE AND HEALTH INSURANCE
PROFILE
The Wealth Management and Life and Health Insurance segment offers a complete range of products and services tailored to the changing wealth management and financial security needs of individuals, groups, businesses and cooperatives, either as members of the Desjardins caisse network or clients of complementary distribution networks.
Wealth Management includes investment fund and guaranteed investment manufacturing and distribution activities, group retirement savings activities as well as full-service and direct (online) securities brokerage. It also includes private management services and trust services.
The insurance operations of Desjardins Financial Security Life Assurance Company generate premiums of over $3.1 billion through its diversified range of life and health insurance products for individuals. This entity also offers life, health and disability coverage to employers and their employees.
Wealth Management and Life and Health Insurance products and services are distributed by advisors and financial planners in the Desjardins caisse network, while those of the Private Management sector are distributed by life insurance representatives, life and health insurance and employee benefit agents and brokers, and securities brokers. Some products lines are also distributed directly online and through client care centres.
ACTIVITIES
Insurance activities for individuals and business people offer these clients insurance products that protect their quality of life, their health, their families and their loved ones, and also help them face life’s unforeseen events.
Group insurance plan activities meet the needs of businesses, cooperatives and organizations of all sizes with solutions that are tailored to their specifications by group plan implementation and administration experts.
Savings activities for individuals and business people feature a comprehensive range of financial security products to help clients with projects such as preparing for retirement, planning trips and financing their children’s education.
Specialized savings activities include specialized savings and investment products, such as investment funds and other investment solutions as well as market-linked guaranteed investments to meet the needs of caisse members and clients of various complementary networks.
Group retirement savings activities are geared to the needs of business members and other clients in the area of employee retirement savings plans.
Brokerage and private management activities include full-service and online brokerage for members and clients, private management and management of investment companies of large business families with complex needs.
INDUSTRY
In 2011, the wealth management industry represented outstandings of approximately $1,841 billion, measured in terms of the assets of the managed products and the fee accounts held by Canadian households. These assets experienced average annual growth of 1.8% in the past five years. This modest growth was due to the current stock market volatility and low interest rate environment.
Major fund companies and banking and life and health insurance financial groups all have a wealth management division that designs and distributes diversified products and services to meet the investment, financial, tax and estate planning needs of the affluent client segments. Changes in the socio-demographic profile of the Canadian population, tending toward a higher concentration of wealth in these segments, have led the major players to outdo each other with respect to their product and service offer in order to win over and retain demanding clients with varied needs.
Advisors, whether “mobile” or working in an establishment still play a key role in providing advice, making sales and maintaining relationships. However, the industry has been proactive about meeting certain clients’ desire for autonomy by diversifying the means of access to services and making the most of virtual interfaces.
In 2011, the Canadian life and health insurance industry recorded premiums of $81.0 billion through a broad range of products, providing 27 million insured persons in Canada with financial security products, and representing the equivalent of $3.8 trillion in life insurance coverage for the entire country. Benefits paid by the industry in 2011 totalled $63.6 billion. The top five Canadian life and health insurers accounted for 75.0% of the market in 2011, which shows that the industry is highly consolidated. In 2012, the industry once again had to deal with low long-term interest rates and a difficult economic

38 2012 DESJARDINS GROUP ANNUAL REPORT – MANAGEMENT’S DISCUSSION AND ANALYSIS
environment. In spite of this, it has grown 4.6% in the past five years across Canada, and 3.7% during the same period in Quebec.
Life and health insurance products are distributed to consumers in a traditional manner, namely through advisory relationships and personal meetings, 86.0% of the time. Remaining sales are made through various channels, including at branches of credit institutions, online, via call centres and at travel agencies.
2012 FINANCIAL HIGHLIGHTS
Continued implementation of the accelerated growth plan for the life and health insurance segment, with savings assets outside Quebec growing 4.7% in 2012 to $5.2 billion, and group and business insurance generating almost half of the premiums outside Quebec
Increase of 5.1% in insurance premium volume Increase of 15.2% in group and business
insurance sales for groups of more than 1,000 employees
Increase of 11.1% in individual insurance sales, of which almost one-third was generated outside Quebec
Increase of 5.9% in group insurance sales Assets under management in the group
retirement savings sector exceeded $5.0 billion, up 9.5% compared to 2011
Off-balance sheet savings: 14.7% market share in Quebec, showing Desjardins Group’s continued growth in Quebec
On-balance sheet savings: Desjardins Group maintained its position with a 42.7% market share
Increase of 178% in net sales of Desjardins Funds in the caisse network
Increase of 103.1% in net sales of market-linked guaranteed investments in the caisse network
The new Chorus II portfolios, launched at the end of 2011, passed the $2.0 billion mark in outstandings
Assets under management in the Private Management sector exceeded the $3.0 billion mark
Increase of 10.2% in sales for the Private Management sector
Increase of 5.7% in Desjardins Securities Inc.’s assets under management
2013 STRATEGY AND PRIORITIES
The Wealth Management and Life and Health Insurance segment reiterates its priority to ensure the profitable growth of its operations which aims at positioning it as a leader in wealth management for mass-affluent individuals and entrepreneurs in Quebec through a unique offer combining investments, insurance and advisory services. It intends to maintain its leadership position in life and health insurance in both the group and individual markets through accelerated development across Canada.
This priority is based on strategies improving service offers to better meet the expectations of each client segment. It is therefore intended to provide higher quality, distinctive service and to increase the satisfaction of caisse members and clients. Growth in the Wealth Management and Life and Health Insurance segment will come from a better use of its distribution advantages, which will fully benefit from all the possibilities provided by Desjardins Group, the marketing of new targeted offers as well as acquisition and partnership opportunities in designated priority areas. By setting up streamlined and automated operational processes, this segment will reduce its unit costs and benefit from gains in efficiency as a result.
Its priorities for 2013 are described below.
Wealth Management:
•Offercaissemembersanenhancedclientexperience by applying an integrated financial planning and advisory service approach tailored specifically to the expectations of prioritized client bases
•Continuetodevelopthesavingsandinvestmentproduct offer so it is adapted to the specific needs of each client segment by taking its diversified distribution networks into consideration
•Improvethecharacteristicsofthisofferandtherelated virtual functionalities
•Reviewthebusinessandtechnologyarchitecture of investment operations to improve the quality of service and achieve efficiency gains
Life and Health Insurance:
•Reviewthekeyprocessestoimproveitsindividual and group insurance service offer to better meet the specific expectations of members and clients, and as a result increase their satisfaction
•AccelerategrowthacrossCanadabyoptimizingthe potential of each distribution network and capitalizing on competitive service offers and solid business partnerships

392012 DESJARDINS GROUP ANNUAL REPORT – MANAGEMENT’S DISCUSSION AND ANALYSIS
ANALYSIS OF SEGMENT FINANCIAL RESULTS
TABLE 12 – WEALTH MANAGEMENT AND LIFE AND HEALTH INSURANCE – SEGMENT RESULTS For the years ended December 31 (in millions of dollars)
2012 2011 2010
Net interest income $ 3 $ 4 $ 3Net premiums 3,366 3,261 3,015Other operating income 880 830 954
Operating income 4,249 4,095 3,972
Investment income 734 1,807 885
Total income 4,983 5,902 4,857
Provision for credit losses — — (1)Claims, benefits, annuities and changes in insurance and investment contract liabilities 3,065 3,994 3,081Non-interest expense 1,615 1,560 1,456Income taxes on surplus earnings 62 68 72
Surplus earnings before member dividends $ 241 $ 280 $ 249
Provision for member dividends, net of tax recovery — 7 6
Net surplus earnings for the year after member dividends $ 241 $ 273 $ 243
Of which: Group’s share $ 192 $ 257 $ 247 Non-controlling interests’ share 49 16 (4)
TABLE 13 – EXPENSES ATTRIBUTABLE TO POLICYHOLDERS For the years ended December 31 (in millions of dollars)
2012 2011 2010
Insurance and annuity benefits $ 2,436 $ 2,378 $ 2,214Changes in actuarial liabilities 508 1,495 754Interests of policyholders, refunds and other 121 121 113
Total $ 3,065 $ 3,994 $ 3,081
GROUP INSURANCE PREMIUMS BY DISTRIBUTION NETWORK (in millions of dollars)
0
500
1,000
1,500
2,000
2,500
3,000
201220112010
585
1,683
613
1,832
641
1,925
n Desjardins Group membersn Other client bases
INDIVIDUAL INSURANCE PREMIUMS BY DISTRIBUTION NETWORK (in millions of dollars)
0
150
300
450
600
201220112010
173
295
195
304
206
327
n Desjardins Group membersn Other client bases

40 2012 DESJARDINS GROUP ANNUAL REPORT – MANAGEMENT’S DISCUSSION AND ANALYSIS
COMPARISON OF 2012 AND 2011
For 2012, surplus earnings before member dividends were $241 million, down $39 million, or 13.9%, compared to 2011, essentially due to life and health insurance operations.
Operating income for 2012 was impacted by the $155 million increase in net insurance premiums and annuity premiums declined by $50 million compared to 2011. Other operating income grew by $50 million compared to the previous year mainly as a result of the growth in average assets under management related to the distribution of various products.
Investment income was down $1,073 million largely as a result of the lower investment income associated with life and health insurance operations attributable to the change in the fair value of assets backing liabilities, which was offset for the most part by changes in actuarial liabilities.
The segment’s total income was $4,983 million, down $919 million, or 15.6%, compared to 2011.
Expenses related to claims, benefits, annuities and changes in insurance and investment contract liabilities were down $929 million, or 23.3%, from 2011, mainly as a result of a $987 million decline in actuarial liabilities included under “Insurance and investment contract liabilities”, including the previously mentioned fluctuation in the fair value of investments. Changes in assumptions for the valuation of actuarial liabilities, made in the normal course of business, pushed up actuarial liabilities by $60 million. These changes had caused actuarial liabilities to go down by $43 million in 2011. In 2012, the adjustments concerned mainly the assumptions related to the contract cancellation rate, certain actuarial valuation methods and models for segregated funds, the mortality rate, operating expenses and return on investments. In 2011, adjustments to assumptions concerned mainly those related to return on investments, the use of certain actuarial valuation methods and models for segregated funds, and the contract cancellation rate. However, gains generated by favourable underwriting experience in individual insurance narrowed the unfavourable difference created by such changes in assumptions.
Non-interest expense was up $55 million, or 3.5%, mainly due to higher salaries and fringe benefits resulting from business growth and the acquisition of MGI Financial Inc. in October 2011, which generated additional expenses of $24 million.
SECTION 2.2.3
PROPERTY AND CASUALTY INSURANCE SEGMENT
PROFILE
The Property and Casualty Insurance segment offers insurance products allowing members and clients to protect themselves against disasters. It includes the operations of Desjardins General Insurance Group Inc. and those of Western Financial Group Inc.
Desjardins General Insurance Group Inc. directly offers the general public and members of partner groups across Canada a line of home and automobile insurance products and provides businesses in the Quebec market with insurance products
Desjardins General Insurance Group’s products are distributed through property and casualty (P&C) insurance agents in the Desjardins caisse network, a number of client care centres (call centres) and business centres, through an exclusive agent network in the field, online and via mobile applications.
Western Financial Group Inc. operates an extensive insurance product distribution network serving more than 600,000 clients in western Canada. Its P&C insurance products are distributed to individuals and businesses through a network of brokers, as well as directly to the general public under the Western Direct Insurance brand. Western Financial Group Inc. also distributes its own life insurance products, pet insurance and certain banking products.
Desjardins General Insurance Group Inc., which has more than 2.1 million policies in force, markets its products to the Canada-wide individual market under the Desjardins General Insurance Group Inc. banner, and to the group market—including members of professional associations and unions, and the employers’ staff—under the banner of The Personal.
The Property and Casualty Insurance segment is also active on the white label market, notably with a well-established Canadian financial institution, as well as with Western Financial Group Inc., for the direct insurance offer launched in certain target urban markets under the Western Direct Insurance brand.
412012 DESJARDINS GROUP ANNUAL REPORT – MANAGEMENT’S DISCUSSION AND ANALYSIS
ACTIVITIES
Automobile insurance operations, including motorcycle and recreational vehicle insurance, offer insurance coverage tailored to clients’ specific needs and their vehicle features. Automobile insurance also includes the necessary coverage to obtain financial compensation for bodily injury in provinces where such coverage is not provided under a public plan.
Property insurance operations aim to offer owners and tenants insurance coverage for primary and secondary residences to protect their physical property. In addition, with all-risk insurance coverage and optional coverage, they can obtain comprehensive protection tailored to their actual needs.
Business insurance operations meet the insurance requirements for commercial vehicles, commercial property and public liability for businesses in Quebec. Desjardins General Insurance Group Inc. serves the following sectors: service firms, retailers and wholesalers, garages, self-employed workers, general or specialized contractors, restaurants, commercial buildings, condominiums and apartment buildings.
Pet insurance operations cover the healthcare needs of domestic dogs and cats. Western Financial Group Inc. has the necessary licences to write this kind of insurance in all provinces and territories of Canada.
Financial product distribution operations comprise a network of independent brokers representing some 120 points of sale in British Columbia, Alberta, Saskatchewan and Manitoba. This network offers primarily P&C insurance products such as automobile, property, farm, business and liability insurance.
Other operations of Western Financial Group Inc. include certain life insurance products and banking solutions.
INDUSTRY
The Canadian P&C insurance industry offers insurance coverage for vehicles, personal and commercial property, and public liability. In 2011, the total amount of direct premiums written was $43.0 billion, of which 62.1% was individual insurance and 37.9% was business insurance. For Canada as a whole, brokers have a market share of 65.6%, while direct writers have 23.7% of the market, and exclusive agents, hold 10.7%. In Quebec, direct writers have gained significant market share since their arrival and now hold 43.7% of the market, compared to 55.4% for brokers and 0.9% for exclusive agents.
The Canadian P&C insurance market is mature and cyclical, with an average annual growth rate of 4.1% and an average return of 9.3% over the past five years. Its growth is influenced by the level of premiums, which varies in particular according to changes in the value of insured property and the loss experience in the different business lines. The industry’s financial performance is dependent on the profitability of insurance operations, which is based on the insurance premiums collected less claims and operating expenses, as well as on the investment portfolio return.
The Ontario market accounts for close to 50% of the gross premiums written in the Canadian industry, and automobile insurance is highly regulated in this province. The end of the hard market cycle and a sharp decline in the number of clients served in the Ontario market have slowed down the growth of insurers since early 2012. The latest reforms of the Ontario system were introduced in September 2010 and were aimed at addressing rising claims costs while improving the settlement process to better meet clients’ needs. The positive effects of these reforms continued to be felt in 2012, with the stabilizing of rate hikes and settlement costs. In spite of this, high rates especially in the Toronto area, remain a political issue. Fraud is also still a major concern in Ontario, and insurers, the government and regulators are joining forces to find long-term solutions.
In 2011, the top 10 P&C insurers in Canada represented 63.0% of the market, up six percentage points since 2007, while the top five insurers represented 41.0% of the market, compared to 36.0% in 2007. Consolidation of the Canadian P&C insurance market continues in the aftermath of a few large insurers’ transactions, which have given them an important advantage by increasing their influence within the industry and thereby putting additional pressure on the competition.

42 2012 DESJARDINS GROUP ANNUAL REPORT – MANAGEMENT’S DISCUSSION AND ANALYSIS
2012 FINANCIAL HIGHLIGHTS
Increase in net premiums of $197 million, or 11.0%, compared to 2011, to total $1,982 million in 2012
Contribution of $263 million to total income in 2012 by Western Financial Group Inc.
Surplus earnings of $205 million, up 42.4% compared to the previous year, resulting in return on equity of 16.1%
Loss ratio of 69.1% for the segment, compared to 73.1% in 2011
2013 STRATEGY AND PRIORITIES
The Property and Casualty Insurance segment will be actively involved in pursuing Desjardins Group’s top priority—member and client satisfaction. Various initiatives will be launched to transform clients into true “promoters” of Desjardins so that Desjardins Group and the Property and Casualty Insurance segment are recognized for the highest quality and satisfaction standards.
This segment will also continue to implement its profitable growth plan to remain a leading industry player in Quebec and to confirm Desjardins Group’s position as a preferred insurer in Ontario, in addition to boosting its development in western Canada. In Quebec, the segment intends to achieve above-market growth by fully leveraging its membership in Desjardins Group and building on its culture of growth, while preserving sound profitability. It would also like to accelerate development in its business insurance sector. In Ontario, it will continue to make Desjardins Group more widely known, which would include a gradual return to the Toronto area. In western Canada, Western Financial Group Inc. will build on its expansion plan through brokerage acquisitions and will increase the visibility of its brand in its market.
The segment also relies on a model and strategy aligned with the market dynamic. It would like to maintain its edge in risk segmentation and continue optimizing its claims management. It also intends to continue adjusting to changing distribution channels based on market imperatives, while continuing to leverage its expertise in direct distribution.
This segment’s priorities for 2013 are indicated below.
Desjardins General Insurance Group Inc.
•Continuetostrivetoimproveclientsatisfactionby simplifying and enhancing the client experience, an area in which it continually aims to stand out
•Continueitsexpansionthroughacquisitionsand strategic partnerships, as well as through organic growth, by increasing access to the market
•Optimizeitssystemsandfine-tuneitsprocedures to enhance performance and maintain above-market profitability
Western Financial Group Inc.
•Continueitsstrongexpansionthroughacquisitions and organic growth to become an important player in the consolidation of the P&C insurance industry’s distribution network, and remain the largest network of brokers in western Canada
•Implementjointdevelopmentinitiatives with Desjardins Group components to strengthen Desjardins Group’s presence in western Canada
ANALYSIS OF SEGMENT FINANCIAL RESULTS
TABLE 14 – PROPERTY AND CASUALTY INSURANCE – SEGMENT RESULTS For the years ended December 31 (in millions of dollars)
2012 2011 2010
Net interest income $ 11 $ 11 $ —Net premiums 1,982 1,785 1,524Other operating income 133 87 1
Operating income 2,126 1,883 1,525
Investment income 142 165 107
Total income 2,268 2,048 1,632
Provision for credit losses — 1 —Claims, benefits, annuities and changes in insurance and investment contract liabilities 1,343 1,299 1,056Non-interest expense 661 550 389Income taxes on surplus earnings 59 54 56
Net surplus earnings for the year $ 205 $ 144 $ 131
Of which: Group’s share $ 184 $ 127 $ 118 Non-controlling interests’ share 21 17 13
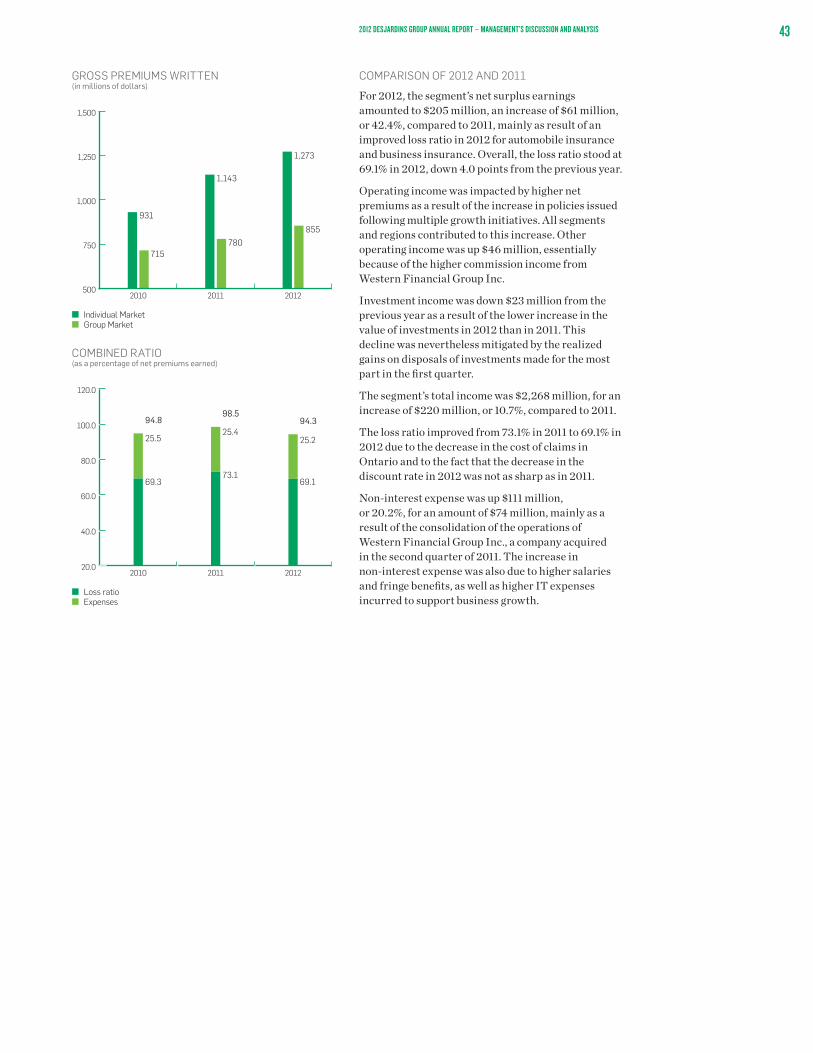
432012 DESJARDINS GROUP ANNUAL REPORT – MANAGEMENT’S DISCUSSION AND ANALYSIS
GROSS PREMIUMS WRITTEN (in millions of dollars)
500
750
1,000
1,250
1,500
201220112010
931
715
1,143
780
1,273
855
n Individual Marketn Group Market
COMBINED RATIO (as a percentage of net premiums earned)
20.0
40.0
60.0
80.0
100.0
120.0
201220112010
69.3
25.5
94.898.5
94.3
73.1
25.4
69.1
25.2
n Loss ration Expenses
COMPARISON OF 2012 AND 2011
For 2012, the segment’s net surplus earnings amounted to $205 million, an increase of $61 million, or 42.4%, compared to 2011, mainly as result of an improved loss ratio in 2012 for automobile insurance and business insurance. Overall, the loss ratio stood at 69.1% in 2012, down 4.0 points from the previous year.
Operating income was impacted by higher net premiums as a result of the increase in policies issued following multiple growth initiatives. All segments and regions contributed to this increase. Other operating income was up $46 million, essentially because of the higher commission income from Western Financial Group Inc.
Investment income was down $23 million from the previous year as a result of the lower increase in the value of investments in 2012 than in 2011. This decline was nevertheless mitigated by the realized gains on disposals of investments made for the most part in the first quarter.
The segment’s total income was $2,268 million, for an increase of $220 million, or 10.7%, compared to 2011.
The loss ratio improved from 73.1% in 2011 to 69.1% in 2012 due to the decrease in the cost of claims in Ontario and to the fact that the decrease in the discount rate in 2012 was not as sharp as in 2011.
Non-interest expense was up $111 million, or 20.2%, for an amount of $74 million, mainly as a result of the consolidation of the operations of Western Financial Group Inc., a company acquired in the second quarter of 2011. The increase in non-interest expense was also due to higher salaries and fringe benefits, as well as higher IT expenses incurred to support business growth.

44 2012 DESJARDINS GROUP ANNUAL REPORT – MANAGEMENT’S DISCUSSION AND ANALYSIS
SECTION 2.2.4
OTHER CATEGORYThe Other category includes financial information that is not specific to any particular business segment. It mainly includes treasury activities related to Caisse centrale Desjardins’s operations and financial intermediation between liquidity surpluses and needs of the caisses. This category also includes the support functions of the Federation, the operations of Capital Desjardins inc. and Fonds de sécurité Desjardins, as well as the operating results related to asset-backed term notes (ABTNs) held by Desjardins Group. It also includes Desjardins Technology Group Inc., which encompasses all of Desjardins Group’s IT operations. In addition to various adjustments necessary to prepare the Combined Financial Statements, the intersegment balance eliminations are classified in this category.
Desjardins Group does not consider an item-by-item comparative analysis of this category to be relevant, given the integration of various consolidation adjustments and intersegment balance eliminations. Consequently, Desjardins Group presents an analysis of these operations based on their contribution to surplus earnings before member dividends.
CONTRIBUTION TO SURPLUS EARNINGS
Net surplus earnings for the year before member dividends arising from operations combined under the Other category totalled $256 million in 2012, compared to $171 million in 2011.
2012
Net surplus earnings for the year before member dividends of $256 million were mainly due to the $159 million increase in the fair value of the ABTN portfolio, net of hedging positions, to treasury activities, and to the decrease in the provisions related to the investment portfolio.
2011
Net surplus earnings for the year before member dividends of $171 million were notably the result of treasury activities, the favourable net impact of changes in the fair value of derivatives used in hedging operations and the increase in the fair value of ABTN portfolios and related items, which were offset by the large amounts invested to modernize IT systems.

452012 DESJARDINS GROUP ANNUAL REPORT – MANAGEMENT’S DISCUSSION AND ANALYSIS
SECTION 2.3
ANALYSIS OF FOURTH QUARTER RESULTSTABLE 15 – QUARTERLY RESULTS FOR THE PREVIOUS EIGHT QUARTERS (unaudited, in millions of dollars and as a percentage)
2012 2011Q4 Q3 Q2 Q1 Q4 Q3 Q2 Q1
Net interest income $ 948 $ 967 $ 969 $ 964 $ 1,006 $ 969 $ 979 $ 967Net premiums 1,325 1,278 1,295 1,228 1,221 1,233 1,238 1,159Other operating income Deposit and payment service charges 124 127 125 123 128 132 128 124 Lending fees and credit card service revenues 137 125 127 128 129 120 116 118 Brokerage, investment fund and trust services 185 164 170 181 168 162 170 176 Other 145 166 150 149 169 133 93 98
Operating income 2,864 2,827 2,836 2,773 2,821 2,749 2,724 2,642
Investment income Net income (loss) on securities at fair value
through profit or loss 65 285 411 (87) 548 796 386 (24) Net income on available-for-sale securities 45 56 52 115 71 118 49 61 Net other investment income 66 56 57 57 71 63 72 58
Investment income 176 397 520 85 690 977 507 95
Total income 3,040 3,224 3,356 2,858 3,511 3,726 3,231 2,737
Provision for credit losses 47 50 62 82 54 56 83 44Claims, benefits, annuities and changes in
insurance and investment contract liabilities 991 1,235 1,425 746 1,444 1,750 1,277 821Non-interest expense 1,576 1,360 1,348 1,476 1,477 1,325 1,415 1,406Income taxes on surplus earnings 101 136 119 133 109 150 103 109
Surplus earnings before member dividends 325 443 402 421 427 445 353 357
Provision for member dividends, net of tax recovery 65 54 49 38 90 43 50 47
Surplus earnings for the year after member dividends $ 260 $ 389 $ 353 $ 383 $ 337 $ 402 $ 303 $ 310
Of which: Group’s share $ 219 $ 378 $ 341 $ 372 $ 315 $ 396 $ 299 $ 304 Non-controlling interests’ share 41 11 12 11 22 6 4 6
Total assets $ 196,706 $ 199,680 $ 193,987 $ 196,409 $ 190,137 $ 189,683 $ 188,024 $ 184,383Return on equity 7.3% 11.6% 11.1% 12.1% 11.9% 13.5% 11.5% 12.0%Tier 1 capital ratio 16.8 16.5 16.1 16.0 17.3 17.0 17.2 17.6Total capital ratio 19.3 19.0 18.8 19.2 19.3 18.3 18.6 19.1

46 2012 DESJARDINS GROUP ANNUAL REPORT – MANAGEMENT’S DISCUSSION AND ANALYSIS
FOURTH QUARTER RESULTSFor the fourth quarter of 2012, Desjardins Group posted surplus earnings before member dividends of $325 million, down $102 million, or 23.9%, compared to the corresponding quarter in 2011.
These results reflect the contribution of the Personal Services and Business and Institutional Services segment, which totalled $262 million. The Wealth Management and Life and Health Insurance segment and the Property and Casualty Insurance segment contributed $44 million and $63 million, respectively. The Other category reduced surplus earnings of $44 million.
Return on equity for the quarter was 7.3%, compared to 11.9% for the fourth quarter of 2011. The decline was due to the significant growth in equity as a result of $1.0 billion in capital shares issued by the Federation and growth in undistributed surplus earnings.
OPERATING INCOME
Net interest income for the fourth quarter of 2012 decreased to $948 million, compared to $1,006 million for the same period in the previous year. Despite the increase of $7.4 billion, or 5.9%, in all outstanding loans during the year, the combination of low interest rates and fierce market competition led to this decline.
Growth in business insurance operations pushed up net premiums by 8.5% to $1,325 million.
The overall insurance operations of the Wealth Management and Life and Health Insurance segment posted net insurance and annuity premiums of $862 million for the fourth quarter of 2012, compared to $792 million for the same period in 2011, representing an 8.8% increase. Net insurance premiums were up 7.6% over 2011 to total $803 million.
Premium volume for individual insurance was $140 million, an $11 million increase compared to the same quarter in 2011. Premium volume from the network of life insurance representatives assigned to Desjardins caisses increased by 7.0%, compared to the corresponding quarter in the previous year. After remarkable sales growth from the distribution networks in recent years, premiums cashed for the fourth quarter of 2012 increased by $7.6 million, or 9.9%, compared to the same quarter in 2011. In addition, the premium volume for products marketed via direct distribution posted a 4.6% growth to total $25 million.
Premiums for group insurance purchased by Desjardins Group members increased by 3.6% and premiums for insurance from other client bases were up 8.8%.
The overall activities of the Property and Casualty Insurance segment generated net premiums of $521 million in the fourth quarter of 2012, compared to $478 million for the same period in 2011, a 9.0% increase, resulting primarily from the increase in policies issued due to spinoffs from growth initiatives targeting mass market clients and groups both in Quebec and across Canada, the development of white label partnerships, the business insurance offer and higher average premiums in certain business sectors. Western Financial Group Inc. contributed $27 million to net premiums in 2012.
Operating income stood at $591 million, down $3 million from the corresponding quarter in 2011.
INVESTMENT INCOME
Investment income was down $514 million from 2011, mainly due to the decrease in investment income associated with life and health insurance operations resulting from changes in the fair value of assets backing liabilities, which were largely offset by changes in actuarial liabilities.
TOTAL INCOME
Total income for the fourth quarter of 2012 was $3,040 million, down $471 million, or 13.4%, from the corresponding quarter in 2011.
PROVISION FOR CREDIT LOSSES
The provision for credit losses totalled $47 million for the fourth quarter of 2012, down $7 million, or 13.0%, from the corresponding period in 2011.

472012 DESJARDINS GROUP ANNUAL REPORT – MANAGEMENT’S DISCUSSION AND ANALYSIS
CLAIMS, BENEFITS, ANNUITIES AND CHANGES IN INSURANCE AND INVESTMENT CONTRACT LIABILITIES
Expenses related to claims, benefits, annuities and changes in insurance and investment contract liabilities totalled $991 million, for a decrease of 31.4% compared to the same period in the previous year. The Wealth Management and Life and Health Insurance segment had expenses of $671 million, down $455 million, or 40.4%, from those recorded for the same quarter in 2011. This decline resulted mainly from a $987 million decrease in changes in actuarial liabilities included under “Insurance and investment contract liabilities”, attributable in particular to the fluctuation in the fair value of investments. Changes in valuation assumptions made in the normal course of business pushed up expenses by $77 million, while they had decreased by $43 million in 2011. Gains related to underwriting experience in individual insurance narrowed the unfavourable difference created by the changes in assumptions.
The expenses of the Property and Casualty Insurance segment totalled $324 million, compared to $319 million in 2011, for an increase of $5 million, or 1.6%. Furthermore, the loss ratio was 64.8% for the fourth quarter of 2012, compared to 67.6% for the corresponding period in 2011.
NON-INTEREST EXPENSE
Non-interest expense was up $99 million, or 6.7%, compared to the fourth quarter of 2011, to total $1,576 million. This increase was mainly due to the annual increase in salaries and fringe benefits, and to the increase in expenses resulting directly from the growth in operations and the revaluation of assets.
The productivity index, calculated as the ratio of non-interest expense to total income, net of expenses related to claims, benefits, annuities and changes in insurance and investment contract liabilities, was 76.9% for the fourth quarter, compared to 71.4% for the same quarter a year earlier. The growth in non-interest expense, combined with lower income as a result of the poorer performance of investments in the fourth quarter of 2012, versus the same period in 2011, accounted for the index deterioration.
SEGMENT RESULTS FOR THE FOURTH QUARTER
PERSONAL SERVICES AND BUSINESS AND INSTITUTIONAL SERVICES
The Personal Services and Business and Institutional Services segment recorded surplus earnings before member dividends of $262 million for the fourth quarter of 2012, down $28 million, or 9.7%, from the same period in 2011.
Operating income totalled $1,396 million in the fourth quarter of 2012, compared to $1,379 million for the corresponding period in the previous year. It was affected by a slight decrease in net interest income, and especially by the combination of continuing low interest rates and fierce competition in mortgage lending. However, the increase in outstanding residential mortgages and business loans mitigated the impact. Other operating income was up $33 million compared to the same period in the previous year as a result of the growth in credit card and point-of-sale financing activities and an increase in caisse network sales of Desjardins products designed by the subsidiaries.
Investment income decreased by $16 million compared to the same period a year earlier, mainly due to a lower return on liquidities and investments in the caisse network as a result of the continuing low interest rate environment.
Total income for the segment was $1,405 million, up slightly compared to the fourth quarter of 2011.
The provision for credit losses stood at $47 million for the fourth quarter of 2012, down $7 million, or 13.0%, from the corresponding period in 2011, despite growth in the outstanding loan portfolio. This decline was due mainly to the adjustments related to changes in the parameters of the provision.
Non-interest expense was up $47 million, or 4.9%, compared to the same period in 2011, reflecting the increase in salaries and fringe benefits arising from business growth and annual indexing. The increase in other expenses resulted directly from growth in operations and the BONUSDOLLARS Rewards Program.

48 2012 DESJARDINS GROUP ANNUAL REPORT – MANAGEMENT’S DISCUSSION AND ANALYSIS
WEALTH MANAGEMENT AND LIFE AND HEALTH INSURANCE
The Wealth Management and Life and Health Insurance segment recorded net surplus earnings of $44 million for the fourth quarter of 2012, down $61 million, or 58.1%, compared to the same quarter in 2011. This decrease was essentially the result of life and health insurance operations, whose contribution to surplus earnings for the quarter was reduced by changes in valuation assumptions. In 2011, annual updates of these assumptions had had the opposite effect on surplus earnings. This factor was partially offset by an improvement in underwriting experience and a gain on investment transactions.
Operating income was impacted by a $56 million increase in net insurance premiums and a $14 million increase in net annuity premiums compared to 2011.
Investment income was down $568 million compared to 2011, mainly because of the decrease in investment income associated with life and health insurance operations resulting from changes in the fair value of assets backing liabilities, which were largely offset by changes in actuarial liabilities.
The segment’s total income was $1,148 million, for a decrease of $498 million, or 30.3%, compared to 2011.
Expenses related to claims, benefits, annuities and changes in insurance and investment contract liabilities stood at $671 million, down $455 million, or 40.4%, compared to the same period in 2011. This change essentially results from a decrease of $496 million in the actuarial liabilities included under “Insurance and investment contract liabilities”, attributable in particular to the fluctuation in the fair value of investments.
Non-interest expense was up $24 million, or 5.9%, to $429 million for the fourth quarter of 2012.
PROPERTY AND CASUALTY INSURANCE
For the fourth quarter of 2012, this segment’s net surplus earnings totalled $63 million, up $21 million, or 50.0%, compared to 2011, mainly as a result of the more favourable loss ratio in 2012. The loss ratio stood at 64.8% for this quarter, down 2.8 points from 2011.
Operating income was impacted by the $43 million increase in net premiums generated by the increase in policies issued. This increase is due to the same reasons as those given for 2012. Other operating income increased by $5 million, chiefly because of the growth in the commission income of Western Financial Group Inc.
Investment income was down $6 million compared to the same period in 2011, essentially as a result of the lower interest rates on the market in 2011, which led to an increase in the value of bonds in 2011, compared to 2012.
Total income for the segment was $586 million for the fourth quarter of 2012, for a $39 million, or 7.1%, increase over the same period in 2011.
The loss ratio decreased from 67.6% in the fourth quarter of 2011 to 64.8% in the corresponding quarter of 2012. The lower loss ratio was primarily due to the reduction in the provisions related to pyrrhotite claims, while an increase in these provisions had been recorded in the fourth quarter of 2011. Finally, as was the case for all of 2012, the discount rate had a favourable impact on the fourth quarter of 2012 compared to the corresponding quarter in 2011.
Non-interest expense rose $12 million, or 7.1%, mainly as a result of the increase in salaries and fringe benefits, IT costs, and advertising expenses incurred to support and stimulate business growth, as well as a $4 million increase related to the operations of Western Financial Group Inc.

492012 DESJARDINS GROUP ANNUAL REPORT – MANAGEMENT’S DISCUSSION AND ANALYSIS
OTHER CATEGORY
CONTRIBUTION TO SURPLUS EARNINGS
The deficit for the period of the operations combined in the Other category totalled $44 million, compared with a deficit of $10 million for the corresponding period in 2011.
FOURTH QUARTER 2012
The deficit of $44 million for the period was especially attributable to fringe benefits and the revaluation of assets, which were offset by the increase of $37 million in the fair value of the ABTN portfolio, net of hedging positions.
FOURTH QUARTER 2011
The deficit of $10 million for the period were mainly due to the large amounts invested to modernize IT systems and the unfavourable net impact related to changes in the fair value of derivatives used in hedging operations, which were offset by treasury activities.
QUARTERLY TRENDSQuarterly income, expenses and surplus earnings before member dividends fluctuate based on certain trends, including seasonal variations and changes in the general economic and market conditions. Table 15 presents the results for the past eight quarters.
Low market interest rates in recent quarters exerted pressure on net interest income, causing it to stagnate even though loans outstanding increased throughout the year. Since the third quarter of 2011, Desjardins Group has posted lower investment income associated with its life and health insurance operations, a decrease that was largely offset, however, by a decline in insurance contract liabilities.
Net premiums have grown steadily since the first quarter of 2011, partly as a result of the various acquisitions made by the insurance segments and business development initiatives.
The provision for credit losses has decreased since the first quarter of 2012 despite the continuous increase in loans outstanding, which reflects the good quality of the loans.
Expenses related to claims, benefits, annuities and changes in insurance and investment contract liabilities experienced quarterly fluctuations as a result of changes in the fair value of investments associated with life and health insurance operations, which reflects market volatility. These changes are also attributable to the lower frequency of claims in the Property and Casualty Insurance segment resulting from more favourable weather conditions.
In step with business growth, non-interest expense has been on the rise since the beginning of 2011. However, summer periods are characterized by a decrease in salary expense due to less intense capital market activity.
Since the second quarter of 2011, the results of Western Financial Group Inc. have been integrated with those of Desjardins Group.
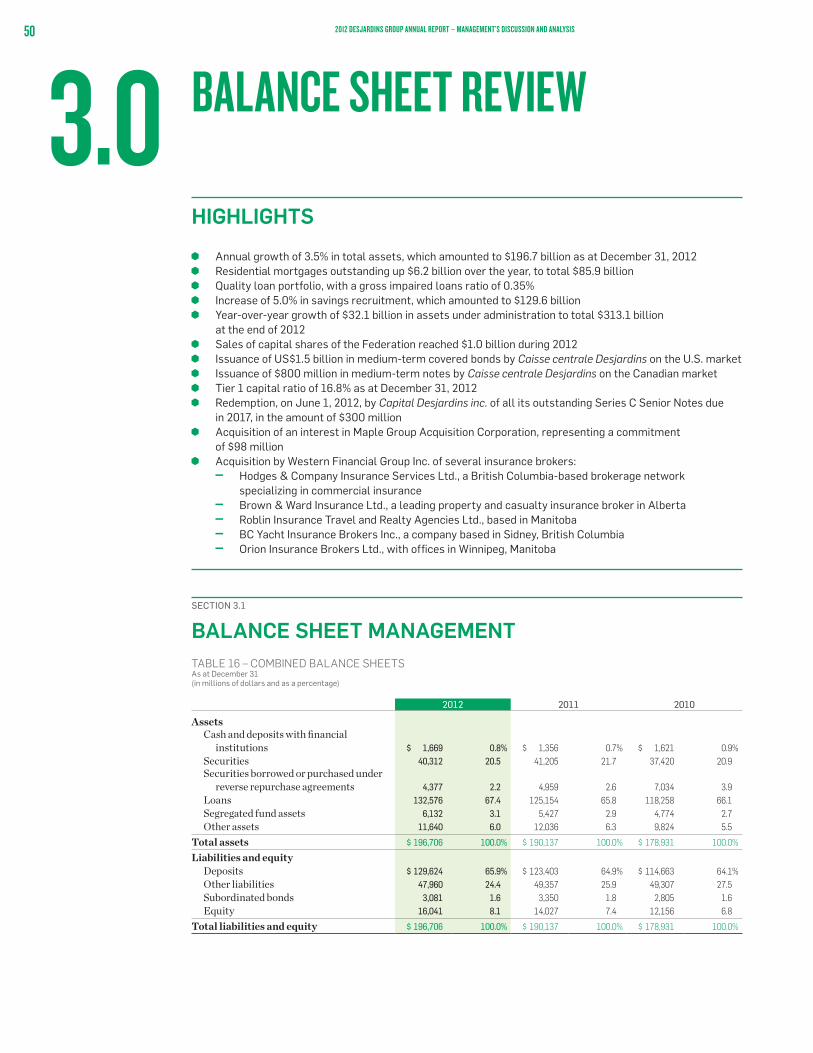
50 2012 DESJARDINS GROUP ANNUAL REPORT – MANAGEMENT’S DISCUSSION AND ANALYSIS
3.0HIGHLIGHTS
Annual growth of 3.5% in total assets, which amounted to $196.7 billion as at December 31, 2012 Residential mortgages outstanding up $6.2 billion over the year, to total $85.9 billion Quality loan portfolio, with a gross impaired loans ratio of 0.35% Increase of 5.0% in savings recruitment, which amounted to $129.6 billion Year-over-year growth of $32.1 billion in assets under administration to total $313.1 billion
at the end of 2012 Sales of capital shares of the Federation reached $1.0 billion during 2012 Issuance of US$1.5 billion in medium-term covered bonds by Caisse centrale Desjardins on the U.S. market Issuance of $800 million in medium-term notes by Caisse centrale Desjardins on the Canadian market Tier 1 capital ratio of 16.8% as at December 31, 2012 Redemption, on June 1, 2012, by Capital Desjardins inc. of all its outstanding Series C Senior Notes due
in 2017, in the amount of $300 million Acquisition of an interest in Maple Group Acquisition Corporation, representing a commitment
of $98 million Acquisition by Western Financial Group Inc. of several insurance brokers:
– Hodges & Company Insurance Services Ltd., a British Columbia-based brokerage network specializing in commercial insurance
– Brown & Ward Insurance Ltd., a leading property and casualty insurance broker in Alberta – Roblin Insurance Travel and Realty Agencies Ltd., based in Manitoba – BC Yacht Insurance Brokers Inc., a company based in Sidney, British Columbia – Orion Insurance Brokers Ltd., with offices in Winnipeg, Manitoba
SECTION 3.1
BALANCE SHEET MANAGEMENTTABLE 16 – COMBINED BALANCE SHEETS As at December 31 (in millions of dollars and as a percentage)
2012 2011 2010
Assets Cash and deposits with financial
institutions $ 1,669 0.8% $ 1,356 0.7% $ 1,621 0.9% Securities 40,312 20.5 41,205 21.7 37,420 20.9 Securities borrowed or purchased under
reverse repurchase agreements 4,377 2.2 4,959 2.6 7,034 3.9 Loans 132,576 67.4 125,154 65.8 118,258 66.1 Segregated fund assets 6,132 3.1 5,427 2.9 4,774 2.7 Other assets 11,640 6.0 12,036 6.3 9,824 5.5
Total assets $ 196,706 100.0% $ 190,137 100.0% $ 178,931 100.0%
Liabilities and equity Deposits $ 129,624 65.9% $ 123,403 64.9% $ 114,663 64.1% Other liabilities 47,960 24.4 49,357 25.9 49,307 27.5 Subordinated bonds 3,081 1.6 3,350 1.8 2,805 1.6 Equity 16,041 8.1 14,027 7.4 12,156 6.8
Total liabilities and equity $ 196,706 100.0% $ 190,137 100.0% $ 178,931 100.0%
BALANCE SHEET REVIEW

512012 DESJARDINS GROUP ANNUAL REPORT – MANAGEMENT’S DISCUSSION AND ANALYSIS
TOTAL ASSETS (in billions of dollars)
100
150
200
250
201220112010
197
179190
ASSET GROWTH (as a percentage)
0.0
5.0
10.0
15.0
201220112010
3.5
13.6
6.3
TOTAL ASSETSAs at December 31, 2012, Desjardins Group’s total assets stood at $196.7 billion, up $6.6 billion, or 3.5%, from a year earlier, compared to an increase of $11.2 billion, or 6.3%, during 2011. In spite of slower economic growth, Desjardins Group’s expansion continued, in large part due to strong credit demand, especially in the residential mortgage sector.
Desjardins Group also stood out in personal, business and government savings recruitment in 2012. Its deposit liabilities, which totalled $129.6 billion as at December 31, 2012, experienced growth that was just as sustained as in 2011 for an increase of $6.2 billion, or 5.0% over the year. In addition, off-balance sheet savings from members and clients, namely savings accumulated in the form of investments in investment funds and other securities, recorded faster growth in 2012, notably because of improvements in the stock market.
CASH AND DEPOSITS WITH FINANCIAL INSTITUTIONS, AND SECURITIESCash and deposits with financial institutions, and securities, including securities borrowed or purchased under reverse repurchase agreements, decreased by $1.2 billion, or 2.4%, since year-end 2011, to total $46.4 billion as at December 31, 2012. Securities other than those borrowed or purchased under reverse repurchase agreements amounted to $40.3 billion as at December 31, 2012, down $893 million, or 2.2%. Securities borrowed or purchased under reverse repurchase agreements followed the same trend and declined by $582 million, or 11.7%, during the same period, to $4.4 billion.
LOANS
FINANCING ACTIVITIESAs at December 31, 2012, Desjardins Group’s outstanding loan portfolio, net of the allowance for credit losses, was up $7.4 billion, or 5.9%, over the year, to total $132.6 billion, compared to an increase of $6.9 billion, or 5.8%, during 2011. This faster growth is largely due to mortgage financing.
In light of the main borrower categories presented in Table 17, financing, which comprises residential mortgages, consumer loans, credit card advances and other personal loans, formed the largest credit category in Desjardins Group’s loan portfolio as at December 31, 2012, representing 78.5%. Loans outstanding in this category were $104.5 billion as at that date, for a year-over-year increase of $6.8 billion, or 6.9%, compared to a growth of $5.7 billion, or 6.2%, during 2011. The improvement in Desjardins Group’s results in this market is attributable to residential mortgages.
Moreover, Desjardins Group was also very active in business and government financing. As at December 31, 2012, its outstanding loans in this sector amounted to $28.5 billion, a year-over-year increase of $596 million, or 2.1%, compared to a growth of $1.2 billion, or 4.4%, during 2011.

52 2012 DESJARDINS GROUP ANNUAL REPORT – MANAGEMENT’S DISCUSSION AND ANALYSIS
RESIDENTIAL MORTGAGES
The outstanding residential mortgage portfolio was up $6.2 billion, or 7.8%, over the year, to $85.9 billion as at December 31, 2012, compared to an increase of $5.2 billion, or 7.0%, during 2011. This increase is mainly attributable to the quality and diversity of Desjardins Group’s mortgage products and its extensive distribution network. It should be noted that Desjardins Group is still the leading residential mortgage lender in Quebec, with a market share estimated at 35.8% as at December 31, 2012.
CONSUMER, CREDIT CARD AND OTHER PERSONAL LOANS
As at December 31, 2012, the outstanding consumer, credit card and other personal loan portfolio posted a year-over-year increase of $535 million, or 3.0%, to total $18.5 billion, compared to a growth of $481 million, or 2.7%, during 2011. Desjardins Group’s sustained growth can be attributed to gains made by Card and Payment Services in automobile financing. Desjardins Group’s share of this market in Quebec was estimated at 22.9%.
Government-guaranteed loans in this portfolio included student loans and loans related to the Immigrant Investor Program and totalled $3.8 billion as at December 31, 2012, compared to $3.6 billion a year earlier.
BUSINESS LOANS
At year-end 2012, business loans, which mainly comprise commercial and industrial loans, totalled $26.9 billion, an increase of $871 million, or 3.4%, over the year, due to strong capital spending by businesses, which is supported by low-cost financing and improvements in business profitability. Desjardins Group’s share of the Quebec business loan market was estimated at 26.2% at year-end 2012.
As at December 31, 2012, Desjardins Group’s outstanding agricultural loans, which are included in the business loan portfolio, amounted to $5.5 billion, for an increase of $105 million, or 2.0%, over the year, compared to an increase of $183 million, or 3.5%, during 2011. Desjardins Group’s Quebec market share of agricultural loans was estimated at 41.4% at year-end 2012, which means that it remains a leader in this sector.
QUEBEC MARKET SHARE FINANCING ACTIVITIES (as a percentage)
20.0
25.0
30.0
35.0
40.0
45.0
201220112010
43.341.9
35.7
27.9
24.723.1
27.0
36.0
41.4
22.9
26.2
35.8
n Agricultural loansn Residential mortgagesn Business loansn Consumer, credit card and other personal loans
TABLE 17 – LOANS BY BORROWER CATEGORY As at December 31 (in millions of dollars and as a percentage)
2012 2011 2010(1)
Residential mortgages $ 85,931 64.6% $ 79,686 63.4% $ 74,466 62.7%Consumer, credit card and other personal loans 18,520 13.9 17,985 14.3 17,504 14.7Business 26,869 20.2 25,998 20.7 24,776 20.9Government 1,675 1.3 1,950 1.6 2,001 1.7
132,995 100.0% 125,619 100.0% 118,747 100.0%
Allowance for credit losses (419) (465) (489)
Total loans by borrower category $ 132,576 $ 125,154 $ 118,258
Loans guaranteed by governments and other public and parapublic institutions included above(1) $ 40,415 $ 36,362 $ 31,423
Loans guaranteed by government and other public or parapublic institutions as a percentage of total gross loans 30.4% 28.9% 26.5%
Residential mortgages and consumer, credit card and other personal loans as a percentage of total gross loans 78.5 77.7 77.4
(1) 2010 data restated to conform with the presentation of 2012 and 2011.

532012 DESJARDINS GROUP ANNUAL REPORT – MANAGEMENT’S DISCUSSION AND ANALYSIS
GOVERNMENT LOANS
As at December 31, 2012, Desjardins Group’s portfolio of outstanding loans to governments, in particular municipalities, stood at $1.7 billion, down $275 million, or 14.1%, from 2011, while it decreased by $51 million, or 2.5%, during 2011. It should be noted that a large proportion of Desjardins Group’s credit outstandings in this area are in the form of lines of credit that fluctuate significantly, due to the nature of government financing needs, such as at the municipal level.
CREDIT QUALITYDesjardins Group’s loan portfolio continues to be of excellent quality. Its outstanding gross impaired loans totalled $466 million as at December 31, 2012, down from $520 million at year-end 2011. The gross impaired loans ratio, as a percentage of the total gross loan portfolio, stood at 0.35% as at December 31, 2012, which constitutes an improvement compared to the ratio of 0.41% at the same date a year earlier. Desjardins Group continues to have one of the best gross impaired loans ratios in the Canadian banking industry.
Additional information about the quality of Desjardins Group’s credit portfolio is presented in section 4.1, “Risk management”, on pages 72 and 73 of this MD&A.
DEPOSITS
COMPOSITION OF THE DEPOSIT PORTFOLIO (as at December 31, 2012)
1.7%
33.2%
65.1%
n Individualsn Business and
governmentn Deposit-taking
institutions and other
SAVINGS RECRUITMENT ACTIVITIESAs at December 31, 2012, Desjardins Group’s outstanding deposits totalled $129.6 billion, up $6.2 billion, or 5.0%, over the year, compared to an increase of $8.7 billion, or 7.6%, during 2011. This increase was mainly the result of deposit recruitment from individuals, businesses and governments.
The composition of Desjardins Group’s deposit portfolio changed very little in 2012. Savings from its members and clients—individuals, businesses and governments—still made up its main source of financing. As at December 31, 2012, it alone accounted for 98.3% of its deposit liabilities, compared to 98.5% at year-end 2011. Deposits by individuals, which stood at $84.4 billion at the end of 2012, were up $1.9 billion, or 2.3%, over the year, versus an increase of $3.7 billion, or 4.7%, during 2011.
Individuals account for a dominant share of Desjardins Group’s deposit liabilities. However, deposits by businesses and governments account for a considerable share as well. These deposits, which totalled $43.0 billion as at December 31, 2012, were up $3.9 billion, or 10.0%, over the year, compared to a gain of $5.4 billion, or 16.1%, during 2011.
Additional information about Desjardins Group’s sources of financing can be found on pages 77 to 79, while its liquidity risk management policy is discussed on page 76.
TABLE 18 – DEPOSITS As at December 31 (in millions of dollars and as a percentage)
2012 2011(1) 2010(1)
Payable on demand
Payable upon notice
Payable on a fixed date Total Total Total Total Total Total
Individuals $ 26,674 $ 3,990 $ 53,751 $ 84,415 65.1% $ 82,486 66.8% $ 78,747 68.7%Business and government 14,999 311 27,723 43,033 33.2 39,104 31.7 33,686 29.4Deposit-taking institutions and other 46 — 2,130 2,176 1.7 1,813 1.5 2,230 1.9
Total deposits $ 41,719 $ 4,301 $ 83,604 $ 129,624 100.0% $ 123,403 100.0% $ 114,663 100.0%
(1) 2011 and 2010 data restated to conform with the presentation of 2012.

54 2012 DESJARDINS GROUP ANNUAL REPORT – MANAGEMENT’S DISCUSSION AND ANALYSIS
QUEBEC MARKET SHARE Personal savings recruitment activities Securities and investment funds (as a percentage)
14.0
14.5
15.0
15.5
16.0
201220112010
15.2
14.514.4
14.3
15.415.5
n Investment fundsn Securities
QUEBEC MARKET SHARE Personal savings recruitment activities On-balance sheet savings (as a percentage)
42.0
42.5
43.0
43.5
44.0
201220112010
42.9
42.7 42.7
n On balance sheet savings
SAVINGS FROM INDIVIDUALS
Deposits by individuals represented 65.1% of Desjardins Group’s deposit liabilities as at December 31, 2012, comparable to the proportion at year-end 2011, which was 66.8%. As at December 31, 2012, the volume of personal savings totalled $84.4 billion, an increase of $1.9 billion, or 2.3%, over the year, compared to an increase of $3.7 billion, or 4.7%, during 2011. This less-sustained growth in deposit recruitment occurred in a low interest rate environment with increased competition from off-balance sheet savings products.
Of the three broad categories of deposits offered by Desjardins Group to its individual members and clients, savings payable on a fixed date is the largest component. This type of deposit represented 63.7% of savings from individuals at year-end 2012, compared to 61.6% at year-end 2011. Savings payable on a fixed date rose $2.9 billion, or 5.7%, over the year, to $53.8 billion as at December 31, 2012, versus an increase of $1.6 billion, or 3.3%, during 2011. Savings payable on demand and upon notice, which accounted for 36.3% of deposits made by Desjardins Group’s individual members and clients over the years, was down by $972 million, or 3.1%, over the year, to $30.7 billion at year-end 2012.
Desjardins Group still ranks as the leader in Quebec for on-balance sheet savings, with a market share estimated at 42.7% as at December 31, 2012.
SAVINGS FROM DEPOSIT-TAKING INSTITUTIONS AND OTHER SOURCES
Outstanding deposits by deposit-taking institutions, which totalled $2.2 billion as at December 31, 2012, grew by $363 million, or 20.0%, over the year, compared to a decrease of $417 million, or 18.7%, during 2011. This type of deposit represented only 1.7% of Desjardins Group’s total deposit liabilities at the end of 2012, versus 1.5% a year earlier.
OTHER LIABILITIESOther liabilities amounted to $48.0 billion as at December 31, 2012, compared to a volume of $49.4 billion recorded at year-end 2011, which represents a $1.4 billion, or 2.8%, decrease. These liabilities comprise mainly insurance and investment contract liabilities as well as commitments related to securities sold short and securities lent or sold under repurchase agreements. They totalled $17.8 billion, $5.0 billion and $8.0 billion, respectively, as at December 31, 2012.
EQUITYEquity amounted to $16.0 billion as at December 31, 2012, compared to $14.0 billion as at December 31, 2011, for an increase of $2.0 billion, or 14.4%. The main sources of this growth were the capital shares the Federation issued to caisse members, which totalled more than $1.0 billion, as well as net surplus earnings for the year after member dividends, which were $1.4 billion.

552012 DESJARDINS GROUP ANNUAL REPORT – MANAGEMENT’S DISCUSSION AND ANALYSIS
SECTION 3.2
CAPITAL MANAGEMENTTIER 1 CAPITAL RATIO (as a percentage)
0.0
5.0
10.0
15.0
20.0
25.0
201220112010
16.817.7 17.3
Capital management is crucial to Desjardins Group’s financial management, and takes into account its regulatory obligations, the economic and financial environment, its risk profile, and its cooperative difference and objectives.
Desjardins Group advocates prudent management of its capital. Its purpose is to maintain higher regulatory capital ratios than those of the Canadian banking industry and regulatory requirements. As at December 31, 2012, Desjardins Group’s Tier 1 capital and total capital ratios stood at 16.8% and 19.3%, respectively, compared to ratios of 17.3% and 19.3%, respectively, as at December 31, 2011. Desjardins Group’s prudent management is further reflected in the credit ratings granted by the various rating agencies.
The 2008–2009 global financial crisis prompted the industry to place more emphasis on capitalization. Now more than ever, the rating agencies and the market favour the best-capitalized institutions. These factors argue in favour of a general increase in the level and quality of capital issued by financial institutions. This is also reflected in the stricter capital adequacy requirements that will apply following the implementation of Basel III, in the first quarter of 2013. It was against this backdrop that Desjardins Group set its minimum target for Tier 1a capital at 15% and its minimum target for Tier 1 capital at 15% over the 2013–2016 horizon.
DESJARDINS GROUP’S INTEGRATED CAPITAL MANAGEMENT FRAMEWORKThe purpose of capital management is to ensure that the capital structure and level of Desjardins Group and its components are adequate in terms of the risks taken by the organization, profitability targets, growth objectives, rating agencies’ expectations and regulators’ requirements. In addition, capital management serves to optimize the allocation of capital and internal capital flow mechanisms, and support growth, development and asset risk management at Desjardins Group.
Broadly speaking, Desjardins Group’s Integrated Capital Management Framework includes the policies and processes required to set targets for its capitalization and to assign targets to its components, to establish strategies to ensure that targets are met, to quickly raise capital, to ensure that the components’ performance is appropriately measured, and to optimize internal capital flow and use mechanisms.
Desjardins Group has set up a stress-testing program aimed to establish and measure the effect of various integrated scenarios, i.e. to simulate various economic scenarios for all of its components and assess the financial and regulatory repercussions. This procedure makes it possible to determine if the required capital, as established in the capitalization plan, is adequate in view of the risks to which Desjardins is exposed.
POLICIESDesjardins Group’s capital management is the responsibility of the Federation’s Board of Directors. To support it with this task, it has mandated the Finance and Risk Management Committee and the Asset/Liability Committee to ensure that Desjardins Group has a sufficient and reliable capital base. The Finance Executive Division and Office of the CFO is responsible for preparing, on an annual basis and with the help of Desjardins Group’s components, a capitalization plan that sets and updates capital objectives and targets for all components.
The current situation and the forecast show that Desjardins Group has a solid capital base overall and, therefore, sufficient latitude to pursue its growth strategy.

56 2012 DESJARDINS GROUP ANNUAL REPORT – MANAGEMENT’S DISCUSSION AND ANALYSIS
BASEL II Desjardins Group’s regulatory capital ratios are calculated according to the AMF’s guideline on adequacy of capital base applicable to financial services cooperatives. Since fiscal 2009, this regulatory framework has been largely based on the revised framework for international convergence of capital measurement and capital standards (Basel II) issued by the Bank for International Settlements. In this regard, the AMF allowed Desjardins Group to use the Internal Ratings-Based Approach, subject to compliance with conditions, for credit risk related to retail loan portfolios (individuals). Other credit exposures and market risk are assessed according to a Standardized Approach, while operational risk is calculated based on the Basic Indicator Approach.
The minimum total capital ratio recommended to institutions for compliance with the Bank for International Settlements’ regulatory requirements and to be considered sufficiently capitalized is 8%. In addition, the Tier 1 capital ratio must represent at least half of the total capital ratio. With the coming into force of the Basel II regulatory framework, the AMF revised its minimum total capital ratio to 11.5%. Desjardins Group maintained its financial objective for the Tier 1 capital ratio at a minimum of 15% (the same level as the target for the total capital ratio), thus taking into account the prevailing global economic context and the framework of the AMF’s guideline on adequacy of capital base.
At 16.8% and 19.3%, respectively, Desjardins Group’s Tier 1 and total capital ratios exceed not only the minimum regulatory requirement but also Desjardins Group’s own financial objective.
In addition to minimum Tier 1 and total capital ratios, the AMF requires that Desjardins Group maintain an assets-to-regulatory capital ratio that does not exceed 20 times to 1. This measure allows overall capital adequacy to be determined against the entity’s total assets, including certain off-balance sheet items. With an assets-to-capital ratio of 11.5 times to 1 as at December 31, 2012, Desjardins Group is well below the limit set by the AMF.
Since the implementation of Basel II, Desjardins Group has applied the deferred treatment prescribed by the AMF, under which equity related to investments in its insurance subsidiaries made before January 1, 2007, was fully deducted from Tier 2 capital until the end of fiscal 2011. Effective January 1, 2012, this equity is deducted in equal shares of 50% from Tier 1 capital and Tier 2 capital. The end of the application of this deferred treatment had an unfavourable impact of approximately 130 basis points on the Tier 1 capital ratio as at December 31, 2012, while the total capital ratio remained the same.
Until the new Basel III requirements are implemented in 2013, regulators are revising certain regulations, in particular concerning market risk and the weighting of some securitization categories (Basel 2.5); these regulations have been effective since the first quarter of 2012. The changes concerning market risk had no significant impact on the increase in risk-weighted assets, while the changes concerning securitization generated an increase of $512 million in risk-weighted assets as at December 31, 2012, which was entirely offset by the resulting lower trigger point adjustment so that the impact on Desjardins Group’s capital ratios is nil.
BASEL IIIOn December 16, 2010, and January 13, 2011, the Bank for International Settlements issued new requirements (Basel III) for the global regulation of capital standards. In fact, since 2009, various consultative proposals have been submitted to the banking industry as a whole to build a more secure financial system that is more resilient in periods of stress. The new rules, which will be phased in over the next few years, increase not only capital requirements (the minimum levels to be met) but also risk management requirements. The new framework, combined with global liquidity standards, forms an essential element of the global financial reform program. These new Basel III capital standards have been integrated into the AMF’s guideline on adequacy of capital base applicable to financial services cooperatives, which was updated in December 2012.

572012 DESJARDINS GROUP ANNUAL REPORT – MANAGEMENT’S DISCUSSION AND ANALYSIS
The key points of the new regulatory capital standards set out in Basel III are:
1) Improvement in the quality of financial institutions’ capital:• Anewdefinitionofthecomponentsof
capital categories • AgreaterfocusonthebestTier1capital
component to absorb losses (Tier 1a capital or Common Equity Tier 1)
2) Increase in minimum capital requirements:• Tier1acapitalratioof7.0%,including
a 2.5% capital conservation buffer• Tier1capitalratioof8.5%,including
a 2.5% capital conservation buffer• Totalcapitalratioof10.5%,including
a 2.5% capital conservation buffer• TheBaselCommitteealsoprovidesforthe
addition of a minimum leverage ratio to prevent the build-up of excessive leverage (a requirement already imposed on Desjardins Group by its regulatory authority)
3) Reduction of systemic risk:• StrongincentivefromtheBaselCommittee
to have a countercyclical capital buffer, ranging from 0% to 2.5%, in order to prevent risk from spreading throughout the entire financial system
4) Addition of supplementary criteria for capitalization instruments to ensure their capacity to absorb losses in insolvency
The increased minimum capital levels will be phased in between 2013 and 2019. The above-mentioned minimum capital requirements represent the minimum regulatory requirements for 2019. The AMF nevertheless expects that Desjardins Group will meet the minimum capital requirements for 2019 in the first quarter of 2013. Should these targets not be met, the AMF may impose measures that could take the form of restrictions on distributions. Desjardins Group was already well capitalized as at December 31, 2012, and expects to exceed these targets.
Capital instruments that do not meet the eligibility criteria for tier capital will be excluded from the tier effective January 1, 2013. However, instruments that meet certain conditions will be gradually eliminated from capital at an annual rate of 10% over a nine-year period beginning January 1, 2013, in accordance with the transitional provisions set out in the AMF guideline. These instruments include an amount of
$2.3 billion in permanent shares and surplus shares that will be subject to the 10% amortization. These shares were eligible as Tier 1 capital under Basel II as at December 31, 2012. Desjardins Group is currently devising a strategy to mitigate the gradual impact of the amortization on its ratios.
Moreover, upon initial application of Basel III as at January 1, 2013, subordinated bonds will also be subject to the 10% amortization. In order to be fully eligible as Tier 2 capital, such subordinated bonds will need to meet Non-Viability Contingent Capital (NVCC) requirements. Discussions concerning the application of these requirements to cooperative entities are still in progress at the international level. Desjardins Group does not plan to issue any subordinated debt until these requirements are further clarified.
HIGHLIGHTS OF CAPITAL MANAGEMENT
On June 18, 2012, the Federation introduced a program to issue capital shares for a maximum of $1.2 billion. An amount of $1,025 million had been issued as at December 31, 2012. These capital shares, currently included in Tier 1 capital under Basel II, meet the upcoming regulatory capital requirements (Basel III) for Tier 1a capital.
On June 1, 2012, Capital Desjardins inc. called all outstanding Series C senior subordinated bonds, in the amount of $300 million.
ANALYSIS OF CAPITAL RATIOS
Desjardins Group is one of the best capitalized financial institutions in Canada: its Tier 1 and total capital ratios, measured under the Basel II regulatory framework, stood at 16.8% and 19.3%, respectively, as at December 31, 2012 (17.3% and 19.3%, respectively, as at December 31, 2011). Desjardins Group therefore still has excellent capitalization, with a Tier 1 capital ratio above its 15% objective. The high level of Tier 1 capital demonstrates the financial strength of Desjardins Group, even in a challenging economic environment.
58 2012 DESJARDINS GROUP ANNUAL REPORT – MANAGEMENT’S DISCUSSION AND ANALYSIS
The Tier 1 capital ratio as at December 31, 2012, at 16.8%, was down 50 basis points from its level a year earlier. This decline is mainly attributable to the end of the deferred treatment applicable to equity related to investments in its insurance subsidiaries made before January 1, 2007, as explained under “Basel II” above, and to the amortization of the initial IFRS impact, which were partially offset by the issuance of capital shares by the Federation and by organic growth. The total capital ratio remained unchanged as at December 31, 2012, compared to December 31, 2011. The issuance of capital shares by the Federation and organic growth offset the decline resulting from the amortization of the initial IFRS impact, the redemption of subordinated debt and the increase in deductions related mainly to the increase in the value of interests in deconsolidated subsidiaries for purposes of calculating regulatory capital.
As at January 1, 2011, the date of conversion to IFRS, Desjardins Group elected to use the transitional provisions permitted by the AMF. This election was irrevocable and made it possible to mitigate the impacts of the new accounting standards through a quarterly adjustment of eligible undistributed surplus earnings over a two-year period ending December 31, 2012. Accordingly, for purposes of calculating the Tier 1 capital ratio, Desjardins Group amortized, the eligible portion of the IFRS impact of $1.2 billion on a straight-line basis, for a quarterly amortization of $145 million, between January 1, 2011, and December 31, 2012. As at December 31, 2012, this impact had been completely amortized, and all impacts related to the first-time adoption of IFRS had been fully taken into account in the capital ratio calculations.
In addition to the impact of the implementation of Basel III on capital ratios, presented under “Basel III” above, capital ratios could be impacted, effective in the first quarter of 2013, by the amendments to IAS 19, “Employee Benefits”, on accounting for defined
benefit pension plans. These amendments stipulate in particular that the use of the “corridor approach” is no longer allowed and that all actuarial gains and losses must now be recognized when they occur. In addition, it is no longer permitted to amortize past service costs, which will accelerate its recognition. At the same time, the new standard allows risk-sharing features to be taken into account. The total negative impact, estimated as at today’s date, of these amendments on Tier 1a capital would be about 65 basis points. However, the initial negative impact could be deferred and amortized on a straight-line basis over the period from January 1, 2013, to December 31, 2014, depending on whether Desjardins Group elects to use the transitional provision stipulated for that purpose by the AMF.
Furthermore, in preparation for the transition to the new Basel III requirements, Desjardins Group has initiated a process to refine all the processes and parameters used to calculate regulatory capital.
As at December 31, 2012, pro forma Tier 1a and Tier 1 capital ratios, which were calculated in accordance with this exercise and Basel III requirements, are both estimated at 16.3% (excluding the incidence of applying the amendments to IAS 19, “Employee Benefits”, on accounting for defined benefit pension plans, whose incidence is described under “Analysis of capital ratios” above, and the 10% amortization, applicable as at January 1, 2013, of capital not eligible under Basel III, but eligible under transitional provisions). Tier 1 capital would fluctuate mainly as a result of the inclusion of other comprehensive income, the fact that a significant portion of the investments in the insurance subsidiaries would no longer be deducted from capital, but rather weighted at 250% under Basel III, and the treatment of unrated securitizations, which would no longer be deducted from capital but rather weighted at 1,250% under Basel III.

592012 DESJARDINS GROUP ANNUAL REPORT – MANAGEMENT’S DISCUSSION AND ANALYSIS
TABLE 19 – REGULATORY CAPITAL As at December 31 (in millions of dollars and as a percentage)
2012 2011
Tier 1 capital Eligible capital shares $ 3,294 $ 2,186 Reserves 10,216 9,032 Undistributed surplus earnings 1,282 1,236 Deferral attributable to the adoption of IFRS — 578 Non-controlling interests 60 60 Goodwill (341) (336) Other deductions(1) (1,586) (423)
Total Tier 1 capital 12,925 12,333
Tier 2 capital Subordinated bonds 3,092 3,363 Eligible collective allowance 261 256 Other eligible securities 112 110 Non-controlling interests 15 68 Other deductions(1) (1,578) (2,379)
Total Tier 2 capital 1,902 1,418
Total regulatory capital $ 14,827 $ 13,751
Capital ratios Tier 1 capital 16.8% 17.3% Total capital 19.3 19.3
(1) Mainly includes the provision deficit related to the Internal Ratings-Based Approach ($309 million [$346 million as at December 31, 2011]), securitization exposures ($222 million [$117 million as at December 31, 2011]) and investments ($2,517 million [$2,254 million as at December 31, 2011]) in components deconsolidated for regulatory capital purposes (primarily Desjardins Financial Security Life Assurance Company and Desjardins General Insurance Group Inc.) as well as investments ($107 million [$80 million as at December 31, 2011]) in associates.
COMPLIANCE WITH REQUIREMENTS
With respect to regulatory capital, the capital adequacy and composition of Desjardins Group as a whole are evaluated using the guideline on adequacy of capital base standards issued by the AMF. The AMF requires that a minimum amount of capital be maintained on a combined basis by all the components, especially the caisses, the Federation (as a legal entity), Caisse centrale Desjardins, Fonds de sécurité Desjardins, Capital Desjardins inc., Western Financial Group Inc., Desjardins Securities Inc. and Desjardins Trust Inc.
This capital takes into consideration investments made in other Desjardins Group components. Some of Desjardins Group’s components are subject to separate requirements with respect to regulatory capital, liquidities and financing, which are set by organizations that regulate banking and securities. Their requirements may be subject to amendments to the regulations and differ by activity. The liquidity of
Desjardins Group’s main components is assessed on an ongoing basis, given the regulatory restrictions imposed by local administrations, as well as operational, tax, economic and other constraints on the flow of funds between components. In this way, Desjardins Group is able to manage and minimize the liquidities it maintains. It monitors and manages liquidity and capital requirements in these entities in order to ensure an efficient use of capital and continuous compliance, by each of these entities, with regional regulations. Additional details concerning the AMF guideline and the regulatory framework governing the capitalization of each Desjardins Group entity are presented in Note 31, “Capital management”, to the Combined Financial Statements.
Desjardins Group and all its entities subject to minimum regulatory capital requirements were in compliance with these requirements as at December 31, 2012, as they were in 2011.

60 2012 DESJARDINS GROUP ANNUAL REPORT – MANAGEMENT’S DISCUSSION AND ANALYSIS
TABLE 20 – RISK-WEIGHTED ASSETS As at December 31 (unaudited, in millions of dollars and as a percentage)
Internal ratings-based approach
Standardized approach2012Total
2011Total
Exposure(1)Risk-weighted
assets Exposure(1)Risk-weighted
assets Exposure(1)Risk-weighted
assets
Average risk weighting
rate Risk-weighted
assets
Sovereign borrowers $ — $ — $ 13,317 $ — $ 13,317 $ — —% $ —Financial institutions — — 8,034 1,607 8,034 1,607 20 1,630Businesses — — 40,555 30,627 40,555 30,627 76 27,632Mortgages 51,252 4,332 193 41 51,445 4,373 9 4,790Qualifying revolving retail exposures 27,604 7,589 — — 27,604 7,589 27 8,596Other retail exposures 37,498 4,093 3,940 2,560 41,438 6,653 16 6,470Securitization — — 1,734 1,026 1,734 1,026 59 636Equities — — 155 155 155 155 100 41Trading portfolio — — 1,468 334 1,468 334 23 572Other assets(2) — — — — 11,761 3,917 33 3,508Scaling factor(3) — 961 — — — 961 — 1,039
Total credit risk 116,354 16,975 69,396 36,350 197,511 57,242 — 54,914
Market risk — — — 1,644 — 1,644 — 1,791Operational risk(4) — — — — — 11,884 — 11,281Transitional adjustment for floor(5) — — — — — 6,125 — 3,339
Total risk-weighted assets $ 116,354 $ 16,975 $ 69,396 $ 37,994 $ 197,511 $ 76,895 —% $ 71,325
(1) Net exposure, after credit risk mitigation (net of individual allowances under the Standardized Approach but not under the Internal Ratings-Based Approach, in accordance with the AMF guideline).(2) The other assets are measured using a method other than the Standardized Approach or the Internal Ratings-Based Approach.(3) The scaling factor is a 6.0% calibration of risk-weighted assets assessed using the Internal Ratings-Based Approach for credit exposures in accordance with Section 1.3 of the AMF guideline.(4) The Basic Indicator Approach was used to assess operational risk.(5) As prescribed in Section 1.6 of the AMF guideline.
SECTION 3.3
ANALYSIS OF CASH FLOWS Because of the nature of Desjardins Group’s operations, most of the items on the Combined Statements of Income and the Combined Balance Sheets are liquidities. Normal operations therefore cause considerable fluctuations in liquidity and influence numerous items such as loans, deposits and securities. The main changes in cash flows are explained in the following paragraphs.
During the year ended December 31, 2012, cash and cash equivalents increased by $313 million, compared to a decrease of $265 million during 2011. Cash and cash equivalents stood at $1,669 million as at December 31, 2012, versus $1,356 million a year earlier.
In 2012, cash flows used in operating activities totalled $437 million, chiefly because of an increase of $7,663 million in loans, and of $1,823 million in other operating assets and liabilities. These increases were for the most part offset by an increase of $6,221 million in deposits. In 2011, cash flows from operating activities amounted to $2,231 million, especially because of an increase of $9,406 million in deposits, a net change of $1,959 million in insurance and investment contract liabilities, and a decrease of $2,075 million in securities borrowed or purchased under reverse repurchase agreements. These changes were offset essentially by growth of $7,592 million in
loans and by a decrease of $2,203 million and of $2,108 million, respectively, in commitments related to securities sold short and in commitments related to securities lent or sold under repurchase agreements.
Cash flows from financing activities totalled $712 million as at December 31, 2012, in particular because of the capital share issue of $1,026 million and the $87 million net change in capital stock, which were chiefly offset by the redemption of subordinated bonds in the amount of $300 million and the remuneration on permanent shares of $70 million, net of income tax recovery. In 2011, cash flows from financing activities totalled $569 million as a result of the issuance of subordinated bonds in the amount of $479 million and the $81 million net change in capital stock.
In addition, cash flows from investing activities were $38 million during the year ended December 31, 2012, primarily because of the proceeds from disposals and maturities of available-for-sale securities for the respective amounts of $34,883 million and $1,201 million, which were offset essentially by the purchase of available-for-sale securities amounting to $35,716 million and the purchase of property, plant and equipment and investment property for $322 million. In 2011, cash flows used in investing activities amounted to $3,065 million, particularly because of the purchase of available-for-sale securities for $28,954 million, offset mainly by the proceeds from the disposals and maturities of available-for-sale securities totalling $24,479 million and $1,902 million, respectively.

612012 DESJARDINS GROUP ANNUAL REPORT – MANAGEMENT’S DISCUSSION AND ANALYSIS
SECTION 3.4
OFF-BALANCE SHEET ARRANGEMENTS In the normal course of its operations, Desjardins Group enters into various off-balance sheet arrangements, including assets under administration and under management on behalf of its members and clients, credit instruments, contractual commitments, financial assets held and pledged as collateral, as well as special purpose entities, including securitization.
ASSETS UNDER ADMINISTRATION AND ASSETS UNDER MANAGEMENTAs at December 31, 2012, Desjardins Group had assets totalling $313.1 billion under administration and under management on behalf of its members and clients, compared to $281.0 billion at the end of 2011. This represented an increase of $32.1 billion, or 11.4%, compared to an increase of $6.5 billion, or 2.4%, in the previous year. In addition, financial assets placed with Desjardins Group as asset manager amounted to $30.9 billion as at that date, for a year-over-year increase of $4.2 billion, or 15.6%, versus an increase of $1.5 billion, or 5.8%, during 2011.
Desjardins Group is one of Canada’s leading trustees and wealth managers. It was able to capitalize on the improvement in stock market activity in Canada and the rest of the world. For instance, at the close of trading on the Toronto Stock Exchange on December 31, 2012, the S&P/TSX index was up 4.0% over the year, compared to a decline of 11.1% in 2011. The assets entrusted to Desjardins Group by its members and clients in the form of off-balance sheet savings products, such as investment funds and other securities, accounted for part of its assets under administration and under management. As at December 31, 2012, these off-balance sheet savings products outstanding had grown by $4.4 billion, or 9.0%, on an annual basis, to total $53.0 billion, compared to an increase of $160 million, or 0.3%, during 2011.
Assets under administration and under management are composed chiefly of financial assets in the form of investment funds, securities held in custody and assets accumulated by pension funds. As a result, they do not belong to Desjardins Group, but to its members and clients, and therefore are not recognized in the Combined Balance Sheets.
TABLE 21 – ASSETS UNDER ADMINISTRATION AND ASSETS UNDER MANAGEMENT As at December 31 (in millions of dollars)
2012 2011(1) 2010(1)
Assets under administration Individual and institutional trust and asset custody services $ 267,401 $ 247,239 $ 246,016 Investment funds(2) 45,696 33,743 28,426
Total assets under administration $ 313,097 $ 280,982 $ 274,442
Assets under management Institutions and individuals $ 6,442 $ 8,006 $ 7,190 Investment funds(2) 24,434 18,694 18,055
Total assets under management $ 30,876 $ 26,700 $ 25,245
(1) 2011 and 2010 data restated to conform with the presentation of 2012.(2) Including Desjardins Funds and Northwest & Ethical Investments.
CREDIT INSTRUMENTSIn order to meet its members’ and clients’ financing needs, Desjardins Group makes credit instruments available to them. Credit instruments include guarantees and standby letters of credit, securities loans, and credit commitments representing authorized amounts that have not been used by members or clients. The risks associated with credit instruments are managed according to the same strict rules as those applied to Combined Balance Sheet items. In management’s opinion, no unusual risk results from these off-balance sheet items.
These instruments expose Desjardins Group to credit and liquidity risks. Management of these risks is described on pages 67 to 73 and pages 76 to 80 of this MD&A. Table 22 shows the contractual amounts of the credit instruments by remaining maturities. Since several of these credit instruments will mature or will be terminated without any cash outflow, the contractual amounts of these commitments do not represent future liquidity needs.
Note 27, “Commitments, guarantees and contingent liabilities”, to the Combined Financial Statements of Desjardins Group provides more detailed information on these credit instruments.

62 2012 DESJARDINS GROUP ANNUAL REPORT – MANAGEMENT’S DISCUSSION AND ANALYSIS
TABLE 22 – CREDIT INSTRUMENTS BY MATURITIES As at December 31 (in millions of dollars)
2012 2011 2010Less than
1 year1 to
5 yearsOver
5 years Total Total Total
Guarantees and standby letters of credit $ 724 $ 144 $ 38 $ 906 $ 733 $ 750Securities lending 1,848 — — 1,848 1,512 1,407Credit commitments 55,236 6,103 21 61,360 55,704 50,756
Total credit instruments $ 57,808 $ 6,247 $ 59 $ 64,114 $ 57,949 $ 52,913
CONTRACTUAL COMMITMENTSDesjardins Group has contractual commitments to make future payments on borrowings, subordinated bonds and leases. Borrowings and subordinated bonds are presented on the Combined Balance Sheets, while other contractual commitments, including credit commitments and leases, are not. Note 6, “Securities”, Note 15, “Other liabilities – Other”, Note 16, “Subordinated bonds”, and Note 27, “Commitments, guarantees and contingent liabilities”, to Desjardins Group’s Combined Financial Statements provide information on these contractual commitments.
FINANCIAL ASSETS HELD AS COLLATERAL Desjardins Group holds or pledges financial assets as collateral as a result of transactions involving securities borrowed or purchased under reverse repurchase agreements. Such transactions are carried out under normal conditions for these types of transactions. Note 27, “Commitments, guarantees and contingent liabilities”, to Desjardins Group’s Combined Financial Statements provides additional information about financial assets held as collateral.
SPECIAL PURPOSE ENTITIES In the normal course of operations, Desjardins Group enters into various financial transactions with special purpose entities (SPEs) to diversify its sources of financing and manage its capital. SPEs are usually created for a single and distinct purpose, and they often have a limited life. They are used to legally isolate the financial assets they hold from the transferring organization. SPEs are not operating entities and generally have no employees. Under IFRS, they can be included in the Combined Balance Sheets if, in substance, the relationship between this entity and Desjardins Group indicates that control exists. Details concerning significant exposure to SPEs are provided below.
MASTER ASSET VEHICLES (MAVs)
The MAV 1 and MAV 3 trusts are considered special purpose entities not included in Desjardins Group’s Combined Balance Sheets. These trusts are composed of synthetic asset, ineligible asset and traditional asset transactions. Desjardins Group entered into several transactions of various nature to minimize the risk associated with the asset-backed term notes (ABTN) portfolio, the margin funding facility (MFF) related to the ABTN portfolio and other restructured securities. The implementation of credit index hedges on a significant portion of the MAV 1 portfolio, the acquisition of protection for Desjardins Group’s commitments under the MFF, and the disposal of various restructured portfolios very significantly reduced the risk related to these portfolios.

632012 DESJARDINS GROUP ANNUAL REPORT – MANAGEMENT’S DISCUSSION AND ANALYSIS
These trusts had assets of approximately $15,962 million as at December 31, 2012, compared to $16,185 million as at December 31, 2011, and they had no equity. As at December 31, 2012, Desjardins Group had an MFF of $1,193 million and held notes with a fair value of $1,705 million, compared to the respective amounts of $1,193 million and $1,368 million in 2011. The total of the MFF and the notes represents the possible maximum risk of loss to which Desjardins Group is exposed. Note 6, “Securities”, to Desjardins Group’s Combined Financial Statements contains more information.
SECURITIZATION
Desjardins Group participates in the Mortgage-Backed Securities Program under the National Housing Act to manage its liquidities and capital. Transactions carried out under this program require the use of an SPE, the Canada Housing Trust (CHT), set up by Canada Mortgage and Housing Corporation (CMHC) under the Canada Mortgage Bonds (CMB) Program. Note 8, “Securitization and other transferred financial assets”, to the Combined Financial Statements provides more information on the financial assets transferred by Desjardins Group through securitization transactions.
To carry out securitization transactions, Desjardins Group bundles CMHC-guaranteed residential mortgages into mortgage-backed securities (NHA MBSs), and transfers them to the SPE in return for monetary consideration. The SPE then finances these purchases by issuing CMBs to investors. However, as part of these transactions, Desjardins Group retains substantially all the risks and rewards related to the securities transferred. Consequently, the loans continue to be recognized on the Combined Balance Sheets, and a liability, which is equal to the consideration received from CMHC for the sale of the NHA MBSs that do not meet derecognition criteria, is recognized.
As at December 31, 2012, outstanding NHA MBSs issued by Desjardins Group and sold to CHT totalled $5.0 billion. However, some securitization transactions entered into before January 1, 2010, resulted in derecognition, as Desjardins Group elected to apply the derecognition requirements prospectively. At the time of transfer, these transactions were therefore recognized as sales, and Desjardins Group retains certain interests in excess interest margins, which are retained interests, and assumes the responsibility of managing the transferred mortgage loans. As at December 31, 2012, the aggregate outstanding of the original assets transferred and derecognized was $0.6 billion, compared to $1.8 billion at the end of 2011. At the same date, assets representing retained interests that Desjardins Group continues to recognize with respect to these transactions amounted to $7 million, compared to $28 million as at December 31, 2011.

64 2012 DESJARDINS GROUP ANNUAL REPORT – MANAGEMENT’S DISCUSSION AND ANALYSIS
4.0 RISK MANAGEMENT
SECTION 4.1
RISK MANAGEMENT
The shaded boxes in this section contain information about credit, market and liquidity risks in accordance with IFRS 7, “Financial Instruments: Disclosures”. They also contain an analysis of how Desjardins Group assesses its risks as well as a description of its risk management objectives, policies and methods. IFRS 7 provides that risk disclosures may be included in the Management’s Discussion and Analysis (MD&A). Consequently, the shaded boxes are an integral part of the Combined Financial Statements, as explained in Note 29, “Financial instrument risk management”, to the Combined Financial Statements.
Desjardins Group is exposed to different types of risk in its normal course of operations, including credit risk, counterparty and issuer risk, market risk, liquidity risk, operational risk, insurance risk, strategic risk and reputation risk. Strict and effective management of these risks is a priority for Desjardins Group, its purpose being to support its major directions, particularly regarding its financial stability as well as its sustained and profitable growth, while complying with Basel requirements.
INTEGRATED RISK MANAGEMENT FRAMEWORKDesjardins Group’s objective in risk management is to optimize the risk-return trade-off, within set tolerance limits, by applying integrated risk management and control strategies, policies and procedures to all its activities. It also aims to provide, through the Integrated Risk Management Framework, a prudent and appropriate framework that complies with accepted accountability and independence principles.
As integral parts of this management framework, risk appetite and tolerance determine the type and level of risk that Desjardins is prepared to assume to achieve its business and strategic objectives. They provide a basis for integrated risk management by promoting a better understanding of the risks and their impact on the risk profile. This framework provides for a system of risk indicators that are monitored on a regular basis to ensure that Desjardins Group’s risk profile matches the level of risk appetite and tolerance sought by senior management and the Board of Directors in view of Desjardins Group’s mission, vision and values. The Board of Directors is responsible for approving the risk appetite and tolerance framework and ensuring it reflects Desjardins Group’s financial and strategic objectives.
Desjardins Group’s Integrated Risk Management Framework also includes the overall operational infrastructure and the risk management governance structure, which are supported by all implicit or explicit rules, values and ways of thinking and acting within Desjardins Group. This framework promotes exchanges between Desjardins Group’s risk management function and its business sectors and regulated entities.
To promote sound risk management and enhance risk management capabilities, risk management training sessions are held on a regular basis. Desjardins Group has a continuing professional development plan, through which it intends to continue updating the knowledge of the members of participating bodies.
RISK MANAGEMENT GUIDELINESThe Integrated Risk Management Framework is based on risk management guidelines that provide for the following:
•TheaccountabilityofDesjardinsGroup’sbusiness sectors with regard to the risks inherent to their operations
•Applicationateveryleveloftheorganization to obtain a comprehensive vision of risk exposure
•Theexistenceofaprocesstodetermine the appropriate capital level based on the risks assumed
•Considerationofriskmanagementintheformulation of strategic plans and business strategies and in the resulting decisions
•Thoroughriskassessmentpriortolaunchingnew products or introducing projects with a strong financial impact

652012 DESJARDINS GROUP ANNUAL REPORT – MANAGEMENT’S DISCUSSION AND ANALYSIS
RISK MANAGEMENT GOVERNANCEThe Integrated Risk Management Framework is based on a solid risk governance structure and reflects Desjardins Group’s organizational structure. The main risk management decision-making bodies are as follows:
Board of Ethics and Professional Conduct
Audit and Inspection Commission
Risk Management Commission
Desjardins Group Finance and Risk Management Committee
Desjardins Group Integrated Risk Management Committee
Desjardins Group Management Committee
Desjardins Group’s President and CEO and Board of Directors
Desjardins Group Monitoring Office
Desjardins Group Risk Management Executive Division
Finance Executive Division and Office of the CFO
The Board of Directors of the Fédération des caisses Desjardins du Québec is responsible for guiding, planning, coordinating and monitoring all of Desjardins Group’s operations, and in such capacity, it participates actively in overseeing the major risks to which Desjardins Group is exposed. The Board of Directors is primarily responsible for adopting the general directions and strategies proposed by senior management as well as risk management policies aimed at ensuring sound and prudent management of operations. To discharge its specific risk management responsibilities, the Board is supported by the Risk Management Commission, the Audit and Inspection Commission and the Board of Ethics and Professional Conduct. Further information about these bodies is available on pages 183 to 202 of the Corporate Governance section of the 2012 Desjardins Group Annual Report.
The Desjardins Group Management Committee must make recommendations to the Board of Directors concerning risk management policies and strategies and ensure that they are implemented effectively and efficiently. Two committees support the Management Committee in discharging its risk management responsibilities: the Integrated Risk Management Committee and the Finance and Risk Management Committee, which are made up of the heads of Desjardins Group’s strategic functions and Desjardins experts. These two committees are themselves supported by subcommittees that specialize in specific aspects of risk management.
Two independent functional units complete Desjardins Group’s risk management governance infrastructure. The Risk Management Executive Division is a strategic function whose main purpose is to serve as a partner in Desjardins Group’s growth by identifying, measuring and managing risks while ensuring the longevity of Desjardins. In partnership with the business sectors, the Desjardins Group risk management function is responsible for recommending and establishing risk management policies, and setting up the appropriate infrastructure, processes and practices to target all major Desjardins-wide risks. Monitoring and control of the various risks is a shared responsibility at Desjardins Group that is partly assumed by the business sectors and teams responsible for regulatory compliance and financial governance. They complement the work of those responsible for risk management to ensure that services are delivered in line with growing regulatory requirements.
The Desjardins Group Monitoring Office is an independent and objective assurance and advisory body that assists Desjardins Group’s management personnel in carrying out their governance responsibilities. It also oversees and advises management with respect to its duty to manage in a sound and prudent manner. In so doing, it contributes to improving Desjardins Group’s overall performance and maintaining the confidence of its members, the public and the regulatory bodies. The Desjardins Group Monitoring Office includes the internal audit services of Desjardins Group’s subsidiaries and other components as well as the audit and inspection services for the caisse network.
66 2012 DESJARDINS GROUP ANNUAL REPORT – MANAGEMENT’S DISCUSSION AND ANALYSIS
RISK MEASUREMENT AND DISCLOSURE
RISK MEASUREMENT
Desjardins Group uses both quantitative and qualitative techniques to determine its risk exposure. It ensures that an appropriate selection of measurement tools and mitigation techniques are designed and maintained in order to support its business development.
Risks are quantified based on both the current economic context as well as hypothetical situations simulating crises applied across the entire organization. Desjardins-wide sensitivity tests and crisis scenarios are used as additional risk analysis tools to measure the potential impact of exceptional but plausible events on profitability and capital levels. Organization-wide crisis scenarios are developed based on the anticipated economic outlook under distress conditions. The results of these analyses help detect potential vulnerabilities to risk factors for various operations
RISK DISCLOSURE
Risk reports on all significant risks are regularly prepared for the Integrated Risk Management Committee, the Finance and Risk Management Committee, the Desjardins Group Operations Committee, the Desjardins Group Management Committee, the Risk Management Commission, the Audit and Inspection Commission, and the Board of Directors. These reports provide risk indicators as well as information about capital, particularly capital adequacy in relation to Desjardins Group’s risk profile. These reports are regularly updated to include the latest risk management developments so that decision-making bodies receive up-to-date information on major risks that is both practical and forward-looking.
BASEL II CAPITAL ACCORDBasel II is an international capital adequacy tool designed to align regulatory capital requirements more closely with risk exposure and to further the continuous development of the risk assessment capabilities of financial institutions.
The Basel II framework is based on three pillars: the first pillar sets out the requirements for risk-weighted regulatory capital; the second pillar deals with the supervisory review process; and the third pillar stipulates financial disclosure requirements.
In compliance with the guideline on adequacy of capital base standards, which was adapted to reflect the provisions of Basel II, Desjardins Group uses the Internal Ratings-Based Approach, subject to conditions, for credit risk related to retail loan portfolios (personal). Other credit and market risk exposures are currently assessed using the Standardized Approach, while operational risk is calculated using the Basic Indicator Approach. This provision is used to calculate Desjardins Group’s capital ratios, among other things.
Again this year, numerous efforts were made throughout Desjardins Group to support the implementation of sound risk management practices and to align regulatory capital requirements more closely with risk exposure. Desjardins Group is continuing to invest in improving its tools and systems and aligning them with industry best practices for the main types of risk. In recent years, the Bank for International Settlements has issued new requirements (Basel III) for the global regulation of capital standards. These new rules, which regulators will integrate progressively into their guidelines effective January 1, 2013, will increase not only capital requirements but also risk management requirements. In addition to the changes made to the level and definition of eligible capital and measurement of risk-weighted assets, Basel III has, under Pillar 2, introduced new requirements for liquidity and raised expectations for a number of management practices. Disclosure standards, which fall under Pillar 3, have also been enhanced. Desjardins will continue its development by integrating these new regulatory requirements into its risk management framework.
Additional information about capital management is presented in section 3.2, “Capital management”, on pages 55 to 60.

672012 DESJARDINS GROUP ANNUAL REPORT – MANAGEMENT’S DISCUSSION AND ANALYSIS
CREDIT RISKCredit risk is the risk of losses resulting from a borrower’s or counterparty’s failure to honour its contractual obligations, whether or not such obligations appear on the Combined Balance Sheets.
Desjardins Group is exposed to credit risk first through its direct personal, business and government loans, which represented 67.4% of assets on the Combined Balance Sheets as at December 31, 2012, compared to 65.8% a year earlier. It is also exposed through its various other commitments, including letters of credit, foreign exchange lines and transactions involving derivative financial instruments and securities.
CREDIT RISK MANAGEMENT
Desjardins Group upholds its goal of providing efficient service to all its members and clients. To this end, it has developed distribution channels specialized by product and clientele. The units and components that make up these channels are considered centres of expertise and are accountable for their performance in their respective markets, including credit risk management. In this regard, they have a certain amount of latitude in terms of frameworks, approvals, and the corresponding management and monitoring tools and structures.
To provide assistance in this area, Desjardins Group has set up centralized structures and procedures to ensure that its risk management framework allows for effective, sound and prudent management.
Desjardins Group has a Risk Management Executive Division, which includes two credit risk management divisions. These divisions share responsibilities based on major activities: credit approval, quantification, monitoring and reporting.
CREDIT RISK FRAMEWORK
A set of policies and standards govern all aspects of credit risk management at Desjardins Group. This framework defines the responsibilities and powers of the parties involved, the limits imposed by risk tolerance, the rules governing the assignment and administration of files, and the disclosure rules for Desjardins Group’s exposure to credit risks.
Approval and credit risk management units assume responsibility for credit granting and management and for providing a framework specific to their products and operations. These units establish their own policies and practices, based on their products and clients and in compliance with the general policies that govern all credit activities.
Together, these frameworks, policies and practices govern Desjardins’s risk management and control activities
CREDIT GRANTING
The caisses, Desjardins business centres and other business centres in contact with clients are primarily responsible for approving files. Some approval limits are set, and loans for any amount above these limits are approved by the Risk Management Executive Division.
Professionals are assigned to one of the two previously mentioned divisions according to client type. Their qualifications, their approval responsibilities and the depth of the analysis required are used to match them to specific products, as well as the complexity and extent of the transaction risk.
RETAIL LOANS
Retail portfolios consist of residential mortgages, personal loans, credit card loans to individuals, and loans to small businesses. To assess the risk of credit activities involving individuals and smaller businesses, credit scoring systems based on proven statistics are used.
These systems were developed based on a history of behaviour among borrowers with a profile or characteristics similar to those of the applicant and based on the products used, including the type of collateral offered, to determine the transaction risk.
Such systems are used for initial approval as well as subsequently, when behavioural ratings, calculated using member-borrowers’ transaction data, are used to assess portfolio risk on an ongoing basis. A monthly update is obtained for existing borrowers’ risk level for proactive management of a portfolio’s credit risk.
The performance of these systems is continually assessed and adjustments are made regularly with a view to determining transaction and borrower risk as adequately as possible.
Risk parameters are set for each exposure category analyzed and make it possible to determine probabilities of default, loss given default and gross exposures at default for groups with similar characteristics.
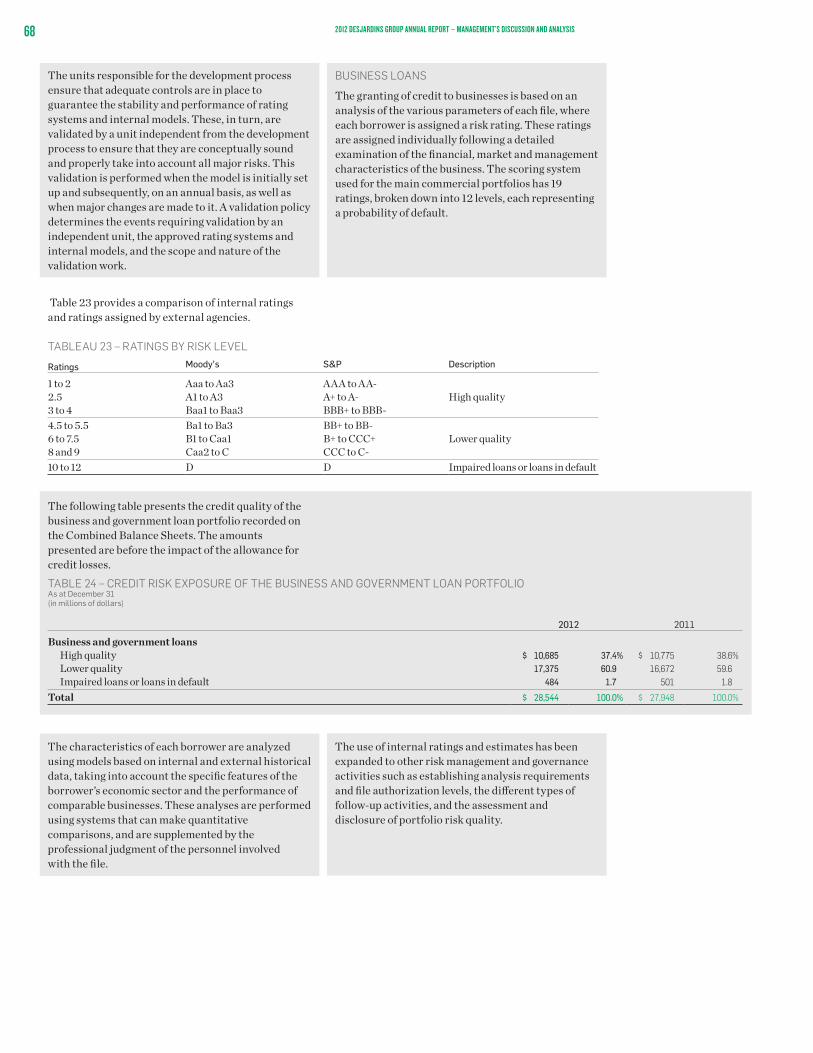
68 2012 DESJARDINS GROUP ANNUAL REPORT – MANAGEMENT’S DISCUSSION AND ANALYSIS
The units responsible for the development process ensure that adequate controls are in place to guarantee the stability and performance of rating systems and internal models. These, in turn, are validated by a unit independent from the development process to ensure that they are conceptually sound and properly take into account all major risks. This validation is performed when the model is initially set up and subsequently, on an annual basis, as well as when major changes are made to it. A validation policy determines the events requiring validation by an independent unit, the approved rating systems and internal models, and the scope and nature of the validation work.
BUSINESS LOANS
The granting of credit to businesses is based on an analysis of the various parameters of each file, where each borrower is assigned a risk rating. These ratings are assigned individually following a detailed examination of the financial, market and management characteristics of the business. The scoring system used for the main commercial portfolios has 19 ratings, broken down into 12 levels, each representing a probability of default.
Table 23 provides a comparison of internal ratings and ratings assigned by external agencies.
The characteristics of each borrower are analyzed using models based on internal and external historical data, taking into account the specific features of the borrower’s economic sector and the performance of comparable businesses. These analyses are performed using systems that can make quantitative comparisons, and are supplemented by the professional judgment of the personnel involved with the file.
The use of internal ratings and estimates has been expanded to other risk management and governance activities such as establishing analysis requirements and file authorization levels, the different types of follow-up activities, and the assessment and disclosure of portfolio risk quality.
TABLEAU 23 – RATINGS BY RISK LEVEL
Ratings Moody’s S&P Description
1 to 2 Aaa to Aa3 AAA to AA-High quality2.5 A1 to A3 A+ to A-
3 to 4 Baa1 to Baa3 BBB+ to BBB-4.5 to 5.5 Ba1 to Ba3 BB+ to BB-
Lower quality6 to 7.5 B1 to Caa1 B+ to CCC+8 and 9 Caa2 to C CCC to C-10 to 12 D D Impaired loans or loans in default
TABLE 24 – CREDIT RISK EXPOSURE OF THE BUSINESS AND GOVERNMENT LOAN PORTFOLIO As at December 31 (in millions of dollars)
2012 2011
Business and government loans High quality $ 10,685 37.4% $ 10,775 38.6% Lower quality 17,375 60.9 16,672 59.6 Impaired loans or loans in default 484 1.7 501 1.8
Total $ 28,544 100.0% $ 27,948 100.0%
The following table presents the credit quality of the business and government loan portfolio recorded on the Combined Balance Sheets. The amounts presented are before the impact of the allowance for credit losses.

692012 DESJARDINS GROUP ANNUAL REPORT – MANAGEMENT’S DISCUSSION AND ANALYSIS
MITIGATING CREDIT RISK
In its lending operations, Desjardins Group obtains collateral, if deemed necessary, for a member’s or client’s borrowing facility following an assessment of their creditworthiness. Collateral normally takes the form of assets, such as capital assets, receivables, inventory, cash, government securities or equities. For some portfolios, programs offered by organizations such as Canada Mortgage and Housing Corporation and La Financière agricole du Québec are used in addition to customary collateral. Loans guaranteed by governments and other public and parapublic organizations represented 30.4% of total gross loans as at December 31, 2012, compared to 28.9% a year earlier, as shown in Table 17 on page 52. Policies and procedures, adapted to each product, contain the requirements for appraising collateral, its legal validation and follow-up.
Where required, Desjardins Group uses mechanisms for sharing risk with other financial institutions, such as loan syndication. Lending in Quebec makes up 93.1% of total loans, with 6.7% in the rest of Canada and 0.2% in the United States.
The large number of borrowers—for the most part individuals, but also small- and medium-sized businesses from most sectors of the economy—helps ensure the sound diversification of the financing portfolio.
LOAN DISTRIBUTION BY BORROWER CATEGORY (as at December 31, 2012)
1.3%
8.1%
20.2%
5.8%64.6%
n Residential mortgagesn Credit cardsn Consumer and other
personal loansn Businessn Government
The above chart presents the distribution of loans by borrower category. Over half of the portfolio consists of residential mortgages, for which, statistically, the loss experience is lower. Additional information about credit risk is presented in Note 27, “Commitments, guarantees and contingent liabilities”, to the Combined Financial Statements.
COUNTERPARTY AND ISSUER RISK
Counterparty and issuer risk is a credit risk relative to different types of transactions involving securities, derivative financial instruments and securities loans.
The Risk Management Executive Division sets the maximum exposure for each counterparty and issuer based on quantitative and qualitative criteria. The amounts are then allocated to the various components based on their needs.
To manage its risk properly, Desjardins Group assigns a credit rating to each counterparty and issuer, based on the ratings of four external credit rating agencies (DBRS, Moody’s, S&P and Fitch). This rating is used to establish exposure limits and to calculate capital requirements using the Standardized Approach. These four external credit rating agencies meet the eligibility criteria of the Basel Accord and are authorized by the AMF and the OSFI.
A large proportion of Desjardins’s exposure is to the different levels of government in Canada, Quebec public and parapublic entities, and major Canadian banks. For most of these, the credit rating is A- or higher. Desjardins Group is not directly exposed to the sovereign debt of the European countries most affected by the recent financial crisis, namely Greece, Portugal, Italy, Ireland and Spain. Its exposure to U.S. and European financial institutions is marginal.
In its derivative financial instrument and securities lending transactions, which include repurchase and reverse repurchase agreements and securities borrowing and lending, Desjardins Group is exposed to counterparty credit risk.
It uses derivative financial instruments primarily for asset and liability management purposes. Derivative financial instruments are contracts whose value is mainly based on an underlying asset, such as interest rates or exchange rates. The vast majority of derivative financial instruments are negotiated by mutual agreement between Desjardins Group and the counterparty and include forward exchange contracts, currency swaps, interest rate swaps, credit default swaps, total return swaps, forward rate agreements, and currency, interest rate and stock index options. Other transactions are carried out as part of regulated trades and mainly consist of futures.

70 2012 DESJARDINS GROUP ANNUAL REPORT – MANAGEMENT’S DISCUSSION AND ANALYSIS
The credit risk associated with derivative financial instruments refers to the risk that a counterparty will fail to honour its contractual obligations toward Desjardins Group at a time when the fair value of the instrument is positive for Desjardins. The credit risk associated with derivative financial instruments normally corresponds to a small fraction of the notional amount. The replacement cost and the credit risk equivalent are two measurements used to evaluate this risk. The replacement cost refers to the current replacement cost of all contracts having a positive fair value. The credit risk equivalent is equal to the sum of this replacement cost and the potential credit exposure.
Desjardins Group limits the credit risk associated with derivative financial instruments by doing business with counterparties that have a high credit rating. Note 17, “Derivative financial instruments and hedging activities”, to the Combined Financial Statements presents derivative financial instruments by credit risk rating and type of counterparty. Based on replacement cost, this note indicates that virtually all counterparties have credit ratings of between AAA and A. Furthermore, by purchasing hedges through credit derivatives, such as credit default swaps and total return swaps, Desjardins Group can transfer credit risk to a counterparty or hedge itself against various types of risk.
Desjardins Group also limits credit risk related to certain counterparties by using master agreements called International Swaps and Derivatives Association (ISDA) agreements, which define the terms and conditions for the transactions. These agreements are legal contracts that bind the counterparties. Most of Desjardins Group’s agreements provide for netting to determine the net exposure in the event of default. In addition, a Credit Support Annex can be added to the master agreement
in order to request the counterparties to pay or secure the current market value of the positions when such value exceeds a certain threshold. Taking into account master netting agreements, the risk-weighted balance for all Desjardins Group’s derivative financial instruments as at December 31, 2012, amounted to $344 million, compared to $311 million at year-end 2011. As at December 31, 2012, the amount of collateral that Desjardins Group would have to provide in the event of a downgrade was marginal because the replacement cost was positive for the majority of the contracts.
Securities lending transactions are regulated by Investment Industry Regulatory Organization of Canada participation agreements. Desjardins Group also uses netting agreements with its counterparties to mitigate credit risk and requires a percentage of collateralization (a pledge) on these transactions.
Desjardins Group accepts from its counterparties, and gives them, financial collateral that complies with the eligibility criteria set out in its policies. These eligibility criteria allow for the timely realization of collateral, if necessary, in the event of default. The types of collateral received by Desjardins Group are mainly cash and government securities.
Additional information about credit risk is presented in Note 27, “Commitments, guarantees and contingent liabilities”, to the Combined Financial Statements.
MAXIMUM CREDIT RISK EXPOSURE
Table 25 presents the maximum credit risk for financial instruments other than those recognized on the Combined Balance Sheets, without taking into account collateral held or other credit enhancements. Maximum credit risk for the financial instruments recognized is equal to the carrying amount.
TABLE 25 – MAXIMUM CREDIT RISK EXPOSURE As at December 31 (in millions of dollars)
2012 2011
Recognized on the Combined Balance SheetsDeposits with financial institutions $ 496 $ 173Securities Debt securities held for trading 8,952 9,448 Debt securities designated as at fair value through profit or loss 12,305 12,385 Available-for-sale debt securities 16,915 17,485
Off-balance sheet Guarantees and standby letters of credit $ 906 $ 733 Credit commitments(1) 61,360 55,704
(1) Includes the credit facility related to the restructuring plan of the Montreal Accord. Additional information is provided in Note 6, “Securities”, to the Combined Financial Statements.
Additional information about credit risk is presented in Note 17, “Derivative financial instruments and hedging activities”, and Note 27, “Commitments,
guarantees and contingent liabilities”, to the Combined Financial Statements.
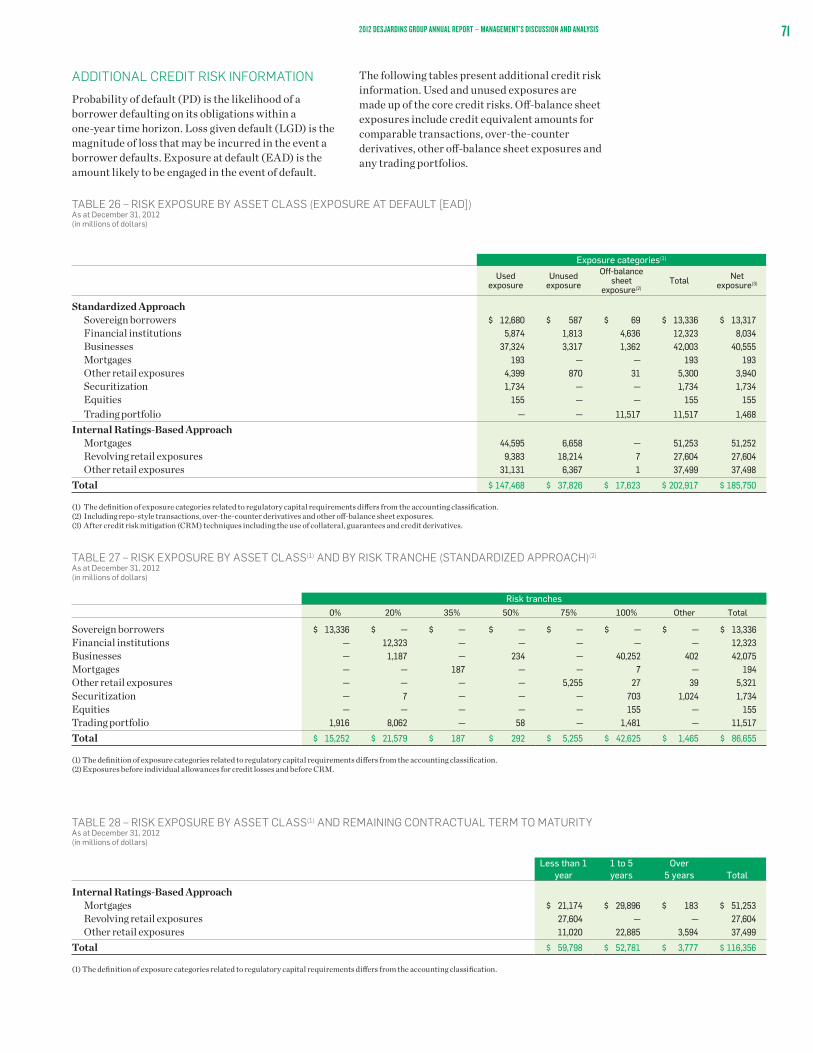
712012 DESJARDINS GROUP ANNUAL REPORT – MANAGEMENT’S DISCUSSION AND ANALYSIS
ADDITIONAL CREDIT RISK INFORMATION
Probability of default (PD) is the likelihood of a borrower defaulting on its obligations within a one-year time horizon. Loss given default (LGD) is the magnitude of loss that may be incurred in the event a borrower defaults. Exposure at default (EAD) is the amount likely to be engaged in the event of default.
The following tables present additional credit risk information. Used and unused exposures are made up of the core credit risks. Off-balance sheet exposures include credit equivalent amounts for comparable transactions, over-the-counter derivatives, other off-balance sheet exposures and any trading portfolios.
TABLE 26 – RISK EXPOSURE BY ASSET CLASS (EXPOSURE AT DEFAULT [EAD]) As at December 31, 2012 (in millions of dollars)
Exposure categories(1)
Usedexposure
Unusedexposure
Off-balance sheet
exposure(2)Total Net
exposure(3)
Standardized Approach Sovereign borrowers $ 12,680 $ 587 $ 69 $ 13,336 $ 13,317 Financial institutions 5,874 1,813 4,636 12,323 8,034 Businesses 37,324 3,317 1,362 42,003 40,555 Mortgages 193 — — 193 193 Other retail exposures 4,399 870 31 5,300 3,940 Securitization 1,734 — — 1,734 1,734 Equities 155 — — 155 155 Trading portfolio — — 11,517 11,517 1,468
Internal Ratings-Based Approach Mortgages 44,595 6,658 — 51,253 51,252 Revolving retail exposures 9,383 18,214 7 27,604 27,604 Other retail exposures 31,131 6,367 1 37,499 37,498
Total $ 147,468 $ 37,826 $ 17,623 $ 202,917 $ 185,750
(1) The definition of exposure categories related to regulatory capital requirements differs from the accounting classification.(2) Including repo-style transactions, over-the-counter derivatives and other off-balance sheet exposures.(3) After credit risk mitigation (CRM) techniques including the use of collateral, guarantees and credit derivatives.
TABLE 27 – RISK EXPOSURE BY ASSET CLASS(1) AND BY RISK TRANCHE (STANDARDIZED APPROACH)(2) As at December 31, 2012 (in millions of dollars)
Risk tranches0% 20% 35% 50% 75% 100% Other Total
Sovereign borrowers $ 13,336 $ — $ — $ — $ — $ — $ — $ 13,336Financial institutions — 12,323 — — — — — 12,323Businesses — 1,187 — 234 — 40,252 402 42,075Mortgages — — 187 — — 7 — 194Other retail exposures — — — — 5,255 27 39 5,321Securitization — 7 — — — 703 1,024 1,734Equities — — — — — 155 — 155Trading portfolio 1,916 8,062 — 58 — 1,481 — 11,517
Total $ 15,252 $ 21,579 $ 187 $ 292 $ 5,255 $ 42,625 $ 1,465 $ 86,655
(1) The definition of exposure categories related to regulatory capital requirements differs from the accounting classification.(2) Exposures before individual allowances for credit losses and before CRM.
TABLE 28 – RISK EXPOSURE BY ASSET CLASS(1) AND REMAINING CONTRACTUAL TERM TO MATURITY As at December 31, 2012 (in millions of dollars)
Less than 1 year
1 to 5 years
Over 5 years Total
Internal Ratings-Based Approach Mortgages $ 21,174 $ 29,896 $ 183 $ 51,253 Revolving retail exposures 27,604 — — 27,604 Other retail exposures 11,020 22,885 3,594 37,499
Total $ 59,798 $ 52,781 $ 3,777 $ 116,356
(1) The definition of exposure categories related to regulatory capital requirements differs from the accounting classification.
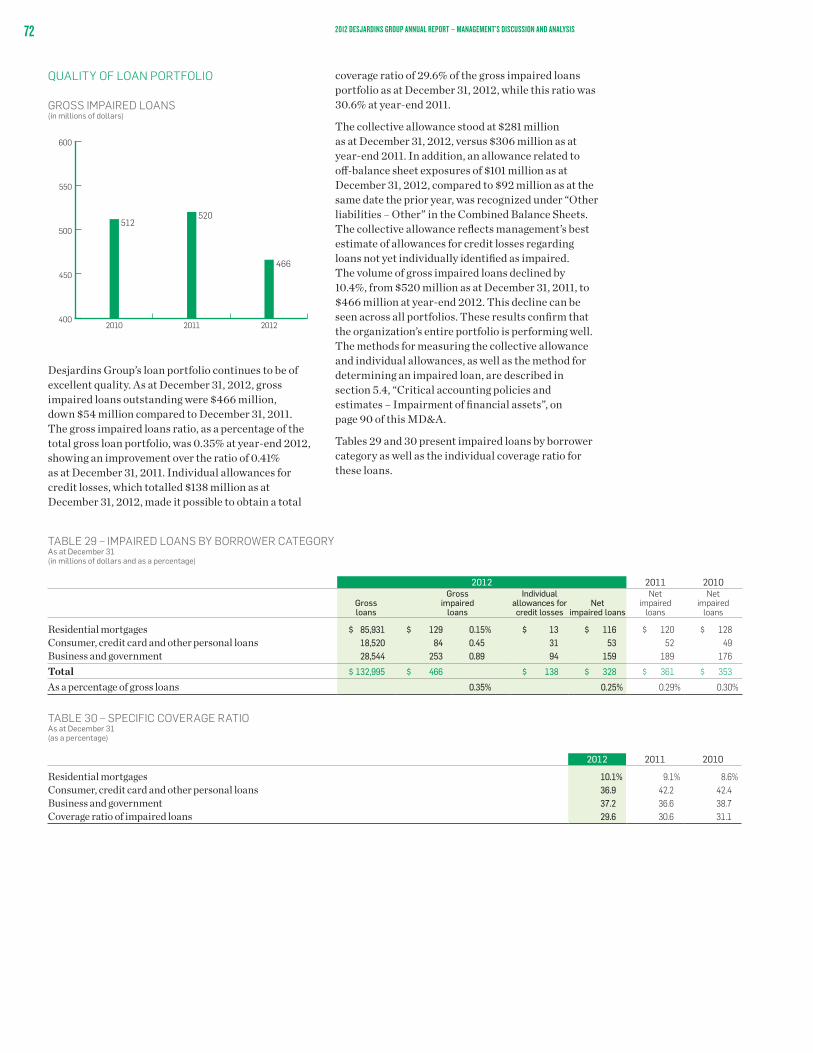
72 2012 DESJARDINS GROUP ANNUAL REPORT – MANAGEMENT’S DISCUSSION AND ANALYSIS
QUALITY OF LOAN PORTFOLIO
GROSS IMPAIRED LOANS (in millions of dollars)
400
450
500
550
600
201220112010
466
512520
Desjardins Group’s loan portfolio continues to be of excellent quality. As at December 31, 2012, gross impaired loans outstanding were $466 million, down $54 million compared to December 31, 2011. The gross impaired loans ratio, as a percentage of the total gross loan portfolio, was 0.35% at year-end 2012, showing an improvement over the ratio of 0.41% as at December 31, 2011. Individual allowances for credit losses, which totalled $138 million as at December 31, 2012, made it possible to obtain a total
coverage ratio of 29.6% of the gross impaired loans portfolio as at December 31, 2012, while this ratio was 30.6% at year-end 2011.
The collective allowance stood at $281 million as at December 31, 2012, versus $306 million as at year-end 2011. In addition, an allowance related to off-balance sheet exposures of $101 million as at December 31, 2012, compared to $92 million as at the same date the prior year, was recognized under “Other liabilities – Other” in the Combined Balance Sheets. The collective allowance reflects management’s best estimate of allowances for credit losses regarding loans not yet individually identified as impaired. The volume of gross impaired loans declined by 10.4%, from $520 million as at December 31, 2011, to $466 million at year-end 2012. This decline can be seen across all portfolios. These results confirm that the organization’s entire portfolio is performing well. The methods for measuring the collective allowance and individual allowances, as well as the method for determining an impaired loan, are described in section 5.4, “Critical accounting policies and estimates – Impairment of financial assets”, on page 90 of this MD&A.
Tables 29 and 30 present impaired loans by borrower category as well as the individual coverage ratio for these loans.
TABLE 29 – IMPAIRED LOANS BY BORROWER CATEGORY As at December 31 (in millions of dollars and as a percentage)
2012 2011 2010
Grossloans
Grossimpaired
loans
Individual allowances forcredit losses
Net impaired loans
Netimpaired
loans
Netimpaired
loans
Residential mortgages $ 85,931 $ 129 0.15% $ 13 $ 116 $ 120 $ 128Consumer, credit card and other personal loans 18,520 84 0.45 31 53 52 49Business and government 28,544 253 0.89 94 159 189 176
Total $ 132,995 $ 466 $ 138 $ 328 $ 361 $ 353
As a percentage of gross loans 0.35% 0.25% 0.29% 0.30%
TABLE 30 – SPECIFIC COVERAGE RATIO As at December 31 (as a percentage)
2012 2011 2010
Residential mortgages 10.1% 9.1% 8.6%Consumer, credit card and other personal loans 36.9 42.2 42.4Business and government 37.2 36.6 38.7Coverage ratio of impaired loans 29.6 30.6 31.1

732012 DESJARDINS GROUP ANNUAL REPORT – MANAGEMENT’S DISCUSSION AND ANALYSIS
PROVISION FOR CREDIT LOSSES
The provision for credit losses totalled $241 million for 2012, up $4 million compared to the corresponding period in 2011. This provision comprises the provision for loan losses of $232 million and the provision for off-balance sheet commitments of $9 million for 2012, compared to $219 million and $18 million, respectively, for 2011. The provision for loan losses represented 0.19% of average gross loans, the same figure as in 2011.
PROVISION FOR CREDIT LOSSES (in millions of dollars)
0
50
100
150
200
250
300
201220112010
241
203
237
MARKET RISK Market risk refers to the risk of changes in the fair value of financial instruments resulting from fluctuations in the parameters affecting this value, in particular, interest rates, exchange rates, credit spreads and their volatility.
Desjardins Group is exposed to market risk primarily through positions taken in the course of its traditional financing and savings recruitment activities. It is also exposed to market risk through its trading activities. Desjardins Group and its components have adopted policies that set out the principles, limits and procedures to use in managing market risk.
INTEREST RATE RISK MANAGEMENT
Desjardins Group is exposed to interest rate risk, which represents the potential impact of interest rate fluctuations on net interest income and the economic value of equity. Interest rate risk is the main component of market risk for Desjardins Group’s traditional banking activities other than trading, such as accepting deposits and granting loans, as well as for its securities portfolios used for long-term investment purposes and as liquidity reserves.
Sound and prudent management is used to achieve the objective of optimizing net interest income while minimizing the negative incidence of interest rate movements. The established policies describe the principles, limits and procedures that apply to interest rate risk management. Simulations are used to measure the effect of different variables on changes in net interest income and the economic value of equity.
The assumptions used in the simulations are based on an analysis of historical data and on the effects of various interest rate environments on changes in this data. These assumptions concern changes in the structure of assets and liabilities, including modelling for non-maturity deposits and equity, member behaviour and pricing. Desjardins Group’s asset and liability management committee (the Asset/Liability Committee) is responsible for analyzing and approving the global matching strategy on a monthly basis while respecting the parameters defined in interest rate risk management policies.
Table 31 presents the impact before income taxes on the non-trading portfolio of a sudden and sustained 100-basis-point increase or decrease in interest rates on net interest income and the economic value of equity.
TABLE 31 – INTEREST RATE SENSITIVITY (BEFORE INCOME TAXES) As at December 31 (in millions of dollars)
2012 2011
Net interestincome(1)
Economic value of equity(2)
Net interestincome(1)
Economic value of equity(2)
Impact of a 100-basis-point increase in interest rates $ 5 $ (96) $ 56 $ 118Impact of a 100-basis-point decrease in interest rates (26) 41 (87) (71)
(1) Represents interest rate sensitivity of net interest income for the next 12 months.(2) Represents the sensitivity of the present value of assets, liabilities and off-balance sheet instruments.

74 2012 DESJARDINS GROUP ANNUAL REPORT – MANAGEMENT’S DISCUSSION AND ANALYSIS
Interest rate sensitivity is based on the earlier of the repricing or maturity date of the assets, liabilities and derivative financial instruments used to manage interest rate risk. The situation presented reflects the position on that date only and can change significantly in subsequent years depending on the preferences of members and clients, and the application of policies on interest rate risk management.
Some Combined Balance Sheet items are considered non-interest-rate-sensitive instruments, including investments in equities, non-performing loans, non-interest-bearing deposits, non-maturity deposits with an interest rate not indexed according to a specific rate (such as the prime rate), and equity. As dictated in its policies, Desjardins Group’s management practices are based on prudent assumptions with respect to the maturity profile used in its models to determine their interest rate sensitivity.
FOREIGN EXCHANGE RISK
Foreign exchange risk arises when the actual or expected value of assets denominated in a foreign currency is higher or lower than that of liabilities denominated in the same currency.
Overall, Desjardins Group’s exposure to this risk is limited because the majority of its transactions are conducted in Canadian dollars. However, in certain specific situations, Desjardins Group and its components may become exposed to foreign exchange risk, particularly with respect to the U.S. dollar. This
exposure mainly arises from their intermediation activities with members and clients, and its financing and investment activities. To ensure that exposure is properly controlled and limited, Desjardins Group and its components use derivative financial instruments such as forward exchange contracts and currency swaps.
MANAGEMENT OF MARKET RISK RELATED TO TRADING ACTIVITIES – VALUE AT RISK
The market risk of trading portfolios is managed on a daily basis under a specific policy. The main tool used to measure the market risk of trading portfolios is “Value-at-Risk” (VaR), which represents an estimate of the potential loss over a certain period of time at a given confidence level.
A Monte Carlo VaR is calculated daily on the trading portfolios, using a 99% confidence level and a holding horizon of one day. It is therefore reasonable to expect a loss exceeding the VaR figure once every 100 days. The calculation of VaR is based on historical data for a one-year interval.
Table 32 presents the aggregate VaR of the trading activities by risk category as well as the diversification effect, which represents the difference between aggregate VaR and the sum of VaR for different risk categories. Equity price risk, interest rate risk and foreign exchange risk are the three risk categories to which Desjardins Group is exposed. The definition of a trading portfolio meets the criteria defined in the Basel Capital Accord.
TABLE 32 – VaR BY RISK CATEGORY (TRADING PORTFOLIO) (in millions of dollars)
As atDecember 31,
2012For the year endedDecember 31, 2012
As at December 31,
2011For the year endedDecember 31, 2011
Average High Low Average High Low
Equities $ 0.1 $ 0.2 $ 0.4 $ 0.1 $ 0.4 $ 0.4 $ 1.1 $ 0.2 Foreign exchange 0.1 0.1 0.1 — 0.1 0.1 0.6 —Interest rate 1.9 3.0 7.8 1.1 3.5 4.0 6.7 2.2Diversification effect(1) (0.2) (0.3) N/A(2) N/A(2) (0.3) (0.5) N/A(2) N/A(2)
Aggregate VaR $ 1.9 $ 3.0 $ 7.7 $ 1.1 $ 3.7 $ 4.0 $ 6.6 $ 2.2
(1) Risk reduction related to diversification, namely the difference between the sum of the VaR for the various market risks and the aggregate VaR.(2) Not applicable: The highs and lows of the various market risk categories can refer to different dates.
As at December 31, 2012, the aggregate VaR was $1.9 million, the interest rate VaR being the largest component. Aggregate VaR was $3.0 million below its annual average. Risk mitigation related to diversification amounted to $0.2 million as at December 31, 2012.

752012 DESJARDINS GROUP ANNUAL REPORT – MANAGEMENT’S DISCUSSION AND ANALYSIS
BACK TESTING
Back testing is conducted to validate the VaR model used. This involves a daily comparison of the VaR with the profits and losses (P&L) on portfolios.
Desjardins Group performs back testing daily, applying a hypothetical P&L to its trading portfolios. The hypothetical P&L is calculated by determining the difference in value resulting from changes in market conditions between two consecutive days. The portfolio mix between these two days remains static.
The following chart presents changes in VaR for trading activities as well as profits and losses related to these activities. During the fourth quarter of 2012, the hypothetical P&L did not exceed VaR.
STRESS TESTING
From time to time, certain events that are considered highly unlikely may occur and may have a significant impact on trading portfolios. These events are at the tail-end of the distribution and are the result of extreme situations.
The approach used to measure the risk related to highly unlikely but plausible events involves applying a stress-testing program (sensitivity tests, historical scenarios and hypothetical scenarios) at regular intervals. Stress-testing results are analyzed together with VaR calculations in order to detect Desjardins Group’s vulnerability to such events. The stress-testing program is reviewed periodically to ensure that it is kept current.
VaR COMPARED TO HYPOTHETICAL P&L OF TRADING ACTIVITIES (in millions of dollars)
Jan.
3, 12
Feb.
7, 12
Mar
. 13,
12
Apr. 1
8, 12
May
23,
12
Jun.
27, 1
2
Aug.
1, 12
Sep.
6, 12
Oct.
11, 1
2
Nov.
15, 1
2
Dec.
20, 1
2
-8,0
-6,0
-4,0
-2,0
0,0
2,0
4,0
n Hypothetical P&L— 99% Monte Carlo VaR
76 2012 DESJARDINS GROUP ANNUAL REPORT – MANAGEMENT’S DISCUSSION AND ANALYSIS
LIQUIDITY RISK Liquidity risk refers to Desjardins Group’s capacity to raise the necessary funds (by increasing liabilities or converting assets) to meet a financial obligation, whether or not it appears on the Combined Balance Sheets.
Desjardins Group is exposed to liquidity risk in potential crisis situations that would result in unusual cash outflows and make it necessary for Desjardins Group Treasury to find the funding needed to meet sudden demands. For instance, such an extreme situation could occur in the event caisse members begin making massive withdrawals due to a lack of confidence in the organization’s financial stability. Liquidity risk management is a key component of the overall risk management strategy. Desjardins Group and its components have established policies describing the principles, limits, risk appetite and tolerance thresholds, and procedures that apply to liquidity risk management.
LIQUIDITY RISK MANAGEMENT
Desjardins Group manages liquidity risk in order to ensure that it has timely and cost-effective access to the funds needed to meet its financial obligations as they become due, in both routine and crisis situations. Managing this risk involves maintaining a sufficient level of liquid securities, ensuring stable and diversified sources of funding, monitoring indicators, and adopting a contingency plan to implement in the event of a liquidity crisis.
Policies and standards are reviewed on a regular basis to ensure that they are appropriate for the operating environment and prevailing market conditions. They are also updated according to regulatory requirements and sound liquidity risk management practices.
LIQUIDITY RESERVES
The minimum liquidity reserves that must be maintained by the caisse network, the Federation and Caisse centrale Desjardins are prescribed in policies and standards specific to each entity. Day-to-day management of securities and the reserve level to be maintained is centralized at Desjardins Group Treasury and is subject to risk management monitoring under the supervision of the Desjardins Group Finance and Risk Management Committee. Eligible securities must meet high security and negotiability standards. Securities held in these funds are largely Canadian government securities.
The aggregate liquidity reserves held in these funds provide manoeuvring room for Desjardins Group and are monitored daily. In addition to complying with specific policies and standards, the levels maintained must provide assurance of their adequacy in the event of a possible severe liquidity crisis directly affecting Desjardins Group, such as if its credit rating were downgraded by rating agencies. A Desjardins-wide crisis scenario program has been implemented for this purpose. This program incorporates the concepts put forward by the Bank for International Settlements (BIS) under the document entitled “Basel III – International Framework for Liquidity Risk Measurement, Standards and Monitoring”. The scenarios make it possible to measure the magnitude of potential cash outflows in a crisis situation, to implement liquidity ratios and levels to be maintained throughout Desjardins Group, and to assess the potential marginal cost of such events, depending on the type, severity and level of the crisis.
The introduction of Basel III will also strengthen international minimum liquidity requirements. This accord will introduce a liquidity coverage ratio (LCR) to allow financial institutions to cope with potential liquidity crisis (“illiquidity”) situations, and a net stable funding ratio (NSFR) to address mismatches between assets and funding sources. Even though the Basel Committee is still studying these two ratios and an observation period is currently underway, the AMF expects Desjardins Group to calculate these ratios in order to benefit from an observation period before the planned effective dates of January 1, 2015, for the LCR, and January 1, 2018, for the NSFR. Desjardins Group already monitors these two ratios on a regular basis for management information purposes and intends to comply with the new standards once they become effective.
SOURCES OF FUNDING
Desjardins Group’s Treasury ensures stable and diversified sources of institutional funding by type, source and maturity. It uses a wide range of financial products and borrowing programs on various markets for its financing needs.
It should be noted that systems are in place for the issuance of covered bonds and the securitization of CHMC-insured loans. Furthermore, Desjardins Group is eligible for the Bank of Canada’s various intervention programs and loan facilities for Emergency Lending Assistance advances.

772012 DESJARDINS GROUP ANNUAL REPORT – MANAGEMENT’S DISCUSSION AND ANALYSIS
LIQUIDITY RISK INDICATORS
The purpose of monitoring liquidity indicators daily is to quickly identify a lack of liquidity, whether potential or real, within Desjardins Group and on capital markets. For each liquidity indicator defined, warning levels are established and are subject to an escalation process. If one or more indicators trigger a warning level, the Desjardins Group Finance and Risk Management Committee is immediately alerted. This committee would also act as a crisis committee should the contingency plan be put into action.
The indicators are divided into two categories: indicators specific to Desjardins Group and capital market indicators. The first category includes indicators that monitor the level of Desjardins Group’s room for manoeuvre, member behaviour, credit spreads faced by Caisse centrale Desjardins, and the effectiveness of institutional funding sources. Market indicators focus primarily on credit spreads observed for financial institutions and the provinces relative to federal bonds.
CONTINGENCY PLAN
Desjardins Group has developed a liquidity contingency plan that includes setting up an internal crisis committee vested with special decision-making powers to deal with crisis situations. This plan also lists the sources of liquidity available in exceptional situations. In addition, it sets out the decision-making and information process based on the severity level of a possible crisis.
The scope of a liquidity crisis depends on its possible duration, the amount of cash outflows, the efficiency of sources of funding, and its potential threat to the solvency of Desjardins Group. The crisis levels affecting Desjardins Group Treasury’s normal operations are as follows:
1. Pre-crisis or temporary decline in liquidity reserves
2. Major decline in liquidity reserves for an extended period of time but solvency not affected
3. Liquidity seriously compromised but solvency not affected
4. Liquidity seriously compromised and solvency threatened
5. Illiquidity and imminent or declared insolvency
The aim of the plan is to enable quick and efficient action in order to minimize disruptions caused by sudden changes in member and client behaviour and potential disruptions in capital markets or economic conditions.
SOURCES OF FINANCING
Core funding, which includes capital, long-term liabilities and a diversified deposit portfolio, is the foundation of Desjardins Group’s liquidity position. As at December 31, 2012, Desjardins Group’s outstanding deposit totalled $129.6 billion, up $6.2 billion, or 5.0%, from December 31, 2011. This growth was mainly due to business and government deposits, which totalled $43.0 billion, up $3.9 billion, or 10.0%, from $39.1 billion as at December 31, 2011. Deposits from individuals, business and government make up the main source of reliable funding and are Desjardins Group’s preferred category of funds. This solid base alone accounted for 98.3% of the deposit liabilities as at December 31, 2012.
DEPOSITS BY CATEGORY (in millions of dollars)
0
25,000
50,000
75,000
100,000
201220112010
78,747
33,686
2,230
39,104
1,813
82,486 84,415
43,033
2,176
n Individualn Business and governmentn Deposit-taking institutions and other
FUNDING BY CURRENCY (as at December 31, 2012)
2.9%
26.7%
70.4%
n Canadian dollarsn U. S. dollarsn Euros
78 2012 DESJARDINS GROUP ANNUAL REPORT – MANAGEMENT’S DISCUSSION AND ANALYSIS
As Desjardins Group’s treasurer, Caisse centrale Desjardins meets the needs of the organization’s members and clients. Its first priority is to implement appropriate strategies to identify, measure and manage risks. These activities are regulated by a liquidity sufficiency and administration policy and a refinancing management policy.
In order to maintain stable and diversified refinancing, Caisse centrale Desjardins ensures the diversification of its sources of financing from institutional capital markets. It therefore regularly turns to the capital markets when conditions are favourable, and occasionally makes public and private issues of term notes on Canadian, U.S. and European markets.
In 2012, Caisse centrale Desjardins managed to maintain sufficient liquidity levels to meet Desjardins Group’s needs through its strong treasury policy, solid institutional refinancing and the contribution of the caisse network. Caisse centrale Desjardins’s strict treasury management strategy also put it in a good position to deal with the current period of global financial recovery.
In keeping with its strategy of increasing the duration of its institutional refinancing and its mission as Desjardins Group’s treasurer, Caisse centrale Desjardins issued debt securities on various markets in 2012. In fact, in March, Caisse centrale Desjardins issued medium-term covered bonds in the amount of US$1.5 billion on the U.S. market. In October 2012, it also issued medium-term notes in the amount of $800 million. This issuance, the largest of its kind on the Canadian market by Caisse centrale Desjardins, was very well received by investors. The presence of Desjardins Group on these different markets also helped expand its pool of institutional investors.
Caisse centrale Desjardins continued to be present in the federally guaranteed mortgage loan securitization market under the Canada Mortgage Bond (CMB) Program. It was in fact active in this area, participating in new issues of approximately
$1.5 billion in 2012, namely four five-year fixed rate CMB issuances and one five-year floating rate CMB issuance. The main objective of this program is to obtain a source of long-term financing at the lowest price on the market.
Capital Desjardins inc. is a subsidiary of Desjardins Group. Its mandate is to issue securities on capital markets and to invest the proceeds in subordinated notes issued by the member caisses of the Federation. On June 1, 2012, Capital Desjardins inc. called all its outstanding Series C Senior Notes due in 2017, in the amount of $300 million.
Overall, these issuances made it possible to adequately meet the liquidity needs of Desjardins Group, to better diversify its sources of financing and to further extend their average term.
The following is a summary of the various Caisse centrale Desjardins borrowing programs:
On the Canadian market:
•Amedium-termdepositnoteprogramofupto$5 billion
On the international market:
•AEuropeanshort-termdepositnoteprogramof €1 billion
•AU.S.short-termdepositnoteprogramofUS$5 billion
•Aglobalmulti-currencymedium-termdepositnote program of €7 billion
As at December 31, 2012, Caisse centrale Desjardins’s borrowings and medium-term notes totalled $10.5 billion, up $575 million compared to the same date in 2011. As for Capital Desjardins inc., its subordinated bonds amounted to $3.1 billion as at December 31, 2012, versus $3.4 billion as at December 31, 2011.

792012 DESJARDINS GROUP ANNUAL REPORT – MANAGEMENT’S DISCUSSION AND ANALYSIS
CREDIT RATINGS
The credit ratings assigned to Desjardins Group by the rating agencies are instrumental in ensuring access to sources of wholesale financing and the cost of such financing, and they also impact Desjardins Group’s credibility and recognition among institutional investors.
Rating agencies assign credit ratings to securities issued by Desjardins Group, based on its financial stability, its capitalization, the stability of its operating surplus earnings, its leading role in its local markets and the quality of its assets.
On December 13, 2012, Standard & Poor’s downgraded the credit ratings of Caisse centrale Desjardins and Capital Desjardins inc., as well as five other Canadian financial institutions. The agency said it was concerned about Canadian debt levels and the possible consequences on financial institutions, particularly on their mortgage portfolios and credit loss volumes. It expects a slowdown in credit demand and greater pressure on the margins of the country’s financial institutions, in a low interest rate environment.
In addition, on January 28, 2013, Moody’s downgraded the credit ratings of Caisse centrale Desjardins and Capital Desjardins inc., as well as the ratings of five other Canadian financial institutions. The agency stated that its decision was due to the economic situation in Canada, which is showing signs for concern, such as high consumer debt levels and elevated housing prices. Moody’s also said that financial institutions are more vulnerable than in the past to downside risks weighing on the Canadian economy.
Management is of the opinion that these decisions have more to do with the agencies’ concerns about Canada’s economic situation than with the quality of Desjardins Group’s loan portfolio or balance sheet.
Even after the downgrade, the ratings of Caisse centrale Desjardins and Capital Desjardins inc. remain among the best in Canada and compare favourably with those of many large international and Canadian financial institutions.
The credit ratings and outlooks assigned by Fitch and DBRS to the various securities of Caisse centrale Desjardins and Capital Desjardins inc. were unchanged in 2012.
TABLE 33 – CREDIT RATINGS OF SECURITIES ISSUED
DBRS STANDARD &
POOR’S MOODY’S FITCH
Caisse centrale Desjardins Short-term R-1 (high) A-1 P-1 F1+ Medium- and long-term, senior AA A+ Aa2 AA-Capital Desjardins inc. Medium- and long-term, senior AA (low) A A2 A+
80 2012 DESJARDINS GROUP ANNUAL REPORT – MANAGEMENT’S DISCUSSION AND ANALYSIS
CONTRACTUAL OBLIGATIONS
Contractual obligations are commitments with respect to minimum future payments and impact Desjardins Group’s liquidity needs. Such contractual obligations are recognized in the Combined Balance Sheets or are off-balance sheet.
Table 34 presents financial liabilities as well as other obligations by remaining contractual maturity term. The amounts presented include principal and interest, if any.
TABLE 34 – CONTRACTUAL OBLIGATIONS BY TERM TO MATURITY As at December 31 (in millions of dollars)
2012Payable on
demandLess than
1 year1 to 5 years
Over 5 years Total
LiabilitiesDeposits $ 46,100 $ 42,415 $ 44,599 $ 338 $ 133,452Acceptances — 841 — — 841Commitments related to securities sold short 4,790 131 44 18 4,983Commitments related to securities lent or sold under repurchase agreements 1 7,982 — — 7,983Subordinated bonds — 175 746 3,425 4,346Amounts payable to clients, brokers and financial institutions 1,752 797 — — 2,549Other financial liabilities 31 1,704 89 2 1,826Guarantees and standby letters of credit 490 234 144 38 906Credit commitments 22,576 32,660 6,103 21 61,360Derivative financial instruments with net settlement — 167 265 13 445Derivative financial instruments with gross settlement(1)
Cash flows to be paid on liabilities — 4,896 1,422 — 6,318 Cash flows to be paid on assets — 4,420 2,737 — 7,157
2011Payable on
demandLess than
1 year1 to 5 years
Over 5 years Total
LiabilitiesDeposits $ 42,734 $ 39,622 $ 44,210 $ 780 $ 127,346Acceptances — 676 — — 676Commitments related to securities sold short 5,119 168 57 2 5,346Commitments related to securities lent or sold under repurchase agreements 3 8,497 — — 8,500Subordinated bonds — 187 777 3,836 4,800Amounts payable to clients, brokers and financial institutions 2,191 1,695 — — 3,886Other financial liabilities 10 2,000 80 3 2,093Guarantees and standby letters of credit 381 107 245 — 733Credit commitments 20,325 29,936 4,226 1,217 55,704Derivative financial instruments with net settlement — 330 437 23 790Derivative financial instruments with gross settlement(1)
Cash flows to be paid on liabilities — 7,842 1,544 — 9,386 Cash flows to be paid on assets — 2,011 1,690 7 3,708
(1) The “Derivative financial instruments with gross settlement” category includes cash flows to be paid on both derivative financial instruments recorded as liabilities and derivative financial instruments recorded as assets. Contractual cash outflows for derivative financial instruments with gross settlement are accompanied by related cash inflows that are not included in this table.

812012 DESJARDINS GROUP ANNUAL REPORT – MANAGEMENT’S DISCUSSION AND ANALYSIS
OPERATIONAL RISKOperational risk is defined as the risk of inadequacy or failure attributable to processes, people, internal systems or external events and resulting in losses, failure to achieve objectives or a negative impact on reputation.
OPERATIONAL RISK MANAGEMENT
Operational risk is inherent to all business activities as well as internal and outsourced activities. Losses can mainly arise from fraud, damage to tangible assets, illegal acts, system failures, or problems in process management.
OPERATIONAL RISK MANAGEMENT FRAMEWORK
The primary objective of the operational risk management framework is to maintain operational risk at an acceptable level while focusing on the quality of service provided to Desjardins Group members and clients and on organizational agility. The development of policies, guidelines and rules to identify, measure, track, monitor and disclose operational risk ensures its sound and prudent management.
There are practices in place to foster efficient and proactive management of events that could lead to operational risk. These include practices for risk assessment, management of outsourcing risks, protection of information, insurance coverage, business continuity and crisis management.
The operational risk management framework is periodically reviewed based on regulatory authorities’ expectations and industry practices
BUSINESS CONTINUITY AND CRISIS MANAGEMENT
Desjardins Group has enhanced its business continuity program, the purpose of which is to ensure that service delivery to members and clients will be maintained in essential operations in the event of business interruptions, system disruptions or crises.
INFORMATION RISK MANAGEMENT
Desjardins Group is aware of the importance of protecting information and has implemented an information risk management program as well as a training and awareness program to protect privacy and ensure the safety of its members’ and clients’ property.
TECHNOLOGY RISK MANAGEMENT
Desjardins Group has updated its technology risk management by implementing a specific framework for all technology services provided by Desjardins Technology Group Inc. This framework defines the concept of technology risks for Desjardins Group, the scope of application of the technology risk management approach, the governance structure and related management activities.
OUTSOURCING RISK MANAGEMENT
A program has been put in place to manage Desjardins Group’s outsourcing activities. All material outsourcing agreements are monitored in order to ensure they are properly managed.
INSURANCE RISKInsurance risk arises from the uncertainty that events may turn out differently from the assumptions used when designing, pricing or measuring actuarial reserves for insurance products, and that profitability of these products may be affected.
The risk associated with designing and pricing products is the risk that the initial pricing is or will become insufficient. The risk of incorrectly estimating actuarial reserves is due to the possibility of selecting an inadequate model for estimating the loss ratio or calculating the reserves. Loss ratio means the estimated amount of benefits that will be required to be paid, contractual clause management and risk selection.
INSURANCE RISK MANAGEMENT
Product design and pricing risk arises from potential errors in projections concerning the many factors used to set premiums, including future returns on investments, underwriting experience in terms of claims experience, mortality and morbidity, and administrative expenses. Insurance components adopt strict pricing standards and policies and perform spot checks to compare forecasts with actual results. Some product pricing may be adjusted depending on the accuracy of forecasts.
Desjardins Group limits potential losses through reinsurance treaties. Such treaties do not, however, release the insurance components from their obligations toward clients in the event that reinsurers experience financial difficulties. Consequently, the components are also exposed to a credit risk related to the reinsurers. To minimize this risk, the components enter into reinsurance treaties with stable, financially solid and, in most cases, duly accredited companies.

82 2012 DESJARDINS GROUP ANNUAL REPORT – MANAGEMENT’S DISCUSSION AND ANALYSIS
The insurance subsidiaries comply with the standards for sound management practices established by the regulatory bodies that govern them and are subject to dynamic capital adequacy testing. Various pessimistic scenarios were tested during the year to measure their effect on the capitalization ratio; the capital proved adequate in each case.
STRATEGIC RISKStrategic risk refers to a possible loss attributable to an inability to adapt to a changing environment because of a failure to act, an inappropriate choice of strategies or the inability to effectively implement strategies.
It is first up to senior management and the Board of Directors to address, define and monitor developments in Desjardins Group’s strategic directions according to the consultation processes specific to Desjardins. Events that could compromise the achievement of Desjardins Group’s strategic objectives and initiatives are systematically and regularly monitored by Desjardins Group’s officers and senior management.
REPUTATION RISKReputation risk is the risk of being perceived negatively by stakeholders, whether justifiably or not, because of practices, actions or lack of action, which could have an unfavourable impact on Desjardins Group’s income and equity, and the trust of its stakeholders.
Reputation is of critical importance and cannot be managed separately from other risks. Consequently, managing reputation risk in all its spheres of activity is a constant concern for Desjardins Group.
Desjardins Group has defined guidelines, a management framework, and roles and responsibilities with regard to reputation risk. This framework is in addition to various processes already in place, such as the regulatory compliance function and ethical requirements, to encourage sound reputation risk management. All management personnel and employees are required to perform their duties in accordance with these principles and Desjardins Group’s values.
OVERVIEW OF OTHER RISKS
ENVIRONMENTAL RISK
Environmental risk is the risk of financial, operational or reputational loss for Desjardins Group as a result of environmental impacts or issues, whether they are a result of Desjardins Group’s credit or investment activities or its operations.
Environmental risk is an integral part of Desjardins Group’s Integrated Risk Management Framework. Desjardins Group has been a pioneer in responsible investing for more than a decade, offering investment products that support businesses with clearly defined social responsibility and environmental values. Desjardins Group also supports climate change action by promoting businesses that are making positive contributions to combat climate change.
LEGAL AND REGULATORY ENVIRONMENT RISK
Legal and regulatory environment risk represents the consequences of not complying with the laws, regulations, standards and practices governing our operations.
The financial services industry is one of the most strictly regulated sectors. In recent years, the regulations governing the financial sector have expanded significantly in response to numerous socio-economic phenomena, such as the development of new, increasingly complex financial products, the continuing volatility in the securities industry, market crises, financial fraud, and the fight against money laundering and terrorist financing, to mention but a few. In addition to federal (Canada and the U.S.) and provincial government requirements, the regulatory environment also includes organizations such as the AMF in Quebec, Canadian securities authorities, the OSFI, the Mutual Fund Dealers Association of Canada, and the Investment Industry Regulatory Organization of Canada. Complying with major legislative and regulatory changes such as the Foreign Account Tax Compliance Act (FATCA), the Dodd-Frank Act and the Basel accords requires Desjardins Group to make significant investments of financial and human resources.
Legal and regulatory environment risk entails effectively preventing and handling possible legal disputes and claims which may lead to judgments or decisions by a court of law or regulatory agency that could result in financial penalties. They may also end in unfavourable judgments, decisions or settlements that could negatively affect how Desjardins Group conducts its operations and lead to further costs associated with legal proceedings that could have an adverse impact on Desjardins Group’s financial position and corporate image.
Desjardins Group manages the risk related to the legal and regulatory environment by promoting a strong culture of compliance and by setting up a compliance management framework in order to identify risks of non-compliance, to assess the potential consequences of such risks and to implement practices to manage them effectively. In addition, a Chief Compliance Officer supervises all Desjardins Group teams that
832012 DESJARDINS GROUP ANNUAL REPORT – MANAGEMENT’S DISCUSSION AND ANALYSIS
conduct compliance activities. This compliance management structure provides reasonable assurance that Desjardins Group’s operations comply with applicable regulations.
The compliance function is responsible for developing, updating and maintaining the compliance management framework. It is based on a number of principles, including the identification and monitoring of regulatory obligations and the functional units subject to them. To do so, regulatory developments and their impact on operations are monitored on an ongoing basis. The compliance function provides support in an advisory capacity to managers in charge of the business sectors so that they can effectively manage their risks while conducting periodic inspections of operations supported by training programs. Lastly, a formal reporting process is in place for Desjardins Group’s senior management and decision-making bodies.
SECTION 4.2
RISK FACTORS THAT COULD IMPACT FUTURE RESULTSAs indicated in the warning about forward-looking statements, general and specific risks and uncertainties may cause the actual results of Desjardins Group to differ from those in the forward-looking statements. Some of these risk factors are presented below.
GENERAL ECONOMIC AND BUSINESS CONDITIONS IN REGIONS IN WHICH DESJARDINS GROUP OPERATES
The general economic and business conditions in the regions in which Desjardins Group operates may significantly affect its revenues. These conditions include short- and long-term interest rates, inflation, debt securities market fluctuations, foreign exchange rates, the volatility of capital markets, including tighter liquidity conditions in certain markets, the strength of the economy, and the volume of business conducted by Desjardins Group in a given region.
FOREIGN EXCHANGE RATES
Exchange rate fluctuations in the Canadian dollar, the U.S. dollar and other foreign currencies may affect Desjardins Group’s financial situation and its future surplus earnings. Fluctuations in the Canadian dollar may also adversely impact the earnings of Desjardins Group’s business clients in Canada.
MONETARY POLICIES
The monetary policies of the Bank of Canada and the Federal Reserve Board in the United States, as well as other interventions in financial markets, have an impact on Desjardins Group’s income. The general level of interest rates may affect Desjardins Group’s profitability. Fluctuations in interest rates affect the spread between interest paid on deposits and interest earned on loans, which could change Desjardins Group’s net interest income. Desjardins Group has no control over changes in monetary policies or financial market conditions, and it therefore cannot forecast or anticipate them with any consistency.
COMPETITION
The level of competition in markets in which Desjardins Group operates affects its performance. Client retention depends on many factors, such as product and service pricing, changes to the products and services offered, and customer service delivery.
CHANGES IN STANDARDS, LAWS AND REGULATIONS
Changes made to standards, laws and regulations, including changes affecting their interpretation or implementation, could have an impact on Desjardins Group by restricting its product or service offer or by enhancing the ability of competitors to compete with its products or services. In addition, shoud Desjardins Group fail to comply with any applicable laws, regulations or other guiding principles, even though it takes care to avoid such a possibility, it could be subject to penalties and fines that may have an unfavourable impact on its reputation and financial results.
84 2012 DESJARDINS GROUP ANNUAL REPORT – MANAGEMENT’S DISCUSSION AND ANALYSIS
ACCURACY AND COMPLETENESS OF INFORMATION CONCERNING CLIENTS AND COUNTERPARTIES
Desjardins Group relies on the accuracy and completeness of the information it collects on its clients and counterparties. When deciding to authorize credit or other transactions with clients or counterparties, Desjardins Group may use information provided by the clients or counterparties themselves, including financial statements and other financial information. It may also rely on representations made by clients and counterparties regarding the completeness and accuracy of such information, and on auditors’ reports regarding financial statements. The financial position and income of Desjardins Group could be adversely affected if it relies on financial statements that are not compliant with accounting standards, are misleading or do not accurately present, in all material respects, the financial position or operating results of its clients and counterparties.
ACCOUNTING POLICIES USED BY DESJARDINS GROUP
The accounting policies that Desjardins Group uses determine how it reports its financial position and operating results, and they may require management to make estimates or rely on assumptions about matters that are inherently uncertain. Any change to these estimates and assumptions may have a significant impact on Desjardins Group’s operating results and financial position.
NEW PRODUCTS AND SERVICES TO MAINTAIN OR INCREASE DESJARDINS GROUP’S MARKET SHARE
The ability of Desjardins Group to maintain or increase its market share depends partly on its skill in adapting its products and services to changing standards in the financial services industry. Financial services companies are subject to increasing pressure regarding the pricing of their products and services. This factor may reduce net interest income or revenues from fee-based products and services. Moreover, the adoption of new technologies could require Desjardins Group to modify or adapt its products and services, resulting in major expenses.
ABILITY TO RECRUIT AND RETAIN KEY MANAGEMENT PERSONNEL, INCLUDING SENIOR MANAGEMENT
Desjardins Group’s future performance depends partly on its ability to recruit and retain key management personnel, including senior management. In addition, there is intense competition to retain the best people in the financial services industry. Desjardins Group cannot, however, be sure that it will be able to continue to recruit and retain key management personnel, including senior management, although this is one of the objectives of its resources management policies and practices.
BUSINESS INFRASTRUCTURE
Third parties provide some of the essential components of Desjardins Group’s business infrastructure, such as Internet connections and network access. Interruptions in network access or other communication services provided by such third parties could adversely affect the ability of Desjardins Group to offer products and services to customers and otherwise conduct its business.
GEOGRAPHIC CONCENTRATION
As at December 31, 2012, Desjardins Group’s lending in Quebec accounted for 93.1% of its aggregate loan portfolio. Moreover, its operations are heavily concentrated in Quebec. As a result of this significant geographic concentration, its results largely depend on economic conditions in Quebec. Any deterioration in these conditions could adversely impact:
•Pastdueloans •Problemassetsandforeclosedproperty •Claimsandlawsuits •Thedemandforproductsandservices •Thevalueofthecollateralavailableforloans,
especially mortgages, and by extension clients’ borrowing capacity, the value of assets associated with impaired loans, and collateral coverage
ACQUISITIONS AND PARTNERSHIPS
Desjardins Group has implemented a rigorous internal control environment for the acquisition and partnership process. Nevertheless, its financial or strategic objectives could fail to be met because of unexpected factors such as delays in approval of transactions by regulators and shareholders, the inability to apply the strategic plan in its original form, difficulties in integrating or retaining key employees or clients, or changes in the economic and competitive environment. As a result, synergies, higher income, cost savings, increased market share and other expected benefits may not materialize, thereby impacting Desjardins Group’s future surplus earnings.

852012 DESJARDINS GROUP ANNUAL REPORT – MANAGEMENT’S DISCUSSION AND ANALYSIS
CREDIT RATINGS
The credit ratings assigned to Desjardins Group by rating agencies are instrumental in its access to sources of wholesale financing and the cost of such financing. There is no guarantee that the credit ratings and outlooks assigned by the agencies to Desjardins Group’s various securities will be maintained. Furthermore, a downgrade to any of Desjardins Group’s ratings could raise its cost of financing and limit its access to capital markets.
OTHER FACTORS
Other factors that may have an impact on Desjardins Group’s future results include changes in tax laws, unexpected changes in consumer spending
and savings habits, technological developments, the ability to implement Desjardins Group’s disaster recovery plan within a reasonable time, the potential impact of international conflicts or natural disasters on Desjardins Group’s business, and Desjardins Group’s ability to anticipate and manage the risks associated with these factors properly despite a disciplined risk environment.
Desjardins Group cautions the reader that factors other than the foregoing could affect future results. Investors and other stakeholders relying on forward-looking statements to make decisions with respect to Desjardins Group should carefully consider these factors as well as other uncertainties, potential events, and industry factors or items specific to Desjardins Group which could adversely impact its future results.
SECTION 4.3
ADDITIONAL INFORMATION RELATED TO EXPOSURE TO CERTAIN RISKSThe tables below provide further details about more complex financial instruments with a higher degree of risk.
TABLE 35 – ASSET-BACKED SECURITIES As at December 31 (in millions of dollars)
2012 2011Notionalamounts Fair value
Notional amounts Fair value
Commercial mortgage-backed securities(1) $ 236 $ 249 $ 249 $ 260Financial asset-backed securities(2) 94 91 71 59
(1) These securities are presented in the Combined Balance Sheets under “Securities at fair value through profit or loss”.(2) None of the securities held are directly backed by subprime residential mortgage loans. These securities are presented in the Combined Balance Sheets under “Securities at fair value through profit or
loss” and “Available-for-sale securities”.
TABLE 36 – DERIVATIVE FINANCIAL INSTRUMENTS As at December 31 (in millions of dollars)
2012 2011Notional amounts
Positive value
Negative value
Notional amounts
Positive value
Negative value
Credit default swaps(1) $ 559 $ 1 $ — $ 601 $ — $ 8Total return swaps(2) 7 — — 8 — —
(1) Desjardins Group’s commitment and the nature of the underlying assets are provided in the “Credit default swaps” section of Note 27, “Commitments, guarantees and contingent liabilities”, to the Combined Financial Statements. Credit default swaps are presented in the Combined Balance Sheets as derivative financial instruments.
(2) These amounts do not include any amounts realized as part of securitization activities. Total return swaps are presented in the Combined Balance Sheets as derivative financial instruments.
TABLE 37 – LEVERAGED FINANCE LOANS AND SUBPRIME LOANS As at December 31 (in millions of dollars)
2012 2011
Leveraged finance loans(1) $ 165 $ 90Alt-A mortgage loans(2) 36 43Subprime residential mortgage loans(3) 2 1
(1) Leveraged finance loans are defined as loans to large corporations and finance companies whose credit rating is between BB+ and D, and whose level of indebtedness is very high compared to other companies in the same industry.
(2) Alt-A mortgages are defined as loans to borrowers with non-standard income documentation. These loans are presented in the Combined Balance Sheets under “Loans – Residential mortgages” and are measured at amortized cost.
(3) These loans are defined as loans to borrowers with a high credit risk profile. Only one of these loans is currently in default. Subprime residential mortgages are recorded on the Combined Balance Sheets under “Loans – Residential mortgages” and are measured at amortized cost.

86 2012 DESJARDINS GROUP ANNUAL REPORT – MANAGEMENT’S DISCUSSION AND ANALYSIS
5.0 ADDITIONAL INFORMATIONSECTION 5.1
CONTROLS AND PROCEDURESDesjardins Group is not a reporting issuer, on a combined basis, under Regulation 52-109 Certification of Disclosure in Issuers’ Annual and Interim Filings issued by the Canadian Securities Administrators (CSA). However, it has chosen to apply the practices provided in this Regulation to demonstrate its willingness to comply with financial governance best practices.
During 2012, Desjardins Group carried out work so that it could provide certification as at December 31, 2012, of the design and effectiveness of its disclosure controls and procedures, as well as of the design and effectiveness of its internal control over financial reporting.
DISCLOSURE CONTROLS AND PROCEDURESIn accordance with the CSA guidance in Regulation 52-109, the Chair of the Board, President and CEO as well as the Senior Vice-President of Finance and Chief Financial Officer of Desjardins Group designed, or caused to be designed, disclosure controls and procedures, which are supported in particular by a process for regular certification of financial disclosures in annual and interim filings. All information collected as part of the financial governance process is reviewed on a quarterly and annual basis by the members of the Desjardins Group Disclosure Committee and the Audit and Inspection Commission, who play a lead role in overseeing and assessing the adequacy of disclosure controls and procedures.
As at December 31, 2012, in accordance with the recognized control framework of the Committee of Sponsoring Organizations (COSO) of the Treadway Commission, Desjardins Group management assessed the design and effectiveness of its disclosure controls and procedures.
The design and effectiveness of disclosure controls and procedures were therefore assessed by Desjardins Group management, under the supervision of the
Chair of the Board, President and CEO, and the Senior Vice-President of Finance and Chief Financial Officer of Desjardins Group. Based on the results of this assessment, they concluded that the disclosure controls and procedures are adequately designed and effective, and do not contain any material weakness, thereby ensuring that the information required to be disclosed in reports filed or submitted under Canadian securities legislation is recorded, processed, summarized and reported within the time periods specified in the applicable rules and forms and thereby providing investors with complete and reliable information.
INTERNAL CONTROL OVER FINANCIAL REPORTINGDesjardins Group management caused an adequate internal control over the financial reporting process to be designed and has maintained it. Such internal control is designed to provide reasonable assurance regarding the reliability of financial reporting and the preparation of combined financial statements for external purposes in accordance with IFRS.
As in the case of the assessment of disclosure controls and procedures, the design and effectiveness of internal control over financial reporting were also assessed in accordance with the COSO control framework.
Because of its inherent limitations, internal control over financial reporting may not prevent or detect misstatements, whether due to error or fraud. Moreover, management’s assessment of the controls provides only reasonable, not absolute, assurance that all the problems related to control, which could give rise to material misstatements, have been detected.
An assessment of the design and effectiveness of internal control over financial reporting was therefore carried out by Desjardins Group management under the supervision of the Chair of the Board, President and CEO, and the Senior Vice-President of Finance and Chief Financial Officer of Desjardins Group. Based on the results of this assessment, they have concluded that, as at December 31, 2012, internal control over financing reporting is adequately designed and effective, and does not contain any material weakness.
872012 DESJARDINS GROUP ANNUAL REPORT – MANAGEMENT’S DISCUSSION AND ANALYSIS
Moreover, as at December 31, 2012, there were three Desjardins Group components, namely Caisse centrale Desjardins, Capital Desjardins inc. and, since May 1, 2012, the Fédération des caisses Desjardins du Québec (as a venture issuer), that complied with the requirements under Regulation 52-109. Note that the subsidiary Western Financial Group Inc. was a non-venture reporting issuer as at December 31, 2012, but that since February 13, 2013, it no longer has this status as a result of Desjardins Group's redemption of its securities on the market. Consequently, Western Financial Group Inc. is no longer subject to the requirements of Regulation 52-109.
Under the supervision of the certifying officers, the respective management of Caisse centrale Desjardins and Capital Desjardins inc. therefore assessed the design and effectiveness of disclosure controls and procedures and of internal control over financial reporting. These assessments provide reasonable assurance regarding the reliability of financial reporting and the preparation of financial statements for external purposes in accordance with IFRS.
CHANGE IN INTERNAL CONTROL OVER FINANCIAL REPORTINGDuring the year ended December 31, 2012, Desjardins Group did not make any changes to its internal control over financial reporting that had materially affected, or may materially affect, its operations.
Various other aspects of governance are examined in more detail on pages 183 to 202 of the 2012 Desjardins Group Annual Report.
SECTION 5.2
RELATED PARTY DISCLOSURES In the normal course of business, Desjardins Group offers financial services and enters into agreements for operating services with related parties. It also pays its key management personnel compensation under normal market conditions.
Furthermore, Desjardins Group provides its financial products and services, under normal market conditions, to its directors, its management personnel and its employees as well as to persons related to them.
Desjardins Group has set up a process to obtain assurance that all transactions with its management personnel and the persons who are related to them have been carried out as arm’s-length transactions and in compliance with the legislative framework for its various components.
Such related party transactions are explained in Note 33, “Related party disclosures”, to Desjardins Group’s annual Combined Financial Statements, on page 181 of the 2012 Desjardins Group Annual Report.
SECTION 5.3
MATERIAL EVENTSCHAIR OF THE BOARD, PRESIDENT AND CEO OF DESJARDINS GROUPOn January 31, 2012, Desjardins Group announced that Monique F. Leroux had been re-elected as Chair of the Board, President and CEO of Desjardins Group for a second mandate of four years.
TMX GROUP INC.On July 31, 2012, TMX Group Limited (formerly Maple Group Acquisition Corporation), a corporation in which Desjardins Group has a stake as an investor along with 12 other Canadian financial institutions and pension funds, announced that the offer to purchase all the shares of TMX Group Limited had been successful. Under the transaction, Desjardins Group invested $98 million in equity in TMX Group Limited. This investment is presented under “Securities – Available-for-sale securities” on the Combined Balance Sheets.

88 2012 DESJARDINS GROUP ANNUAL REPORT – MANAGEMENT’S DISCUSSION AND ANALYSIS
On September 14, 2012, as part of an arrangement, TMX Group Limited acquired all outstanding TMX Group Inc. shares in exchange for common shares of TMX Group Limited, on a one-for-one basis. The Toronto Stock Exchange approved the listing of TMX Group Limited shares.
ACQUISITIONSThrough Western Financial Group Inc., the Federation acquired Roblin Insurance Travel and Realty Agencies Ltd., based in Manitoba, on January 3, 2012; Brown & Ward Insurance Ltd., a leading property and casualty insurance broker in Alberta, on February 1, 2012; and Hodges & Company Insurance Services Ltd., a network of experienced brokers specialized in commercial insurance, on May 17, 2012. Hodges & Company is based in Victoria, and its acquisition was Western Financial Group Inc.'s first foray into British Columbia. In 2012, Western Financial Group Inc. also acquired BC Yacht Insurance Brokers Inc., based in Sidney, British Columbia, on July 1, 2012, and Orion Insurance Brokers Ltd., whose offices are in Winnipeg, Manitoba, on September 1, 2012.
SUBSEQUENT EVENT – QTRADE CANADA INC.On February 4, 2013, Desjardins Group entered into a final agreement, through Desjardins Financial Corporation Inc., a wholly owned subsidiary of the Federation, to purchase between 25% and 40% of the outstanding shares of Qtrade Canada Inc. (Qtrade), a company specializing in online brokerage and wealth management services, primarily for credit unions.
This transaction qualifies as a business combination since Desjardins Group will obtain control over Qtrade’s operations, and it will be accounted for using the acquisition method. The allocation of the purchase price to the assets acquired and liabilities assumed will be completed on the transaction’s closing date, which is scheduled for the second quarter of 2013. Qtrade’s results will be included in the Combined Financial Statements of Desjardins Group from the transaction’s closing date.
SECTION 5.4
CRITICAL ACCOUNTING POLICIES AND ESTIMATESA description of the accounting policies used by Desjardins Group is essential to understanding the Combined Financial Statements as at December 31, 2012. The significant accounting policies are described in Note 2, “Significant accounting policies”, to the Combined Financial Statements. Some of these policies are particular important in presenting Desjardins Group’s financial position and operating results since they require management to make assumptions and estimates that may involve uncertainties, and, since any change to these assumptions and estimates could have a significant impact on the Combined Financial Statements of Desjardins Group. The following paragraphs summarize these accounting policies.
SPECIAL PURPOSE ENTITIES Desjardins Group includes in its Combined Financial Statements the operations of the distinct legal structures specifically created to manage a transaction or a group of similar transactions (special purpose entities), even if it has no equity interest in these entities, provided that it exercises control in substance based on the following criteria:
•Theactivitiesoftheentityarebeingconductedexclusively on behalf of Desjardins Group, such that Desjardins Group benefits from the entity’s operations.
•DesjardinsGrouphasthedecision-makingandmanagement powers needed to obtain the majority of the benefits from the ongoing activities of the entity. These powers are characterized by the ability to dissolve the entity, to modify its statutes or to veto any modification thereto formally.
•DesjardinsGrouphastheabilitytoobtainthemajority of the benefits of the entity and therefore may be exposed to risks incident to the entity's activities. These benefits may take the form of the right to receive some or all of the entity’s profit or loss, measured on an annual basis, or a share of its net assets, or the right to sell one or more assets or to receive the majority of the residual assets in the event of liquidation.
•DesjardinsGroupretainsthemajorityoftherisks taken by the entity in order to obtain benefits from its activities; this would be the case if Desjardins Group remained exposed to the initial losses on the asset portfolio held by the entity.

892012 DESJARDINS GROUP ANNUAL REPORT – MANAGEMENT’S DISCUSSION AND ANALYSIS
FAIR VALUE MEASUREMENT OF FINANCIAL INSTRUMENTSThere is little subjectivity in the determination of the fair value of financial instruments, especially securities, obtained from quoted prices on active markets.
If there are no quoted prices on active markets, the fair value is determined using either models based on observable market data or models that are not based on observable market data. When no quoted prices are available, the fair value is estimated using present value or other valuation methods, which are influenced by the assumptions used concerning the amount and timing of estimated future cash flows and discount rates, which reflect varying degrees of risk, including liquidity risk, credit risk, and risks related to interest rates, exchange rates and price and rate volatility. Due to the need to use estimates and make judgments when applying many valuation techniques, fair value estimates for identical or similar assets may differ between entities. Fair value reflects market conditions on a given date and for this reason cannot be representative of future fair values. It also cannot be considered as being realizable in the event of immediate settlement of these instruments.
LOANS
Changes in interest rates and in the creditworthiness of borrowers are the main causes of changes in the fair value of loans held by Desjardins Group, which results in a favourable or unfavourable difference compared to their carrying amount. The fair value of loans is estimated by discounting expected cash flows using market interest rates charged for similar new loans at the reporting date. The fair value of impaired loans is assumed to be equal to their carrying amount.
DEPOSITS
The fair value of deposits with floating-rate features or with no stated maturity is assumed to be equal to their carrying amount. The fair value of fixed-rate deposits is determined by discounting expected cash flows using market interest rates currently being offered for deposits with substantially the same term.
SUBORDINATED BONDS
The fair value of subordinated bonds is based on the market rates for similar issues or debt securities, or on the rates currently offered to Desjardins Group for debt securities with the same remaining term.
DERIVATIVE FINANCIAL INSTRUMENTS
The fair value of derivative financial instruments is determined using pricing models that incorporate the current market prices and the contractual prices of the underlying instruments, the time value of money, yield curves and volatility factors. The fair value of derivative financial instruments is presented without taking into account the impact of legally enforceable master netting agreements.
FINANCIAL INSTRUMENTS WHOSE FAIR VALUE EQUALS THEIR CARRYING AMOUNT
The carrying amount of certain financial instruments that mature within the next 12 months is a reasonable approximation of their fair value. These financial instruments include the following items: “Cash and deposits with financial institutions”, “Clients’ liability under acceptances”, “Amounts receivable from clients, brokers and financial institutions”, “Other assets – Other”, “Acceptances”, “Amounts payable to clients, brokers and financial institutions” and “Other liabilities – Other”.
The fair value of financial instruments is presented in Note 5, “Fair value of financial instruments”, to the Combined Financial Statements.
DERECOGNITION OF FINANCIAL ASSETS AND FINANCIAL LIABILITIESA financial asset is derecognized when the contractual rights to the cash flows from the asset expire or when the contractual rights to the cash flows from the financial asset and substantially all risks and rewards of ownership of the asset are transferred to a third party.
When the cash flows from a financial asset have been transferred but Desjardins Group has retained substantially all the risks and rewards of ownership of the financial asset, it recognizes a separate asset and a separate liability presented in the Combined Balance Sheets, which represent the rights and obligations created or retained in the asset transfer. If control of the financial asset is retained, Desjardins Group continues to recognize the asset in the Combined Balance Sheets to the extent of its continuing involvement in said asset.
When a financial asset is derecognized in its entirety, a gain or a loss is recognized in the Combined Statements of Income for an amount equal to the difference between the carrying amount of the asset and the value of the consideration received.
A financial liability is derecognized when the related obligation is discharged, cancelled, or expires.

90 2012 DESJARDINS GROUP ANNUAL REPORT – MANAGEMENT’S DISCUSSION AND ANALYSIS
IMPAIRMENT OF FINANCIAL ASSETS
ALLOWANCE FOR CREDIT LOSSES
Measuring the allowance for credit losses is very important for Desjardins Group given the size of its loan portfolio. Certain factors may influence management’s judgment, and any material change to estimates or parameters could result in a change in the currently recognized amount for the allowance for credit losses. The allowance for credit losses reflects management’s best estimate of potential credit losses.
The impairment of a loan or a group of loans is determined by estimating the recoverable amount of these financial assets. The allowance is equal to the difference between this amount and the carrying amount. To determine the estimated recoverable amount of a loan, Desjardins Group discounts the estimated future cash flows at the effective interest rate inherent to the loan. When the amounts and timing of future cash flows cannot be estimated with reasonable reliability, the estimated recoverable amount is determined using either the fair value of any security underlying the loan, net of expected costs of realization, or the observable market price for the loan. The security may vary depending on the type of loan.
The allowance resulting from this impairment is established using two components: individual allowances and collective allowance.
For individual allowances, Desjardins Group first reviews its loan portfolios on a loan-by-loan basis to assess credit risk and determine if there is any objective evidence of impairment for which a loss should be recognized in the Combined Statements of Income. Loan portfolios for which an individual allowance has not been established are then included in groups of assets having similar credit risk characteristics and are subject to a collective allowance.
The method used by Desjardins Group to determine the collective allowance takes into account the risk parameters of the various loan portfolios, in particular through the integration of sophisticated credit risk models. These collective allowance models take into account certain factors such as the probabilities of default (loss frequency), loss given default (extent of losses) and gross exposures at default. These parameters, which are based on historical losses, are determined according to the category and risk rating of each loan. The measurement of the collective allowance also depends on management’s interpretation of current credit quality trends with respect to business segments, the impact of changes to its credit policies and economic conditions.
Additional information about accounting for loans and the allowance for credit losses is presented in Note 7, “Loans and allowance for credit losses”, to the Combined Financial Statements.
AVAILABLE-FOR-SALE SECURITIES
Securities classified in the “Available for sale” category are monitored on a regular basis to determine whether there is any objective evidence that they are impaired. In measuring the decline in value, Desjardins Group takes into account many facts specific to each investment and all the factors that could indicate that there has been impairment. Factors considered include, but are not limited to, a significant or prolonged decline in fair value, significant financial difficulties of the issuer, a breach of contract, the increasing probability that the issuer will enter bankruptcy or a restructuring, and the disappearance of an active market for the financial asset in question. Management also uses its judgment to determine when to recognize an impairment loss.
Debt securities classified in the “Available for sale” category are individually assessed by Desjardins Group to determine whether there is any objective evidence of impairment. For equity securities classified in the “Available for sale” category, the objective evidence would also include a “significant” or “prolonged” decline in the fair value below cost.
Additional information about the recognition of available-for-sale securities and fair value measurement is presented in Note 4, “Carrying amount of financial instruments”, Note 5, “Fair value of financial instruments”, and Note 6, “Securities”, to the Combined Financial Statements.
IMPAIRMENT OF NON-FINANCIAL ASSETSDesjardins Group assesses, at the reporting date, whether there is an indication that an asset may be impaired. An impairment loss is recognized when the carrying amount of the asset exceeds its recoverable amount. The recoverable amount is the higher of its fair value less costs to sell and its value in use, which corresponds to the present value of the recoverable future cash flows. Any impairment loss recognized in the Combined Statements of Income represents the excess of the carrying amount of the asset over the recoverable amount. Impairment losses on that asset may be subsequently reversed and are recognized in the Combined Statements of Income in the year in which they occur.

912012 DESJARDINS GROUP ANNUAL REPORT – MANAGEMENT’S DISCUSSION AND ANALYSIS
Estimating the recoverable amount of a non-financial asset to determine if it is impaired also requires that management make estimates and assumptions, and any change in these estimates and assumptions could impact the determination of the recoverable amount of non-financial assets and, therefore, the outcome of the impairment test.
GOODWILL
Goodwill is tested for impairment once a year and when events or changes in circumstances indicate that the carrying amount may not be recoverable.
The goodwill impairment test is performed based on the recoverable amount of each cash-generating unit (CGU) (or each group of CGUs) to which goodwill is allocated.
The recoverable amount represents the higher of the fair value less costs to sell and the value in use. Fair value represents the best estimate of the amount obtainable from the sale, less costs to sell, in an arm’s-length transaction between knowledgeable and willing parties. The value in use is calculated using the most appropriate method, generally by discounting estimated future cash flows.
When the recoverable amount is less than the carrying amount, an impairment loss is recognized in the Combined Statement of Income for the year and is first recorded as a reduction of the goodwill allocated to the CGU (or group of CGUs) and then as a reduction of the other identifiable assets of the CGU (or group of CGUs) pro rata on the basis of their carrying amount in the unit. Nevertheless, the allocation of the impairment loss to the assets of the CGU (or group of CGUs) must not result in their carrying amount being lower than the highest of the following amounts: the fair value of the assets less costs to sell, their value in use, and zero. Goodwill impairment losses cannot be reversed.
INSURANCE CONTRACT LIABILITIES
LIFE AND HEALTH INSURANCE CONTRACT LIABILITIES
The calculation of the insurance contract liabilities of the life and health insurance subsidiaries requires that assumptions be made with respect to the timing of many factors such as death, disability, investment income, inflation, policy cancellations, expenses, income taxes, premiums, commissions and participating policyholders’ dividends as well as the amounts they represent. To predict underwriting experience, the life and health subsidiaries use best estimate assumptions. Some of these assumptions refer to events that are likely to occur in the distant future and they may need to be changed.
PROPERTY AND CASUALTY INSURANCE CONTRACT LIABILITIES
The calculation of the provisions for claims and adjustment expenses related to the property and casualty insurance subsidiaries’ insurance policies takes into consideration assumptions based on characteristics of the business lines, settlement history and other relevant factors. The estimating methods used to make this calculation are based on best estimate assumptions, taking into account currently known data, which are regularly reviewed and updated.
The provisions for claims and adjustment expenses include individual loss estimates for each claim reported. In addition, a provision is established for adjustment expenses, changes in reported claims and incurred but not reported claims, based on previous experience and portfolio contracts. These estimates are regularly reviewed and updated, and any resulting adjustment is recognized in the Combined Statement of Income for the year in which the revision occurs. The provision for claims and adjustment expenses is reported on a discounted basis using the underlying asset rate, with a margin for adverse deviation.
Note 14, “Insurance and investment contract liabilities”, to the Combined Financial Statements provides information about accounting for the various insurance contract liabilities, the main assumptions used and the impact on results of changes to assumptions.
PROVISIONSProvisions are liabilities of uncertain timing or amount. A provision is recognized when Desjardins Group has an obligation (legal or constructive) as a result of a past event, the settlement of which should result in an outflow of resources embodying economic benefits, and when a reliable estimate can be made of the amount of the obligation. The amount of the obligation is discounted where the effect of the time value of money is material.
Provisions are based on management’s best estimate of the amounts required to settle the obligation on the reporting date, taking into account the relevant risks and uncertainties. As these estimates are forward-looking in nature, management must use its judgment to forecast the timing and amount of future cash flows. Actual results may differ significantly from these forecasts.
Charges to and reversals of provisions are recognized in profit or loss under the items corresponding to the nature of the future expenditures covered.

92 2012 DESJARDINS GROUP ANNUAL REPORT – MANAGEMENT’S DISCUSSION AND ANALYSIS
CONTINGENT LIABILITIESIn the normal course of its business operations, Desjardins Group is involved in various litigation matters and lawsuits relating to its various products, services, investments and other activities.
It is not currently possible to determine the outcome of some of such litigation matters and lawsuits, the timing of such outcome as well as the possible impact on Desjardins Group’s financial position. In management’s opinion, the fair value of the contingent liabilities resulting from such litigation matters and lawsuits, to the extent that it can be measured, could have an impact on Desjardins Group’s profit or loss for a specific period, but would not have a significant adverse impact on Desjardins Group’s combined financial position.
Additional information about contingent liabilities is presented in Note 27, “Commitments, guarantees and contingent liabilities”, to the Combined Financial Statements.
DERIVATIVE FINANCIAL INSTRUMENTS AND HEDGING ACTIVITIESDerivative financial instruments are financial contracts whose value depends on assets, interest rates, foreign exchange rates and other financial indexes. The vast majority of derivative financial instruments are negotiated by mutual agreement between Desjardins Group and the counterparty and include forward exchange contracts, currency swaps, interest rate swaps, credit default swaps, total return swaps, forward rate agreements, and currency, interest rate and stock index options. Other transactions are carried out as part of regulated trades and mainly consist of futures.
Derivative financial instruments, including embedded derivatives which are required to be recognized separately, are recognized on the Combined Balance Sheets at fair value.
Desjardins Group uses derivative financial instruments for trading purposes or for asset/liability management purposes. Derivative financial instruments held for trading purposes are used to meet the needs of members and clients, and to allow Desjardins Group to generate income on its own trading activities. Derivative financial instruments held for asset/liability management purposes are used to manage current and expected risks related to market risk. These instruments enable Desjardins Group to transfer, manage or reduce the interest rate and foreign currency exposures of assets and liabilities recorded in the Combined Balance Sheets, as well as firm commitments and forecasted transactions.
When derivative financial instruments are used to manage assets and liabilities, Desjardins Group must determine, for each derivative, whether or not hedge accounting is appropriate. To qualify for hedge accounting, a hedging relationship must be designated and documented at its inception. Such documentation must address the specific strategy for managing risk, the asset, liability or cash flows that are being hedged as well as the measure of hedge effectiveness. Consequently, the effectiveness of each hedging relationship must be assessed, regularly and on an individual basis, to determine with reasonable assurance whether the relationship is effective and will continue to be effective. The derivative financial instrument must prove highly effective to offset changes in the fair value or the cash flows of the hedged item attributable to the risk being hedged.
Additional information about derivative financial instruments and hedging activities is presented in Note 17, “Derivative financial instruments and hedging activities”, to the Combined Financial Statements.
INCOME TAXES ON SURPLUS EARNINGSThe income tax expense on surplus earnings comprises the current tax expense and the deferred tax expense. Income taxes on surplus earnings are recognized in the Combined Statements of Income unless they relate to items that were recognized outside profit or loss directly in the Combined Statements of Comprehensive Income or the Combined Statements of Changes in Equity. In such case, income taxes on surplus earnings are also not recognized outside profit or loss.
The calculation of income taxes on surplus earnings is based on the expected tax treatment of transactions. To determine the current and deferred portions of income taxes on surplus earnings, assumptions must be made concerning the dates on which deferred income tax assets and liabilities will be reversed. If Desjardins Group’s interpretation differs from that of taxation authorities or if the reversal dates do not correspond with the forecasted dates, the provision for income taxes on surplus earnings may increase or decrease in subsequent years.
Note 25, “Income taxes on surplus earnings”, to the Combined Financial Statements provides additional information on income taxes on surplus earnings.
PROVISION FOR MEMBER DIVIDENDSThe board of directors of each caisse recommends for approval the surplus earnings distribution plan at the annual general meeting of member, which is held in the four months following year-end. The amount of member dividends to be paid is part of this plan. The amount of the provision is estimated based on, among other things, the surplus earnings recorded for the year by the caisses, taking into consideration the

932012 DESJARDINS GROUP ANNUAL REPORT – MANAGEMENT’S DISCUSSION AND ANALYSIS
financial framework for the appropriation of surplus earnings in relation with the Desjardins Group Capitalization Plan, which sets capitalization targets. The difference between the amount of member dividends actually paid, in cash or in shares, following the general meetings held by the caisses, and the estimated amount of the provision is charged to combined profit or loss for the year in which the payments are made.
The allocation basis of member dividends depends on the interest recorded on loans and deposits, the average outstanding amount of Desjardins investment funds, guaranteed market-linked investments, Accord D loans obtained by the member through the caisse, and the various service charges collected from the member depending on the services used. The surplus earnings distribution plan takes into account a program under which members may elect to receive their dividends in the form of shares, in which case the value is greater than the equivalent dividends paid in cash. The caisses can pay out member dividends when legal and regulatory requirements have been met.
EMPLOYEE BENEFITSDesjardins Group offers a majority of its employees pension plans and supplemental pension plans, which provide pension benefits in excess of statutory limits. Defined benefit pension plans are plans for which Desjardins Group has formally committed to a level of benefits and therefore assumes actuarial and, when the plans are funded, investment risks. Benefits are calculated on the basis of the number of years of membership in the pension plans and take into consideration the average salary of the employee’s five most highly paid years. Since the terms of the plans are such that future changes in salary levels will have an impact on the amount of future benefits, the cost of the benefits and the fair value of the defined benefit plan obligation are generally actuarially determined using the projected unit credit method. These calculations are made based on management’s best estimate assumptions primarily concerning the expected rate of return on the plans’ investments and the plan obligation discount rate, and also, but to a lesser extent, salary increases, the retirement age of employees, the mortality rate and the rate of increase in pension benefits. A complete actuarial valuation is performed each year by a qualified actuary.
Actuarial gains (losses) result from the difference between the actual return on pension plan assets and the expected return for funded plans, the changes made to the actuarial assumptions used to determine the defined benefit plan obligation and the experience gains or losses on this obligation. Any net actuarial gain or loss exceeding 10% of the greater of the value of the defined benefit plan obligation and the fair value of plan assets at the end of the previous year is amortized over the expected average remaining working lives of the plan members.
Defined benefit plan assets or liabilities correspond to the present value of the obligation of these plans less the unrecognized past service cost, the fair value of pension plan assets and unamortized actuarial losses, plus unamortized actuarial gains. The value of any asset is limited to the total of actuarial losses, the unrecognized past service costs and the present value of any economic benefits available in the form of refunds from the plans or reductions in future contributions to the pension plans.
Note 26, “Defined benefit plans”, to the Combined Financial Statements provides further information on the recognition of defined benefit plans and on the sensitivity of the key assumptions.
SECTION 5.5
FUTURE ACCOUNTING CHANGESAccounting standards that have been issued but are not yet effective are listed below. Regulatory authorities have also stated that early adoption of these standards will not be permitted.
DATE OF APPLICATION: JANUARY 1, 2013
IFRS 10, “CONSOLIDATED FINANCIAL STATEMENTS”
In May 2011, the IASB issued IFRS 10, “Consolidated Financial Statements”, which defines the principle of control and establishes that control serves as the basis to determine which entities are included in the scope of consolidation. This new standard supersedes the requirements on consolidated financial statements included in IAS 27, “Consolidated and Separate Financial Statements”, and SIC 12, “Consolidation – Special Purpose Entities”.
Desjardins Group is currently assessing the impact of the adoption of this new standard, which must be applied retrospectively.

94 2012 DESJARDINS GROUP ANNUAL REPORT – MANAGEMENT’S DISCUSSION AND ANALYSIS
IFRS 11, “JOINT ARRANGEMENTS”
In May 2011, the IASB issued IFRS 11, “Joint Arrangements”, which supersedes IAS 31, “Interests in Joint Ventures”, and SIC 13, “Jointly Controlled Entities – Non-Monetary Contributions by Venturers”. This standard establishes principles for accounting for two types of joint arrangements, namely joint operations and joint ventures, and eliminates the possibility of recognizing joint ventures using the proportionate consolidation method.
The adoption of this new standard will have no impact on Desjardins Group since interests in joint ventures are already recognized using the equity method. This new standard must be applied retrospectively.
IFRS 12, “DISCLOSURE OF INTERESTS IN OTHER ENTITIES”
In May 2011, the IASB issued IFRS 12, “Disclosure of Interests in Other Entities”, which expands disclosure requirements for interests held by an entity in subsidiaries, joint arrangements, associates, and unconsolidated structured entities. Some of the disclosures were already required by the current standards, while others are new, such as disclosures about significant judgments and assumptions the entity has made in determining the nature of its interests in another entity as well as the nature and extent of, and risks associated with, its interests in other entities.
IFRS 12 is a new presentation standard that will have no impact on Desjardins Group’s results or financial position. It must be applied retrospectively.
IFRS 13, “FAIR VALUE MEASUREMENT”
In May 2011, the IASB issued IFRS 13, “Fair Value Measurement”, which defines fair value and sets out a single framework for measuring the fair value of all transactions and balances for which IFRS require or permit fair value measurement. This standard aims at improving the consistency between the various fair value concepts defined in various existing standards. In addition, IFRS 13 carries forward disclosure requirements concerning the fair value of financial instruments and expands the scope to all items measured at fair value.
With respect to fair value measurements, Desjardins Group does not expect the adoption of this new standard, which is applicable prospectively, to have a significant impact.
IAS 1, “PRESENTATION OF FINANCIAL STATEMENTS”
In June 2011, the IASB issued amendments to IAS 1, “Presentation of Financial Statements”, which improve the presentation of items of other comprehensive income. The amendments require the presentation by nature of items of other comprehensive income by distinguishing those that will be reclassified to the statement of income in a subsequent period from those that will not.
IAS 1 is a presentation standard whose objective is to provide information to enable users to better understand financial statements, among other things. The amendments to this standard will have no impact on Desjardins Group’s results or financial position. They must be applied retrospectively.
IAS 19, “EMPLOYEE BENEFITS”
In June 2011, the IASB issued an amended version of IAS 19, “Employee Benefits” (IAS 19(R)), which requires that the funding status of a defined benefit plan be entirely reflected in the Combined Balance Sheets. This change therefore eliminates the option to defer the recognition of actuarial gains and losses, known as the “corridor approach”. All actuarial gains and losses will now be recognized immediately in other comprehensive income. The calculation of the interest cost recognized in the Combined Statements of Income is also amended. This interest cost will now be calculated by multiplying the net defined benefit plan asset or liability by the rate used to discount the obligation, and the difference between the actual return on plan assets and the amount recognized as interest cost will be recognized in other comprehensive income. In addition, all past service costs will now be directly recognized in profit or loss when they occur.
Furthermore, the risk-sharing features between employers and employees for defined benefit plans will now be taken into account when determining the liability to be recognized in the Combined Balance Sheets and the expense to be recognized in the Combined Statements of Income. The presentation and recognition of changes in the defined benefit plan obligation and plan assets will therefore be modified, and disclosures about the characteristics of defined benefit plans and the risks to which an entity is exposed through its participation in such plans will be enhanced. Desjardins Group will have to apply this new standard retrospectively.
Accordingly, the main impact of Desjardins Group adopting IAS 19(R) will be the recognition of unamortized actuarial losses and unrecognized past service cost under “Defined benefit plan liabilities” in the Combined Balance Sheets. This will result in a decrease in “Undistributed surplus earnings” (for more information, refer to Note 26, “Defined benefits plans”, to the Combined Financial Statements).

952012 DESJARDINS GROUP ANNUAL REPORT – MANAGEMENT’S DISCUSSION AND ANALYSIS
In addition, taking into account the risk-sharing features between employers and employees for the main group pension plan will result in a decrease in “Defined benefit plan liabilities” and a corresponding increase in “Undistributed surplus earnings”. Desjardins Group is currently assessing the impact of the changes related to risk sharing. The initial impact of these amendments on capital ratios could be deferred and amortized on a straight-line basis over the period from January 1, 2013, to December 31, 2014, depending on whether Desjardins Group elects to use the transitional provision stipulated for that purpose by the regulatory authorities.
IFRS 7, “FINANCIAL INSTRUMENTS: DISCLOSURES” – OFFSETTING FINANCIAL ASSETS AND FINANCIAL LIABILITIES
In December 2011, the IASB issued amendments to IFRS 7, “Financial Instruments: Disclosures”. These amendments improve the disclosure requirements with respect to offsetting of financial assets and liabilities. The objective of these amendments is to help users of financial statements better evaluate the impact of netting agreements on the financial position of an entity and understand how an entity manages the credit risk associated with such agreements.
IFRS 7 is a presentation standard whose objective is to provide disclosures to enable the users, among other things, to better understand and evaluate the significance of financial instruments for the entity’s financial position and performance. Since the amendments to this standard specifically concern disclosures, they have no impact on Desjardins Group’s results or financial position. They must be applied retrospectively.
ANNUAL IMPROVEMENTS
In May 2012, the IASB issued amendments to several standards as part of its annual improvement process. Except for the amendment to IAS 32, “Financial Instruments: Presentation”, these amendments are minor and will have no impact on Desjardins Group’s results or financial position.
The amendment to IAS 32 specifies that the income tax consequences of dividends and remuneration on capital stock should now be recognized in accordance with IAS 12, “Income Taxes”. Therefore, when certain conditions are met, the income tax consequences of dividends and remuneration on capital stock will have to be presented in profit or loss rather than in equity. This amendment will be applied retrospectively.
Accordingly, there will be no impact on Desjardins Group’s financial position as at January 1 and December 31, 2012. However, certain comparative figures will have to be reclassified from the Combined Statement of Changes in Equity to the Combined Statement of Income for the year ended December 31, 2012. “Income tax recovery on remuneration of permanent shares”, in the Combined Statement of Changes in Equity, will decrease by $25 million, and “Income taxes on surplus earnings”, in the Combined Statement of Income, will decrease by a corresponding amount.
DATE OF APPLICATION: JANUARY 1, 2014
IAS 32, “FINANCIAL INSTRUMENTS: PRESENTATION”
In December 2011, the IASB issued amendments to IAS 32, “Financial Instruments: Presentation”, to clarify the criteria for offsetting a financial asset and a financial liability.
Desjardins Group is currently assessing the impact of the amendments made to this standard, which must be applied retrospectively.
DATE OF APPLICATION: JANUARY 1, 2015
IFRS 9, “FINANCIAL INSTRUMENTS”
The IASB issued in November 2009 and amended in October 2010 the first phase of a project that will replace IAS 39, “Financial Instruments: Recognition and Measurement”. This standard defines a new way of classifying and measuring financial assets and liabilities. Financial assets will be classified in two categories (amortized cost and fair value through profit or loss) based on the entity’s business model for managing its financial assets and the contractual cash flow characteristics of the financial assets. However, a new exposure draft issued in November 2012 proposes the introduction of a third financial instrument category for debt securities: fair value through other comprehensive income.
Financial liabilities will be classified in the same categories as those defined in IAS 39, but measurement of financial liabilities under the fair value option has been modified.
The impairment of financial asset methodology and hedging activities will be covered in future phases.
Desjardins Group is currently assessing the impact of the adoption of IFRS 9. The application of all phases of this standard is expected to be prospective.
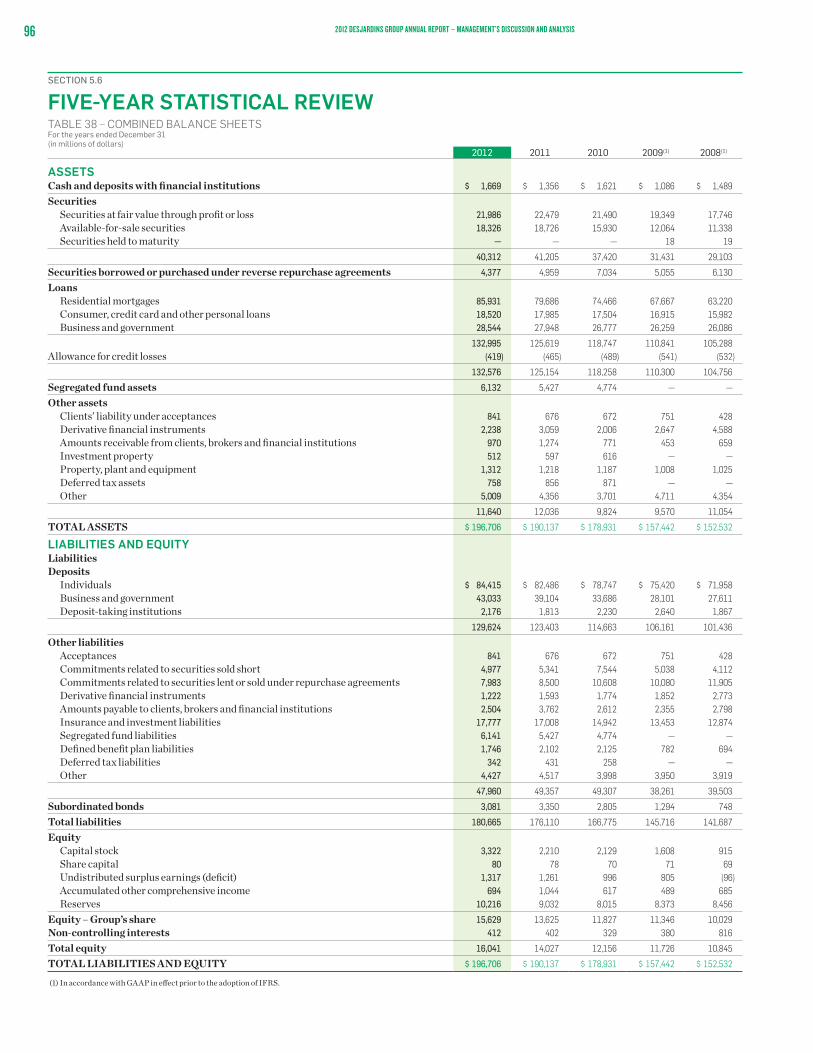
96 2012 DESJARDINS GROUP ANNUAL REPORT – MANAGEMENT’S DISCUSSION AND ANALYSIS
SECTION 5.6
FIVE-YEAR STATISTICAL REVIEWTABLE 38 – COMBINED BALANCE SHEETS For the years ended December 31 (in millions of dollars)
2012 2011 2010 2009(1) 2008(1)
ASSETSCash and deposits with financial institutions $ 1,669 $ 1,356 $ 1,621 $ 1,086 $ 1,489
Securities Securities at fair value through profit or loss 21,986 22,479 21,490 19,349 17,746 Available-for-sale securities 18,326 18,726 15,930 12,064 11,338 Securities held to maturity — — — 18 19
40,312 41,205 37,420 31,431 29,103
Securities borrowed or purchased under reverse repurchase agreements 4,377 4,959 7,034 5,055 6,130
Loans Residential mortgages 85,931 79,686 74,466 67,667 63,220 Consumer, credit card and other personal loans 18,520 17,985 17,504 16,915 15,982 Business and government 28,544 27,948 26,777 26,259 26,086
132,995 125,619 118,747 110,841 105,288Allowance for credit losses (419) (465) (489) (541) (532)
132,576 125,154 118,258 110,300 104,756
Segregated fund assets 6,132 5,427 4,774 — —
Other assets Clients’ liability under acceptances 841 676 672 751 428 Derivative financial instruments 2,238 3,059 2,006 2,647 4,588 Amounts receivable from clients, brokers and financial institutions 970 1,274 771 453 659 Investment property 512 597 616 — — Property, plant and equipment 1,312 1,218 1,187 1,008 1,025 Deferred tax assets 758 856 871 — — Other 5,009 4,356 3,701 4,711 4,354
11,640 12,036 9,824 9,570 11,054
TOTAL ASSETS $ 196,706 $ 190,137 $ 178,931 $ 157,442 $ 152,532
LIABILITIES AND EQUITYLiabilities Deposits Individuals $ 84,415 $ 82,486 $ 78,747 $ 75,420 $ 71,958 Business and government 43,033 39,104 33,686 28,101 27,611 Deposit-taking institutions 2,176 1,813 2,230 2,640 1,867
129,624 123,403 114,663 106,161 101,436
Other liabilities Acceptances 841 676 672 751 428 Commitments related to securities sold short 4,977 5,341 7,544 5,038 4,112 Commitments related to securities lent or sold under repurchase agreements 7,983 8,500 10,608 10,080 11,905 Derivative financial instruments 1,222 1,593 1,774 1,852 2,773 Amounts payable to clients, brokers and financial institutions 2,504 3,762 2,612 2,355 2,798 Insurance and investment liabilities 17,777 17,008 14,942 13,453 12,874 Segregated fund liabilities 6,141 5,427 4,774 — — Defined benefit plan liabilities 1,746 2,102 2,125 782 694 Deferred tax liabilities 342 431 258 — — Other 4,427 4,517 3,998 3,950 3,919
47,960 49,357 49,307 38,261 39,503
Subordinated bonds 3,081 3,350 2,805 1,294 748
Total liabilities 180,665 176,110 166,775 145,716 141,687
Equity Capital stock 3,322 2,210 2,129 1,608 915 Share capital 80 78 70 71 69 Undistributed surplus earnings (deficit) 1,317 1,261 996 805 (96) Accumulated other comprehensive income 694 1,044 617 489 685 Reserves 10,216 9,032 8,015 8,373 8,456
Equity – Group’s share 15,629 13,625 11,827 11,346 10,029Non-controlling interests 412 402 329 380 816
Total equity 16,041 14,027 12,156 11,726 10,845
TOTAL LIABILITIES AND EQUITY $ 196,706 $ 190,137 $ 178,931 $ 157,442 $ 152,532
(1) In accordance with GAAP in effect prior to the adoption of IFRS.

972012 DESJARDINS GROUP ANNUAL REPORT – MANAGEMENT’S DISCUSSION AND ANALYSIS
TABLE 39 – COMBINED STATEMENTS OF INCOME For the years ended December 31 (in millions of dollars)
2012 2011 2010 2009(1) 2008(1)
Interest income Loans $ 5,474 $ 5,462 $ 5,250 $ 5,068 $ 5,573 Securities 391 428 439 438 474
5,865 5,890 5,689 5,506 6,047
Interest expense Deposits 1,851 1,818 1,692 1,920 2,590 Subordinated bonds and other 166 151 105 64 39
2,017 1,969 1,797 1,984 2,629
Net interest income 3,848 3,921 3,892 3,522 3,418
Net premiums 5,126 4,851 4,360 4,247 4,131
Other operating income(2)
Deposit and payment service charges 499 512 535 513 497 Lending fees and credit card service revenues 517 483 451 444 410 Brokerage, investment fund and trust services 700 676 656 581 617 Other 610 493 240 343 467
2,326 2,164 1,882 1,881 1,991
Operating income(2) 11,300 10,936 10,134 9,650 9,540
Investment income(2)
Net income (loss) on securities at fair value through profit or loss 674 1,706 984 666 (1,001) Net income (loss) on available-for-sale securities 268 299 174 79 (405) Net income from other investments 236 264 251 275 239
1,178 2,269 1,409 1,020 (1,167)
Total income 12,478 13,205 11,543 10,670 8,373
Provision for credit losses 241 237 203 260 223
Claims, benefits, annuities and changes in insurance and investment contract liabilities 4,397 5,292 4,136 3,758 3,144
Non-interest expense Salaries and fringe benefits 2,882 2,782 2,601 2,423 2,250 Premises, equipment and furniture, including depreciation 415 428 425 415 393 Service agreements and outsourcing 228 270 363 371 322 Communications 271 247 258 237 252 Restructuring expenses — — — 101 — Other 1,964 1,896 1,733 1,602 1,588
5,760 5,623 5,380 5,149 4,805
Operating surplus earnings 2,080 2,053 1,824 1,503 201
Income taxes on surplus earnings 489 471 438 412 113
Surplus earnings before member dividends 1,591 1,582 1,386 1,091 88
Provision for member dividends 279 320 299 311 215 Tax recovery on provision for member dividends (73) (90) (81) (98) (62)
Net surplus earnings (deficit) for the year after member dividends $ 1,385 $ 1,352 $ 1,168 $ 878 $ (65)
Of which: Group’s share $ 1,310 $ 1,314 $ 1,153 $ 861 $ (64) Non-controlling interests’ share 75 38 15 17 (1)
(1) In accordance with GAAP in effect prior to the adoption of IFRS.(2) See “Basis of presentation of financial information” on page 15.
TABLE 40 – SELECTED FINANCIAL MEASURES For the years ended December 31 (in millions of dollars and as a percentage)
2012 2011 2010 2009(1) 2008(1)
Tier 1 capital ratio 16.8% 17.3% 17.7% 15.8% 13.6%Total capital ratio 19.3 19.3 18.7 15.8 13.0Return on equity 10.4 12.2 12.2 10.2 0.9Productivity index 71.3 71.1 72.6 74.5 91.9Gross impaired loans as a percentage of gross loans 0.35 0.41 0.43 0.46 0.40Average assets $ 195,384 $ 186,232 $ 174,132 $ 158,689 $ 149,722Average net loans 128,683 121,279 114,323 107,229 99,764Average deposits 127,409 119,424 111,020 104,584 99,288
(1) In accordance with GAAP in effect prior to the adoption of IFRS.
98
TABLE OF CONTENTS
REPORTS Annual report by the Audit and Inspection Commission 99 Management’s responsibility for financial reporting 101 Independent auditor’s report 102
COMBINED FINANCIAL STATEMENTS Combined Balance Sheets 103 Combined Statements of Income 104 Combined Statements of Comprehensive Income 105 Combined Statements of Changes in Equity 106 Combined Statements of Cash Flows 107
NOTES TO THE COMBINED FINANCIAL STATEMENTS Note 1 – Information on Desjardins Group 108 Note 2 – Significant accounting policies 108 Note 3 – Future accounting changes 126 Note 4 – Carrying amount of financial instruments 129 Note 5 – Fair value of financial instruments 131 Note 6 – Securities 134 Note 7 – Loans and allowance for credit losses 138 Note 8 – Securitization and other transferred financial assets 139 Note 9 – Segregated funds 140 Note 10 – Property, plant and equipment and investment property 142 Note 11 – Other assets – Other 143 Note 12 – Deposits 143 Note 13 – Covered bonds 143 Note 14 – Insurance and investment contract liabilities 144 Note 15 – Other liabilities – Other 152 Note 16 – Subordinated bonds 152 Note 17 – Derivative financial instruments and hedging activities 153 Note 18 – Significant acquisitions and disposals 160 Note 19 – Capital stock 162 Note 20 – Share capital 162 Note 21 – Accumulated other comprehensive income 163 Note 22 – Non-controlling interests 164 Note 23 – Net income (loss) on securities at fair value through profit or loss 164 Note 24 – Other income – Other and Non-interest expense – Other 165 Note 25 – Income taxes on surplus earnings 165 Note 26 – Defined benefit plans 167 Note 27 – Commitments, guarantees and contingent liabilities 170 Note 28 – Leases 173 Note 29 – Financial instrument risk management 173 Note 30 – Interest rate sensitivity and maturity matching 174 Note 31 – Capital management 176 Note 32 – Segmented information 178 Note 33 – Related party disclosures 181 Note 34 – Subsequent event 182
DESJARDINS GROUP COMBINED FINANCIAL STATEMENTS
992012 DESJARDINS GROUP ANNUAL REPORT – COMBINED FINANCIAL STATEMENTS
The role of the Audit and Inspection Commission (AIC) is to support the Board of Directors of the Fédération des caisses Desjardins du Québec (the Federation) in its oversight responsibilities for Desjardins Group. Its mandate consists primarily of analyzing the financial statements, their presentation and the quality of the accounting principles adopted, risk management relating to financial reporting, internal control systems, internal audit and external independent audit processes, the procedures applied to these audits, and the management of regulatory compliance.
The AIC reviews Desjardins Group’s interim and annual financial statements, related press releases, and the interim and annual versions of the Management’s Discussion and Analysis. The AIC ensures that management has designed and implemented an effective internal control system with respect to the organization’s business processes, financial reporting, asset protection, fraud detection, and regulatory compliance. It also ensures that management has set up systems to manage the main risks that may influence the financial results of the caisse network and Desjardins Group. The AIC reviews the information resulting from this financial governance process on a quarterly basis.
Also examined are files that document the caisse network’s transformation, including the financial position of the caisses, particular situations detected in the caisses, any follow-up completed, credit losses and how certain accounting policies and practices, such as the management method for the collective allowance, are applied. The AIC ensures that the action plan for caisse network audits and inspections conducted by the Desjardins Group Monitoring Office is carried out. It also reviews comment letters, inspection reports including corrective actions and any follow-up performed. At the end of the fiscal year, the AIC reviews the Monitoring Office’s annual report, which presents the results of the year’s oversight activities for the caisse network as well as the highlights of the fiscal year.
The external independent auditor is under the authority of the AIC. To fulfil its responsibilities in this regard, the AIC ensures and preserves the external independent auditor’s independence by authorizing all its services unrelated to auditing, by recommending its appointment or the continuance of its engagement, by setting and recommending auditor compensation and by conducting annual auditor evaluations. In addition, the AIC supervises the work of the external independent auditor and examines its audit proposal, its mandate, its annual strategy, its reports, its letter to management, and management’s comments. Desjardins Group has a policy that governs the awarding of contracts for related services. This policy addresses the following issues: (a) services that can or cannot be performed by the external independent auditor, (b) governance procedures that must be followed before mandates can be awarded, and (c) responsibilities of the key players involved. Accordingly, the AIC receives a quarterly report on the contracts awarded to the external independent auditor by each of the Desjardins Group entities.
The AIC ensures the independence of internal audit, for which the Desjardins Group Monitoring Office is responsible. The AIC analyzes the annual internal audit strategy as well as the internal audit team’s responsibilities, performance, objectivity and staffing. The AIC reviews the internal audit team’s summary reports and, if necessary, takes appropriate follow-up action. When doing so, the AIC meets with the head of internal audit at Desjardins Group to discuss any major issues submitted to management.
With respect to relations with the Autorité des marchés financiers (AMF), the AIC reviews and follows up on the inspection reports issued by the AMF, as well as the financial reports that are submitted each quarter to the AMF.
ANNUAL REPORT BY THE AUDIT AND INSPECTION COMMISSION

100 2012 DESJARDINS GROUP ANNUAL REPORT – COMBINED FINANCIAL STATEMENTS
The AIC meets privately with the external independent auditor, the Senior Executive Vice-President of Desjardins Group and General Manager of the Federation, the Senior Vice-President of Finance and Chief Financial Officer of Desjardins Group, the Chief Monitoring Officer of Desjardins Group and AMF representatives. It reports to the Board of Directors on a quarterly basis and, if necessary, makes recommendations. Lastly, to comply with sound corporate governance practices, the AIC annually reviews the degree of efficiency and effectiveness with which it has performed the tasks set out in its charter.
The AIC is made up of five independent directors and four observers. These observers are the chairs of the audit committees of Desjardins Financial Security Life Assurance Company, Desjardins General Insurance Group Inc. and Desjardins Securities Inc., and a caisse general manager who sits on the Federation’s Board of Directors. None of the AIC members receives compensation from Desjardins Group, either directly or indirectly, for services other than those rendered as a member of the Board of Directors of the Federation or other Desjardins Group entity, including committees.
All members of the AIC possess the knowledge required to read and interpret the financial statements of a financial institution, according to the criteria established in the AIC’s charter. With significant changes being made to requirements in terms of accounting and financial disclosure, the members of the AIC participated in a number of training activities during the year. These activities focused in particular on the new International Financial Reporting Standards (IFRS) which took effect in January 2011 and on the impact of changes to the normative and regulatory frameworks to which corporate governance is subject.
The AIC held 13 meetings and its members attended two training sessions in fiscal 2012. During the year, Andrée Lafortune, FCPA, FCA, left the Commission and Benoît Turcotte became a member. As at December 31, the five independent directors who are members of the AIC are Annie P. Bélanger, Donat Boulerice, André Gagné, CPA, CGA, Pierre Levasseur and Benoît Turcotte. The observers are Serge Hamelin, Roger Desrosiers, FCPA, FCA, Jean-Yves Leblanc and Alain Dumas, FCPA, FCA.
ANDRÉ GAGNÉ, cpa, cgaChair
Montreal, Quebec February 19, 2013
ANNUAL REPORT BY THE AUDIT AND INSPECTION COMMISSION (CONTINUED)
1012012 DESJARDINS GROUP ANNUAL REPORT – COMBINED FINANCIAL STATEMENTS
The Combined Financial Statements of Desjardins Group and all information contained in this Management’s Discussion and Analysis are the responsibility of the management of the Fédération des caisses Desjardins du Québec (the Federation), whose duty is to ensure reporting integrity and accuracy.
The Combined Financial Statements have been prepared in accordance with International Financial Reporting Standards and in accordance with the accounting requirements of the Autorité des marchés financiers, as applicable. The Combined Financial Statements necessarily contain amounts established by management based on estimates which it deems fair and reasonable. These estimates include valuations of the insurance and investment contract liabilities performed by the actuaries of the insurance segments. All financial information in the Annual Report is consistent with the audited Combined Financial Statements.
Federation management is responsible for the accuracy of Desjardins Group’s Combined Financial Statements and related information, as well as the accounting systems from which they are derived, which it ensures through controls over transactions and related accounting practices. The controls in place include an organizational structure that ensures effective segregation of duties, a code of ethics, hiring and training standards, policies and procedure manuals, as well as the application of regularly updated control methods for adequate supervision of operations. The internal control system is backed by a professional team from the Desjardins Group Monitoring Office with full and unrestricted access to the Audit and Inspection Commission. Management has also implemented a financial governance structure based on best market practices to ensure the effectiveness of the disclosure controls and procedures over the financial information presented in the annual and interim filings of Desjardins Group.
The Autorité des marchés financiers conducts an inspection of certain components of Desjardins Group under its authority on a regular basis.
The Board of Directors of the Federation approves the financial information contained in the Desjardins Group Annual Report by relying on the recommendation of the Audit and Inspection Commission (AIC). To this effect, the AIC is mandated by the Board to review the Combined Financial Statements of Desjardins Group as well as the Management’s Discussion and Analysis. In addition, the AIC, comprising directors who are neither management nor employees of Desjardins Group, exercises an oversight role to ensure that management has developed and implemented adequate control procedures and systems to ensure quality financial reporting with all the required disclosures within the required timeframes.
The Combined Financial Statements have been audited by the independent auditor appointed by the Board of Directors, PricewaterhouseCoopers LLP, whose report follows. The independent auditor may meet with the members of the AIC at any time to discuss its audit and any questions related thereto, notably the integrity of the financial information provided and the quality of internal control systems.
MONIQUE F. LEROUX, c.m., fcpa, fcaChair of the Board, President and Chief Executive Officer Desjardins Group
DANIEL DUPUIS, cpa, ca Senior Vice-President, Finance and Chief Financial Officer Desjardins Group
Lévis, QuebecFebruary 21, 2013
MANAGEMENT’S RESPONSIBILITY FOR FINANCIAL REPORTING
102 2012 DESJARDINS GROUP ANNUAL REPORT – COMBINED FINANCIAL STATEMENTS
TO THE MEMBERS OF THE FÉDÉRATION DES CAISSES DESJARDINS DU QUÉBECWe have audited the accompanying combined financial statements of Desjardins Group, which comprise the combined balance sheets as at December 31, 2012 and 2011, and the combined statements of income, comprehensive income, changes in equity and cash flows for the years ended December 31, 2012 and 2011, and the accompanying notes, including a summary of significant accounting policies and other explanatory information.
MANAGEMENT’S RESPONSIBILITY FOR THE COMBINED FINANCIAL STATEMENTS
Management is responsible for the preparation and fair presentation of these combined financial statements in accordance with International Financial Reporting Standards (IFRS), and for such internal control as management determines is necessary to enable the preparation of combined financial statements that are free from material misstatement, whether due to fraud or error.
AUDITOR’S RESPONSIBILITY
Our responsibility is to express an opinion on the combined financial statements based on our audits. We conducted our audits in accordance with Canadian generally accepted auditing standards. Those standards require that we comply with ethical requirements and plan and perform the audit to obtain reasonable assurance about whether the combined financial statements are free from material misstatement.
An audit involves performing procedures to obtain audit evidence about the amounts and disclosures in the combined financial statements. The procedures selected depend on the auditor’s judgment, including the assessment of the risks of material misstatement of the combined financial statements, whether due to fraud or error. In making those risk assessments, the auditor considers internal control relevant to the entity’s preparation and fair presentation of the combined financial statements in order to design audit procedures that are appropriate in the circumstances, but not for the purpose of expressing an opinion on the effectiveness of the entity’s internal control. An audit also includes evaluating the appropriateness of accounting policies used and the reasonableness of accounting estimates made by management, as well as evaluating the overall presentation of the combined financial statements.
We believe that the audit evidence we have obtained in our audits is sufficient and appropriate to provide a basis for our audit opinion.
OPINION
In our opinion, the combined financial statements present fairly, in all material respects, the financial position of Desjardins Group as at December 31, 2012 and 2011, and its financial performance and its cash flows for the years ended December 31, 2012 and 2011 in accordance with International Financial Reporting Standards.
PRICEWATERHOUSECOOPERS LLPCPA auditor, CA, public accountancy permit No. A115888Montreal, Quebec, February 21, 2013
INDEPENDENT AUDITOR’S REPORT

1032012 DESJARDINS GROUP ANNUAL REPORT – COMBINED FINANCIAL STATEMENTS
COMBINED BALANCE SHEETS(in millions of Canadian dollars)
As at December 31,
2012
As at December 31,
2011
ASSETSCash and deposits with financial institutions $ 1,669 $ 1,356
Securities Notes 6 and 8 Securities at fair value through profit or loss 21,986 22,479 Available-for-sale securities 18,326 18,726
40,312 41,205
Securities borrowed or purchased under reverse repurchase agreements 4,377 4,959
Loans Notes 7 and 8 Residential mortgages 85,931 79,686 Consumer, credit card and other personal loans 18,520 17,985 Business and government 28,544 27,948
132,995 125,619Allowance for credit losses Note 7 (419) (465)
132,576 125,154
Segregated fund assets Note 9 6,132 5,427
Other assets Clients’ liability under acceptances 841 676 Derivative financial instruments Note 17 2,238 3,059 Amounts receivable from clients, brokers and financial institutions 970 1,274 Investment property Note 10 512 597 Property, plant and equipment Note 10 1,312 1,218 Deferred tax assets Note 25 758 856 Other Note 11 5,009 4,356
11,640 12,036
TOTAL ASSETS $ 196,706 $ 190,137
LIABILITIES AND EQUITYLiabilitiesDeposits Note 12 Individuals $ 84,415 $ 82,486 Business and government 43,033 39,104 Deposit-taking institutions 2,176 1,813
129,624 123,403
Other liabilities Acceptances 841 676 Commitments related to securities sold short 4,977 5,341 Commitments related to securities lent or sold under repurchase agreements 7,983 8,500 Derivative financial instruments Note 17 1,222 1,593 Amounts payable to clients, brokers and financial institutions 2,504 3,762 Insurance and investment contract liabilities Note 14 17,777 17,008 Segregated fund liabilities Note 9 6,141 5,427 Defined benefit plan liabilities Note 26 1,746 2,102 Deferred tax liabilities Note 25 342 431 Other Note 15 4,427 4,517
47,960 49,357
Subordinated bonds Note 16 3,081 3,350
Total liabilities 180,665 176,110
Equity Capital stock Note 19 3,322 2,210 Share capital Note 20 80 78 Undistributed surplus earnings 1,317 1,261 Accumulated other comprehensive income Note 21 694 1,044 Reserves 10,216 9,032
Equity – Group’s share 15,629 13,625
Non-controlling interests Note 22 412 402
Total equity 16,041 14,027
TOTAL LIABILITIES AND EQUITY $ 196,706 $ 190,137
The accompanying notes are an integral part of the Combined Financial Statements.
On behalf of the Board of Directors of the Fédération des caisses Desjardins du Québec, MONIQUE F. LEROUX, c.m., fcpa, fca DENIS PARÉ, ll.l., d.d.n.Chair of the Board Vice-Chair of the Board

104 2012 DESJARDINS GROUP ANNUAL REPORT – COMBINED FINANCIAL STATEMENTS
COMBINED STATEMENTS OF INCOMEFor the years ended December 31 (in millions of Canadian dollars)
2012 2011
Interest income Loans $ 5,474 $ 5,462 Securities 391 428
5,865 5,890
Interest expense Deposits 1,851 1,818 Subordinated bonds and other 166 151
2,017 1,969
Net interest income 3,848 3,921
Net premiums Note 14 5,126 4,851
Other income Deposit and payment service charges 499 512 Lending fees and credit card service revenues 517 483 Brokerage, investment fund and trust services 700 676 Net income on securities at fair value through profit or loss Note 23 674 1,706 Net income on available-for-sale securities 268 299 Net other investment income 236 264 Other Note 24 610 493
3,504 4,433
Total income 12,478 13,205
Provision for credit losses Note 7 241 237
Claims, benefits, annuities and changes in insurance and investment contract liabilities Note 14 4,397 5,292
Non-interest expense Salaries and fringe benefits 2,882 2,782 Premises, equipment and furniture, including depreciation 415 428 Service agreements and outsourcing 228 270 Communications 271 247 Other Note 24 1,964 1,896
5,760 5,623
Operating surplus earnings 2,080 2,053 Income taxes on surplus earnings Note 25 489 471
Surplus earnings before member dividends(1) 1,591 1,582 Provision for member dividends 279 320 Tax recovery on the provision for member dividends Note 25 (73) (90)
Net surplus earnings for the year after member dividends $ 1,385 $ 1,352
of which: Group’s share $ 1,310 $ 1,314 Non-controlling interests’ share Note 22 75 38
(1) The Group’s share of “Surplus earnings before member dividends” is presented in Note 32, “Segmented information”.The accompanying notes are an integral part of the Combined Financial Statements.

1052012 DESJARDINS GROUP ANNUAL REPORT – COMBINED FINANCIAL STATEMENTS
COMBINED STATEMENTS OF COMPREHENSIVE INCOMEFor the years ended December 31 (in millions of Canadian dollars)
2012 2011
Net surplus earnings for the year after member dividends $ 1,385 $ 1,352
Other comprehensive income, net of income taxes Note 25 Net unrealized gains on available-for-sale securities 46 245 Reclassification of gains on available-for-sale securities to the Combined Statements of Income (104) (138)
(58) 107
Net gains (losses) on derivative financial instruments designated as cash flow hedges (166) 424 Reclassification of gains on derivative financial instruments designated as cash flow hedges
to the Combined Statements of Income Note 17 (125) (105)
(291) 319
Total other comprehensive income (349) 426
Comprehensive income for the year $ 1,036 $ 1,778
of which: Group’s share $ 962 $ 1,742 Non-controlling interests’ share 74 36
The accompanying notes are an integral part of the Combined Financial Statements.

106 2012 DESJARDINS GROUP ANNUAL REPORT – COMBINED FINANCIAL STATEMENTS
COMBINED STATEMENTS OF CHANGES IN EQUITYFor the years ended December 31 (in millions of Canadian dollars)
Capital
Undistributed surplus
earnings
Accumulated other
compre hensive income
(Notes 18 and 21)
Reserves
Equity – Group’s share
Non-controlling interests(Notes 18
and 22)Total
equity
Capital stock
(Note 19)
Share capital
(Note 20)Stabilization
reserve
Reserve for future member
dividendsGeneral reserve
Total reserves
Balance as at December 31, 2010 $ 2,129 $ 70 $ 996 $ 617 $ 419 $ 446 $ 7,150 $ 8,015 $ 11,827 $ 329 $ 12,156
Net surplus earnings for the year after member dividends — — 1,314 — — — — — 1,314 38 1,352
Other comprehensive income for the year — — — 428 — — — — 428 (2) 426
Total comprehensive income for the year — — 1,314 428 — — — — 1,742 36 1,778
Net change in capital stock 81 — — — — — — — 81 — 81Issuance of share capital — 62 — — — — — — 62 14 76Redemption of share capital — (54) — — — — — — (54) — (54)Remuneration on
permanent shares — — (91) — — — — — (91) — (91)Income tax recovery
on remuneration on permanent shares — — 25 — — — — — 25 — 25
Dividends — — (2) — — — — — (2) (8) (10)Transfer from undistributed
surplus earnings (to reserves) — — (1,017) — 241 15 761 1,017 — — —Impact of acquisition and disposal — — — (1) — — — — (1) 73 72Other — — 36 — — — — — 36 (42) (6)
Balance as at December 31, 2011 $ 2,210 $ 78 $ 1,261 $ 1,044 $ 660 $ 461 $ 7,911 $ 9,032 $ 13,625 $ 402 $ 14,027
Net surplus earnings for the year after member dividends — — 1,310 — — — — — 1,310 75 1,385
Other comprehensive income for the year — — — (348) — — — — (348) (1) (349)
Total comprehensive income for the year — — 1,310 (348) — — — — 962 74 1,036
Issuance of F capital shares 1,026 — — — — — — — 1,026 — 1,026 F capital share issuance costs (1) — — — — — — — (1) — (1) Other net change in capital
stock 87 — — — — — — — 87 — 87 Issuance of share capital — 2 — — — — — — 2 — 2 Remuneration on permanent
shares — — (95) — — — — — (95) — (95)Income tax recovery
on remuneration on permanent shares — — 25 — — — — — 25 — 25
Redemption of share capital — — — — — — — — — (52) (52) Dividends — — (2) — — — — — (2) (6) (8)Transfer from undistributed
surplus earnings (to reserves) — — (1,184) — 151 20 1,013 1,184 — — —Other — — 2 (2) — — — — — (6) (6)
Balance as at December 31, 2012 $ 3,322 $ 80 $ 1,317 $ 694 $ 811 $ 481 $ 8,924 $ 10,216 $ 15,629 $ 412 $ 16,041
The accompanying notes are an integral part of the Combined Financial Statements.

1072012 DESJARDINS GROUP ANNUAL REPORT – COMBINED FINANCIAL STATEMENTS
COMBINED STATEMENTS OF CASH FLOWSFor the years ended December 31 (in millions of Canadian dollars)
2012 2011
Cash flows from (used in) operating activitiesOperating surplus earnings $ 2,080 $ 2,053Non-cash adjustments: Depreciation of property, plant and equipment and investment property 177 171 Net change in insurance and investment contract liabilities 769 1,959 Provision for credit losses 241 237 Net realized gains on available-for-sale securities (175) (168) Other 175 67Changes in operating assets and liabilities: Securities at fair value through profit or loss 493 (918) Securities borrowed or purchased under reverse repurchase agreements 582 2,075 Loans (7,663) (7,592) Derivative financial instruments, net amount 59 (874) Deposits 6,221 9,406 Commitments related to securities sold short (364) (2,203) Commitments related to securities lent or sold under repurchase agreements (517) (2,108) Other (1,823) 705Income taxes paid on surplus earnings (389) (281)Payment of member dividends (303) (298)
(437) 2,231
Cash flows from (used in) financing activitiesIssuance of subordinated bonds — 479Redemption of subordinated bonds (300) —Sale of debt securities and subordinated bonds to third parties on the market 28 63Issuance of F capital shares 1,026 —F capital share issuance costs (1) —Other net change in capital stock 87 81Remuneration on permanent shares, net of income tax recovery (70) (66)Issuance of preferred shares – Group’s share — 62Issuance of preferred shares – Non-controlling interests’ share — 14Redemption of preferred shares – Group’s share — (54)Redemption of preferred shares – Non-controlling interests’ share (52) —Dividends paid – Group’s share — (2)Dividends paid – Non-controlling interests’ share (6) (8)
712 569
Cash flows from (used in) investing activitiesPurchase of available-for-sale securities (35,716) (28,954)Proceeds from disposals of available-for-sale securities 34,883 24,479Proceeds from maturities of available-for-sale securities 1,201 1,902Business acquisition (71) (256)Proceeds from the disposal of interests, net of cash and cash equivalents sold — (51)Acquisitions of property, plant and equipment and investment property (322) (267)Proceeds from disposals of property, plant and equipment and investment property 63 82
38 (3,065)
Net increase (decrease) in cash and cash equivalents 313 (265)Cash and cash equivalents at beginning of year 1,356 1,621
Cash and cash equivalents at end of year $ 1,669 $ 1,356
Supplemental information on cash flows from operating activities Interest paid $ 1,965 $ 1,891 Interest and dividends received 5,995 5,940
The accompanying notes are an integral part of the Combined Financial Statements.

108 2012 DESJARDINS GROUP ANNUAL REPORT – NOTES TO THE COMBINED FINANCIAL STATEMENTS
NOTES TO THE COMBINED FINANCIAL STATEMENTSNOTE 1
INFORMATION ON DESJARDINS GROUPNATURE OF OPERATIONS
Desjardins Group is made up of the Desjardins caisses in Quebec and Ontario, the Fédération des caisses Desjardins du Québec (the Federation) and its subsidiaries, the Fédération des caisses populaires de l’Ontario and the Fonds de sécurité Desjardins. A number of the subsidiaries are active across Canada. The various business segments in which Desjardins Group operates are described in Note 32, “Segmented information”. The address of the head office is 100 Des Commandeurs Street, Lévis, Quebec, Canada.
BASIS OF PRESENTATION OF THE COMBINED FINANCIAL STATEMENTS
As an integrated financial services group, Desjardins Group is a complete economic entity. The Combined Financial Statements of Desjardins Group have been prepared to present the financial position, the financial performance and the cash flows of this economic entity. The Desjardins caisses collectively control the Federation, whose mission is to determine the strategic priorities and coordinate the operations of Desjardins Group. The role of the Federation is also to protect the interests of Desjardins Group members and to promote the development of the Group.
As Desjardins caisses and the Federation are financial services cooperatives, these Combined Financial Statements differ from the consolidated financial statements of a group with a traditional organizational structure. Consequently, the financial statements of Desjardins Group are a combination of the accounts of the Desjardins caisses, the caisses populaires of Ontario, the Federation, the Fédération des caisses populaires de l’Ontario and the entities controlled by them, namely the Federation’s subsidiaries and the Fonds de sécurité Desjardins. The capital stock of Desjardins Group represents the aggregate of the capital stock issued by the caisses, the Federation and the Fédération des caisses populaires de l’Ontario.
NOTE 2
SIGNIFICANT ACCOUNTING POLICIES A) GENERAL INFORMATION
STATEMENT OF COMPLIANCE
Pursuant to the Act Respecting Financial Services Cooperatives (the Act), these Combined Financial Statements have been prepared by Desjardins Group’s management in accordance with Canadian generally accepted accounting principles (GAAP) and the accounting requirements of the Autorité des marchés financiers (AMF) in Québec, which do not differ from GAAP.
The International Financial Reporting Standards (IFRS), as issued by the International Accounting Standards Board (IASB), constitute GAAP for Desjardins Group. Some numbers from fiscal 2011 were reclassified to be consistent with the presentation of the Combined Financial Statements for fiscal 2012. This reclassification did not affect Desjardins Group’s results or total assets and liabilities. These Combined Financial Statements for the year ended December 31, 2012, were approved by the Board of Directors of Desjardins Group, which is the Board of Directors of the Federation, on February 21, 2013.
The significant measurement and presentation rules applied to prepare these Combined Financial Statements are described below.
SCOPE OF THE GROUP
The scope of these Combined Financial Statements of Desjardins consists of the operations of the Desjardins caisses in Quebec and Ontario, the Federation, the Fédération des caisses populaires de l’Ontario and the entities controlled by them, namely the Federation’s subsidiaries and the Fonds de sécurité Desjardins. The main subsidiaries of the Federation are as follows: Caisse centrale Desjardins, which acts as Desjardins Group’s treasurer and financial agent on the Canadian and international markets; Capital Desjardins inc., which issues securities on capital markets and invests the proceeds therefrom in securities issued by the Desjardins caisses; Desjardins Trust Inc., which is active in asset custody and trust services; Desjardins Technology Group Inc., which is responsible for the development and the maintenance of Desjardins Group’s technology systems and applications; and Desjardins Financial Corporation Inc. This last subsidiary encompasses the operations of

1092012 DESJARDINS GROUP ANNUAL REPORT – NOTES TO THE COMBINED FINANCIAL STATEMENTS
NOTE 2
SIGNIFICANT ACCOUNTING POLICIES (CONTINUED)Desjardins Asset Management Inc., which is a group of investment experts that manages the assets from the insurance subsidiaries and other managed items entrusted to it by other subsidiaries of Desjardins Group; Desjardins General Insurance Group Inc., which offers property and casualty insurance products; Desjardins Financial Security Life Assurance Company, which offers life and health insurance products and financial services; Western Financial Group Inc., a financial services company operating in western Canada; and Desjardins Securities Inc., which offers securities brokerage products and services.
The financial statements of all Group entities have been prepared for the same reference period using similar accounting policies. All intercompany balances, income and expenses as well as gains and losses on internal transactions have been eliminated.
NON-CONTROLLING INTERESTS
Non-controlling interests represent the share in profit or loss as well as net assets not held by Desjardins Group. They are presented separately in the Combined Statements of Income, the Combined Statements of Comprehensive Income and in equity, in the Combined Balance Sheets.
ASSOCIATES
Desjardins Group’s investments in associates are accounted for using the equity method, whereby the value of securities held is replaced by Desjardins Group’s share of the equity and profit or loss of the investee. Desjardins Group’s investments in associates include the goodwill (net of any impairment) determined upon acquisition. An associate is an entity over which Desjardins Group has significant influence. These investments are presented under “Other assets – Other” in the Combined Balance Sheets.
JOINT VENTURES
Desjardins Group’s interests in joint ventures are also accounted for using the equity method. A joint venture is an entity whose economic activity is undertaken under the joint control of the joint venturers pursuant to a contractual arrangement.
SPECIAL PURPOSE ENTITIES
Desjardins Group includes in its Combined Financial Statements the operations of the distinct legal structures specifically created to manage a transaction or a group of similar transactions (special purpose entities), even if it has no equity interest in these entities, provided that it exercises control in substance based on the following criteria:
•TheactivitiesoftheentityarebeingconductedexclusivelyonbehalfofDesjardinsGroup,suchthatDesjardinsGroupbenefitsfrom the entity’s operations.
•DesjardinsGrouphasthedecision-makingandmanagementpowersneededtoobtainthemajorityofthebenefitsoftheongoingactivities of the entity. These powers are characterized by the ability to dissolve the entity, to modify its statutes or to formally veto any modification thereto.
•DesjardinsGrouphastheabilitytoobtainthemajorityofthebenefitsoftheentityandthereforemaybeexposedtorisksincident to the entity’s activities. These benefits may take the form of the right to receive some or all of the profit or loss of the entity, measured on an annual basis, or a share of its net assets, or the right to sell one or more assets or to receive the majority of the residual assets in the event of liquidation.
•DesjardinsGroupretainsthemajorityoftheriskstakenbytheentityinordertoobtainbenefitsfromitsactivities;thiswouldbethecaseif Desjardins Group remained exposed to the initial losses on the asset portfolio held by the entity.
SIGNIFICANT JUDGMENTS, ESTIMATES AND ASSUMPTIONS
The preparation of combined financial statements in accordance with IFRS requires management to make judgments, estimates and assumptions, which are described in the following significant accounting policies with respect to consolidation of special purpose entities, fair value measurement of financial instruments, derecognition of financial assets and liabilities, allowance for credit losses, objective evidence of impairment of available-for-sale securities, impairment of non-financial assets, insurance and investment contract liabilities, provisions, income taxes on surplus earnings, provision for member dividends, employee benefits and goodwill.
PRESENTATION AND FUNCTIONAL CURRENCY
These Combined Financial Statements are expressed in Canadian dollars, which is also the functional currency of Desjardins Group. Dollar amounts presented in the tables of the Notes to the Combined Financial Statements are in millions of dollars, unless otherwise stated.

110 2012 DESJARDINS GROUP ANNUAL REPORT – NOTES TO THE COMBINED FINANCIAL STATEMENTS
NOTE 2
SIGNIFICANT ACCOUNTING POLICIES (CONTINUED)B) FINANCIAL ASSETS AND LIABILITIESFinancial assets mainly consist of securities, loans and derivative financial instruments, whereas financial liabilities mainly include deposits and derivative financial instruments.
Financial assets and liabilities are recognized on the date Desjardins Group becomes a party to their contractual provisions, namely the date of acquisition or issuance of the financial instrument. Regular-way purchases and sales of financial assets are recognized on a trade-date basis.
CLASSIFICATION AND MEASUREMENT
Financial assets and liabilities are classified based on their characteristics and the intention of management upon their acquisition.
The classification of financial assets can be summarized as follows:
Recognition
Categories Classes Initial Subsequent
Financial assets
At fair value through profit or loss (i)
Held for trading (ii) Fair value Fair value
Designated as at fair value through profit or loss (iii) Fair value Fair value
Loans and receivables (iv) Fair value Amortized cost
Available for sale (v) Fair value Fair value
Held to maturity (vi) Fair value Amortized cost
(i) Financial assets classified in the “At fair value through profit or loss” category include financial assets “Held for trading” and financial assets “Designated as at fair value through profit or loss”. Therefore:
•Changesinfairvalueoffinancialassetsclassifiedinthiscategoryarerecordedinprofitorlossunder“Netincomeonsecuritiesatfairvalue through profit or loss”.
•Interestanddividendincomefromthefinancialassetsclassifiedinthe“Atfairvaluethroughprofitorloss”categoryofthePersonalServices and Business and Institutional Services segment and the Other category is recognized under “Interest income – Securities” and, for the other segments, such income is mainly recognized under “Net income on securities at fair value through profit or loss” using the effective interest method.
(ii) Financial assets classified as “Held for trading” include the following:
•Securitiesacquiredforresalepurposesintheneartermandsecuritiesthatarepartofaportfolioofsecuritiesthataremanagedtogetherand for which there is evidence of an actual pattern of short-term profit-taking
•Derivativefinancialinstruments
Derivative financial instruments designated as fair value or cash flow hedging items cannot be classified in this category. Section Q) “Derivative financial instruments and hedging activities”, specifies the nature of the recognition of derivative financial instruments designated as part of a hedging relationship.
(iii) Financial assets classified as “Designated as at fair value through profit or loss” are essentially securities designated as such by management upon initial recognition, on an instrument-by-instrument basis. Management may designate a financial instrument as at fair value through profit or loss upon initial recognition when one of the following conditions is met:
•Thedesignationeliminatesorsignificantlyreducesameasurementorrecognitioninconsistency.
•Theassetsarepartofagroupoffinancialassetsorfinancialassetsandliabilitiesthataremanagedandwhoseperformanceisevaluatedon a fair value basis.
•Thefinancialinstrumentcontainsoneormoreembeddedderivativesthatsignificantlymodifythecashflowsandthatwouldotherwisebe separated from their host contract.
Desjardins Group’s financial assets classified in this category comprise certain investments made in connection with derivative instruments that are not designated as part of a hedging relationship, thereby significantly reducing an accounting mismatch. For securities that are designated in this category to eliminate or significantly reduce an accounting mismatch and that back the life insurance actuarial liabilities and the property and casualty insurance provisions for claims, see Note 14 “Insurance and investment contract liabilities”, for more information.

1112012 DESJARDINS GROUP ANNUAL REPORT – NOTES TO THE COMBINED FINANCIAL STATEMENTS
NOTE 2
SIGNIFICANT ACCOUNTING POLICIES (CONTINUED)(iv) Securities classified in the “Loans and receivables” category are non-derivative financial assets with fixed or determinable income that
are not quoted in an active market and that are not held for sale upon their acquisition or their granting. Securities in this category include “Cash and deposits with financial institutions”, “Securities borrowed or purchased under reverse repurchase agreements”, “Loans”, “Clients’ liability under acceptances” and “Amounts receivable from clients, brokers and financial institutions” and other assets.
Outstanding securities classified in the “Loans and receivables” category are initially recognized at fair value in the Combined Balance Sheets and, at subsequent reporting dates, they are measured at amortized cost using the effective interest method. Income recognized on securities classified in the “Loans and receivables” category is presented under “Interest income – Loans” in the Combined Statements of Income when it is recognized by the Personal Services and Business and Institutional Services segment and the Other category. Income for the other segments is recognized under “Other income – Other” in the Combined Statements of Income.
(v) Securities classified in the “Available for sale” category are non-derivative financial assets that are initially designated as available for sale or that are not classified in the “At fair value through profit or loss”, “Held to maturity” or “Loans and receivables” categories. Available-for-sale securities can be sold further to or in view of fluctuations in interest rates, exchange rates, prices of equity instruments or changes in financing sources or terms, or to meet the liquidity needs of Desjardins Group.
Gains and losses resulting from changes in fair value, except for impairment losses and foreign exchange gains and losses, are recognized in the Combined Statements of Comprehensive Income under “Net unrealized gains on available-for-sale securities” until the financial asset is derecognized. Premiums and discounts on the purchase of available-for-sale securities are amortized over the life of the security using the effective interest method and recognized in combined profit or loss.
(vi) Securities classified in the “Held to maturity” category are non-derivative financial assets with fixed or determinable payments and fixed maturity that management has the intention and ability to hold to maturity. These securities are recognized at amortized cost using the effective interest method. Desjardins Group held no instruments in this category at the reporting dates.
The classification of financial liabilities can be summarized as follows:
Recognition
Categories Classes Initial Subsequent
Financial liabilities
At fair value through profit or loss (i)
Held for trading (ii) Fair value Fair value
Designated as at fair value through profit or loss (iii) Fair value Fair value
At amortized cost (iv) Fair value Amortized cost
(i) Financial liabilities classified in the “At fair value through profit or loss” category include financial liabilities “Held for trading” and financial liabilities “Designated as at fair value through profit or loss”. Therefore:
•Changesinfairvalueoffinancialliabilitiesclassifiedinthiscategoryarerecordedinprofitorlossunder“Netincomeonsecurities at fair value through profit or loss”.
•Interestexpenserelatedtofinancialliabilitiesclassifiedinthe“Atfairvaluethroughprofitorloss”categoryisrecognizedunder “Net income on securities at fair value through profit or loss” using the effective interest method.
(ii) Financial liabilities classified as “Held for trading” are debt securities issued with the intention to repurchase them in the near term and securities that are part of a portfolio of securities that are managed together and for which there is evidence of an actual pattern of short-term profit-taking, such as “Commitments related to securities sold short”. Derivative financial instruments are also classified as “Held for trading”. Derivative financial instruments designated as fair value or cash flow hedging items cannot be classified in this category. Section Q) “Derivative financial instruments and hedging activities”, specifies the nature of the recognition of derivative financial instruments designated as part of a hedging relationship.

112 2012 DESJARDINS GROUP ANNUAL REPORT – NOTES TO THE COMBINED FINANCIAL STATEMENTS
NOTE 2
SIGNIFICANT ACCOUNTING POLICIES (CONTINUED)(iii) Financial liabilities classified as “Designated as at fair value through profit or loss” have been designated as such by management upon
initial recognition, on an instrument-by-instrument basis. Management may designate a financial instrument as at fair value through profit or loss upon initial recognition when one of the following conditions is met:
•Thedesignationeliminatesorsignificantlyreducesameasurementorrecognitioninconsistency. •Theliabilitiesarepartofagroupoffinancialliabilitiesorfinancialassetsandliabilitiesthataremanagedandwhoseperformanceis
evaluated on a fair value basis. •Thefinancialinstrumentcontainsoneormoreembeddedderivativesthatsignificantlymodifythecashflowsandthatwouldotherwise
be separated from their host contract.
Desjardins Group held no instruments in this category at the reporting dates.
(iv) Financial liabilities that are not classified in the “At fair value through profit or loss” category are classified in the “At amortized cost” category. Financial liabilities measured at amortized cost include “Deposits”, “Acceptances”, “Commitments related to securities lent or sold under repurchase agreements”, “Amounts payable to clients, brokers and financial institutions”, “Subordinated bonds” and other liabilities.
Financial liabilities classified in the “At amortized cost” category are initially recognized at fair value in the Combined Balance Sheets and, at subsequent reporting dates, they are measured at amortized cost using the effective interest method. Interest expense on securities classified in the “At amortized cost” category is recognized in profit or loss under “Interest expense” for the Personal Services and Business and Institutional Services segment and the Other category. Income for the other segments is mainly recognized under “Net income on securities at fair value through profit or loss” in the Combined Statements of Income.
FAIR VALUE MEASUREMENT OF FINANCIAL INSTRUMENTS
There is little subjectivity in the determination of the fair value of financial instruments, especially securities, obtained from quoted prices on active markets.
If there are no quoted prices on active markets, the fair value is determined using either models based on observable market data or models that are not based on observable market data. When no quoted prices are available, the fair value is estimated using present value or other valuation methods, which are influenced by the assumptions used concerning the amount and timing of estimated future cash flows and discount rates, which reflect varying degrees of risk, including liquidity risk, credit risk, and risks related to interest rates, exchange rates, and price and rate volatility. Due to the need to use estimates and make judgments when applying many valuation techniques, fair value estimates for identical or similar assets may differ between entities. Fair value reflects market conditions on a given date and for this reason cannot be representative of future fair values. It also cannot be considered as being realizable in the event of immediate settlement of these instruments.
LOANS
Changes in interest rates and in the creditworthiness of borrowers are the main causes of changes in the fair value of loans held by Desjardins Group, which results in a favourable or unfavourable difference compared to their carrying amount. The fair value of loans is estimated by discounting expected cash flows using market interest rates charged for similar new loans at the reporting date. The fair value of impaired loans is assumed to be equal to their carrying amount.
DEPOSITS
The fair value of deposits with floating-rate features or with no stated maturity is assumed to be equal to their carrying amount. The fair value of fixed-rate deposits is determined by discounting expected cash flows using market interest rates currently being offered for deposits with substantially the same term.
SUBORDINATED BONDS
The fair value of subordinated bonds is based on the market rates for similar issues or debt securities, or on the rates currently offered to Desjardins Group for debt securities with the same remaining term.
DERIVATIVE FINANCIAL INSTRUMENTS
The fair value of derivative financial instruments is determined using pricing models that incorporate the current market prices and the contractual prices of the underlying instruments, the time value of money, yield curves and volatility factors. The fair value of derivative financial instruments is presented without taking into account the impact of legally enforceable master netting agreements. Note 17, “Derivative financial instruments and hedging activities”, specifies the nature of the derivative financial instruments held by Desjardins Group.
1132012 DESJARDINS GROUP ANNUAL REPORT – NOTES TO THE COMBINED FINANCIAL STATEMENTS
NOTE 2
SIGNIFICANT ACCOUNTING POLICIES (CONTINUED)FINANCIAL INSTRUMENTS WHOSE FAIR VALUE EQUALS THEIR CARRYING AMOUNT
The carrying amount of certain financial instruments that mature within the next 12 months is a reasonable approximation of their fair value. These financial instruments include the following items: “Cash and deposits with financial institutions”, “Clients’ liability under acceptances”, “Amounts receivable from clients, brokers and financial institutions”, “Acceptances” and “Amounts payable to clients, brokers and financial institutions”.
TRANSACTION COSTS
Transaction costs for financial instruments are capitalized and then amortized over the life of the instrument using the effective interest method, except if such instruments are classified or designated as part of the “At fair value through profit or loss” category, in which case these costs are expensed as incurred.
OFFSETTING OF FINANCIAL ASSETS AND LIABILITIES
Financial assets and liabilities are presented on a net basis when there is a legally enforceable right to set off the recognized amounts and Desjardins Group intends to settle on a net basis or to realize the asset and settle the liability simultaneously.
DERECOGNITION OF FINANCIAL ASSETS AND LIABILITIES
A financial asset is derecognized when the contractual rights to the cash flows from the asset expire or when the contractual rights to the cash flows from the financial asset and substantially all risks and rewards of ownership of the asset are transferred to a third party.
When the cash flows from a financial asset have been transferred but Desjardins Group has retained substantially all the risks and rewards of ownership of the financial asset, it recognizes a separate asset and a separate liability presented in the Combined Balance Sheets under “Other assets – Other” and “Other liabilities – Other”, respectively, which represents the rights and obligations created or retained in the asset transfer. If control of the financial asset is retained, Desjardins Group continues to recognize the asset in the Combined Balance Sheets to the extent of its continuing involvement in said asset.
When a financial asset is derecognized in its entirety, a gain or a loss is recognized in the Combined Statements of Income for an amount equal to the difference between the carrying amount of the asset and the value of the consideration received.
A financial liability is derecognized when the related obligation is discharged, cancelled or expires.
C) CASH AND DEPOSITS WITH FINANCIAL INSTITUTIONS“Cash and deposits with financial institutions” includes cash and cash equivalents. Cash equivalents consist of deposits with the Bank of Canada, deposits with financial institutions—including net amounts receivable related to cheques and other items in the clearing process—as well as the net amount of cheques and other items in transit. These financial instruments mature in the short term, are readily convertible to known amounts of cash and are subject to an insignificant risk of changes in value. They are classified as “Loans and receivables”.
D) SECURITIESSecurities are instruments classified based on their characteristics and management’s intention under the various categories presented in section B), “Financial assets and liabilities”, above.
SECURITIES BORROWED OR PURCHASED UNDER REVERSE REPURCHASE AGREEMENTS
Securities borrowed for a securities or cash consideration or purchased under reverse repurchase agreements are not recognized in the Combined Balance Sheets, as substantially all the risks and rewards of ownership of these securities have not been transferred.
When the consideration for the borrowed securities is paid in cash, the cash pledged as collateral is derecognized from “Cash and deposits with financial institutions” in the Combined Balance Sheets, and an asset representing the right to receive the securities is recognized under “Securities borrowed or purchased under reverse repurchase agreements”.
Reverse repurchase agreements are accounted for as collateralized lending transactions. The consideration paid for the securities acquired, including accrued interest, is recognized under “Securities borrowed or purchased under reverse repurchase agreements”.
When the consideration for the borrowed securities is paid in securities, the securities pledged as collateral are not derecognized, as substantially all the risks and rewards of ownership of these securities have not been transferred.

114 2012 DESJARDINS GROUP ANNUAL REPORT – NOTES TO THE COMBINED FINANCIAL STATEMENTS
NOTE 2
SIGNIFICANT ACCOUNTING POLICIES (CONTINUED)The fair value of securities borrowed for a securities or cash consideration or purchased under reverse repurchase agreements is presented in the notes as financial assets held as collateral. In addition, when the securities received can subsequently be resold or repledged as collateral, the fair value of securities borrowed or purchased under reverse repurchase agreements is presented in Note 27, “Commitments, guarantees and contingent liabilities”, as financial assets held as collateral that can be sold or repledged.
SECURITIES LENT OR SOLD UNDER REPURCHASE AGREEMENTS
Securities lending transactions or securities sold under repurchase agreements (to be repurchased at a subsequent date) do not result in the derecognition of securities in the Combined Balance Sheets, as substantially all the risks and rewards of ownership of these securities have not been transferred. These transactions are treated as collateralized financings since the party that pays the consideration takes possession of the securities pledged as collateral for the financing.
When the consideration received for the securities lent is paid in cash, the cash received as collateral is recognized under “Cash and deposits with financial institutions” in the Combined Balance Sheets, and a liability representing the obligation to return the securities is recognized under “Commitments related to securities lent or sold under repurchase agreements”.
Repurchase agreements are accounted for as collateralized borrowing transactions. The consideration received for the securities sold, including accrued interest, is therefore recognized under “Cash and deposits with financial institutions” in the Combined Balance Sheets, and a liability representing the obligation to return the securities is recognized under “Commitments related to securities sold under repurchase agreements”. The difference between the price received and the repurchase price is recognized as interest expense.
When the consideration received for the securities lent is paid in securities, the securities held as collateral are not recognized, as substantially all the risks and rewards of ownership of these securities have not been transferred.
The carrying amount of securities lent or sold under repurchase agreements is presented in Note 27, “Commitments, guarantees and contingent liabilities”, as financial assets pledged as collateral. When the consideration received for the securities lent is paid in securities and these securities can be pledged as collateral or sold, the fair value of the securities received is presented in Note 27, “Commitments, guarantees and contingent liabilities”, as financial assets held as collateral.
SECURITIES SOLD SHORT
Securities sold short as part of trading activities, which represent Desjardins Group’s obligation to deliver securities that it did not possess at the time of sale, are recognized as liabilities at their fair value. Realized and unrealized gains and losses on these securities are recognized in the Combined Statements of Income under “Net income on securities at fair value through profit or loss”. Securities sold short are classified in the “Securities at fair value through profit or loss – Held for trading” category.
E) LOANS Loans, including advances to policyholders, are recorded at amortized cost using the effective interest method, net of the allowance for credit losses.
The fees collected and the direct costs related to the origination, restructuring, and renegotiation of loans are treated as being integral to the yield of the loan, unless the terms and conditions were changed in such a way that the transaction is treated as the granting of a new loan, in which case fees and direct costs are recorded in profit or loss for the year. Collateral is obtained if deemed necessary, based on an assessment of the borrower’s creditworthiness. Collateral normally takes the form of assets such as cash, government securities, shares, receivables, inventory or capital assets.
F) IMPAIRMENT OF FINANCIAL ASSETSAt the reporting date, Desjardins Group assesses whether there is any objective evidence that a financial asset or a group of financial assets is impaired.
ALLOWANCE FOR CREDIT LOSSES
Evidence of impairment results from a loss event that occurred after the loan was granted but before the reporting date and that has an impact on the estimated future cash flows of loans.

1152012 DESJARDINS GROUP ANNUAL REPORT – NOTES TO THE COMBINED FINANCIAL STATEMENTS
NOTE 2
SIGNIFICANT ACCOUNTING POLICIES (CONTINUED)The impairment of a loan or a group of loans is determined by estimating the recoverable amount of these financial assets. The allowance is equal to the difference between this estimate and the carrying amount. This allowance is presented in deduction of assets under “Allowance for credit losses”. To determine the estimated recoverable amount of a loan, Desjardins Group discounts the estimated future cash flows at the effective interest rate inherent to the loan. When the amounts and timing of future cash flows cannot be estimated with reasonable accuracy, the estimated recoverable amount is determined using either the fair value of the securities underlying the loan, net of expected costs of realization, or the observable market price for the loan. The security may vary depending on the type of loan.
The allowance resulting from this impairment is established using two components: individual allowances and collective allowance.
INDIVIDUAL ALLOWANCES
Desjardins Group first reviews its loan portfolios on a loan-by-loan basis to assess credit risk and determine if there is any objective evidence of impairment for which a loss should be recognized in the Combined Statements of Income. Loan portfolios for which an individual allowance has not been established are then included in groups of assets having similar credit risk characteristics and are subject to a collective allowance.
There is objective evidence of impairment when a loan is considered impaired. A loan is classified as an impaired loan when one of the following conditions is met:
•Thereisreasontobelievethataportionoftheprincipalorinterestcannotbecollected.
•Theinterestorprincipalrepaymentiscontractually90dayspastdue,unlesstheloanisfullysecuredandintheprocessofcollection.
•Theinterestorprincipalismorethan180dayspastdue.
A loan is considered past due when the borrower has failed to make a payment by the contractual due date.
When a loan becomes impaired, the interest previously accrued but not collected is capitalized to the loan. Payments received subsequently are recorded as a deduction of the principal. A loan ceases to be considered impaired when principal and interest payments are up to date and there is no doubt as to the collection of the loan or when it is restructured, in which case it is treated as a new loan, and there is no doubt as to the collection of principal and interest.
Assets foreclosed to settle impaired loans are recognized on the date of the foreclosure at their fair value less costs to sell. Any difference between the carrying amount of the loan and the fair value recorded for the acquired assets is recognized under “Provision for credit losses”.
A loan classified as “Loans and receivables” is written off when all attempts at restructuring or collection have been made and the likelihood of future recovery is remote. When a loan is written off completely, any subsequent payments are recorded under “Provision for credit losses” in the Combined Statements of Income. Credit card balances are written off completely when no payment has been received at the end of a 180-day period.
Changes in the individual allowance for credit losses due to the passage of time are recognized under “Interest income – Loans”, while those that are due to a revision of expected receipts are recognized under “Provision for credit losses” in the Combined Statements of Income.
COLLECTIVE ALLOWANCE
Loan portfolios for which an individual allowance has not been established are included in groups of financial assets with similar credit characteristics and are subject to a collective allowance.
The method used by Desjardins Group to determine the collective allowance takes into account the risk parameters of the various loan portfolios, in particular through the integration of sophisticated credit risk models. These collective allowance impairment models take into account certain factors such as probabilities of default (loss frequency), loss given default (extent of losses) and gross exposures at default. These parameters, which are based on historical losses, are determined according to the category and the risk rating of each loan. The measurement of the collective allowance also depends on management’s assessment of current credit quality trends with respect to the business segments, the impact of changes to its credit policies and economic conditions. The collective allowance on the loans of the life and health insurance subsidiaries is, however, included in the policy reserves, under “Insurance and investment contract liabilities”.
The allowance related to off-balance sheet exposures, such as letters of guarantee and certain unrecognized credit commitments, is recognized under “Other liabilities – Other” in the Combined Balance Sheets and under “Provision for credit losses” in the Combined Statements of Income.
116 2012 DESJARDINS GROUP ANNUAL REPORT – NOTES TO THE COMBINED FINANCIAL STATEMENTS
NOTE 2
SIGNIFICANT ACCOUNTING POLICIES (CONTINUED)AVAILABLE-FOR-SALE SECURITIES
Securities classified in the “Available for sale” category are monitored on a regular basis to determine whether there is any objective evidence that they are impaired. In measuring the decline in value, Desjardins Group takes into account many facts specific to each investment and all the factors that could indicate that there has been impairment. Factors considered include, but are not limited to, a significant or prolonged decline in the fair value, significant financial difficulties of the issuer, a breach of contract, the increasing probability that the issuer will enter bankruptcy or a restructuring, and the disappearance of an active market for the financial asset in question. Management also uses its judgment to determine when to recognize an impairment loss.
Debt securities classified in the “Available for sale” category are individually assessed by Desjardins Group to determine whether there is any objective evidence of impairment. However, the impairment loss represents the cumulative loss measured as the difference between amortized cost and current fair value, less any impairment loss previously recognized. Future interest income is calculated on the reduced carrying amount using the same interest rate as the one used to discount future cash flows in order to measure the impairment loss. When, during a subsequent period, the fair value of a debt security increases and that increase can be objectively related to a credit event occurring after the impairment loss had been recognized in profit or loss, the impairment loss is reversed through profit or loss.
For equity securities classified in the “Available for sale” category, the objective evidence would also include a “significant” or “prolonged” decline in the fair value below cost. When evidence of impairment exists, the cumulative loss (measured as the difference between acquisition cost and current fair value, less any impairment loss previously recognized) is transferred out of other comprehensive income, in the Combined Statements of Comprehensive Income, and recognized in the Combined Statements of Income. Impairment losses on equity securities are not reversed through profit or loss, and increases in fair value occurring subsequent to impairment are recorded directly in other comprehensive income, in the Combined Statements of Comprehensive Income. Any impairment loss on securities previously impaired is directly recognized in profit or loss.
G) SECURITIZATIONAs part of its liquidity and capital management strategy, Desjardins Group participates in the National Housing Act Mortgage-Backed Securities Program. Under this program, Desjardins Group bundles residential mortgage loans guaranteed by Canada Mortgage and Housing Corporation (CMHC) into mortgage-backed securities (NHA MBSs) and transfers them to the Canada Housing Trust (CHT). Afterwards, Desjardins Group may not transfer or sell these assets or pledge them as collateral, as they have been sold to the CHT, and it may not repurchase them before maturity. However, as part of these transactions, Desjardins Group retains substantially all the risks and rewards related to these securities, in particular prepayment and reinvestment risks. Consequently, these loans continue to be recognized in the Combined Balance Sheets. Furthermore, Desjardins Group treats these transfers as collateralized financing transactions and recognizes a liability. This liability, which is equal to the consideration received from CMHC for the sale of NHA MBSs that do not meet the derecognition criteria, is presented under “Deposits – Business and government” in the Combined Balance Sheets. The CHT funds these purchases by issuing Canada Mortgage Bonds (CMBs) to investors. The legal guarantee of third parties holding CMBs is limited to the transferred assets.
The terms and conditions of the program require that interest rate swaps be entered into by the CHT and Desjardins Group in order to receive all cash flows related to the mortgage loans underlying the NHA MBSs every month. Desjardins Group pays the CHT an amount corresponding to the interest payable to the holders of CMBs, the difference between these amounts being considered as excess interest margin. As part of these swaps, Desjardins Group must also create a separate account for reinvestment purposes (principal reinvestment account) for any principal payment received on mortgage loans in order to meet the obligations related to the repayment of CMBs at maturity.
Some securitization transactions entered into before January 1, 2010, resulted in derecognition, as Desjardins Group elected to prospectively apply the derecognition requirements. At the time of transfer, these transactions were therefore recognized as sales, and Desjardins Group retains certain interests in excess interest margins, which are retained interests, and it assumes the responsibility of managing the transferred mortgage loans and the principal reinvestment account. The assets and liabilities representing the retained interests and obligations are recognized upon the transfer of loans under “Other assets – Other” and “Other liabilities – Other” in the Combined Balance Sheets. These transactions will mature no later than December 31, 2014.
No loss is expected on the mortgage loans as they are guaranteed by CMHC. Income related to securitization transactions is recognized under “Other income – Other”, “Interest income – Securities” and “Interest income – Loans”.
H) PROPERTY, PLANT AND EQUIPMENT AND INVESTMENT PROPERTY
PROPERTY, PLANT AND EQUIPMENT
Property, plant and equipment consists of land, buildings, computer hardware, furniture, fixtures and other items as well as leasehold improvements. These assets are recognized at cost less any accumulated depreciation and any accumulated impairment losses, and are depreciated over their expected useful life using the straight-line method.

1172012 DESJARDINS GROUP ANNUAL REPORT – NOTES TO THE COMBINED FINANCIAL STATEMENTS
NOTE 2
SIGNIFICANT ACCOUNTING POLICIES (CONTINUED)The depreciable amount of an item of property, plant and equipment is determined after deducting its residual value less costs to sell. The useful life of property, plant and equipment is generally equal to its expected useful life.
The depreciation expense for property, plant and equipment is recognized under “Non-interest expense – Premises, equipment and furniture, including depreciation” in the Combined Statements of Income.
INVESTMENT PROPERTY
Investment properties are buildings or land held to earn rentals or for capital appreciation.
Investment properties are recognized at cost less accumulated depreciation and are depreciated over their useful life using the straight-line method. Transfers to or from the “Investment property” category are made only when there is a change in use. Upon a transfer of property, plant and equipment from the “Investment property” category to the “Buildings” category, the cost remains the same and continues to be the carrying amount. If a building held and occupied by Desjardins Group becomes an investment property, it is recorded using the accounting policies applicable to investment properties.
The depreciation expense for investment properties is recognized under “Net other investment income” in the Combined Statements of Income.
DEPRECIATION
Property, plant and equipment and investment property are depreciated using the following depreciation periods:
Depreciation periodsLand Non-depreciableBuildings/Investment property 5 to 80 yearsComputer equipment 2 to 10 yearsFurniture, fixtures and other 3 to 10 yearsLeasehold improvements Expected term of the lease
When an item of property, plant and equipment is made up of several significant parts having different useful lives or providing economic benefits according to different patterns, each part is recognized separately and is depreciated over its own depreciation period.
DERECOGNITION
Property, plant and equipment and investment property are derecognized upon disposal or when they are permanently withdrawn from use and no future economic benefits are expected. Gains and losses on the disposal or sale of buildings are recognized in the Combined Statement of Income for the year in which they are realized under “Premises, equipment and furniture, including depreciation” for property, plant and equipment and under “Net other investment income” for investment property.
IMPAIRMENT
Property, plant and equipment and investment properties are tested for impairment whenever events or changes in circumstances indicate that their carrying amount may not be recoverable. Assessing whether such events or circumstances exist is subject to management’s judgment.
I) GOODWILL AND INTANGIBLE ASSETS
GOODWILL
Goodwill represents the excess of the purchase price over the fair value of the identifiable assets acquired and liabilities assumed in a business combination accounted for using the acquisition method.
At the acquisition date, each item of goodwill is allocated to one or more cash-generating units (CGU or group of CGUs) that are expected to benefit from the combination. The group of CGUs must not be larger than a business segment. A CGU is the smallest identifiable group of assets that generates cash inflows that are independent from the cash inflows from other groups of assets. Subsequent to initial measurement, goodwill is measured at cost less any impairment loss.

118 2012 DESJARDINS GROUP ANNUAL REPORT – NOTES TO THE COMBINED FINANCIAL STATEMENTS
NOTE 2
SIGNIFICANT ACCOUNTING POLICIES (CONTINUED)INTANGIBLE ASSETS
Intangible assets include acquired and internally generated intangible assets and are initially recognized at cost. The cost of an intangible asset acquired as part of a business combination corresponds to its fair value at the date of acquisition. Subsequent to initial recognition, intangible assets are measured at cost less any accumulated amortization and any impairment losses. Expenditures related to internally generated intangible assets, except for development costs, are recognized in profit or loss as incurred.
Desjardins Group assesses whether the useful life of an intangible asset is finite or indefinite. Intangible assets with finite useful lives include mainly software and are amortized using the straight-line method over their estimated useful lives, which do not exceed seven years.
Gains or losses resulting from the derecognition of an intangible asset are determined as the difference between the net proceeds of disposal and the net carrying amount of the asset. They are recognized under “Non-interest expense – Other” in the Combined Statements of Income upon derecognition of the asset.
J) IMPAIRMENT OF NON-FINANCIAL ASSETSDesjardins Group assesses at the reporting date whether there is an indication that an asset may be impaired. An impairment loss is recognized when the carrying amount of the asset exceeds its recoverable amount. The recoverable amount is the higher of its fair value less costs to sell and its value in use, which corresponds to the present value of the recoverable future cash flows. Any impairment loss recognized in the Combined Statements of Income represents the excess of the carrying amount of the asset over the recoverable amount. Impairment losses on that asset may be subsequently reversed and are recognized in the Combined Statements of Income in the year in which they occur.
Estimating the recoverable amount of a non-financial asset to determine if it is impaired also requires that management make estimates and assumptions, and any change in these estimates and assumptions could impact the determination of the recoverable amount of non-financial assets and, therefore, the outcome of the impairment test.
GOODWILL
Goodwill is tested for impairment once a year and when events or changes in circumstances indicate that the carrying amount may not be recoverable.
The goodwill impairment test is performed based on the recoverable amount of each CGU (or each group of CGUs) to which goodwill is allocated.
The recoverable amount represents the higher of the fair value less costs to sell and the value in use. Fair value represents the best estimate of the amount obtainable from the sale, less costs to sell, in an arm’s-length transaction between knowledgeable and willing parties. The value in use is calculated using the most appropriate method, generally by discounting estimated future cash flows.
When the recoverable amount is less than the carrying amount, an impairment loss is recognized in the Combined Statement of Income for the year and is first recorded as a reduction of the goodwill allocated to the CGU (or group of CGUs) and then as a reduction of the other identifiable assets of the CGU (or group of CGUs) pro rata on the basis of their carrying amount in the unit. Nevertheless, the allocation of the impairment loss to the assets of the CGU (or group of CGUs) must not result in their carrying amount being lower than the highest of the following amounts: the fair value of the assets less costs to sell, their value in use, and zero.
Goodwill impairment losses cannot be reversed.
K) ACCEPTANCES AND CLIENTS’ LIABILITY UNDER ACCEPTANCESThe potential liability of Desjardins Group under acceptances is recorded as a liability in the Combined Balance Sheets. Recourse against the client, in the event of a call on any of these commitments, is recorded as an equivalent offsetting asset. These financial instruments are classified in the “Loans and receivables” category.
L) CLASSIFICATION OF INSURANCE AND INVESTMENT CONTRACTSInsurance contracts are contracts under which a significant insurance risk is transferred upon the contract’s issuance. An insurance risk is transferred when the insurance subsidiaries agree to compensate the policyholder if an uncertain future event specified in the contract adversely affects the policyholder. All contracts that do not meet the definition of an insurance contract under IFRS are classified as investment contracts or service contracts, where appropriate. Investment contracts are contracts that comprise a financial risk but no significant insurance risk. Contracts that transfer a significant insurance risk issued by the insurance subsidiaries have been classified as insurance contracts, in accordance with IFRS 4, “Insurance Contracts”. Otherwise, contracts issued by the insurance subsidiaries have been classified either as investment contracts in accordance with International Accounting Standard (IAS) 39, “Financial Instruments: Recognition and Measurement”, or as service contracts in accordance with IAS 18, “Revenue”.

1192012 DESJARDINS GROUP ANNUAL REPORT – NOTES TO THE COMBINED FINANCIAL STATEMENTS
NOTE 2
SIGNIFICANT ACCOUNTING POLICIES (CONTINUED)Once a contract has been classified as an insurance contract, it continues to be an insurance contract over its remaining life, even if the insurance risk decreases significantly during that period. However, an investment contract may be reclassified as an insurance contract after its issuance if the insurance risk becomes significant.
M) INSURANCE AND INVESTMENT CONTRACT LIABILITIESInsurance and investment contract liabilities include the contract liabilities of the life and health insurance subsidiaries and the property and casualty insurance subsidiaries.
LIFE AND HEALTH INSURANCE CONTRACT LIABILITIES
Life and health insurance contract liabilities consist of actuarial liabilities, provisions for benefits, dividends and experience refunds, and policyholder deposits.
The calculation of the insurance contract liabilities of the life and health insurance subsidiaries requires that assumptions be made with respect to the timing of many factors such as death, disability, investment income, inflation, policy cancellations, expenses, income taxes, premiums, commissions and participating policyholders’ dividends as well as the amounts they represent. To predict underwriting experience, the life and health subsidiaries use best estimate assumptions. Some of these assumptions refer to events that are likely to occur in the distant future and they may need to be changed.
Actuarial liabilities represent the amounts which, together with estimated future premiums and net investment income, will provide for all the life and health insurance subsidiaries’ commitments regarding estimated future benefits, policyholder dividends, taxes (other than taxes on surplus earnings) and related expenses. The appointed actuary of each life and health insurance subsidiary is required to determine the actuarial liabilities needed to meet its future commitments. The actuarial liabilities of the life and health insurance subsidiaries are determined using the Canadian Asset Liability Method (CALM), in accordance with Canadian accepted actuarial practices.
Under CALM, the determination of the actuarial liabilities of the life and health insurance subsidiaries is based on an explicit projection of cash flows using current best estimate assumptions for each cash flow component and each significant contingency. Investment returns are based on projected investment income using the current asset portfolios and projected reinvestment strategies. Each non-economic assumption is adjusted by a margin for adverse deviation. With respect to investment returns, the provision for adverse deviation is established by using yield scenarios. These scenarios are established using a deterministic model that includes testing prescribed by Canadian actuarial standards. The provision for minimum guarantees on segregated fund products is established using stochastic modelling. The period used for the projection of cash flows is the policy lifetime for most insurance contracts. For certain types of contracts, a shorter projection period may be used. This period is, however, limited to the term of the liability over which the life and health insurance subsidiaries are exposed to significant risk without the ability to adjust policy premiums or charges related to the contracts.
PROPERTY AND CASUALTY INSURANCE CONTRACT LIABILITIES
Property and casualty insurance contract liabilities consist of unearned premiums and provisions for claims and adjustment expenses.
Unearned premiums represent the portion of premiums remaining to be earned at the reporting date. The property and casualty subsidiaries are exposed to pricing risk to the extent that unearned premiums could be insufficient to cover future costs related to policies. Future claim costs, related costs, investment income and expected income related to unearned premiums are regularly assessed.
The calculation of the provisions for claims and adjustment expenses related to the property and casualty insurance subsidiaries’ insurance policies takes into consideration assumptions based on characteristics of the business lines, settlement history and other relevant factors. The estimating methods used to make this calculation are based on best estimate assumptions, taking into account currently known data, which are regularly reviewed and updated. Additional information on the main actuarial assumptions and their sensitivity to changes is presented in Note 14, “Insurance and investment contract liabilities”.
The provisions for claims and adjustment expenses include individual loss estimates for each claim reported. In addition, a provision is established for adjustment expenses, changes related to reported claims, and incurred but not reported claims, based on previous experience and portfolio contracts. These estimates are regularly reviewed and updated, and any resulting adjustment is recognized in the Combined Statement of Income for the year in which the revision occurs. The provision for claims and adjustment expenses is reported on a discounted basis using the underlying asset rate, with a margin for adverse deviation.

120 2012 DESJARDINS GROUP ANNUAL REPORT – NOTES TO THE COMBINED FINANCIAL STATEMENTS
NOTE 2
SIGNIFICANT ACCOUNTING POLICIES (CONTINUED)INVESTMENT CONTRACT LIABILITIES
Investment contract liabilities are recognized at amortized cost using the effective interest method. Amounts received from clients are initially recognized in the Combined Balance Sheets as liabilities under “Insurance and investment contract liabilities”. Subsequently, new amounts received from clients and withdrawals are directly recorded as adjustments to “Insurance and investment contract liabilities”, in the Combined Balance Sheets.
DISCRETIONARY PARTICIPATION FEATURES
Certain insurance contracts of the life and health insurance subsidiaries contain a discretionary participation feature that allows the policyholder to participate in the profitability related to the contracts in question. These contracts give the policyholder the contractual right to receive additional benefits as supplement to guaranteed benefits. The life and health subsidiaries elected not to recognize the participating portion of these contracts separately. The cumulative amount of surplus earnings attributable to these contracts is presented under “Non-controlling interests” in the Combined Balance Sheets.
REINSURANCE
The life and health insurance subsidiaries enter into reinsurance treaties for contracts with coverage in excess of certain maximum amounts that vary based on the nature of the activities. In addition, they purchase additional reinsurance protection with respect to large-scale catastrophic events.
To reduce the risk related to extensive claims, the property and casualty insurance subsidiaries enter into reinsurance treaties with more than one reinsurer to limit their exposure to a maximum amount per claim or per catastrophe.
These reinsurance treaties do not release the insurance subsidiaries from their obligations toward their policyholders.
Premium income from insurance contracts and expenses related to claims, benefits and changes in insurance contract liabilities associated with contracts under reinsurance treaties are presented net of amounts ceded to reinsurers in the Combined Statements of Income. In addition, the share of reinsurers in the insurance contract liabilities is presented as an asset in the Combined Balance Sheets under “Other assets – Other”.
The resulting reinsurance asset is tested annually for impairment. If there is objective evidence that a reinsurance asset is impaired, following an event that occurred after initial recognition, the insurance subsidiaries reduce the carrying amount of that asset to its recoverable amount, and recognize the resulting loss in the Combined Statements of Income under “Claims, benefits, annuities and changes in insurance and investment contract liabilities”.
N) SEGREGATED FUNDSCertain insurance contracts allow policyholders to invest in segregated funds held by one of the life and health insurance subsidiaries for their benefit. All risks and rewards of ownership of these investments accrue to the policyholders, even though these investments are held by the life and health insurance subsidiary. Accordingly, the assets and liabilities of segregated funds are presented on a separate line in the Combined Balance Sheets. Segregated fund assets are measured and recognized at fair value at the reporting date, which is determined using the methods described earlier in section B) “Financial assets and liabilities”. In addition, if a segregated fund controls a mutual fund in which it has invested, then such mutual fund is consolidated in the segregated fund assets. A liability corresponding to the sum of the interests of the policyholders in the segregated fund assets and the consolidated share of non-controlling mutual fund holders is also recognized separately.
O) SUBORDINATED BONDSSubordinated bonds are bonds subordinated in right of payment to claims of depositors and certain other creditors. Subordinated bonds are classified in the “Financial liabilities at amortized cost” category.
P) PROVISIONSProvisions are liabilities of uncertain timing or amount. A provision is recognized when Desjardins Group has an obligation (legal or constructive) as a result of a past event, the settlement of which should result in an outflow of resources embodying economic benefits, and when a reliable estimate can be made of the amount of the obligation. The amount of the obligation is discounted where the effect of the time value of money is material.
Provisions are based on management’s best estimate of the amounts required to settle the obligation on the reporting date, taking into account relevant risks and uncertainties. As these estimates are forward-looking in nature, management must use its judgment to forecast the timing and amount of future cash flows. Actual results may differ significantly from these forecasts.
Charges to and reversals of provisions are recognized in profit or loss and presented under the items corresponding to the nature of the future expenditures covered.

1212012 DESJARDINS GROUP ANNUAL REPORT – NOTES TO THE COMBINED FINANCIAL STATEMENTS
NOTE 2
SIGNIFICANT ACCOUNTING POLICIES (CONTINUED)Q) DERIVATIVE FINANCIAL INSTRUMENTS AND HEDGING ACTIVITIES
DERIVATIVE FINANCIAL INSTRUMENTS
Derivative financial instruments are financial contracts whose value depends on assets, interest rates, foreign exchange rates and other financial indexes. The vast majority of derivative financial instruments are negotiated by mutual agreement between Desjardins Group and the counterparty and include forward exchange contracts, currency swaps, interest rate swaps, credit default swaps, total return swaps, forward rate agreements, and currency, interest rate and stock index options. Other transactions are carried out as part of regulated trades and mainly consist of futures. The types of contracts used are defined in Note 17, “Derivative financial instruments and hedging activities”.
Derivative financial instruments, including embedded derivatives which are required to be recognized separately, are recorded on the Combined Balance Sheets at fair value.
Embedded derivative financial instruments are separated from their host contract and accounted for as derivatives if: (a) the economic characteristics and risks of the embedded derivatives are not closely related to the economic characteristics and risks of the host contract; (b) the embedded derivative has the same terms as a separate instrument; (c) the hybrid instrument or contract is not measured at fair value with changes in fair value recognized in combined profit or loss. Embedded derivatives that are required to be recognized separately are measured at fair value, and changes in their fair value are recognized under “Net income on securities at fair value through profit or loss” in the Combined Statements of Income.
Desjardins Group uses derivative financial instruments for trading purposes or for asset-liability management purposes.
The derivative financial instruments held for trading purposes are used to meet the needs of members and clients and to allow Desjardins Group to generate income on its own trading activities. These derivative financial instruments are recognized at fair value in the Combined Balance Sheets, and changes in their fair value are recognized under “Net income on securities at fair value through profit or loss” in the Combined Statements of Income.
The derivative financial instruments held for asset-liability management purposes are used to manage current and expected risks related to market risk. These instruments enable Desjardins Group to transfer, modify or reduce the interest rate and foreign currency exposures of assets and liabilities recorded on the Combined Balance Sheets, as well as firm commitments and forecasted transactions.
HEDGING ACTIVITIES
Desjardins Group mainly designates its derivative financial instruments as part of a fair value or cash flow hedging relationship.
When derivative financial instruments are used to manage assets and liabilities, Desjardins Group must determine, for each derivative, whether or not hedge accounting is appropriate. To qualify for hedge accounting, a hedging relationship must be designated and documented at its inception. Such documentation must address the specific strategy for managing risk, the asset, liability or cash flows that are being hedged as well as the measure of hedge effectiveness. Consequently, the effectiveness of each hedging relationship must be assessed, regularly and on an individual basis, to determine with reasonable assurance whether the relationship is effective and will continue to be effective. The derivative financial instrument must prove highly effective to offset changes in the fair value or the cash flows of the hedged item attributable to the risk being hedged.
Desjardins Group may also use derivative financial instruments as an economic hedge for certain transactions in situations where the hedging relationship does not qualify for hedge accounting or where it elects not to apply hedge accounting. In such circumstances, derivative financial instruments are classified as "Held for trading", and realized and unrealized gains and losses are recognized in the Combined Statements of Income under “Net income on securities at fair value through profit or loss”.
The designation of a derivative financial instrument as a hedging item is discontinued in the following cases: the hedged item is sold or matures, the derivative financial instrument is repurchased or matures, the hedge is no longer effective, or Desjardins Group terminates the designation of the hedge or no longer expects the forecasted transaction to occur.
Hedging instruments that meet the strict hedge accounting conditions are recognized as follows:
FAIR VALUE HEDGES
Fair value hedge transactions involve mostly the use of interest rate swaps to hedge the changes in fair value of a fixed-rate financial instrument caused by a change in interest rates on the market. The change in fair value of hedging derivative financial instruments offsets the change in fair value of hedged items. Desjardins Group uses fair value hedge strategies for its securities, loan and deposit portfolios.

122 2012 DESJARDINS GROUP ANNUAL REPORT – NOTES TO THE COMBINED FINANCIAL STATEMENTS
NOTE 2
SIGNIFICANT ACCOUNTING POLICIES (CONTINUED)In a fair value hedge transaction, changes in the fair value of the hedging derivative financial instrument are recognized under “Net income on securities at fair value through profit or loss” in the Combined Statements of Income, as well as changes in fair value of the hedged asset or liability attributable to the hedged risk. The gain or loss attributable to the hedged risk is applied to the carrying amount of the hedged item. When the changes in fair value of the hedging derivative financial instrument and the hedged item do not entirely offset each other, the resulting amount, which represents the ineffective portion of the relationship, is recognized in “Net income on securities at fair value through profit or loss” in the Combined Statements of Income.
When a fair value hedging relationship is discontinued, hedge accounting is discontinued prospectively. The hedged item is no longer adjusted to reflect the fair value impact of the designated risk. Adjustments previously recorded in the hedged item are amortized using the effective interest method and are recognized in net interest income, in the Combined Statements of Income, following the underlying instrument, over the remaining life of the hedged item, unless the hedged item ceased to exist, in which case the adjustments for the impact of the designated risk are immediately recognized under “Net income on securities at fair value through profit or loss” in the Combined Statements of Income.
CASH FLOW HEDGES
Cash flow hedge transactions involve mostly the use of interest rate swaps to hedge the changes in future cash flows from a floating-rate financial instrument. Hedging derivative financial instruments reduce the variability of future cash flows from the hedged item. Desjardins Group uses cash flow hedge strategies for its loan, deposit and securities portfolios.
In a cash flow hedge transaction, gains and losses resulting from changes in the fair value of the effective portion of the derivative financial instrument are recognized in other comprehensive income under “Net gains (losses) on derivative financial instruments designated as cash flow hedges” until the hedged item is recognized in the Combined Statements of Income, at which time such changes are recognized in net interest income in the Combined Statements of Income, following the underlying instrument. The ineffective portion of cash flow hedge transactions is immediately recognized in the Combined Statements of Income under “Net income on securities at fair value through profit or loss”.
When a cash flow hedging relationship no longer qualifies for hedge accounting, Desjardins Group discontinues hedge accounting prospectively. Gains or losses recognized in other comprehensive income are amortized to net interest income, in the Combined Statements of Income, following the underlying instrument, over the expected remaining life of the hedging relationship that was discontinued. If a designated hedged item is sold or matures before the related derivative financial instrument ceases to exist, all gains or losses are immediately recognized in profit or loss under “Net income on securities at fair value through profit or loss”.
R) FINANCIAL GUARANTEESA financial guarantee is a contract or an indemnification agreement that contingently requires Desjardins Group entities to make payments to the guaranteed party following a loss resulting from the default by a specified third party to make a payment upon maturity in accordance with the original or modified provisions of the borrowing instrument.
Financial guarantees are initially recognized in the Combined Financial Statements at fair value at the date the guarantee is issued. After initial recognition, the guarantee is measured at the higher of the following amounts:
(i) The amount initially recorded less, when appropriate, cumulative amortization of costs recognized in profit or loss
(ii) The best estimate of the expenditure required to settle any financial obligation resulting from the guarantee
The obligations related to financial guarantees issued by Desjardins Group are presented under “Other liabilities – Derivative financial instruments”. The carrying amount of guarantees does not reflect the maximum potential amount of future payments under guarantees. Therefore, Desjardins Group continues to consider these guarantees as off-balance sheet credit instruments.
S) RESERVESReserves included in equity are mainly from the caisses. They are based on the balance of the reserves as at December 31 of the prior year and the surplus earnings distribution plans for such year, which must be approved by the general meeting of each caisse within the first four months following year-end.
The stabilization reserve consists of amounts appropriated by the caisses and the Federation. Amounts appropriated to the stabilization reserve are essentially used for the payment of interest on permanent shares when the surplus earnings of a caisse are not sufficient.
The reserve for future member dividends is made up of amounts appropriated by the caisses. This reserve allows them to manage over time the impact of changes in annual surplus earnings on the payment of member dividends.
The general reserve is essentially made up of amounts appropriated by the caisses, the Federation, the Fonds de sécurité Desjardins and Caisse centrale Desjardins. This reserve can be used only to eliminate a deficit and cannot be divided amongst members nor used to pay member dividends.

1232012 DESJARDINS GROUP ANNUAL REPORT – NOTES TO THE COMBINED FINANCIAL STATEMENTS
NOTE 2
SIGNIFICANT ACCOUNTING POLICIES (CONTINUED)T) REVENUE RECOGNITION Revenues are recognized to the extent that it is probable that the economic benefits will flow to Desjardins Group and that they can be measured reliably. In addition to the items mentioned in section B), “Financial assets and liabilities”, the specific recognition criteria that follow must also be met before revenues can be recognized.
NET INTEREST INCOME
Interest income and expense are mainly earned or incurred by the Personal Services and Business and Institutional Services segment and the Other category. They are recognized using the effective interest method for all financial instruments measured at amortized cost, for all interest-bearing financial assets classified in the “Available for sale” category and for financial instruments classified in the “At fair value through profit or loss” category.
The effective interest method is a method of calculating the amortized cost of a financial asset or a financial liability and of allocating the interest income or interest expense over the relevant period. The effective interest rate is the rate that exactly discounts future cash payments or receipts through the expected life of the financial instrument or, when appropriate, over a shorter period to obtain the net carrying amount of the financial asset and the financial liability.
When calculating the effective interest rate, Desjardins Group estimates cash flows considering all contractual terms of the financial instrument (for example, prepayment options) but does not consider future credit losses. The calculation includes transaction costs and income between parties to the contract as well as premiums or discounts. Transaction costs and income that form an integral part of the effective rate of the contract, such as file setup fees and finders’ fees, are assimilated to supplemental interest.
PREMIUMS
Gross premiums on insurance contracts of the life and health insurance subsidiaries are recognized as revenues when they become due. As soon as these premiums are recognized, an actuarial provision is established and recognized in liabilities under “Insurance and investment contract liabilities”. Premiums are presented, net of premiums ceded under reinsurance treaties, under “Net premiums” in the Combined Statements of Income.
Gross premiums on insurance contracts of the property and casualty insurance subsidiaries are recognized as revenues proportionately over the life of the insurance contracts. Premiums are presented, net of premiums ceded under reinsurance treaties, under “Net premiums” in the Combined Statements of Income. The portion of the premiums remaining to be earned at the reporting date is presented in liabilities under “Insurance and investment contract liabilities”, in the Combined Balance Sheets.
SERVICE CHARGES, COMMISSIONS, BROKERAGE FEES AND OTHER
Desjardins Group earns revenues from service charges, commissions and brokerage fees as a result of the broad range of products and services it provides its members and clients.
Service charges, commissions and brokerage fees are recognized once the service has been provided or the product has been delivered. Income from service charges is recognized under “Deposit and payment service charges” and “Brokerage, investment fund and trust services” in the Combined Statements of Income.
Loan syndication fees are recognized as revenues when the syndication agreement is signed unless the yield on the loan retained by Desjardins Group is less than the yield of other comparable lending institutions that participate in the financing. In such instances, an appropriate portion of the fees is deferred using the effective interest method.
Commissions and costs arising from the negotiation, or the participation thereto, of a transaction on behalf of a third party—such as the arrangement of share or other securities acquisitions or business purchases or sales—are recognized at the outcome of the underlying transactions.
Fee income is recorded under “Lending fees and credit card service revenues” in the Combined Statements of Income.
Portfolio management fees and fees for other services are recognized based on the applicable service contracts, pro rata over the period during which the service is provided. Portfolio management income is recognized under “Other income – Other” in the Combined Statements of Income.
Asset management fees related to investment funds are recognized pro rata over the period during which the service is provided. The same principles are applied to wealth management, financial planning and custodial services that are provided on an ongoing basis over a long period of time. Asset management income is recorded under “Other income – Other” in the Combined Statements of Income.

124 2012 DESJARDINS GROUP ANNUAL REPORT – NOTES TO THE COMBINED FINANCIAL STATEMENTS
NOTE 2
SIGNIFICANT ACCOUNTING POLICIES (CONTINUED)U) ASSETS UNDER MANAGEMENT AND UNDER ADMINISTRATIONAssets under management and under administration are held by and for the benefit of clients. These assets under management and under administration are therefore excluded from the Combined Balance Sheets of Desjardins Group. Income from these management services is recognized under “Other income – Other” in the Combined Statements of Income when the service is provided.
V) FOREIGN CURRENCY TRANSLATIONMonetary assets and liabilities denominated in foreign currencies are translated into Canadian dollars at the exchange rate prevailing at the reporting date. Non-monetary assets and liabilities measured at historical cost are translated at the exchange rate prevailing at the transaction date, while those that are measured at fair value are translated at the exchange rate prevailing at the date fair value was determined. Income and expenses are translated at the average exchange rate for the year. Realized and unrealized gains and losses resulting from the translation are recognized in the Combined Statements of Income under “Other income – Other”. However, unrealized gains and losses on non-monetary financial instruments classified as “Available for sale”, and gains and losses on derivatives designated as cash flow hedges are presented in other comprehensive income in the Combined Statements of Comprehensive Income.
W) LEASESIn a finance lease, the lessor transfers to the lessee substantially all the risks and rewards inherent to the asset. This type of lease is analyzed as financing granted to the lessee to purchase the asset. In contrast, in an operating lease, the lessor retains substantially all the risks and rewards inherent to the leased asset. Desjardins Group mainly enters into operating leases. The recognition of operating leases depends on the position of Desjardins Group, namely as a lessor or as a lessee.
LESSOR
Initial indirect costs incurred in negotiating an operating lease are added to the carrying amount of the leased asset, which is recognized as property, plant and equipment by the lessor and depreciated on a straight-line basis over the lease period. The asset is amortized without consideration to residual value, and all lease payments are recognized in profit or loss on a straight-line basis over the lease period. These lease payments are recognized under “Net other investment income”.
LESSEE
The asset is not recognized as an asset by the lessee. Lease payments made under operating leases are recognized on a straight-line basis over the lease period under “Premises, equipment and furniture, including depreciation”, in the Combined Statements of Income.
X) INCOME TAXES ON SURPLUS EARNINGS The income tax expense on surplus earnings comprises the current income tax expense and the deferred tax expense. Income taxes on surplus earnings are recognized in the Combined Statements of Income unless they relate to items that were recognized outside profit or loss directly in the Combined Statements of Comprehensive Income or the Combined Statements of Changes in Equity. In such case, income taxes on surplus earnings are also recognized outside profit or loss.
The calculation of income taxes on surplus earnings is based on the expected tax treatment of the transactions. To determine the current and deferred portions of income taxes on surplus earnings, assumptions must be made concerning the dates on which deferred income tax assets and liabilities will be reversed. If Desjardins Group’s interpretation differs from that of the taxation authorities or if the reversal dates do not correspond with the forecasted dates, the provision for income taxes on surplus earnings may increase or decrease in subsequent years.
CURRENT INCOME TAXES
Current income tax assets and liabilities for the current year and prior years are measured based on the amount expected to be paid to or recovered from the taxation authorities. Tax rates and tax laws applied to determine these amounts are those that have been enacted or substantively enacted at the reporting date.
DEFERRED INCOME TAXES
Deferred taxes are recognized, using the balance sheet liability method, for all temporary differences existing at the reporting date between the tax basis of assets and liabilities and their carrying amount in the Combined Balance Sheets.
Deferred tax liabilities are recognized for all taxable temporary differences, except in the following cases:
(i) When the deferred tax liability arises from the initial recognition of goodwill or the initial recognition of an asset or liability in a transaction which is not a business combination and which, at the time of the transaction, affects neither accounting profit nor taxable profit (or tax loss)
(ii) For taxable temporary differences associated with investments in subsidiaries, when the date at which the temporary difference reverses can be controlled and it is probable that the temporary difference will not reverse in the foreseeable future
1252012 DESJARDINS GROUP ANNUAL REPORT – NOTES TO THE COMBINED FINANCIAL STATEMENTS
NOTE 2
SIGNIFICANT ACCOUNTING POLICIES (CONTINUED)Deferred tax assets are recognized for all deductible temporary differences, tax loss carryforwards and unused tax credits, to the extent that it is probable that a taxable profit will be available against which these deductible temporary differences, tax loss carryforwards and unused tax credits can be utilized, except in the following cases:
(i) When the deferred tax asset associated with the deductible temporary difference arises from the initial recognition of an asset or liability in a transaction which is not a business combination and which, at the time of the transaction, affects neither accounting profit nor taxable profit (or tax loss).
(ii) For deductible temporary differences associated with investments in subsidiaries, associates and joint ventures. Deferred tax assets are recognized only to the extent that it is probable that the temporary difference will reverse in the foreseeable future and that a taxable profit will be available against which the temporary difference can be utilized.
The carrying amount of a deferred tax asset is reviewed at each reporting date and reduced to the extent that it is no longer probable that sufficient taxable profit will be available to allow the benefit of part or all of the deferred tax asset to be utilized. Unrecognized deferred tax assets are reassessed at each reporting date and are recognized to the extent that it becomes probable that a future taxable profit will be available to recover them.
Deferred tax assets and liabilities are measured at the tax rates that are expected to apply to the period when the asset is realized or the liability is settled, based on tax rates (and tax laws) that have been enacted or substantively enacted at the reporting date.
Current and deferred taxes related to items recognized directly in equity are recognized in equity and not in profit or loss.
Deferred tax assets and liabilities are offset if there is a legally enforceable right to set off current tax assets against current tax liabilities, and if these deferred taxes relate to the same taxable entity and the same taxation authority.
Y) PROVISION FOR MEMBER DIVIDENDSThe board of directors of each caisse recommends for approval the surplus earnings distribution plan at the annual general meeting of members, which is held in the four months following year-end. The amount of member dividends to be paid is part of this plan. The amount of the provision is estimated based on, among other things, the surplus earnings recorded for the year by the caisses, taking into consideration the financial framework for the appropriation of surplus earnings in relation with the Desjardins Group Capitalization Plan, which sets capitalization targets. The difference between the amount of member dividends actually paid, in cash or in shares, following the general meetings held by the caisses, and the estimated amount of the provision is charged to combined profit or loss for the year in which the payments are made.
The allocation basis of member dividends depends on the interest recorded on loans and deposits, the average outstanding amount of Desjardins investment funds, guaranteed market-linked investments, Accord D loans obtained by the member through the caisse, and the various service charges collected from the member depending on the services used. The surplus earnings distribution plan takes into account a program under which members may elect to receive their dividends in the form of shares, in which case the value is greater than the equivalent dividends paid in cash. Whether paid in shares or cash, member dividends are recognized under “Provision for member dividends” in the Combined Statements of Income. The caisses can pay out member dividends when legal and regulatory requirements have been met. The provision for member dividends is mainly allocated to the Personal Services and Business and Institutional Services segment.
Z) EMPLOYEE BENEFITS
SHORT-TERM BENEFITS
Short-term benefits are benefits payable within 12 months after the reporting date, other than termination benefits, such as salaries and commissions, social security contributions and certain bonuses. An expense is recorded for these short-term benefits in the period during which the services giving right to them were rendered.
POST-EMPLOYMENT BENEFITS
PENSION PLANS
Desjardins Group offers to a majority of its employees pension plans and supplemental pension plans, which provide pension benefits in excess of statutory limits. Most of the pension plans represent defined benefit group pension plans of which the risks are shared by the Desjardins Group participating entities. In addition, the main pension plan is funded by both employee and employer contributions , which are determined based on the financial position and the funding policy of the plan.
126 2012 DESJARDINS GROUP ANNUAL REPORT – NOTES TO THE COMBINED FINANCIAL STATEMENTS
NOTE 2
SIGNIFICANT ACCOUNTING POLICIES (CONTINUED)Defined benefit pension plans are plans for which Desjardins Group has formally committed to a level of benefits and therefore assumes actuarial and, when the plans are funded, investment risks. Benefits are calculated on the basis of the number of years of membership in the pension plans and take into consideration the average salary of the employee’s five most highly paid years. Since the terms of the plans are such that future changes in salary levels will have an impact on the amount of future benefits, the cost of the benefits and the fair value of the defined benefit plan obligation are generally actuarially determined using the projected unit credit method. These calculations are made based on management’s best estimate assumptions concerning the expected rate of return of the plans’ investments and the plan obligation discount rate, and also, but to a lesser extent, salary increases, the retirement age of employees, the mortality rate and the rate of increase in pension benefits. A complete actuarial valuation is performed each year by a qualified actuary.
Actuarial gains (losses) result from the difference between the actual return on plan assets and the expected return for funded plans, the changes made to the actuarial assumptions used to determine the defined benefit plan obligation and the experience gains or losses on this obligation. Any net actuarial gain or loss exceeding 10% of the greater of the value of the defined benefit plan obligation and the fair value of plan assets at the end of the previous year is amortized over the expected average remaining working lives of the plan members.
Past service cost is recognized in profit or loss on a straight-line basis over the average period until the benefits become vested. To the extent that the benefits are already vested immediately following the introduction of, or changes to, a defined benefit plan, vested past service cost is recognized in profit or loss immediately.
Defined benefit assets or liabilities correspond to the present value of the obligation of these plans less the unrecognized past service cost, the fair value of pension plan assets and unamortized actuarial losses, plus unamortized actuarial gains. The value of any asset is limited to the total of actuarial losses, unrecognized past service cost and the present value of any economic benefits available in the form of refunds from the plans or reductions in future contributions to the pension plans.
Defined benefit pension plan liabilities are recognized under “Defined benefit plan liabilities” in the Combined Balance Sheets.
OTHER PLANS
Desjardins Group also offers medical, dental and life insurance coverage to retiring employees and their dependants through unfunded defined benefit plans. The main plan is a defined benefit group pension plan of which the risks are shared by the Desjardins Group participating entities. The terms of these plans are such that future changes in salary levels or health costs will have an impact on the amount of future benefits. The cost of these benefits is accrued over the service lives of employees according to accounting policies similar to those used for defined benefit pension plans.
Liabilities related to these other post-employment benefit plans are recognized under “Defined benefit plan liabilities” in the Combined Balance Sheets.
NOTE 3
FUTURE ACCOUNTING CHANGESAccounting standards that have been issued but are not yet effective are listed below. Regulatory authorities have also stated that early adoption of these standards will not be permitted.
DATE OF APPLICATION: JANUARY 1, 2013
IFRS 10, “CONSOLIDATED FINANCIAL STATEMENTS”
In May 2011, the IASB issued IFRS 10, “Consolidated Financial Statements”, which defines the principle of control and establishes that control serves as the basis to determine which entities are included in the scope of consolidation. This new standard supersedes the requirements on consolidated financial statements included in IAS 27, “Consolidated and Separate Financial Statements”, and SIC 12, “Consolidation – Special Purpose Entities”.
Desjardins Group is currently assessing the impact of the adoption of this new standard, which must be applied retrospectively.
IFRS 11, “JOINT ARRANGEMENTS”
In May 2011, the IASB issued IFRS 11, “Joint Arrangements”, which supersedes IAS 31, “Interests in Joint Ventures” and SIC 13, “Jointly Controlled Entities – Non-Monetary Contributions by Venturers”. This standard establishes principles for accounting for two types of joint arrangements, namely joint operations and joint ventures, and eliminates the possibility of recognizing joint ventures using the proportionate consolidation method.
The adoption of this new standard will have no impact on Desjardins Group since interests in joint ventures are already recognized using the equity method. This new standard must be applied retrospectively.

1272012 DESJARDINS GROUP ANNUAL REPORT – NOTES TO THE COMBINED FINANCIAL STATEMENTS
NOTE 3
FUTURE ACCOUNTING CHANGES (CONTINUED)IFRS 12, “DISCLOSURE OF INTERESTS IN OTHER ENTITIES”
In May 2011, the IASB issued IFRS 12, “Disclosure of Interests in Other Entities”, which expands disclosure requirements for interests held by an entity in subsidiaries, joint arrangements, associates and unconsolidated structured entities. Some of the disclosures were already required by the current standards, while others are new, such as disclosures about significant judgments and assumptions the entity has made in determining the nature of its interests in another entity as well as the nature of, and risks associated with, its interests in other entities.
IFRS 12 is a new presentation standard that will have no impact on Desjardins Group’s results or financial position. It must be applied retrospectively.
IFRS 13, “FAIR VALUE MEASUREMENT”
In May 2011, the IASB issued IFRS 13, “Fair Value Measurement”, which defines fair value and sets out a single framework for measuring the fair value of all transactions and balances for which IFRS require or permit fair value measurement. This standard aims at improving the consistency between the various fair value concepts defined in various existing standards. In addition, IFRS 13 carries forward disclosure requirements concerning the fair value of financial instruments and expands the scope to all items measured at fair value.
With respect to fair value measurements, Desjardins Group does not expect the adoption of this new standard, which is applicable prospectively, to have a significant impact.
IAS 1, “PRESENTATION OF FINANCIAL STATEMENTS”
In June 2011, the IASB issued amendments to IAS 1, “Presentation of Financial Statements”, which improve the presentation of items of other comprehensive income. The amendments require the presentation by nature of items of other comprehensive income by distinguishing those that will be reclassified to the statement of income in a subsequent period from those that will not.
IAS 1 is a presentation standard whose objective is to provide information to enable users to better understand financial statements. The amendments to this standard will have no impact on Desjardins Group’s results or financial position. They must be applied retrospectively.
IAS 19, “EMPLOYEE BENEFITS”
In June 2011, the IASB issued an amended version of IAS 19, “Employee Benefits” (IAS 19(R)), which requires that the funding status of a defined benefit plan be entirely reflected in the Combined Balance Sheets. This change therefore eliminates the option to defer the recognition of actuarial gains and losses, known as the “corridor approach”. All actuarial gains and losses will now be recognized immediately in other comprehensive income. The calculation of the interest cost recognized in the Combined Statements of Income is also amended. This interest cost will now be calculated by multiplying the net defined benefit plan asset or liability by the rate used to discount the obligation, and the difference between the actual return on plan assets and the amount recognized as interest cost will be recognized in other comprehensive income. In addition, all past service costs will now be directly recognized in profit or loss when they occur. Furthermore, the risk-sharing features between employers and employees for defined benefit plans will now be taken into account when determining the liability to be recognized in the Combined Balance Sheets and the expense to be recognized in the Combined Statements of Income. The presentation and recognition of changes in the defined benefit plan obligation and plan assets will therefore be modified, and disclosures about the characteristics of defined benefit plans and the risks to which an entity is exposed through its participation in such plans will be enhanced. Desjardins Group will have to apply this new standard retrospectively.
Accordingly, the main impact of Desjardins Group’s adopting IAS 19(R) will be the recognition of unamortized actuarial losses and unrecognized past service cost under “Defined benefit plan liabilities” in the Combined Balance Sheets. This will result in a decrease in “Undistributed surplus earnings” (for more information, please refer to Note 26, “Defined benefits plans”). In addition, taking into account the risk-sharing features between employers and employees for the main group pension plan will result in a decrease in “Defined benefit plan liabilities” and a corresponding increase in “Undistributed surplus earnings”. Desjardins Group is currently assessing the impact of the changes related to risk sharing. The impact of these amendments on capital ratios could be deferred and amortized on a straight-line basis over the period from January 1, 2013, to December 31, 2014, depending on whether Desjardins Group elects to use transitional provision stipulated for that purpose by the regulatory authorities.

128 2012 DESJARDINS GROUP ANNUAL REPORT – NOTES TO THE COMBINED FINANCIAL STATEMENTS
NOTE 3
FUTURE ACCOUNTING CHANGES (CONTINUED)IFRS 7, “FINANCIAL INSTRUMENTS: DISCLOSURES” – OFFSETTING FINANCIAL ASSETS AND FINANCIAL LIABILITIES
In December 2011, the IASB issued amendments to IFRS 7, “Financial Instruments: Disclosures”. These amendments improve the disclosure requirements with respect to offsetting of financial assets and liabilities. The objective of these amendments is to help users of financial statements better evaluate the impact of netting agreements on the financial position of an entity and understand how an entity manages the credit risk associated with such agreements.
IFRS 7 is a presentation standard whose objective is to provide disclosures to enable the users , among other things, to better understand and evaluate the significance of financial instruments for the entity’s financial position and performance. Since the amendments to this standard specifically concern disclosures, they have no impact on Desjardins Group’s results or financial position. They must be applied retrospectively.
ANNUAL IMPROVEMENTS
In May 2012, the IASB issued amendments to several standards as part of its annual improvement process. Except for the amendment to IAS 32, “Financial Instruments: Presentation”, these amendments are minor and will have no impact on Desjardins Group’s results or financial position.
The amendment to IAS 32 specifies that the income tax consequences of dividends and remuneration on capital stock should now be recognized in accordance with IAS 12, “Income Taxes”. Therefore, when certain conditions are met, the income tax consequences of dividends and remuneration on capital stock will have to be presented in profit or loss rather than in equity. This amendment will be applied retrospectively.
Accordingly, there will be no impact on Desjardins Group’s financial position as at January 1 and December 31, 2012. However, certain comparative figures will have to be reclassified from the Combined Statement of Changes in Equity to the Combined Statement of Income for the year ended December 31, 2012. “Income tax recovery on remuneration of permanent shares”, in the Combined Statement of Changes in Equity, will decrease by $25 million, and “Income taxes on surplus earnings”, in the Combined Statement of Income, will decrease by a corresponding amount.
DATE OF APPLICATION: JANUARY 1, 2014
IAS 32, “FINANCIAL INSTRUMENTS: PRESENTATION”
In December 2011, the IASB issued amendments to IAS 32, “Financial Instruments: Presentation”, to clarify the criteria for offsetting a financial asset and a financial liability.
Desjardins Group is currently assessing the impact of the amendments to this standard, which must be applied prospectively.
DATE OF APPLICATION: JANUARY 1, 2015
IFRS 9, “FINANCIAL INSTRUMENTS”
The IASB issued in November 2009 and amended in October 2010 the first phase of a project to replace IAS 39, “Financial Instruments: Recognition and Measurement”. This standard defines a new way of classifying and measuring financial assets and liabilities. Financial assets will be classified in two categories (amortized cost and fair value through profit or loss) based on the entity’s business model for managing its financial assets and the contractual cash flow characteristics of the financial assets. However, a new exposure draft issued in November 2012 proposes the introduction of a third financial instrument category for debt securities: fair value through other comprehensive income.
Financial liabilities will be classified in the same categories as those defined in IAS 39, but measurement of financial liabilities under the fair value option has been modified.
The impairment of financial asset methodology and hedging activities will be covered in future phases.
Desjardins Group is currently assessing the impact of the adoption of IFRS 9. The application of all phases of this standard is expected to be prospective.

1292012 DESJARDINS GROUP ANNUAL REPORT – NOTES TO THE COMBINED FINANCIAL STATEMENTS
NOTE 4
CARRYING AMOUNT OF FINANCIAL INSTRUMENTSCLASSIFICATION AND CARRYING AMOUNT OF FINANCIAL INSTRUMENTSThe following tables present the carrying amount of all financial assets and liabilities according to their classification in the categories defined in the financial instrument standards, as well as those designated in hedging relationships.
As at December 31, 2012At fair value
through profit or loss
Held for trading
Designated as at fair value
through profit or loss
Availablefor sale
Loans and receivables, and financial liabilities at amortized
cost
Derivatives designated as hedging
instruments(2) Total
Financial assetsCash and deposits with financial institutions $ — $ — $ — $ 1,669 $ — $ 1,669Securities Securities at fair value through profit or loss 8,994 12,992 — — — 21,986 Available-for-sale securities — — 18,326 — — 18,326Securities borrowed or purchased under reverse repurchase agreements — — — 4,377 — 4,377Loans(1) — — — 132,576 — 132,576Other financial assets Clients’ liability under acceptances — — — 841 — 841 Derivative financial instruments 1,278 — — — 960 2,238 Amounts receivable from clients, brokers and financial institutions — — — 970 — 970 Other — — — 2,000 — 2,000
Total financial assets $ 10,272 $ 12,992 $ 18,326 $ 142,433 $ 960 $ 184,983
Financial liabilitiesDeposits $ — $ — $ — $ 129,624 $ — $ 129,624Other financial liabilities Acceptances — — — 841 — 841 Commitments related to securities sold short 4,977 — — — — 4,977 Commitments related to securities lent or sold under
repurchase agreements — — — 7,983 — 7,983 Derivative financial instruments 986 — — — 236 1,222 Amounts payable to clients, brokers and financial institutions — — — 2,504 — 2,504 Other 1 — — 2,965 — 2,966Subordinated bonds — — — 3,081 — 3,081
Total financial liabilities $ 5,964 $ — $ — $ 146,998 $ 236 $ 153,198
(1) For more information, see Note 7, “Loans and allowance for credit losses”.(2) For details on derivatives designated as hedging instruments, see Note 17, “Derivative financial instruments and hedging activities”.

130 2012 DESJARDINS GROUP ANNUAL REPORT – NOTES TO THE COMBINED FINANCIAL STATEMENTS
NOTE 4
CARRYING AMOUNT OF FINANCIAL INSTRUMENTS (CONTINUED)As at December 31, 2011
At fair value through profit or loss
Held fortrading
Designated as at fair value
through profit or loss
Availablefor sale
Loans and receivables, and financial liabilities at
amortized cost
Derivative designatedas hedging
instruments (2) Total
Financial assetsCash and deposits with financial institutions $ — $ — $ — $ 1,356 $ — $ 1,356Securities Securities at fair value through profit or loss 9,494 12,985 — — — 22,479 Available-for-sale securities — — 18,726 — — 18,726Securities borrowed or purchased under reverse repurchase agreements — — — 4,959 — 4,959Loans(1) — — — 125,154 — 125,154Other financial assets Clients’ liability under acceptances — — — 676 — 676 Derivative financial instruments 1,455 — — — 1,604 3,059 Amounts receivable from clients, brokers and financial institutions — — — 1,274 — 1,274 Other — — 18 1,801 — 1,819
Total financial assets $ 10,949 $ 12,985 $ 18,744 $ 135,220 $ 1,604 $ 179,502
Financial liabilitiesDeposits $ — $ — $ — $ 123,403 $ — $ 123,403Other financial liabilities Acceptances — — — 676 — 676 Commitments related to securities sold short 5,341 — — — — 5,341 Commitments related to securities lent or sold under
repurchase agreements — — — 8,500 — 8,500 Derivative financial instruments 1,162 — — — 431 1,593 Amounts payable to clients, brokers and financial institutions — — — 3,762 — 3,762 Other — — — 3,164 — 3,164Subordinated bonds — — — 3,350 — 3,350
Total financial liabilities $ 6,503 $ — $ — $ 142,855 $ 431 $ 149,789
(1) For more information, see Note 7, “Loans and allowance for credit losses”.(2) For details on derivatives designated as hedging instruments, see Note 17, “Derivative financial instruments and hedging activities”.
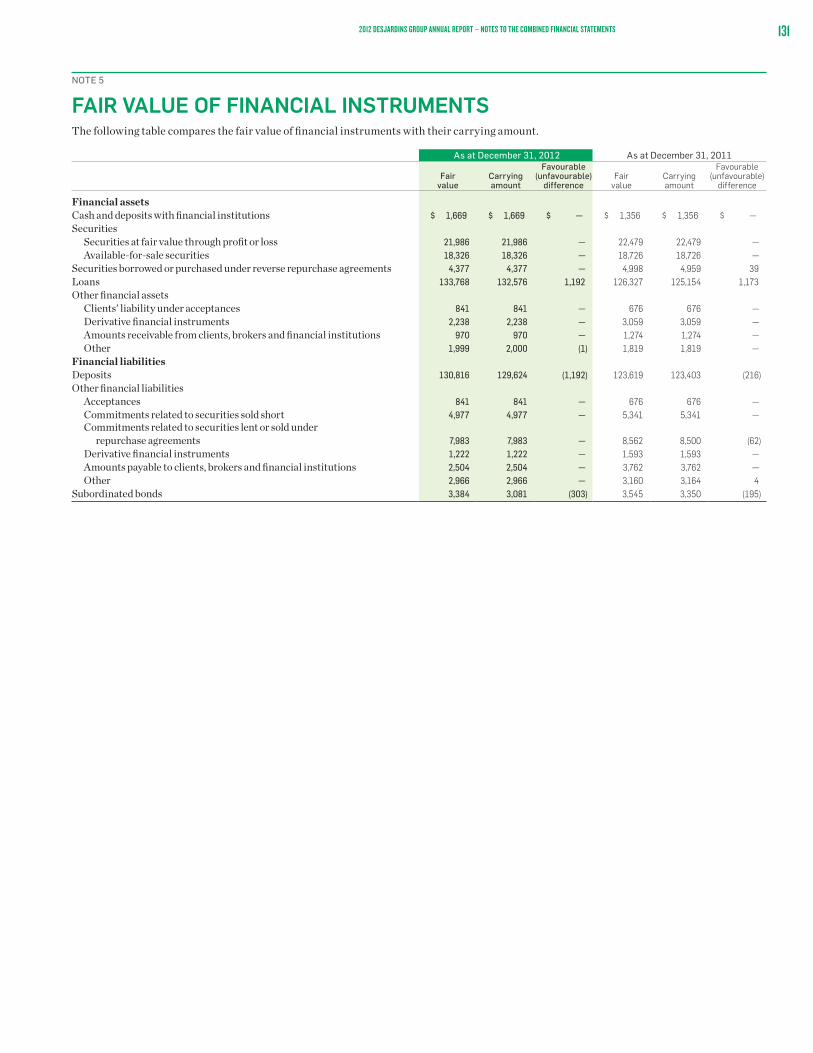
1312012 DESJARDINS GROUP ANNUAL REPORT – NOTES TO THE COMBINED FINANCIAL STATEMENTS
NOTE 5
FAIR VALUE OF FINANCIAL INSTRUMENTSThe following table compares the fair value of financial instruments with their carrying amount.
As at December 31, 2012 As at December 31, 2011
Fairvalue
Carrying amount
Favourable (unfavourable)
differenceFair
valueCarrying amount
Favourable (unfavourable)
difference
Financial assetsCash and deposits with financial institutions $ 1,669 $ 1,669 $ — $ 1,356 $ 1,356 $ —Securities Securities at fair value through profit or loss 21,986 21,986 — 22,479 22,479 — Available-for-sale securities 18,326 18,326 — 18,726 18,726 —Securities borrowed or purchased under reverse repurchase agreements 4,377 4,377 — 4,998 4,959 39Loans 133,768 132,576 1,192 126,327 125,154 1,173Other financial assets Clients’ liability under acceptances 841 841 — 676 676 — Derivative financial instruments 2,238 2,238 — 3,059 3,059 — Amounts receivable from clients, brokers and financial institutions 970 970 — 1,274 1,274 — Other 1,999 2,000 (1) 1,819 1,819 —Financial liabilitiesDeposits 130,816 129,624 (1,192) 123,619 123,403 (216)Other financial liabilities Acceptances 841 841 — 676 676 — Commitments related to securities sold short 4,977 4,977 — 5,341 5,341 — Commitments related to securities lent or sold under
repurchase agreements 7,983 7,983 — 8,562 8,500 (62) Derivative financial instruments 1,222 1,222 — 1,593 1,593 — Amounts payable to clients, brokers and financial institutions 2,504 2,504 — 3,762 3,762 — Other 2,966 2,966 — 3,160 3,164 4Subordinated bonds 3,384 3,081 (303) 3,545 3,350 (195)

132 2012 DESJARDINS GROUP ANNUAL REPORT – NOTES TO THE COMBINED FINANCIAL STATEMENTS
NOTE 5
FAIR VALUE OF FINANCIAL INSTRUMENTS (CONTINUED)LEVELS OF FAIR VALUE HIERARCHYThe measurement of financial instruments recognized at fair value is determined using the following three levels of the fair value hierarchy:
•Level1–Valuationtechniquesbasedonquotedprices(unadjusted)inactivemarketsforidenticalassetsorliabilities •Level2–Valuationtechniquesbasedprimarilyonobservablemarketdata •Level3–Valuationtechniquesnotbasedprimarilyonobservablemarketdata
The following tables present the breakdown of fair value measurements of financial instruments recognized at fair value in the Combined Balance Sheets.
As at December 31, 2012Level 1 Level 2 Level 3 Total
Financial assetsSecurities Securities at fair value through profit or loss $ 14,917 $ 4,574 $ 2,495 $ 21,986 Available-for-sale securities 13,941 4,311 74 18,326Other financial assets Derivative financial instruments — 2,212 26 2,238
Total financial assets $ 28,858 $ 11,097 $ 2,595 $ 42,550
Financial liabilitiesOther financial liabilities Commitments related to securities sold short $ 4,914 $ 63 $ — $ 4,977 Derivative financial instruments — 1,203 19 1,222
Total financial liabilities $ 4,914 $ 1,266 $ 19 $ 6,199
As at December 31, 2011Level 1 Level 2 Level 3 Total
Financial assetsSecurities Securities at fair value through profit or loss $ 16,178 $ 4,186 $ 2,115 $ 22,479 Available-for-sale securities 14,550 4,111 65 18,726Other financial assets Derivative financial instruments 2 2,897 160 3,059 Other 18 — — 18
Total financial assets $ 30,748 $ 11,194 $ 2,340 $ 44,282
Financial liabilitiesOther financial liabilities Commitments related to securities sold short $ 5,249 $ 92 $ — $ 5,341 Derivative financial instruments 7 1,586 — 1,593
Total financial liabilities $ 5,256 $ 1,678 $ — $ 6,934
During the year ended December 31, 2012, $31 million in bonds was transferred from Level 2 to Level 1, and $6 million in money market securities was transferred from Level 2 to Level 1 due to the availability of quoted prices. In addition, during the year ended December 31, 2011, government bonds of $625 million were transferred from Level 2 to Level 1 to more adequately reflect the valuation methodology for these securities.

1332012 DESJARDINS GROUP ANNUAL REPORT – NOTES TO THE COMBINED FINANCIAL STATEMENTS
NOTE 5
FAIR VALUE OF FINANCIAL INSTRUMENTS (CONTINUED)CHANGES IN FAIR VALUE OF FINANCIAL INSTRUMENTS CLASSIFIED IN LEVEL 3The following tables present the reconciliation from the beginning balance to the ending balance for Level 3 of the hierarchy, namely financial instruments whose fair value is determined using valuation techniques not based on observable market data.
As at December 31, 2012
Beginningbalance
Realized gains/losses recognized
in profit or loss(1)
Unrealized gains/losses recognized
in profit or loss(2)
Unrealized gains/losses recognized
in other compre hensive
income(3)
Transfers of instruments
intoLevel 3
Purchases/Issuances
Sales/ Settlements
Endingbalance
Financial assetsSecurities Securities at fair value through profit or loss $ 2,115 $ — $ 383 $ — $ — $ 63 $ (66) $ 2,495 Available-for-sale securities(1) 65 1 — 1 — 12 (5) 74Other financial assets Derivative financial instruments 160 — (134) — — — — 26
Total financial assets $ 2,340 $ 1 $ 249 $ 1 $ — $ 75 $ (71) $ 2,595
Financial liabilitiesOther financial liabilities Derivative financial instruments $ — $ (5) $ — $ — $ 20 $ 6 $ (2) $ 19
Total financial liabilities $ — $ (5) $ — $ — $ 20 $ 6 $ (2) $ 19
As at December 31, 2011
Beginningbalance
Realized gains/losses recognized
in profit or loss(1)
Unrealized gains/losses recognized
in profit or loss(2)
Unrealized gains/losses recognized
in other compre hensive
income(3)
Transfers of instruments
intoLevel 3
Purchases/Issuances
Sales/ Settlements
Endingbalance
Financial assetsSecurities Securities at fair value through profit or loss $ 1,951 $ (6) $ 94 $ — $ — $ 200 $ (124) $ 2,115 Available-for-sale securities(1) 11 1 — 4 — 50 (1) 65Other financial assets Derivative financial instruments 161 — (1) — — — — 160
Total financial assets $ 2,123 $ (5) $ 93 $ 4 $ — $ 250 $ (125) $ 2,340
Financial liabilitiesOther financial liabilities Derivative financial instruments $ 16 $ — $ — $ — $ — $ — $ (16) $ —
Total financial liabilities $ 16 $ — $ — $ — $ — $ — $ (16) $ —
(1) Realized gains or losses on financial assets held for trading and designated as at fair value through profit or loss are presented under “Net income on securities at fair value through profit or loss”. Realized gains or losses on available-for-sale financial assets are recognized under “Net income on available-for-sale securities”.
(2) Unrealized gains or losses on financial assets held for trading and designated as at fair value through profit or loss are presented under “Net income on securities at fair value through profit or loss”.(3) Unrealized gains or losses on available-for-sale financial assets are recognized under “Unrealized gains on available-for-sale securities” in the Combined Statements of Comprehensive Income.
SENSITIVITY OF LEVEL 3 FINANCIAL ASSETS AND FINANCIAL LIABILITIES
Desjardins Group performs sensitivity analyses for the fair value measurements of financial instruments classified in Level 3. Changing unobservable inputs to one or more reasonably possible alternative assumptions does not significantly change the fair value of financial instruments classified in Level 3, except for asset-backed term notes (ABTNs) and the total return swap hedging ABTNs, for which a sensitivity analysis is provided in the “Asset-backed term notes” section of Note 6, “Securities”.

134 2012 DESJARDINS GROUP ANNUAL REPORT – NOTES TO THE COMBINED FINANCIAL STATEMENTS
NOTE 6
SECURITIESMATURITIES OF SECURITIESThe following tables present an analysis of the maturity terms of Desjardins Group’s securities.
As at December 31, 2012Terms to maturity
Under1 year
1 to3 years
Over 3 to 5 years
Over 5 to 10 years
Over10 years
No specific maturity Total
Securities at fair value through profit or loss Securities held for trading Securities issued or guaranteed by Canada $ 404 $ 777 $ 747 $ 1,376 $ 1,177 $ — $ 4,481 Provinces and municipal corporations in Canada 683 857 403 477 763 — 3,183 Other public administrations 14 48 161 20 49 — 292 Other securities in Canada Financial institutions 557 228 44 9 33 — 871 Other issuers 5 22 18 22 4 — 71 Shares — — — — — 10 10 Securities from foreign issuers 41 — — — 12 33 86
Total securities held for trading 1,704 1,932 1,373 1,904 2,038 43 8,994
Securities designated as at fair value through profit or loss Securities issued or guaranteed by Canada 295 348 — 3 16 — 662 Provinces and municipal corporations in Canada 91 423 360 768 4,959 — 6,601 Other public administrations 1 — — — 179 — 180 Other securities in Canada Financial institutions 12 164 284 151 168 — 779 Other issuers(1) 181 281 233 556 2,743 — 3,994 Shares — — — — — 328 328 Securities from foreign issuers — 18 — — 54 376 448
Total securities designated as at fair value through profit or loss 580 1,234 877 1,478 8,119 704 12,992
Total securities at fair value through profit or loss 2,284 3,166 2,250 3,382 10,157 747 21,986
Available-for-sale securities Securities issued or guaranteed by Canada 249 2,874 2,121 208 7 9 5,468 Provinces and municipal corporations in Canada 530 3,343 1,650 1,322 613 2 7,460 Other public administrations 18 — — 5 29 — 52 Other securities in Canada Financial institutions 1,512 1,470 661 35 18 — 3,696 Other issuers 7 38 50 76 65 2 238 Shares — — — — 3 775 778 Securities from foreign issuers — 2 — — — 632 634
Total available-for-sale securities 2,316 7,727 4,482 1,646 735 1,420 18,326
Total securities $ 4,600 $ 10,893 $ 6,732 $ 5,028 $ 10,892 $ 2,167 $ 40,312
(1) Includes ABTNs with a fair value of $1,705 million as at December 31, 2012.

1352012 DESJARDINS GROUP ANNUAL REPORT – NOTES TO THE COMBINED FINANCIAL STATEMENTS
NOTE 6
SECURITIES (CONTINUED)As at December 31, 2011
Terms to maturityUnder1 year
1 to3 years
Over 3 to 5 years
Over 5 to 10 years
Over10 years
No specific maturity Total
Securities at fair value through profit or loss Securities held for trading Securities issued or guaranteed by Canada $ 728 $ 1,761 $ 915 $ 935 $ 575 $ — $ 4,914 Provinces and municipal corporations in Canada 437 928 363 502 1,512 — 3,742 Other public administrations 40 5 2 52 79 — 178 Other securities in Canada Financial institutions 171 92 24 6 38 — 331 Other issuers 11 12 24 17 68 — 132 Shares — — — — — 18 18 Securities from foreign issuers 11 — — 5 122 41 179
Total securities held for trading 1,398 2,798 1,328 1,517 2,394 59 9,494
Securities designated as at fair value through profit or loss Securities issued or guaranteed by Canada 235 741 19 4 15 — 1,014 Provinces and municipal corporations in Canada 612 530 520 791 4,869 — 7,322 Other public administrations 1 1 — — 149 — 151 Other securities in Canada Financial institutions 140 80 280 157 112 — 769 Other issuers(1) 27 201 280 529 2,031 — 3,068 Shares 32 93 3 — — 273 401 Securities from foreign issuers 14 — — 9 37 200 260
Total securities designated as at fair value through profit or loss 1,061 1,646 1,102 1,490 7,213 473 12,985
Total securities at fair value through profit or loss 2,459 4,444 2,430 3,007 9,607 532 22,479
Available-for-sale securities Securities issued or guaranteed by Canada 433 3,834 2,469 276 5 — 7,017 Provinces and municipal corporations in Canada 559 2,166 1,400 1,789 608 — 6,522 Other public administrations 39 — 1 4 32 — 76 Other securities in Canada Financial institutions 1,218 1,053 1,079 279 12 — 3,641 Other issuers 10 27 86 46 60 3 232 Shares — — 3 — 9 537 549 Securities from foreign issuers — — — — — 689 689
Total available-for-sale securities 2,259 7,080 5,038 2,394 726 1,229 18,726
Total securities $ 4,718 $ 11,524 $ 7,468 $ 5,401 $ 10,333 $ 1,761 $ 41,205
(1) Includes ABTNs with a fair value of $1,368 million as at December 31, 2011.

136 2012 DESJARDINS GROUP ANNUAL REPORT – NOTES TO THE COMBINED FINANCIAL STATEMENTS
NOTE 6
SECURITIES (CONTINUED)UNREALIZED GAINS AND LOSSES ON AVAILABLE-FOR-SALE SECURITIESThe following tables present unrealized gains and losses on available-for-sale securities.
As at December 31, 2012Amortized
costUnrealizedgross gains
Unrealizedgross losses
Carryingamount
Securities issued or guaranteed by Canada $ 5,420 $ 50 $ 2 $ 5,468 Provinces and municipal corporations in Canada 7,214 246 — 7,460 Other public administrations 51 1 — 52Other securities in Canada Financial institutions 3,648 48 — 3,696 Other issuers 229 10 1 238 Shares 695 93 10 778Securities from foreign issuers 555 80 1 634
$ 17,812 $ 528 $ 14 $ 18,326
As at December 31, 2011Amortized
costUnrealizedgross gains
Unrealizedgross losses
Carryingamount
Securities issued or guaranteed by Canada $ 6,905 $ 113 $ 1 $ 7,017 Provinces and municipal corporations in Canada 6,217 306 1 6,522 Other public administrations 75 1 — 76Other securities in Canada Financial institutions 3,581 62 2 3,641 Other issuers 222 10 — 232 Shares 488 70 9 549Securities from foreign issuers 682 33 26 689
$ 18,170 $ 595 $ 39 $ 18,726
IMPAIRMENT LOSSES RECOGNIZED
During the year ended December 31, 2012, Desjardins Group concluded that there was objective evidence of impairment. An amount of $31 million ($30 million for the year ended December 31, 2011) on available-for-sale securities was recognized under “Net income on available-for-sale securities” in the Combined Statements of Income.
SECURITIES – ASSET-BACKED TERM NOTESDesjardins Group holds ABTNs the face value of which is allocated among the various following vehicles:
As at December 31,
2012
As at December 31,
2011
MAV 1 Classes A-1, A-2, B and C $ 1,913 $ 1,915
MAV 1 Class IA – Ineligible (subprime) assets 21 22 Class IA – Ineligible (other) assets 18 18
MAV 3 Class IA – Ineligible (subprime) assets 36 38 Class TA – Traditional assets 10 44
Total ineligible and traditional assets 85 122
Total MAV 1 and MAV 3 $ 1,998 $ 2,037

1372012 DESJARDINS GROUP ANNUAL REPORT – NOTES TO THE COMBINED FINANCIAL STATEMENTS
NOTE 6
SECURITIES (CONTINUED)As at December 31, 2012, the fair value of ABTNs was $1,661 million for MAV 1 A-1, A-2, B and C notes and $44 million for ineligible and traditional assets ($1,296 million for MAV 1 A-1, A-2, B and C notes and $72 million for ineligible and traditional assets as at December 31, 2011). The ABTNs are classified in the “Designated as at fair value through profit or loss” category. The fair value of the derivative financial instruments hedging ABTNs, which include a total return swap, was $32 million as at December 31, 2012 ($190 million as at December 31, 2011).
Desjardins Group participates, for an amount of $1,193 million, in the margin funding facility (MFF) intended to cover any potential collateral calls from the counterparties to the credit default swaps of Master Asset Vehicle (MAV 1). Desjardins Group’s share of this credit commitment ranks equal to that of all other participants in the MFF and matures in July 2017 or earlier if all such credit default swap transactions have been settled. As at December 31, 2012, no amount had been drawn on the MFF. In addition, Desjardins Group purchased a $400 million protection for its commitments under the MFF from one of the participants in MAV 1 in exchange for an annual commitment fee of 1.2%, which is the same rate as the rate that applies to the third-party institutions that have contributed to the equivalent MFF of MAV 2. This protection will automatically end upon maturity of MAV 1’s MFF. Since the restructuring, deferred income related to the MFF has been recognized under “Other liabilities – Other”. As at December 31, 2012, this deferred income amounted to $41 million ($50 million as at December 31, 2011).
Desjardins Group entered into several different types of transactions to reduce the risk associated with the ABTN portfolio, the MFF related to the ABTN portfolio and other restructured securities. These hedges have maturities that are similar to those of the ABTN portfolio, and Desjardins Group’s management intends to keep them in place until they mature.
The MAV 1 trust is considered a special purpose entity as it was created for a specific purpose: to aggregate the structured notes arising from asset-backed commercial paper held by Canadian investors. This vehicle has assets of approximately $15,545 million as at December 31, 2012, has no equity, and is composed mainly of synthetic asset transactions for which investors are committed to contributing to the MFF. Desjardins Group does not consolidate MAV 1 since, in substance, according to the requirements of SIC 12, the relationship between the special purpose entity and Desjardins Group indicates that the MAV 1 is not controlled by Desjardins Group. As at December 31, 2012, Desjardins Group had a credit commitment (MFF) of $1,193 million ($1,193 million as at December 31, 2011) and held MAV 1 notes with a fair value of $1,689 million ($1,322 million as at December 31, 2011), the total of which represents the maximum risk of loss for Desjardins Group with respect to MAV 1.
ABTN VALUATION METHODOLOGY
Since there is no active market for these securities, Desjardins Group’s management estimated the fair value of its holdings and the resulting changes in value by using a valuation technique. In addition, the ability to trade MAV 1 notes is subject to significant restrictions, since MAV 1 A-1, A-2, B and C ABTN holders may only transfer the notes to a third party if such transfer is made on a pro rata basis of each of the classes held by the seller and if the buyer assumes an equivalent share of the commitments related to the MFF, either directly or through another entity, as long as the party assuming the share of the MFF has a sufficiently high credit rating.
The fair value of ABTNs taking the form of MAV 1 A-1, A-2, B and C notes, i.e. synthetic assets and hybrid assets, is based on a financial model that reflects uncertainties regarding return, credit spreads, the nature and credit risk of underlying assets, the amount and timing of cash inflows, as well as the maturity dates and the liquidity restrictions of the new notes.
The model adjusts the aggregate par value of the notes downwards based on the mark-to-market value of the credit default swaps underlying the notes, the quality of assets pledged as collateral and MAV 1 notes’ lack of liquidity as well as, but to a lesser extent, other risks inherent in the nature of these notes. Furthermore, the assumptions used for the various adjustments take into account credit spreads, maturities, expected recovery rates in the event of default and market and liquidity risk for all the notes. It should be noted that the assumptions used are based as much as possible on observable market data such as credit spreads and benchmark indexes for similar assets. They also reflect, if necessary, any specific features of the restructuring, and partially rely on other assumptions not supported by observable market prices or rates for similar assets.
The fair value of tracking notes backed by traditional and ineligible assets was determined using a valuation model that considers the value determined by the MAV administrator, as well as certain inherent risks that are not reflected in the valuation performed by such administrator.
TOTAL RETURN SWAP VALUATION METHODOLOGY
The fair value of the total return swap, which is classified in Level 3, is determined using a valuation model that takes into account the credit spreads of the credit default swaps as well as assumptions on recovery rates and probabilities of default for each of the transactions underlying the financial instrument.
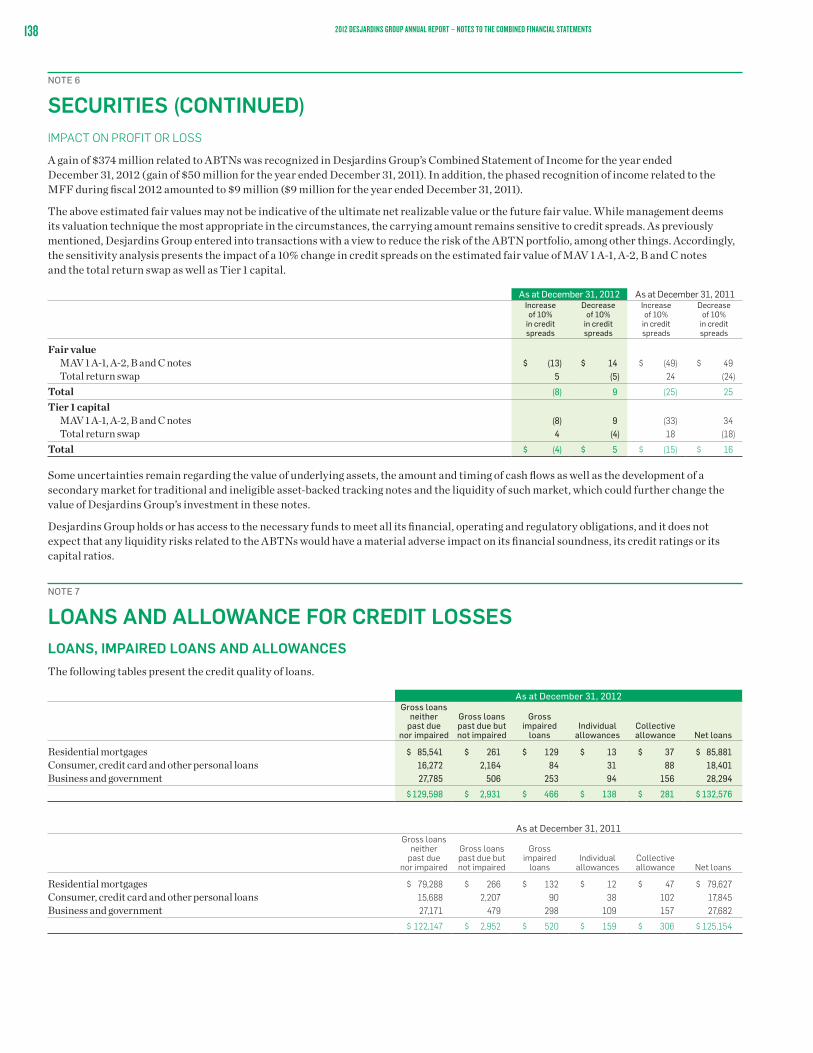
138 2012 DESJARDINS GROUP ANNUAL REPORT – NOTES TO THE COMBINED FINANCIAL STATEMENTS
NOTE 6
SECURITIES (CONTINUED)IMPACT ON PROFIT OR LOSS
A gain of $374 million related to ABTNs was recognized in Desjardins Group’s Combined Statement of Income for the year ended December 31, 2012 (gain of $50 million for the year ended December 31, 2011). In addition, the phased recognition of income related to the MFF during fiscal 2012 amounted to $9 million ($9 million for the year ended December 31, 2011).
The above estimated fair values may not be indicative of the ultimate net realizable value or the future fair value. While management deems its valuation technique the most appropriate in the circumstances, the carrying amount remains sensitive to credit spreads. As previously mentioned, Desjardins Group entered into transactions with a view to reduce the risk of the ABTN portfolio, among other things. Accordingly, the sensitivity analysis presents the impact of a 10% change in credit spreads on the estimated fair value of MAV 1 A-1, A-2, B and C notes and the total return swap as well as Tier 1 capital.
As at December 31, 2012 As at December 31, 2011Increase of 10%
in credit spreads
Decrease of 10%
in credit spreads
Increase of 10%
in credit spreads
Decrease of 10%
in credit spreads
Fair value MAV 1 A-1, A-2, B and C notes $ (13) $ 14 $ (49) $ 49 Total return swap 5 (5) 24 (24)
Total (8) 9 (25) 25
Tier 1 capital MAV 1 A-1, A-2, B and C notes (8) 9 (33) 34 Total return swap 4 (4) 18 (18)
Total $ (4) $ 5 $ (15) $ 16
Some uncertainties remain regarding the value of underlying assets, the amount and timing of cash flows as well as the development of a secondary market for traditional and ineligible asset-backed tracking notes and the liquidity of such market, which could further change the value of Desjardins Group’s investment in these notes.
Desjardins Group holds or has access to the necessary funds to meet all its financial, operating and regulatory obligations, and it does not expect that any liquidity risks related to the ABTNs would have a material adverse impact on its financial soundness, its credit ratings or its capital ratios.
NOTE 7
LOANS AND ALLOWANCE FOR CREDIT LOSSESLOANS, IMPAIRED LOANS AND ALLOWANCES The following tables present the credit quality of loans.
As at December 31, 2012Gross loans
neither past due
nor impaired
Gross loans past due but not impaired
Grossimpaired
loansIndividual
allowancesCollective allowance Net loans
Residential mortgages $ 85,541 $ 261 $ 129 $ 13 $ 37 $ 85,881Consumer, credit card and other personal loans 16,272 2,164 84 31 88 18,401Business and government 27,785 506 253 94 156 28,294
$ 129,598 $ 2,931 $ 466 $ 138 $ 281 $ 132,576
As at December 31, 2011Gross loans
neither past due
nor impaired
Gross loans past due but not impaired
Grossimpaired
loansIndividual
allowancesCollective allowance Net loans
Residential mortgages $ 79,288 $ 266 $ 132 $ 12 $ 47 $ 79,627Consumer, credit card and other personal loans 15,688 2,207 90 38 102 17,845Business and government 27,171 479 298 109 157 27,682
$ 122,147 $ 2,952 $ 520 $ 159 $ 306 $ 125,154

1392012 DESJARDINS GROUP ANNUAL REPORT – NOTES TO THE COMBINED FINANCIAL STATEMENTS
NOTE 7
LOANS AND ALLOWANCE FOR CREDIT LOSSES (CONTINUED)GROSS LOANS PAST DUE BUT NOT IMPAIREDThe following tables present the aging of gross loans that are past due but not impaired.
As at December 31, 20121 to
29 days30 to
59 days60 to
89 days90 daysor more Total
Residential mortgages $ 213 $ 24 $ 10 $ 14 $ 261Consumer, credit card and other personal loans 1,675 271 99 119 2,164Business and government 259 69 39 139 506
$ 2,147 $ 364 $ 148 $ 272 $ 2,931
As at December 31, 20111 to
29 days30 to
59 days60 to
89 days90 daysor more Total
Residential mortgages $ 215 $ 22 $ 9 $ 20 $ 266Consumer, credit card and other personal loans 1,778 233 80 116 2,207Business and government 285 46 12 136 479
$ 2,278 $ 301 $ 101 $ 272 $ 2,952
ALLOWANCE FOR CREDIT LOSSES The following table presents the reconciliation of the allowance for credit losses for the years ended December 31.
2012 2011 2012 2011 2012 2011 2012 2011Residentialmortgages
Consumer, credit card and other personal loans
Business and government Total
Balance at beginning of year $ 67 $ 71 $ 187 $ 182 $ 303 $ 310 $ 557 $ 563 Provision for credit losses (6) 7 196 198 51 32 241 237 Write-offs and recoveries (10) (11) (218) (193) (50) (39) (278) (243)
Balance at end of year $ 51 $ 67 $ 165 $ 187 $ 304 $ 303 $ 520 $ 557
Composed of: Allowance for credit losses $ 50 $ 59 $ 119 $ 140 $ 250 $ 266 $ 419 $ 465 Allowance for off-balance sheet credit commitments(1) 1 8 46 47 54 37 101 92
(1) The allowance for off-balance sheet credit commitments is presented under “Other liabilities – Other”.
NOTE 8
SECURITIZATION AND OTHER TRANSFERRED FINANCIAL ASSETS The following table presents the carrying amount of financial assets transferred by Desjardins Group but not derecognized and the related liabilities recognized in the Combined Balance Sheets.
As at December 31, 2012(1) As at December 31, 2011Assets Liabilities Assets Liabilities
Financial assets transferred through securitization transactions $ 4,679 $ 4,661 $ 3,482 $ 3,467Securities sold under repurchase agreements 7,263 7,268 7,376 7,393Securities lent: Against cash — — 3 3 Against securities 698 — 445 —
(1) The fair values of financial assets transferred through securitization transactions and related liabilities were $4,813 million and $4,679 million, respectively, which represents a net position of $134 million.
In addition, certain securitization transactions completed before January 1, 2010, were subject to derecognition. The total outstanding amount of these initial transferred assets was $562 million as at December 31, 2012 ($1,781 million as at December 31, 2011). Assets representing retained interests that Desjardins Group continues to recognize with respect to these transactions and assumed servicing liabilities amounted to $7 million and $1 million, respectively, as at December 31, 2012 ($28 million and $4 million as at December 31, 2011).

140 2012 DESJARDINS GROUP ANNUAL REPORT – NOTES TO THE COMBINED FINANCIAL STATEMENTS
NOTE 9
SEGREGATED FUNDSSEGREGATED FUND ASSETS The following table presents segregated fund assets by category.
As at December 31,
2012
As at December 31,
2011
Investments Bonds $ 402 $ 212 Mortgage loans 5 7 Shares and mutual fund units 5,590 5,003 Money market securities 94 151 Derivative financial instruments — 1Other assets 72 90Liabilities (77) (84)
Total segregated fund contract assets $ 6,086 $ 5,380
Consolidated share of non-controlling mutual fund holders $ 66 $ 65Assets held for the insurer (20) (18)
Segregated fund assets(1) $ 6,132 $ 5,427
(1) The difference between the segregated fund assets and liabilities represents the elimination of balances between the segregated funds and the various companies included in Desjardins Group’s scope of consolidation. The eliminations amounted to $9 million as at December 31, 2012.
FAIR VALUE OF FINANCIAL INSTRUMENTSSegregated fund assets include financial instruments recognized at fair value. For each financial instrument category, Desjardins Group classified the fair value measurements using a three-level hierarchy that reflects the significance of the inputs used in making the measurements. A description of the three hierarchy levels and guidance on inputs used in fair value measurements are presented in Note 5, “Fair value of financial instruments”.
The following tables present the financial instruments included in segregated fund assets measured at fair value.
As at December 31, 2012Level 1 Level 2 Level 3 Total
Investments Bonds $ 227 $ 175 $ — $ 402 Mortgage loans — 5 — 5 Shares and mutual fund units 3,679 1,911 — 5,590 Money market securities 56 38 — 94
Total financial instruments measured at fair value $ 3,962 $ 2,129 $ — $ 6,091
As at December 31, 2011Level 1 Level 2 Level 3 Total
Investments Bonds $ 109 $ 103 $ — $ 212 Mortgage loans — 7 — 7 Shares and mutual fund units 3,054 1,949 — 5,003 Money market securities 73 78 — 151 Derivative financial instruments 1 — — 1
Total financial instruments measured at fair value $ 3,237 $ 2,137 $ — $ 5,374
No transfers were made between fair value measurement hierarchy levels during the years ended December 31, 2012 and 2011.

1412012 DESJARDINS GROUP ANNUAL REPORT – NOTES TO THE COMBINED FINANCIAL STATEMENTS
NOTE 9
SEGREGATED FUNDS (CONTINUED)SECURITIES LENDING AND FINANCIAL ASSETS HELD AS COLLATERALThe segregated funds lend securities as part of their investment activities. As part of these securities lending transactions, the financial assets transferred to third parties remain on the Combined Balance Sheets because these transactions fail to meet derecognition criteria. The carrying amount of the financial assets transferred through such transactions was $222 million as at December 31, 2012 ($150 million as at December 31, 2011). Securities lending transactions for which cash was received as collateral are recognized as commitments for a total amount of $84 million as at December 31, 2012 ($49 million as at December 31, 2011), and are presented as liabilities.
The fair value of financial assets held as collateral with respect to securities lending and reverse repurchase transactions was $226 million as at December 31, 2012 ($153 million as at December 31, 2011).
FINANCIAL INSTRUMENT RISKSDesjardins Group is not exposed to the risks related to financial instruments included in the assets held for segregated fund contract holders since such holders assume the risks and obtain the benefits arising from these financial instruments.
SEGREGATED FUND LIABILITIESThe following table presents the changes in segregated fund liabilities.
As at December 31,
2012
As at December 31,
2011
Balance at beginning of year – Segregated fund contract liabilities $ 5,380 $ 4,794Additions Amounts received from contract holders 1,112 1,291 Net investment income 491 —
1,603 1,291
Deductions Withdrawals and redemptions 787 559 Net realized and unrealized losses on investments — 55 Management fees 101 91
888 705
Balance at end of year – Segregated fund contract liabilities $ 6,095 $ 5,380
Consolidated share of non-controlling mutual fund holders $ 66 $ 65 Liabilities to the insurer (20) (18)
Segregated fund liabilities(1) $ 6,141 $ 5,427
(1) The difference between the segregated fund assets and liabilities represents the elimination of balances between the segregated funds and the various companies included in Desjardins Group’s scope of consolidation. The eliminations amounted to $9 million as at December 31, 2012.

142 2012 DESJARDINS GROUP ANNUAL REPORT – NOTES TO THE COMBINED FINANCIAL STATEMENTS
NOTE 10
PROPERTY, PLANT AND EQUIPMENT AND INVESTMENT PROPERTYThe following table presents the changes in property, plant and equipment and investment property.
Property, plant and equipment Investment property
Land BuildingsComputer equipment
Furniture, fixtures
and otherLeasehold
improvements Total Land Buildings Total
CostAs at December 31, 2010 $ 115 $ 1,184 $ 441 $ 606 $ 359 $ 2,705 $ 87 $ 713 $ 800Additions 7 70 30 87 33 227 6 34 40Business combination 1 1 4 4 6 16 — — —Disposals (2) (10) (46) (42) (23) (123) (7) (22) (29)Other (3) (41) (41) (12) (9) (106) (2) (59) (61)
As at December 31, 2011 $ 118 $ 1,204 $ 388 $ 643 $ 366 $ 2,719 $ 84 $ 666 $ 750
Additions $ 3 $ 146 $ 64 $ 64 $ 36 $ 313 $ — $ 9 $ 9Disposals (3) (61) (16) (46) (6) (132) — (22) (22)Other (6) (32) 6 (2) (4) (38) — (44) (44)
As at December 31, 2012 $ 112 $ 1,257 $ 442 $ 659 $ 392 $ 2,862 $ 84 $ 609 $ 693
Property, plant and equipment Investment property
Land BuildingsComputer equipment
Furniture, fixtures
and otherLeasehold
improvements Total Land Buildings Total
Accumulated depreciation As at December 31, 2010 $ — $ 521 $ 355 $ 454 $ 188 $ 1,518 $ 5 $ 179 $ 184Depreciation — 39 42 39 28 148 — 23 23Disposals — (6) (37) (33) (21) (97) — (19) (19)Other — (19) (41) 1 (9) (68) — (35) (35)
As at December 31, 2011 $ — $ 535 $ 319 $ 461 $ 186 $ 1,501 $ 5 $ 148 $ 153
Depreciation $ — $ 37 $ 39 $ 43 $ 31 $ 150 $ — $ 27 $ 27Disposals — (33) (15) (24) (4) (76) — (5) (5)Other — (17) 4 (7) (5) (25) — 6 6
As at December 31, 2012 $ — $ 522 $ 347 $ 473 $ 208 $ 1,550 $ 5 $ 176 $ 181
Property, plant and equipment Investment property
Land BuildingsComputer equipment
Furniture, fixtures
and otherLeasehold
improvements Total Land Buildings Total
Net carrying amountAs at December 31, 2012 $ 112 $ 735 $ 95 $ 186 $ 184 $ 1,312 $ 79 $ 433 $ 512
As at December 31, 2011 $ 118 $ 669 $ 69 $ 182 $ 180 $ 1,218 $ 79 $ 518 $ 597
As at December 31, 2012, an amount of $106 million ($41 million as at December 31, 2011) included in the buildings balance represented costs related to buildings under construction. In addition, Desjardins Group had commitments amounting to $36 million ($35 million as at December 31, 2011) related to the acquisition of these buildings.
Information about assets pledged as collateral is disclosed in Note 27, “Commitments, guarantees and contingent liabilities”.
As at December 31, 2012, the fair value of investment property was $1,054 million ($1,102 million as at December 31, 2011). The fair value of investment property is determined by independent real estate appraisers with recognized and relevant professional qualifications who use a range of appraisal techniques, including net operating income capitalization and cash flow discounting. The appraisal techniques, which are based on market inputs, involve estimating capitalization rates and future net operating income, in the case of the net operating income capitalization method, and estimating discount rates and future cash flows for investment property, in the case of the cash flow discounting method.
For the year ended December 31, 2012, rental income from investment property amounted to $134 million ($142 million in 2011). Amounts recognized in profit or loss for operating expenses related to investment property that generated rental income during the year totalled $94 million ($83 million in 2011), while no amount has been recognized for those that did not generate rental income. These amounts are presented under “Net other investment income” in the Combined Statements of Income.
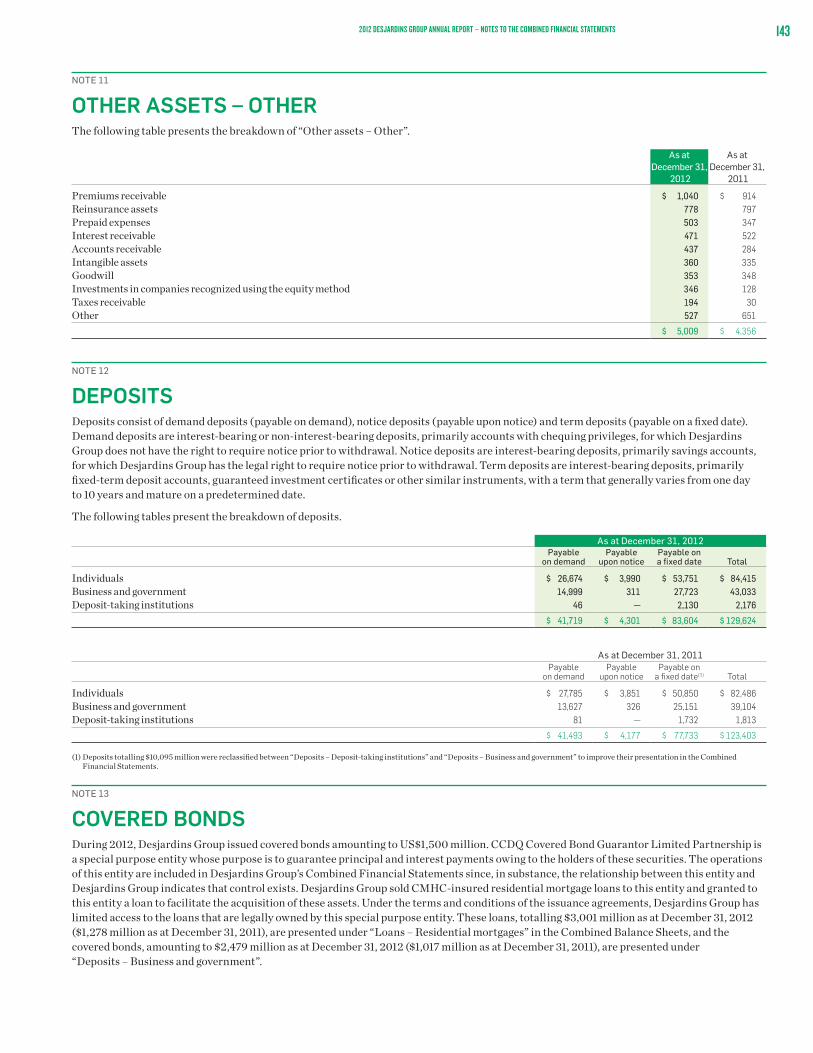
1432012 DESJARDINS GROUP ANNUAL REPORT – NOTES TO THE COMBINED FINANCIAL STATEMENTS
NOTE 11
OTHER ASSETS – OTHERThe following table presents the breakdown of “Other assets – Other”.
As at December 31,
2012
As at December 31,
2011
Premiums receivable $ 1,040 $ 914Reinsurance assets 778 797Prepaid expenses 503 347Interest receivable 471 522Accounts receivable 437 284Intangible assets 360 335Goodwill 353 348Investments in companies recognized using the equity method 346 128Taxes receivable 194 30Other 527 651
$ 5,009 $ 4,356
NOTE 12
DEPOSITSDeposits consist of demand deposits (payable on demand), notice deposits (payable upon notice) and term deposits (payable on a fixed date). Demand deposits are interest-bearing or non-interest-bearing deposits, primarily accounts with chequing privileges, for which Desjardins Group does not have the right to require notice prior to withdrawal. Notice deposits are interest-bearing deposits, primarily savings accounts, for which Desjardins Group has the legal right to require notice prior to withdrawal. Term deposits are interest-bearing deposits, primarily fixed-term deposit accounts, guaranteed investment certificates or other similar instruments, with a term that generally varies from one day to 10 years and mature on a predetermined date.
The following tables present the breakdown of deposits.
As at December 31, 2012Payable
on demandPayable
upon noticePayable on a fixed date Total
Individuals $ 26,674 $ 3,990 $ 53,751 $ 84,415Business and government 14,999 311 27,723 43,033Deposit-taking institutions 46 — 2,130 2,176
$ 41,719 $ 4,301 $ 83,604 $ 129,624
As at December 31, 2011Payable
on demandPayable
upon noticePayable on
a fixed date(1) Total
Individuals $ 27,785 $ 3,851 $ 50,850 $ 82,486Business and government 13,627 326 25,151 39,104Deposit-taking institutions 81 — 1,732 1,813
$ 41,493 $ 4,177 $ 77,733 $ 123,403
(1) Deposits totalling $10,095 million were reclassified between “Deposits – Deposit-taking institutions” and “Deposits – Business and government” to improve their presentation in the Combined Financial Statements.
NOTE 13
COVERED BONDSDuring 2012, Desjardins Group issued covered bonds amounting to US$1,500 million. CCDQ Covered Bond Guarantor Limited Partnership is a special purpose entity whose purpose is to guarantee principal and interest payments owing to the holders of these securities. The operations of this entity are included in Desjardins Group’s Combined Financial Statements since, in substance, the relationship between this entity and Desjardins Group indicates that control exists. Desjardins Group sold CMHC-insured residential mortgage loans to this entity and granted to this entity a loan to facilitate the acquisition of these assets. Under the terms and conditions of the issuance agreements, Desjardins Group has limited access to the loans that are legally owned by this special purpose entity. These loans, totalling $3,001 million as at December 31, 2012 ($1,278 million as at December 31, 2011), are presented under “Loans – Residential mortgages” in the Combined Balance Sheets, and the covered bonds, amounting to $2,479 million as at December 31, 2012 ($1,017 million as at December 31, 2011), are presented under “Deposits – Business and government”.

144 2012 DESJARDINS GROUP ANNUAL REPORT – NOTES TO THE COMBINED FINANCIAL STATEMENTS
NOTE 14
INSURANCE AND INVESTMENT CONTRACT LIABILITIESCOMPOSITION OF INSURANCE AND INVESTMENT CONTRACT LIABILITIES
As at December 31,
2012
As at December 31,
2011
Insurance contract liabilities Actuarial liabilities $ 14,105 $ 13,610 Provisions for claims and adjustment expenses 1,862 1,623 Unearned premiums 975 905 Policyholder deposits 464 490 Provisions for benefits, policyholder dividends and experience refunds 322 331
17,728 16,959
Investment contract liabilities 49 49
Total insurance and investment contract liabilities $ 17,777 $ 17,008
ACTUARIAL LIABILITIES
COMPOSITION
Actuarial liabilities and assets backing actuarial liabilities comprise the following amounts:
As at December 31,
2012
As at December 31,
2011
Gross actuarial liabilities Non-participating policies $ 11,741 $ 11,287 Participating policies 2,364 2,323
14,105 13,610
Amounts ceded to reinsurers 737 754
Net actuarial liabilities $ 13,368 $ 12,856
As at December 31,
2012
As at December 31,
2011Composition of assets backing net actuarial liabilities Bonds $ 8,377 $ 8,223 Mortgage and business loans 2,590 2,666 Investment property 864 489 Shares 668 597 Other 869 881
$ 13,368 $ 12,856
The fair value of assets backing net actuarial liabilities was $13,882 million as at December 31, 2012 ($13,607 million as at December 31, 2011).
ACTUARIAL ASSUMPTIONS
The computation of actuarial liabilities is based on estimates and assumptions. The nature of the main assumptions used in the computation of actuarial liabilities and the method used to establish these assumptions are described in the following paragraphs.
The basic assumptions used to compute actuarial liabilities are those that prove to be the best estimates for various contingencies. The appointed actuary must, for each of these assumptions, establish a margin for adverse deviation in order to mitigate the random event, allow for the risk of deteriorating underwriting experience and ensure that provisions are adequate to meet future commitments. The extent of the margins for adverse deviation is prescribed by the Standards of Practice of the Canadian Institute of Actuaries (CIA). The actuary establishes the appropriate margins based on the characteristics of the risks associated with the products. These margins vary for each assumption and type of product. The margins for adverse deviation increase actuarial liabilities and reduce the profit or loss that would otherwise be recognized at inception of the policies. With time and as estimation risks decline, these margins are reversed and recognized in profit or loss.
The risks associated with the accuracy of the actuarial assumptions used to compute actuarial liabilities arise from the non-materialization of expected assumptions. The actuary periodically carries out studies on the underwriting experience related to each assumption and modifies the assumptions, if appropriate, to take into account the current and future expected situation. Any impact resulting from these modifications is immediately recognized in profit or loss.

1452012 DESJARDINS GROUP ANNUAL REPORT – NOTES TO THE COMBINED FINANCIAL STATEMENTS
NOTE 14
INSURANCE AND INVESTMENT CONTRACT LIABILITIES (CONTINUED)MORTALITY
The life and health insurance subsidiaries determine their mortality assumptions for individual life insurance based on the results of the annual studies of their recent underwriting experience. When these results cannot serve as the only source of reference due to their insufficient credibility, the mortality assumption is also based on industry studies. Mortality assumptions vary based on gender, risk category and type of contract. A future mortality improvement assumption is taken into account in accordance with CIA standards.
For annuities, the life and health insurance subsidiaries also carry out an annual study of their underwriting experience which is sufficiently credible to be the main basis for the determination of assumptions. Contrary to life insurance, a future mortality improvement assumption is taken into account in accordance with CIA standards.
MORBIDITY
For morbidity assumptions regarding the occurrence of accidents and illnesses, the life and health insurance subsidiaries use industry-developed morbidity tables modified based on current data provided by their studies of their underwriting experience and those of the industry. These assumptions are mainly used for disability, critical illness and long-term care insurance products.
CONTRACT CANCELLATION RATES
The life and health insurance subsidiaries carry out an annual study of their underwriting experience with respect to individual insurance contract cancellation, as policyholders can cancel their policy before the expiry of their contractual coverage period by discontinuing premium payment without using the non-forfeiture options, if any. The contract cancellation rate assumptions are based on the life and health insurance subsidiaries’ recent underwriting experience. These assumptions are adjusted on the basis of the industry’s underwriting experience when the life and health insurance subsidiaries’ assumptions are not sufficiently credible. For certain types of insurance products, such as term-to-100 life insurance and universal life insurance with level mortality costs, lower than projected cancellation rates may have a negative impact on the life and health insurance subsidiaries’ underwriting experience. Cancellation rate assumptions may vary depending on the product type, the contract’s term, the age at issuance and the premium payment method.
INVESTMENT RETURN
Investment return is based on projected investment income using the current portfolios of assets backing the actuarial liabilities and projected reinvestment strategies. The life and health insurance subsidiaries manage the investments backing their actuarial liabilities by taking into account the characteristics of the commitments of each of their business segments, using clearly defined mechanisms set out in their matching policy. The Canadian Asset Liability Method (CALM) is the standard set by the CIA to ensure the compliance of assets that are backing the actuarial liabilities. By closely matching the cash flows related to the assets with those related to the actuarial liabilities, the life and health insurance subsidiaries mitigate their sensitivity to future changes in interest rate levels. According to CALM, changes in the fair value of assets backing the actuarial liabilities are essentially offset by corresponding changes in the value of actuarial liabilities.
Under CALM, cash flows from these assets are matched with cash flows that will arise from future asset acquisitions or sales to determine the expected rates of return on these assets for the coming years. The projected reinvestment strategies are determined based on the characteristics of the commitments of each segment, and reinvestment returns are based on current and expected market rates for fixed-rate investments and on expected rates for floating-rate investments. In addition, the asset cash flow projections include assumptions for investment management fees and credit risk.
Investment return assumptions take into account expected future credit losses on fixed-income investments. In that regard, in addition to the provisions for non-performing investments recognized through a write-down of the carrying amount of the assets, a provision amounting to $867 million ($543 million as at December 31, 2011) has been included in actuarial liabilities as a protection against the risk of insufficient return on assets.
OPERATING EXPENSES AND TAXES
The operating expense assumptions reflect the projected costs for managing and processing contracts in force, including indirect overhead expenses. The life and health insurance subsidiaries carry out an annual study of operating expenses by major product line, and these expenses are projected using the expected rate of inflation and the expected development of blocks of business, when relevant.
Taxes reflect the assumptions relating to future premium taxes and taxes other than income taxes. For income taxes, actuarial liabilities are adjusted only when there are temporary differences or to take into account the non-deductible or non-taxable items in cash flows from the liabilities and the assets related to insurance contracts.

146 2012 DESJARDINS GROUP ANNUAL REPORT – NOTES TO THE COMBINED FINANCIAL STATEMENTS
NOTE 14
INSURANCE AND INVESTMENT CONTRACT LIABILITIES (CONTINUED)PARTICIPATING POLICYHOLDERS’ DIVIDENDS
Actuarial liabilities include estimated amounts of future participating policyholders’ dividends. These estimated amounts are determined based on the expected future results of this block of business and the reasonable expectations of participating policyholders. Changes in the best estimate assumptions for participating insurance would result in corresponding changes in policyholders’ dividends and an immaterial net change in actuarial liabilities related to participating policies.
SENSITIVITY OF ACTUARIAL LIABILITIES TO CHANGES IN ASSUMPTIONS
The following table shows the impact on “Net surplus earnings for the year after member dividends” of the sensitivity of actuarial liabilities to changes in underlying non-economic assumptions for the years ended December 31.
2012 2011
2% negative change in future mortality rates Products for which a rate increase increases actuarial liabilities $ (27) $ (26) Products for which a rate decrease increases actuarial liabilities (19) (21)5% increase in future morbidity rates (49) (42)10% negative change in future contract cancellation rates (89) (85)5% increase in future operating expenses (27) (28)
CHANGE IN NET ACTUARIAL LIABILITIES
The change in net actuarial liabilities during the years ended December 31 was due to business activities and to changes in actuarial estimates, as follows:
2012 2011
Balance at beginning of year $ 12,856 $ 11,281Change due to: Business combination — 61 Passage of time 158 1,174 New business 293 374 Changes in actuarial assumptions 55 (36)
506 1,573
Other changes 6 2
Balance at end of year $ 13,368 $ 12,856
Composed of: Gross actuarial liabilities $ 14,105 $ 13,610 Amounts ceded to reinsurers (737) (754)
CHANGES IN ACTUARIAL ASSUMPTIONS
The economic and non-economic assumptions taken into account in the computation of actuarial liabilities are periodically updated to reflect the actual or projected underwriting experience associated with each of them. The following table presents the impact of changes made to assumptions on “Net surplus earnings for the year after member dividends” for the years ended December 31.
2012 2011
Changed assumptions Mortality $ 47 $ (18) Morbidity 8 15 Contract cancellation rates (80) (72) Investment return 30 47 Operating expenses 32 (11) Methods and other (86) 65
$ (49) $ 26
The decrease in actuarial liabilities related to mortality is mainly attributable to an improvement in mortality for individual insurance products.
The increase in actuarial liabilities related to contract cancellation rates is attributable to the change update of the forecasts for individual insurance products.
Actuarial liabilities decreased with respect to investment returns as a result of updates to investment expenses and indexation rates for individual insurance products.
Actuarial liabilities decreased with respect to operating expenses for individual insurance and segregated fund products.
The increase in actuarial liabilities related to methods and other is mainly attributable to changes in valuation systems for segregated fund products.

1472012 DESJARDINS GROUP ANNUAL REPORT – NOTES TO THE COMBINED FINANCIAL STATEMENTS
NOTE 14
INSURANCE AND INVESTMENT CONTRACT LIABILITIES (CONTINUED)RISK MANAGEMENT
In addition to the risks related to actuarial assumptions, the life and health subsidiaries are exposed to the following risks inherent to insurance activities and take into account the following considerations in the calculation of actuarial liabilities.
INSURANCE RISK
In the course of their operations, the life and health insurance subsidiaries are exposed to insurance risk, which comprises two components: product development and pricing risk and underwriting and commitment risk.
Product development and pricing risk is the risk that the initial pricing is or will become insufficient. It is related to the possibility that the forecasts for certain factors, such as future investment return, mortality, morbidity and administrative expenses, taken into account in pricing prove to be inaccurate. The life and health insurance subsidiaries apply stringent standards and policies with respect to product development and pricing, and regularly carry out analyses to compare forecasts with actual results and revise pricing assumptions if needed. In addition, certain products allow for price adjustments depending on whether assumptions materialize or not.
Underwriting and commitment risk is the risk arising from the selection of risks, the provisioning and settlement of insurance claims, the reduction, retention or ceding of risks and contractual clause management. The life and health insurance subsidiaries manage this risk by setting appropriate risk selection criteria and policies, setting up actuarial liabilities in accordance with the actuarial standards prescribed by the CIA, constantly monitoring the development of loss experience and limiting their losses through reinsurance treaties.
REINSURANCE RISK
The life and health insurance subsidiaries enter into reinsurance treaties for contracts with coverage in excess of certain maximum amounts that vary based on the nature of the activities. In addition, they purchase additional reinsurance protection with respect to large-scale catastrophic events.
In order to reduce reinsurance risk, the life and health insurance subsidiaries do business with many different reinsurers, the vast majority of which are duly registered, that meet credit standards and are governed by the same regulatory authorities as the subsidiaries. These reinsurance treaties do not release the life and health insurance subsidiaries from their obligations toward their policyholders.
For the years ended December 31, the impact of reinsurance reduced the Combined Statements of Income items presented in the table below by the following amounts:
2012 2011
Premiums $ 198 $ 169Claims, benefits, annuities and changes in insurance and investment contract liabilities 91 249
SEGREGATED FUND RISK
Actuarial liabilities also include amounts sufficient to pay the minimum segregated fund guarantees, which are calculated using stochastic models defined by the CIA. These models are based on the nature of the guarantees and on assumptions related to investment return, mortality and contract forfeiture rates. Deferred acquisition costs, being the expenses incurred on the sale of individual segregated fund contracts, are recognized in actuarial liabilities and amortized over the same period as the applicable surrender fees. Actuarial liabilities take into account the fact that future income will be available to recover unamortized acquisition costs.
To reduce the potential negative impact that may arise from the segregated fund contract guarantee risk, the life and health insurance subsidiary selling segregated fund contracts implemented in 2010 a hedging program aimed at offsetting the impact of unfavourable stock market fluctuations on the future cost of guarantees. In addition, in 2011, a second hedging program aimed at offsetting the impact of unfavourable changes in interest rates on these future costs was implemented. These programs cover all the contracts and funds offered to clients by the relevant life and health insurance subsidiary.
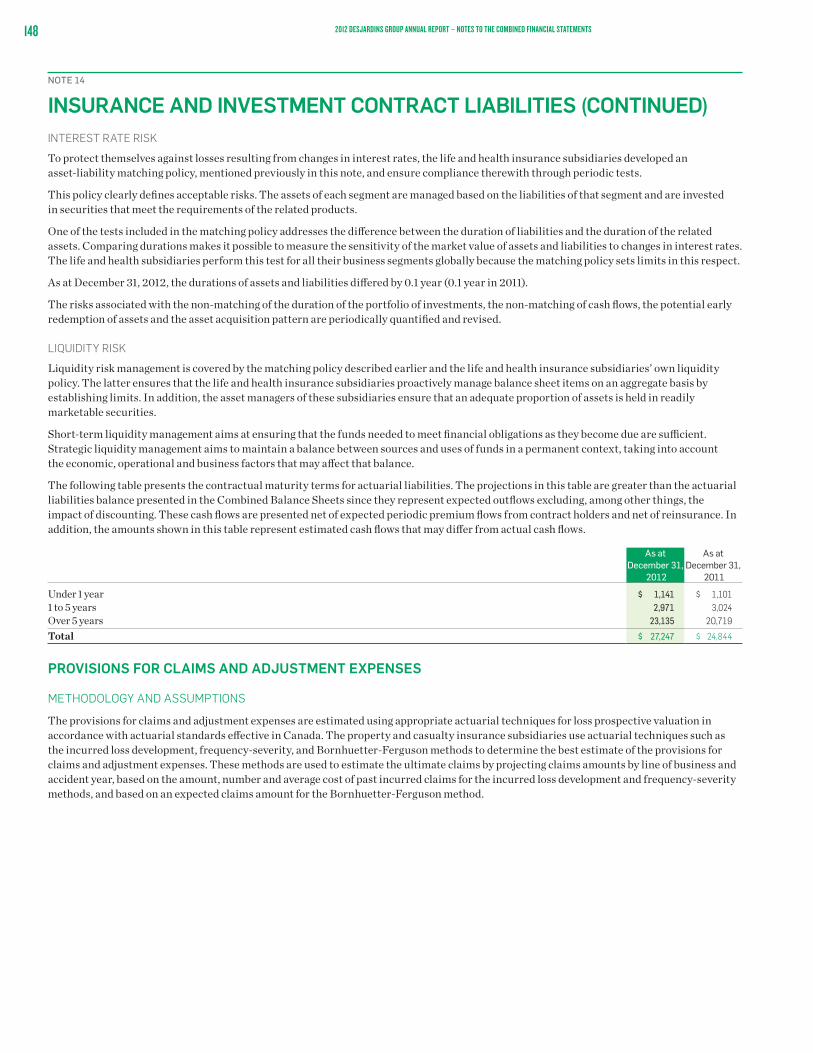
148 2012 DESJARDINS GROUP ANNUAL REPORT – NOTES TO THE COMBINED FINANCIAL STATEMENTS
NOTE 14
INSURANCE AND INVESTMENT CONTRACT LIABILITIES (CONTINUED)INTEREST RATE RISK
To protect themselves against losses resulting from changes in interest rates, the life and health insurance subsidiaries developed an asset-liability matching policy, mentioned previously in this note, and ensure compliance therewith through periodic tests.
This policy clearly defines acceptable risks. The assets of each segment are managed based on the liabilities of that segment and are invested in securities that meet the requirements of the related products.
One of the tests included in the matching policy addresses the difference between the duration of liabilities and the duration of the related assets. Comparing durations makes it possible to measure the sensitivity of the market value of assets and liabilities to changes in interest rates. The life and health subsidiaries perform this test for all their business segments globally because the matching policy sets limits in this respect.
As at December 31, 2012, the durations of assets and liabilities differed by 0.1 year (0.1 year in 2011).
The risks associated with the non-matching of the duration of the portfolio of investments, the non-matching of cash flows, the potential early redemption of assets and the asset acquisition pattern are periodically quantified and revised.
LIQUIDITY RISK
Liquidity risk management is covered by the matching policy described earlier and the life and health insurance subsidiaries’ own liquidity policy. The latter ensures that the life and health insurance subsidiaries proactively manage balance sheet items on an aggregate basis by establishing limits. In addition, the asset managers of these subsidiaries ensure that an adequate proportion of assets is held in readily marketable securities.
Short-term liquidity management aims at ensuring that the funds needed to meet financial obligations as they become due are sufficient. Strategic liquidity management aims to maintain a balance between sources and uses of funds in a permanent context, taking into account the economic, operational and business factors that may affect that balance.
The following table presents the contractual maturity terms for actuarial liabilities. The projections in this table are greater than the actuarial liabilities balance presented in the Combined Balance Sheets since they represent expected outflows excluding, among other things, the impact of discounting. These cash flows are presented net of expected periodic premium flows from contract holders and net of reinsurance. In addition, the amounts shown in this table represent estimated cash flows that may differ from actual cash flows.
As at December 31,
2012
As at December 31,
2011
Under 1 year $ 1,141 $ 1,1011 to 5 years 2,971 3,024Over 5 years 23,135 20,719
Total $ 27,247 $ 24,844
PROVISIONS FOR CLAIMS AND ADJUSTMENT EXPENSES
METHODOLOGY AND ASSUMPTIONS
The provisions for claims and adjustment expenses are estimated using appropriate actuarial techniques for loss prospective valuation in accordance with actuarial standards effective in Canada. The property and casualty insurance subsidiaries use actuarial techniques such as the incurred loss development, frequency-severity, and Bornhuetter-Ferguson methods to determine the best estimate of the provisions for claims and adjustment expenses. These methods are used to estimate the ultimate claims by projecting claims amounts by line of business and accident year, based on the amount, number and average cost of past incurred claims for the incurred loss development and frequency-severity methods, and based on an expected claims amount for the Bornhuetter-Ferguson method.

1492012 DESJARDINS GROUP ANNUAL REPORT – NOTES TO THE COMBINED FINANCIAL STATEMENTS
NOTE 14
INSURANCE AND INVESTMENT CONTRACT LIABILITIES (CONTINUED)The main assumption underlying these methods is that past claims development can be used to project what future claims development will be (or that past claims development will be similar to future claims development). An additional qualitative judgment is made to assess the extent by which past trends may not apply in the future and make the necessary adjustments to ensure that the provisions for claims and adjustment expenses are adequate and represent the best estimates of future payments on outstanding claims, including claims incurred but not reported that can be expected, based on data and information currently known. The assumptions used to develop this estimate are selected by risk category and geographic area. In addition, the estimates take into consideration a number of quantitative and qualitative factors, including the average settlement cost per claim and the average number of claims, claims severity and frequency trends, and other factors such as inflation, changes in market factors, for instance public behaviour toward claims and economic conditions. They also take into account internal factors, such as the mix of the insurance contract portfolio, the terms and conditions of such contracts and claims management procedures. Judgment is also used to assess the extent by which external factors, such as legal decisions and government laws, may affect this estimate.
The initial estimate of the provisions for claims and adjustment expenses is a non-discounted amount. This estimate is then discounted to take into account the time value of money. The discount rate used is based on the interest rate for the assets backing the provisions for claims and adjustment expenses. This rate may vary based on changes in interest rates and credit spreads.
Since claims estimates are subject to measurement uncertainty and may change significantly in the short term, the property and casualty insurance subsidiaries include margins for adverse deviation in the assumptions with respect to claims development, expected reinsurance recoveries and future investment income from the asset portfolio backing the provisions for claims and adjustment expenses. These margins for adverse deviation are determined in accordance with accepted actuarial standards to ensure that the amount of the provisions for claims and adjustment expenses is sufficient to settle future benefits. The selected margins for adverse deviation are within the range recommended by the CIA.
CHANGE IN PROVISIONS FOR CLAIMS AND ADJUSTMENT EXPENSES
The following table shows the change in the provisions for claims and adjustment expenses for the years ended December 31.
2012 2011Gross
amountCeded
amountNet
amountGross
amountCeded
amountNet
amount
Balance at beginning of year $ 1,623 $ 30 $ 1,593 $ 1,447 $ 25 $ 1,422Claims incurred during the year 1,404 8 1,396 1,272 — 1,272Development of claims incurred in prior years (71) — (71) (10) 6 (16)Claims paid during the year (1,094) (2) (1,092) (1,088) (1) (1,087)Business combination — — — 2 — 2
Balance at end of year $ 1,862 $ 36 $ 1,826 $ 1,623 $ 30 $ 1,593
Changes in assumptions had no material impact on the Combined Financial Statements as at December 31, 2012 and 2011.
ASSUMPTION SENSITIVITY ANALYSIS
The provisions for claims and adjustment expenses are sensitive to certain key assumptions. The sensitivity of certain qualitative variables, such as legislative changes or the uncertainty surrounding the estimation process, could not be quantified. The following analysis addresses reasonably plausible changes in certain key assumptions with all other assumptions remaining constant, and it presents the impact of such changes on “Net surplus earnings for the year after member dividends”. The correlation of assumptions would have a material impact on the calculation of ultimate claims, but to demonstrate the impact attributable to changes in assumptions, changes must be applied to individual assumptions.
2012 2011
Changes inactuarial
assumptions
Impact on “Net surplus earnings
for the yearafter member dividends”
Average claims settlement cost +5% $ (88) $ (79)Number of claims incurred but not reported +5 (6) (7)

150 2012 DESJARDINS GROUP ANNUAL REPORT – NOTES TO THE COMBINED FINANCIAL STATEMENTS
NOTE 14
INSURANCE AND INVESTMENT CONTRACT LIABILITIES (CONTINUED)DEVELOPMENT OF CLAIMS AND ADJUSTMENT EXPENSES
The following table shows the development of claims and adjustment expenses on a net basis. It presents the estimated ultimate claims amount, including claims reported and claims incurred but not reported, for each accident year and at each reporting date, with cumulative payments made to date.
2005and before 2006 2007 2008 2009 2010 2011 2012 Total
Estimated ultimate claims amount At the end of the accident year $ 1,034 $ 1,023 $ 1,156 $ 1,092 $ 1,118 $ 1,291 $ 1,396 1 year later 1,022 994 1,110 1,079 1,120 1,291 2 years later 996 962 1,111 1,093 1,108 3 years later 975 959 1,111 1,088 4 years later 965 954 1,097 5 years later 962 943 6 years later 955 Cumulative payments to date 903 868 988 915 858 895 743
Net provisions for claims and adjustment expenses $ 118 $ 52 $ 75 $ 109 $ 173 $ 250 $ 396 $ 653 $ 1,826
Reinsurers’ share in provisions for claims and adjustment expenses 25 — — 2 1 — — 8 36
Gross provisions for claims and adjustment expenses $ 143 $ 52 $ 75 $ 111 $ 174 $ 250 $ 396 $ 661 $ 1,862
RISK MANAGEMENT
In addition to the risks related to actuarial assumptions, the property and casualty insurance subsidiaries are exposed to the following risks inherent to insurance activities.
INSURANCE RISK
The property and casualty insurance subsidiaries mainly issue automobile, home, commercial property and other insurance contracts to individuals and small and medium businesses. In the normal course of their operations, the property and casualty insurance subsidiaries are exposed to insurance risk, which includes several components: insurance product development and pricing risk, underwriting and claims settlement risk, provisioning risk, catastrophe risk and reinsurance risk.
Insurance product development and pricing risk is the risk of financial losses related to insurance operations, when commitments that may arise from a particular line of products exceed those anticipated or exceed the price that is expected to be set for such products.
Underwriting and claims settlement risk is the risk arising from the selection of risks, claims settlement and contractual clause management.
To manage these two risks, the property and casualty insurance subsidiaries adopted rigorous practices and procedures with respect to product development and pricing as well as underwriting and commitment management, which take into account several factors that are regularly revised and adapted based on changes in industry market conditions. In addition, the property and casualty insurance subsidiaries reduce their exposure to claim settlement risk by performing regular detailed reviews of claims management procedures and frequent investigations of potentially fraudulent claims.
Provisioning risk is the risk that the provisions for claims and adjustment expenses recorded may not be sufficient to cover the risks inherent to issued insurance policies. Provisions are intended to cover the property and casualty insurance subsidiaries’ estimated obligations for the payment of all claims and adjustment expenses with respect to premiums received or receivable on issued insurance policies. There is a risk that the amounts provisioned differ significantly from the actual amount for which ultimate claims are settled. The property and casualty insurance subsidiaries’ practice is to establish their provisions for claims and adjustment expenses using accepted actuarial methods that take into account a multitude of factors and trend analyses that are updated periodically.
Catastrophe risk is the risk of loss arising from too many claims related to a single catastrophe. To limit the potential consequences of catastrophes, the property and casualty insurance subsidiaries use reinsurance, under which amounts are recovered when the claims amount exceeds $30 million for a single catastrophe.
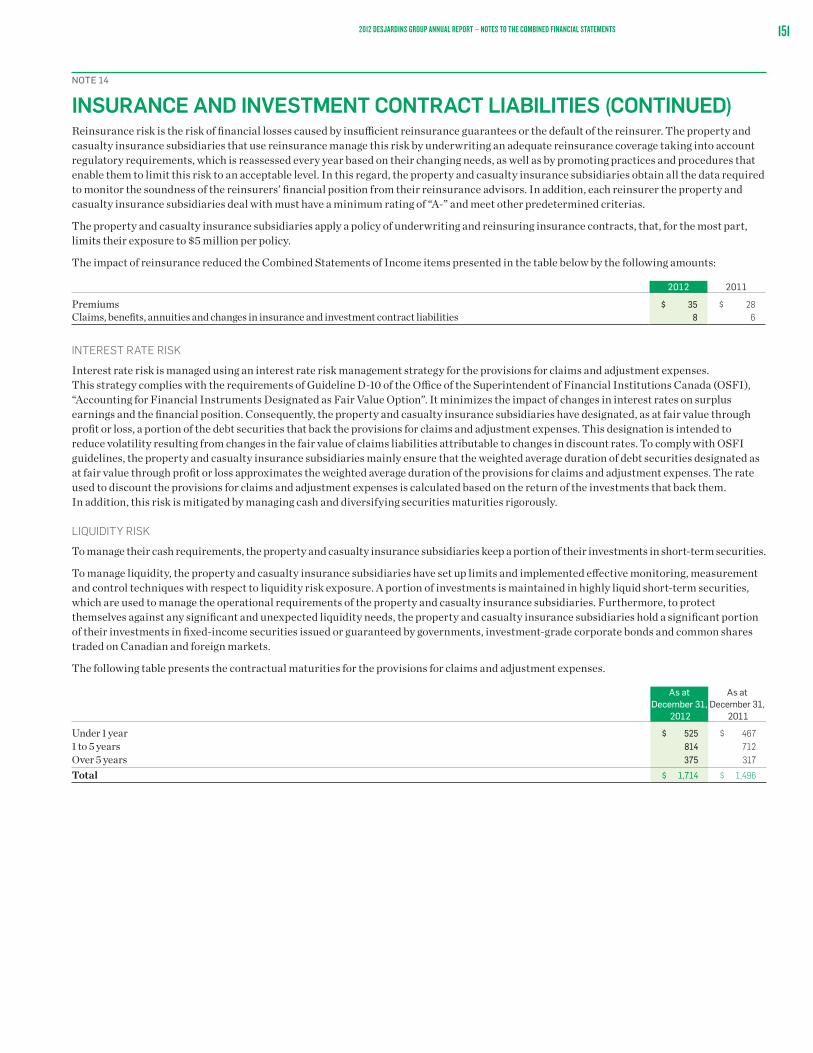
1512012 DESJARDINS GROUP ANNUAL REPORT – NOTES TO THE COMBINED FINANCIAL STATEMENTS
NOTE 14
INSURANCE AND INVESTMENT CONTRACT LIABILITIES (CONTINUED)Reinsurance risk is the risk of financial losses caused by insufficient reinsurance guarantees or the default of the reinsurer. The property and casualty insurance subsidiaries that use reinsurance manage this risk by underwriting an adequate reinsurance coverage taking into account regulatory requirements, which is reassessed every year based on their changing needs, as well as by promoting practices and procedures that enable them to limit this risk to an acceptable level. In this regard, the property and casualty insurance subsidiaries obtain all the data required to monitor the soundness of the reinsurers’ financial position from their reinsurance advisors. In addition, each reinsurer the property and casualty insurance subsidiaries deal with must have a minimum rating of “A-” and meet other predetermined criterias.
The property and casualty insurance subsidiaries apply a policy of underwriting and reinsuring insurance contracts, that, for the most part, limits their exposure to $5 million per policy.
The impact of reinsurance reduced the Combined Statements of Income items presented in the table below by the following amounts:
2012 2011
Premiums $ 35 $ 28Claims, benefits, annuities and changes in insurance and investment contract liabilities 8 6
INTEREST RATE RISK
Interest rate risk is managed using an interest rate risk management strategy for the provisions for claims and adjustment expenses. This strategy complies with the requirements of Guideline D-10 of the Office of the Superintendent of Financial Institutions Canada (OSFI), “Accounting for Financial Instruments Designated as Fair Value Option”. It minimizes the impact of changes in interest rates on surplus earnings and the financial position. Consequently, the property and casualty insurance subsidiaries have designated, as at fair value through profit or loss, a portion of the debt securities that back the provisions for claims and adjustment expenses. This designation is intended to reduce volatility resulting from changes in the fair value of claims liabilities attributable to changes in discount rates. To comply with OSFI guidelines, the property and casualty insurance subsidiaries mainly ensure that the weighted average duration of debt securities designated as at fair value through profit or loss approximates the weighted average duration of the provisions for claims and adjustment expenses. The rate used to discount the provisions for claims and adjustment expenses is calculated based on the return of the investments that back them. In addition, this risk is mitigated by managing cash and diversifying securities maturities rigorously.
LIQUIDITY RISK
To manage their cash requirements, the property and casualty insurance subsidiaries keep a portion of their investments in short-term securities.
To manage liquidity, the property and casualty insurance subsidiaries have set up limits and implemented effective monitoring, measurement and control techniques with respect to liquidity risk exposure. A portion of investments is maintained in highly liquid short-term securities, which are used to manage the operational requirements of the property and casualty insurance subsidiaries. Furthermore, to protect themselves against any significant and unexpected liquidity needs, the property and casualty insurance subsidiaries hold a significant portion of their investments in fixed-income securities issued or guaranteed by governments, investment-grade corporate bonds and common shares traded on Canadian and foreign markets.
The following table presents the contractual maturities for the provisions for claims and adjustment expenses.
As at December 31,
2012
As at December 31,
2011
Under 1 year $ 525 $ 4671 to 5 years 814 712Over 5 years 375 317
Total $ 1,714 $ 1,496

152 2012 DESJARDINS GROUP ANNUAL REPORT – NOTES TO THE COMBINED FINANCIAL STATEMENTS
NOTE 15
OTHER LIABILITIES – OTHERThe following table presents the breakdown of “Other liabilities – Other”.
As at December 31,
2012
As at December 31,
2011
Accounts payable $ 1,388 $ 1,446Interest payable 1,083 1,032Provisions for risks and expenses 235 287Deferred income related to loyalty programs 197 174Taxes payable 77 119Borrowings from financial institutions 43 37Cooperative shares and preferred shares 22 24Other 1,382 1,398
$ 4,427 $ 4,517
NOTE 16
SUBORDINATED BONDSSubordinated bonds are bonds subordinated in right of payment to claims of depositors and certain other creditors, and are included in regulatory capital. Redemption and cancellation of subordinated bonds are subject to the consent and approval of the various regulatory authorities.
Senior subordinated bonds comprise the following items:
As at December 31,
2012
As at December 31,
2011
Senior Series C bonds (par value of $300 million), issued on May 9, 2002, maturing in June 2017, bearing interest at an annual rate of 6.322% for the first 10 years, and for the following 5 years, at an annual rate equal to the 90-day bankers’ acceptance rate plus 1%, redeemable at the option of Desjardins Group $ — $ 290
Senior Series E bonds (par value of $500 million), issued on March 30, 2009, maturing in April 2019, bearing interest at an annual rate of 5.756% for the first 5 years, and for the following 5 years, at an annual rate equal to the 90-day bankers’ acceptance rate plus 4.97%, redeemable at the option of Desjardins Group 494 490
Senior Series F bonds (par value of $500 million), issued on June 1, 2009, maturing in June 2021, bearing interest at an annual rate of 5.541% for the first 7 years, and for the following 5 years, at an annual rate equal to the 90-day bankers’ acceptance rate plus 3.88%, redeemable at the option of Desjardins Group 497 498
Senior Series G bonds (par value of $900 million), issued on May 5, 2010, maturing in May 2020, bearing interest at an annual rate of 5.187%, redeemable at the option of Desjardins Group starting in 2015 897 896
Senior Series H bonds (par value of $700 million), issued on November 23, 2010, maturing in November 2020, bearing interest at an annual rate of 3.797% for the first 5 years, and for the following 5 years, at an annual rate equal to the 90-day bankers’ acceptance rate plus 1.32%, redeemable at the option of Desjardins Group starting in 2015 697 697
Senior Series J bonds (par value of $500 million), issued on December 15, 2011, maturing in December 2026, bearing interest at an annual rate of 4.954% for the first 10 years, and for the following 5 years, at an annual rate equal to the 90-day bankers’ acceptance rate plus 2.67%, redeemable at the option of Desjardins Group starting in 2021 496 479
$ 3,081 $ 3,350
NEW REDEMPTION
During fiscal 2012, Desjardins Group called all of its outstanding Senior Series C subordinated bonds amounting to $300 million.
1532012 DESJARDINS GROUP ANNUAL REPORT – NOTES TO THE COMBINED FINANCIAL STATEMENTS
NOTE 17
DERIVATIVE FINANCIAL INSTRUMENTS AND HEDGING ACTIVITIESDesjardins Group’s derivative financial instruments include the following types of contracts:
INTEREST RATE CONTRACTS
Interest rate contracts include swaps, forward rate agreements and futures. Interest rate swaps are transactions in which two parties exchange interest flows on a specified notional amount for a predetermined period based on agreed-upon fixed and floating rates. Principal amounts are not exchanged. Forward rate agreements are forward transactions on interest rates, based on a notional amount, which call for cash settlement at a future date for the difference between the contractual interest rate and the market rate. Futures represent a future commitment to purchase or deliver financial instruments on a later specified date at a specified price. Futures are traded in predetermined amounts on organized exchanges and are subject to daily cash margining.
FOREIGN EXCHANGE CONTRACTS
Foreign exchange contracts include forward contracts, spot transactions and currency swaps. Forward exchange contracts are commitments to exchange, at a future date, two currencies based on a rate agreed by both parties at the inception of the contract. Spot transactions are similar to forward exchange contracts, except that delivery must be made within two business days following the contract date. Currency swaps and cross-currency interest rate swaps are transactions in which the parties exchange interest payments on notional amounts in different currencies. Principal notional amounts are exchanged upon entering into the transaction and upon maturity. Desjardins Group uses currency swaps and cross-currency interest rate swaps to manage its foreign-currency denominated asset and liability exposures.
OPTIONS
Options are contractual agreements under which the seller grants the purchaser the right but not the obligation to buy (call option) or sell (put option) a specified amount of a financial instrument at a predetermined price, on or before a specified date. The seller receives a premium from the purchaser in exchange for this right. Desjardins Group enters into various options, such as interest rate, currency, stock index and commodity options, primarily to meet the needs of its members and clients and to manage its own asset-liability exposures.
CREDIT DEFAULT SWAPS
Credit default swaps are transactions in which one of the parties agrees to pay interest to the other party who, in turn, undertakes to make a payment should a predetermined credit incident occur. Desjardins Group uses credit default swaps to manage the credit risk associated with its assets and liabilities.
OTHER FINANCIAL DERIVATIVE CONTRACTS
Other financial derivative contracts used by Desjardins Group are related to financial index transactions and include mainly total return swaps. Total return swaps are transactions in which one party agrees to pay to or receive from the other party the rate of return on an underlying asset, group of assets or index in exchange for a remuneration specified in the contract.

154 2012 DESJARDINS GROUP ANNUAL REPORT – NOTES TO THE COMBINED FINANCIAL STATEMENTS
NOTE 17
DERIVATIVE FINANCIAL INSTRUMENTS AND HEDGING ACTIVITIES (CONTINUED)DERIVATIVE FINANCIAL INSTRUMENT MATURITIESThe following table presents the maturity terms of the notional amounts of derivative financial instruments.
As at December 31, 2012
Terms to maturityUnder1 year
1 to 3 years
Over 3 to 5 years
Over5 years
Notional amount
Interest rate contracts Over-the-counter contracts Interest rate swaps $ 23,736 $ 28,080 $ 27,096 $ 5,143 $ 84,055 Forward rate agreements 4,282 2,211 — — 6,493 Options purchased 150 — — — 150 Options written 150 — — — 150Exchange-traded contracts Futures 712 31 — — 743 Options purchased 26 — — — 26 Options written 36 — — — 36
29,092 30,322 27,096 5,143 91,653
Foreign exchange contracts Over-the-counter contracts Forward contracts 7,132 122 11 — 7,265 Currency swaps 1,407 1,169 2,487 — 5,063 Options purchased 171 1 — — 172 Options written 174 2 — — 176
8,884 1,294 2,498 — 12,676
Other contracts(1)
Over-the-counter contracts Swaps 231 229 1,928 — 2,388 Options purchased 1,446 3,482 3,200 285 8,413 Options written 1,443 3,477 3,129 275 8,324Exchange-traded contracts Futures 688 — — — 688
3,808 7,188 8,257 560 19,813
Total derivative financial instruments $ 41,784 $ 38,804 $ 37,851 $ 5,703 $ 124,142
(1) Includes contracts related to indexed term savings products.

1552012 DESJARDINS GROUP ANNUAL REPORT – NOTES TO THE COMBINED FINANCIAL STATEMENTS
NOTE 17
DERIVATIVE FINANCIAL INSTRUMENTS AND HEDGING ACTIVITIES (CONTINUED)The following table presents the maturity terms of the notional amounts of derivative financial instruments.
As at December 31, 2011
Terms to maturityUnder1 year
1 to 3 years
Over 3 to 5 years
Over5 years
Notional amount
Interest rate contracts Over-the-counter contracts Interest rate swaps $ 20,403 $ 35,821 $ 26,128 $ 5,798 $ 88,150 Forward rate agreements 2,241 896 — — 3,137 Options purchased 100 50 — — 150 Options written 100 50 — — 150Exchange-traded contracts Futures 1,536 133 — — 1,669 Options purchased 34 — — — 34 Options written 41 — — — 41
24,455 36,950 26,128 5,798 93,331
Foreign exchange contracts Over-the-counter contracts Forward contracts 7,015 212 — — 7,227 Currency swaps 2,146 1,191 1,526 11 4,874 Options purchased 250 6 — — 256 Options written 252 6 — — 258 Exchange-traded contracts Forward contracts 25 — — — 25
9,688 1,415 1,526 11 12,640
Other contracts(1)
Over-the-counter contracts Swaps 297 970 836 1,127 3,230 Options purchased 901 2,949 3,226 276 7,352 Options written 903 2,944 3,206 276 7,329Exchange-traded contracts Futures 602 — — — 602
2,703 6,863 7,268 1,679 18,513
Total derivative financial instruments $ 36,846 $ 45,228 $ 34,922 $ 7,488 $ 124,484
(1) Includes contracts related to indexed term savings products.

156 2012 DESJARDINS GROUP ANNUAL REPORT – NOTES TO THE COMBINED FINANCIAL STATEMENTS
NOTE 17
DERIVATIVE FINANCIAL INSTRUMENTS AND HEDGING ACTIVITIES (CONTINUED)The following table presents the fair value of derivative financial instruments recognized in the Combined Balance Sheets.
As at December 31, 2012 As at December 31, 2011Notional amount Assets Liabilities
Notional amount Assets Liabilities
Designated as hedging items Fair value hedges Interest rate contracts Swaps $ 21,159 $ 461 $ 72 $ 23,658 $ 819 $ 91
21,159 461 72 23,658 819 91
Foreign exchange contracts Forward contracts 205 — 2 223 4 — Currency swaps 3,482 90 17 4,013 89 203
3,687 90 19 4,236 93 203
Total – Fair value hedges 24,846 551 91 27,894 912 294
Cash flow hedges Interest rate contracts Swaps 25,603 409 24 24,100 692 25
25,603 409 24 24,100 692 25
Foreign exchange contracts Currency swaps 656 — 121 660 — 112
656 — 121 660 — 112
Total – Cash flow hedges 26,259 409 145 24,760 692 137
Total – Designated as hedging items 51,105 960 236 52,654 1,604 431
Trading purposes Interest rate contracts Swaps 37,293 537 236 40,392 724 476 Forward rate agreements 6,493 1 1 3,137 4 3 Futures 743 — — 1,669 2 — Options purchased 176 2 — 184 1 — Options written 186 — 1 191 — — 44,891 540 238 45,573 731 479 Foreign exchange contracts Forward contracts 7,060 30 26 7,029 30 71 Currency swaps 925 5 7 201 6 1 Options purchased 172 1 — 256 6 — Options written 176 — 1 258 — 8
8,333 36 34 7,744 42 80
Other contracts Swaps 2,388 34 33 3,230 190 106 Futures 688 — — 602 — 6 Options purchased 8,413 668 — 7,352 492 — Options written 8,324 — 681 7,329 — 491
19,813 702 714 18,513 682 603
Total – Trading purposes 73,037 1,278 986 71,830 1,455 1,162
Total derivative financial instruments before impact of master netting agreements $ 124,142 $ 2,238 $ 1,222 $ 124,484 $ 3,059 $ 1,593
Less: impact of master netting agreements(1) $ — $ 356 $ 356 $ — $ 772 $ 772
Total derivative financial instruments after impact of master netting agreements $ 124,142 $ 1,882 $ 866 $ 124,484 $ 2,287 $ 821
(1) Impact of offsetting credit exposure when Desjardins Group holds master netting agreements without the intention of settling on a net basis or simultaneously.
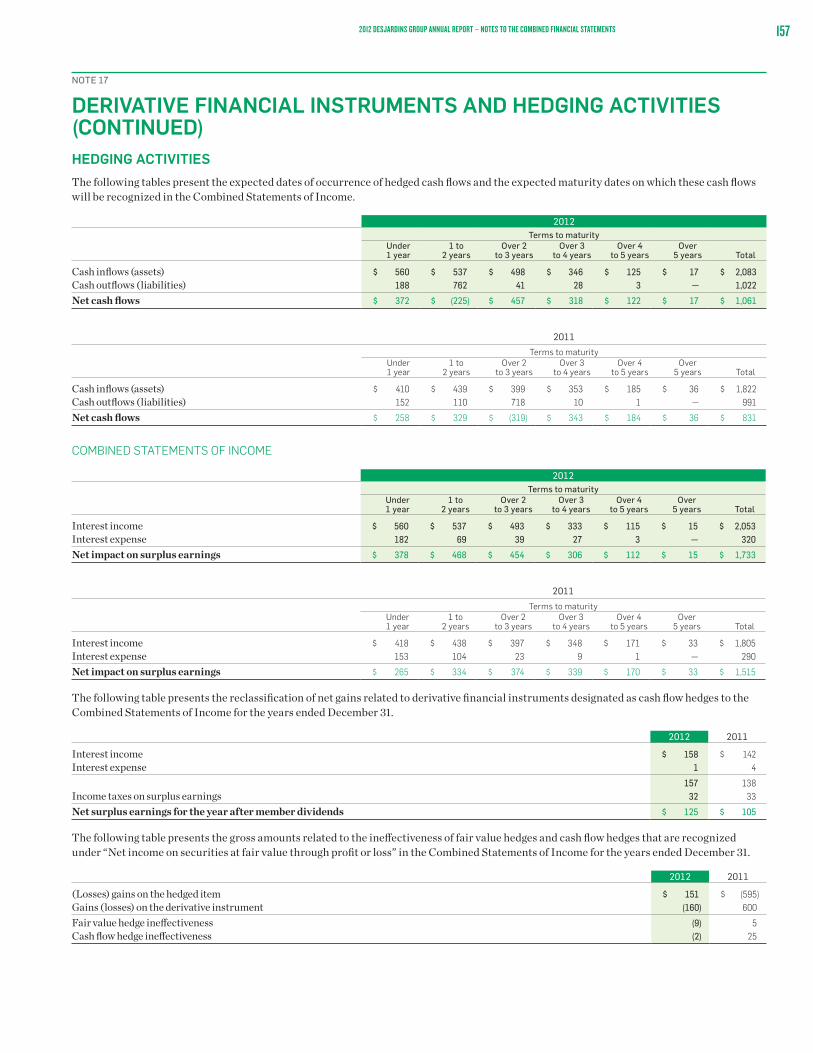
1572012 DESJARDINS GROUP ANNUAL REPORT – NOTES TO THE COMBINED FINANCIAL STATEMENTS
NOTE 17
DERIVATIVE FINANCIAL INSTRUMENTS AND HEDGING ACTIVITIES (CONTINUED)HEDGING ACTIVITIESThe following tables present the expected dates of occurrence of hedged cash flows and the expected maturity dates on which these cash flows will be recognized in the Combined Statements of Income.
2012Terms to maturity
Under1 year
1 to 2 years
Over 2 to 3 years
Over 3 to 4 years
Over 4 to 5 years
Over5 years Total
Cash inflows (assets) $ 560 $ 537 $ 498 $ 346 $ 125 $ 17 $ 2,083Cash outflows (liabilities) 188 762 41 28 3 — 1,022
Net cash flows $ 372 $ (225) $ 457 $ 318 $ 122 $ 17 $ 1,061
2011
Terms to maturityUnder1 year
1 to 2 years
Over 2 to 3 years
Over 3 to 4 years
Over 4 to 5 years
Over5 years Total
Cash inflows (assets) $ 410 $ 439 $ 399 $ 353 $ 185 $ 36 $ 1,822Cash outflows (liabilities) 152 110 718 10 1 — 991
Net cash flows $ 258 $ 329 $ (319) $ 343 $ 184 $ 36 $ 831
COMBINED STATEMENTS OF INCOME
2012Terms to maturity
Under1 year
1 to 2 years
Over 2 to 3 years
Over 3 to 4 years
Over 4 to 5 years
Over5 years Total
Interest income $ 560 $ 537 $ 493 $ 333 $ 115 $ 15 $ 2,053Interest expense 182 69 39 27 3 — 320
Net impact on surplus earnings $ 378 $ 468 $ 454 $ 306 $ 112 $ 15 $ 1,733
2011
Terms to maturityUnder1 year
1 to 2 years
Over 2 to 3 years
Over 3 to 4 years
Over 4 to 5 years
Over5 years Total
Interest income $ 418 $ 438 $ 397 $ 348 $ 171 $ 33 $ 1,805Interest expense 153 104 23 9 1 — 290
Net impact on surplus earnings $ 265 $ 334 $ 374 $ 339 $ 170 $ 33 $ 1,515
The following table presents the reclassification of net gains related to derivative financial instruments designated as cash flow hedges to the Combined Statements of Income for the years ended December 31.
2012 2011
Interest income $ 158 $ 142Interest expense 1 4
157 138Income taxes on surplus earnings 32 33
Net surplus earnings for the year after member dividends $ 125 $ 105
The following table presents the gross amounts related to the ineffectiveness of fair value hedges and cash flow hedges that are recognized under “Net income on securities at fair value through profit or loss” in the Combined Statements of Income for the years ended December 31.
2012 2011
(Losses) gains on the hedged item $ 151 $ (595)Gains (losses) on the derivative instrument (160) 600
Fair value hedge ineffectiveness (9) 5Cash flow hedge ineffectiveness (2) 25

158 2012 DESJARDINS GROUP ANNUAL REPORT – NOTES TO THE COMBINED FINANCIAL STATEMENTS
NOTE 17
DERIVATIVE FINANCIAL INSTRUMENTS AND HEDGING ACTIVITIES (CONTINUED)DERIVATIVE FINANCIAL INSTRUMENTS – CREDIT RISK
Notional amount Contract amount to which a rate or price is applied in order to calculate the exchange of cash flows.
Replacement cost The cost of replacing, at current market rates, all contracts with a positive market value, without taking into consideration the impact of netting agreements or any collateral which may be obtained.
Credit risk equivalent The total of the replacement cost and potential credit exposure, which is represented by the change in value based on a formula prescribed by the Bank for International Settlements (BIS), excluding items prescribed by the BIS, such as the replacement cost of forward exchange contracts with an original maturity term of less than 14 days and exchange-traded derivatives subject to daily cash margining.
Risk-weighted balance The risk related to the creditworthiness of the counterparty calculated at the rates prescribed by the BIS.
The following table gives an overview of Desjardins Group’s derivative financial instrument portfolio and the related credit risk, before and after the impact of master netting agreements.
As at December 31, 2012 As at December 31, 2011
Notional amount
Replacementcost
Creditrisk
equivalent
Riskweightedbalance
Notional amount
Replacementcost
Creditrisk
equivalent
Risk-weightedbalance
Interest rate contracts Swaps $ 84,055 $ 1,407 $ 1,758 $ 354 $ 88,150 $ 2,235 $ 2,621 $ 539 Forward rate agreements 6,493 1 12 2 3,137 4 8 2 Futures 743 — — — 1,669 2 — — Options purchased 176 2 2 — 184 1 1 — Options written 186 — — — 191 — — —
91,653 1,410 1,772 356 93,331 2,242 2,630 541
Foreign exchange contracts Forward contracts 7,265 30 108 32 7,252 34 113 32 Currency swaps 5,063 95 292 58 4,874 95 253 51 Options purchased 172 1 3 1 256 6 9 4 Options written 176 — — — 258 — — —
12,676 126 403 91 12,640 135 375 87
Other contracts Swaps 2,388 34 293 49 3,230 190 549 81 Futures 688 — — — 602 — — — Options purchased 8,413 668 1,337 267 7,352 492 1,087 217 Options written 8,324 — — — 7,329 — — —
19,813 702 1,630 316 18,513 682 1,636 298
Total derivative financial instruments before impact of master netting agreements $ 124,142 $ 2,238 $ 3,805 $ 763 $ 124,484 $ 3,059 $ 4,641 $ 926
Less: Impact of master netting agreements(1) $ — $ 356 $ — $ 419 $ — $ 772 $ — $ 615
Total derivative financial instruments after impact of master netting agreements $ 124,142 $ 1,882 $ 3,805 $ 344 $ 124,484 $ 2,287 $ 4,641 $ 311
(1) Impact of offsetting credit exposure when Desjardins Group holds master netting agreements without the intention of settling on a net basis or simultaneously.
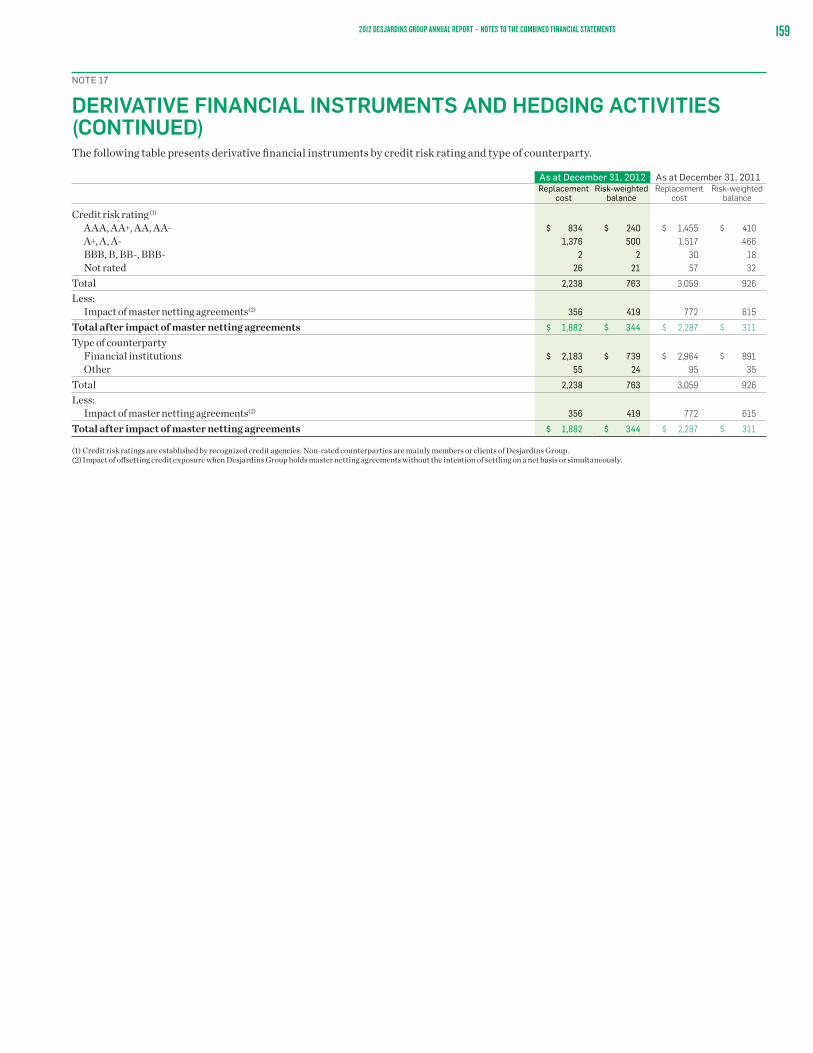
1592012 DESJARDINS GROUP ANNUAL REPORT – NOTES TO THE COMBINED FINANCIAL STATEMENTS
NOTE 17
DERIVATIVE FINANCIAL INSTRUMENTS AND HEDGING ACTIVITIES (CONTINUED)The following table presents derivative financial instruments by credit risk rating and type of counterparty.
As at December 31, 2012 As at December 31, 2011Replacement
costRiskweighted
balanceReplacement
costRisk-weighted
balance
Credit risk rating (1)
AAA, AA+, AA, AA- $ 834 $ 240 $ 1,455 $ 410 A+, A, A- 1,376 500 1,517 466 BBB, B, BB-, BBB- 2 2 30 18 Not rated 26 21 57 32
Total 2,238 763 3,059 926
Less: Impact of master netting agreements(2) 356 419 772 615
Total after impact of master netting agreements $ 1,882 $ 344 $ 2,287 $ 311
Type of counterparty Financial institutions $ 2,183 $ 739 $ 2,964 $ 891 Other 55 24 95 35
Total 2,238 763 3,059 926
Less: Impact of master netting agreements(2) 356 419 772 615
Total after impact of master netting agreements $ 1,882 $ 344 $ 2,287 $ 311
(1) Credit risk ratings are established by recognized credit agencies. Non-rated counterparties are mainly members or clients of Desjardins Group. (2) Impact of offsetting credit exposure when Desjardins Group holds master netting agreements without the intention of settling on a net basis or simultaneously.
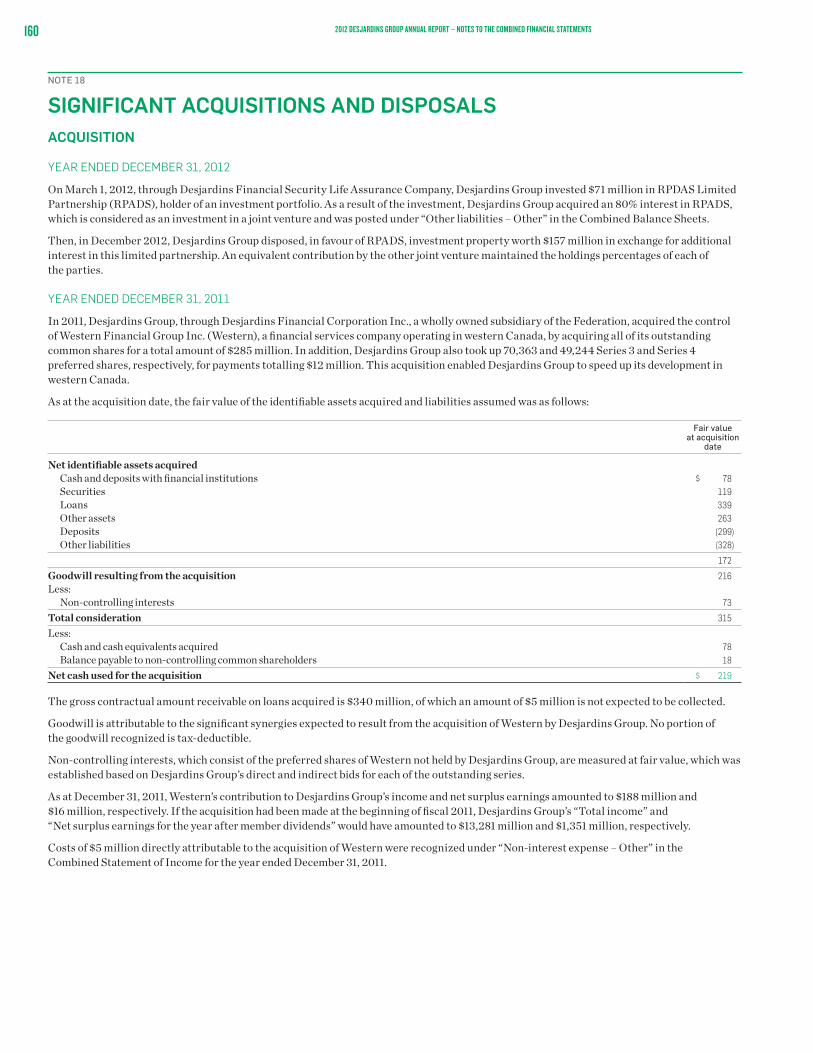
160 2012 DESJARDINS GROUP ANNUAL REPORT – NOTES TO THE COMBINED FINANCIAL STATEMENTS
NOTE 18
SIGNIFICANT ACQUISITIONS AND DISPOSALSACQUISITION
YEAR ENDED DECEMBER 31, 2012
On March 1, 2012, through Desjardins Financial Security Life Assurance Company, Desjardins Group invested $71 million in RPDAS Limited Partnership (RPADS), holder of an investment portfolio. As a result of the investment, Desjardins Group acquired an 80% interest in RPADS, which is considered as an investment in a joint venture and was posted under “Other liabilities – Other” in the Combined Balance Sheets.
Then, in December 2012, Desjardins Group disposed, in favour of RPADS, investment property worth $157 million in exchange for additional interest in this limited partnership. An equivalent contribution by the other joint venture maintained the holdings percentages of each of the parties.
YEAR ENDED DECEMBER 31, 2011
In 2011, Desjardins Group, through Desjardins Financial Corporation Inc., a wholly owned subsidiary of the Federation, acquired the control of Western Financial Group Inc. (Western), a financial services company operating in western Canada, by acquiring all of its outstanding common shares for a total amount of $285 million. In addition, Desjardins Group also took up 70,363 and 49,244 Series 3 and Series 4 preferred shares, respectively, for payments totalling $12 million. This acquisition enabled Desjardins Group to speed up its development in western Canada.
As at the acquisition date, the fair value of the identifiable assets acquired and liabilities assumed was as follows:
Fair value at acquisition
date
Net identifiable assets acquired Cash and deposits with financial institutions $ 78 Securities 119 Loans 339 Other assets 263 Deposits (299) Other liabilities (328)
172
Goodwill resulting from the acquisition 216Less: Non-controlling interests 73
Total consideration 315
Less: Cash and cash equivalents acquired 78 Balance payable to non-controlling common shareholders 18
Net cash used for the acquisition $ 219
The gross contractual amount receivable on loans acquired is $340 million, of which an amount of $5 million is not expected to be collected.
Goodwill is attributable to the significant synergies expected to result from the acquisition of Western by Desjardins Group. No portion of the goodwill recognized is tax-deductible.
Non-controlling interests, which consist of the preferred shares of Western not held by Desjardins Group, are measured at fair value, which was established based on Desjardins Group’s direct and indirect bids for each of the outstanding series.
As at December 31, 2011, Western’s contribution to Desjardins Group’s income and net surplus earnings amounted to $188 million and $16 million, respectively. If the acquisition had been made at the beginning of fiscal 2011, Desjardins Group’s “Total income” and “Net surplus earnings for the year after member dividends” would have amounted to $13,281 million and $1,351 million, respectively.
Costs of $5 million directly attributable to the acquisition of Western were recognized under “Non-interest expense – Other” in the Combined Statement of Income for the year ended December 31, 2011.

1612012 DESJARDINS GROUP ANNUAL REPORT – NOTES TO THE COMBINED FINANCIAL STATEMENTS
NOTE 18
SIGNIFICANT ACQUISITIONS AND DISPOSALS (CONTINUED)DISPOSAL
YEAR ENDED DECEMBER 31, 2012
Desjardins Group made no material disposals in 2012.
YEAR ENDED DECEMBER 31, 2011
On June 1, 2011, Desjardins Group sold its interest in Desjardins Credit Union Inc. (DCU) for an amount of $10 million.
A loss of $3 million related to the disposal of DCU has been recognized under “Other income – Other” in the Combined Statement of Income for the year ended December 31, 2011.
The sale of DCU had the following impact on Desjardins Group’s assets and liabilities:
Carrying amount on
the date of disposal
Net assets sold Cash and deposits with financial institutions $ 61 Securities 133 Loans 802 Other assets 8 Deposits (965) Other liabilities (26)
13
Proceeds from disposal Cash 10 Less:
Costs directly attributable to the disposal (1)
Net proceeds from disposal 9
Loss on disposal before the reclassification of unrealized gains on available-for-sale securities 4 Reclassification of unrealized gains on available-for-sale securities 1
Loss on disposal $ 3
DCU’s assets were presented with the data for the Personal Services and Business and Institutional Services segment.

162 2012 DESJARDINS GROUP ANNUAL REPORT – NOTES TO THE COMBINED FINANCIAL STATEMENTS
NOTE 19
CAPITAL STOCKAUTHORIZEDCapital stock comprises qualifying shares, permanent shares, surplus shares and capital shares.
The caisses may issue an unlimited number of qualifying shares with a par value of $5, redeemable at the option of the issuer. Members have only one vote each, no matter how many qualifying shares they own.
The Act authorizes the issue of an unlimited number of permanent and surplus shares with a par value of $10 and $1, respectively. These shares do not carry any voting rights and cannot be redeemed except under certain conditions stipulated by the Act. Their rate of interest is determined annually by the general meeting of each caisse. Under the interest reinvestment program, interest on surplus shares is paid in shares, while interest on permanent shares may be paid in cash or in shares. Interest is recognized under “Remuneration on permanent shares” in the Combined Statements of Changes in Equity after being approved by the general meeting of each caisse, which is held in the four months following year-end.
The Federation may issue an unlimited number of F capital shares with a par value of $10. F capital shares may be issued to members of Desjardins caisses in Quebec, including their auxiliary members. The Federation has the right, by resolution of the Board of Directors and with the authorization of the AMF, to redeem unilaterally, in whole or in part, F capital shares at any time. The Federation may also purchase, in whole or in part, F capital shares by private agreement, at any time, with the authorization of the AMF. The repayment of principal and payment of interest are subject to compliance with certain conditions.
ISSUED AND PAID SHARES
As at December 31,
2012
As at December 31,
2011
Qualifying shares $ 37 $ 37Permanent shares 2,122 2,063Surplus shares 138 110F capital shares 1,025 —
$ 3,322 $ 2,210
ISSUANCE OF A NEW CLASS OF SHARES OF CAPITAL STOCKDuring the year ended December 31, 2012, the Federation issued a new class of capital shares. It issued 102,589,044 F capital shares for a cash consideration of $1,024,763,922, which represents the gross proceeds of this share issue, $1,025,890,440 less share issue costs of $1,126,518.
NOTE 20
SHARE CAPITALAUTHORIZEDThere is an unlimited number of Class A preferred shares, offered only to members of the Fédération des caisses populaires de l’Ontario Inc. and the caisses populaires of Ontario, non-voting, redeemable at the option of the issuer at the paid-up amount plus declared and unpaid dividends, non-participating and non-cumulative.
There is an unlimited number of Class B preferred shares, non-voting, redeemable at the option of the issuer, the Fédération des caisses populaires de l’Ontario Inc. and the caisses populaires of Ontario, at the paid-up amount plus declared and unpaid dividends, non-participating and non-cumulative. These shares may be issued in one or more series.
There is an unlimited number of Class C preferred shares, non-voting, redeemable at the option of the issuer, the Fédération des caisses populaires de l’Ontario Inc., at the paid-up amount plus declared and unpaid dividends, non-participating and non-cumulative. These shares may be issued in one or more series.

1632012 DESJARDINS GROUP ANNUAL REPORT – NOTES TO THE COMBINED FINANCIAL STATEMENTS
NOTE 20
SHARE CAPITAL (CONTINUED)SPECIFIC CHARACTERISTICS OF ISSUED AND PAID CLASS B AND C PREFERRED SHARES
CLASS B PREFERRED SHARES – SERIES 2000, 2002 AND 2003
The dividend rate will be equal to the higher of the average interest rate for the year on non-redeemable term deposits of five years plus 0.50% or 6.00% (Series 2000), 1.00% or 5.25% (Series 2002) and 1.00% or 4.00% (Series 2003), i.e. the minimum rate. Should the issuer be unable to pay the dividend in full, a partial dividend may be declared. The dividend may be declared every time the issuer’s surplus earnings allow it and all regulatory requirements in terms of funding and cash have been met. The issuer may redeem, upon the holder’s request and the Board of Directors’ approval, up to a maximum of 10% of the issued and outstanding shares of the prior year. These shares have been redeemable at the option of the issuer since September 30, 2005, for Series 2000; since July 1, 2007, for Series 2002; and since March 1, 2008, for Series 2003. Shares can be redeemed only if the issuer does not or will not violate section 84 of the Ontario Credit Unions and Caisses Populaires Act, 1994, regarding capital adequacy.
CLASS C PREFERRED SHARES – SERIES 2010
The dividend rate will be equal to the highest of the following rates: the average interest rate for the year on non-redeemable term deposits of five years plus 0.50% or 4.25%, i.e. the minimum rate. Should the issuer be unable to pay the dividend in full, a partial dividend may be declared. The dividend may be declared every time the issuer’s surplus earnings allow it and that all regulatory requirements in terms of funding and cash have been met. The issuer may redeem, upon the holder’s request and the Board of Directors’ approval, up to a maximum of 10% of the issued and outstanding shares of the prior year. They are redeemable at the option of the issuer starting on January 1, 2015. Redemption of shares can be made only if the issuer does not or will not violate section 84 of the Ontario Credit Unions and Caisses Populaires Act, 1994, regarding capital adequacy.
ISSUED AND PAID SHARES
Numberof shares 2012 Number
of shares 2011
Class A preferred shares 682,000 $ 7 684,900 $ 7Class B preferred shares – Series 2000 50,000 1 50,000 1Class B preferred shares – Series 2002 380,200 4 380,200 4Class B preferred shares – Series 2003 655,200 6 655,200 6Class C preferred shares – Series 2010 6,205,300 62 6,000,000 60
$ 80 $ 78
During fiscal 2012, the issuer paid a dividend of $2 million in the form of Class C preferred shares – Series 2010 (205,300 shares). During fiscal 2011, the issuer redeemed the 2,144,400 Class C preferred shares – Series 1996 for an amount of $21 million and the 3,342,400 Class C preferred shares – Series 2002 for an amount of $33 million. It also issued 6,000,000 Class C preferred shares – Series 2010 for an amount of $60 million as well as 216,300 Class A preferred shares, 14,900 Class B preferred shares – Series 2002 and 7,200 Class B preferred shares – Series 2003 for a total amount of $2 million.
NOTE 21
ACCUMULATED OTHER COMPREHENSIVE INCOMEThe following table presents the main components of “Accumulated other comprehensive income” (net of taxes).
As at December 31, 2012 As at December 31, 2011
Group’s share
Noncontrolling interests’
share Group’s share
Non-controlling interests’
share
Net unrealized gains on available-for-sale securities $ 324 $ 28 $ 381 $ 29Net gains on derivative financial instruments designated as cash flow hedges 372 — 663 —Other (2) — — —
Accumulated other comprehensive income $ 694 $ 28 $ 1,044 $ 29

164 2012 DESJARDINS GROUP ANNUAL REPORT – NOTES TO THE COMBINED FINANCIAL STATEMENTS
NOTE 22
NON-CONTROLLING INTERESTSNon-controlling interests are detailed as follows:
As at December 31,
2012
As at December 31,
2011
Equity of participating policyholders of a life and health insurance subsidiary $ 230 $ 181Common shares of subsidiaries 106 91Capital shares of a subsidiary 61 62Preferred shares of subsidiaries 15 68
$ 412 $ 402
For the years ended December 31, “Net surplus earnings for the year after member dividends” attributable to non-controlling interests were as follows:
2012 2011
Participating policyholders of a life and health insurance subsidiary $ 48 $ 15Common shareholders of subsidiaries and holders of capital shares 24 18Preferred shareholders of subsidiaries 3 5
$ 75 $ 38
NOTE 23
NET INCOME (LOSS) ON SECURITIES AT FAIR VALUE THROUGH PROFIT OR LOSSFINANCIAL INSTRUMENTS HELD FOR TRADINGThe following table presents the impact of income from financial instruments held for trading on the Combined Statements of Income for the years ended December 31.
2012 2011
Income Net interest income $ 29 $ 12 Net income (loss) on securities at fair value through profit or loss (173) 289
$ (144) $ 301
FINANCIAL INSTRUMENTS DESIGNATED AS AT FAIR VALUE THROUGH PROFIT OR LOSSThe following table presents the impact of income from financial instruments designated as at fair value through profit or loss on the Combined Statements of Income for the years ended December 31.
2012 2011
Income Net interest income $ 28 $ 47 Net income on securities at fair value through profit or loss 847 1,417
$ 875 $ 1,464
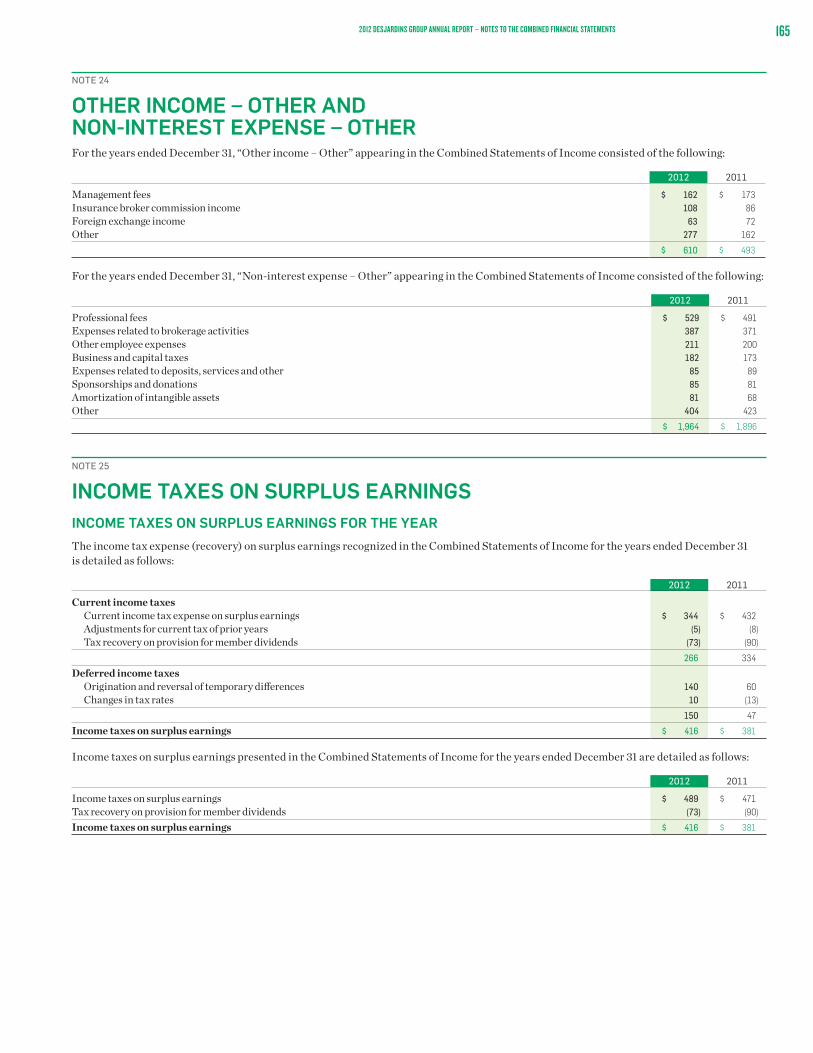
1652012 DESJARDINS GROUP ANNUAL REPORT – NOTES TO THE COMBINED FINANCIAL STATEMENTS
NOTE 24
OTHER INCOME – OTHER AND NON-INTEREST EXPENSE – OTHERFor the years ended December 31, “Other income – Other” appearing in the Combined Statements of Income consisted of the following:
2012 2011
Management fees $ 162 $ 173Insurance broker commission income 108 86Foreign exchange income 63 72Other 277 162
$ 610 $ 493
For the years ended December 31, “Non-interest expense – Other” appearing in the Combined Statements of Income consisted of the following:
2012 2011
Professional fees $ 529 $ 491Expenses related to brokerage activities 387 371Other employee expenses 211 200Business and capital taxes 182 173Expenses related to deposits, services and other 85 89Sponsorships and donations 85 81Amortization of intangible assets 81 68Other 404 423
$ 1,964 $ 1,896
NOTE 25
INCOME TAXES ON SURPLUS EARNINGSINCOME TAXES ON SURPLUS EARNINGS FOR THE YEAR The income tax expense (recovery) on surplus earnings recognized in the Combined Statements of Income for the years ended December 31 is detailed as follows:
2012 2011
Current income taxes Current income tax expense on surplus earnings $ 344 $ 432 Adjustments for current tax of prior years (5) (8) Tax recovery on provision for member dividends (73) (90)
266 334
Deferred income taxes Origination and reversal of temporary differences 140 60 Changes in tax rates 10 (13)
150 47
Income taxes on surplus earnings $ 416 $ 381
Income taxes on surplus earnings presented in the Combined Statements of Income for the years ended December 31 are detailed as follows:
2012 2011
Income taxes on surplus earnings $ 489 $ 471Tax recovery on provision for member dividends (73) (90)
Income taxes on surplus earnings $ 416 $ 381

166 2012 DESJARDINS GROUP ANNUAL REPORT – NOTES TO THE COMBINED FINANCIAL STATEMENTS
NOTE 25
INCOME TAXES ON SURPLUS EARNINGS (CONTINUED)TAX RATE RECONCILIATIONThe income tax expense (recovery) on surplus earnings recognized in the Combined Statements of Income for the years ended December 31 differs from the income tax expense (recovery) determined using the Canadian statutory rate for the following reasons:
2012 2011
Income taxes at the combined statutory rate of 27.52% (28.60% in 2011) $ 495 $ 496Eligible small business deduction and additional credit for credit unions (20) (30)Non-taxable investment income and other items (55) (56)Changes in tax rates 10 (13)Non-deductible expenses 12 15Adjustment for current tax of prior years (5) (8)Other (21) (23)
$ 416 $ 381
The statutory rate reduction is mainly due to the fact that the general federal tax rate was 15.00% in 2012, compared to 16.50% in 2011.
INCOME TAX EXPENSE ON OTHER COMPREHENSIVE INCOMEThe income tax expense (recovery) related to each component of other comprehensive income for the year is presented in the following table for the years ended December 31.
2012 2011
Net unrealized gains on available-for-sale securities $ 2 $ 90Reclassification of gains on available-for-sale securities to the Combined Statements on Income (35) (48)Net gains (losses) on derivative financial instruments designated as cash flow hedges (74) 140Reclassification of gains on derivative financial instruments designated as cash flow hedges
to the Combined Statements of Income (32) (33)
Total income tax expense $ (139) $ 149
Composition of income tax expense Current income taxes (21) 24 Deferred income taxes (118) 125
$ (139) $ 149
INCOME TAX EXPENSE ON ITEMS OF THE COMBINED STATEMENTS OF CHANGES IN EQUITYCurrent income taxes recognized in the Combined Statements of Changes in Equity for the years ended December 31 are detailed as follows:
2012 2011
Current income tax recovery on remuneration on permanent shares $ (25) $ (25)
DEFERRED INCOME TAXESThe deferred income tax sources are as follows:
Combined Balance Sheets
Combined Statements of Income
As at December 31,
2012
As at December 31,
2011 2012 2011
Deferred tax assets Insurance and investment contract liabilities $ 61 $ 98 $ 37 $ 80 Allowance for credit losses 71 74 4 7 Defined benefit plan liabilities 425 530 90 (1) Tax losses 62 115 61 8 Other 5 — — —
624 817 192 94
Deferred tax liabilities Property, plant and equipment and investment property 105 103 5 (22) Securities and other financial instruments 103 275 (59) (21) Other — 14 12 (4)
208 392 (42) (47)
Net deferred income tax assets $ 416 $ 425 $ 150 $ 47

1672012 DESJARDINS GROUP ANNUAL REPORT – NOTES TO THE COMBINED FINANCIAL STATEMENTS
NOTE 25
INCOME TAXES ON SURPLUS EARNINGS (CONTINUED)Deferred tax assets and liabilities are presented as follows in the Combined Balance Sheets:
As at December 31,
2012
As at December 31,
2011
Deferred tax assets(1) $ 758 $ 856Deferred tax liabilities(1) 342 431
$ 416 $ 425
(1) Deferred income taxes will reverse mainly in the long term.
The amount of deductible temporary differences, tax losses and tax credits for which no deferred tax assets have been recognized in the Combined Balance Sheets was $33 million ($3 million as at December 31, 2011). These amounts do not expire, apart from $21 million set to expire in 2013.
NOTE 26
DEFINED BENEFIT PLANSCHANGE IN DEFINED BENEFIT PLAN LIABILITIESDefined benefit plan liabilities are as follows:
As at December 31, 2012 As at December 31, 2011Group
pensionplans
Othergroupplan(1) Other(2) Total
Grouppension
plans
Othergroupplan(1) Other(2) Total
Change in defined benefit plan obligation Defined benefit plan obligation at
beginning of year $ 8,334 $ 604 $ 162 $ 9,100 $ 7,814 $ 556 $ 158 $ 8,528 Current service costs 211 18 7 236 215 15 6 236 Interest costs 429 31 8 468 423 30 8 461 Participants’ contributions 181 — — 181 158 — — 158 Benefits paid (300) (22) (7) (329) (260) (19) (6) (285) Past service costs 22 — — 22 — — — — Actuarial losses (gains) 720 28 18 766 (20) 22 7 9 Other changes (1) (3) (2) (6) 4 — (11) (7)
Defined benefit plan obligation at end of year $ 9,596 $ 656 $ 186 $ 10,438 $ 8,334 $ 604 $ 162 $ 9,100
Change in fair value of plan assets Fair value of plan assets at beginning of year $ 5,879 $ — $ 33 $ 5,912 $ 5,652 $ — $ 40 $ 5,692 Expected return on plan assets 444 — 2 446 416 — 2 418 Actuarial (losses) gains 156 — 1 157 (366) — (4) (370) Employers’ contributions(3) 604 — 6 610 274 — 5 279 Participants’ contributions 181 — — 181 158 — — 158 Benefits paid (299) — (1) (300) (259) — (1) (260) Other changes 5 — — 5 4 — (9) (5)
Fair value of plan assets at end of year $ 6,970 $ — $ 41 $ 7,011 $ 5,879 $ — $ 33 $ 5,912
Funding status at end of year $ (2,626) $ (656) $ (145) $ (3,427) $ (2,455) $ (604) $ (129) $ (3,188) Unamortized actuarial losses 1,624 69 32 1,725 1,078 41 19 1,138 Unrecognized past service costs 3 (49) 2 (44) 1 (56) 3 (52)
Defined benefit plan liabilities $ (999) $ (636) $ (111) $ (1,746) $ (1,376) $ (619) $ (107) $ (2,102)
Funding statusFunded plans Defined benefit plan liabilities $ 9,524 $ — $ 64 $ 9,588 $ 8,281 $ — $ 50 $ 8,331 Fair value of plan assets 6,970 — 41 7,011 5,879 — 33 5,912
$ (2,554) $ — $ (23) $ (2,577) $ (2,402) $ — $ (17) $ (2,419)
Unfunded plans Defined benefit plan liabilities $ 72 $ 656 $ 122 $ 850 $ 53 $ 604 $ 112 $ 769
$ (72) $ (656) $ (122) $ (850) $ (53) $ (604) $ (112) $ (769)
(1) Medical, dental and life insurance plan.(2) Pension plans and medical, dental and life insurance plans not representing group plans.(3) In 2012, the employer paid supplemental contributions of $288 million to the main group pension plan. No supplemental contribution had been paid in 2011.
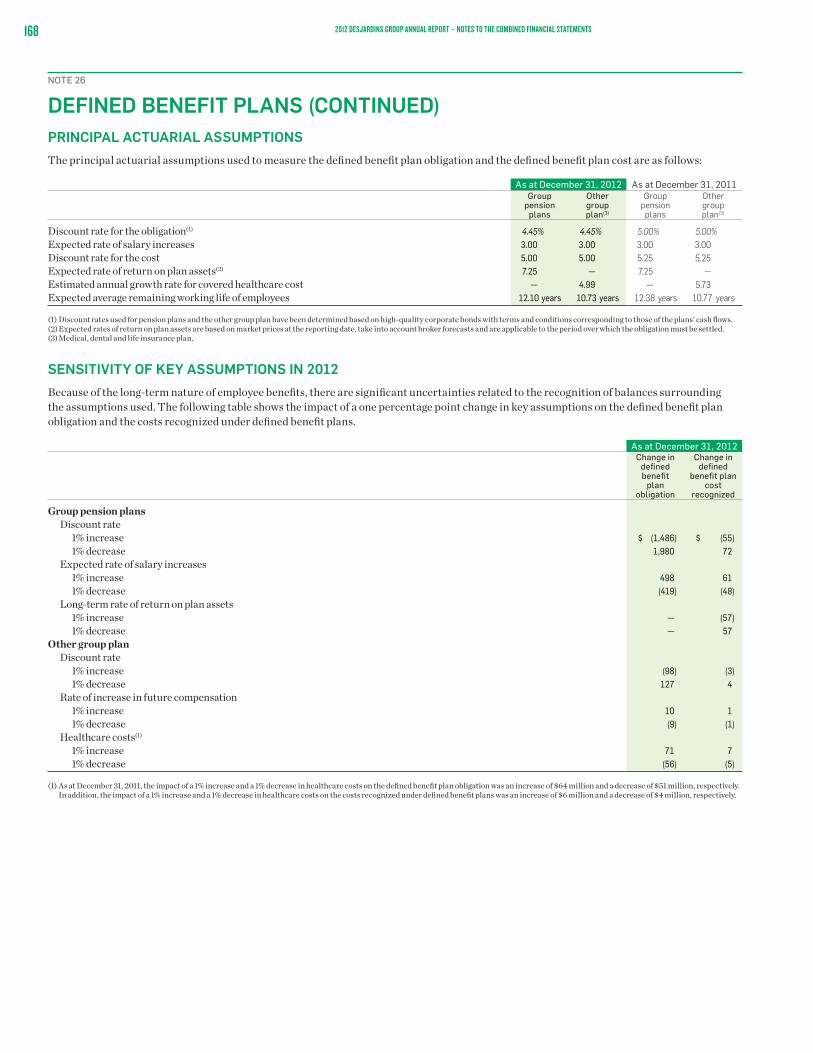
168 2012 DESJARDINS GROUP ANNUAL REPORT – NOTES TO THE COMBINED FINANCIAL STATEMENTS
NOTE 26
DEFINED BENEFIT PLANS (CONTINUED)PRINCIPAL ACTUARIAL ASSUMPTIONSThe principal actuarial assumptions used to measure the defined benefit plan obligation and the defined benefit plan cost are as follows:
As at December 31, 2012 As at December 31, 2011Group
pensionplans
Othergroupplan(3)
Grouppension
plans
Othergroupplan(3)
Discount rate for the obligation(1) 4.45% 4.45% 5.00% 5.00%Expected rate of salary increases 3.00 3.00 3.00 3.00Discount rate for the cost 5.00 5.00 5.25 5.25Expected rate of return on plan assets(2) 7.25 — 7.25 —Estimated annual growth rate for covered healthcare cost — 4.99 — 5.73Expected average remaining working life of employees 12.10 years 10.73 years 12.38 years 10.77 years
(1) Discount rates used for pension plans and the other group plan have been determined based on high-quality corporate bonds with terms and conditions corresponding to those of the plans’ cash flows.(2) Expected rates of return on plan assets are based on market prices at the reporting date, take into account broker forecasts and are applicable to the period over which the obligation must be settled. (3) Medical, dental and life insurance plan.
SENSITIVITY OF KEY ASSUMPTIONS IN 2012Because of the long-term nature of employee benefits, there are significant uncertainties related to the recognition of balances surrounding the assumptions used. The following table shows the impact of a one percentage point change in key assumptions on the defined benefit plan obligation and the costs recognized under defined benefit plans.
As at December 31, 2012 Change in
defined benefit
plan obligation
Change indefined
benefit plancost
recognized
Group pension plans Discount rate 1% increase $ (1,486) $ (55) 1% decrease 1,980 72 Expected rate of salary increases 1% increase 498 61 1% decrease (419) (48) Long-term rate of return on plan assets 1% increase — (57) 1% decrease — 57Other group plan Discount rate 1% increase (98) (3) 1% decrease 127 4 Rate of increase in future compensation 1% increase 10 1 1% decrease (9) (1) Healthcare costs(1)
1% increase 71 7 1% decrease (56) (5)
(1) As at December 31, 2011, the impact of a 1% increase and a 1% decrease in healthcare costs on the defined benefit plan obligation was an increase of $64 million and a decrease of $51 million, respectively. In addition, the impact of a 1% increase and a 1% decrease in healthcare costs on the costs recognized under defined benefit plans was an increase of $6 million and a decrease of $4 million, respectively.

1692012 DESJARDINS GROUP ANNUAL REPORT – NOTES TO THE COMBINED FINANCIAL STATEMENTS
NOTE 26
DEFINED BENEFIT PLANS (CONTINUED)ALLOCATION OF GROUP PENSION PLAN ASSETSThe fair value of group pension plan assets is detailed as follows, as a percentage:
As at December 31,
2012
As at December 31,
2011
Main asset categoriesShares 38.8% 40.1%Bonds 35.5 29.9Real estate 12.5 12.7Other 13.2 17.3
As at December 31, 2012, the plan held eligible investments in money market securities and segregated funds issued by Desjardins Group entities, whose fair value totalled $105 million ($136 million as at December 31, 2011).
DEFINED BENEFIT PLAN COST RECOGNIZEDThe amounts recognized in profit or loss under “Salaries and fringe benefits” for the years ended December 31 are as follows:
2012 2011Group
pensionplans
Othergroupplan(1) Other(2)
Grouppensionplans
Othergroupplan(1) Other(2)
Current service costs $ 211 $ 14 $ 7 $ 215 $ 10 $ 6Interest costs 429 31 8 423 30 8Expected return on plan assets (444) — (2) (416) — (2)Net actuarial losses recognized during the year 16 — 3 2 — 8Past service costs 22 (7) 1 — (7) 1Other — — — (1) — —
$ 234 $ 38 $ 17 $ 223 $ 33 $ 21
(1) Medical, dental and life insurance plan.(2) Pension plans and medical, dental and life insurance plans not representing group plans.
For the year ended December 31, 2012, the actual return on plan assets was $604 million ($49 million in 2011).
EXPECTED CONTRIBUTIONS FOR 2013Desjardins Group expects to contribute $344 million to its defined benefit pension plans in the next year. If necessary, the employer will make supplemental contributions to the main group pension plan.
RETROSPECTIVE DISCLOSURES Amounts related to 2012 and the two previous years are as follows:
As at December 31, 2012 As at December 31, 2011 As at December 31, 2010Group
pensionplans
Othergroupplan(1) Other(2)
Grouppensionplans
Othergroupplan(1) Other(2)
Grouppensionplans
Othergroupplan(1) Other(2)
Defined benefit plan liabilities $ 9,596 $ 656 $ 186 $ 8,334 $ 604 $ 162 $ 7,814 $ 556 $ 158Fair value of plan assets 6,970 — 41 5,879 — 33 5,652 — 40
Plan surplus (deficit) (2,626) (656) (145) (2,455) (604) (129) (2,162) (556) (118)Experience gains (losses) on defined
benefit plan obligations 161 (3) (3) (148) (15) 1 (36) (3) —
Experience gains (losses) on plan assets $ 157 $ — $ 1 $ (366) $ — $ (4) $ 170 $ — $ 1
(1) Medical, dental and life insurance plan.(2) Pension plans and medical, dental and life insurance plans not representing group plans.
As at January 1, 2010, the liability, fair value of assets and deficit balances for the group pension plans and other group plan were $6,946 million, $4,944 million and $2,002 million, respectively. For the other plans, these balances were $131 million, $32 million and $99 million, respectively.

170 2012 DESJARDINS GROUP ANNUAL REPORT – NOTES TO THE COMBINED FINANCIAL STATEMENTS
NOTE 27
COMMITMENTS, GUARANTEES AND CONTINGENT LIABILITIESCOMMITMENTS
COMMITMENTS RELATED TO FINANCIAL INSTRUMENTS WITH CONTRACTUAL AMOUNTS REPRESENTING A CREDIT RISK
The primary purpose of these instruments is to ensure that members and clients have funds available, when necessary, for variable maturity terms and under specific conditions. Desjardins Group’s policy with respect to collateral for these credit instruments is generally the same as for loans.
The total amount of credit instruments does not necessarily represent future cash requirements since many of these instruments will expire or terminate without being funded. The following table presents the contractual amounts for these commitments.
As at December 31,
2012
As at December 31,
2011
Commitments made Guarantees and standby letters of credit $ 906 $ 733 Securities lending(1) 1,848 1,512 Credit commitments Original term of 1 year or less 55,236 50,260 Original term of over 1 year 6,124 5,444
(1) Secured by marketable securities generally issued by the federal or provincial governments, representing 102% of the contractual amount.
GUARANTEES AND STANDBY LETTERS OF CREDIT
Guarantees and standby letters of credit represent irrevocable commitments by Desjardins Group to make payments in the event that a member or client cannot meet financial obligations to third parties. Desjardins Group’s policy with respect to collateral received for these instruments is generally the same as for loans. The term of these products does not exceed five years.
The collective allowance for credit losses covers all credit risks, including guarantees and standby letters of credit.
SECURITIES LENDING
In the normal course of operations, Desjardins Group lends its own securities or those of members and clients. When lending securities of members or clients, Desjardins Group acts as an agent for the owner of a security, who agrees to lend it to a borrower for a commission under the terms of a pre-arranged contract.
In securities lending transactions, the loans must at all times be secured by the borrower (secured by marketable securities generally issued by the federal and provincial governments). There is a risk of loss if the borrower defaults on its commitments and the value of the collateral is not adequate to cover the amount of the loan. The credit risk related to these transactions is considered to be minimal since Desjardins Group deals only with reputable stock brokerage firms and financial institutions. Furthermore, the borrower pledges securities of a value that is at least equivalent to the amount of the loan adjusted on a daily basis. The securities lending transactions for which securities were received as collateral are included in the table above, whereas the securities lending transactions of $7,983 million as at December 31, 2012 ($8,500 million in 2011), for which cash was received as collateral, are excluded from the table above because they are recorded under “Commitments related to securities lent or sold under repurchase agreements” in the Combined Balance Sheets.
CREDIT COMMITMENTS
Credit commitments represent unused portions of authorizations to extend credit in the form of loans, guarantees or letters of credit.
Additional information on these commitments is provided in the “Asset-backed term notes” section of Note 6, “Securities”.

1712012 DESJARDINS GROUP ANNUAL REPORT – NOTES TO THE COMBINED FINANCIAL STATEMENTS
NOTE 27
COMMITMENTS, GUARANTEES AND CONTINGENT LIABILITIES (CONTINUED)GUARANTEES
MAXIMUM POTENTIAL AMOUNT OF FUTURE PAYMENTS
The guarantees that Desjardins Group granted to third parties and the maximum potential amount of future payments under these guarantees are as follows:
As at December 31,
2012
As at December 31,
2011
Guarantees and standby letters of credit $ 906 $ 733Credit default swaps 559 601Guarantee for securities lending with indemnification 1,818 2,066
$ 3,283 $ 3,400
CREDIT DEFAULT SWAPS
Desjardins Group has entered into credit default swaps with bank counterparties. It has made an irrevocable commitment to the counterparties to assume the credit risk for the bonds that constitute the underlying assets for the swaps. The guarantee given by Desjardins Group is to provide partial or total payment for one security or a group of securities following an unfavourable event leading to a payment default.
The maximum amount of the guarantee is equal to the notional amount of the swap. The amounts to be disbursed will depend on the nature of the default and the recovery rates of the securities in collection.
The underlying assets for the swaps are credit derivatives within high-quality securitization structures. The swaps mature on various dates through 2017.
GUARANTEE FOR SECURITIES LENDING WITH INDEMNIFICATION
As part of its asset custody activities, Desjardins Group entered into securities lending agreements with members and clients under which Desjardins Group obtains guarantees in order to protect itself against any potential losses. The guarantee for securities lending with indemnification represents the contractual amount of members’ and clients’ securities for which Desjardins Group is the custodian. As at December 31, 2012, “Commitments related to securities lent or sold under repurchase agreements”, recognized in the Combined Balance Sheet, included securities lending with indemnification for which a cash amount of $718 million ($1,099 million in 2011) was received as a guarantee. An additional amount of $1,100 million ($967 million in 2011) received as securities was included in the “Maximum potential amount of future payments” table.
OTHER INDEMNIFICATION AGREEMENTS
In the normal course of its operations, Desjardins Group enters into agreements containing indemnification provisions. The indemnifications are normally related to the sale of assets, purchase agreements, service agreements, lease agreements, clearing agreements, and transfers of assets or shares. Under these agreements, Desjardins Group may be liable for indemnifying a counterparty if certain events occur, such as amendments to statutes and regulations (including tax rules) as well as to disclosed financial positions, the existence of undisclosed liabilities, and losses resulting from third-party activities or as a result of third-party litigation. The indemnification provisions vary from one contract to the next. In several cases, no predetermined amount or limit is stated in the contract, and future events that would trigger a payment would be difficult to foresee. Therefore, the maximum amount that Desjardins Group could be required to pay counterparties cannot be estimated. In the past, payments made under these agreements have been immaterial.

172 2012 DESJARDINS GROUP ANNUAL REPORT – NOTES TO THE COMBINED FINANCIAL STATEMENTS
NOTE 27
COMMITMENTS, GUARANTEES AND CONTINGENT LIABILITIES (CONTINUED)FINANCIAL ASSETS PLEDGED AS COLLATERAL
The carrying amounts of financial assets pledged as collateral by Desjardins Group in the normal course of operations are presented in the following table:
As at December 31,
2012
As at December 31,
2011
Financial assets pledged as collateral to the following counterparties: Bank of Canada $ 121 $ 137 Clearing systems, payment systems and depositories(1) 8,123 7,817Financial assets pledged as collateral for the following transactions: Transactions on derivative financial instruments 46 73 Securities borrowing 30 159 Commitments related to securities lent or sold under repurchase agreements 7,587 7,385 Securitization transactions 6,280 4,486 Covered bonds 2,671 1,157 Other 2 —
$ 24,860 $ 21,214
(1) In the normal course of its operations, Desjardins Group must pledge collateral to the Bank of Canada for the use of the Large Value Transfer System. Since 2010, the Bank of Canada has allowed Desjardins Group to pledge as collateral assets other than securities. Therefore, Desjardins Group used for this purpose credit card receivables having a carrying amount of $7,791 million as at December 31, 2012 ($7,530 million in 2011).
FINANCIAL ASSETS HELD AS COLLATERAL
As at December 31, 2012, the fair value of the financial assets held as collateral that Desjardins Group is permitted to sell or repledge in the absence of default totalled $5,340 million ($5,610 million as at December 31, 2011). The fair value of financial assets accepted as collateral sold or repledged amounted to $3,663 million ($3,497 million as at December 31, 2011).
These financial assets held as collateral were obtained as a result of transactions involving securities borrowed or purchased under reverse repurchase agreements. Such transactions are carried out under normal market conditions for these types of transactions.
As at December 31, 2012, Desjardins Group had not entered into any securities lending transactions in exchange for securities for which such securities had been repledged or relent.
CONTINGENT LIABILITIESIn the normal course of operations, Desjardins Group is a party to various legal claims and lawsuits relating to its various products, services, investments and other activities. Motions for leave to commence class actions have been filed against certain Desjardins Group entities, notably with respect to the management and distribution of guaranteed-capital products.
More specifically, a class action has been filed against Desjardins Group for the reimbursement of foreign currency exchange fees charged to Visa Desjardins cardholders. On June 11, 2009, the Superior Court of Quebec had required the reimbursement of such fees under terms that were to be set subsequently by the Court. On August 2, 2012, the Court of Appeal of Quebec reversed the decision by ruling in favour of Desjardins Group’s arguments. In October, the plaintiff sought leave to appeal this decision with the Supreme Court of Canada. Desjardins Group awaits this decision.
It is not currently possible to predict the outcome of these legal claims and lawsuits (including the above-mentioned class action), the timing of such outcomes, or the potential impact on Desjardins Group’s financial position. In management’s opinion, it is possible that the fair value of the contingent liabilities resulting from these legal claims and lawsuits, to the extent such an amount can be estimated, could have an impact on Desjardins Group’s combined profit or loss for a specific period. However, it would not have a significant adverse impact on Desjardins Group’s combined financial position.

1732012 DESJARDINS GROUP ANNUAL REPORT – NOTES TO THE COMBINED FINANCIAL STATEMENTS
NOTE 28
LEASESLEASES – AS LESSEE
OPERATING LEASE
The minimum future commitments under leases for premises and equipment for the years ended December 31 are presented in the following table.
2012 2011
Under 1 year $ 67 $ 871 to 5 years 220 265Over 5 years 151 191
438 543
Total future minimum sublease payments to be received $ (1) $ (1)
Lease payments recognized as an expense for the years ended December 31 are as follows:
2012 2011
Minimum payments $ 74 $ 84Contingent rents 1 —Sublease income (15) (7)
Total lease expenses $ 60 $ 77
LEASES – AS LESSOR
OPERATING LEASE
For the years ended December 31, future minimum lease payments to be received under non-cancellable leases for premises and equipment are as follows:
2012 2011
Under 1 year $ 65 $ 961 to 5 years 163 221Over 5 years 69 169
Total future minimum payments $ 297 $ 486
Total contingent rents recognized as income for the year ended December 31, 2012, were $2 million ($2 million in 2011).
NOTE 29
FINANCIAL INSTRUMENT RISK MANAGEMENTDesjardins Group is exposed to different types of financial instrument risks in the normal course of operations, including credit risk, market risk and liquidity risk. The manner in which Desjardins Group assesses its risks as well as the objectives, policies and methods it uses to manage them are presented in Section 4.1, “Risk Management”, of the Management’s Discussion and Analysis. The shaded boxes containing text and tables presented in that section are an integral part of these Combined Financial Statements.

174 2012 DESJARDINS GROUP ANNUAL REPORT – NOTES TO THE COMBINED FINANCIAL STATEMENTS
NOTE 30
INTEREST RATE SENSITIVITY AND MATURITY MATCHINGThe following tables present the exposure to interest rate risks. Financial instruments are presented based on their maturity date or repricing date, whichever is earlier.
As at December 31, 2012
Floating rate
Under3 months
3 to6 months
Over 6 to12 months
Over 1 to5 years
Over5 years
Noninterestsensitive
and provisions Total
AssetsCash and deposits with financial institutions $ — $ — $ — $ — $ — $ — $ 1,669 $ 1,669Securities 646 4,466 1,289 1,377 15,571 14,018 2,945 40,312Effective interest rate 1.70% 1.95% 2.41% 2.22% 4.32%Securities borrowed or purchased under reverse
repurchase agreements — 4,078 299 — — — — 4,377Effective interest rate 1.76% 2.95%Loans 43,326 15,200 13,741 18,394 39,319 2,475 121 132,576Effective interest rate 3.63% 3.88% 3.79% 4.36% 5.23%Segregated fund assets and other assets(1) — (2,529) — — 2,624 — 17,677 17,772
$ 43,972 $ 21,215 $ 15,329 $ 19,771 $ 57,514 $ 16,493 $ 22,412 $ 196,706
Liabilities and equityDeposits $ 13,742 $ 15,905 $ 8,530 $ 15,575 $ 42,952 $ 1,301 $ 31,619 $ 129,624Effective interest rate 1.30% 2.20% 1.83% 2.69% 3.38%Commitments related to securities sold short 129 131 6 — 2,222 2,477 12 4,977Effective interest rate 2.71% 5.25% 2.11% 3.89%Commitments related to securities lent or sold
under repurchase agreements — 7,472 — — — — 511 7,983Effective interest rate 2.21%Insurance and investment contract liabilities — — — — — — 17,777 17,777Other liabilities(1) (139) 1,059 — (505) (386) — 17,606 17,635Subordinated bonds — — — — 1,688 1,393 — 3,081Effective interest rate 4.88% 5.10%Equity — — — — — — 15,629 15,629
$ 13,732 $ 24,567 $ 8,536 $ 15,070 $ 46,476 $ 5,171 $ 83,154 $ 196,706
Sensitivity gap – Combined Balance Sheet items $ 30,240 $ (3,352) $ 6,793 $ 4,701 $ 11,038 $ 11,322 $ (60,742) $ —Sensitivity gap – Derivative financial instruments,
based on notional amounts — (1,527) 6 (101) (85) 1,707 — —
Total interest rate sensitivity gap $ 30,240 $ (4,879) $ 6,799 $ 4,600 $ 10,953 $ 13,029 $ (60,742) $ —
(1) Segregated fund assets and liabilities are not exposed to interest rate risk. For more information, see Note 9, “Segregated funds”.
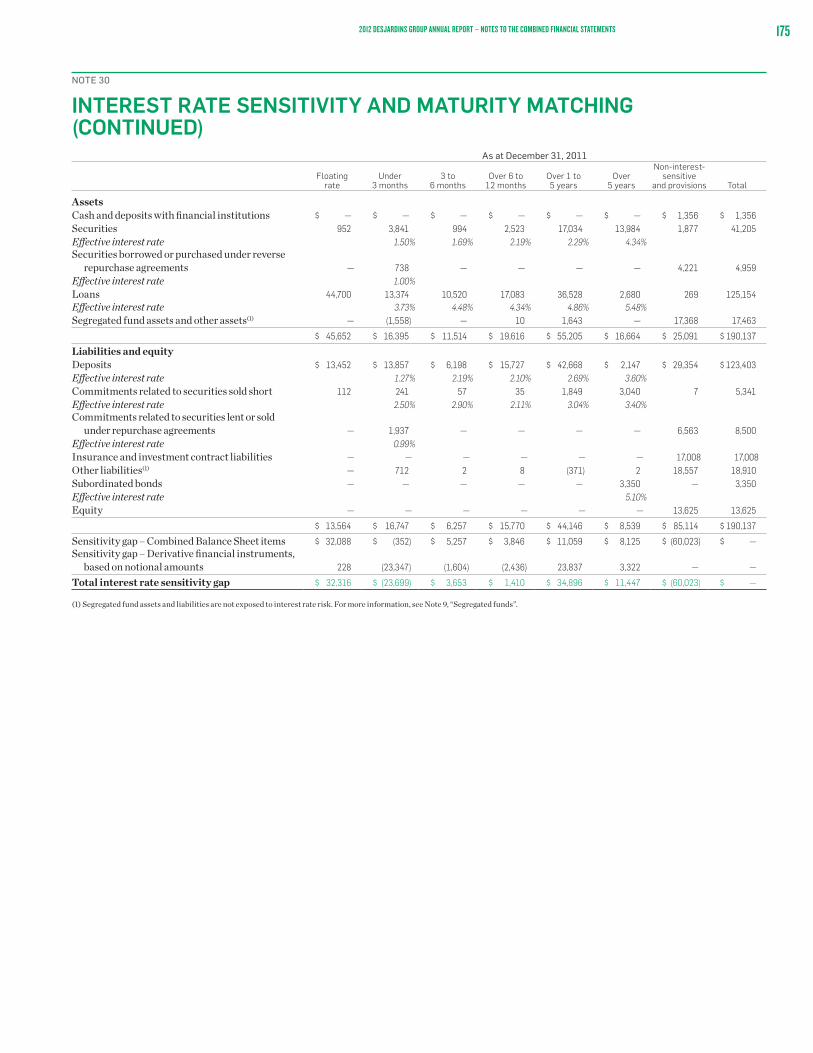
1752012 DESJARDINS GROUP ANNUAL REPORT – NOTES TO THE COMBINED FINANCIAL STATEMENTS
NOTE 30
INTEREST RATE SENSITIVITY AND MATURITY MATCHING (CONTINUED)
As at December 31, 2011
Floating rate
Under3 months
3 to6 months
Over 6 to12 months
Over 1 to5 years
Over5 years
Non-interest-sensitive
and provisions Total
AssetsCash and deposits with financial institutions $ — $ — $ — $ — $ — $ — $ 1,356 $ 1,356Securities 952 3,841 994 2,523 17,034 13,984 1,877 41,205Effective interest rate 1.50% 1.69% 2.19% 2.29% 4.34%Securities borrowed or purchased under reverse
repurchase agreements — 738 — — — — 4,221 4,959Effective interest rate 1.00%Loans 44,700 13,374 10,520 17,083 36,528 2,680 269 125,154Effective interest rate 3.73% 4.48% 4.34% 4.86% 5.48%Segregated fund assets and other assets(1) — (1,558) — 10 1,643 — 17,368 17,463
$ 45,652 $ 16,395 $ 11,514 $ 19,616 $ 55,205 $ 16,664 $ 25,091 $ 190,137
Liabilities and equityDeposits $ 13,452 $ 13,857 $ 6,198 $ 15,727 $ 42,668 $ 2,147 $ 29,354 $ 123,403Effective interest rate 1.27% 2.19% 2.10% 2.69% 3.60%Commitments related to securities sold short 112 241 57 35 1,849 3,040 7 5,341Effective interest rate 2.50% 2.90% 2.11% 3.04% 3.40%Commitments related to securities lent or sold
under repurchase agreements — 1,937 — — — — 6,563 8,500Effective interest rate 0.99%Insurance and investment contract liabilities — — — — — — 17,008 17,008Other liabilities(1) — 712 2 8 (371) 2 18,557 18,910Subordinated bonds — — — — — 3,350 — 3,350Effective interest rate 5.10%Equity — — — — — — 13,625 13,625
$ 13,564 $ 16,747 $ 6,257 $ 15,770 $ 44,146 $ 8,539 $ 85,114 $ 190,137
Sensitivity gap – Combined Balance Sheet items $ 32,088 $ (352) $ 5,257 $ 3,846 $ 11,059 $ 8,125 $ (60,023) $ —Sensitivity gap – Derivative financial instruments,
based on notional amounts 228 (23,347) (1,604) (2,436) 23,837 3,322 — —
Total interest rate sensitivity gap $ 32,316 $ (23,699) $ 3,653 $ 1,410 $ 34,896 $ 11,447 $ (60,023) $ —
(1) Segregated fund assets and liabilities are not exposed to interest rate risk. For more information, see Note 9, “Segregated funds”.
176 2012 DESJARDINS GROUP ANNUAL REPORT – NOTES TO THE COMBINED FINANCIAL STATEMENTS
NOTE 31
CAPITAL MANAGEMENTThe goal of capital management at Desjardins Group is to ensure that a sufficient level of high-quality capital is maintained for the following reasons: to have flexibility for its development, to maintain a favourable credit rating and to maintain the confidence of depositors and financial markets.
With respect to regulatory capital, the capital adequacy and composition of Desjardins Group as a whole are evaluated using the guideline on adequacy of capital base standards issued by the AMF. The AMF requires that a minimum amount of capital be maintained on a combined basis by all the components, mainly the caisses, the Federation (non-consolidated), Caisse centrale Desjardins, Fonds de sécurité Desjardins, Capital Desjardins inc., Western Financial Group Inc., Desjardins Securities Inc. and Desjardins Trust Inc. This capital takes into consideration investments made in other Desjardins Group components.
Capital management is the responsibility of Desjardins Group’s Board of Directors. To support it with this task, it has mandated the Finance and Risk Management Committee and the Asset/Liability Committee to ensure that Desjardins Group has a sufficient and reliable capital base. Therefore, every year, the Finance Executive Division and Office of the CFO of Desjardins Group prepares, with the help of its components, a capitalization plan that is combined with the integrated capital management framework and allows to set and update capital objectives and targets for all of the components.
Desjardins Group’s capital ratios are calculated according to the guideline on adequacy of capital base standards applicable to financial services cooperatives, issued by the AMF. This regulatory framework is largely based on the revised framework for international convergence of capital measurement and capital standards (Basel II) issued by the Bank for International Settlements (BIS). In that regard, the AMF allowed Desjardins Group to use the Advanced Internal Ratings-Based approach for credit risk related to retail loan portfolios (individuals). Other credit exposures and market risk are assessed according to the Standardized Approach, while operational risk is calculated based on the Basic Indicator Approach. The AMF’s minimum requirement has been set at a total capital ratio of 11.5%. The new methods have mainly affected the calculation of risk-weighted assets. The calculation of capital, however, has not been significantly changed.
The regulatory capital of Desjardins Group, which constitutes capital, differs from the equity disclosed in the Combined Balance Sheets. It comprises two classes: Tier 1 capital and Tier 2 capital.
Tier 1 capital includes more permanent capital items than Tier 2 capital. It consists of eligible capital shares, reserves, undistributed surplus earnings and non-controlling interests. Goodwill is deducted from that total. Tier 2 capital consists of subordinated bonds, eligible preferred and qualifying shares and the eligible portion of the collective allowance for credit losses. As prescribed by the current AMF guidelines, investments in insurance companies and affiliated companies as well as unrated securitization exposures are not combined for purposes of computing risk assets but are deducted from Tier 2 capital up to the amount of Tier 2 capital. Any excess is deducted from Tier 1 capital.
In terms of developing the Integrated Capital Management Framework, the financial goal for Desjardins Group’s Tier 1 capital ratio was maintained at a minimum of 15% under Basel II (the same level as for the total capital ratio), considering the global economic context, the new regulatory requirements announced by the BIS with respect to Basel III (in effect as of January 1, 2013) and the implementation of the IFRS as a new accounting framework. In that respect, as at January 1, 2011—the date of conversion to IFRS—Desjardins Group elected to use the transitional provisions of the Notice issued by the AMF. This election is irrevocable and helps mitigate the impact of the new standards through a quarterly adjustment of Desjardins Group’s undistributed surplus earnings over a two-year period ending December 31, 2012. Accordingly, for purposes of calculating the Tier I capital ratio, Desjardins Group has amortized the eligible portion of the IFRS impact of $1,157 million on a straight-line basis between January 1, 2011, and December 31, 2012.
Since the implementation of Basel II, Desjardins Group has applied the deferred treatment prescribed by the AMF, under which equity related to investments in its insurance subsidiaries made before January 1, 2007, is fully deducted from Tier 2 capital, until fiscal 2012. Effective 2012, this equity is deducted in equal shares of 50% from Tier 1 capital and Tier 2 capital. The end of the application of this deferred treatment had an impact on Tier 1 capital ratio.
In addition to minimum Tier 1 and total capital ratios, the AMF requires that Desjardins Group maintains an assets-to-regulatory capital ratio of less than 20. This ratio determines the overall regulatory capital adequacy with respect to total assets of the entity, including certain off-balance sheet items.

1772012 DESJARDINS GROUP ANNUAL REPORT – NOTES TO THE COMBINED FINANCIAL STATEMENTS
NOTE 31
CAPITAL MANAGEMENT (CONTINUED)The following table presents the composition of Desjardins Group’s regulatory capital.(in millions of Canadian dollars)
As at December 31,
2012
As at December 31,
2011
Tier 1 capital Eligible capital shares $ 3,294 $ 2,186 Reserves 10,216 9,032 Undistributed surplus earnings 1,282 1,236 Deferral attributable to IFRS adoption — 578 Non-controlling interests 60 60 Goodwill (341) (336) Other deductions(1) (1,586) (423)
Total Tier 1 capital 12,925 12,333
Tier 2 capital Subordinated bonds 3,092 3,363 Eligible collective allowance 261 256 Other eligible securities 112 110 Non-controlling interests 15 68 Other deductions(1) (1,578) (2,379)
Total Tier 2 capital 1,902 1,418
Total regulatory capital $ 14,827 $ 13,751
(1) Includes the provision deficit related to the Internal Ratings-Based approach, unrated securitization exposures and investments in components that are deconsolidated for regulatory capital purposes (mainly from Desjardins Financial Security Life Assurance Company and Desjardins General Insurance Group Inc., net of the unamortized balance of the impact of IFRS adoption on these investments) and in associates.
Desjardins Group’s regulatory capital amounted to $14,827 million at the reporting date, up $1,076 million from December 31, 2011. This increase is mainly explained by the surplus earnings for the year of $1,312 million, based on the scope of application of the guideline on adequacy of capital base standards, and the issue of subordinated bonds of $1,025 million, offset by the unamortized impact of IFRS adoption of $578 million and the redemption of $300 million of subordinated bonds and the $263 million increase in deductions related to investments in the insurance subsidiaries.
On May 1, 2012, the Federation obtained venture reporting issuer status from the AMF. Also, on June 18, 2012, the Federation launched a capital share issuance of up to $1.2 billion. These capital shares, currently included in Tier 1 capital under Basel II, meet the upcoming capital regulatory requirements (Basel III) as Tier 1a capital. As described in Note 19, “Capital stock”, an amount of $1,025 million had been issued as at December 31, 2012.
During the second quarter of 2012, Desjardins Group also called all of its outstanding Senior Series C subordinated bonds in the amount of $300 million. These subordinated bonds are included in Desjardins Group’s Tier 2 capital.
The capital adequacy of Quebec caisses and Caisse centrale Desjardins is governed by standards established by the Federation. The standards draw on those of the AMF and address capital base adequacy, items comprising capital base and proportions between those items.
Desjardins Financial Security Life Assurance Company is also governed by the AMF under its provincial charter. It must also comply with the standards set by the regulatory authorities of the other provinces and territories in which it operates. In Quebec, insurance companies must comply with the capital adequacy requirements of the AMF in order to support their solvency.
Desjardins General Insurance Group Inc. is subject to the following regulatory requirements: to support their solvency, property and casualty insurance subsidiaries in Quebec must comply with the AMF’s capital adequacy requirements through the Minimum Capital Test (MCT), while subsidiaries outside Quebec must comply with the MCT requirements issued by OSFI.
The life and health insurance subsidiary of Western Financial Group Inc. is governed by OSFI under its federal charter and must comply with the Minimum Continuing Capital and Surplus Requirements. The property and casualty insurance subsidiary of Western Financial Group Inc. is also governed by OSFI and must comply with MCT requirements. The banking subsidiary of Western Financial Group Inc. is subject to OSFI’s Guideline A-1 on capital adequacy requirements.
The capital adequacy of the Fédération des caisses populaires de l’Ontario and associated caisses is governed by a regulation and guidelines issued by the Financial Services Commission of Ontario and the Deposit Insurance Corporation of Ontario. Overall, although they present certain differences, these guidelines are similar to those issued by the AMF. Desjardins Trust Inc., which is under federal jurisdiction, is governed by OSFI under a regulatory system which is, for all practical purposes, identical to the guidelines issued by the AMF.
Finally, Desjardins Securities Inc. is regulated by the Investment Industry Regulatory Organization of Canada (IIROC). This subsidiary must have a risk-adjusted capital of more than 0 at all times, as calculated in accordance with IIROC by-laws.
Desjardins Group, including all its components subject to regulatory requirements with respect to minimum capital, are in compliance with said requirements as at December 31, 2012, as they were in 2011.

178 2012 DESJARDINS GROUP ANNUAL REPORT – NOTES TO THE COMBINED FINANCIAL STATEMENTS
NOTE 32
SEGMENTED INFORMATIONDesjardins Group is made up of the three following segments: Personal Services and Business and Institutional Services; Wealth Management and Life and Health Insurance; and Property and Casualty Insurance. These business segments have been structured according to the needs of members and clients and the markets in which Desjardins Group operates, and they reflect Desjardins Group’s internal management method. Financial information related to activities that are not specific to a business segment is presented under the Other category.
The Personal Services and Business and Institutional Services business segment offers Desjardins Group’s members and clients a broad range of regular financial products and services that are distributed through the caisse network, and also through business centres and the major accounts team. This segment also offers its products and services through complementary distribution networks and mortgage representatives, by telephone, on the Internet and through mobile applications and through ATMs.
The Wealth Management and Life and Health Insurance business segment offers Desjardins Group’s members and clients a range of products and services adapted to the changing wealth management and financial security needs of individuals, groups and businesses. These products and services are distributed through the caisse network and complementary distribution networks, by telephone, on the Internet and through mobile applications.
The Property and Casualty Insurance business segment offers insurance products allowing Desjardins Group’s members and clients to protect themselves against disasters. It includes the operations of Desjardins Group General Insurance Inc. as well as those of Western Financial Group Inc. since its acquisition by Desjardins Group in 2011. In addition to being offered through the caisse network, the products of this segment are distributed by many client care centres and business centres, through a network of brokers and a network of exclusive agents in the field, and on the Internet and through mobile applications.
The Other category includes financial information that is not specific to a business segment. It primarily includes treasury activities related to Caisse centrale Desjardins’s operations and financial intermediation between the liquidity excesses or needs of the caisses. This category also includes the results of the support functions provided by the Federation to Desjardins Group as a whole, the operations of Capital Desjardins inc. and Fonds de sécurité Desjardins as well the operating results related to ABTN securities held by Desjardins Group. It also includes Desjardins Technology Group Inc., which combines all of Desjardins Group’s IT-related activities. In addition to the various adjustments necessary to prepare combined financial statements, the intersegment balance eliminations are classified in this category.
Intersegment transactions are recognized at the exchange amount, which represents the amount agreed to by the various legal entities and business units. The terms and conditions of these transactions are comparable to those offered in financial markets. The results of the main segments reflect data collected by internal financial reporting systems and are consistent with the policies used in preparing Desjardins Group’s Combined Financial Statements.

1792012 DESJARDINS GROUP ANNUAL REPORT – NOTES TO THE COMBINED FINANCIAL STATEMENTS
NOTE 32
SEGMENTED INFORMATION (CONTINUED)RESULTS BY BUSINESS SEGMENTThe following tables provide a summary of Desjardins Group’s financial results by business segment for the years ended December 31.
2012Personal
Services and Business and Institutional
Services
Wealth Management
and Life and Health Insurance
Property and Casualty
Insurance Other Combined
Net interest income $ 3,690 $ 3 $ 11 $ 144 $ 3,848Net premiums — 3,366 1,982 (222) 5,126Other income 1,734 1,614 275 (119) 3,504
Total income 5,424 4,983 2,268 (197) 12,478
Provision for credit losses 241 — — — 241Claims, benefits, annuities and changes in insurance and investment contract liabilities — 3,065 1,343 (11) 4,397Non-interest expense 3,990 1,615 661 (506) 5,760
Operating surplus earnings 1,193 303 264 320 2,080Income taxes on surplus earnings 304 62 59 64 489
Surplus earnings before member dividends(1) 889 241 205 256 1,591
Provision for member dividends, net of income tax recovery 206 — — — 206
Net surplus earnings for the year after member dividends $ 683 $ 241 $ 205 $ 256 $ 1,385
of which: Group’s share $ 682 $ 192 $ 184 $ 252 $ 1,310 Non-controlling interests’ share 1 49 21 4 75
(1) As at December 31, 2012, the Group’s share of “Surplus earnings before member dividends” was $888 million for the Personal Services and Business and Institutional Services segment, $192 million for the Wealth Management and Life and Health Insurance segment, $184 million for the Property and Casualty Insurance segment and $252 million for the Other category.
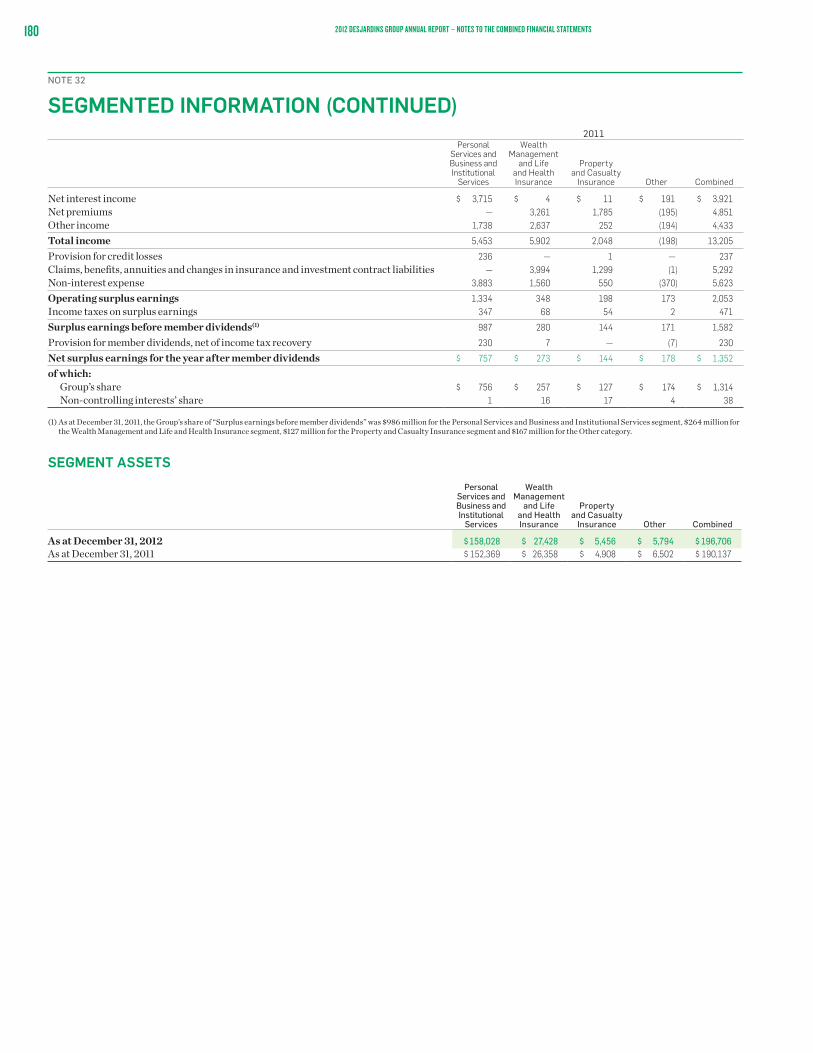
180 2012 DESJARDINS GROUP ANNUAL REPORT – NOTES TO THE COMBINED FINANCIAL STATEMENTS
NOTE 32
SEGMENTED INFORMATION (CONTINUED)2011
Personal Services and Business and Institutional
Services
Wealth Management
and Life and Health Insurance
Property and Casualty
Insurance Other Combined
Net interest income $ 3,715 $ 4 $ 11 $ 191 $ 3,921Net premiums — 3,261 1,785 (195) 4,851Other income 1,738 2,637 252 (194) 4,433
Total income 5,453 5,902 2,048 (198) 13,205
Provision for credit losses 236 — 1 — 237Claims, benefits, annuities and changes in insurance and investment contract liabilities — 3,994 1,299 (1) 5,292Non-interest expense 3,883 1,560 550 (370) 5,623
Operating surplus earnings 1,334 348 198 173 2,053Income taxes on surplus earnings 347 68 54 2 471
Surplus earnings before member dividends(1) 987 280 144 171 1,582
Provision for member dividends, net of income tax recovery 230 7 — (7) 230
Net surplus earnings for the year after member dividends $ 757 $ 273 $ 144 $ 178 $ 1,352
of which: Group’s share $ 756 $ 257 $ 127 $ 174 $ 1,314 Non-controlling interests’ share 1 16 17 4 38
(1) As at December 31, 2011, the Group’s share of “Surplus earnings before member dividends” was $986 million for the Personal Services and Business and Institutional Services segment, $264 million for the Wealth Management and Life and Health Insurance segment, $127 million for the Property and Casualty Insurance segment and $167 million for the Other category.
SEGMENT ASSETS
Personal Services and Business and Institutional
Services
Wealth Management
and Life and Health Insurance
Property and Casualty
Insurance Other Combined
As at December 31, 2012 $ 158,028 $ 27,428 $ 5,456 $ 5,794 $ 196,706As at December 31, 2011 $ 152,369 $ 26,358 $ 4,908 $ 6,502 $ 190,137

1812012 DESJARDINS GROUP ANNUAL REPORT – NOTES TO THE COMBINED FINANCIAL STATEMENTS
NOTE 33
RELATED PARTY DISCLOSURESTRANSACTIONS WITH DESJARDINS GROUP’S RELATED PARTIESThe Combined Financial Statements reflect certain transactions carried out with associates, joint ventures and other related parties. All these transactions were entered into under normal market terms and conditions and were initially recognized at fair value. Since the transactions carried out and balances outstanding at the reporting date between the various companies included in the group scope of Desjardins Group are entirely eliminated in the Combined Financial Statements, only the portion that is not eliminated in consolidation is presented in the following table.
The main related party transactions are associated with fund management and custody fees and rents paid with respect to real estate. They are also associated with management income from pension plans and interest expense paid on bonds to the Desjardins Group Pension Plan. The main assets with related parties include investments in funds and amounts receivable, while the main liabilities include amounts payable.
These transactions and balances as at the reporting dates are as follows:
2012 2011
AssociatesOther related
parties (1) Total AssociatesOther related
parties (1) Total
Combined Statements of Income Brokerage, investment fund and trust services $ 1 $ 241 $ 242 $ 1 $ 240 $ 241 Other 11 19 30 4 57 61
Combined Balance Sheets Securities borrowed or purchased under reverse repurchase agreements $ — $ — $ — $ — $ 2 $ 2 Loans 30 5 35 30 — 30 Other assets 4 25 29 4 23 27 Deposits(2) — 406 406 — 338 338 Other liabilities — 40 40 1 13 14
Other Credit commitments given $ 10 $ 68 $ 78 $ 9 $ 21 $ 30 Guarantees given — — — — 129 129
(1) Other related parties include the benefit plans for Desjardins Group’s employees (see Note 26, “Defined benefit plans”), Desjardins Funds, Fonds privés GPD, Fondation Desjardins, Développement international Desjardins and Capital régional et coopératif Desjardins. Desjardins Group’s funded pension plans are administered by a pension committee which represents the employers and employees of Desjardins Group.
(2) For 2012, deposits carried interest at rates ranging from 1.00% to 3.50%. An amount of $89 million was payable on demand, an amount of $302 million was payable in January 2013 and the balance is payable at various dates through 2017. For 2011, deposits carried interest at rates ranging from 1.00% to 3.75%. An amount of $14 million was payable on demand, an amount of $286 million was payable in January 2012 and the balance is payable at various dates through 2017.
KEY MANAGEMENT PERSONNEL COMPENSATIONKey management personnel of Desjardins Group comprise the members of the Board of Directors and the members of the Management Committee of Desjardins Group. These individuals have the authority and responsibility for planning, directing and controlling the activities of Desjardins Group. In the normal course of operations, Desjardins Group carries out financial transactions with its management personnel. In addition to the compensation paid to Desjardins Group’s key management personnel, the main financial transactions also include routine financial intermediation transactions as well as wealth management, life and health insurance, and property and casualty insurance transactions with the various Desjardins Group entities. These transactions were entered into under terms and conditions equivalent to those of arm’s length transactions and were initially recognized at fair value.
For the years ended December 31, the compensation of Desjardins Group’s key management personnel was as follows:
2012 2011
Short-term benefits $ 16 $ 15Post-employment benefits 5 4Other long-term benefits 5 6
$ 26 $ 25

182 2012 DESJARDINS GROUP ANNUAL REPORT – NOTES TO THE COMBINED FINANCIAL STATEMENTS
NOTE 34
SUBSEQUENT EVENTOn February 4, 2013, Desjardins Group entered into a final agreement, through Desjardins Financial Corporation Inc., a wholly owned subsidiary of the Federation, to purchase between 25% and 40% of the outstanding shares of Qtrade Canada Inc. (Qtrade), a company specializing in online brokerage and wealth management services, primarily for credit unions.
This transaction qualifies as a business combination since Desjardins Group will take control of Qtrade’s operations, and it will be accounted for using the acquisition method. The allocation of the purchase price between the assets acquired and liabilities assumed will be performed on the transaction’s closing date, which is scheduled for the second quarter of 2013. Qtrade’s results will be included in the Federation’s Consolidated Financial Statements from the transaction’s closing date.

1832012 DESJARDINS GROUP ANNUAL REPORT – CORPORATE GOVERNANCE
As a cooperative financial group, Desjardins Group is motivated to deliver strong financial results in order to continue the economic and social mission we gave ourselves more than 112 years ago. In addition to that mission—whose ultimate goal is to meet the needs of our members and clients and support sustainable prosperity in their communities—Desjardins Group also places a high value on education and democratic participation. We have more than 5,600 officers who devote their time, energy and creativity to improving and extending the reach of their caisses and of Desjardins in their communities. And after the success of the 2012 International Year of Cooperatives, we are now, more than ever, committed to growing the cooperative model, with the support of our members, elected officers, employees and managers, who are all stakeholders in our governance.
At Desjardins, our governance is an important part of how we carry out our mission, to ensure we operate in compliance with regulatory requirements and our own social responsibility objectives. We take a continuous improvement approach to our governance program and work to ensure it remains consistent with our cooperative nature.
There have recently been some major developments in our governance. A committee was formed, independent of the Board of Directors, composed of elected officers representing all the regions in Quebec, as well as Ontario. In 2012, this committee submitted its final recommendations on the updating of Desjardins Group’s cooperative governance practices. This process will have a considerable impact, not only on our officers but on Desjardins Group as a whole. Namely, it will:
• RenewandstrengthenthefoundationsofDesjardins Group’s democratic and participative activities
• Promoteandexpandtheroleofourofficersas central players in our democratic and participative processes, thereby increasing their contributions and broadening their influence
• PromoteDesjardins-widefocusandactionto establish collective accountability for Desjardins’s overall performance as a cooperative group
The decisions resulting from these recommendations willbeoverseenbytheOfficerLeadershipProject,which was approved by the Board of Directors. The project team has identified a number of areas for improvement and has begun implementing initiatives, some of which will require amendments to our by-laws.TheFédération des caisses Desjardins du Québec (the Federation) has scheduled a Special General Meeting for a vote to be held on these amendments, and a Congress of Elected Officers is also planned where fundamental governance issues will be put to a vote—what better examples of the highly democratic nature of our cooperative group.
GOVERNANCE THAT BENEFITS OUR MEMBERS

184 2012 DESJARDINS GROUP ANNUAL REPORT – CORPORATE GOVERNANCE
HIGHLIGHTSThe following additional governance-related issues were addressed by Desjardins Group’s decision-making bodies in 2012:
The committee responsible for the election of the Desjardins Group president issued its report on the 2012 election.
The Board of Directors held a symposium to define Desjardins Group’s strategic goals and to discuss the key priorities for the 2013–2016 Strategic Plan, which was adopted in January 2013.
In developing the strategic plan, a special effort was made to consult the regions and to ensure the involvement of the chairs of the boards of directors and boards of supervision, caisse general managers, and business centre managers.
The priorities and strategies of all the support functions were reviewed to ensure consistency with the business sectors’ strategies and Desjardins Group’s strategic priorities.
A new Desjardins Group code of ethics was adopted and will be introduced in the first half of 2013.
The members of the Board of Directors agreed to introduce peer evaluations as a way to improve their self-assessment program and ensure effective and responsible governance.
The Board of Directors formally defined the duties of the Vice-Chair of the Board, which now include the responsibilities of lead director, in consideration of the mechanisms in place to ensure the Board remains independent from management.
A new governance mechanism for determining compensation of Desjardins Group staff, including executives, was approved and will be introduced following the Federation’s Annual General Meeting in the spring of 2013, at which time delegates will hold an advisory vote on the issue.
Satisfaction survey programs for individual and business members will be continued. Officer engagement, which is also a concern, will also continue to be measured.
Work was continued on the 2015 Vision of the Caisse Network program, whose goal is to define a comprehensive vision for the caisse network. The directions that will guide the updating of our caisse governance frameworks were successfully revised.
The GM Leadership working group was tasked with defining how the role of Desjardins caisse general managers will change in the medium and long term, in response to issues in the caisse network and across Desjardins Group and in consideration of the essential role general managers play in providing support to elected officers on governance matters.
The mandate and membership of the Desjardins Group Investment Commission were reviewed. The commission will now play a monitoring and supervisory role over the portfolios and will coordinate and follow up on strategies and directions.
A comprehensive recognition program was adopted, the goal of which is to encourage recognition of human capital at Desjardins and to maintain close relationships between Desjardins and the people who contribute to its governance and management.
The Board of Directors approved the development of an internal arbitration and mediation program for the caisse network and the subsidiaries.
Guidelines on membership of the subsidiaries’ boards of directors were reviewed, in order to better meet the subsidiaries’ specific needs and to ensure that the people appointed as directors match the target profiles.
Guidelines were adopted on compensation for elected officers and directors of the subsidiaries. Updates to compensation rules will follow in 2013.
In early 2012, changes were made to the responsibilities of the Senior Executive Vice-President, Desjardins Group and the Federation. On the recommendation of the Desjardins Group President and CEO, the Board changed the title to Senior Executive Vice-President of Desjardins Group and General Manager of the Federation, to clarify and further define the role and responsibilities of the position with regard to the strategic operations and development activities of both the Federation and Desjardins Group. The change also reinforces the independence of the Board of Directors, as it ensures the individual holding the position of Chair of the Board, President and CEO is removed from the day-to-day management of Desjardins Group’s activities.
1852012 DESJARDINS GROUP ANNUAL REPORT – CORPORATE GOVERNANCE
Desjardins Group has a set of standards and policies in place to ensure sound and prudent management of the organization. In 2012, the following polices and policy statements were adopted or revised:
Desjardins Group Development Fund policy, under which approved projects will be required to reflect Desjardins Group’s principles of intercooperation and organization-wide focus
Desjardins Group policy on financial commitments
Desjardins Group policy on risk appetite and tolerance
Desjardins Group policy on compliance
Desjardins Group policy on liquidity risk management
Desjardins Group policy on securitization and covered bonds
Desjardins Group policy on counterparty and issuer risk
Policy on management of confidential information
Policy on social media use recommended to the caisses
Policy on recognition of Desjardins Group’s human capital
Policy on the appointment of Desjardins Group officers, executives and employees to positions with external organizations
Standard for the departure of caisse general managers and business centre managers
Charter of the Audit and Inspection Commission
Other governance development initiatives undertaken by Desjardins Group in 2012 are outlined in the following pages.
GOVERNANCE PROGRAMThe purpose of Desjardins Group’s corporate governance is to ensure the organization is able to carry out its mission, which is to improve the economicandsocialwell-beingofpeopleandcommunities.
The Fédération des caisses Desjardins du Québec (the Federation) oversees the development and application ofaDesjardins-widegovernanceprogramthattakesinto account the organization’s cooperative model, the complexity of its activities, and the guidelines set by the Autorité des marchés financiers (AMF) in Quebec. This program also covers the activities of the Federation, Caisse centrale Desjardins, the Fonds de sécurité Desjardins, the Fédération des caisses populaires de l’Ontario Inc., the Desjardins subsidiaries and the caisses. As certain subsidiaries are subject to specific regulations, the program draws predominantly on rules established by the Canadian Securities Administrators (CSA) and the Office of the Superintendent of Financial Institutions Canada, as well as on industry best practices.
MANDATE OF THE BOARD OF DIRECTORS
1. ADMINISTRATION OF THE FEDERATION
The Board of Directors assumes explicit responsibility for the sound and prudent administration of the Federation. It ensures that the tools and structures the Federation needs to play its full part within the organization are in place. It regularly reviews its operations, under a continuous improvement approach, and safeguards the assets of Desjardins Group.
The Board fulfils a dual role since its responsibilities apply both to the Federation as a business and to Desjardins Group as a cooperative financial group. The Federation is the organization that guides, plans, coordinates, monitors and controls all Desjardins Group operations. Its organizational structure, which is built around the business sectors and support functions, strengthens its ability to deliver on that role by bringing the Federation and the subsidiaries closer to the caisses and their members. The structure serves to optimize overall performance, streamline the organization and improve financial and risk management.
In accordance with the Act respecting financial services cooperatives, the Board exercises all the powers and undertakes all the duties of the Federation, except for those which it occasionally delegates to its commissions and committees. The Board’s responsibilities include the following:

186 2012 DESJARDINS GROUP ANNUAL REPORT – CORPORATE GOVERNANCE
a. Culture of integrity
The Board of Directors is responsible for preserving the cooperative nature of Desjardins, which is defined by the cooperative values and principles established bytheInternationalCo-operativeAlliance,andforpromoting its own values: money at the service of human development, democratic action, personal commitment, integrity and rigour in the cooperative enterprise, and solidarity with the community. The Board is also responsible for enforcing Desjardins Group’s rules of professional conduct among management, employees and elected officers and for raising their awareness about the organization’s values.
TheFederationhasaBoardofEthicsandProfessionalConduct that, like the Board of Directors, reports to the Federation’s general meeting. A similar relationship exists in the Desjardins caisses, where the body responsible for ethics and professional conduct is called the “board of supervision” in Quebec and the “audit committee” in Ontario. The Board ofEthicsandProfessionalConductisresponsiblefor updating the Desjardins Group Code of Ethics and Professional Conduct (the Code) and, as needed, issuing advice with regard to ethical or professional conduct and cooperation. There is a support structure inplacetoenabletheBoardofEthicsandProfessionalConduct to carry out awareness and training activities, in addition to providing advisory services. These are some of the practical measures taken by Desjardins Group to promote its values and to ensure compliance with the Code, which imposes penalties for violations. Desjardins also has a confidential mechanism for reporting violations of the Code and other regulatory frameworks.
The Code, which is available to the public on Desjardins.com as well as on the Federation’s intranet portals, requires all individuals who are active within Desjardins to demonstrate ethical conduct that reflects the principles of honesty, transparency, social responsibility and altruism. It applies to all Desjardins components and includes a section on ethics relating to Desjardins Group’s mission and values.
b. Strategic and financial planning process
The Board of Directors has an ongoing strategic and financial planning process for Desjardins Group that includes a financial plan, crisis scenarios, a funding plan and a capitalization plan. The Board is supported by the Desjardins Group Management Committee, which helps ensure that the strategic directions and plans of the caisses and the business sectors are integrated and that business development strategies are consistent throughout the organization, all while taking into account potential risks and Desjardins’s specific values. A unique trait of Desjardins Group’s strategic planning process is that it allows those responsible for the planning exercise to occasionally call on the Congress of Elected Officers to define the key directions for the plan. The Congress is an assembly of more than 1,000 local caisse delegates.
In 2012, the Board of Directors worked to finalize the2013–2016StrategicPlan,whichwasadoptedin January 2013. The process involved soliciting contributions from the caisses, Desjardins Group’s elected bodies, the business sectors and the subsidiaries. The main aspects of the strategic plan are shared with the elected officers, managers and employees to ensure everyone across the organization stays informed.
Once the strategic and financial plans are adopted, each region and caisse in the cooperative network is responsible for developing its own annual business plan. The Board of Directors plays a supervisory and monitoring role in this process, for which it receives support from the Desjardins Group Management Committee. The Management Committee also produces regular reports so the Board of Directors can monitor the progress of the business plans and make any necessary changes.
The respective boards of directors of Caisse centrale Desjardins, Desjardins Financial Security Life Assurance Company, Desjardins General Insurance Group Inc., Desjardins Securities Inc., and Desjardins Trust Inc. each adopt a strategic and financial plan specific to their own sector, which ties in with the overall Desjardins Group plan.
c. Identification and management of main risks
The Board is responsible for identifying the main risks for the Federation and Desjardins Group, setting the risk tolerance thresholds and ensuring that management sets up the required systems for the integrated management of these risks. The Federation is supported in these efforts by Desjardins Group’sRiskManagementExecutiveDivision.TheFederation’sBoardofDirectors,backedbytheRiskManagement Commission, works in concert with the Audit and Inspection Commission, which is responsible for risks related to the financial disclosure process. The same applies to Caisse centrale Desjardins and Desjardins Trust Inc. The Desjardins Group Management Committee also supports the Board of Directorsincarryingoutthisresponsibility.TheRiskManagementCommissionholdsclosed-doormeetingswhich are not attended by management. The Board can also count on the contribution of the Finance andRiskManagementCommittee,whichmainlycomprises managers from finance, risk management and compliance, as well as the business sectors.
On the compliance front, a number of procedures have been introduced in recent years to ensure Desjardins Group’s operations are fully compliant with all applicable laws, regulations and industry standards. For the first time, in February 2013, the Boardheldaclosed-doormeetingwithDesjardins Group’s Chief Compliance Officer for comments on the 2012 annual compliance report. Moving forward, this procedure will be followed every year.
A detailed presentation of the management principles applied throughout Desjardins Group can be found in theRiskManagementsectiononpage64.

1872012 DESJARDINS GROUP ANNUAL REPORT – CORPORATE GOVERNANCE
d. Succession planning
The Board of Directors oversees the Desjardins Group ManagementSuccessionandDevelopmentProgramandissupportedinthistaskbytheHumanResourcesCommission(HRC)andDesjardinsGroup’sPeopleandCultureExecutiveDivision.TheHRCoverseesthe program and reports to the Board of Directors, making recommendations if need be. Through the program, the Desjardins Group Management Committee identifies potential successors for key roles and guides their development in line with the organization’s business needs, thereby mitigating Desjardins’s vulnerability to potential risks.
President and Chief Executive Officer
In accordance with Desjardins Group’s cooperative nature,thePresidentandCEOischosenbya255-personelectoralcollegemadeupofrepresentatives from Quebec and Ontario caisses (the members of the councils of representatives), plus thecurrentPresidentandCEOofDesjardinsGroup.Although the Board of Directors does not appoint the incumbent, it oversees the succession process, in particular by determining the main parameters forthemandateoftheDesjardinsGroupPresident, whoservesafour-yearterm.
The electoral process is governed by a Federation by-lawandtheDesjardins Group Code of Ethics and Professional Conduct, and it is overseen by an election committee made up of elected officers, independent from the Board of Directors, whose overall responsibility is to establish the rules of the electoral process and the rules of conduct to which the electoral college, candidates, employees and elected officers must adhere. At the end of the 2012 electoral process, which began in March 2011, the current president was re-elected.Thiswillbehersecondandfinalfour-yearterm,asthereisatwo-termlimitfortheposition.Theelection committee submitted its report on the 2012 election to the Federation Board of Directors.
Senior Executive Vice-President of Desjardins Group and General Manager of the Federation
To reinforce the organization’s independence mechanisms, maintain its stability and ensure effective succession planning, the Senior Executive Vice-PresidentofDesjardinsGroupandGeneralManager of the Federation is appointed by the Board of Directors. The Board also adopts organizational practices for Desjardins Group’s strategic management and the associated macrostructure.
e. Integrity of internal control management reporting systems
The Board of Directors, with the support of its Audit and Inspection Commission, ensures the implementation of effective accounting, administrative and management control systems to safeguard the integrity of its operations and obtain the required reporting information from management. The Board receives support for this responsibility by the Chief Monitoring Officer of Desjardins Group, whose annual work plan is approved by the Audit and Inspection Commission. A rigorous financial governance process is maintained throughout Desjardins Group to ensure adequate support for the DesjardinsGroupSeniorVice-PresidentofFinanceand Chief Financial Officer, who, together with the PresidentandCEO,isresponsibleforcertifyingtheCombined Financial Statements of Desjardins Group.
Financial governance work was carried out in 2012 so that Desjardins Group’s signing officers could certify, as at December 31, 2012, the design and operating effectiveness of disclosure controls and internal controls over financial reporting, in accordance with CSARegulation52-109.
In the caisse network, work was done to update the internal controls system, making it more effective, efficient and tailored to the particular needs of the network. This system is also designed to provide decision-makingbodieswithreasonableassurancethatthe network is achieving its business objectives, while ensuring compliance with regulatory requirements.
The Board also ensures that the Desjardins Group Management Committee provides the Board and its commissions and committees with information that is reliable, timely and adapted to the particular needs of its directors so that they are able to take advantage of business opportunities and evaluate potential risks. Board members are invited to periodically assess the quality of the documents that support the decision-makingprocess.
Management information is made available to members of management so they can effectively monitor key performance indicators; this benefits the Board as it allows directors to quickly obtain strategicinformationpertinenttothedecision-makingprocess. Improvements are made to management information systems on an ongoing basis.
Board members receive financial and operating reports at least quarterly so they can assess Desjardins Group’s situation and the status of the Federation’s projects. The Board ensures that appropriate policies and procedures are in place to facilitate the production and presentation of this information.

188 2012 DESJARDINS GROUP ANNUAL REPORT – CORPORATE GOVERNANCE
To effectively carry out its duties, the Federation’s Boardmeetsregularlyonapre-establishedschedule.Board members receive the meeting agenda in advance, along with any relevant documentation, to ensure productive discussions and to facilitate thedecision-makingprocess.TheBoardconstantlyseeks to increase its efficiency and focus its efforts on strategic issues, for example by delegating certain operational responsibilities to the Desjardins Group Management Committee.
Directors have electronic access to meeting documentation and to the management frameworks for Desjardins Group’s operations. Directors also haveaccesstoanintranetportalthatispurpose-builtfor them.
f. Communications strategies
The Board of Directors adopts a communications policy and strategic communications directions for Desjardins Group, in line with the Communications MasterPlan,thatspecifyactionstobetakenandresults to be measured. The Federation also draws up internal and external communications plans in order to better manage its relations with the caisses and their members; the business sectors and their clients;itsemployees;social,communityandnon-governmental organizations; opinion makers; the public; the media; rating agencies; and government agencies.
The Federation oversees the financial reporting process and the disclosure of any major changes that may affect Desjardins Group’s financial position. The Federation uses a variety of mechanisms to communicate effectively with its many stakeholders.
These mechanisms include: the Communications Corporate Division, the Ombudsman, the Cooperative Support Division and Secretariat General’s ethics and professional conduct support team, the caisse complaint-handlingprocedure(Your Satisfaction Is My Priority); and, within Desjardins Group: the annual general meetings, the release of Desjardins Group’s quarterly financial results, Desjardins publications (including its annual reports, its social and cooperative responsibility reports, the Desjardins, Desjardins and Me, Espace D, Entreprises and Partenaires magazines, and employee newsletters), its toll-freetelephonenumber,intranetportals,includingone designed especially for caisse officers, its website (whichincludesa“MemberRelations”section),theFederation’s Member Services Committee, and the procedure for reporting violations of the Desjardins Group Code of Ethics and Professional Conduct and other regulatory frameworks.
In addition, the Federation handles relations with international rating and scoring agencies and coordinates Desjardins Group’s relationships with all levels of government, in compliance with lobbying legislation.
2. MEMBERSHIP OF THE BOARD OF DIRECTORS
The Federation’s Board of Directors is made up of 22 directors, the majority of whom are independent.
Thevice-presidentsoftheOutaouais,Abitibi-Témiscamingue and Nord du Québec Council ofRepresentativesandtheBas-Saint-LaurentandGaspésie–Îles-de-la-MadeleineCouncilofRepresentativesalsoserveontheBoardas managing directors.
Additionally, four management members support the Board by attending its meetings: the Senior Executive Vice-PresidentofDesjardinsGroupandGeneralManageroftheFederation;theSeniorVice-Presidentof Finance and Chief Financial Officer; the Desjardins GroupExecutiveVice-PresidentofCooperativeDevelopment and Democratic Governance Support; and the Desjardins Group Secretary General.
3. INDEPENDENT AND NON-INDEPENDENT MEMBERS
Therearefivenon-independentmembersoftheBoardofDirectors:thePresidentandChiefExecutiveOfficer of Desjardins Group, plus four caisse general managers. The first is not independent because he or she is a member of Federation management, and the other four are not independent because they are employees of cooperatives belonging to Desjardins Group (the caisses). None of these directors has any business or personal relationships with members of the Desjardins Group Management Committee; or any interests which, in the opinion of the Board, could significantly interfere with their ability to act in the best interests of the Federation or Desjardins Group; or any interests of any other nature which, in the opinion of the Board, could reasonably be perceived as harmful.
For guidance in these matters, the Board refers to the provisions of the Desjardins Group Code of Ethics and Professional Conduct, which governs the actions of its directors, and to the declaration of interests filed annually by each director. None of the directors sits on another board of directors for any other major company. Generally speaking, they may hold one or twootherdirectorshipswithnon-profitorganizations.
The list of directors and their status (independent or non-independent)canbefoundonpage200.

1892012 DESJARDINS GROUP ANNUAL REPORT – CORPORATE GOVERNANCE
4. NOMINATION PROCESS
Taking into account the cooperative structure of Desjardins Group and its adherence to the principle of delegation, 17 of the 22 members of the Federation’s Board of Directors are directly elected by the delegates of the Federation’s member caisses at regional and group caisse meetings. These elected individuals also act as presidents of the councils of representatives.(1)
Delegates are therefore responsible for selecting the most qualified individuals from among the interested candidates, keeping in mind that they will play a dual role: to serve as a director of the Federation and Desjardins Group as a whole, and to represent their region or group caisse. Before nominations are accepted, candidates are reminded of the responsibilities and requirements of the position of president of a council of representatives. Because the presidents are, at the same time, caisse officers, members of their councils of representatives, and members of the Federation’s Board of Directors, the Board benefits from having directors who have comprehensive knowledge of Desjardins Group’s activities and yet who remain independent ofmanagement.Thisin-depthknowledgeoftheorganization’s activities is one of the considerable advantages of Desjardins Group’s democratic structure.
The presidents of the councils of representatives are also responsible for ensuring, firstly, that their caisses have a full understanding of the strategic directions established by the Board of Directors, and secondly, that the Board takes into consideration the concerns of the caisses. The presidents play an important leadership role in helping to achieve regional objectives and in promoting intercooperation.
Four of the remaining positions on the Board of Directors are filled by caisse general managers, who are chosen at an election held at an Assembly of RepresentativesoftheFederation.ThefinalpositionisreservedforthePresidentandChiefExecutiveOfficer of Desjardins Group. The presence of four caisse general managers ensures that the directions adopted by the Board accurately reflect the realities of the caisses.
The methods for selecting the members of the Federation’sBoardofDirectorsanditsPresidentand CEO are designed so that each position is subject to a separate electoral process and a separate electoral college. This approach reinforces the independence of Board members from management.
Furthermore, the rules governing Board membership are designed to ensure stability and continuity in Desjardins Group’s corporate governance. Board membershavethree-yearrenewableterms,andeachyearone-thirdoftheBoardmembersareoutgoing.These terms give directors enough time to develop their knowledge of Board issues and to actively participate in activities. Membership turnover occurs naturally, at a pace that doesn’t impact the Board’s overall performance.
The Board’s composition is designed to ensure fair geographic representation, with members from all across Quebec, from the group caisses and from the Ontario caisses populaires. Its membership also has a good balance of skills and experience; current members include chartered accountants, legal professionals, managers, professional mediators, management professors in universities, caisse network managers, school teachers and entrepreneurs.
All caisse officers are provided with a guide that outlines all the terms, conditions and processes pertaining to the responsibilities of Federation directors and presidents of council of representatives. The purpose of the guide is to assist those interested in applying for the positions, and to provide guidance for those voting to elect the candidates.
5. PERFORMANCE REVIEWS
The Board of Directors and its commissions and committees conduct an annual review of their performance using quantifiable objectives set by the Board at the beginning of the year. Areas for improvement and areas to be monitored are identified during this review and written into an action plan, which is submitted to the Corporate Governance Commission. The Commission follows up on this report,andgivestheBoardamid-yearprogressreportandafullreportatyear-end.TheFederation’sreviewprogramalsocallsforself-assessments,followedbyindividual meetings between each director and the Chair of the Board. In 2012, the Board introduced peer evaluations to the process. Engagement and skills development are also addressed in the process. The Chair of the Board is responsible for the review process, and the entire exercise is monitored by the Corporate Governance Commission.
In 2012, the Board introduced a new practice to make the concept of cooperative difference more concrete and measurable: At the end of every meeting, it reviews all of its decisions and evaluates whether the cooperative difference was taken into consideration. The Board’s conclusions are included in its report on the achievement of its objectives.
(1) The councils of representatives are democratic bodies within the Federation. There is a council for each region, one for Ontario, and one for all of the group caisses combined. The role of the councils is: to ensure collaboration between the caisses and the Federation; to influence decisions that affect major priorities and projects by actively participating in consultations; to contribute to identifying regional issues and business development opportunities; to follow up on member satisfaction and Desjardins Group’s reputation in the regions; and to provide a corporate presence in the region. The councils of representatives are a vital part of Desjardins’s participatory governance system, due to the leadership role their members play within the caisses. They also ensure that concerns raised by the caisses in their region (or the group caisse network) are heard by the Federation.

190 2012 DESJARDINS GROUP ANNUAL REPORT – CORPORATE GOVERNANCE
6. ORIENTATION AND TRAINING PROGRAM FOR NEW DIRECTORS
The Federation organizes orientation sessions for all of its directors, provides ongoing training opportunities, and plans activities tailored to their specific needs.
All new directors attend an orientation session where they meet with members of management and receive a reference manual containing all the information they need to carry out their duties. This manual is also available to all Federation officers on their dedicatedintranetsite(theElectedOfficerPortal).Every director also receives a document reminding them of the expectations and duties that come with the position, and orientation sessions are held for new members of Board commissions and committees.
Upon request, meetings with specialists from the Federation, Caisse centrale Desjardins and Desjardins Trust Inc. are organized to help directors increase their general and specialized knowledge of the organization and of its main strategic projects.
The training program for Board members is part of the programming offered by the Desjardins Cooperative Institute (DCI). The DCI is the training institute for Desjardins Group elected officers, managers and employees.
7. SIZE OF THE BOARD
The composition of the Board of Directors is designed to ensure balanced representation of the caisses from across the 17 regions in Quebec, plus those from parts of Ontario and the group caisses. Given the size of the Board, the directors strive to take a disciplined and effective management approach to Board meetings.
Every year, the Board reviews the mandates of its commissions and committees and related processes to ensure they will effectively support the Board. The Board also regularly revises the membership rules for its commissions and committees as well as the rules for appointing chairs for the subsidiaries, commissions and committees.
The Chair of the Board also holds regular informal meetings with the directors, with the aim of making official meetings more efficient. Year after year, the results of the Board’s performance evaluation show the importance of these meetings. After each Board,committeeorcommissionmeeting,aclosed-door session is held, which members of Federation managementdonotattend,exceptforthePresidentand CEO (unless his or her recusal is necessary for independence reasons).
8. COMPENSATION POLICY FOR DIRECTORS
The Board annually reviews its policy on the compensation of its directors, members of the Board ofEthicsandProfessionalConduct,andmembersofthe councils of representatives. The Board receives recommendations from the Corporate Governance Commission, which keeps a close eye on industry developments.
While the policy’s compensation rates fall below industry norms, they are fair and take into account: the culture at Desjardins, which values personal commitment; the scope of the duties carried out on behalf of the Federation, Caisse centrale Desjardins and Desjardins Trust Inc.; and the requirements and risks inherent to those duties.
In 2012, the members of the Board of Directors adopted new guidelines for the determination of compensation for both elected officers and staff members. They also approved a new governance mechanism, to be implemented in 2013, that will allow delegates of the Federation’s annual general meeting to hold an advisory vote on the compensation guidelines for Desjardins Group staff members, including senior management. In 2012, the Board approved a minor increase in compensation rates, which had remained unchanged since January 1, 2008. ThePresidentandCEO’scompensationissubjecttothe recommendations of a special Board committee made up entirely of independent directors. The PresidentandCEOdoesnotpersonallyreceiveanycompensation for duties performed as director of any of the aforementioned subsidiaries.

1912012 DESJARDINS GROUP ANNUAL REPORT – CORPORATE GOVERNANCE
COMPENSATION SCHEDULE FOR MEMBERS OF THE BOARDS OF DIRECTORS OF THE FEDERATION, CAISSE CENTRALE DESJARDINS AND DESJARDINS TRUST INC., AND FOR MEMBERS OF THE BOARDS OF ETHICS AND PROFESSIONAL CONDUCT OF THE FEDERATION AND CAISSE CENTRALE DESJARDINS
Federation Caisse centrale Desjardins
Desjardins Trust Inc. Subsidiaries
Chair of the Board of Directors(1)
$0 (as this position is held by the President and CEO of
Desjardins Group)
$20,000 (paid to the Federation, as this position
is held by the President and CEO of Desjardins Group)
$20,000 (paid to the Federation, as this position
is held by the President and CEO of Desjardins Group)
$10,000 (paid to the Chair of the Board of Directors)
Annual stipend for the chair of a commission or committee(2) $ 6,500 $ 6,500 $ 6,500 $ 6,500
Annual stipend for a member of the Board of Directors(3,4) $ 10,667 $ 10,667 $ 10,667 $ 10,000
Annual stipend for a member of a commission or committee of the Board of Directors(5) $ 2,000 $ 2,000 $ 2,000 $ 2,000
Attendance fee for Board of Directors meetings(6) $ 1,200 (daily maximum)
$ 1,200 (daily maximum)
$ 1,200 (daily maximum)
$ 1,200 (daily maximum)
Attendance fee for commission or committee meetings(6)
$ 600 (per half-day)
$ 600 (per half-day)
$ 600 (per half-day)
$ 600 (per half-day)
Conference calls $ 200 $ 200 $ 200 $ 200
Attendance fee for members of the Board ofEthicsandProfessionalConductorthe Ethics Committee
$ 2,400 (chair) $ 1,200 (members)
$ 2,400 (chair) $ 1,200 (members)
$ 2,400 (chair) $ 1,200 (members)
$ 600 (per half-day)
Compensation for the president of a council of representatives(3) $ 15,000 N/A N/A N/A
Attendance fee for members of councils of representatives
$ 300 per meeting N/A N/A N/A
N/A: not applicable(1) For the subsidiaries, the position of Chair of the Board is held by a member of the Federation’s Board of Directors.(2) For commissions/committees that hold fewer than four meetings per year, the chair’s attendance fee is doubled in lieu of the annual stipend.(3) Federation Board members receive an annual stipend of $32,000 for their service as directors of the Federation, of Caisse centrale Desjardins and of Desjardins Trust Inc. This amount is divided equally
betweenthesethreeentities.Thestipendpaidtothetwomanagingdirectorsis$24,800,withanadditional$7,500paidforservingasvice-presidentsoftheirrespectivecouncilsofrepresentatives.(4)Forthefourcaissegeneralmanagerswhositonboardsofdirectors:Thepolicystipulatesthatitisuptotheircaisse’sboardofdirectorstodecidewhetherornottheymaykeep100%oftheircompensation.(5) The annual member stipend is paid regardless of the number of commissions or committees the member sits on for the Federation, Caisse centrale Desjardins or Desjardins Trust Inc. In other words,
a single stipend is paid for all positions held for all three entities. Commission or committee members who are not members of the Board of Directors are paid a stipend of $5,000.(6) The maximum daily attendance fee is $1,200, regardless of the number of Board, commission or committee meetings a member attends in a single day. Every effort is made to schedule multiple
meetings on the same day to keep costs to a minimum. The Federation’s Board of Directors may invite any elected caisse officer to sit on any of its committees. The Board of Directors determines the compensation to be paid based on the nature of the responsibilities entrusted to the officer and the compensation schedule.
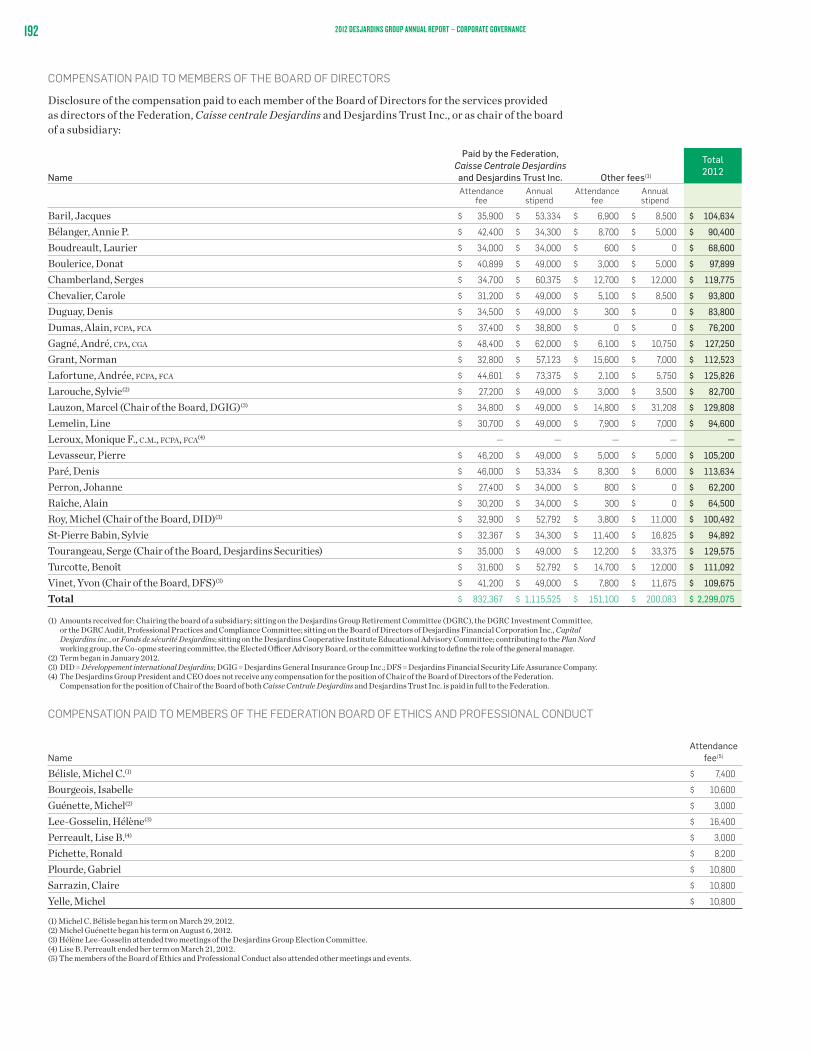
192 2012 DESJARDINS GROUP ANNUAL REPORT – CORPORATE GOVERNANCE
COMPENSATION PAID TO MEMBERS OF THE BOARD OF DIRECTORS
Disclosure of the compensation paid to each member of the Board of Directors for the services provided as directors of the Federation, Caisse centrale Desjardins and Desjardins Trust Inc., or as chair of the board of a subsidiary:
Name
Paid by the Federation, Caisse Centrale Desjardins and Desjardins Trust Inc. Other fees(1)
Total2012
Attendance fee
Annual stipend
Attendance fee
Annual stipend
Baril, Jacques $ 35,900 $ 53,334 $ 6,900 $ 8,500 $ 104,634
Bélanger,AnnieP. $ 42,400 $ 34,300 $ 8,700 $ 5,000 $ 90,400
Boudreault, Laurier $ 34,000 $ 34,000 $ 600 $ 0 $ 68,600
Boulerice, Donat $ 40,899 $ 49,000 $ 3,000 $ 5,000 $ 97,899
Chamberland, Serges $ 34,700 $ 60,375 $ 12,700 $ 12,000 $ 119,775
Chevalier, Carole $ 31,200 $ 49,000 $ 5,100 $ 8,500 $ 93,800
Duguay, Denis $ 34,500 $ 49,000 $ 300 $ 0 $ 83,800
Dumas, Alain, fcpa, fca $ 37,400 $ 38,800 $ 0 $ 0 $ 76,200
Gagné, André, cpa, cga $ 48,400 $ 62,000 $ 6,100 $ 10,750 $ 127,250
Grant, Norman $ 32,800 $ 57,123 $ 15,600 $ 7,000 $ 112,523
Lafortune, Andrée, fcpa, fca $ 44,601 $ 73,375 $ 2,100 $ 5,750 $ 125,826
Larouche, Sylvie(2) $ 27,200 $ 49,000 $ 3,000 $ 3,500 $ 82,700
Lauzon, Marcel (Chair of the Board, DGIG)(3) $ 34,800 $ 49,000 $ 14,800 $ 31,208 $ 129,808
Lemelin, Line $ 30,700 $ 49,000 $ 7,900 $ 7,000 $ 94,600
Leroux, Monique F., c.m., fcpa, fca(4) — — — — —
Levasseur,Pierre $ 46,200 $ 49,000 $ 5,000 $ 5,000 $ 105,200
Paré,Denis $ 46,000 $ 53,334 $ 8,300 $ 6,000 $ 113,634
Perron,Johanne $ 27,400 $ 34,000 $ 800 $ 0 $ 62,200
Raîche,Alain $ 30,200 $ 34,000 $ 300 $ 0 $ 64,500
Roy,Michel(ChairoftheBoard,DID)(3) $ 32,900 $ 52,792 $ 3,800 $ 11,000 $ 100,492
St-PierreBabin,Sylvie $ 32,367 $ 34,300 $ 11,400 $ 16,825 $ 94,892
Tourangeau, Serge (Chair of the Board, Desjardins Securities) $ 35,000 $ 49,000 $ 12,200 $ 33,375 $ 129,575
Turcotte,Benoît $ 31,600 $ 52,792 $ 14,700 $ 12,000 $ 111,092
Vinet, Yvon (Chair of the Board, DFS)(3) $ 41,200 $ 49,000 $ 7,800 $ 11,675 $ 109,675
Total $ 832,367 $ 1,115,525 $ 151,100 $ 200,083 $ 2,299,075
(1) Amountsreceivedfor:Chairingtheboardofasubsidiary;sittingontheDesjardinsGroupRetirementCommittee(DGRC),theDGRCInvestmentCommittee,ortheDGRCAudit,ProfessionalPracticesandComplianceCommittee;sittingontheBoardofDirectorsofDesjardinsFinancialCorporationInc.,Capital Desjardins inc., or Fonds de sécurité Desjardins; sitting on the Desjardins Cooperative Institute Educational Advisory Committee; contributing to the Plan Nord workinggroup,theCo-opmesteeringcommittee,theElectedOfficerAdvisoryBoard,orthecommitteeworkingtodefinetheroleofthegeneralmanager.
(2) Term began in January 2012.(3) DID = Développement international Desjardins; DGIG = Desjardins General Insurance Group Inc.; DFS = Desjardins Financial Security Life Assurance Company.(4)TheDesjardinsGroupPresidentandCEOdoesnotreceiveanycompensationforthepositionofChairoftheBoardofDirectorsoftheFederation.
Compensation for the position of Chair of the Board of both Caisse Centrale Desjardins and Desjardins Trust Inc. is paid in full to the Federation.
COMPENSATION PAID TO MEMBERS OF THE FEDERATION BOARD OF ETHICS AND PROFESSIONAL CONDUCT
NameAttendance
fee(5)
Bélisle, Michel C.(1) $ 7,400
Bourgeois, Isabelle $ 10,600
Guénette, Michel(2) $ 3,000
Lee-Gosselin,Hélène(3) $ 16,400
Perreault,LiseB.(4) $ 3,000
Pichette,Ronald $ 8,200
Plourde,Gabriel $ 10,800
Sarrazin, Claire $ 10,800
Yelle, Michel $ 10,800
(1)MichelC.BélislebeganhistermonMarch29,2012.(2) Michel Guénette began his term on August 6, 2012.(3)HélèneLee-GosselinattendedtwomeetingsoftheDesjardinsGroupElectionCommittee.(4)LiseB.PerreaultendedhertermonMarch21,2012.(5)ThemembersoftheBoardofEthicsandProfessionalConductalsoattendedothermeetingsandevents.

1932012 DESJARDINS GROUP ANNUAL REPORT – CORPORATE GOVERNANCE
In accordance with the Act respecting financial services cooperatives, the total budget for the payment of attendance fees to members of the Board of Directors, the councils of representatives, and theBoardofEthicsandProfessionalConductisauthorized by the Federation’s general meeting. The total compensation budget (annual stipends plus attendance fees) is reported to the general meeting. The general meeting receives a report of changes to the compensation budget from one year to the next. In 2012, the total compensation budget increased to $2,867,127 after having remained steady at $2,675,884inboth2011and2010.
9. COMMISSION AND COMMITTEE MEMBERSHIP
The Board forms committees and commissions to support and streamline its various activities (guidance, planning, monitoring and control) and it defines the mandates of these committees and commissions, which are made up entirely or almost entirely of independent members. At the end of each meeting, these commissions and committees holdclosed-doorsessionswhichmanagementmembers do not attend, except for the Chair of theBoard,PresidentandCEO(unlesshisorherrecusal is necessary for independence reasons). The membership and mandates of these commissions and committees are reviewed every year.
10. RESPONSIBILITY FOR CORPORATE GOVERNANCE
The Board of Directors mandates the Corporate Governance Commission (CGC) to administer and update the governance program to ensure it keeps pace with industry trends. The CGC reports its observations and recommendations to the Board of Directors. The CGC has no say in selecting the members of the Federation’s Board of Directors. It does, however, oversee the selection process for the directors of Desjardins Group subsidiaries. The CGC’smeetingsareclosed-doorandnotattendedby management members, except for the Chair of theBoard,PresidentandCEO(unlesshisorherrecusal is necessary for independence reasons). In 2012, the CGC’s activities helped to define a common vision for the caisse network and update the directions that will serve to enhance the caisse governance frameworks. The CGC also supported the Board in adopting guidelines on the membership of the subsidiaries’ boards of directors.
11. RESPONSIBILITIES OF THE DESJARDINS GROUP MANAGEMENT COMMITTEE
TheresponsibilitiesofthePresidentandCEOofDesjardins Group are defined in the Federation’s InternalBy-laws.TheBoardhasalsoformallydocumented the division of responsibilities between itself and the Desjardins Group Management Committee.
a. Setting annual management objectives
President and Chief Executive Officer
The annual objectives of the Desjardins Group PresidentandCEOarerecommendedtotheBoardof Directors by the Committee on the Aggregate RemunerationofthePresidentandChiefExecutiveOfficerofDesjardinsGroup(CAR).TheCARisoverseenbytheVice-ChairoftheBoardofDirectors, who acts as lead director, in accordance with established independence standards. The PresidentandCEOisnotpresentforthecommittee’sdeliberations.
Senior Executive Vice-President of Desjardins Group and General Manager of the Federation
TheannualobjectivesoftheSeniorExecutiveVice-PresidentofDesjardinsGroupandGeneralManagerof the Federation are set by the Board of Directors, ontherecommendationoftheHumanResourcesCommission(HRC).
Other members of the Desjardins Group Management Committee
The objectives of the other members of the ManagementCommitteearesetbythePresidentandCEO during individual performance reviews held with each committee member. Their incentive plan is taken into account.
b. Performance reviews
The Board of Directors has guidelines for setting objectives to ensure incentive plans are effectively managed and equitably applied across all Desjardins components. An annual review process is used to measure the degree to which these objectives are achieved. The performance review of the Desjardins GroupPresidentandCEOisoverseenbytheCAR.Each director participates anonymously using a grid preparedinadvancebytheCAR,andmembersofmanagement do not participate in the process.

194 2012 DESJARDINS GROUP ANNUAL REPORT – CORPORATE GOVERNANCE
12. INDEPENDENCE OF THE BOARD OF DIRECTORS FROM THE MANAGEMENT COMMITTEE
There are a number of structures and procedures in place to ensure the Board of Directors’ independence from Desjardins Group management.
• ThereisonlyoneBoardmemberwhoisalsoa member of Desjardins Group management: theChairoftheBoard,PresidentandCEOofDesjardins Group. To ensure legitimacy and independence, this individual is also an officer electedbytheAssemblyofRepresentatives.
• ThepositionofVice-ChairoftheBoardofDirectors was created by the general meeting. TheVice-ChairpresidesovertheBoard’smeetings, playing the role of lead director, when the issues being discussed require the recusal oftheChairoftheBoard.TheInternalBy-lawsspecifythattheVice-ChairshallreplacetheChair whenever he or she is unable to act.
• Thedirectorsholdperiodicinformalmeetingsbetween themselves. The Chair of the Board, PresidentandCEOupdatesthemembersof Desjardins Group management, who do not attend these meetings. However, both independentandnon-independentdirectorsdoattend these meetings, since the matters under discussion do not pose a risk of conflict of interest fornon-independentdirectors.
• Closed-doorsessionsareheldattheendofeveryBoard of Directors and Executive Committee meeting, which members of management do notattend(exceptforthePresidentandCEO).The same practice applies to Board commission meetings.TheVice-ChairoftheBoardmaybecalled on to chair these meetings if the matters under discussion require the recusal of the Chair.
• TheAuditandInspectionCommissionandtheRiskManagementCommissionarechairedbyindependent directors.
• TheCorporateGovernanceCommission(ofwhichonlyonememberisanon-independentmember) is mandated with the following:
– Managing relations between the Board of Directors and the Desjardins Group Management Committee
– Ensuring that the Board fulfils its duties (however, the responsibility of drawing up and overseeing meeting agendas for the Board and its commissions/committees falls to the Chair of the Board)
• OnlyindependentdirectorsserveontheCommitteeontheAggregateRemuneration oftheCAR.
• Effective2013,theDesjardinsGroupManagement Committee is chaired by the Senior ExecutiveVice-PresidentofDesjardinsGroupand General Manager of the Federation. The PresidentandCEOwillattendManagementCommittee meetings to ensure that the directions defined by the Board of Directors are taken into account.
• ThemembersoftheHRCandtheCARmaycallon external consultants, as needed, for issues involving the aggregate compensation of senior management.
The Federation also has a Board of Ethics and ProfessionalConduct,whosemembersareelectedbythe general meeting and are all independent from both management and the Board of Directors.
THE NON-SEPARATION OF THE ROLES OF CHAIR OF THE BOARD AND PRESIDENT AND CHIEF EXECUTIVE OFFICER
At Desjardins Group, the role of Chair of the Board isnotseparatefromtheroleofPresidentandCEO.This decision was made by the Federation’s general meeting and has been integrated into its Internal By-laws.Thisissue,inadditiontoothermattersrelated to corporate governance at Desjardins Group, wasexaminedbytheCollaboration,ParticipationandConnection with the Caisse Network project.
DesjardinsGroup’scurrentpositionisthatnon-separation promotes the legitimacy and independence ofthePresidentandCEOofDesjardinsGroup. The main arguments in favour of this position are the following:
• Unlikeatothercompanies,wherethePresidentand CEO is appointed by the Board of Directors, theDesjardinsPresidentandCEOiselectedbyan electoral college of 255 Federation member representatives and the current or outgoing PresidentandCEO.ThePresidentandCEO’sprimary responsibility is to protect the interests ofDesjardinsmembers.ThePresidentandCEO’sinterests are therefore aligned with those of the members.
• TheChairoftheBoard,PresidentandCEOof Desjardins Group has no influence over the choice of directors, because he or she cannot recommend candidates and because each director is elected at either a regional or a group caisse general meeting where the Chair, PresidentandCEOhasnovotingrights,oratanAssemblyofRepresentativeswhereheorshehasonly one vote out of 256. The same applies to the selection of the members of the Board of Ethics andProfessionalConduct.
1952012 DESJARDINS GROUP ANNUAL REPORT – CORPORATE GOVERNANCE
• TheBoardofDirectorscreatedtheCAR,whichischairedbytheVice-ChairoftheBoardofDirectors and made up entirely of independent directors, to eliminate any risk of conflict of interest with respect to compensation. The CAR’smeetingsareclosed-door,anditalsoholdsworking sessions with the Board of Directors, which the Chair does not attend.
• OwingtothecomplexnatureofDesjardinsGroup’s management and activities, and to the expectations of regulators and the general public, it is essential that the Chair of the Board be thoroughly familiar with the activities, business and projects of both the Federation and Desjardins Group in order to effectively act as a leader and uniting force for the elected officers, the management teams of the Desjardins components, and caisse members.
• DesjardinsGroup’sstructureisdesignedtoreleasethePresidentandCEOfromtheeveryday operational concerns of the Federation and Desjardins Group. This enables the PresidentandCEOtofocusmoreonpromotingcooperation within Desjardins and in the community; on the organization’s growth and key strategic priorities; on governance; and on the engagement of Desjardins Group’s elected officers and employees.
• Forthesamereasons,theSeniorExecutiveVice-PresidentofDesjardinsGroupandGeneralManager of the Federation:
– Playsasupervisoryandcoordinationrolewith the business sectors, to promote better unity and synergy between Desjardins Group’s various growth and development activities. Each business sector falls under the responsibilityofaSeniorVice-PresidentandGeneral Manager.
– Has a direct reporting relationship over Desjardins Group’s major support functions as well as the Cooperative Network Support Executive Division and the Cooperative Development and Democratic Governance Support Corporate Division.
13. AUDIT AND INSPECTION COMMISSION
The Audit and Inspection Commission (AIC), established under the Act respecting financial services cooperatives, acts as the audit committee for the Federation’s caisse inspection activities. The AIC is composed entirely of independent directors, and the chair has accounting expertise.
The roles and responsibilities of the AIC have been defined to give its members a very clear understanding of their oversight duties. The AIC has all the power and access to all the information it needs to fulfill its mandate. It reviews all financial information, supervises the required reporting activities, and plays a lead role in overseeing financial disclosure controls and assessing their appropriateness. It has the ability to communicate directly with the Desjardins Group Monitoring Office, which is responsible for the internal audit of the Desjardins Group subsidiaries and components, the external audit of the financial statements of the Quebec caisses, and caisse inspections in Quebec and Ontario.(2) The AIC is also in contact with the external auditors to discuss and review certain issues, should the need arise. The AIC holdsclosed-doorsessions,whichmanagementdoesnot attend.
The AIC ensures the independence of the Desjardins Group internal audit sector and adopts its annual action plan.
14. EXTERNAL CONSULTANTS
A director may retain the services of an external consultant at the Federation’s expense. However, to ensure the reasonableness of such contracts, a request must be submitted to the Corporate Governance Commission.
(2) The Desjardins Group Monitoring Office provides independent opinions on the caisses’ management and financial statements. Consequently, through inspections and audits, it monitors the risks associated with network activities and determines whether these risks are being managed according to sound and prudent management practices and in compliance with legislation, standards and rules of conduct. Moreover, it audits the caisses’ financial statements using recognized auditing standards and issues an opinion on these statements.
196 2012 DESJARDINS GROUP ANNUAL REPORT – CORPORATE GOVERNANCE
MANDATES AND MEMBERSHIP OF THE FEDERATION’S COMMISSIONS, COMMITTEES, AND BOARD OF ETHICS AND PROFESSIONAL CONDUCTAs at December 31, 2012
Note: * Independent member ** Managing director
EXECUTIVE COMMITTEE (EC) (7 directors)
This committee has the same functions and powers as the Board of Directors, with the exception of those which the Board may reserve for itself or assign to another committee or commission. The EC held eight meetings and one conference call in 2012.
Members Monique F. Leroux, c.m., fcpa, fca, Chair of the Board DenisParé,*Vice-ChairoftheBoardYvon Vinet,* Secretary of the BoardLaurier Boudreault(i)
Serges Chamberland*Line Lemelin*(i)
Serge Tourangeau*(i) Term began on June 15, 2012.Jacques Baril* and Alain Dumas, fcpa, fca, were members until June 15, 2012.
COOPERATION AND NETWORK LIAISON COMMISSION (CNLC)(9 directors)
This commission assists the Board of Directors with issues related to Desjardins Group’s cooperative culture and the relationship between the Federation’s democratic bodies and the caisse network. The commission ensures that collaboration, participation and network liaison mechanisms are working efficiently and effectively. It submits recommendations to the Board of Directors as needed. The CNLC held five meetings and three conference calls in 2012.
Members DenisParé,*chairJacques Baril*(i)
Denis Duguay* Norman Grant*(i)
Andrée Lafortune,*(i) fcpa, fca
Sylvie Larouche*(i)
JohannePerron(i)
AlainRaîche(i)
SylvieSt-PierreBabin*/**(i)
(i) Term began on June 15, 2012.LaurierBoudreaultandMichelRoy*weremembersuntilJune15,2012.
AUDIT AND INSPECTION COMMISSION (AIC) (5 directors)
This commission oversees the activities of the Desjardins Group Monitoring Office, supports the Board of Directors in its monitoring and control responsibilities for the Federation and Desjardins Group, and examines in detail all aspects related to the disclosure of financial information. The AIC held 15 days of meetings in 2012.
Members André Gagné,* cpa, cga, chairAnnieP.Bélanger*/**Donat Boulerice*PierreLevasseur*BenoîtTurcotte*(i)
Alain Dumas, fcpa, fca,RogerDesrosiers,fcpa, cpa, Jean-YvesLeblancandSergeHamelinsitontheAICas observers.(i) Term began on June 15, 2012.Andrée Lafortune,* fcpa, fca, was a member until June 15, 2012.
RISK MANAGEMENT COMMISSION (RMC) (6 directors)
This commission assists the Board of Directors in identifying and monitoring major risks to the FederationandDesjardinsGroup.TheRMCheld seven meetings, one conference call and one training day in 2012.
Members Andrée Lafortune,* fcpa, fca, chairJacques Baril*(i)
Norman Grant*MichelRoy*SylvieSt-PierreBabin*/**(i)
Serge Tourangeau*
André Gagné,* cpa, cga,andAlainRaîchesitontheRMCasobservers.(i) Term began on June 15, 2012.Serges Chamberland,* Marcel Lauzon* and Line Lemelin* were members until June 15, 2012.

1972012 DESJARDINS GROUP ANNUAL REPORT – CORPORATE GOVERNANCE
HUMAN RESOURCES COMMISSION (HRC) (5 directors)
This commission periodically reviews Desjardins Group’s total compensation program to help ensure the organization remains competitive, and ensures that the compensation practices in effect are in compliance with Desjardins Group’s policies and guidelines.ThemandateoftheHRCdoesnotincludethetermsofemploymentforthePresidentandChiefExecutiveOfficer.TheRMCheldsixmeetingsandfour conference calls in 2012.
Members Monique F. Leroux, c.m., fcpa, fca, Chair of the Board DenisParé,*Vice-ChairoftheBoardYvon Vinet,* Secretary of the BoardCarole Chevalier*Marcel Lauzon*
COMMITTEE ON THE AGGREGATE REMUNERATION OF THE PRESIDENT AND CHIEF EXECUTIVE OFFICER OF DESJARDINS GROUP (CAR)(4 directors)
This committee is composed entirely of independent directors and is mandated to make recommendations to the Board of Directors on the compensation, terms ofemployment,andannualobjectivesofthePresidentandChiefExecutiveOfficer.TheCARheldonemeeting and two conference calls in 2012. It also heldtwoclosed-doorworkingsessionswiththeBoard of Directors.
Members DenisParé,*Vice-ChairoftheBoardCarole Chevalier* Marcel Lauzon* Yvon Vinet*
CORPORATE GOVERNANCE COMMISSION (CGC) (5 directors)
This commission supports the Board of Directors in applying and updating the corporate governance program. The CGC also oversees the process for recommending candidates to sit on the boards of directors of Desjardins Group subsidiaries. In addition, the CGC is responsible for supervising the performance review program for members of the Board of Directors and its commissions and committees, and for administering the Sustainable DevelopmentPolicyandtheVotingRightsPolicy. The CGC held six meetings and one conference call in 2012.
Members Monique F. Leroux, c.m., fcpa, fca, Chair of the Board Denis Duguay*PierreLevasseur*(i)
DenisParé,*(i)Vice-ChairoftheBoardSylvieSt-PierreBabin*/**(i) (i) Term began on June 15, 2012.André Gagné,* cpa, cga, and Yvon Vinet* were members until June 15, 2012.
INVESTMENT COMMISSION(5 directors and 1 external member)
This commission’s role is fourfold: to monitor the markets and develop an integrated vision; to support portfolio positioning and asset distribution; to follow up on strategies and directions; and to act as an advisory body. The commission’s activities complement those oftheRiskManagementCommissionandDesjardinsGroup’s various other investment committees and do not overlap with them. The Investment Commission held four meetings in 2012.
Members Jacques Baril,* chairLaurier BoudreaultAlain Dumas, fcpa, fca
Normand Grégoire*PierreLevasseur*(i)
JohannePerron(i) Term began on June 15, 2012.BenoîtTurcotte*wasamemberuntilJune15,2012.

198 2012 DESJARDINS GROUP ANNUAL REPORT – CORPORATE GOVERNANCE
DESJARDINS GROUP RETIREMENT COMMITTEE (DGRC) (6 directors, 1 external member, and employer/participant/retiree representatives)
By virtue of the powers vested in it by the Supplemental Pension Plans Act and by the Desjardins GroupPensionPlan(DGPP)Regulation,this committee is in charge of administering the DGPP,managingthepensionfundandpayingparticipants and their survivors the benefits they are entitled to. The members represent employees, employers and retirees and share the role of trustee forthepensionfund.TheDGRCheldfourmeetingsand one conference call.
The Federation represents all Desjardins employers withrespecttotheDGPP.TheFederation’sBoardofDirectorshasdecision-makingpowerincertainmatters,includingtheDGPPRegulation,thenatureand terms of benefit payments to participants and retirees, contribution rates, and the use of any surplus. Through its Board of Directors, the Federation stands surety for the obligations (payment of employee pensions) resulting from the participation of all DesjardinsGroupemployersintheDGPP.
Employer representatives are appointed by the Federation’s Board of Directors. Member and retiree representatives are democratically elected by the group that they represent.
Employer representatives from the Board of Directors Serges Chamberland,* chair Carole Chevalier,*(i)vice-chairNorman Grant,* secretary Sylvie Larouche*(i)
Line Lemelin*BenoîtTurcotte*(i) Term began on June 15, 2012.DenisParé*andJacquesBaril*weremembersuntilJune15,2012.
Participant representatives Guy Cormier Julie Goulet Mario Lévesque SylvainRouleau
External member ReynaldN.Harpin*
Representative for retirees, beneficiaries and participants entitled to a deferred pension Michel-PierreBergeron
Observer representing participants VacantSimonGarneauwasamemberuntilOctober4,2012.
Observer representing retirees, beneficiaries and participants entitled to a deferred pension Normand Deschênes
DGRC INVESTMENT COMMITTEE(5 directors and 1 external member)
UndertheresponsibilityoftheDGRC,whichestablishestheinvestmentpolicy,theDGRCInvestment Committee’s mandate is to administer the policy and coordinate the activities of the designated fundmanagers.TheDGRCInvestmentCommitteeheld five meetings and five conference calls in 2012.
Members Carole Chevalier,*(i) chair Line Lemelin,* secretarySerges Chamberland* ReynaldN.Harpin*Sylvie Larouche*(i)
BenoîtTurcotte*
Guy Cormier, observerGregory Crispin, observer(i) Term began on June 15, 2012.JacquesBaril*andDenisParé*weremembersuntilJune15,2012.
DGRC AUDIT, PROFESSIONAL PRACTICES AND COMPLIANCE COMMITTEE(1 director and 2 external members)
This committee is responsible for overseeing the financial reporting process, rules governing professionalconductandethics,thecomplaint-handling policy, regulatory compliance management and corporate governance. It held three meetings and one conference call.
Members Norman Grant,* chairSylvainRouleau,secretaryJulie Goulet(i)
(i) Term began in April 2012.Vincent Coulombe was a member until February 17, 2012.

1992012 DESJARDINS GROUP ANNUAL REPORT – CORPORATE GOVERNANCE
BOARD OF ETHICS AND PROFESSIONAL CONDUCT (8 elected officers)
PursuanttotheAct respecting financial services cooperatives, the Federation has a Board of Ethics andProfessionalConductthatisindependentoftheBoard of Directors. The eight members of this board are Desjardins Group elected officers. The Board of EthicsandProfessionalConductissupportedbyateam that reports to the Cooperative Support Division and Secretariat General. In 2012, it held 12 meetings, including five conference calls, and its members attended one day of training to strengthen their ethics expertise. During the year, the members were also invitedtoattendameetingheldbythePresidentand CEO of the AMF and the Board of Directors, a training session for members of Desjardins ethics committees and boards, and the annual conference organized by the Quebec Organizational Ethics Network.
One of the main responsibilities of the Board of EthicsandProfessionalConductistoensuretheindependence and objectivity of the Federation’s inspection and audit services for the caisses (Desjardins Group Monitoring Office) and make recommendationstothePresidentandChiefExecutive Officer of Desjardins Group regarding the appointment of the person responsible for managing these services.
Inadditiontotheabove-mentionedresponsibilities,theroleoftheBoardofEthicsandProfessionalConduct includes adopting the rules of conduct applicable to the officers of Desjardins Group and the subsidiaries and to the employees of the Federation and the caisses; presenting said rules for approval to the Board of Directors and ensuring the caisses and the Federation comply with them; supporting the caisses and the Federation in applying the rules of conduct; issuing advice, observations and recommendations on ethical and professional conduct issues (particularly in cases of misconduct); notifying the Board of Directors of violations to the rules of ethics and professional conduct or if the Federation violates the provisions of the Act respecting financial services cooperatives or the regulations governing restricted party transactions and conflicts of interest; ensuring that complaints about the Federation originating from the caisses or other Federation members (Caisse centrale Desjardins, holding companies or subsidiaries) are addressed. The DesjardinsGroupBoardofEthicsandProfessionalConductholdsclosed-doormeetings,whichmanagement does not attend.
In 2012, the Board revised the Desjardins Group Code of Ethics and Professional Conduct, with the intention ofmakingittheveryfirstorganization-widecodeapplicable to all Desjardins Group components. Each component will contribute to the revision process by adopting specific rules for its own activities. The new code will come into effect in the first half of 2013.
Members HélèneLee-Gosselin,*chairClaire Sarrazin,* secretaryMichel C. Bélisle*(i)
Isabelle Bourgeois*Michel Guénette*(ii)
RonaldPichette*GabrielPlourde*Michel Yelle*(i) TermbeganonMarch29,2012.(ii) Term began on August 6, 2012.
MarcelCardinal*wasamemberuntilMarch29,2012.LiseB.Perreault*wasamemberuntilMarch21,2012.
Note: * Independent member
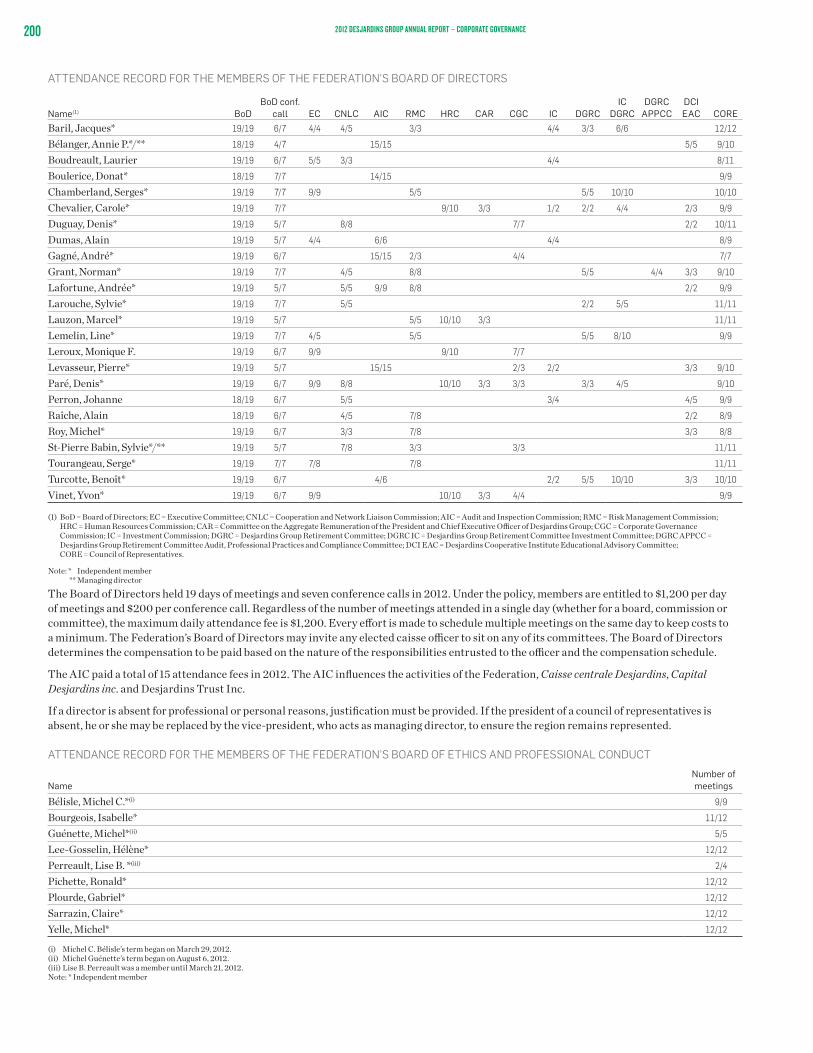
200 2012 DESJARDINS GROUP ANNUAL REPORT – CORPORATE GOVERNANCE
ATTENDANCE RECORD FOR THE MEMBERS OF THE FEDERATION’S BOARD OF DIRECTORS
Name(1) BoDBoD conf.
call EC CNLC AIC RMC HRC CAR CGC IC DGRCIC
DGRCDGRC
APPCC DCI EAC CORE
Baril, Jacques* 19/19 6/7 4/4 4/5 3/3 4/4 3/3 6/6 12/12
Bélanger,AnnieP.*/** 18/19 4/7 15/15 5/5 9/10
Boudreault, Laurier 19/19 6/7 5/5 3/3 4/4 8/11
Boulerice, Donat* 18/19 7/7 14/15 9/9
Chamberland, Serges* 19/19 7/7 9/9 5/5 5/5 10/10 10/10
Chevalier, Carole* 19/19 7/7 9/10 3/3 1/2 2/2 4/4 2/3 9/9
Duguay, Denis* 19/19 5/7 8/8 7/7 2/2 10/11
Dumas, Alain 19/19 5/7 4/4 6/6 4/4 8/9
Gagné, André* 19/19 6/7 15/15 2/3 4/4 7/7
Grant, Norman* 19/19 7/7 4/5 8/8 5/5 4/4 3/3 9/10
Lafortune, Andrée* 19/19 5/7 5/5 9/9 8/8 2/2 9/9
Larouche, Sylvie* 19/19 7/7 5/5 2/2 5/5 11/11
Lauzon, Marcel* 19/19 5/7 5/5 10/10 3/3 11/11
Lemelin, Line* 19/19 7/7 4/5 5/5 5/5 8/10 9/9
Leroux, Monique F. 19/19 6/7 9/9 9/10 7/7
Levasseur,Pierre* 19/19 5/7 15/15 2/3 2/2 3/3 9/10
Paré,Denis* 19/19 6/7 9/9 8/8 10/10 3/3 3/3 3/3 4/5 9/10
Perron,Johanne 18/19 6/7 5/5 3/4 4/5 9/9
Raîche,Alain 18/19 6/7 4/5 7/8 2/2 8/9
Roy,Michel* 19/19 6/7 3/3 7/8 3/3 8/8
St-PierreBabin,Sylvie*/** 19/19 5/7 7/8 3/3 3/3 11/11
Tourangeau, Serge* 19/19 7/7 7/8 7/8 11/11
Turcotte,Benoît* 19/19 6/7 4/6 2/2 5/5 10/10 3/3 10/10
Vinet, Yvon* 19/19 6/7 9/9 10/10 3/3 4/4 9/9
(1) BoD=BoardofDirectors;EC=ExecutiveCommittee;CNLC=CooperationandNetworkLiaisonCommission;AIC=AuditandInspectionCommission;RMC=RiskManagementCommission; HRC=HumanResourcesCommission;CAR=CommitteeontheAggregateRemunerationofthePresidentandChiefExecutiveOfficerofDesjardinsGroup;CGC=CorporateGovernanceCommission;IC=InvestmentCommission;DGRC=DesjardinsGroupRetirementCommittee;DGRCIC=DesjardinsGroupRetirementCommitteeInvestmentCommittee;DGRCAPPCC=DesjardinsGroupRetirementCommitteeAudit,ProfessionalPracticesandComplianceCommittee;DCIEAC=DesjardinsCooperativeInstituteEducationalAdvisoryCommittee; CORE=CouncilofRepresentatives.
Note: * Independent member ** Managing director
TheBoardofDirectorsheld19daysofmeetingsandsevenconferencecallsin2012.Underthepolicy,membersareentitledto$1,200perdayofmeetingsand$200perconferencecall.Regardlessofthenumberofmeetingsattendedinasingleday(whetherforaboard,commissionorcommittee), the maximum daily attendance fee is $1,200. Every effort is made to schedule multiple meetings on the same day to keep costs to a minimum. The Federation’s Board of Directors may invite any elected caisse officer to sit on any of its committees. The Board of Directors determines the compensation to be paid based on the nature of the responsibilities entrusted to the officer and the compensation schedule.
The AIC paid a total of 15 attendance fees in 2012. The AIC influences the activities of the Federation, Caisse centrale Desjardins, Capital Desjardins inc. and Desjardins Trust Inc.
If a director is absent for professional or personal reasons, justification must be provided. If the president of a council of representatives is absent,heorshemaybereplacedbythevice-president,whoactsasmanagingdirector,toensuretheregionremainsrepresented.
ATTENDANCE RECORD FOR THE MEMBERS OF THE FEDERATION’S BOARD OF ETHICS AND PROFESSIONAL CONDUCT
Name Number of meetings
Bélisle, Michel C.*(i) 9/9
Bourgeois, Isabelle* 11/12
Guénette, Michel*(ii) 5/5
Lee-Gosselin,Hélène* 12/12
Perreault,LiseB.*(iii) 2/4
Pichette,Ronald* 12/12
Plourde,Gabriel* 12/12
Sarrazin, Claire* 12/12
Yelle, Michel* 12/12
(i) MichelC.Bélisle’stermbeganonMarch29,2012.(ii) Michel Guénette’s term began on August 6, 2012.(iii)LiseB.PerreaultwasamemberuntilMarch21,2012.Note: * Independent member

2012012 DESJARDINS GROUP ANNUAL REPORT – CORPORATE GOVERNANCE
MEMBERS OF THE COUNCILS OF REPRESENTATIVES
Ratherthanpublishindividualattendancefiguresforall255members,theBoardofDirectorshasdecidedtopublish meeting attendance rates for the 17 councils of representatives.
2012Attendance
rate (%)Number of meetings
Bas-Saint-LaurentandGaspésie–Îles-de-la-Madeleine 89 10
KamouraskaandChaudière-Appalaches 88 8
Québec-Est 82 7
Québec-OuestandRive-Sud 86 11
Saguenay–Lac-Saint-Jean,CharlevoixandCôte-Nord 91 10
Centre-du-Québec 82 10
Mauricie 88 9
Eastern Townships 89 10
Richelieu-Yamaska 88 11
Lanaudière 87 9
Rive-SuddeMontréal 88 9
Laval–Laurentides 88 11
Ouest de Montréal 90 9
Est de Montréal 83 12
Outaouais, 84 11
Abitibi-TémiscamingueetNordduQuébec(1) 93 10
Group caisses 85 11
Ontario 95 9
(1)ThecouncilofrepresentativesfortheOutaouais,Abitibi-TémiscamingueandNordduQuébecregiondividesitsmeetingsintotwosectors.
ASSEMBLY OF REPRESENTATIVES
Number of representatives
presentAttendance
rate (%)
March 30, 2012 256 100
May 5, 2012 209 81.6
September 15, 2012 215 84.0

202 2012 DESJARDINS GROUP ANNUAL REPORT – CORPORATE GOVERNANCE
DESJARDINS GROUP MANAGEMENT COMMITTEE (13 management members)
ThiscommitteesupportsthePresidentandCEOofDesjardins Group and the Board of Directors in their responsibility to provide a management structure for Desjardins Group. The committee helps the Board incorporate the strategic directions of the cooperative network and the subsidiaries and implement business development strategies. The Management Committee held 26 meetings, one conference call and one videoconference in 2012.
Members
Monique F. Leroux, c.m., fcpa, fca, Chair of theBoard,PresidentandChiefExecutiveOfficer of Desjardins Group, and Chair of the Committee
Stéphane Achard,SeniorVice-PresidentandGeneral Manager, Business and Institutional Services, Desjardins Group
Réal Bellemare,SeniorVice-President, RiskManagement,DesjardinsGroup
Denis Berthiaume,SeniorVice-President and General Manager, Wealth Management and Life and Health Insurance, Desjardins Group
Serge Cloutier,ExecutiveVice-President,Cooperative Development and Democratic Governance Support, Desjardins Group
Guy Cormier,SeniorVice-President,CooperativeNetwork Support, Desjardins Group
Marie-Huguette Cormier,ExecutiveVice-President,Communications, Desjardins Group
Normand Desautels, cpa, cga,SeniorVice-PresidentandGeneralManager,PersonalServicesandHumanCapital, Desjardins Group
Daniel Dupuis, cpa, ca,SeniorVice-President,Finance, and Chief Financial Officer, Desjardins Group
Louis-Daniel Gauvin,SeniorVice-President and General Manager, Caisse centrale Desjardins and Capital Desjardins inc.
Marc Laplante, cpa, ca, Senior Executive Vice-President,DesjardinsGroup,andGeneralManager of the Federation
Robert Ouellette,SeniorVice-President,Technologyand Shared Services, Desjardins Group
Sylvie Paquette,SeniorVice-President,Propertyand Casualty Insurance, Desjardins Group
The Management Committee has the following Desjardins-widecoordinationcommittees: the Desjardins Group Operating Committee; the Desjardins Group Strategic Management Structure Committee; the Operational Governance andFollow-UpCommittee;theFinanceandRiskManagement Committee; the Desjardins Group Image Committee; the Network Liaison Committee; andtheDesjardinsGroupDevelopmentPlanning andFollow-UpCommittee.
EXECUTIVE COMPENSATION
Executive compensation disclosure requirements apply to certain Desjardins Group components, namely the Federation, Caisse centrale Desjardins and Capital Desjardins inc.AsrequiredbyRegulation51-102respectingContinuousDisclosureObligations,the compensation of executives from the Federation, Caisse centrale Desjardins and Capital Desjardins inc.is presented in each entity’s respective Annual Information Forms and is incorporated by reference in this annual report. The Annual Information Forms areavailableontheSEDARwebsite(www.sedar.com)under each entity’s respective company profile.

2032012 DESJARDINS GROUP ANNUAL REPORT – GLOSSARY OF FINANCIAL TERMS
GLOSSARY OF FINANCIAL TERMS ACCEPTANCE
Short-term debt security traded on the money market, guaranteed by a financial institution for a borrower in exchange for a stamping fee.
ALLOWANCE FOR CREDIT LOSSES
Amount deemed sufficient by management to cover the anticipated losses on a loan portfolio. The allowance for credit losses is increased by individual and collective provisions and decreased by write-offs, net of recoveries.
Alt-A MORTGAGE LOAN
Loan to a borrower with non-standard income documentation.
ANNUITY PREMIUM
Amount invested by a policyholder in order to receive annuity payments, immediately or after an accumulation period.
APPOINTED ACTUARY
Actuary appointed by an insurance company’s board of directors, in accordance with the federal and provincial laws governing insurance.
ASSETS UNDER MANAGEMENT AND UNDER ADMINISTRATION
Assets managed or administered by a financial institution that are beneficially owned by clients or members and are therefore not recognized on the financial institution’s combined balance sheet. Services provided in respect of assets under administration are administrative in nature, such as custodial services, collection of investment income and settlement of buy and sell transactions, while services provided in respect of assets under management include selecting investments and offering investment advice. Assets under management may also be administered by the financial institution. Assets resulting from securitization transactions are not considered assets under administration or under management.
AUTORITÉ DES MARCHÉS FINANCIERS
Organization whose mission is to administer all laws governing the supervision of the financial industry in Quebec, particularly as concerns insurance, deposit-taking institutions, financial product and service distribution, and securities.
BASIS POINT
Unit of measure equal to one one-hundredth of a percent (0.01%).
BENEFIT
Amount paid by an insurer under a life, disability or health insurance policy. The benefit is paid to the policyholder, the insured or the designated beneficiary. In a pension plan, this term refers to the vested rights of a participant.
BOND
Certificate evidencing a debt under which the issuer promises to pay the holder a specified amount of interest for a specified period of time, and to repay the borrowing at maturity. Generally, assets are pledged as security for the borrowing, except in the case of government or corporate bonds. This term is often used to describe any debt security.
COLLECTIVE ALLOWANCE
Allowance established for loan portfolios that are not subject to an individual allowance and are included in groups of financial assets having similar credit characteristics.
COMBINED RATIO
In property and casualty insurance, incurred claims plus operating expenses expressed as a percentage of net premiums earned.
COMMERCIAL MORTGAGE-BACKED SECURITY
Security created through the securitization of a pool of commercial mortgage loans.
CREDIT INSTRUMENT
Credit facility offered in the form of a loan or other financing vehicle recognized in the combined balance sheets or in the form of an off-balance sheet product. Credit instruments include guarantees, letters of credit, securities loans and credit commitments.
DEFINED BENEFIT PENSION PLAN
Pension plan that guarantees each participant a defined level of retirement income, often based on a formula set by the plan in terms of the participant’s salary and years of service.
204 2012 DESJARDINS GROUP ANNUAL REPORT – GLOSSARY OF FINANCIAL TERMS
DERIVATIVE
Financial contract whose value fluctuates based on an underlying asset, but that does not require holding or delivering the underlying asset itself. Derivatives are used to transfer, modify or reduce current or expected risks, including risks related to interest and exchange rates and other financial indexes.
DESJARDINS GROUP COMPONENT
Cooperative or subsidiary that is part of Desjardins Group.
EFFECTIVE INTEREST RATE
Rate determined by discounting total future cash flows, including fees paid or received, premiums or discounts, and transaction costs.
FAIR VALUE MEASUREMENT
Measurement to determine the approximate value at which financial instruments could be traded in a current transaction between willing parties.
FINANCIAL ASSET-BACKED SECURITY
Security created through the securitization of a pool of financial assets.
FORWARD CONTRACT
Contractual commitment to sell or purchase a determined quantity of a specified underlying asset on a future specified date and at a predetermined price. Forward contracts, which are derivatives, are tailored and traded over the counter.
FORWARD EXCHANGE CONTRACT
Contractual commitment to sell or purchase a fixed amount of foreign currency on a specified future date and at a predetermined exchange rate.
FUTURES CONTRACT
Contractual commitment to sell or purchase a determined quantity of a specified underlying asset on a future specified date and at a predetermined price. Futures contracts, which are derivatives, are standardized and exchange-traded.
GROSS PREMIUMS WRITTEN
In property and casualty insurance, the premiums stipulated in insurance policies issued during the year.
GUARANTEES AND STANDBY LETTERS OF CREDIT
Irrevocable commitments by a financial institution to make payments in the event a member or client cannot meet their financial obligations to a third party.
HEDGING
Transaction designed to reduce or offset exposure to one or more financial risks. It involves taking a position exposed to effects that are equivalent, but of opposite direction, to the effects of market fluctuations on an existing or forecasted position.
HEDGING RELATIONSHIP
Relationship established between a hedged item and a hedging instrument that meets all the hedge accounting conditions stated in IAS 39, “Financial Instruments: Recognition and Measurement”. A hedging instrument (generally a derivative instrument) is used to offset an identified risk associated with interest or exchange rates or other financial indexes to which the financial institution is exposed by a hedged item (generally an asset or liability recognized on the combined balance sheets).
IMPAIRED LOAN
Loans, except credit card balances, whose collection is doubtful as a result of a deterioration in credit quality. Loans are classified as impaired when one of the following conditions is met: in management’s opinion, there is reasonable doubt that the principal or the interest will be collected on the scheduled dates; the interest or principal payment is 90 days or more past due, unless the loan is fully secured and in the process of collection; or the interest or principal is more than 180 days past due.
INDIVIDUAL ALLOWANCE
Specific allowance established for an individual loan portfolio for which the financial institution deems that there is objective evidence of impairment and a loss should be recognized in the combined statements of income. Loan portfolios for which an individual allowance has not been established are then included in groups of assets having similar credit risk characteristics and are subject to a collective allowance.
INSURANCE AND INVESTMENT CONTRACT LIABILITY
Provision representing the amount of an insurance company’s commitments toward all insureds and beneficiaries, established to guarantee the payment of benefits.
INSURANCE PREMIUM
Payment that the policyholder is required to make to maintain the insurance contract in force. This payment represents the cost of insurance and can sometimes include a savings component. The premium is directly proportional to the amount of risk underwritten by the insurer.

2052012 DESJARDINS GROUP ANNUAL REPORT – GLOSSARY OF FINANCIAL TERMS
INSURED
Person whose life or health is insured under an insurance policy.
INTERNAL RATINGS-BASED APPROACH
Approach under which risk weighing is based on the type of counterparty (individual, small or medium-sized business, large corporation, etc.) and risk-weighing factors determined using internal parameters: the borrower’s probability of default (PD), loss given default (LGD), effective maturity (EM) and exposure at default (EAD).
LEVERAGED FINANCE LOAN
Loan to a large corporation or finance company whose credit rating is between BB+ and D and whose level of debt is very high compared to other companies in the same industry.
LOSS RATIO
In property and casualty insurance, incurred claims expressed as a percentage of net premiums earned.
MASTER NETTING AGREEMENT
Standard agreement developed to reduce the credit risk of multiple derivative transactions by creating a legal right to offset the obligations of a counterparty in the event of default.
MATCHING
Process of adjusting asset, liability and off-balance sheet item maturities in order to minimize risks related to interest or exchange rates or other financial indexes. Matching is used in asset/liability management.
MEMBER DIVIDEND
Allocation of surplus earnings to a member on the basis of their business volume with the caisse.
MORBIDITY RATE
Probability that a person of a given age will suffer an illness or disability. The health insurance premium paid by a person belonging to a particular age group is based on this group’s morbidity rate.
MORTALITY RATE
Rate of death in a particular group of persons. The life insurance premium paid by a person belonging to a particular age group is based on this group’s mortality rate.
MORTGAGE-BACKED SECURITY
Security created through the securitization of a pool of residential mortgage loans under the National Housing Act.
MUTUAL FUND
Fund made up of amounts pooled together by investors for the purpose of making a collective investment. A third party manages the fund and must, on request, redeem the units at their net asset value (or redemption value).
NET INTEREST INCOME
Difference between what a financial institution receives on assets such as loans and securities and what it pays out on liabilities such as deposits and subordinated bonds.
NET PREMIUMS EARNED
In property and casualty insurance, premiums collected for a given period, net of reinsurance premiums.
NOTIONAL AMOUNT
Reference amount used to calculate payments for instruments such as forward rate agreements and interest rate swaps. This amount is called “notional” because it does not change hands.
OFFICE OF THE SUPERINTENDENT OF FINANCIAL INSTITUTIONS CANADA
Organization whose mission is to administer all laws governing the supervision of the financial industry in Canada, particularly as concerns banks, insurance companies, trust companies, loan companies and pension plans.
OPTION
Contractual agreement that grants the right, but not the obligation, to sell (put option) or to buy (call option) a specified amount of a financial instrument at a predetermined price (the exercise or strike price) on or before a specified date.
PENSION PLAN
Contract under which participants receive retirement benefits under certain terms starting at a given age. A pension plan is funded through contributions made either by the employer alone or by both the employer and the participants.
PERMANENT SHARE OR CAPITAL SHARE
Equity security offered to caisse members.
POLICY
Written document that evidences the existence of an insurance or annuity contract and that sets out the terms and conditions thereof.

206 2012 DESJARDINS GROUP ANNUAL REPORT – GLOSSARY OF FINANCIAL TERMS
PROVISION FOR CREDIT LOSSES
Amount intended to cover losses on other off-balance sheet financial assets and financial assets recognized in the combined balance sheets, in addition to the allowance for credit losses. Individual allowances are established to reduce the carrying amount of some assets (especially impaired loans) to an estimated realizable value. A collective allowance is established for expected losses on total unimpaired loans when credit losses cannot yet be estimated on an individual basis. For this purpose, these loans are aggregated in financial asset groups having similar credit characteristics.
REINSURANCE TREATY
Agreement whereby one insurer assumes all or part of a risk undertaken by another insurer. Despite the treaty, the original insurer remains fully liable to its policyholders for the insurance obligations.
RISK-WEIGHTED ASSETS
Assets adjusted based on a risk-weighting factor prescribed by regulations to reflect the level of risk associated with items presented in the combined balance sheets. Some assets are not weighted, but rather deducted from capital. The calculation method is defined in the Autorité des marchés financiers guidelines. For more details, see the “Capital management” section of the Management’s Discussion and Analysis.
SECURITY AT FAIR VALUE THROUGH PROFIT OR LOSS
Security held on a short-term basis for arbitrage purposes.
SECURITIZATION
Process by which financial assets, such as mortgage loans, are converted into asset-backed securities and transferred to a trust.
SEGREGATED FUND
Type of fund offered by insurance companies through a variable contract that provides the contract holder with a number of guarantees, such as principal repayment upon death. Segregated funds encompass a range of categories of securities and are designed to meet a variety of investment objectives.
SPECIAL PURPOSE ENTITY
Entity whose equity at risk is not sufficient to finance its activities without additional subordinated financial support or whose holders of equity investment at risk lack any characteristics of a controlling financial interest.
STANDARDIZED APPROACH
Default approach used to calculate risk-weighted assets. Under this method, the financial institution uses valuations performed by external credit assessment institutions recognized by the Autorité des marchés financiers to determine the risk-weighing factors related to the various exposure categories.
SUBORDINATED BOND
Unsecured bond whose repayment in the event of liquidation is subordinated to the prior repayment of certain other creditors.
SUBPRIME RESIDENTIAL MORTGAGE LOAN
Loan to a borrower with a high credit risk profile.
SUBSIDIARY
Company controlled by the Fédération des caisses Desjardins du Québec.
SWAP
Derivative financial instrument under which two parties agree to exchange interest rates or currencies for a specified period according to predetermined rules.
TIER 1 CAPITAL
Capital of a more permanent nature than Tier 2 capital, consisting of eligible capital shares, reserves, undistributed surplus earnings and non-controlling interests. Goodwill is deducted from Tier 1 capital.
TOTAL CAPITAL
Tier 1 capital plus Tier 2 capital, less certain deductions.
UNDERWRITING EXPERIENCE
In life and health insurance, the difference between actual results and actuarial assumptions, used to determine premiums or actuarial liabilities, as applicable.
VALUE-AT-RISK (VaR)
Estimated value of the potential loss for a certain period of time at a given confidence level.
