2012 investor days1.q4cdn.com/.../2012/2012-investor-day-presentation-final.pdf · disclose only...
TRANSCRIPT
7/26/2012
1
TSX: IMG NYSE: IAG
2012 INVESTOR DAY June 25, 2012
Leveraging Our Core Competencies
TSX: IMG NYSE: IAG
Introduction

7/26/2012
2
Cautionary Statement
This presentation contains forward-looking statements. All statements, other than of historical fact, that address activities, events or
developments that the Company believes, expects or anticipates will or may occur in the future (including, without limitation,
statements regarding expected, estimated or planned gold and niobium production, cash costs, margin expansion, capital
expenditures and exploration expenditures and statements regarding the estimation of mineral resources, exploration results,
potential mineralization, potential mineral resources and mineral reserves) are forward-looking statements. Forward-looking
statements are generally identifiable by use of the words “may”, “will”, “should”, “continue”, “expect”, “anticipate”, “estimate”,
“believe”, “intend”, “plan” or “project” or the negative of these words or other variations on these words or comparable term inology.
Forward-looking statements are subject to a number of risks and uncertainties, many of which are beyond the Company’s ability to
control or predict, that may cause the actual results of the Company to differ materially from those discussed in the forward-looking
statements. Factors that could cause actual results or events to differ materially from current expectations include, among other
things, without limitation, failure to meet expected, estimated or planned gold and niobium production, cash costs, margin
expansion, capital expenditures and exploration expenditures and failure to establish estimated mineral resources, the possibility
that future exploration results will not be consistent with the Company's expectations, changes in world gold markets and other risks
disclosed in IAMGOLD’s most recent Form 40-F/Annual Information Form on file with the United States Securities and Exchange
Commission and Canadian provincial securities regulatory authorities. Any forward-looking statement speaks only as of the date on
which it is made and, except as may be required by applicable securities laws, the Company disclaims any intent or obligation to
update any forward-looking statement.
The United States Securities and Exchange Commission (the "SEC") permits mining companies, in their filings with the SEC, to
disclose only those mineral deposits that a company can economically and legally extract or produce. We use certain terms in this
presentation, such as "mineral resources" , that the SEC guidelines strictly prohibit us from including in our filings with the SEC.
U.S. investors are urged to consider closely the disclosure in the IAMGOLD Annual Report on Form 40-F. A copy of the most recent
Form 40-F is available to shareholders, free of charge, upon written request addressed to the Investor Relations Department.
Total Resources includes all categories of resources unless indicated otherwise.
All currency numbers are in US$ unless otherwise stated.
3
Executive Leadership Team
4
Steve Letwin President and Chief Executive Officer
Benjamin Little Senior Vice President, Corporate Affairs
Paul Olmsted Senior Vice President, Corporate Development
Jeffery Snow Senior Vice President and General Counsel
Lisa Zangari Senior Vice President, Human Resources
Denis Miville-Deschênes Senior Vice President, Project Development
Bob Carreau Senior Vice President, Health, Safety & Sustainability
Craig MacDougall Vice President, Exploration
Gordon Stothart Executive Vice President and COO
Carol Banducci Executive Vice President and CFO
Michael Donnelly Senior Vice President, Exploration

7/26/2012
3
6.14
5.26
3.79
1.98 2.40 2.24
1.67
2006 2007 2008 2009 2010 2011 YTD
Historical Global DART and TRIR Rates
Health and Safety Lagging Indicators 2012
5
3.36
2.86
1.90
1.06 1.06 1.12
0.89
Year-to-Date
(As of May 2012)
# Hours
Worked 10,522,099
DART Rate 0.89
# of DART 47
TRIR Rate 1.67
# of TRI 88
Definitions:
DART – Days Away Restricted and Transfer
TRIR – Total Recordable Incident Rate
DART
TRIR
AGENDA
6
1 Transformation of IAMGOLD
2 Gold Business
3 Greenfields Exploration
4 Niobium Business
5 Rare Earth Elements
6 Corporate Affairs
7 Financial Review
8 Investment Thesis

7/26/2012
4
TSX: IMG NYSE: IAG
Transformation of IAMGOLD
The Transformation of IAMGOLD – Financials
8
Cash balances
enhanced through
sale of non-
strategic assets
Exploited solid
balance sheet and
cash flow to
increase overall
liquidity
Increased dividend
213%
Strengthen
balance sheet
Enhance financial
flexibility
Improve return to
shareholders Annual Dividend
$0.25 / share
Annual Dividend:
$0.08 / share
Credit Facility:
$350M
Cash & Cash
Equivalents: $271M
Gold Bullion (at market):
$141M
Cash & Cash
Equivalent: $528M
Gold Bullion (at market):
$224M
Available Credit
Facility:$500M
Niobec Credit: $250M
1Excludes transaction costs
7/26/2012
5
9
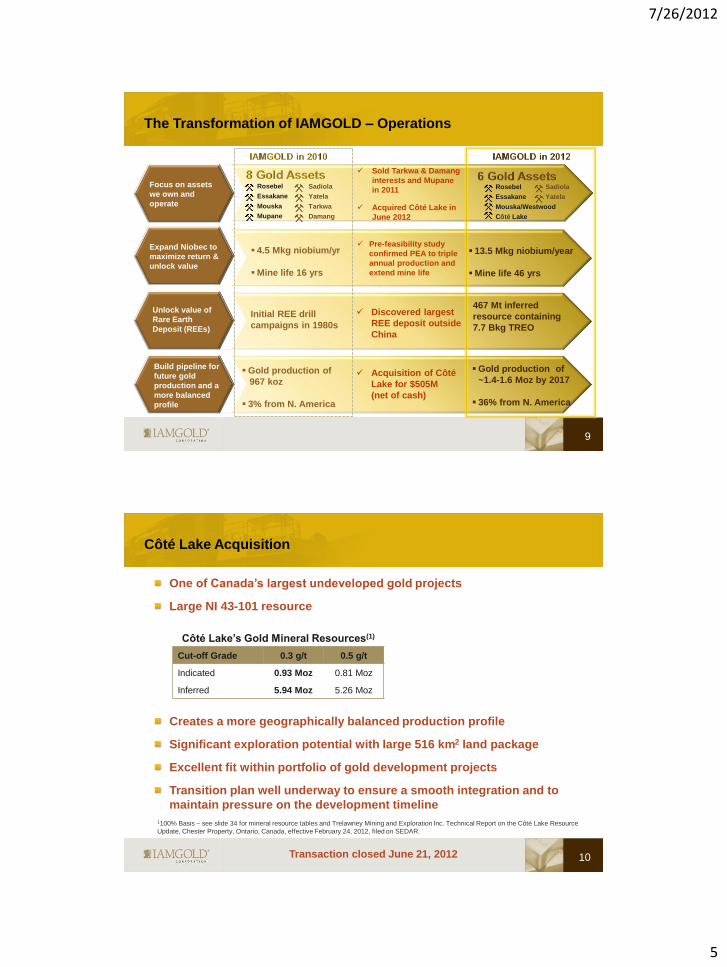
Rosebel
Essakane
Mouska
Mupane
Sadiola
Yatela
Tarkwa
Damang
4.5 Mkg niobium/yr
Mine life 16 yrs
Initial REE drill
campaigns in 1980s
Gold production of
967 koz
3% from N. America
Rosebel
Essakane
Mouska/Westwood
Côté Lake
Sadiola
Yatela
13.5 Mkg niobium/year
Mine life 46 yrs
467 Mt inferred
resource containing
7.7 Bkg TREO
Gold production of
~1.4-1.6 Moz by 2017
36% from N. America
Sold Tarkwa & Damang
interests and Mupane
in 2011
Acquired Côté Lake in
June 2012
Pre-feasibility study
confirmed PEA to triple
annual production and
extend mine life
Discovered largest
REE deposit outside
China
Acquisition of Côté
Lake for $505M
(net of cash)
The Transformation of IAMGOLD – Operations
Focus on assets
we own and
operate
Expand Niobec to
maximize return &
unlock value
Build pipeline for
future gold
production and a
more balanced
profile
Unlock value of
Rare Earth
Deposit (REEs)
Côté Lake Acquisition
One of Canada’s largest undeveloped gold projects
Large NI 43-101 resource
Creates a more geographically balanced production profile
Significant exploration potential with large 516 km2 land package
Excellent fit within portfolio of gold development projects
Transition plan well underway to ensure a smooth integration and to
maintain pressure on the development timeline
10
Côté Lake’s Gold Mineral Resources(1)
Cut-off Grade 0.3 g/t 0.5 g/t
Indicated 0.93 Moz 0.81 Moz
Inferred 5.94 Moz 5.26 Moz
1100% Basis – see slide 34 for mineral resource tables and Trelawney Mining and Exploration Inc. Technical Report on the Côté Lake Resource
Update, Chester Property, Ontario, Canada, effective February 24, 2012, filed on SEDAR.
Transaction closed June 21, 2012
7/26/2012
6
'12E '13E '14E '15E '16E '17E
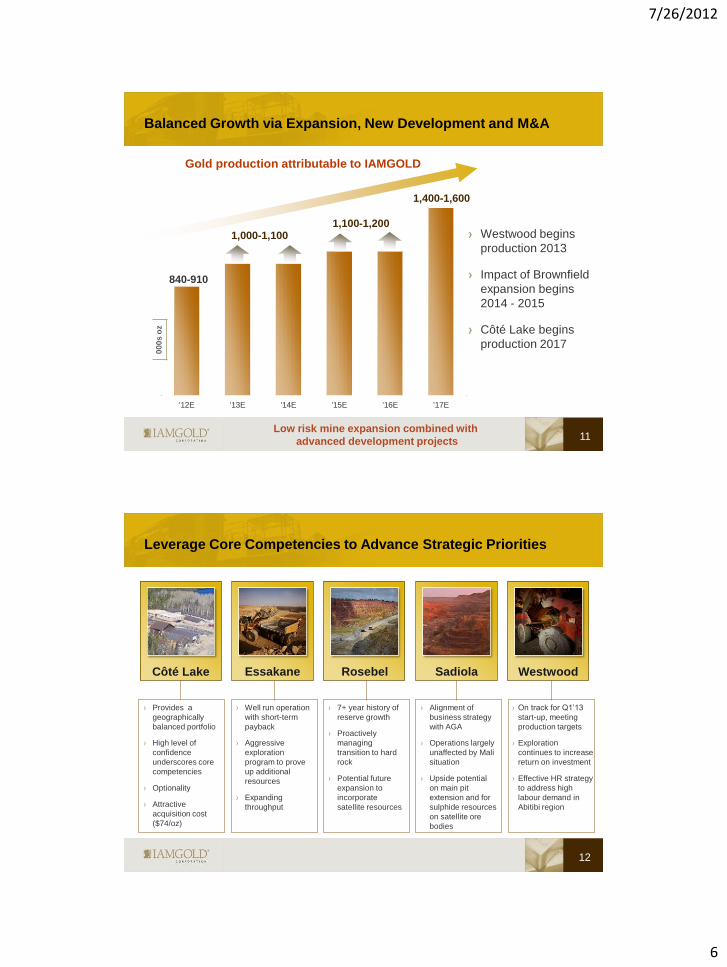
Balanced Growth via Expansion, New Development and M&A
11
00
0s
oz
Low risk mine expansion combined with
advanced development projects
840-910
1,000-1,100
Gold production attributable to IAMGOLD
1,100-1,200
1,400-1,600
Westwood begins
production 2013
Impact of Brownfield
expansion begins
2014 - 2015
Côté Lake begins
production 2017
Leverage Core Competencies to Advance Strategic Priorities
12
› Provides a
geographically
balanced portfolio
› High level of
confidence
underscores core
competencies
› Optionality
› Attractive
acquisition cost
($74/oz)
› Well run operation
with short-term
payback
› Aggressive
exploration
program to prove
up additional
resources
› Expanding
throughput
› Alignment of
business strategy
with AGA
› Operations largely
unaffected by Mali
situation
› Upside potential
on main pit
extension and for
sulphide resources
on satellite ore
bodies
› On track for Q1’13
start-up, meeting
production targets
› Exploration
continues to increase
return on investment
› Effective HR strategy
to address high
labour demand in
Abitibi region
Essakane Rosebel Sadiola Westwood Côté Lake
› 7+ year history of
reserve growth
› Proactively
managing
transition to hard
rock
› Potential future
expansion to
incorporate
satellite resources
7/26/2012
7
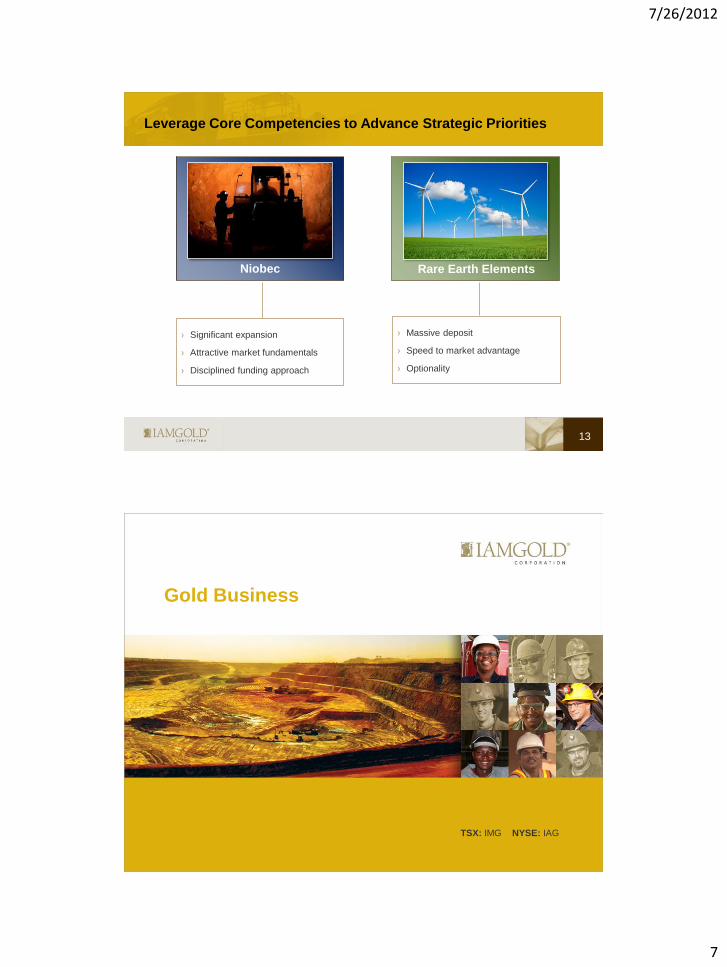
Leverage Core Competencies to Advance Strategic Priorities
13
› Significant expansion
› Attractive market fundamentals
› Disciplined funding approach
Niobec Rare Earth Elements
› Massive deposit
› Speed to market advantage
› Optionality
TSX: IMG NYSE: IAG
Gold Business
7/26/2012
8
TSX: IMG NYSE: IAG
Côté Lake Project
Provides a geographically balanced portfolio
High level of confidence underscores core competencies
Optionality
Attractive acquisition cost ($74/oz)
Côté Lake – Key Messages
16
Côté Lake

7/26/2012
9
17
Animation of Côté Lake deposit
18
Côté Lake – One of Canada’s Largest Undeveloped Gold Projects
Large Canadian resource creates balanced portfolio
Confidence level reflects rigorous due diligence
Attractive location with established infrastructure
Access to skilled labour
Cost benefits through large, bulk tonnage potential
Significant exploration potential
7/26/2012
10
19
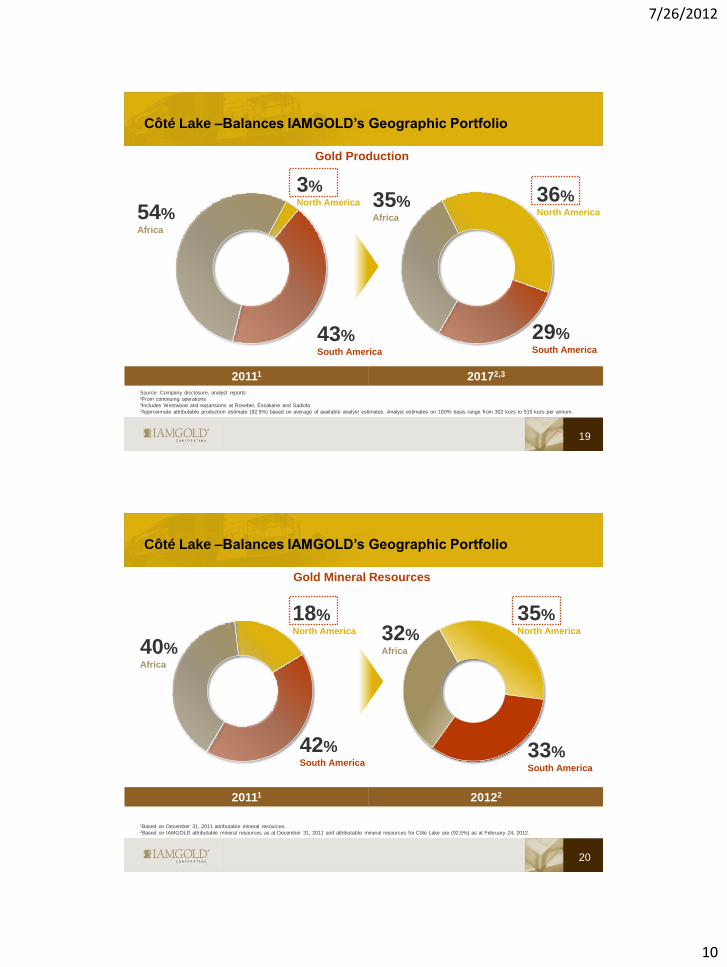
Côté Lake –Balances IAMGOLD’s Geographic Portfolio
20111 20172,3
3% North America
54% Africa
43% South America
36% North America
35% Africa
29% South America
Gold Production
Source: Company disclosure, analyst reports 1From continuing operations 2Includes Westwood and expansions at Rosebel, Essakane and Sadiola 3Approximate attributable production estimate (92.5%) based on average of available analyst estimates. Analyst estimates on 100% basis range from 302 kozs to 515 kozs per annum.
20
Côté Lake –Balances IAMGOLD’s Geographic Portfolio
20111 20122
Gold Mineral Resources
1Based on December 31, 2011 attributable mineral resources. 2Based on IAMGOLD attributable mineral resources as at December 31, 2011 and attributable mineral resources for Côté Lake are (92.5%) as at February 24, 2012.
18% North America
40% Africa
42% South America
35% North America 32%
Africa
33% South America

7/26/2012
11
21
ENERGY 5 km to 115 kV power line
75 km to 500 kV transmission line
Côté Lake – Well Established Infrastructure
ROAD Close to Hwy 144, 130 km to Timmins,
170 km to Sudbury
RAIL 25km to CN Rail siding in Gogama
70km to CP Rail crossing
WATER Ample supply to develop and
operate a mine
VENDORS & SUPPLIERS Located in the heart of one of Canada’s
premier mining camps
Source: MNDM and Trelawney Mining
144
101 CN Rail
CP Rail
Chapleau
Sudbury
Timmins
Côté Lake
Property
500 kV
Power line
115 kV
Power
line
Gogama
Conceptual
Pit
Rail
Roads
Power lines
Côté Lake – Project Evaluation Process Overview
Many projects evaluated
About 1 in twenty advance to full executive-level discussion
Project sensitivities gauged through software generated resource &
mining scenarios
Resource modeling: Geological models, assay capping & compositing, block model search, classification strategies
Mine modeling: Gold price, recoveries, minimum widths/selective mining unit, processing costs, mining costs, slope
angles, dilution, processing & mining rates
Mine schedules: Pit phases, variable cut-off grades, stockpiling, capitalized stripping
Cash flow: Discount rates, capex, taxes, royalties, reclamation
Only a few opportunities stand-out
IRR & NPV
Acquisition cost
Economic models withstand stress test
22
Evaluation Projects Description
Stage I 100% Public data
Stage II 33% Confidential data
Stage III 13% Due diligence teams
Stage IV 5% Board discussion

7/26/2012
12
Côté Lake – Rigorous Due Diligence
23
Due Diligence 2010 2011 2012
Task N D J F M A M J J A S O N D J F M A M J
Compile Public Data √ √ √ √ √
Resource Modeling √ √ √ √ √ √ √ √
Resource Audit √ √ √
Pit Shell Modeling √ √ √ √ √ √ √ √
Pit Shell Audit √ √
Confidentially Agreement √ √ √ √ √ √ √ √ √ √ √ √ √ √ √
Permitting Review √ √ √
Site Visit √ √ √ √ √
Land Title Search √ √ √ √ √ √ √ √
Mineral Potential Assessment √ √ √
Geotechnical Analysis √ √ √ √
Update Project Parameters √ √ √ √ √ √ √
Metallurgical Testing Results √ √ √
Schedule & Cash Flow Models √ √ √ √ √ √
Site Planning √ √ √ √
Data Validation √ √ √ √ √
Cash Flow Audit √ √
Community/First Nations Assessment √ √ √ √ √ √ √ √ √ √ √ √ √ √
Geophysical Database Review √ √
Legal-Financial Due Diligence √ √
Acquisition Announcement √
Closing √
Comprehensive and lengthy process
Côté Lake Due Diligence – Site Visits
Geologists & Geotechnical Engineers
Understanding the geological controls on mineralization
First hand assessment of rock quality
Taking verification samples
Reviewing site practices
Review QA/QC processes
Biologists
Understanding the permitting requirements and timelines
Construction Engineers
Assessing capital expenditure requirements
Reviewing existing regional infrastructure
Community Relation Experts
Understanding community involvement and perspective
24
7/26/2012
13
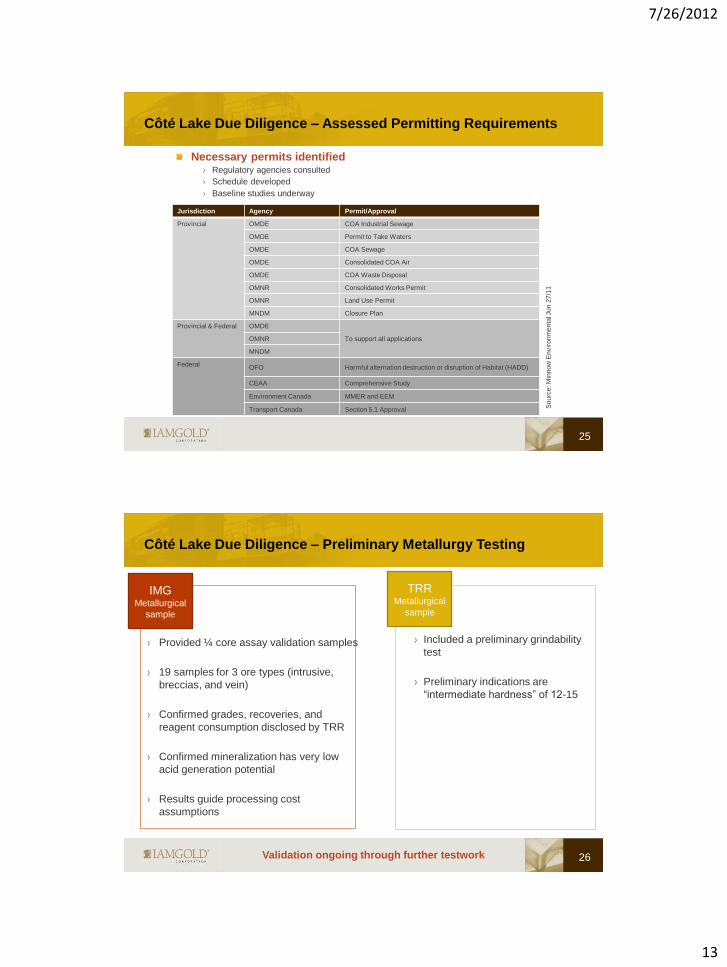
Côté Lake Due Diligence – Assessed Permitting Requirements
Necessary permits identified Regulatory agencies consulted
Schedule developed
Baseline studies underway
25
Sourc
e: M
innow
Envir
onm
enta
l Jun 2
7/1
1
Jurisdiction Agency Permit/Approval
Provincial OMDE COA Industrial Sewage
OMDE Permit to Take Waters
OMDE COA Sewage
OMDE Consolidated COA Air
OMDE COA Waste Disposal
OMNR Consolidated Works Permit
OMNR Land Use Permit
MNDM Closure Plan
Provincial & Federal OMDE
To support all applications OMNR
MNDM
Federal OFO Harmful alternation destruction or disruption of Habitat (HADD)
CEAA Comprehensive Study
Environment Canada MMER and EEM
Transport Canada Section 5.1 Approval
26
IMG Metallurgical
sample
Provided ¼ core assay validation samples
19 samples for 3 ore types (intrusive,
breccias, and vein)
Confirmed grades, recoveries, and
reagent consumption disclosed by TRR
Confirmed mineralization has very low
acid generation potential
Results guide processing cost
assumptions
TRR Metallurgical
sample
Included a preliminary grindability
test
Preliminary indications are
“intermediate hardness” of 12-15
Côté Lake Due Diligence – Preliminary Metallurgy Testing
Validation ongoing through further testwork
7/26/2012
14
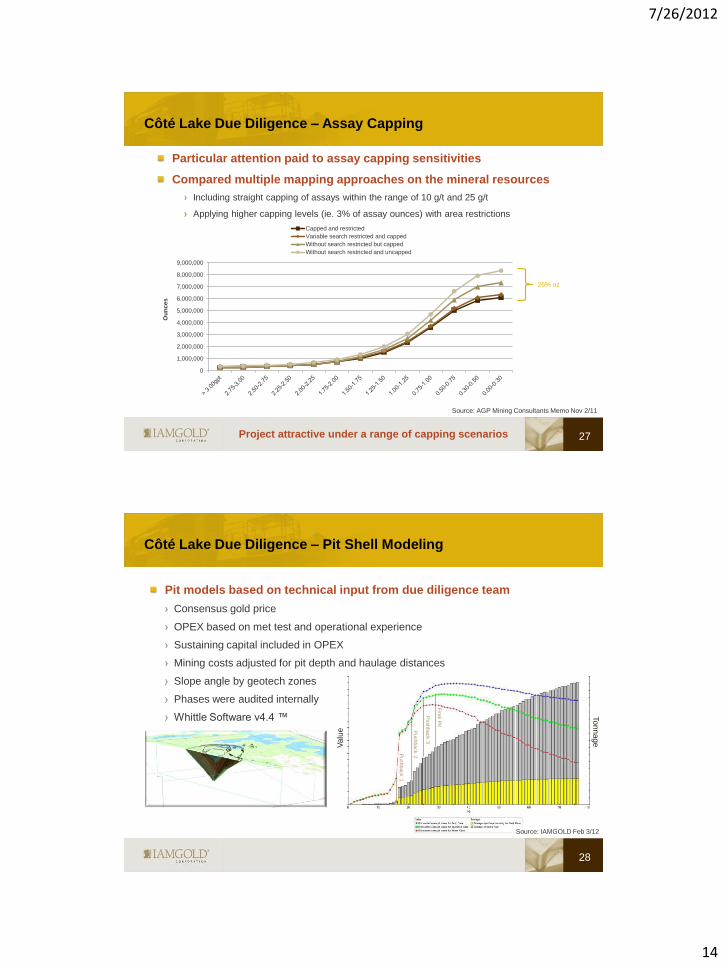
Côté Lake Due Diligence – Assay Capping
Particular attention paid to assay capping sensitivities
Compared multiple mapping approaches on the mineral resources
Including straight capping of assays within the range of 10 g/t and 25 g/t
Applying higher capping levels (ie. 3% of assay ounces) with area restrictions
27
Source: AGP Mining Consultants Memo Nov 2/11
26% oz
Project attractive under a range of capping scenarios
0
1,000,000
2,000,000
3,000,000
4,000,000
5,000,000
6,000,000
7,000,000
8,000,000
9,000,000
Ou
nces
Capped and restricted
Variable search restricted and capped
Without search restricted but capped
Without search restricted and uncapped
Va
lue
To
nn
ag
e
Pushback 1
Fin
al P
it
Pushback 2
Pushback 3
Côté Lake Due Diligence – Pit Shell Modeling
Pit models based on technical input from due diligence team
Consensus gold price
OPEX based on met test and operational experience
Sustaining capital included in OPEX
Mining costs adjusted for pit depth and haulage distances
Slope angle by geotech zones
Phases were audited internally
Whittle Software v4.4 ™
28
Source: IAMGOLD Feb 3/12
7/26/2012
15
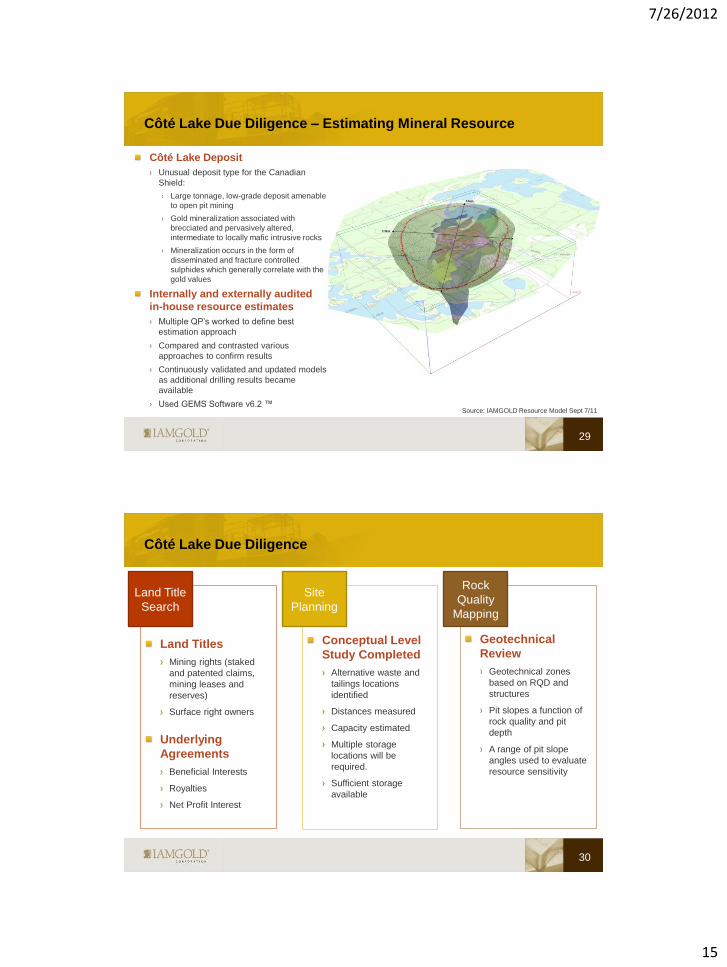
Côté Lake Due Diligence – Estimating Mineral Resource
29
Source: IAMGOLD Resource Model Sept 7/11
Côté Lake Deposit
Unusual deposit type for the Canadian
Shield:
Large tonnage, low-grade deposit amenable
to open pit mining
Gold mineralization associated with
brecciated and pervasively altered,
intermediate to locally mafic intrusive rocks
Mineralization occurs in the form of
disseminated and fracture controlled
sulphides which generally correlate with the
gold values
Internally and externally audited
in-house resource estimates
Multiple QP’s worked to define best
estimation approach
Compared and contrasted various
approaches to confirm results
Continuously validated and updated models
as additional drilling results became
available
Used GEMS Software v6.2 ™
30
Land Title
Search
Land Titles
Mining rights (staked
and patented claims,
mining leases and
reserves)
Surface right owners
Underlying
Agreements
Beneficial Interests
Royalties
Net Profit Interest
Site
Planning
Rock
Quality
Mapping
Conceptual Level
Study Completed
Alternative waste and
tailings locations
identified
Distances measured
Capacity estimated
Multiple storage
locations will be
required.
Sufficient storage
available
Geotechnical
Review
Geotechnical zones
based on RQD and
structures
Pit slopes a function of
rock quality and pit
depth
A range of pit slope
angles used to evaluate
resource sensitivity
Côté Lake Due Diligence

7/26/2012
16
Côté Lake Due Diligence – Schedules and Cash Flow Modeling
Many Schedule optimizations
Gold price sensitivities
Variable cut-off grade
Operating cost sensitivities
Stockpiling
Capitalized pre-stripping
Up-side alternatives
Permitting timeline
COMET Software ™
Many cash flow models
After tax
Acquisition costs
Tax pools
31
Côté Lake Due Diligence – Development Options
32
Mining
Conventional truck fleet,
or
Reduced truck fleet with
in-pit crushing and
conveying
Reduction in OPEX
Leverages hydro-electricity
infrastructure
Processing
Other
value
creating
options
On-site carbon in leach
(CIL), or
Flotation and off-site
processing of
concentrates
Reduction in capex
Simplified permitting
400 km to Doyon mill
Silver (0.5 to 1.0 g/t)
recovered during gold
refining
Copper recovery from
enriched areas
(0.05-0.08%)
7/26/2012
17
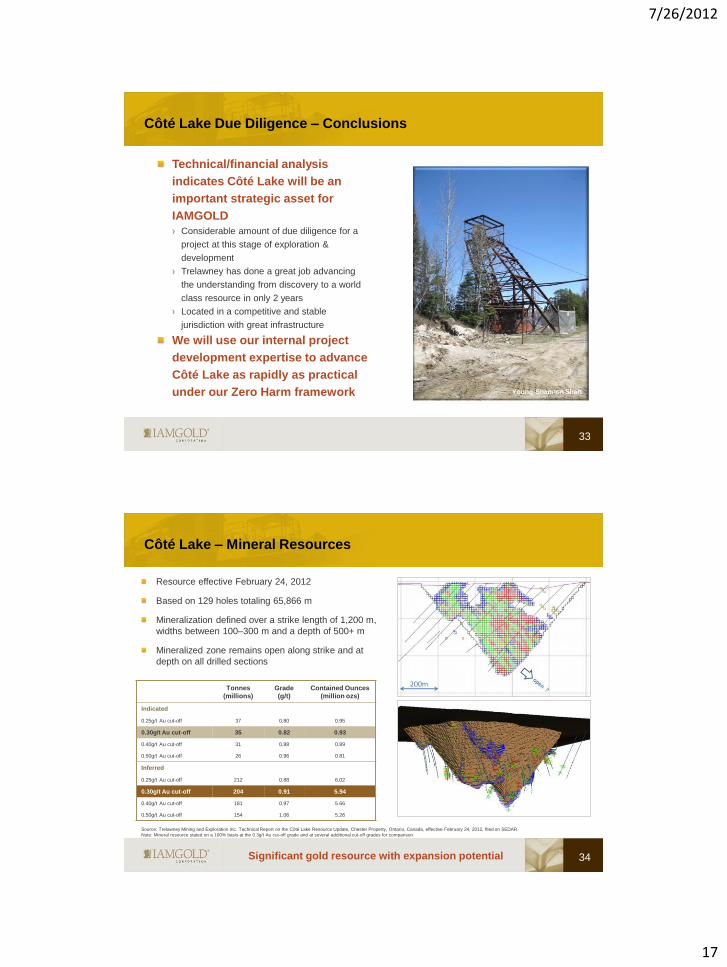
Côté Lake Due Diligence – Conclusions
33
Young-Shannon Shaft
Technical/financial analysis
indicates Côté Lake will be an
important strategic asset for
IAMGOLD
Considerable amount of due diligence for a
project at this stage of exploration &
development
Trelawney has done a great job advancing
the understanding from discovery to a world
class resource in only 2 years
Located in a competitive and stable
jurisdiction with great infrastructure
We will use our internal project
development expertise to advance
Côté Lake as rapidly as practical
under our Zero Harm framework
Côté Lake – Mineral Resources
34 Significant gold resource with expansion potential
Resource effective February 24, 2012
Based on 129 holes totaling 65,866 m
Mineralization defined over a strike length of 1,200 m,
widths between 100–300 m and a depth of 500+ m
Mineralized zone remains open along strike and at
depth on all drilled sections
Tonnes
(millions)
Grade
(g/t)
Contained Ounces
(million ozs)
Indicated
0.25g/t Au cut-off 37 0.80 0.95
0.30g/t Au cut-off 35 0.82 0.93
0.40g/t Au cut-off 31 0.88 0.89
0.50g/t Au cut-off 26 0.96 0.81
Inferred
0.25g/t Au cut-off 212 0.88 6.02
0.30g/t Au cut-off 204 0.91 5.94
0.40g/t Au cut-off 181 0.97 5.66
0.50g/t Au cut-off 154 1.06 5.26
Source: Trelawney Mining and Exploration Inc. Technical Report on the Côté Lake Resource Update, Chester Property, Ontario, Canada, effective February 24, 2012, filed on SEDAR.
Note: Mineral resource stated on a 100% basis at the 0.3g/t Au cut-off grade and at several additional cut-off grades for comparison.
7/26/2012
18
0
0.2
0.4
0.6
0.8
1
1.2
1.4
1.6
1.8
1 2 3 4 5 CôtéLake(0.5g/t)
7 8 9 CôtéLake(0.3g/t)
11 12 13 14 15 16 17
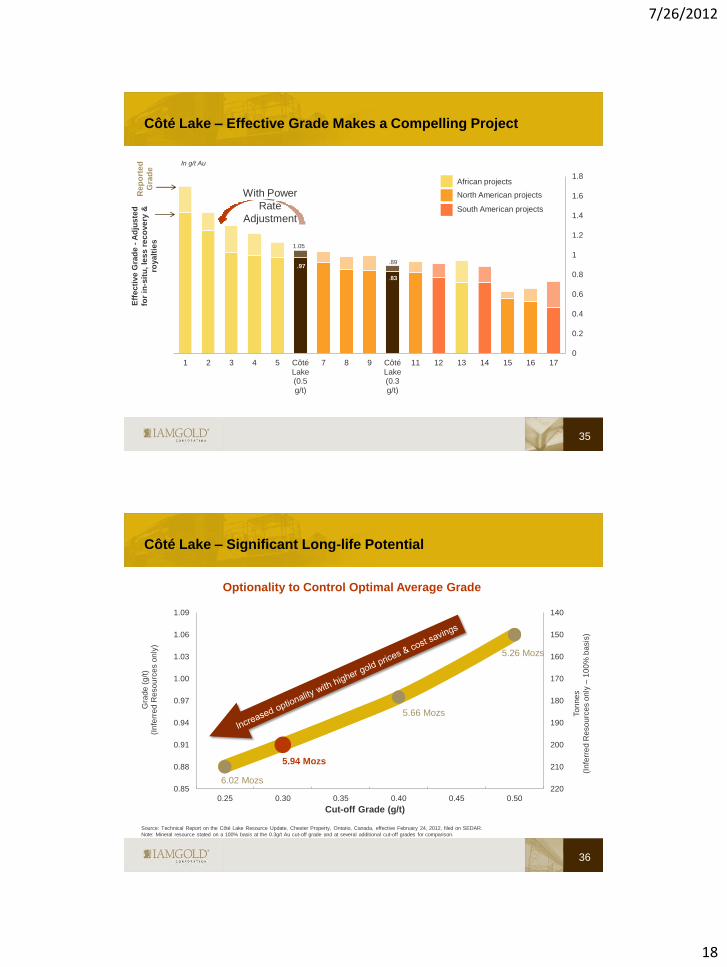
Côté Lake – Effective Grade Makes a Compelling Project
35
African projects
North American projects
South American projects
With Power
Rate
Adjustment
Eff
ec
tive
Gra
de
- A
dju
ste
d
for
in-s
itu
, le
ss
re
co
ve
ry &
roya
ltie
s
Rep
ort
ed
Gra
de
In g/t Au
1.05
.97 .89
.83
Côté Lake – Significant Long-life Potential
36
Optionality to Control Optimal Average Grade
140
150
160
170
180
190
200
210
2200.85
0.88
0.91
0.94
0.97
1.00
1.03
1.06
1.09
0.25 0.30 0.35 0.40 0.45 0.50
Gra
de
(g
/t)
(I
nfe
rre
d R
eso
urc
es o
nly
)
Cut-off Grade (g/t)
To
nn
es
(In
ferr
ed
Reso
urc
es o
nly
– 1
00
% b
asis
)
6.02 Mozs
5.94 Mozs
5.66 Mozs
5.26 Mozs
Source: Technical Report on the Côté Lake Resource Update, Chester Property, Ontario, Canada, effective February 24, 2012, filed on SEDAR.
Note: Mineral resource stated on a 100% basis at the 0.3g/t Au cut-off grade and at several additional cut-off grades for comparison.

7/26/2012
19
Côté Lake – Establishing Strong Community Relationships
The Mattagami First Nation and
the Flying Post First Nation
have been identified as
“Interested parties” with respect
to development of the Côté Lake
project
Both bands are members of the Wabun
Tribal Council
Trelawney has maintained a positive and
proactive relationship with First Nations
since commencing their activities in the
region.
IAMGOLD executives have already met
with local first Nations leaders
37
Côté Lake
Côté Lake – Drilling Progress to Date
38
Resource
Estimate (Feb. 24th)
Post Estimate
Disclosures
Assays
Pending
Holes 125 35 98
Metres 60,592 18,581 57,159
% of Metres 44% 14% 42%
Drilling metres more than doubled since last resource estimate
Post estimate drilling mostly designed to upgrade mineral resources
into the indicated category
Twelve active drill rigs
Expected to result in a resource update in Q4 2012
7/26/2012
20
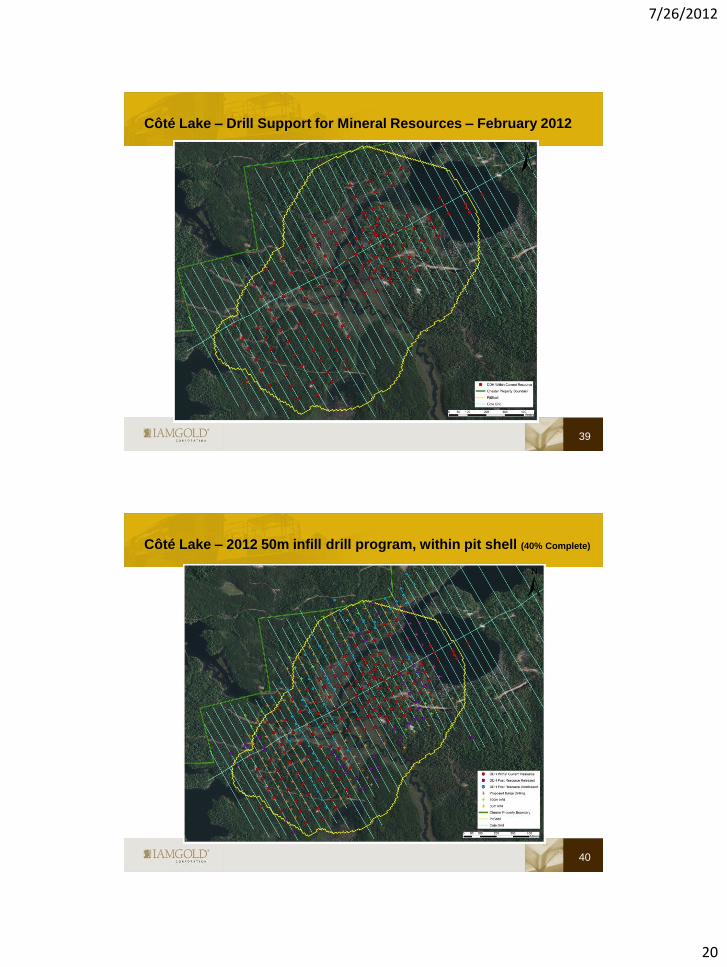
Côté Lake – Drill Support for Mineral Resources – February 2012
39
Côté Lake – 2012 50m infill drill program, within pit shell (40% Complete)
40
7/26/2012
21
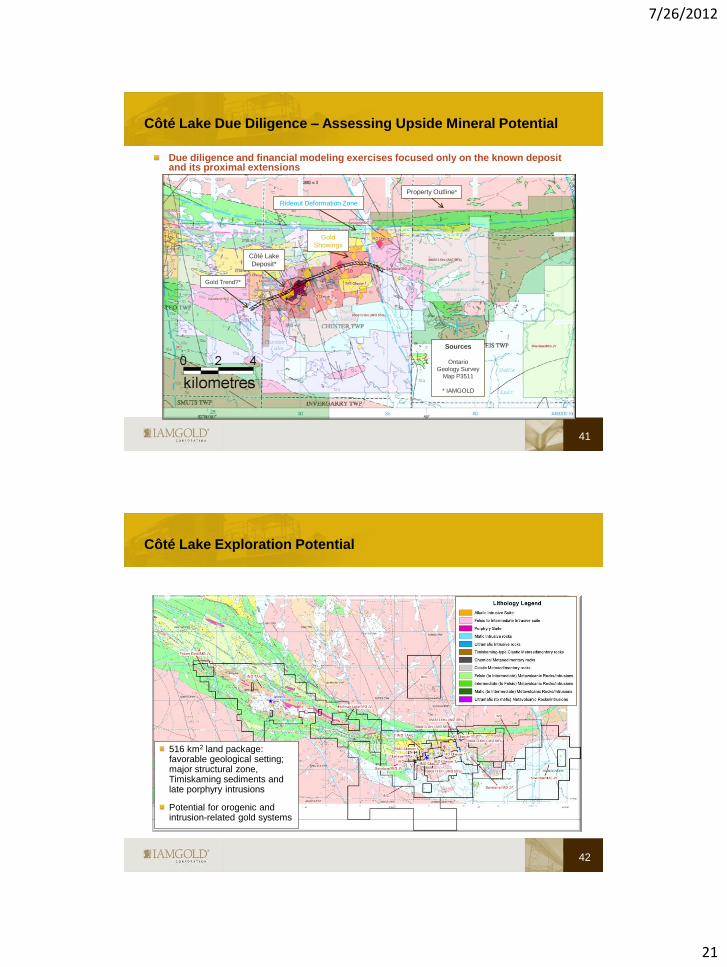
Côté Lake Due Diligence – Assessing Upside Mineral Potential
41
Côté Lake
Deposit*
Gold Trend?*
Sources
Ontario
Geology Survey
Map P3511
* IAMGOLD
Property Outline*
Gold
Showings
Rideout Deformation Zone
Due diligence and financial modeling exercises focused only on the known deposit and its proximal extensions
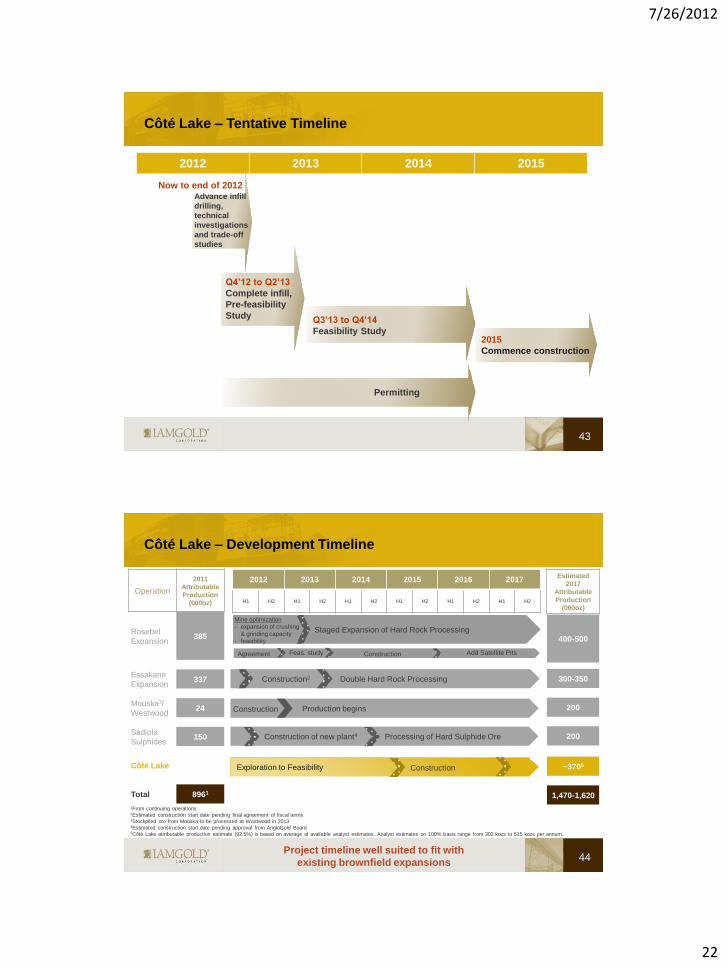
Côté Lake Exploration Potential
42
516 km2 land package: favorable geological setting; major structural zone, Timiskaming sediments and late porphyry intrusions
Potential for orogenic and intrusion-related gold systems
7/26/2012
22
Côté Lake – Tentative Timeline
43
2012 2013 2014 2015
Advance infill
drilling,
technical
investigations
and trade-off
studies
Now to end of 2012
Q4’12 to Q2’13
Complete infill,
Pre-feasibility
Study Q3’13 to Q4’14
Feasibility Study 2015
Commence construction
Permitting
Côté Lake – Development Timeline
44
2012 2013 2014 2015 2016 2017
H1 H2 H1 H2 H1 H2 H1 H2 H1 H2 H1 H2
Operation
2011
Attributable
Production
(000oz)
Rosebel
Expansion 385
Essakane
Expansion 337
Mouska3/
Westwood 24
Sadiola
Sulphides 150
Côté Lake
Total 8961
Estimated
2017
Attributable
Production
(000oz)
1From continuing operations 2Estimated construction start date pending final agreement of fiscal terms 3Stockpiled ore from Mouska to be processed at Westwood in 2013 4Estimated construction start date pending approval from AngloGold Board 5Côté Lake attributable production estimate (92.5%) is based on average of available analyst estimates. Analyst estimates on 100% basis range from 302 kozs to 515 kozs per annum.
400-500
300-350
200
200
~3705
1,470-1,620
Agreement
Construction
Construction of new plant4
Construction2
Mine optimization
- expansion of crushing
& grinding capacity
- feasibility
Feas. study Construction
Exploration to Feasibility
Double Hard Rock Processing
Production begins
Processing of Hard Sulphide Ore
Construction
Staged Expansion of Hard Rock Processing
Add Satellite Pits
Project timeline well suited to fit with
existing brownfield expansions

7/26/2012
23
Provides a geographically balanced portfolio
High level of confidence underscores core competencies
Optionality
Attractive acquisition cost ($74/oz)
Côté Lake – Key Messages
45
Côté Lake
TSX: IMG NYSE: IAG
Essakane
7/26/2012
24
Well run operation with short-term payback
Aggressive exploration program to prove up
additional resources
Expanding throughput
Essakane – Key Messages
47
Essakane
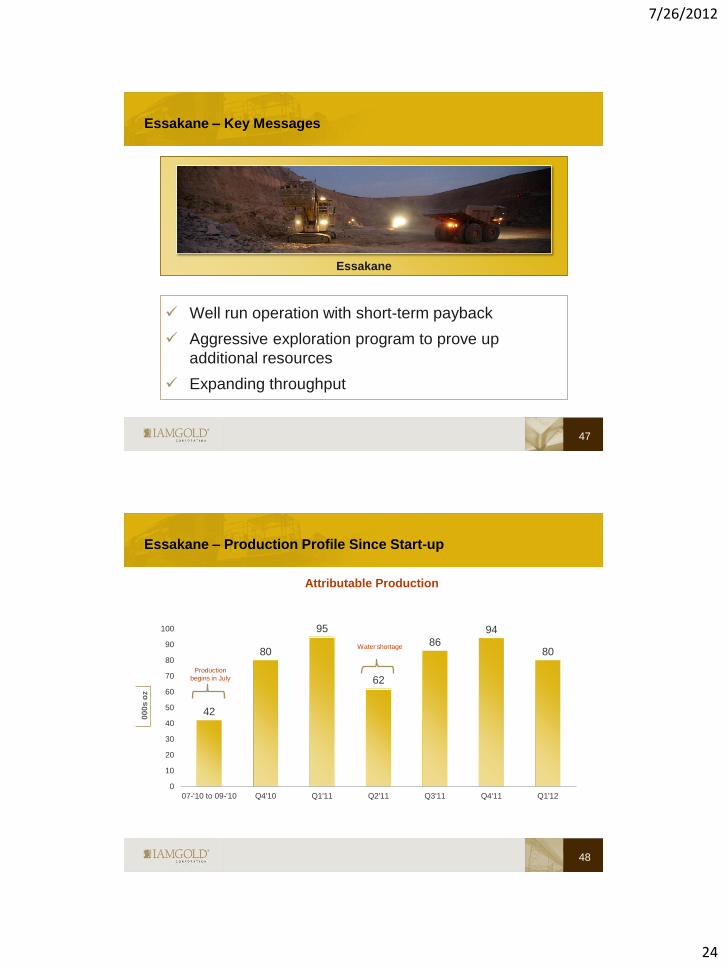
Essakane – Production Profile Since Start-up
48
42
80
95
62
86
94
80
0
10
20
30
40
50
60
70
80
90
100
07-'10 to 09-'10 Q4'10 Q1'11 Q2'11 Q3'11 Q4'11 Q1'12
00
0s
oz
Water shortage
Production
begins in July
Attributable Production
7/26/2012
25
Essakane – Operating Well
Throughput rates (soft rock)
Initial feasibility mill throughput 7.5 Mtpa
Constructed nameplate mill throughput 9.0 Mtpa
Current annualized running rate (2012 May YTD) 10.7 Mtpa
Plant Availability 92.1%
Resource Model to Mill Reconciliation ± 5%
Water Storage Status
Additional water storage facility (BWS #3 @ 2.9M m3 capacity) completed Oct. ‘11
and partially filled for 2011-2012 dry season
Water pumping capacity doubled during 2011 to permit faster water capture
Enhanced water management practices to minimize consumption per tonne of ore
processed
Water storage system more than sufficient for expanded mill capacity on hard rock
49
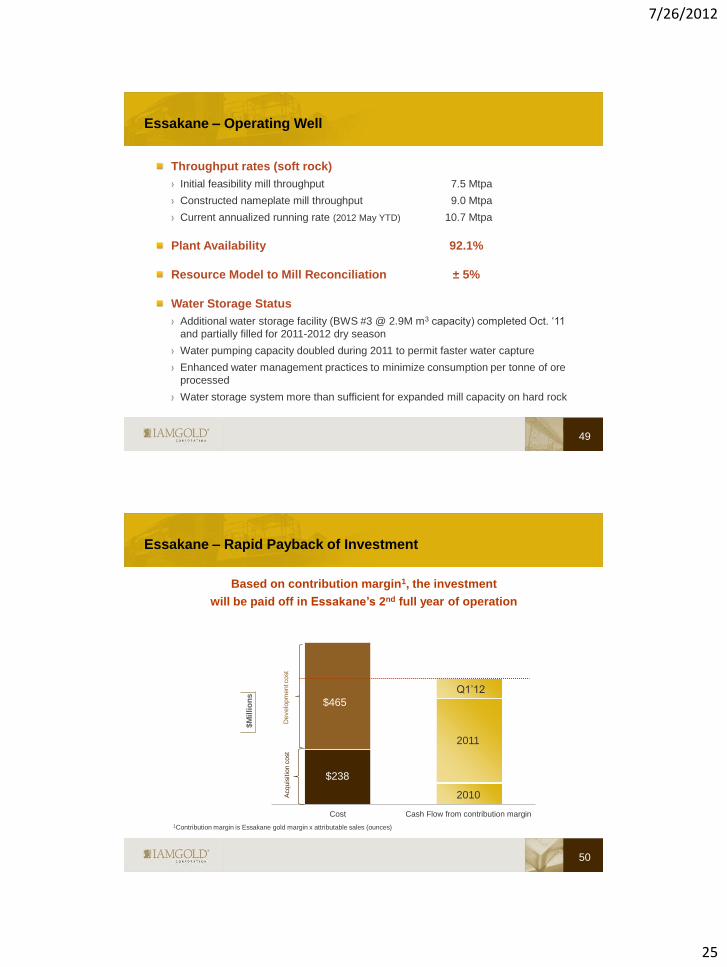
Essakane – Rapid Payback of Investment
50
Cost Cash Flow from contribution margin
Acquis
itio
n c
ost
Develo
pm
ent cost
Based on contribution margin1, the investment
will be paid off in Essakane’s 2nd full year of operation
1Contribution margin is Essakane gold margin x attributable sales (ounces)
$238
$M
illi
on
s
$465
2010
2011
Q1’12

7/26/2012
26
Essakane – Expanding Mine Capacity to Double Hard Rock
Processing
H2/12 - Final agreement on fiscal terms
H2/12 - Construction start
H2/13 - Commissioning of expanded plant
51
Completed development study in 2011
Hard rock processing - to double from
5.4Mtpa to 10.8Mtpa
Mining rate - to increase to 50-55 Mtpa by
2014, remaining at that level for 6 years
before gradually declining
Requires investment in additional
grinding and power generating
capacity
Pre-crushing circuit and ore handling system
SAG and ball mill grinding line
Pebble crushing circuit for both grinding lines
Additional power generation for hard ore
River diversion
Essakane – Development Timeline
52
2012 2013 2014 2015 2016 2017
H1 H2 H1 H2 H1 H2 H1 H2 H1 H2 H1 H2
Operation
2011
Attributable
Production
(000oz)
Rosebel
Expansion 385
Essakane
Expansion 337
Mouska3/
Westwood 24
Sadiola
Sulphides 150
Côté Lake
Total 8961
Estimated
2017
Attributable
Production
(000oz)
1From continuing operations 2Estimated construction start date pending final agreement of fiscal terms 3Stockpiled ore from Mouska to be processed at Westwood in 2013 4Estimated construction start date pending approval from AngloGold Board 5Côté Lake attributable production estimate (92.5%) is based on average of available analyst estimates. Analyst estimates on 100% basis range from 302 kozs to 515 kozs per annum.
400-500
300-350
200
200
~3705
1,470-1,620
Agreement
Construction
Construction of new plant4
Construction2
Feas. study Construction
Double Hard Rock Processing
Production begins
Processing of Hard Sulphide Ore
Add Satellite Pits
Staged Expansion of Hard Rock Processing
Exploration to Feasibility Construction
Mine optimization
- expansion of crushing
& grinding capacity
- feasibility
7/26/2012
27
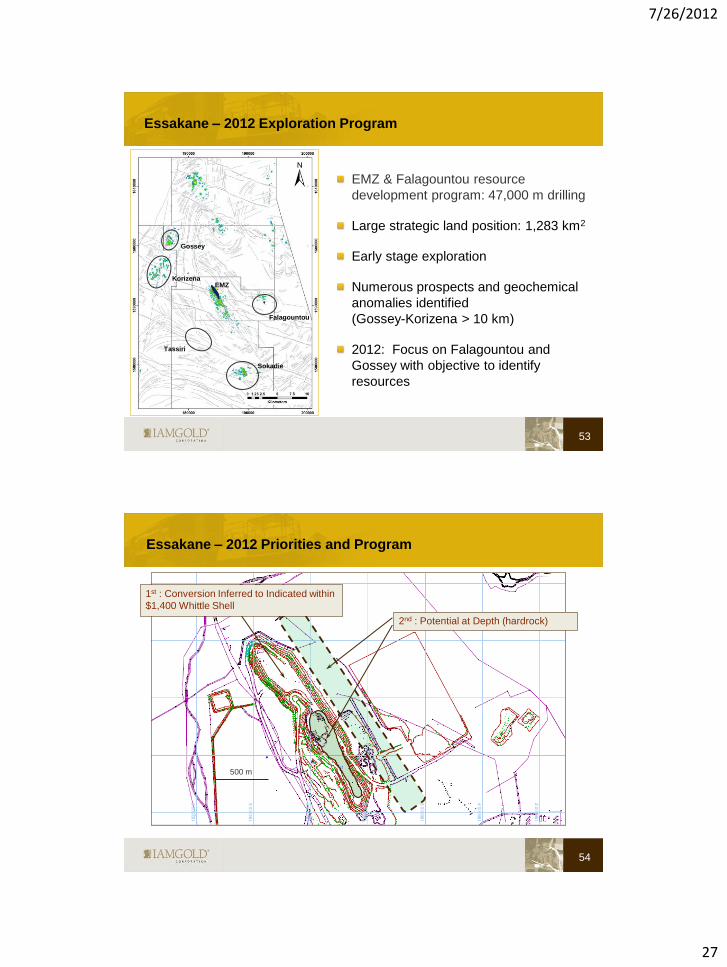
Essakane – 2012 Exploration Program
53
EMZ & Falagountou resource
development program: 47,000 m drilling
Large strategic land position: 1,283 km2
Early stage exploration
Numerous prospects and geochemical
anomalies identified
(Gossey-Korizena > 10 km)
2012: Focus on Falagountou and
Gossey with objective to identify
resources
Gossey
Korizena
Falagountou
Tassiri
Sokadie
EMZ
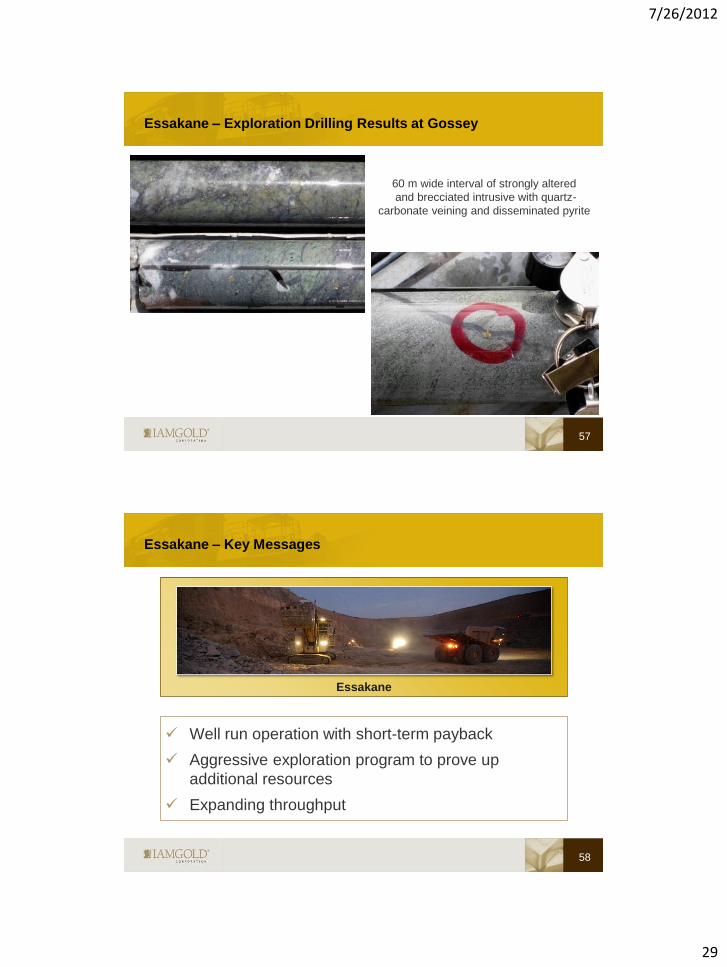
2nd : Potential at Depth (hardrock)
1st : Conversion Inferred to Indicated within
$1,400 Whittle Shell
500 m
Essakane – 2012 Priorities and Program
54

7/26/2012
28
55
Essakane –
2011 Exploration Results and 2012 Program at Falagountou
Artisanal
Workings Au (gram-metre)
< 2
2 – 10
> 10
Cut-off 0.5g/t
IAMGOLD Drilling
RC holes
DD holes
2012 RC program
173 holes = 20,760 m
Completed - Assays Pending
Falagountou Resource (Dec 31, 2011)
Indicated: 345,000 oz @ 1.31 g/t Au
Inferred: 91,000 oz @ 1.41 g/t Au
Resource Delineation and Expansion Drilling
8 km to Essakane plant New Mineralization Trend
1.0 km long, open
500 m
Source for Essakane’s latest
resource update: February 23,
2012 news release
« IAMGOLD Continuing Gold
Operations Post 2011
Reserves of 13.3 Million
Ounces and Measured and
Indicated Resources of 18.2
Million Ounces »
56
Essakane – Exploration Drilling Results at Gossey
Gossey
Infill drilling on 100 m x 100 m grid (19,950 m)
Phase 1 RC program in progress (200 x 100 m)
Fast-track resource delineation
Gossey Southeast
Aircore drilling on 100 m x 50 m grid
Program completed (gridded gold results shown)
Accelerate design of subsequent drilling
Concurrent 4,450 m diamond drilling program
Following-up positive 2010 results
Gossey
Korizena
Lao Gountoure 2
Gossey SE
Artisanal
Workings
Legend
Driling Results Au (gram-metre)
< 5.0
5.0 – 10.0
10.0 – 25.0
> 25.0
█ - Completed
Assays Pending
500 m
7/26/2012
29
57
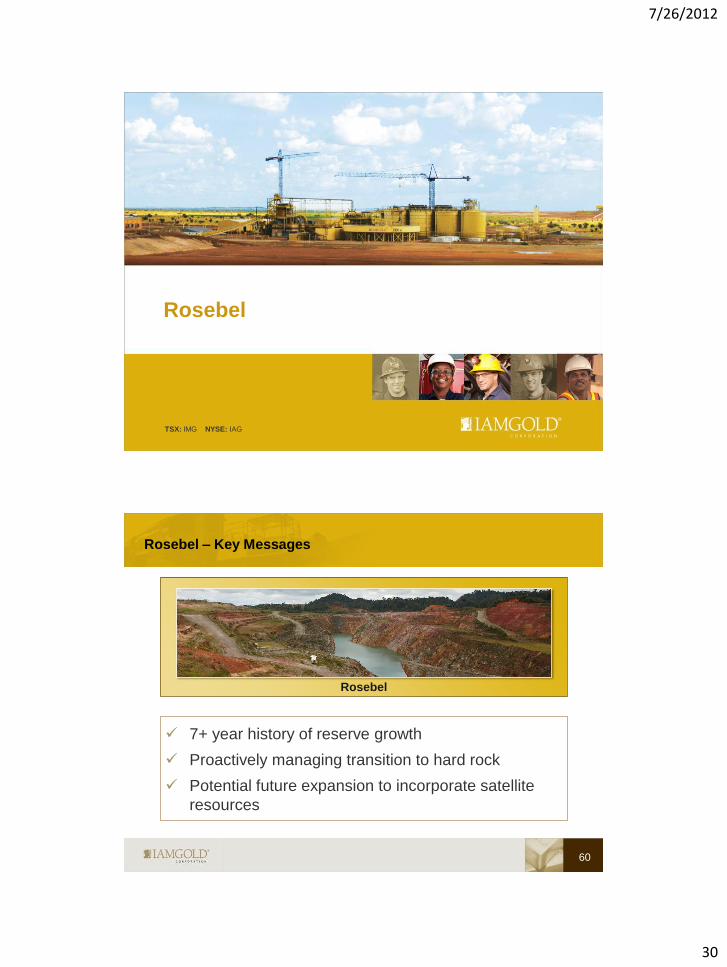
Essakane – Exploration Drilling Results at Gossey
60 m wide interval of strongly altered
and brecciated intrusive with quartz-
carbonate veining and disseminated pyrite
Well run operation with short-term payback
Aggressive exploration program to prove up
additional resources
Expanding throughput
Essakane – Key Messages
58
Essakane
7/26/2012
30
TSX: IMG NYSE: IAG
Rosebel
7+ year history of reserve growth
Proactively managing transition to hard rock
Potential future expansion to incorporate satellite
resources
Rosebel – Key Messages
60
Rosebel
7/26/2012
31
19 389 735
1,053 1,371
1,730 2,142
2,668 3,073
2,382
2,537
3,212
3,817 3,403
3,716
5,094
6,202 6,031
2003 2004 2005 2006 2007 2008 2009 2010 2011
Mineral Reserves (In Situ)
Cumulative Production
122
Rosebel – Long History of Building Reserves and Production
61
00
0s
oz 320
2,401
2,926
3,947
4,870 4,774
5,446
7,236
8,870 9,104
*on 100% basis
Rosebel – Staged Expansion of Hard Rock Processing
62
Metallurgical testwork completed in 2011:
Proportion of hard rock in mill feed will
increase from 15% to 80% by 2016
Investment in additional crushing and
grinding equipment
Maintain mill throughput at 14 Mtpa
Higher than rate in recent years
3rd ball mill in construction
Expanded gravity circuit
Further investment in additional and larger
equipment
Increase annual mining capacity from 55
Mtpa to 100 Mtpa by 2016
Complete feasibility study providing greater
design detail – by Q1 2013
Increasing mining capacity to optimize mill feed grades

7/26/2012
32
63
Power
Assessing alternative power supply scenarios
Opportunities for partnership with government on expansion of hydropower generating
capacity
Mining
Larger equipment, economies of scale
Reviewing alternative ore transport from southern ore bodies
Improved rainy season operating practices
Processing
Optimize grinding power and stabilize feed variability
New pre-crusher and larger pebble crusher
New SAG liner design
Automated control system
Improved Gold Recovery including new gravity circuit
Rosebel – Continuous Improvement
Improving stability in mining and processing
Rosebel – Good Expansion Potential
64
ROSEBEL Suriname
Heads of Agreement with Government of Suriname Dec. ’11 to support significant expansion at Rosebel
Definitive Agreement expected this year
7/26/2012
33
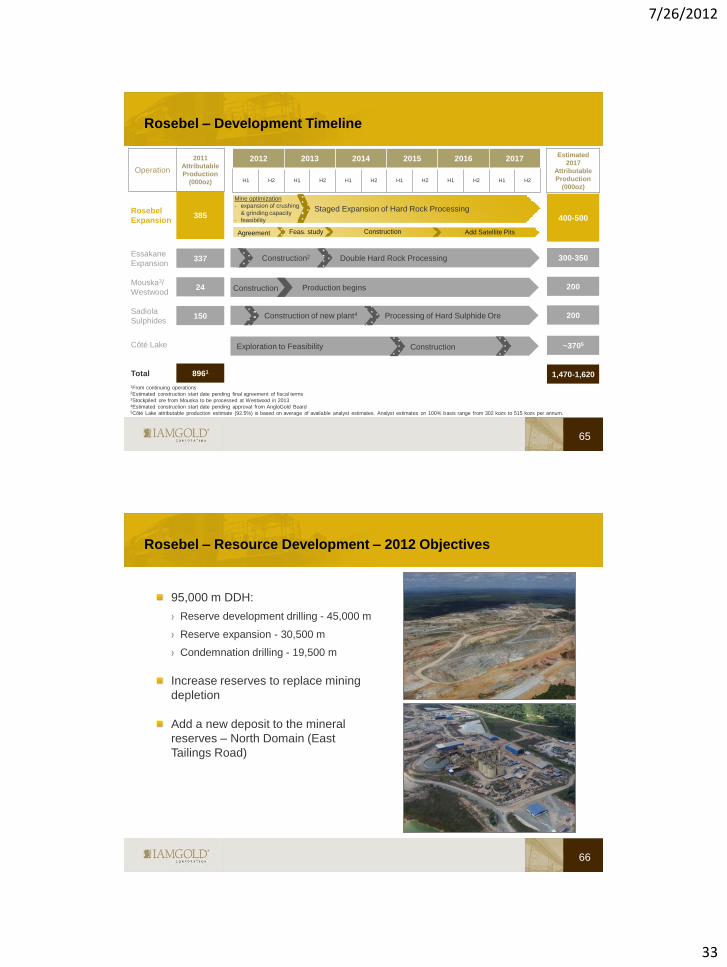
Rosebel – Development Timeline
65
2012 2013 2014 2015 2016 2017
H1 H2 H1 H2 H1 H2 H1 H2 H1 H2 H1 H2
Operation
2011
Attributable
Production
(000oz)
Rosebel
Expansion 385
Essakane
Expansion 337
Mouska3/
Westwood 24
Sadiola
Sulphides 150
Côté Lake
Total 8961
Estimated
2017
Attributable
Production
(000oz)
1From continuing operations 2Estimated construction start date pending final agreement of fiscal terms 3Stockpiled ore from Mouska to be processed at Westwood in 2013 4Estimated construction start date pending approval from AngloGold Board 5Côté Lake attributable production estimate (92.5%) is based on average of available analyst estimates. Analyst estimates on 100% basis range from 302 kozs to 515 kozs per annum.
400-500
300-350
200
200
~3705
1,470-1,620
Agreement
Construction
Construction of new plant4
Construction2
Feas. study Construction
Exploration to Feasibility
Double Hard Rock Processing
Production begins
Processing of Hard Sulphide Ore
Construction
Add Satellite Pits
Staged Expansion of Hard Rock Processing
Mine optimization
- expansion of crushing
& grinding capacity
- feasibility
95,000 m DDH:
Reserve development drilling - 45,000 m
Reserve expansion - 30,500 m
Condemnation drilling - 19,500 m
Increase reserves to replace mining
depletion
Add a new deposit to the mineral
reserves – North Domain (East
Tailings Road)
66
Rosebel – Resource Development – 2012 Objectives
7/26/2012
34
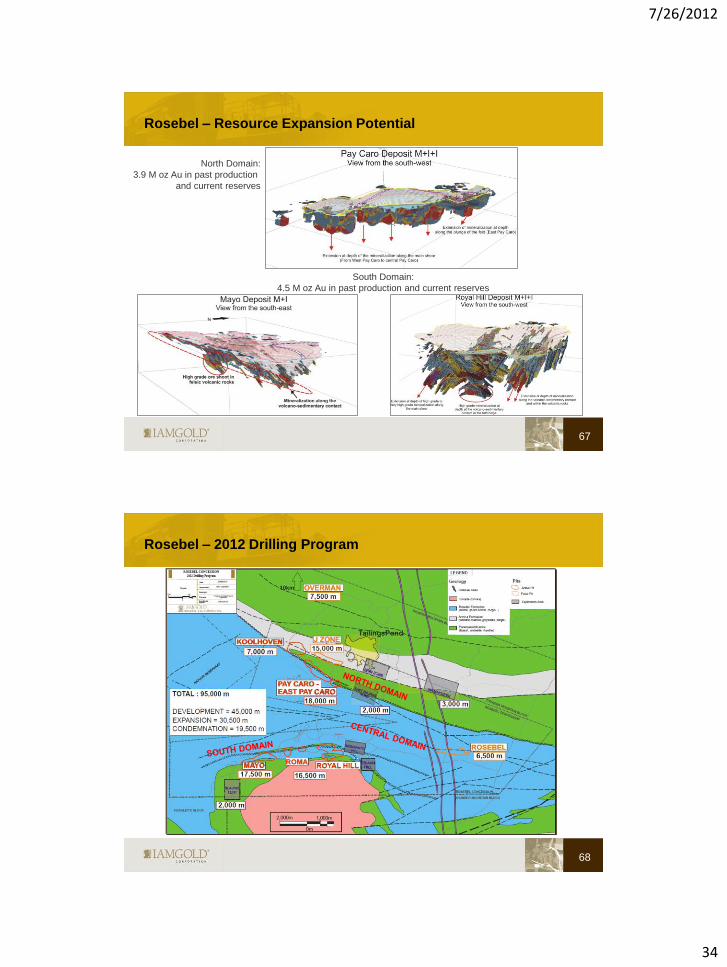
Rosebel – Resource Expansion Potential
67
North Domain:
3.9 M oz Au in past production
and current reserves
South Domain:
4.5 M oz Au in past production and current reserves
68
2012 – Drilling Program
Rosebel – 2012 Drilling Program

7/26/2012
35
Rosebel – District Exploration Potential
Key Points
Large land area still to be explored
Discoveries such as Overman,
Mamacreek and Koemboe confirm
regional exploration potential
New techniques being implemented
Rosebel Concessions
Mechanised auger over alluvials
7,000 m diamond drilling on known mineralised trends
3,000 m diamond drilling at Koemboe
Charmagne
1,000 m extension drilling
2,000 m on new targets
Charmagne West (NEW)
Stream sediments & mapping
Mechanical auger
69
Mamacreek
Saramacca
Rosebel Extension
Blauwe Tent
Charmagne
Mayo Extension
Charmagne West
Overman
Koolhoven Extension
ROSEBEL
OPERATION
Koemboe
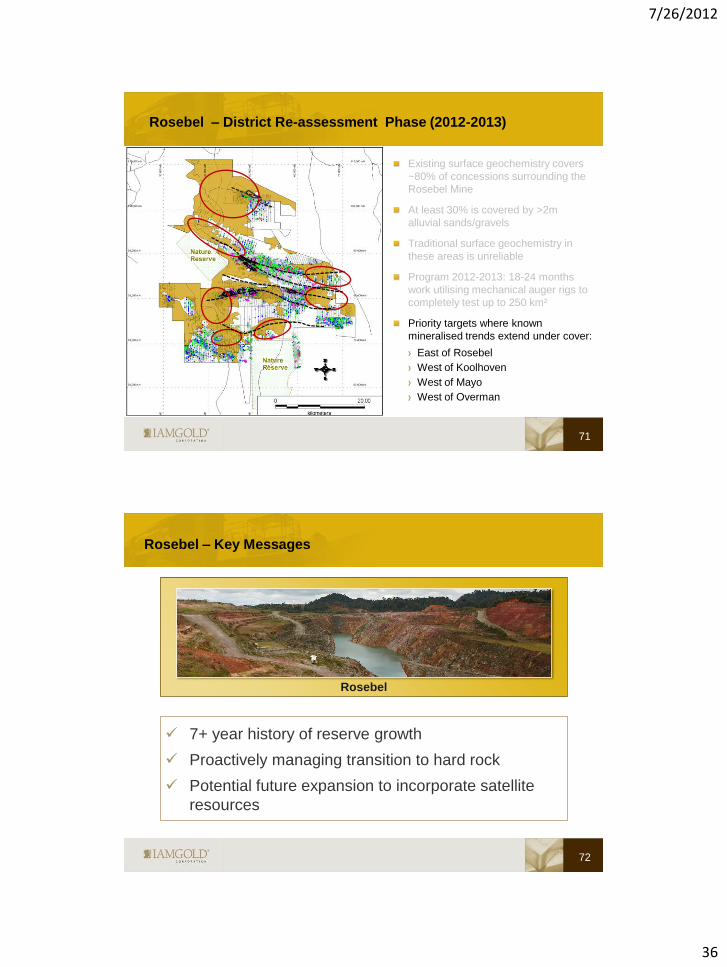
Rosebel – District Re-assessment Phase (2012-2013)
Existing surface geochemistry covers
~80% of concessions surrounding the
Rosebel Mine
At least 30% is covered by >2m
alluvial sands/gravels
Traditional surface geochemistry in
these areas is unreliable
Program 2012-2013: 18-24 months
work utilising mechanical auger rigs to
completely test up to 250 km²
70
7/26/2012
36
Existing surface geochemistry covers
~80% of concessions surrounding the
Rosebel Mine
At least 30% is covered by >2m
alluvial sands/gravels
Traditional surface geochemistry in
these areas is unreliable
Program 2012-2013: 18-24 months
work utilising mechanical auger rigs to
completely test up to 250 km²
Priority targets where known
mineralised trends extend under cover:
East of Rosebel
West of Koolhoven
West of Mayo
West of Overman
Rosebel – District Re-assessment Phase (2012-2013)
71
7+ year history of reserve growth
Proactively managing transition to hard rock
Potential future expansion to incorporate satellite
resources
Rosebel – Key Messages
72
Rosebel

7/26/2012
37
TSX: IMG NYSE: IAG
Sadiola
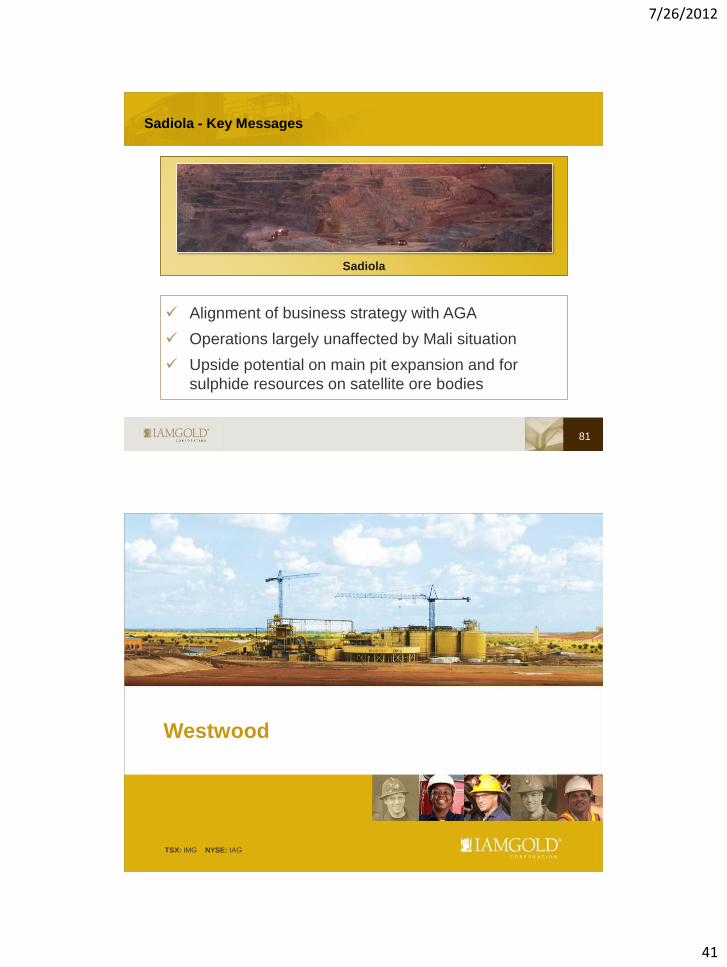
Alignment of business strategy with AGA
Operations largely unaffected by Mali situation
Upside potential on main pit expansion and for
sulphide resources on satellite ore bodies
Sadiola – Key Messages
74
Sadiola

7/26/2012
38
75
Sadiola – Expansion in Main Pit
Mining hard sulphide ore will double mine life
Based on Interim FS Base Case Expansion
Mine Life 8 years 15 years
Processing Rate 4.6-5.0 Mtpa 7.5-8.5 Mtpa
Nominal Mining Rate 25-30 Mtpa 50-60 Mtpa
declining to 20 Mtpa
Strip Ratio
(Waste:Ore) 4.5 3.4
Annual Gold
Production
300-325 koz
declining to 200-250 koz 350-450 koz
Sadiola Sulphide Project
IAMGOLD initiated the
sulphide project which will
increase the throughput,
annual production and
extend mine life
Sadiola – Alignment with AngloGold Ashanti (AGA)
76
Construction effort to be led by IAMGOLD
Participation of some AGA technical staff on the project team.
Interface and coordination with Sadiola/Yatela operating teams
Multiple projects generate equipment cost savings
Ongoing engineering and major equipment procurement
Mining
Sadiola Sulphide project will be based on the owner mining scenario
Lower operating cost and full realization of benefits from continuous
improvement
Greater control
Opportunity to review mining execution model for remaining oxide
reserves
Equipment will start to arrive late 2012 for pre-stripping
7/26/2012
39
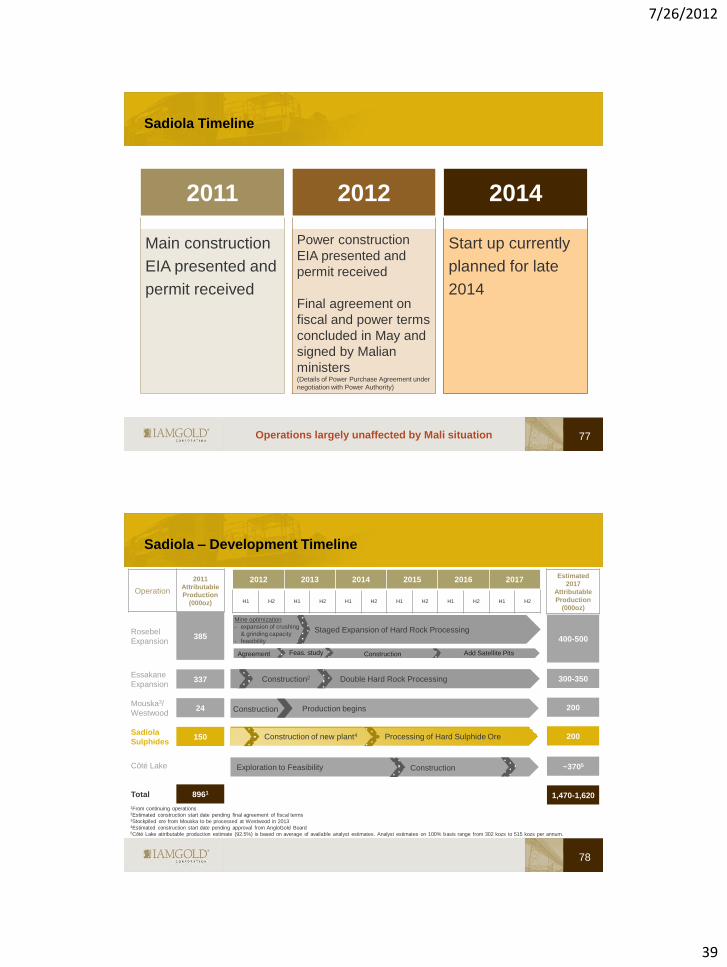
Sadiola Timeline
77
2011
Main construction
EIA presented and
permit received
2012
Power construction
EIA presented and
permit received
Final agreement on
fiscal and power terms
concluded in May and
signed by Malian
ministers (Details of Power Purchase Agreement under
negotiation with Power Authority)
2014
Start up currently
planned for late
2014
Operations largely unaffected by Mali situation
Sadiola – Development Timeline
78
2012 2013 2014 2015 2016 2017
H1 H2 H1 H2 H1 H2 H1 H2 H1 H2 H1 H2
Operation
2011
Attributable
Production
(000oz)
Rosebel
Expansion 385
Essakane
Expansion 337
Mouska3/
Westwood 24
Sadiola
Sulphides 150
Côté Lake
Total 8961
Estimated
2017
Attributable
Production
(000oz)
1From continuing operations 2Estimated construction start date pending final agreement of fiscal terms 3Stockpiled ore from Mouska to be processed at Westwood in 2013 4Estimated construction start date pending approval from AngloGold Board 5Côté Lake attributable production estimate (92.5%) is based on average of available analyst estimates. Analyst estimates on 100% basis range from 302 kozs to 515 kozs per annum.
400-500
300-350
200
200
~3705
1,470-1,620
Agreement
Construction
Construction of new plant4
Construction2
Feas. study Construction
Exploration to Feasibility
Double Hard Rock Processing
Production begins
Processing of Hard Sulphide Ore
Construction
Add Satellite Pits
Staged Expansion of Hard Rock Processing
Mine optimization
- expansion of crushing
& grinding capacity
- feasibility

7/26/2012
40
Sadiola – Exploration Potential
History of ongoing discovery and
expanding resources
“A project that just keeps giving”
3 years of systematic exploration for
oxide resources (nearing an end)
Sadiola: Transition plan to sulphide
mining in 2014
Develop sulphide targets:
Sadiola sulphide project
Regional evaluation
79
10 km Oxide targets
Sadiola Sulphide Project – 2012 Exploration program
80
Longitudinal Section (Average grade iso-contours)
Isometric view of the Sadiola deposit
6 diamond holes to test interpreted high grade plunge of mineralisation below SSP pit
Zone intersected at depth – Results under review
Lower limit of the Deep
Sulphide pit (SSP)
7/26/2012
41
Alignment of business strategy with AGA
Operations largely unaffected by Mali situation
Upside potential on main pit expansion and for
sulphide resources on satellite ore bodies
Sadiola - Key Messages
81
Sadiola
TSX: IMG NYSE: IAG
Westwood
7/26/2012
42
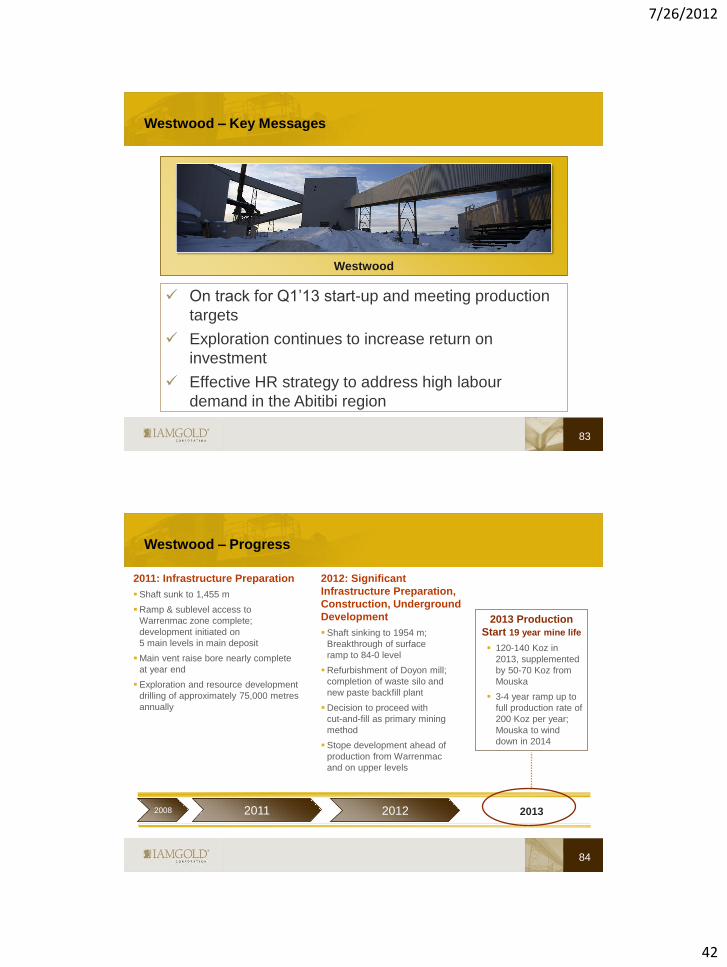
On track for Q1’13 start-up and meeting production
targets
Exploration continues to increase return on
investment
Effective HR strategy to address high labour
demand in the Abitibi region
Westwood – Key Messages
83
Westwood
Westwood – Progress
84
2013
2011: Infrastructure Preparation
Shaft sunk to 1,455 m
Ramp & sublevel access to
Warrenmac zone complete;
development initiated on
5 main levels in main deposit
Main vent raise bore nearly complete
at year end
Exploration and resource development
drilling of approximately 75,000 metres
annually
2013 Production
Start 19 year mine life
120-140 Koz in
2013, supplemented
by 50-70 Koz from
Mouska
3-4 year ramp up to
full production rate of
200 Koz per year;
Mouska to wind
down in 2014
2008 2011 2012
2012: Significant
Infrastructure Preparation,
Construction, Underground
Development
Shaft sinking to 1954 m;
Breakthrough of surface
ramp to 84-0 level
Refurbishment of Doyon mill;
completion of waste silo and
new paste backfill plant
Decision to proceed with
cut-and-fill as primary mining
method
Stope development ahead of
production from Warrenmac
and on upper levels
7/26/2012
43
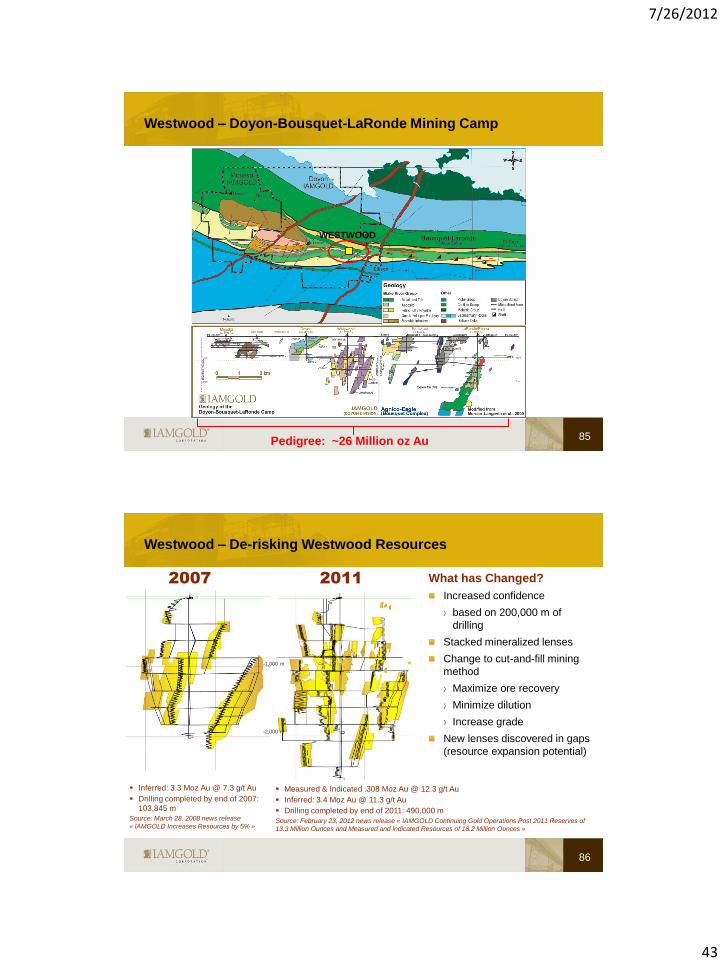
Westwood – Doyon-Bousquet-LaRonde Mining Camp
85
WESTWOOD
Pedigree: ~26 Million oz Au
Westwood – De-risking Westwood Resources
86
2007 2011
Inferred: 3.3 Moz Au @ 7.3 g/t Au
Drilling completed by end of 2007:
103,845 m
Source: March 28, 2008 news release
« IAMGOLD Increases Resources by 5% »
Measured & Indicated .308 Moz Au @ 12.3 g/t Au
Inferred: 3.4 Moz Au @ 11.3 g/t Au
Drilling completed by end of 2011: 490,000 m
Source: February 23, 2012 news release « IAMGOLD Continuing Gold Operations Post 2011 Reserves of
13.3 Million Ounces and Measured and Indicated Resources of 18.2 Million Ounces »
-1,000 m
-2,000 m
What has Changed?
Increased confidence
based on 200,000 m of
drilling
Stacked mineralized lenses
Change to cut-and-fill mining
method
Maximize ore recovery
Minimize dilution
Increase grade
New lenses discovered in gaps
(resource expansion potential)
7/26/2012
44
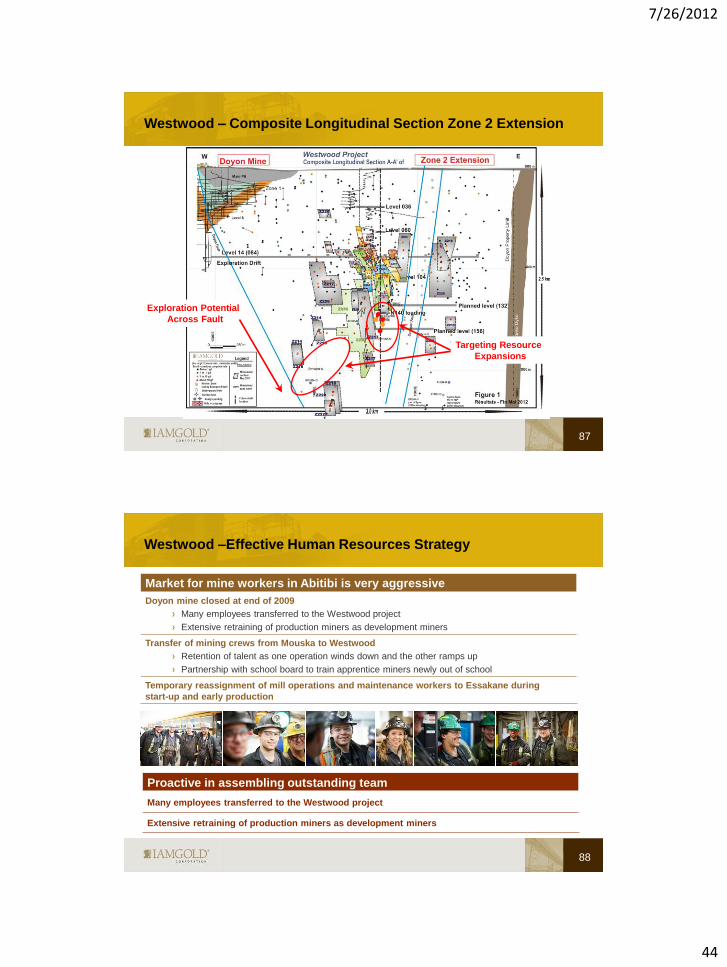
Westwood – Composite Longitudinal Section Zone 2 Extension
87
Targeting Resource
Expansions
Exploration Potential
Across Fault
Westwood –Effective Human Resources Strategy
88
Market for mine workers in Abitibi is very aggressive
Doyon mine closed at end of 2009
Many employees transferred to the Westwood project
Extensive retraining of production miners as development miners
Transfer of mining crews from Mouska to Westwood
Retention of talent as one operation winds down and the other ramps up
Partnership with school board to train apprentice miners newly out of school
Temporary reassignment of mill operations and maintenance workers to Essakane during
start-up and early production
Proactive in assembling outstanding team
Many employees transferred to the Westwood project
Extensive retraining of production miners as development miners
7/26/2012
45
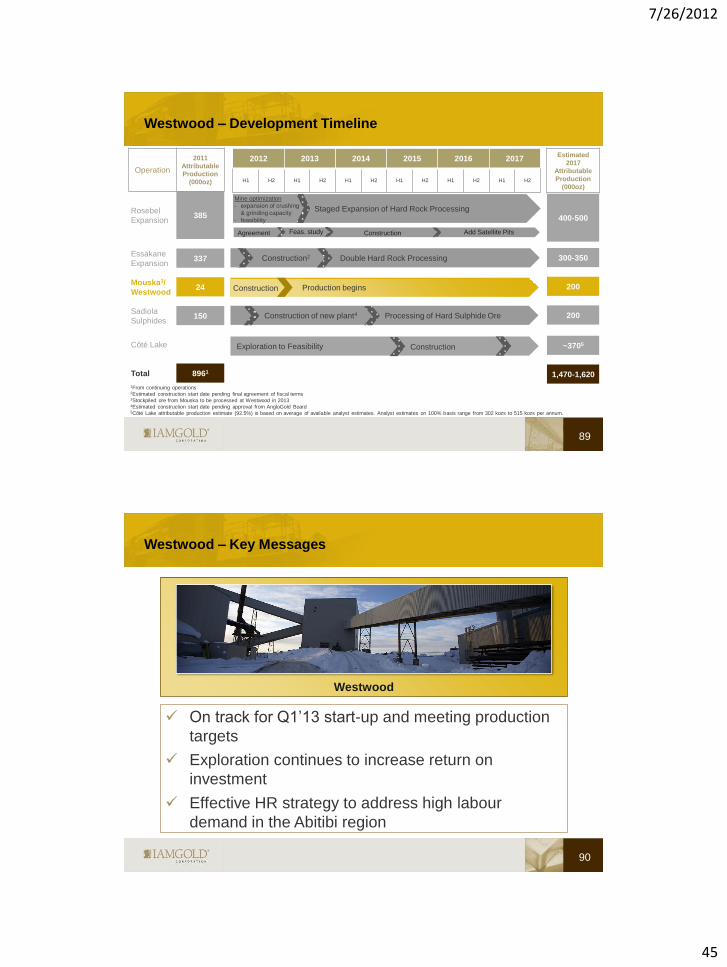
Westwood – Development Timeline
89
2012 2013 2014 2015 2016 2017
H1 H2 H1 H2 H1 H2 H1 H2 H1 H2 H1 H2
Operation
2011
Attributable
Production
(000oz)
Rosebel
Expansion 385
Essakane
Expansion 337
Mouska3/
Westwood 24
Sadiola
Sulphides 150
Côté Lake
Total 8961
Estimated
2017
Attributable
Production
(000oz)
1From continuing operations 2Estimated construction start date pending final agreement of fiscal terms 3Stockpiled ore from Mouska to be processed at Westwood in 2013 4Estimated construction start date pending approval from AngloGold Board 5Côté Lake attributable production estimate (92.5%) is based on average of available analyst estimates. Analyst estimates on 100% basis range from 302 kozs to 515 kozs per annum.
400-500
300-350
200
200
~3705
1,470-1,620
Agreement
Construction
Construction of new plant4
Construction2
Feas. study Construction
Double Hard Rock Processing
Production begins
Processing of Hard Sulphide Ore
Add Satellite Pits
Staged Expansion of Hard Rock Processing
Exploration to Feasibility Construction
Mine optimization
- expansion of crushing
& grinding capacity
- feasibility
On track for Q1’13 start-up and meeting production
targets
Exploration continues to increase return on
investment
Effective HR strategy to address high labour
demand in the Abitibi region
Westwood – Key Messages
90
Westwood
7/26/2012
46
TSX: IMG NYSE: IAG
Greenfields Exploration
91
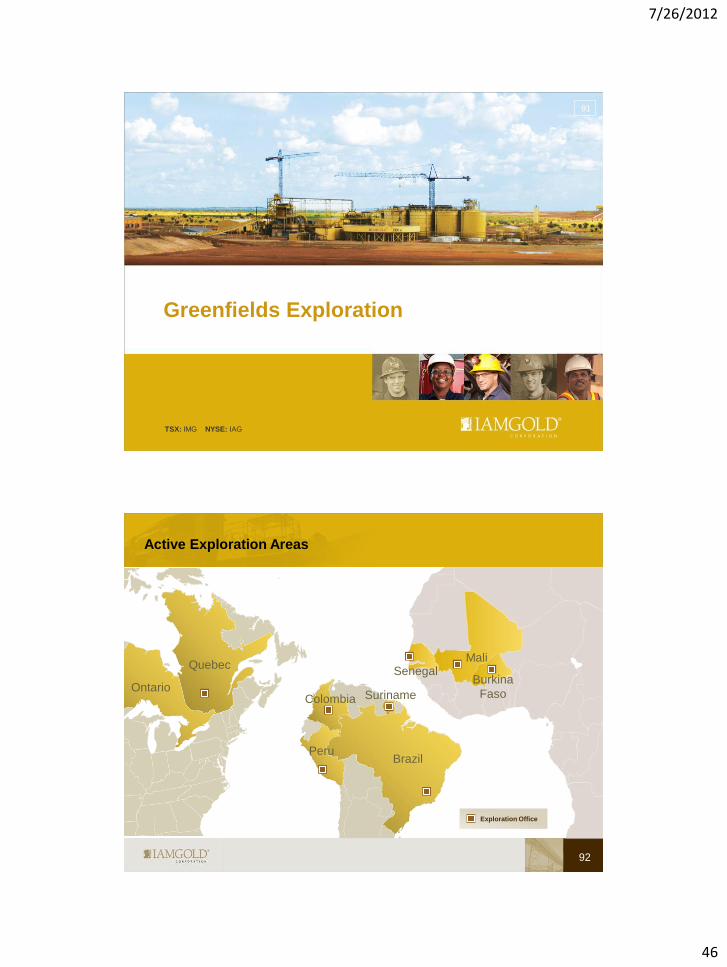
Active Exploration Areas
92
Quebec Mali
Burkina
Faso
Senegal
Exploration Office
Brazil
Colombia
Peru
Suriname Ontario
7/26/2012
47
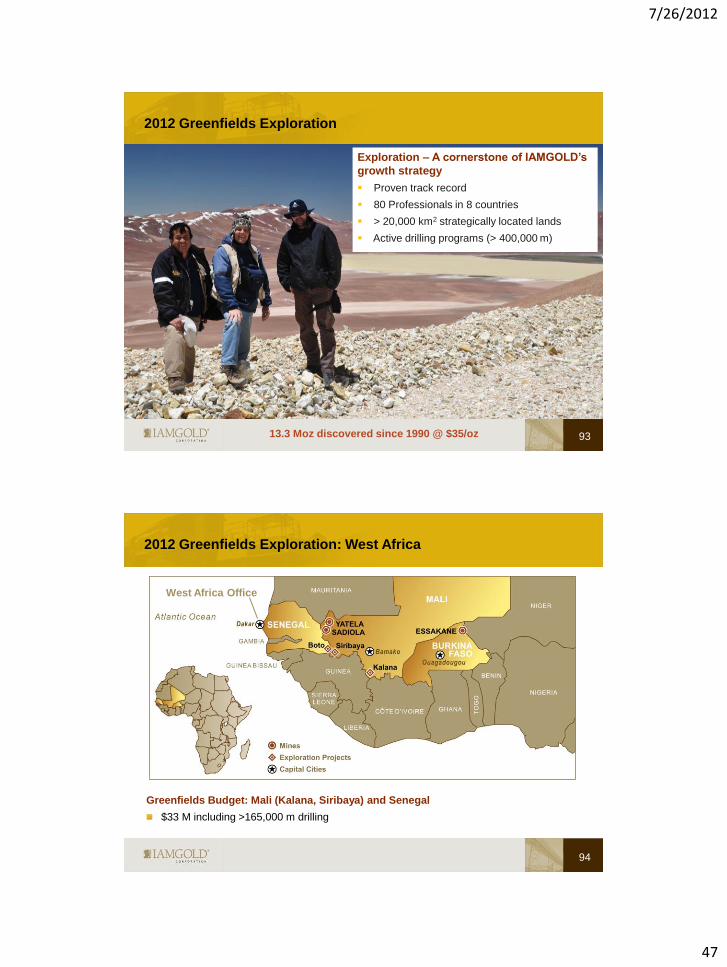
2012 Greenfields Exploration
93
Exploration – A cornerstone of IAMGOLD’s
growth strategy
Proven track record
80 Professionals in 8 countries
> 20,000 km2 strategically located lands
Active drilling programs (> 400,000 m)
13.3 Moz discovered since 1990 @ $35/oz
2012 Greenfields Exploration: West Africa
94
West Africa Office
Greenfields Budget: Mali (Kalana, Siribaya) and Senegal
$33 M including >165,000 m drilling
7/26/2012
48
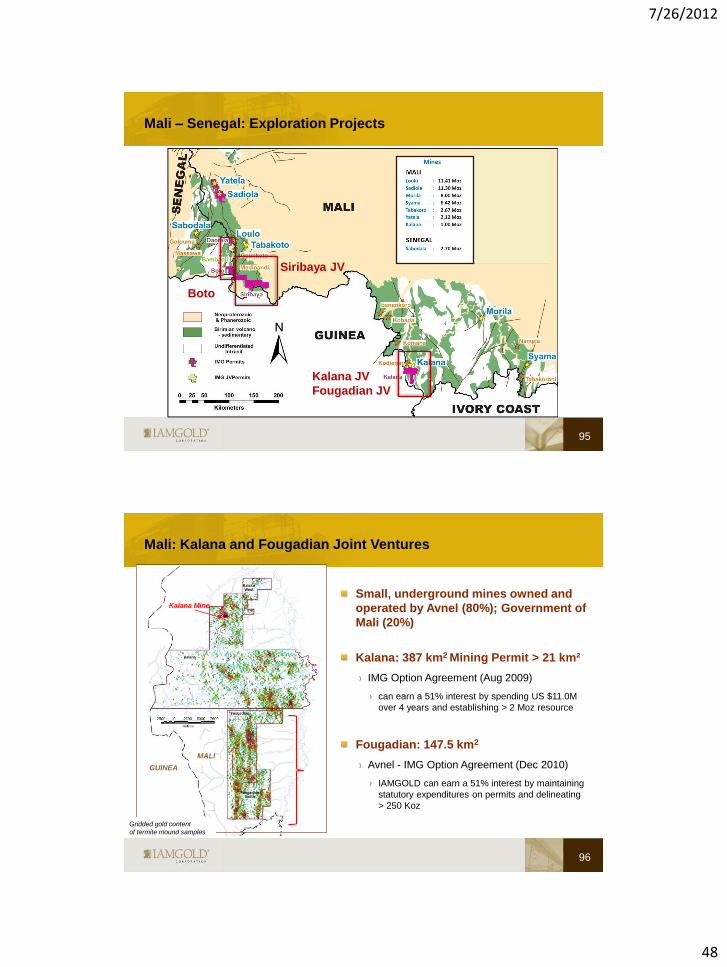
Mali – Senegal: Exploration Projects
95
Kalana JV
Fougadian JV
Siribaya JV
Boto
Mali: Kalana and Fougadian Joint Ventures
96
GUINEA
MALI
Small, underground mines owned and
operated by Avnel (80%); Government of
Mali (20%)
Kalana: 387 km2 Mining Permit > 21 km²
IMG Option Agreement (Aug 2009)
can earn a 51% interest by spending US $11.0M
over 4 years and establishing > 2 Moz resource
Fougadian: 147.5 km2
Avnel - IMG Option Agreement (Dec 2010)
IAMGOLD can earn a 51% interest by maintaining
statutory expenditures on permits and delineating
> 250 Koz
Kalana Mine
Gridded gold content
of termite mound samples
7/26/2012
49
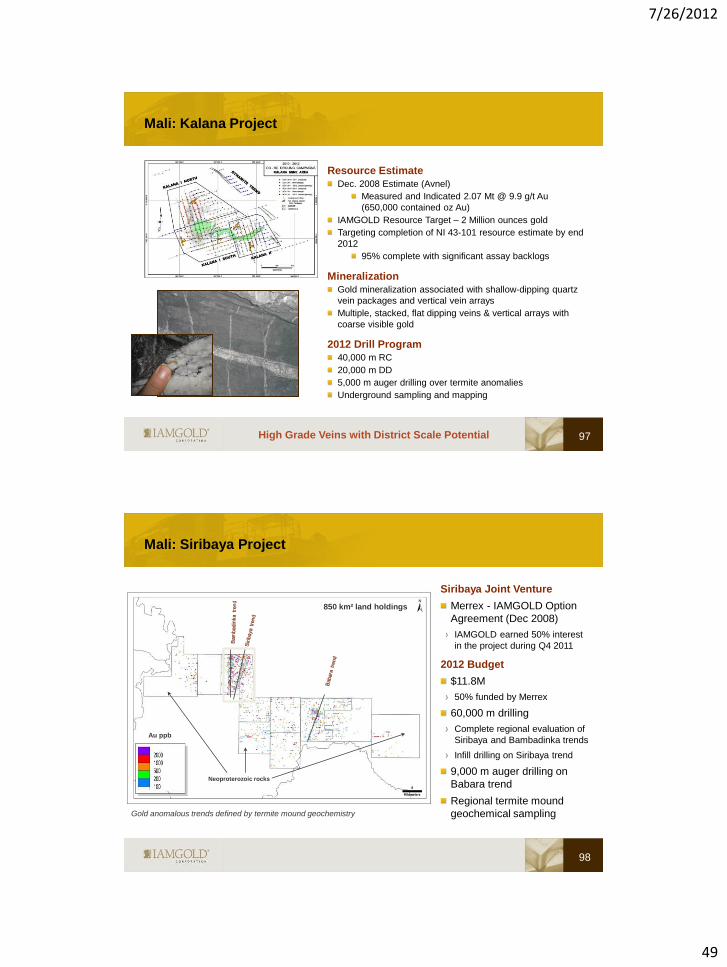
Mali: Kalana Project
Resource Estimate
Dec. 2008 Estimate (Avnel)
Measured and Indicated 2.07 Mt @ 9.9 g/t Au
(650,000 contained oz Au)
IAMGOLD Resource Target – 2 Million ounces gold
Targeting completion of NI 43-101 resource estimate by end
2012
95% complete with significant assay backlogs
Mineralization
Gold mineralization associated with shallow-dipping quartz
vein packages and vertical vein arrays
Multiple, stacked, flat dipping veins & vertical arrays with
coarse visible gold
2012 Drill Program
40,000 m RC
20,000 m DD
5,000 m auger drilling over termite anomalies
Underground sampling and mapping
97 High Grade Veins with District Scale Potential
Gold anomalous trends defined by termite mound geochemistry
Neoproterozoic rocks
Au ppb
Mali: Siribaya Project
Siribaya Joint Venture
Merrex - IAMGOLD Option
Agreement (Dec 2008)
IAMGOLD earned 50% interest
in the project during Q4 2011
2012 Budget
$11.8M
50% funded by Merrex
60,000 m drilling
Complete regional evaluation of
Siribaya and Bambadinka trends
Infill drilling on Siribaya trend
9,000 m auger drilling on
Babara trend
Regional termite mound
geochemical sampling
850 km² land holdings
98

7/26/2012
50
Mali: Siribaya Project - Drilling Status
99
RC Drilling
20m @ 0.82g/t Au
8m @ 19.09g/t Au
18m @ 1.97g/t Au
24m @ 1.76g/t Au
16m @ 1.59g/t Au
19m @ 1.99g/t Au
8m @ 1.26g/t Au
12m @ 3.99g/t Au
Siribaya Resources: Indicated: 308,000 oz @ 2.39 g/t Au Inferred: 70,000 oz @ 2.29 g/t Au
(Source: Merrex Gold Feb. 3, 2010 news release “Merrex 2010 Resource increases Grade and Establishes
Indicated Resource at Siribaya”)
Diamond Drilling
6m @ 2.38g/t Au
6m @ 1.15g/t Au
7m @ 1.75g/t Au
26m @ 1.43g/t Au
5m @ 1.97g/t Au
Sig
nific
ant
Assay R
esults
: w
ww
.merr
exgold
.co
m
Senegal: Boto 2012 Program
Boto 1
Boto 5
Fekola Discovery
(Papillon Resources)
Boto 3
Boto 4
Boto 6
Drill Section (Next slide)
100
Boto 2
7/26/2012
51
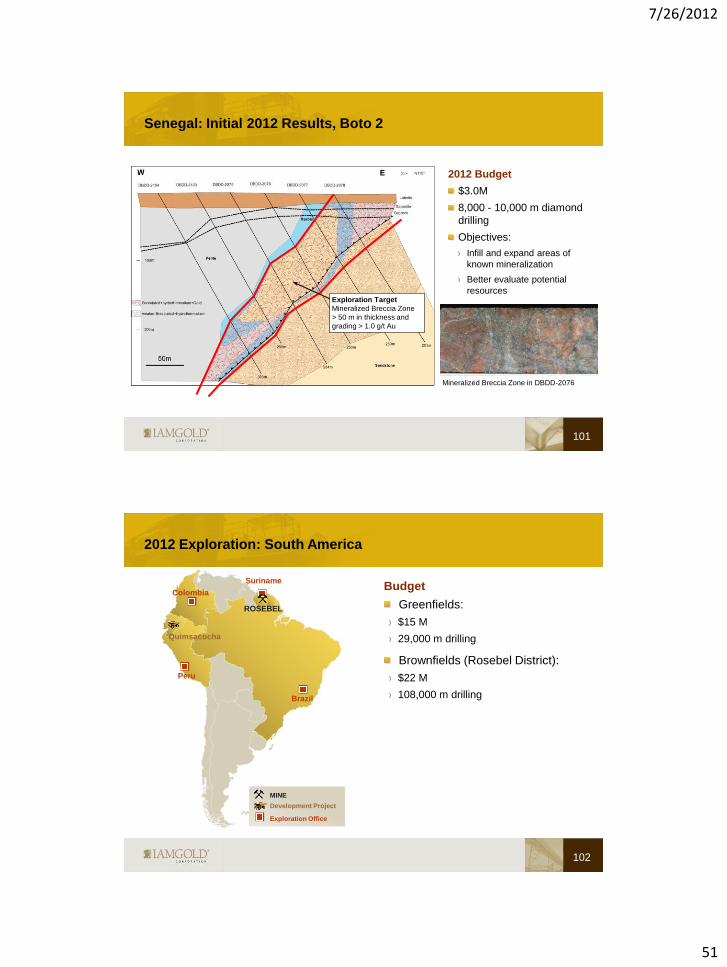
2012 Budget
$3.0M
8,000 - 10,000 m diamond
drilling
Objectives:
Infill and expand areas of
known mineralization
Better evaluate potential
resources
Senegal: Initial 2012 Results, Boto 2
Exploration Target
Mineralized Breccia Zone
> 50 m in thickness and
grading > 1.0 g/t Au
Mineralized Breccia Zone in DBDD-2076
101
2012 Exploration: South America
MINE
Development Project
Exploration Office
Suriname
ROSEBEL
Brazil
Peru
Colombia
Quimsacocha
102
Budget
Greenfields:
$15 M
29,000 m drilling
Brownfields (Rosebel District):
$22 M
108,000 m drilling

7/26/2012
52
Brazil: 2012 Exploration Budget - $5.6 M
Brazil Projects
Minas Gerais (Pitangui)
2011 – Gold mineralization identified in
Banded Iron Formation host rocks
5,000 m diamond drilling in progress
South Para (Vila Estrela)
Q1 2012 - 1,100 m drilling completed
on remaining 2011 targets
Project Generation
Reconnaissance field work ongoing in
select areas
South Para
Project Generation
Minas Gerais
103
Brazil: Minas Gerais - Pitangui Project
1.5 Moz
104

7/26/2012
53
Brazil: Pitangui Project - Jaguara Prospect
*Source – MEG (AGA)
Mineralized BIF in FJG-02
105
Jaguara Prospect
Mineralization identified in Banded
Iron Formation (“BIF”) host rocks
Mineralization style and alteration
similar to known BIF-hosted gold
deposits in the Iron Quadrangle
which collectively contain:
8.3 Moz Reserves + M&I Resources
13.6 Moz Inferred Resources
Brazil: Pitangui Project - Jaguara Prospect
Jaguara Prospect
Mineralization identified in Banded
Iron Formation (“BIF”) host rocks
Mineralization style and alteration
similar to known BIF-hosted gold
deposits in the Iron Quadrangle
which collectively contain:
8.3 Moz Reserves + M&I Resources
13.6 Moz Inferred Resources
*Source – MEG
Mineralized BIF in FJG-02
106

7/26/2012
54
Colombia: 2012 Exploration Budget - $2.6M
107
Regional field work on priority targets identified by country wide generative work
2011 investments in junior companies as an avenue for growth
$6.0M in Bellhaven Copper and Gold Inc. (10.2% equity interest; could increase to 14.6%
with exercise of warrants)
$3.42M in Columbia Crest Gold Corp (14% equity interest; could increase to 19.7% with
exercise of warrants)
$10M in Tolima Gold Corp
Canada: 2012 Exploration
$19.5M Brownfields
$5.7M Greenfields
15,000 m drilling planned
3 key greenfields projects on
major trends in the Abitibi
Earn-In Option signed with
Virginia Mines on Lac Pau
Renewed focus on growth in
Quebec-Ontario
MINE
Development Project
Exploration Office
Westwood
MOUSKA
Val d’Or NIOBEC
108

7/26/2012
55
Gold Potential of the Abitibi Belt Keeps Growing
109 Total production and developing resources (2011): >260 Moz Au
Kirkland Lk 4.1 M oz
Detour Lake 23.2 M oz
Foxtrot 1.3 M oz
Timmins O 1.9 M oz
Goldex 1.6 M oz
Lapa 1.7 M oz
Casa-Bérardi 2.8 M oz
Young-Davidson 4.8 M oz
Joanna 2.8 M oz
Canadian Malartic 12.7 M oz
Westwood 3.5 M oz
Cote Lake
6.9 M oz
New mines (Au)
Mines in development
Exploration Properties in Québec – 2012 Update
110
Zn
Zn
Cu-
Zn
Zn-Cu
PORCUPINE-LÉPINE (Au)
ROUYN-MERGER (Au)
CARIBOU
(Au & BM)
BOUSQUET-ODYNO (Au)
Simplified Geology of the Abitibi Volcanic Belt
Abitibi
Belt
LAC PAU
NIOBEC
ANATACAU
GÉMINI-TURGEON (JV with Cancor, Au & BM)
Land positions totalling 813km²
323 km² in the Abitibi
458 km² in James Bay
24 km2 in the Niobec area
Option exercised by Cogitore - Caribou
Option to be exercised by Virginia - Anatacau
Earn-In Option on Virginia’s Lac Pau
Right to an Earn-in Option in the Niobec area
- DIOS
7/26/2012
56
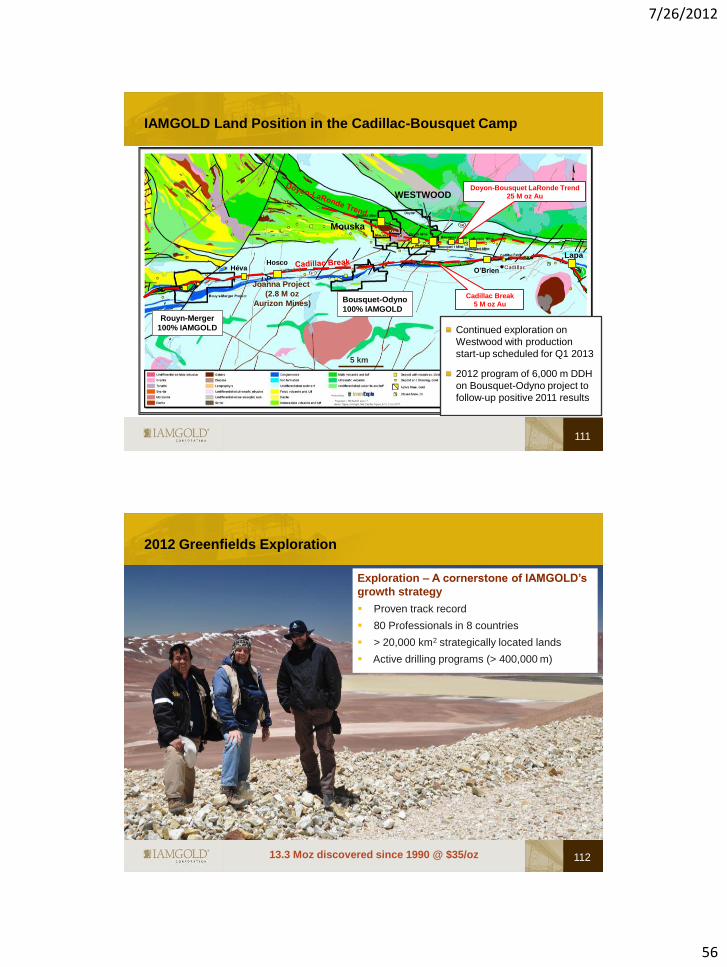
IAMGOLD Land Position in the Cadillac-Bousquet Camp
111
Doyon-Bousquet LaRonde Trend
25 M oz Au
Cadillac Break
5 M oz Au
Mouska
WESTWOOD
Héva Hosco
O’Brien
Bousquet-Odyno
100% IAMGOLD Rouyn-Merger
100% IAMGOLD
Joanna Project
(2.8 M oz
Aurizon Mines)
Lapa
5 km
Continued exploration on
Westwood with production
start-up scheduled for Q1 2013
2012 program of 6,000 m DDH
on Bousquet-Odyno project to
follow-up positive 2011 results
2012 Greenfields Exploration
112
Exploration – A cornerstone of IAMGOLD’s
growth strategy
Proven track record
80 Professionals in 8 countries
> 20,000 km2 strategically located lands
Active drilling programs (> 400,000 m)
13.3 Moz discovered since 1990 @ $35/oz
7/26/2012
57
®
®
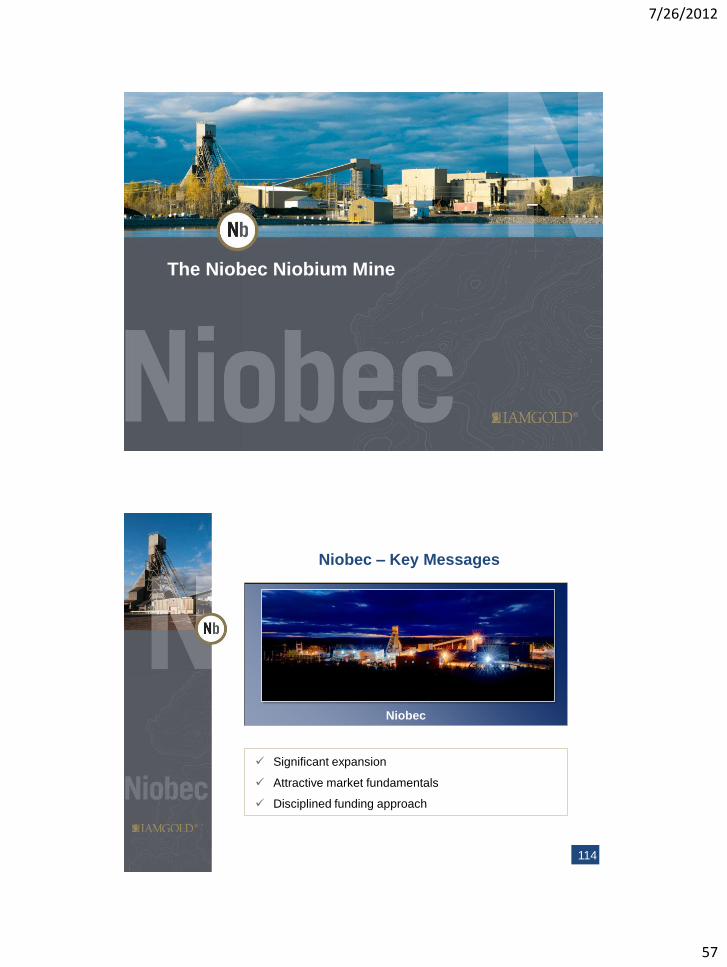
The Niobec Niobium Mine
®
Niobec – Key Messages
Significant expansion
Attractive market fundamentals
Disciplined funding approach
Niobec
114

7/26/2012
58
®
Pre
Expansion
Post
Expansion
Change
Contained Nb205 (Mkg)
- Probable Reserves 244 1,746 616%
- Measured 90 1,028
- Indicated 154 986
- M&I 244 2,014
- Inferred 316 547
Mine Life 16 years 46 years +30 years
Average Annual
Production ~4.6-5.1 Mkg
(2012 Guidance) 13.5 Mkg ~3X
Operating Margin $15-17 kg
(2012 Guidance) $28/ kg ~2X
Annual Sustaining Capex $15 Million $21 Million
• Source: IAMGOLD Feb. 23, 2012, news release “ IAMGOLD Releases Update on its Capital Development Projects ”
• Measured and indicated resources are 98% inclusive of probable reserves. Under the block caving scenario around 2% of the measured
and indicated resources included in the probable reserves are slightly below the cutoff of 0.20% Nb2O5 per tonne (before recovery) used
for resource reporting. This material represents only 5.8 Mt averaging 0.18% Nb2O5 for 10 Mkg of Nb2O5 contained.
Significant Expansion of Reserves,
Production and Mine Life
115
®
Average Annual Niobium Production 13.5 Mkg Nb
Operating Margin $28 / kg Nb
Estimated IRR (after-tax) 17-19%(1)
NAV (after-tax) $1.6 - $1.8 B(1)
Pre-Production Capex $976 M
Sustaining Capex $965 M
1. Canadian/US Exchange Rate 1.05 (2012 -1.00) and Niobium Price Assumption @ $45/kg Nb
Source: IAMGOLD Feb. 23, 2012, news release “ IAMGOLD Releases Update on its Capital Development Projects ”
Attractive Project Economics
Attractive Project Characteristics
Proven metallurgy
Potential to expand capacity to match growth in demand
Expect to complete permitting process in 18-24 months
Social and environmental baselines completed
Feasibility study expected to be completed by mid-2013
Feasibility and permitting will further de-risk project
116
7/26/2012
59
®
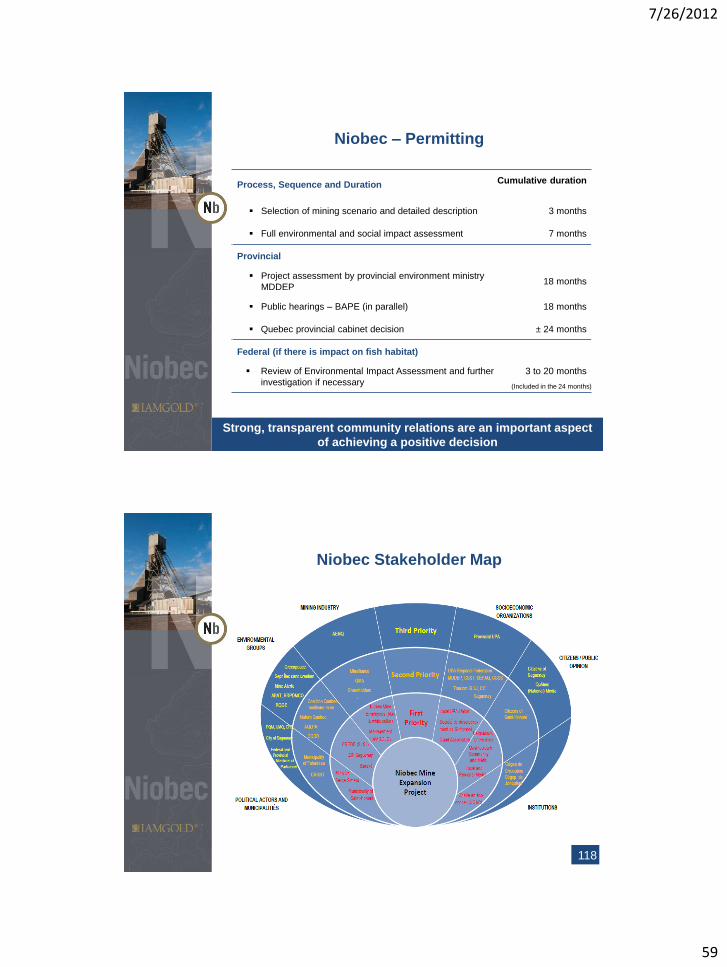
Niobec – Permitting
Process, Sequence and Duration
Selection of mining scenario and detailed description 3 months
Full environmental and social impact assessment 7 months
Provincial
Project assessment by provincial environment ministry
MDDEP 18 months
Public hearings – BAPE (in parallel) 18 months
Quebec provincial cabinet decision ± 24 months
Federal (if there is impact on fish habitat)
Review of Environmental Impact Assessment and further
investigation if necessary
3 to 20 months
(Included in the 24 months)
Cumulative duration
Strong, transparent community relations are an important aspect
of achieving a positive decision
®
Niobec Stakeholder Map
118

7/26/2012
60
®
FeN
b c
onsum
ption (to
nnes)
Demand for Niobium is Growing
Source: Roskill, World Steel Association
Global Ferroniobium Demand
4041 41
4343
52
56
6362
43
55 55
48.5
750
850
950
1,050
1,150
1,250
1,350
1,450
1,550
30
35
40
45
50
55
60
65
'00 '01 '02 '03 '04 '05 '06 '07'08' '09'10' '11 '12
Driven by increase usage intensity & growing steel production
~ 60% of FeNb growth generated by increased intensity; balance is in growth of crude
steel production
20% of steel produced in developed countries is HSLA; only 10% in developing
countries
HSLA prod’n will continue to increase in both developed and developing countries
(HSLA in automobiles will double by 2020)
Ste
el P
roductio
n (M
t)
g F
eN
b/t
ste
el
600
800
1,000
1,200
1,400
1,600
1,800
2,000
5,000
25,000
45,000
65,000
85,000
105,000
125,000
145,000
'82 '85 '88 '91 '94 '97 '00 '03 '06 '09 '12 '15
FeNb Consumption Steel Consumption
Ferroniobium Intensity Usage
Ste
el P
roductio
n (M
t)
®
$15
$33
$37 $35 $36
$41 $41 $41 $42 $43
$45 $45 $45 $45 $45 $45
'06 '07 '08 '09 '10 '11 '12E '13E '14E '15E '16E '17E '18E '19E '20E
Base Case Forecast
Niobium Pricing
(Global Market)
For long term planning purposes, average price
conservatively forecast to be $45/kg
SPOT market in 2011 > $45/kg
Prices estimated by an independent source to Roscoe Postle Associates.
120
7/26/2012
61
®
0%
10%
20%
30%
40%
50%
60%
70%
80%
90%
100%
00 01 02 03 04 05 06 07 08 09 10 11 12 13 14 15 16 17 18
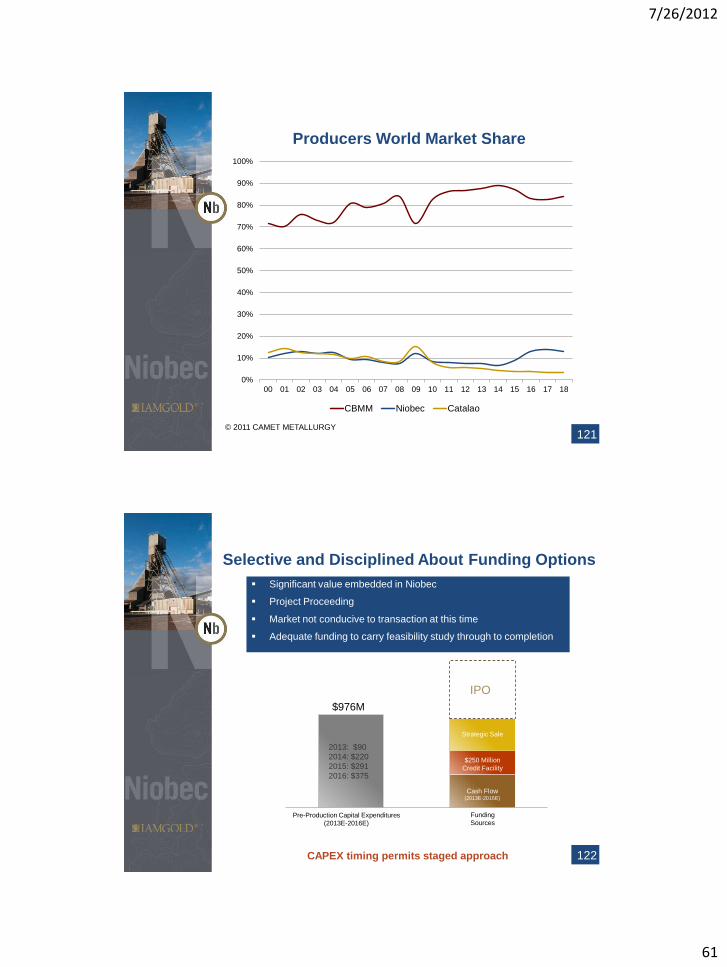
CBMM Niobec Catalao
© 2011 CAMET METALLURGY
Producers World Market Share
121
®
2013: $90
2014: $220
2015: $291
2016: $375
$976M
Pre-Production Capital Expenditures
(2013E-2016E)
Funding
Sources
Cash Flow (2013E-2016E)
$250 Million
Credit Facility
Strategic Sale
IPO
122 CAPEX timing permits staged approach
Selective and Disciplined About Funding Options
Significant value embedded in Niobec
Project Proceeding
Market not conducive to transaction at this time
Adequate funding to carry feasibility study through to completion
122

7/26/2012
62
®
Niobec – Key Messages
Significant expansion
Attractive market fundamentals
Disciplined funding approach
Niobec
123
REE
The Value of REEs
Rare Earth Elements
IAMGOLD.COM | TSX: IMG | NYSE: IAG
7/26/2012
63
125
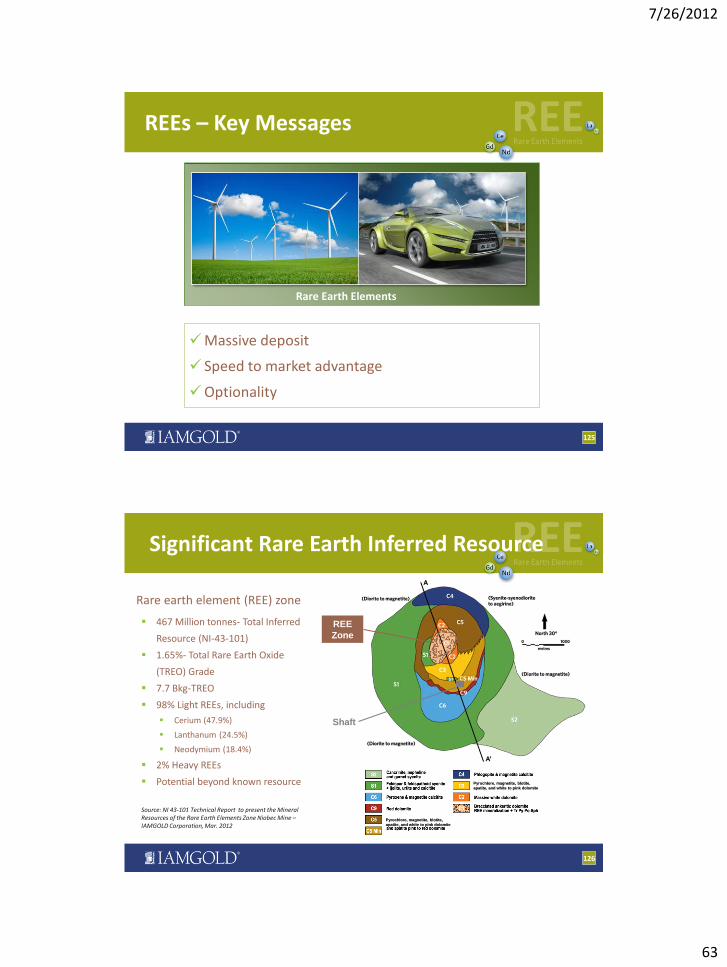
REEs – Key Messages
Rare Earth Elements
Massive deposit
Speed to market advantage
Optionality
126
Rare earth element (REE) zone
Significant Rare Earth Inferred Resource
467 Million tonnes- Total Inferred
Resource (NI-43-101)
1.65%- Total Rare Earth Oxide
(TREO) Grade
7.7 Bkg-TREO
98% Light REEs, including
Cerium (47.9%)
Lanthanum (24.5%)
Neodymium (18.4%)
2% Heavy REEs
Potential beyond known resource
Source: NI 43-101 Technical Report to present the Mineral Resources of the Rare Earth Elements Zone Niobec Mine – IAMGOLD Corporation, Mar. 2012
Pyrochlore, magnetite, blotite,
apatite, and white to pink dolomite
Pyrochlore, magnetite, blotite,
apatite, and white to pink dolomite
REE
Zone
Shaft

7/26/2012
64
127
IAMGOLD has the Largest Deposit Outside China
China’s Mongolian deposit
Bayan Obo 40 Mt TREO
IAMGOLD 7.7 Mt TREO
Avalon Northwest Territories, Canada
4.3 Mt TREO
Lynas Australia
1.4 Mt
Quest Canada 1.3 Mt
Molycorp USA
1.1 Mt
Rare Element USA
0.9 Mt
Source: Company reports
128
N
S
TREO %
200m
200m
375m deep
Inferred Resources to ~375m Total Inferred Resource of 466.8 Mt @ 1.65% TREO (0.031% HREO) 2012: 26,000m (100 x100m) infill drilling program to the ~700m level in progress Resource update in Q4 2012
Block Model: Total Rare Earth Oxides (TREO) %
Section 3600E
REE Zone – Block Model
Total Inferred Resource (NI 43-101)
466.8 tonnes
Total Rare Earth Oxide (TREO) (grade %)
1.65%
TREO 7.7 million tonnes
Heavy Rare Earth Oxides
2%
Light Rare Earth Oxides 98%
Key REE Mineralization Bastnaesite/Monazite
Host Rock Carbonatite
Source: NI 43-101 Technical Report to present the Mineral Resources of the Rare Earth Elements Zone Niobec Mine – IAMGOLD Corporation, Mar. 2012
7/26/2012
65
129
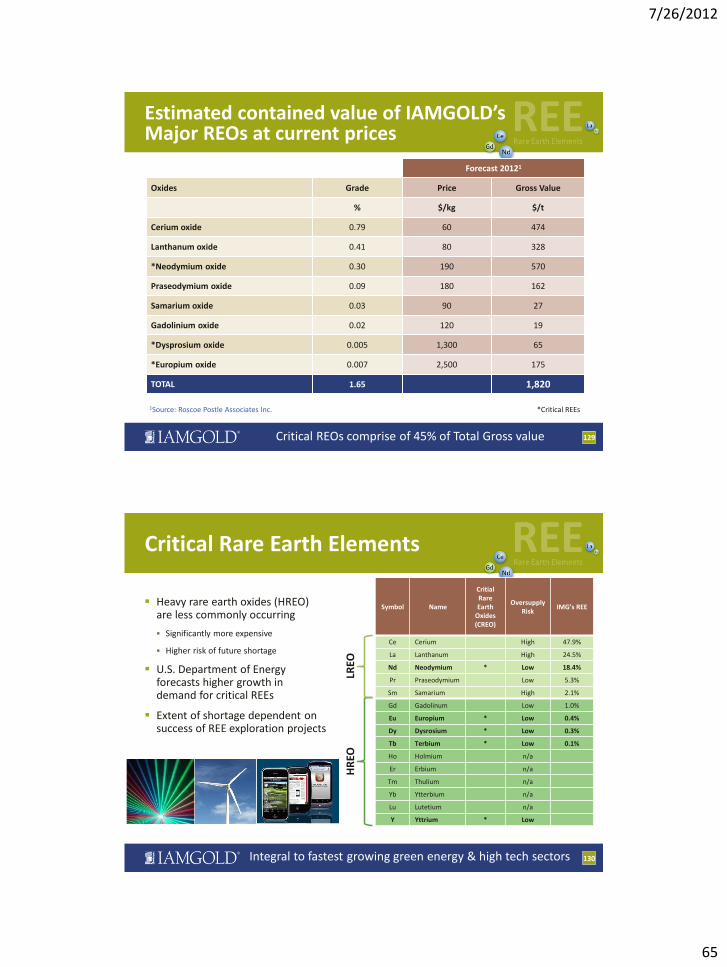
Estimated contained value of IAMGOLD’s Major REOs at current prices
Forecast 20121
Oxides Grade Price Gross Value
% $/kg $/t
Cerium oxide 0.79 60 474
Lanthanum oxide 0.41 80 328
*Neodymium oxide 0.30 190 570
Praseodymium oxide 0.09 180 162
Samarium oxide 0.03 90 27
Gadolinium oxide 0.02 120 19
*Dysprosium oxide 0.005 1,300 65
*Europium oxide 0.007 2,500 175
TOTAL 1.65 1,820
1Source: Roscoe Postle Associates Inc. *Critical REEs
Critical REOs comprise of 45% of Total Gross value
130
Critical Rare Earth Elements
Heavy rare earth oxides (HREO) are less commonly occurring
Significantly more expensive
Higher risk of future shortage
U.S. Department of Energy forecasts higher growth in demand for critical REEs
Extent of shortage dependent on success of REE exploration projects
Symbol Name
Critial Rare Earth
Oxides (CREO)
Oversupply Risk
IMG’s REE
Ce Cerium High 47.9%
La Lanthanum High 24.5%
Nd Neodymium * Low 18.4%
Pr Praseodymium Low 5.3%
Sm Samarium High 2.1%
Gd Gadolinum Low 1.0%
Eu Europium * Low 0.4%
Dy Dysrosium * Low 0.3%
Tb Terbium * Low 0.1%
Ho Holmium n/a
Er Erbium n/a
Tm Thulium n/a
Yb Ytterbium n/a
Lu Lutetium n/a
Y Yttrium * Low
LREO
H
REO
Integral to fastest growing green energy & high tech sectors

7/26/2012
66
131
Growing Gap between Supply and Demand
Since 2000, global demand for rare earths has grown ~4.7% per year
Over the next decade, demand is expected to grow at 7-9% CAGR
0
20,000
40,000
60,000
80,000
100,000
120,000
140,000
160,000
'05 '06 '07 '08 '09 '10 '11F '12F '13F '14F '15F
Dem
and
tp
a -
REO
China Export Quota China Demand ROW Demand
Source: D. Kingsworth IMCOA 2011
132
Proximity to existing infrastructure
1 km north of IAMGOLD’s operating niobium mine
Underground drill access from Niobec
Existing road and rail infrastructure
Proximity to deep water ports and ocean access
Prospect of utilizing existing underground at Niobec as well as surface facilities to mine and process the REEs
Among the world’s top 5 mining friendly jurisdictions1
Very competitive hydro rates @~$0.045/kWh
Further economies of scale with Niobec expansion
Québec
Low Cost and Speed to Market Advantages
1Source: The Fraser Institute’s Survey of Mining Companies: 2011/2012
7/26/2012
67
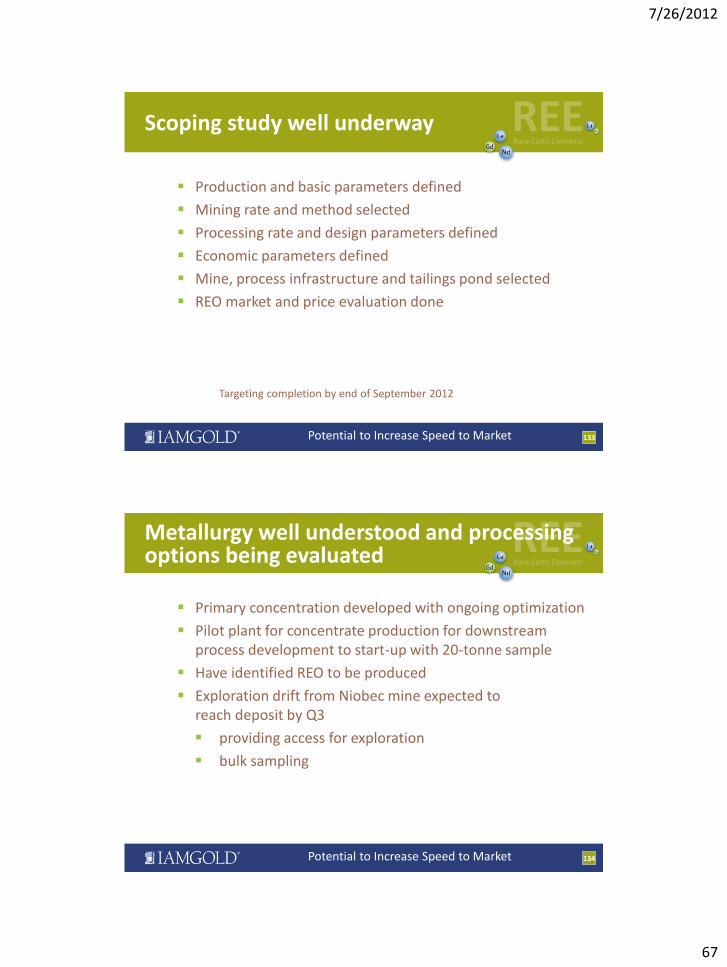
133
Scoping study well underway
Production and basic parameters defined
Mining rate and method selected
Processing rate and design parameters defined
Economic parameters defined
Mine, process infrastructure and tailings pond selected
REO market and price evaluation done
Targeting completion by end of September 2012
Potential to Increase Speed to Market
134
Metallurgy well understood and processing options being evaluated
Primary concentration developed with ongoing optimization
Pilot plant for concentrate production for downstream process development to start-up with 20-tonne sample
Have identified REO to be produced
Exploration drift from Niobec mine expected to reach deposit by Q3
providing access for exploration
bulk sampling
Potential to Increase Speed to Market

7/26/2012
68
135
REEs – Key Messages
Rare Earth Elements
Massive deposit
Speed to market advantage
Optionality
TSX: IMG NYSE: IAG
GOVERNMENT UPDATE

7/26/2012
69
Role of Corporate Affairs
Managing relationships with governments
Managing political / country risk
Lead in negotiations with governments on
Taxes
Key project terms
Transactions
Government dimensions of permitting / approvals
Reputation
137
} Suriname, Burkina Faso and Mali
138
Core Strengths of our Corporate Affairs Program
Global program dedicated to managing political risk integrated into all
facets of our business
Established relationships with home and host governments
Highly proactive approach to government relations
Deep in-country expertise and regular on the ground presence of
senior executives
Award-winning, internationally recognized Corporate Social
Responsibility track record
Deep experience in Africa and the Americas

7/26/2012
70
Country Updates – Mali and Suriname
139
Suriname
Mali
TSX: IMG NYSE: IAG
FINANCIAL REVIEW

7/26/2012
71
525
224
500
250
Q1 2012 (Pro Forma)
Available Niobecfacility
Available credit
Bullion at marketvalue
Cash
141 141
Strong balance sheet with
ample liquidity
Sufficient liquidity / cash
flow to fund development
of projects
Sizeable cash flow from
operating activities
Cash flows largely cover
growth capex
No Debt
Significant financial flexibility to fund growth projects
Note: 2007, 2008, 2009 financial metrics in Canadian GAAP and have not been restated for discontinued
operations; 2010 and 2011 financial metrics in IFRS.
(1) New Niobec facility established February 2012.
(2) Increased to $500mm February 2012.
(3) Pro forma for ~C$505mm Trelawney acquisition, net of cash.
(4) Operating Cash Flow net of Corporate G&A and Exploration.
(5) LTM as of Q1 2012.
(3)
(2)
(1)
Consistent Operating Cash Flows(4)
Significant Liquidity
$119
$258 $257
$348
$590 $561
$0
$200
$400
$600
$800
2007 2008 2009 2010 2011 LTM
$m
illio
ns
(5)
$m
illi
on
s
$1,500
Excellent Financial Position with Cash Flow Growth
$ M
illi
on
s
5 15 20 40
130 60
200 60
40
145 185
190
320
230
60
2012 2013 2014
Essakane
Rosebel
Westwood
Sadiola
Other
Planned Capital Expenditures for Gold Operations
142 Significant investment in brownfield growth
2012 Capital Expenditure
710
620
370
Capex data includes Capitalized Stripping
Essakane › Additional water storage pond and river diversion
› Additional power generation for hard ore
Rosebel › Crushing & grinding circuit expansion, resource
development
› $24M sustaining capital
› Includes $34 million of carry-over from 2011
Sadiola › Assumes positive production decision for Sadiola
Sulphides project
› $10M sustaining capital
Westwood › Deepening shaft, developing drift levels for future mining
and building up ore stockpile in 2012, and mill
refurbishment
$millions Capitalized Stripping
2012 2013 2014 Total 3
years
Essakane 50 40 40 130
Rosebel - 20 50 70
Sadiola 15 50 50 115
Total 65 110 140 315

7/26/2012
72
Essakane
Rosebel
Westwood
Sadiola
Funding for Growth Initiatives
Gold Operations
1Operating Cash Flow net of Corporate G&A and Exploration
$42M Capital Expenditures
(2012E-2014E)
$0.2B
$0.3B
$0.6B
$0.6B
$1.7B
143
Operating
Cash Flow1
(2012E-2014E)
Sensitivities
$1
.8B
@ $
1,5
00
/oz
$2
.2B
@ $
1,7
00
/oz
$2
.7B
@ $
2,0
00
/oz
$976M
Capital Expenditures
(2013E-2016E)
Funding
Sources
Credit
Facility $250M
Strategic
Minority
Sale
IPO
Capex (2013E-2016E)
$310M
Capex (2015E-2016E)
$666M
Operating
Cash Flow(1)
(2013E-2016E)
Niobium Expansion
TSX: IMG NYSE: IAG
IFRS 11 – JOINT ARRANGEMENTS
7/26/2012
73
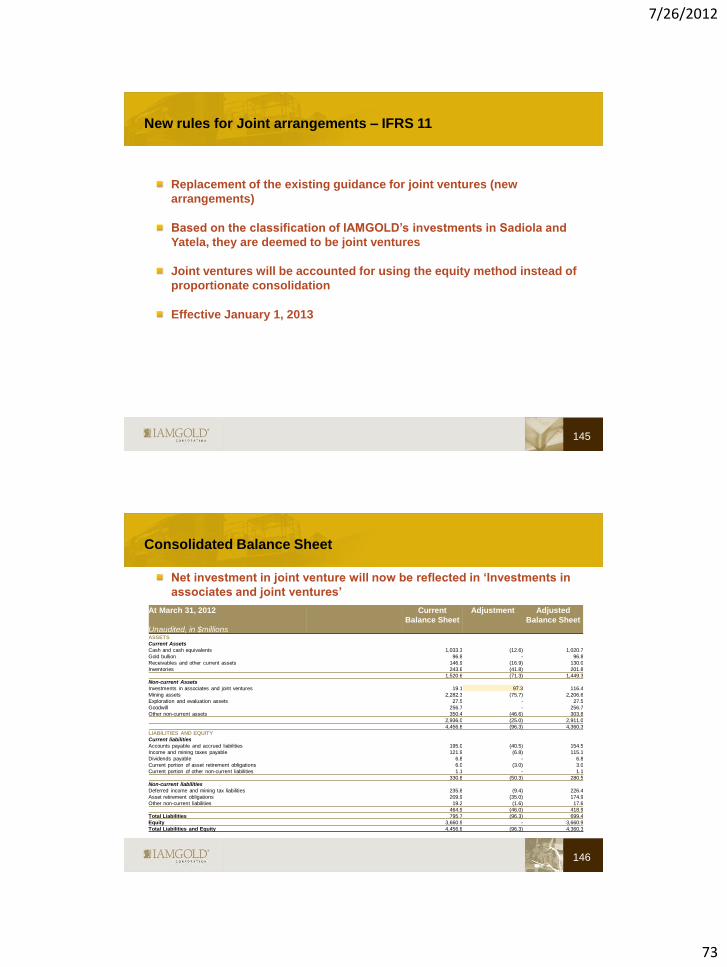
New rules for Joint arrangements – IFRS 11
Replacement of the existing guidance for joint ventures (new
arrangements)
Based on the classification of IAMGOLD’s investments in Sadiola and
Yatela, they are deemed to be joint ventures
Joint ventures will be accounted for using the equity method instead of
proportionate consolidation
Effective January 1, 2013
145
Consolidated Balance Sheet
Net investment in joint venture will now be reflected in ‘Investments in
associates and joint ventures’
146
At March 31, 2012
Unaudited, in $millions
Current
Balance Sheet
Adjustment Adjusted
Balance Sheet
ASSETS
Current Assets
Cash and cash equivalents 1,033.3 (12.6) 1,020.7
Gold bullion 96.8 - 96.8
Receivables and other current assets 146.9 (16.9) 130.0
Inventories 243.6 (41.8) 201.8
1,520.6 (71.3) 1,449.3
Non-current Assets
Investments in associates and joint ventures 19.1 97.3 116.4
Mining assets 2,282.3 (75.7) 2,206.6
Exploration and evaluation assets 27.5 - 27.5
Goodwill 256.7 - 256.7
Other non-current assets 350.4 (46.6) 303.8
2,936.0 (25.0) 2,911.0
4,456.6 (96.3) 4,360.3
LIABILITIES AND EQUITY
Current liabilities
Accounts payable and accrued liabilities 195.0 (40.5) 154.5
Income and mining taxes payable 121.9 (6.8) 115.1
Dividends payable 6.8 - 6.8
Current portion of asset retirement obligations 6.0 (3.0) 3.0
Current portion of other non-current liabilities 1.1 - 1.1
330.8 (50.3) 280.5
Non-current liabilities
Deferred income and mining tax liabilities 235.8 (9.4) 226.4
Asset retirement obligations 209.9 (35.0) 174.9
Other non-current liabilities 19.2 (1.6) 17.6
464.9 (46.0) 418.9
Total Liabilities 795.7 (96.3) 699.4
Equity 3,660.9 - 3,660.9
Total Liabilities and Equity 4,456.6 (96.3) 4,360.3
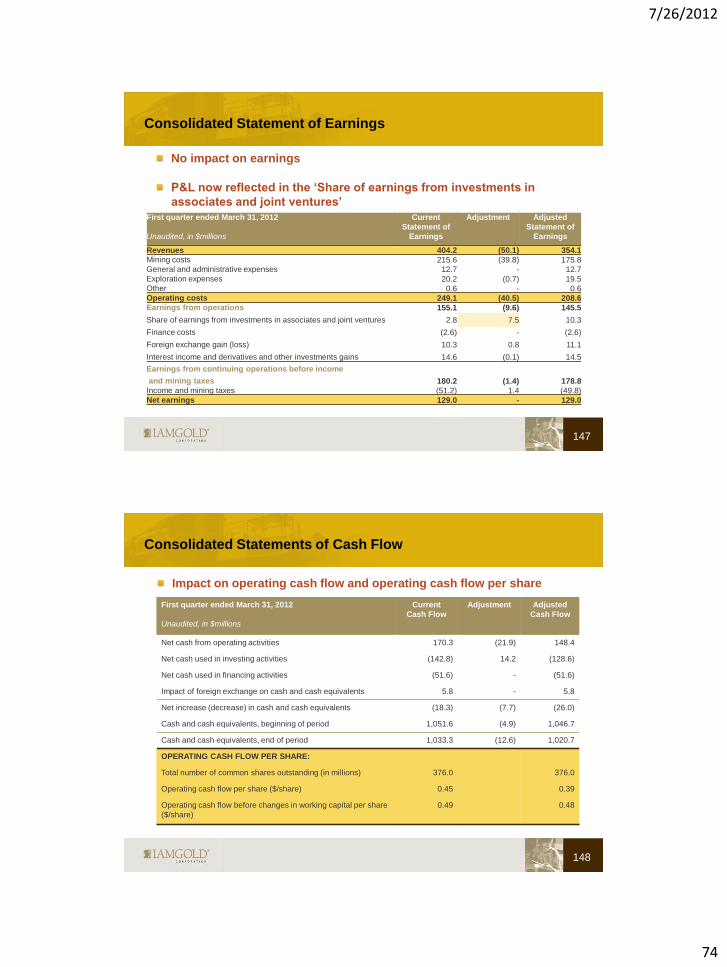
7/26/2012
74
Consolidated Statement of Earnings
No impact on earnings
P&L now reflected in the ‘Share of earnings from investments in
associates and joint ventures’
147
First quarter ended March 31, 2012
Unaudited, in $millions
Current
Statement of
Earnings
Adjustment Adjusted
Statement of
Earnings
Revenues 404.2 (50.1) 354.1
Mining costs 215.6 (39.8) 175.8
General and administrative expenses 12.7 - 12.7
Exploration expenses 20.2 (0.7) 19.5
Other 0.6 - 0.6
Operating costs 249.1 (40.5) 208.6
Earnings from operations 155.1 (9.6) 145.5
Share of earnings from investments in associates and joint ventures 2.8 7.5 10.3
Finance costs (2.6) - (2.6)
Foreign exchange gain (loss) 10.3 0.8 11.1
Interest income and derivatives and other investments gains 14.6 (0.1) 14.5
Earnings from continuing operations before income
and mining taxes 180.2 (1.4) 178.8
Income and mining taxes (51.2) 1.4 (49.8)
Net earnings 129.0 - 129.0
Consolidated Statements of Cash Flow
Impact on operating cash flow and operating cash flow per share
148
First quarter ended March 31, 2012
Unaudited, in $millions
Current
Cash Flow
Adjustment Adjusted
Cash Flow
Net cash from operating activities 170.3 (21.9) 148.4
Net cash used in investing activities (142.8) 14.2 (128.6)
Net cash used in financing activities (51.6) - (51.6)
Impact of foreign exchange on cash and cash equivalents 5.8 - 5.8
Net increase (decrease) in cash and cash equivalents (18.3) (7.7) (26.0)
Cash and cash equivalents, beginning of period 1,051.6 (4.9) 1,046.7
Cash and cash equivalents, end of period 1,033.3 (12.6) 1,020.7
OPERATING CASH FLOW PER SHARE:
Total number of common shares outstanding (in millions) 376.0 376.0
Operating cash flow per share ($/share) 0.45 0.39
Operating cash flow before changes in working capital per share
($/share)
0.49 0.48

7/26/2012
75
Disclosures
Consolidated Financial Statements
Detailed information will be provided in notes to financial
statements
MD&A
Information for Sadiola and Yatela operations will be provided
individually as in the past
Will continue to report production and cash costs
149
Hedging
150
IAMGOLD Hedging 2012 (as at May 11, 2012)
COMMODITY % of Exposure Hedged Range
Gold none -
CAD$ : US$ 64% C$0.97/$ – C$1.05/$
EURO€: US$ 38% $1.25/€ - $1.35/€
OIL 66% $70 – $95
per barrel WTC
ALUMINUM 72%
(49% for 2013) $2,146 – $2,369
per tonne

7/26/2012
76
TSX: IMG NYSE: IAG
INVESTMENT THESIS
Leverage Core Competencies to Advance Strategic Priorities
152
› Provides a
geographically
balanced portfolio
› High level of
confidence
underscores core
competencies
› Optionality
› Attractive
acquisition cost
($74/oz)
› Well run operation
with short-term
payback
› Aggressive
exploration
program to prove
up additional
resources
› Expanding
throughput
› Alignment of
business strategy
with AGA
› Operations largely
unaffected by Mali
situation
› Upside potential
on main pit
extension and for
sulphide resources
on satellite ore
bodies
› On track for Q1’13
start-up, meeting
production targets
› Exploration
continues to increase
return on investment
› Effective HR strategy
to address high
labour demand in
Abitibi region
Essakane Rosebel Sadiola Westwood Côté Lake
› 7+ year history of
reserve growth
› Proactively
managing
transition to hard
rock
› Potential Future
expansion to
incorporate
satellite resources

7/26/2012
77
Leverage Core Competencies to Advance Strategic Priorities
153
› Significant expansion
› Attractive market fundamentals
› Disciplined funding approach
Niobec Rare Earth Elements
› Massive deposit
› Speed to market advantage
› Optionality
Growth Strategy
154
Increase productivity
Expand and optimize existing mines
Evaluate acquisition opportunities
Pursue exploration plays
Surface full value of Niobec
Exploit rare earth potential
Focused on maximizing return on capital

7/26/2012
78
Investment Highlights
155
Diversified portfolio of long-life gold assets
Proven operating, exploration and development expertise
Demonstrated CSR leadership
Unique niobium asset and an untapped REE deposit
Strong balance sheet
Return on capital driven growth strategy
TSX: IMG NYSE: IAG
APPENDIX
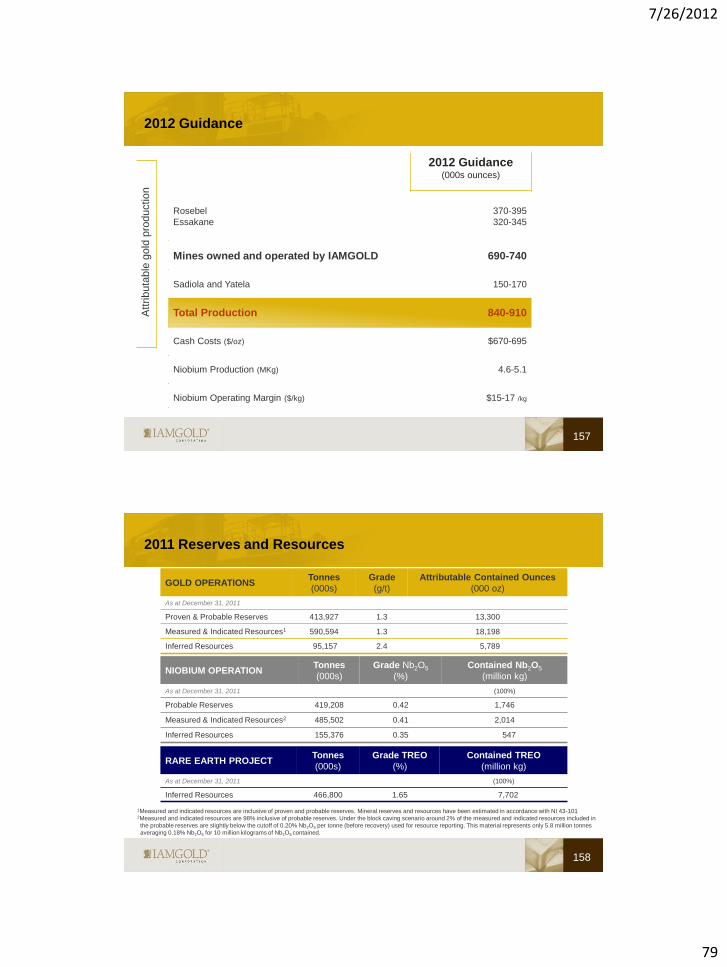
7/26/2012
79
2012 Guidance (000s ounces)
Rosebel
Essakane
370-395
320-345
Mines owned and operated by IAMGOLD 690-740
Sadiola and Yatela 150-170
Total Production 840-910
Cash Costs ($/oz) $670-695
Niobium Production (MKg) 4.6-5.1
Niobium Operating Margin ($/kg) $15-17 /kg
2012 Guidance
157
Att
rib
uta
ble
gold
pro
ductio
n
2011 Reserves and Resources
158
GOLD OPERATIONS Tonnes
(000s)
Grade
(g/t)
Attributable Contained Ounces
(000 oz)
As at December 31, 2011
Proven & Probable Reserves 413,927 1.3 13,300
Measured & Indicated Resources1 590,594 1.3 18,198
Inferred Resources 95,157 2.4 5,789
NIOBIUM OPERATION Tonnes
(000s)
Grade Nb2O5
(%)
Contained Nb2O5
(million kg)
As at December 31, 2011 (100%)
Probable Reserves 419,208 0.42 1,746
Measured & Indicated Resources2 485,502 0.41 2,014
Inferred Resources 155,376 0.35 547
RARE EARTH PROJECT Tonnes
(000s)
Grade TREO
(%)
Contained TREO
(million kg)
As at December 31, 2011 (100%)
Inferred Resources 466,800 1.65 7,702
1Measured and indicated resources are inclusive of proven and probable reserves. Mineral reserves and resources have been estimated in accordance with NI 43-101 2Measured and indicated resources are 98% inclusive of probable reserves. Under the block caving scenario around 2% of the measured and indicated resources included in
the probable reserves are slightly below the cutoff of 0.20% Nb2O5 per tonne (before recovery) used for resource reporting. This material represents only 5.8 million tonnes
averaging 0.18% Nb2O5 for 10 million kilograms of Nb2O5 contained.
7/26/2012
80
Notes regarding reserves and resources
159
Cautionary Note to Investors Concerning Estimates of Measured and Indicated Resources
This presentation uses the terms "measured resources" and "indicated resources". We advise investors that while those
terms are recognized and required by Canadian regulations, the SEC does not recognize them. Investors are cautioned
not to assume that any part or all of mineral deposits in these categories will ever be converted into reserves.
Cautionary Note to Investors Concerning Estimates of Inferred Resources
This presentation also uses the term "inferred resources". We advise investors that while this term is recognized and
required by Canadian regulations, the SEC does not recognize it. "Inferred resources" have a great amount of uncertainty
as to their existence, and great uncertainty as to their economic and legal feasibility. It cannot be assumed that all or any
part of an inferred mineral resource will ever be upgraded to a higher category. Under Canadian rules, estimates of
inferred mineral resources may not form the basis of feasibility or pre-feasibility studies, except in rare cases. Investors
are cautioned not to assume that part or all of an inferred resource exists, or is economically or legally mineable.
Scientific and Technical Disclosure
IAMGOLD is reporting mineral resource and reserve estimates in accordance with the CIM guidelines for the estimation,
classification and reporting of resources and reserves.
Investors are cautioned not to assume that part or all of an inferred resource exists, or is economically or legally mineable.
A feasibility study is a comprehensive technical and economic study of the selected development option for a mineral
project that includes appropriately detailed assessments of realistically assumed mining, processing, metallurgical,
economic, marketing, legal, environmental, social and governmental considerations together with any other relevant
operational factors and detailed financial analysis, that are necessary to demonstrate at the time of reporting that
extraction is reasonably justified (economically mineable). The results of the study may reasonably serve as the basis for
a final decision by a proponent or financial institution to proceed with, or finance, the development of the project. The
confidence level of the study will be higher than that of a Pre-Feasibility Study.
Cautionary Language on Reserves and Resources
160
Scientific and Technical Disclosure
Trelawney mineral resource estimates reference the Technical Report on the Côté Lake Resource Update, Chester Property,
Ontario, Canada reported in accordance with National Instrument 43-101 requirements, signed by W. Roscoe and B. Cook,
Roscoe Postle Associates Inc., effective February 24, 2012.
IAMGOLD reports mineral resource and reserve estimates in accordance with the CIM definitions.
Investors are cautioned that mineral resources are not mineral reserves and do not have demonstrated economic viability.
A feasibility study is a comprehensive technical and economic study of the selected development option for a mineral project
that includes appropriately detailed assessments of realistically assumed mining, processing, metallurgical, economic,
marketing, legal, environmental, social and governmental considerations together with any other relevant operational factors
and detailed financial analysis, that are necessary to demonstrate at the time of reporting that extraction is reasonably
justified (economically mineable). The results of the study may reasonably serve as the basis for a final decision by a
proponent or financial institution to proceed with, or finance, the development of the project. The confidence level of the study
will be higher than that of a Pre-Feasibility Study.
Qualified Person/Control Notes on Côté Lake Reserves and Resources
Geoffrey Chinn P.Geo., Manager Resource Geology of IAMGOLD and David Beilhartz P.Geo, Vice-President Exploration of
Trelawney, both Qualified Persons as defined under National Instrument 43-101, have reviewed and approved this disclosure
having current knowledge of the project.