2012 results - laird plc · 2012 results 1 march 2013 1 . agenda 1. introduction and results...
TRANSCRIPT

2012 Results 1 March 2013
1
Agenda
1. Introduction and Results overview – David Lockwood
2. Financial performance - Jonathan Silver
3. Operational performance – David Lockwood
2

Our differentiation
3
Customer Mindshare
Innovation Reliable Fulfilment
Speed
2012 highlights: delivering growth
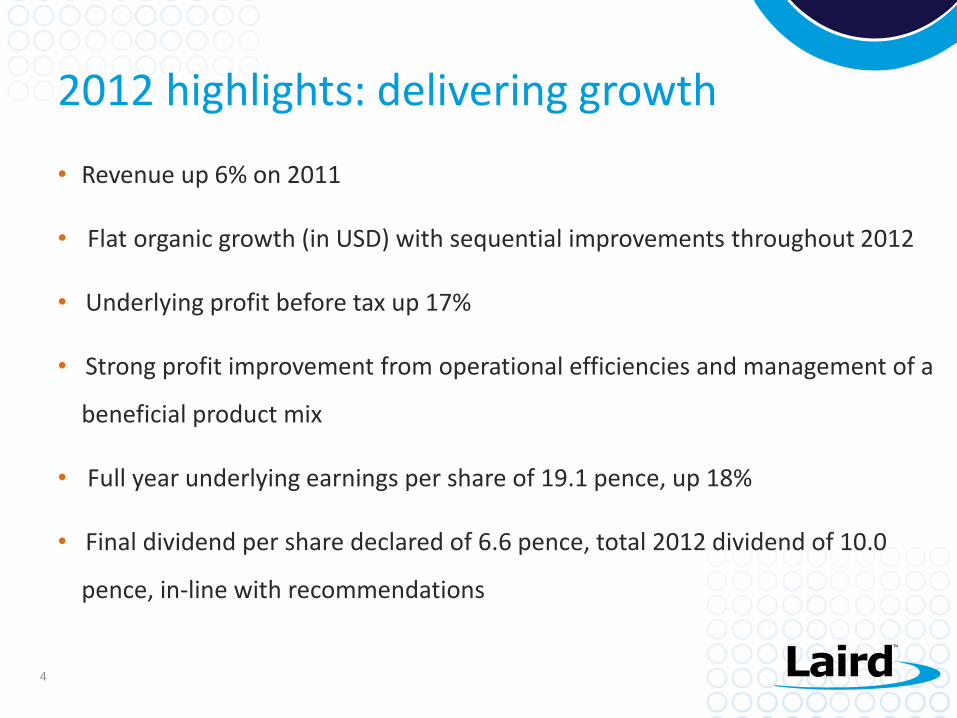
• Revenue up 6% on 2011
• Flat organic growth (in USD) with sequential improvements throughout 2012
• Underlying profit before tax up 17%
• Strong profit improvement from operational efficiencies and management of a
beneficial product mix
• Full year underlying earnings per share of 19.1 pence, up 18%
• Final dividend per share declared of 6.6 pence, total 2012 dividend of 10.0
pence, in-line with recommendations
4

5
Financial Performance
Jonathan Silver
Continuing operations revenue & profit
6
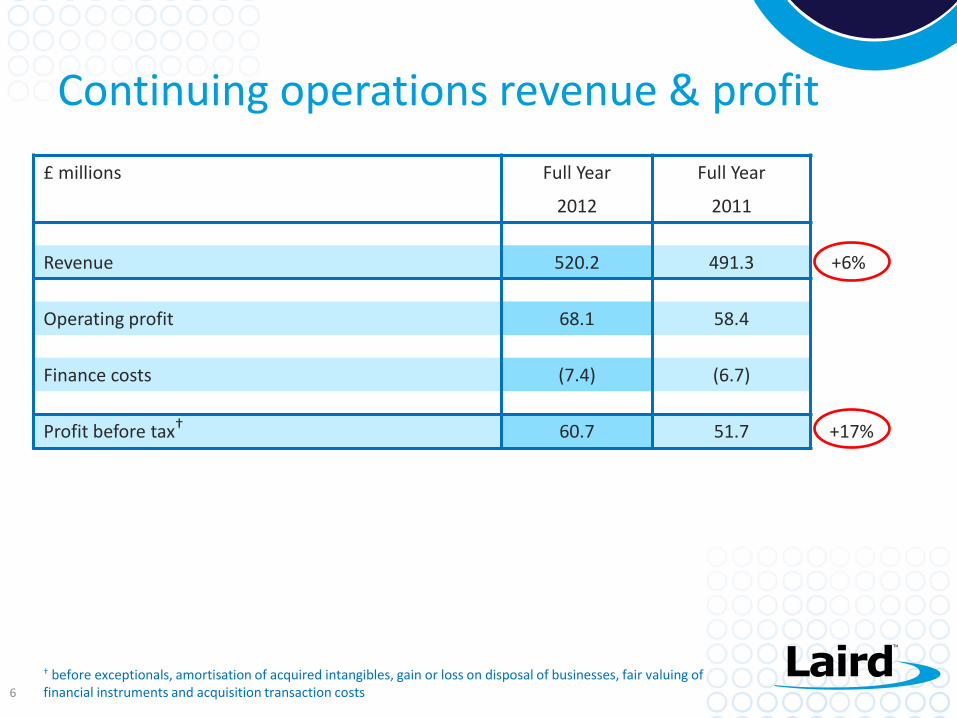
£ millions Full Year Full Year
2012 2011
Revenue 520.2 491.3 +6%
Operating profit 68.1 58.4
Finance costs (7.4) (6.7)
Profit before tax† 60.7 51.7 +17%
† before exceptionals, amortisation of acquired intangibles, gain or loss on disposal of businesses, fair valuing of financial instruments and acquisition transaction costs

Segmental analysis in £ and US$
7
Actual 2012 £m
Actual 2011 £m
%
Δ Actual 2012 $m
Actual 2011 $m
%
Δ
Performance Materials (PM)
Revenue 324.7 305.0 +6% 514.4 489.5 +5%
Operating profit† 48.9 43.0 +14% 77.5 69.0 +12%
Wireless Systems (WS)
Revenue 195.5 186.3 +5% 309.7 299.1 +4%
Operating profit† 25.8 22.7 +14% 40.9 36.4 +12%
Unallocated costs (6.6) (7.3) (10.5) (11.7)
Total
Revenue 520.2 491.3 +6% 824.1 788.6 +5%
Operating profit† 68.1 58.4 +17% 107.9 93.7 +15%
† before exceptionals, amortisation of acquired intangibles, gain or loss on disposal of businesses and acquisition transaction costs

Margin performance
8
Actual 2012
Actual 2011
US$m US$m
Revenue 824.1 788.6
Cost of sales (494.1) (491.1)
Gross margin 330.0 40.0% 297.5 37.7%
SG&A (169.2) (160.4)
Gross R&D (58.0) 7.0% (49.7) 6.3%
Net capitalised development 5.1 6.3
Operating profit† 107.9 13.1% 93.7 11.9%
† before exceptionals, amortisation of acquired intangibles, gain or loss on disposal of businesses and acquisition transaction costs
• Stepping up R&D spend in 2012/2013

Performance Materials – revenue bridge
9
$21m
EMI
$15m Thermal
$489m
$514m
+6%*
-12%*
$14m
EMI acq
$1m
SIP
2%*
0
10
20
30
40
50
2009 2010 2011 2012
0
20
40
60
80
100
120
140
2009 2010 2011 2012
0
100
200
300
400
2009 2010 2011 2012
EMI
Thermal
Signal Integrity Products
* year on year organic growth in US$ † refers to Klüver acquisition made in 2011
• Performance Materials organic revenue growth was 1%
• Smartphones and tablet shielding principal driver of EMI growth
• Thermal revenues impacted by subdued Telecoms market
$4m
Thermal acq†

Year ended 31 December 2012 2011
($ millions) Year Year
Revenue 514.4 489.5 +5%
Operating profit† 77.5 69.0 +12%
Return on sales 15.1% 14.1%
Performance Materials Division
10
• $3m profit contribution from acquisitions
† before exceptionals, amortisation of acquired intangibles and acquisition transaction costs

$(2)m TELE/M2M
$299m
$310m
-1%*
-6%*
$m
WACS
$13m
M2M acq
Wireless Systems – revenue bridge
11 * year on year organic growth in US$
• Revenue on an organic basis 1% lower
• Good demand from the automotive and wireless infrastructure markets
• Weaker industrial and European market demand
0
40
80
120
160
200
2009 2010 2011 2012
0
20
40
60
80
2009 2010 2011 2012
Infrastructure Antennae
Telematics / M2M
0
20
40
60
80
2009 2010 2011 2012
Wireless Automation & Control Solutions
$13m
IAS
+25%*
$(4)m
WACS $(9)m TELE
Inventory transfer

Year ended 31 December 2012 2011
($ millions) Year Year
Revenue 309.7 299.1 +4%
Operating profit† 40.9 36.4 +12%
Return on sales 13.2% 12.2%
Wireless Systems Division
12
† before exceptionals, amortisation of acquired intangibles and acquisition transaction costs
• $2m profit contribution from acquisitions
• Margin improvement driven by vertical integration and product rationalisation

£ millions Discontinued Continuing Full Year
2012 2012 2011
Operating profit 1.5 68.1 59.4
Depreciation 13.5 17.0
Amortisation of capitalised development 5.3 6.4
Other and non-cash 1.8 1.3
1.5 88.7 84.1
Decrease / (increase) in working capital† 11.1 7.5 (0.3)
Capitalised development - (8.5) (9.1)
Capital expenditure (0.3) (13.3) (12.0)
Operating cash flow 12.3 74.4 62.7
Total 86.7
Strong cash conversion
13 † after adjusting for creditor decreases on exceptional items of £12.4m at 31 December 2012
• Cash conversion of 109 % (2011, 104%) from continuing operations
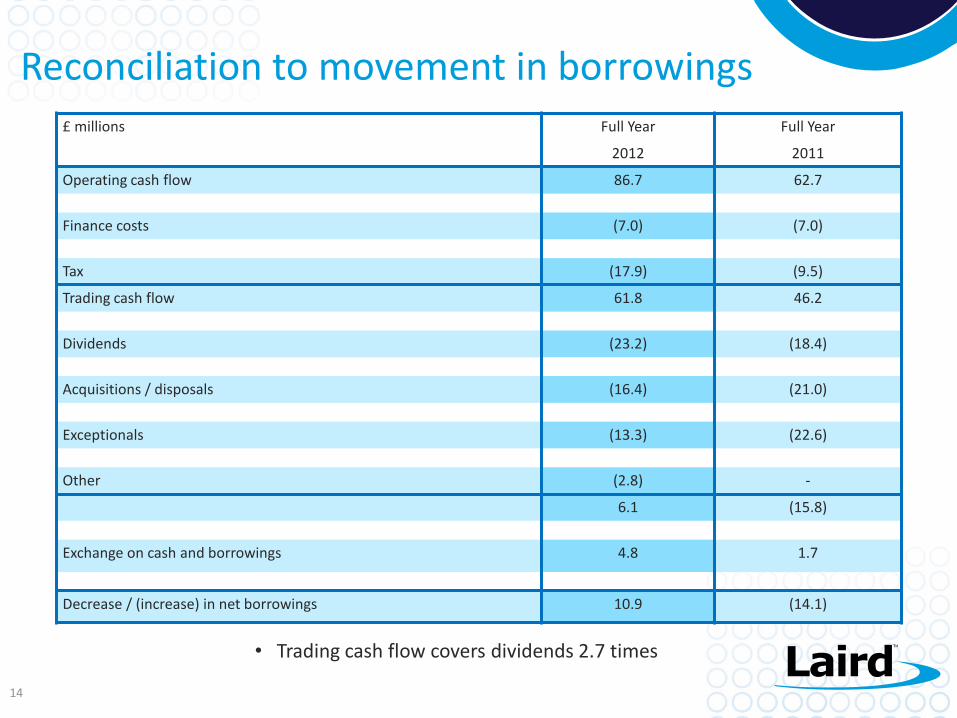
£ millions Full Year Full Year
2012 2011
Operating cash flow 86.7 62.7
Finance costs (7.0) (7.0)
Tax (17.9) (9.5)
Trading cash flow 61.8 46.2
Dividends (23.2) (18.4)
Acquisitions / disposals (16.4) (21.0)
Exceptionals (13.3) (22.6)
Other (2.8) -
6.1 (15.8)
Exchange on cash and borrowings 4.8 1.7
Decrease / (increase) in net borrowings 10.9 (14.1)
Reconciliation to movement in borrowings
14
• Trading cash flow covers dividends 2.7 times
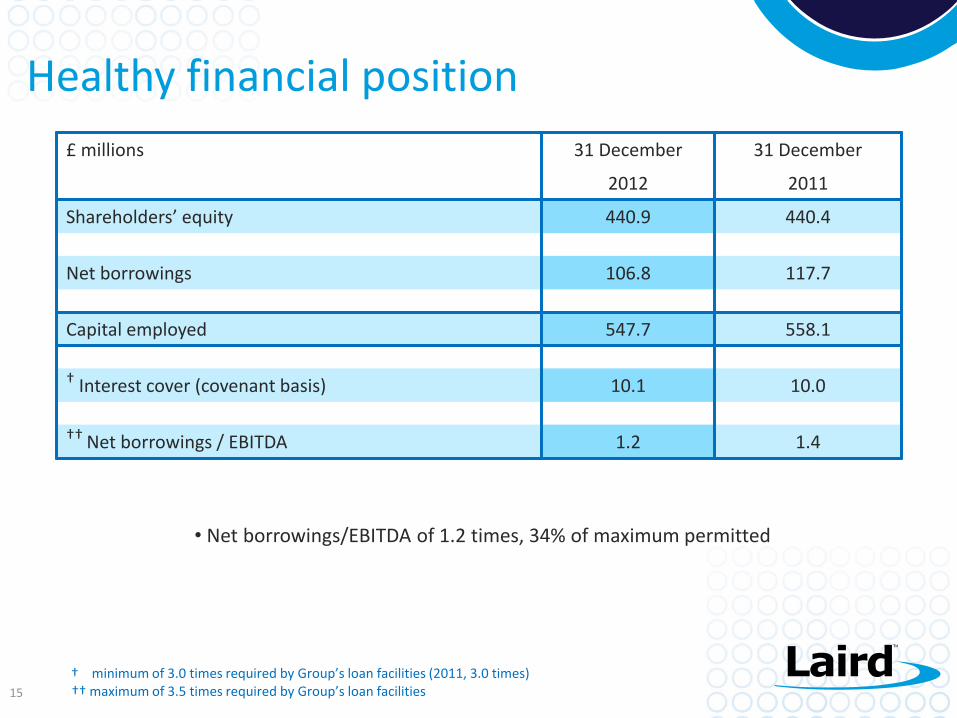
Healthy financial position
15
£ millions 31 December 31 December
2012 2011
Shareholders’ equity 440.9 440.4
Net borrowings 106.8 117.7
Capital employed 547.7 558.1
† Interest cover (covenant basis) 10.1 10.0
†† Net borrowings / EBITDA 1.2 1.4
† minimum of 3.0 times required by Group’s loan facilities (2011, 3.0 times) †† maximum of 3.5 times required by Group’s loan facilities
• Net borrowings/EBITDA of 1.2 times, 34% of maximum permitted
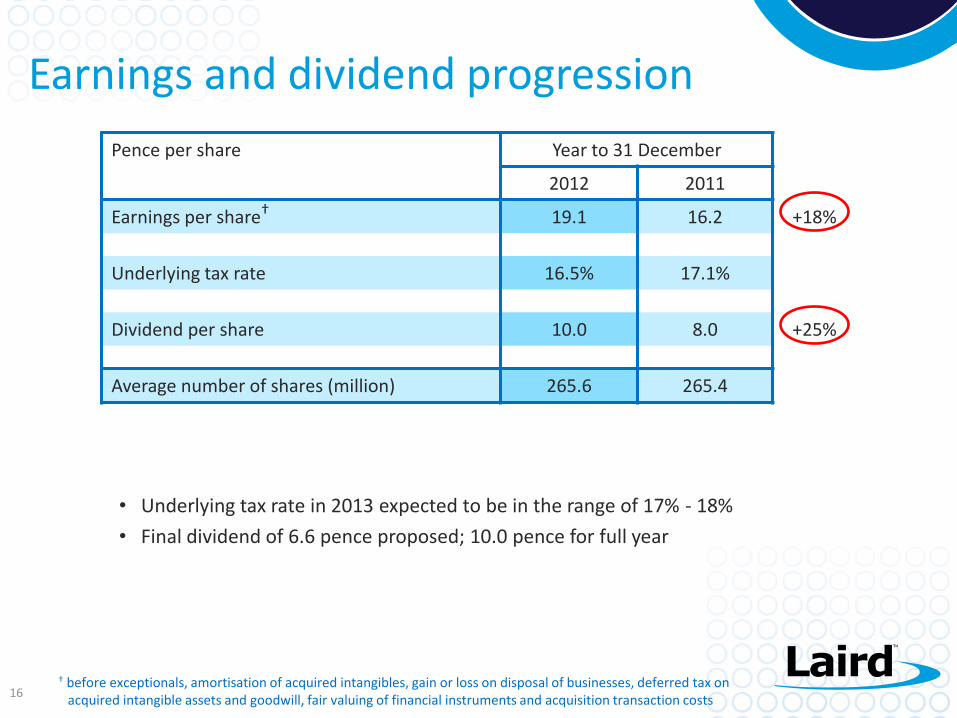
Earnings and dividend progression
16
Pence per share Year to 31 December
2012 2011
Earnings per share† 19.1 16.2 +18%
Underlying tax rate 16.5% 17.1%
Dividend per share 10.0 8.0 +25%
Average number of shares (million) 265.6 265.4
• Underlying tax rate in 2013 expected to be in the range of 17% - 18%
• Final dividend of 6.6 pence proposed; 10.0 pence for full year
† before exceptionals, amortisation of acquired intangibles, gain or loss on disposal of businesses, deferred tax on acquired intangible assets and goodwill, fair valuing of financial instruments and acquisition transaction costs

17
Operational Performance
David Lockwood

Laird’s differentiation
captured
Growth opportunities
identified
Operations aligned to refined Business Model
Growth Opportunities
• New segments in Industrial / Medical and Automotive
• Expansion in Automotive and Wireless Telecom
• Handset target one or two additional key OEMs
• Notebook strategic saturation and commoditization
Ind/Med/Mil Notebook Automotive -OEM
Handset Automotive -T1
Telecom -Wireless
Other IT Telecom -Wired
Tablet Consumer
Segment OEM Design Opportunity and Laird Penetration
Market Laird
USA RoEMEA Taiwan Germany Japan Korea China RoA RoAPAC Other
Regional OEM Design Opportunity and Laird PenetrationMarket Laird
* 'Other' represents broadly mixed geography
• Germany and Europe growth in new segments
• Expand current capabilities into China, Korea, and Japan through local OEM’s
A year of significant change
18

28%
11%
25%
3%
16%
11%
6%
IT / Telecom Industrial Transportation Medical
Handsets Other Consumer
Serving the right market segments
19
BY PRODUCT SEGMENT (%)
FY 2012 REVENUE £520.2m
BY MARKET SEGMENT (%)*
43%
14% 5%
22%
8%
8%
EMI Shielding
Thermal
Signal Integrity
Telematics / Wireless Modules
Infrastructure Antennae
Wireless Automation and Control
Performance Materials
Wireless systems
Performance Materials
Wireless systems
* % has been reclassified from Industrial to Transportation from H1 2012
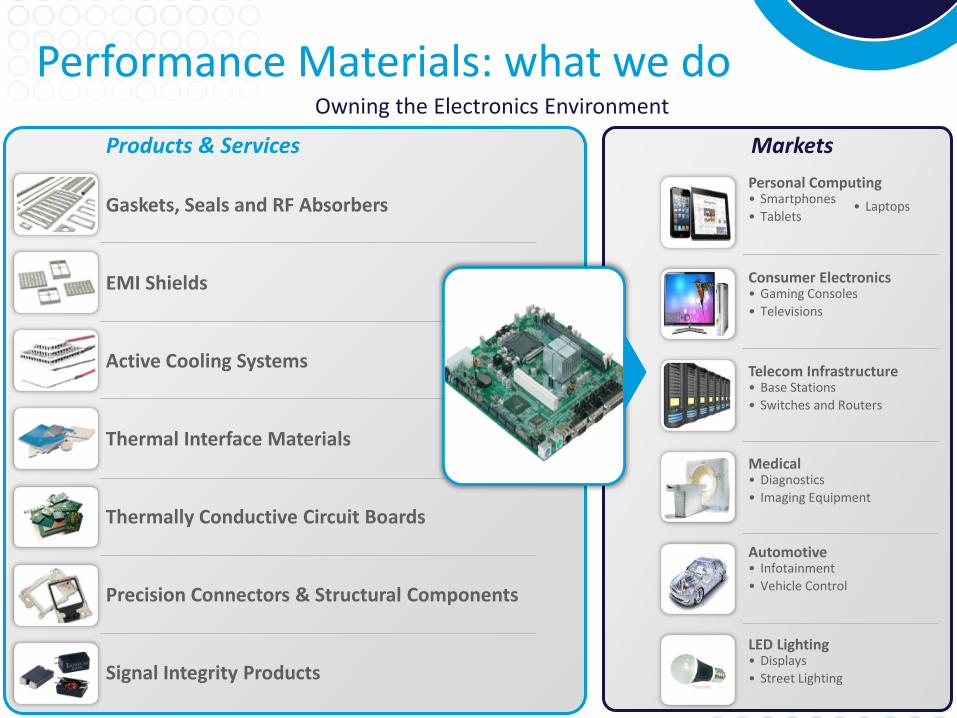
Performance Materials: what we do
20
Gaskets, Seals and RF Absorbers
EMI Shields
Active Cooling Systems
Thermal Interface Materials
Thermally Conductive Circuit Boards
Precision Connectors & Structural Components
Signal Integrity Products
Products & Services Markets
Personal Computing • Smartphones
• Tablets
Consumer Electronics • Gaming Consoles
• Televisions
Telecom Infrastructure • Base Stations
• Switches and Routers
Medical • Diagnostics
• Imaging Equipment
Automotive • Infotainment
• Vehicle Control
LED Lighting • Displays
• Street Lighting
• Laptops
Owning the Electronics Environment

Value ‘Sweet Spot’: Matching demand in Performance Materials
OEM Design
Contract Manufacture
Commodity • Available from many sources • Minimal differentiation • Minimal engineering required • Sales through distribution
System Core • Significant customer resource
to design and purchase • Large part of customer BOM • Specialised supply base • Typically capital intensive • Life-cycle driver
Custom Engineered • Capabilities enable design
freedom • Engineered customer cost saving • Low cost relative to core parts • Provide customer design resource • Short customer design time
DES
IGN
DES
IGN
DES
IGN
Component Supply
Well positioned to provide as devices become smaller, faster and higher powered

Client / Server applications
Antennas
Rechargeable Power
Embedded Radio Modules
Tracking Devices/Smart Antennas
Wireless Automation And Control
Products & Services
Transportation • Rail
• Automotive and commercial truck • Fleet management
Industrial • Heavy equipment and mining
• Material handling
• Energy and remote monitoring
Wireless infrastructure • WLAN
• Telecom (WWAN) • Public Safety
• Industrial and Commercial Wireless
Medical • Hospital equipment
• Home health care devices • Client Server application
Markets
Wireless Systems Enabling Wireless Communication
Turning data into insights and actions in real time – predictive and preventive thorough innovative Software solutions
Sensing, Connecting and collecting data to and from devices and systems of “all things” via embedded wireless and sensing technology
Improve wireless devices and system performance thorough antenna technology
Powering remote or handheld wireless communication devices
Enablement

Innovation in Wireless Systems
23
Smart 4G MIMO antenna for use in automotive global navigation and communication systems
Exi
stin
g
MA
RK
ET
Ne
w
Existing PRODUCT New
x
Bluetooth Low Energy (BLE) modules enable short range wireless connectivity for ultra-low power sensor applications. Launching in Q2 2013
Exi
stin
g
MA
RK
ET
Ne
w
Business Unit Roles
& Responsibility
Existing PRODUCT New
x
Business Unit Roles
& Responsibility

Innovation in Performance Materials
Thermal interface material used to cool microprocessors
Exi
stin
g
MA
RK
ET
Ne
w
Business Unit Roles
& Responsibility
Existing PRODUCT New
x
Robotic arm used in small part process assembly for smartphones and tablets
Exi
stin
g
MA
RK
ET
Ne
w
Business Unit Roles
& Responsibility
Existing PRODUCT New
x x

Acquisition of Nextreme
25
Thermal thin film energy harvesting
Exi
stin
g
MA
RK
ET
Ne
w
Business Unit Roles
& Responsibility
Existing PRODUCT New
x
• Year-long relationship with Nextreme
prior to acquisition
• Enabled us to test the market
• Deep understanding of the product
• De-risked the acquisition
• Innovative technology
• Enables us to move into complementary
new markets

Outlook
26
Innovation, reliable fulfilment and speed are key to delivering
future growth
Positioned in growth markets with
comprehensive product offering
Increasing investment on innovation through
disciplined R&D
Strategic direction for growth aligned to
selected markets, not OEMs
Confident in our ability to deliver on medium to long-term targets
Strong balance sheet 2013 revenue seasonally weighted to second half of the year

27
Q&A

28
Appendix

Business Model
29
Market Development
New segments to Laird
New geographies to Laird
Adjacent segments
Cross Business Unit
Mergers & Acquisitions
New Laird business
New geographic expansion
Business Unit strategic
Core Business
Customer and product focused growth
Technology Development
Organic business development
New Business Unit products
Division enables BU-Company and
Cross-BU interaction
E
xist
ing
MA
RK
ET
New
Existing PRODUCT New
Company Roles
& Responsibility
Business Unit Roles
& Responsibility

Margin trajectory model
30
PBIT 12
PBIT 20
IO 26
IO 31
Rev 100
Rev 133
ASSUMPTIONS
• No change in product mix
• 70% of costs variable, 30% fixed
• Variable moves with revenue, fixed with inflation
MODEL OUTPUT
• Profit drop through 25% on incremental revenue
• Revenue growth >30%; PBIT growth >60%
REV: Revenue IO: Indirect overheads PBIT: Profit before interest & tax
12.0% RoS 15.0%
Economies of scale from organic revenue growth
I N
D E
X

Performance Materials Division performance
31
• Revenue up 11% YoY • Strong demand for tablets & smartphones • Additional capacity expansion serving us well • Telecoms and IT markets remained subdued • Lower demand seen for some consumer electronics e.g. plasma display TVs
Supplying the Handset, IT,/datacom & automotive sectors
• Revenue down 8% YoY • Telecoms demand remained subdued • Some initial signs of demand improving
Supplying the IT/datacom, medical & consumer sectors
EMI Shielding
• Revenue up 2% YoY • IT & Printer sales remained weak • Maintained market position with the customers we serve [despite this]
Supplying the IT, consumer & automotive sectors
Thermal Solutions Signal Integrity
BY PRODUCT SEGMENT
69%
22%
9% EMI
Thermal
Signal Integrity
BY MARKET SEGMENT
• Revenue up 6% YoY • Organic revenue up 1% • Sequential growth in 2012 • Good margin improvements
2012 REVENUE £325m
35%
25%
23%
8% 5%
4% IT/Telecom
Handset
Other
Consumer
Medical
Transportation

• Revenue up 1% YoY • N.American auto market remained robust • M2M products rationalised to avoid more standardised areas • Vertical integration has helped improve margins
Supplying the transportation and industrial sectors
• Revenue down 6% YoY • Capital spend in rail markets has been deferred • Solid after-market revenues
Supplying the rail, industrial (transportation) and mining sectors
Telematics/M2M
• Revenue up 25% YoY • Strong demand from WLAN, RFID, cellular networks • Demand driven by increasing bandwidth requirements
Supplying the IT/datacom and industrial sectors
Wireless Automation & Control Solutions
Infrastructure Antennae
• Revenue up 5% YoY • Organic revenue 1% lower • Variable performance dependent on specific markets and geographies • Good margin improvements
2012 REVENUE £196m
57% 22%
21% Telematics & "M2M"
WACS
Infrastructure & otherantennae
BY PRODUCT SEGMENT
BY MARKET SEGMENT
Wireless Systems Division performance
32
58% 21%
17% 4%
Transportation
Industrial
IT/Telecom
Other

Measuring our strategic progress
33
Target: Medium to Long-term FY 2012 result
Organic revenue growth averaging 10% per annum
Flat/+1% in a low growth environment
Underlying return on sales margin of 15% 13.1% from operating efficiencies, product mix and vertical integration
Dividend per share of 10p for 2012 Total dividend of 10p declared