2013-10-14 europe’s digital economy at risk
TRANSCRIPT

Europe’s Digital Economy at Risk
Eight trends why the European digital economy is losing ground –key measures to regain a leading position.key measures to regain a leading position.
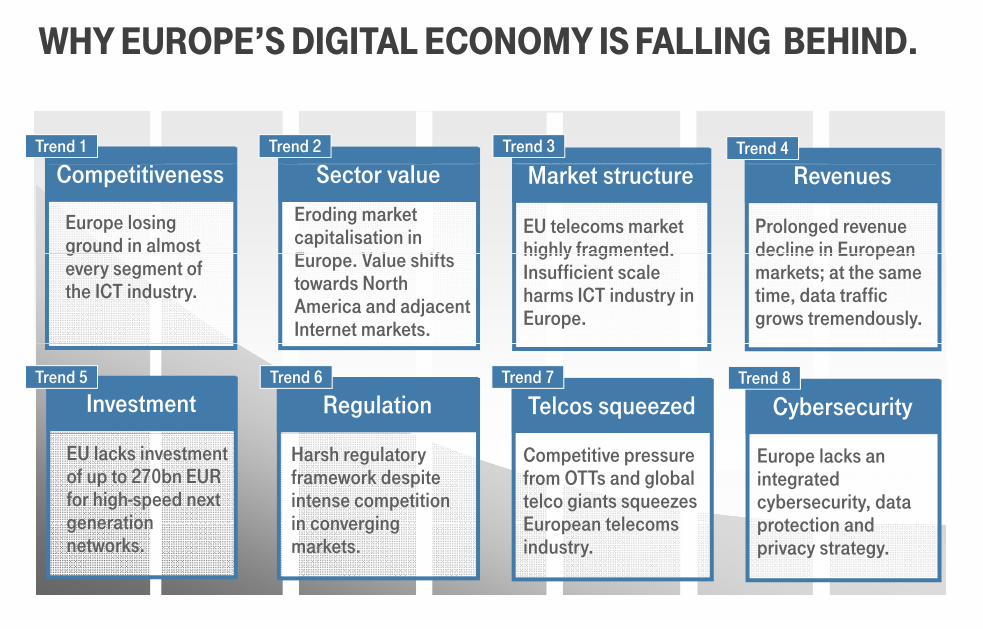
WHY EUROPE’S DIGITAL ECONOMY IS FALLING BEHIND.
Trend 2 Trend 3 Trend 4Trend 1
Competitiveness Sector value Market structure Revenues
Europe losing ground in almost
Prolonged revenue decline in European
EU telecoms market highly fragmented.
Eroding market capitalisation in E V l hift
gevery segment of the ICT industry.
decline in European markets; at the same time, data traffic grows tremendously.
highly fragmented. Insufficient scale harms ICT industry in Europe.
Europe. Value shifts towards North America and adjacent Internet markets.
RegulationInvestment Telcos squeezedTrend 5 Trend 6 Trend 7
CybersecurityTrend 8
EU lacks investment of up to 270bn EUR for high-speed next generation
Harsh regulatory framework despite intense competition in converging
Competitive pressure from OTTs and global telco giants squeezes European telecoms
Europe lacks an integrated cybersecurity, data protection and generation
networks. in converging markets.
European telecoms industry.
protection and privacy strategy.
2

TREND 1: ACROSS ICT SEGMENTS AMERICAN AND ASIAN COMPANIES DOMINATE GLOBAL MARKETSASIAN COMPANIES DOMINATE GLOBAL MARKETS.
TrendsICT Leaders 2011/12 (by revenues)
Less than 10 percent of global ICT revenues are generated by European companies.companies.
Former market leaders have been picked up by global competitors (Nokia) or have exited market segments g(Siemens).
Many European industries are increasingly reliant on non-European ICT players.
Source: A.T. Kearney, IDATE, Alexa, Financial Times
3

TREND 1: GLOBAL PLAYERS FORGING THEIR WAY INTO EUROPE’S DIGITAL ECONOMYEUROPE’S DIGITAL ECONOMY.
Inorganic Moves
+
DEALSEUROPE: FROM INNOVATOR TO
TAKE-OVER TARGET?TARGET?Austria
RUMORS or
4

TREND 2: ERODING MARKET CAPITALIZATION IN EU. VALUE SHIFTS OUTWARDSVALUE SHIFTS OUTWARDS.
GLOBAL OTT GIANTSGLOBAL TELCO GIANTS LEADING EUROPEAN TELCOS
Ø EV/EBITDA: 5,3x Ø EV/EBITDA: 5,2x Ø EV/EBITDA: 14,1x
309
222204
4350
11257
106139
160
102 108
ex VZW1
31010204350
47
Market cap in bn EURMarket cap in bn EURM k t i b EUR
Group CAGR:2005-2013 + 8.6 % Group CAGR:
2005-2013 - 6.8 % Group CAGR:2005-2013 + 10.9 %
Market cap in bn EURMarket cap in bn EURMarket cap in bn EUR
5

TREND 2: NEGATIVE TOTAL SHAREHOLDER RETURNS FOR MANY EUROPEAN INCUMBENTS VS GLOBAL PEERSFOR MANY EUROPEAN INCUMBENTS VS. GLOBAL PEERS.
I t ti l T l
Annualized Total Shareholder Return (12/2009 – 12/2012)
Turk Telekom (25%)
International Telcos
Verizon (18%)
Softbank (14%)
Telenor (16%)
Swisscom (6%) KDDI (10%)European TelcosAT&T (13%)
Vodafone (9%)Swisscom (6%) KDDI (10%)p
Deutsche Telekom (-1%)
Telekom Austria (-11%)
France Telecom (-13%)
Belgacom (-5%)
Telekom Polska (0%)Teliasonera (-0%)
- -30 -20 -10 0 10 20 30 40
( )
Portugal Telecom (-10%)Telefonica (-12%)
KPN (-29%) Telekom Italia (-9%)
Annualized Total Shareholder Return in % (12/2009 – 12/2012)
6
Source : BCG.

TREND 3: EU TELECOMS MARKET HIGHLY FRAGMENTEDINSUFFICIENT SCALE HARMS INDUSTRY– INSUFFICIENT SCALE HARMS INDUSTRY.
TrendsEuropean Commission: “Fragmented European Market”
American and Asian operators are able to serve hundreds of millions of customers each in one consolidated market
TrendsEuropean Commission: Fragmented European Market .
510m300m 1,500m
USA EU China
one consolidated market. In Europe, merger remedies
have repeatedly reversed market-driven consolidation (e g twice in Austria)
510mPop.
300mPop.
,
Population
200 national operators4-5 nation-wide operators 4-5 nation-wide operators (e.g. twice in Austria). The lack of scale impedes
European telecom investments in next-generation technology.
USA benefits from lower
200 national operators4-5 nation-wide operators
Scale matters
Source: European Commission.
Increased coverage **OPEX savings * CAPEX savings *
4-5 nation-wide operators
USA benefits from lower spectrum costs (0.55 EUR/ pop/MHz vs. 0.77 in Europe).1)
Intra-European consolidation difficult due to framework
Increased coverage OPEX savings
-10%
CAPEX savings
-20%
LTE
cove
rage
difficult due to framework conditions. EU companies become targets for non-European rivals.
** Increased coverage: With higher market share it becomes economically
Critical market sharebefore after
Mergerbefore after
Merger
* Example values from Sunrise/Orange merger 1) Analysis of 800 MHz auctions in the EU (2011 2013) vs
7
Source: BCG (2013).** Increased coverage: With higher market share it becomes economically
viable to increase coverage to less densely populated areas.* Example values from Sunrise/Orange merger
proposal.
1) Analysis of 800 MHz auctions in the EU (2011-2013) vs.700 MHz auctions in the USA (2008)

TREND 4: DECLINE OF EUROPEAN TELECOM REVENUES.
TrendsEuropean Commission: “Pressure is growing”.
Western Europe
Telecom RevenuesIP Traffic
Western Europe While IP Traffic grows,
revenues shrink continuously. Despite huge growth in
demand for their services 2008 2016e 2016e
Western Europe
+836%
2008
Western Europe
-10%
telecoms companies in Europe face decreasing revenues.
This is in stark contrast to the
North America
+966%North America
+35%U.S. and Asia Pacific where revenues are on the rise.
Prices in European Markets are under pressure due to
l t i t ti d
2008 2016e 2016e
Asia Pacific
2008
Asia Pacificregulatory intervention and competition.
2008 2016e 2008 2016e
+1,006% +40%
Source: European Commission (Sep. 2013)
8

TREND 4: PROLONGED REVENUE DECLINE IN EUROPEAN MARKETS EUROPEAN MARKETS.
Wireless service revenues per capita in the U.S. and Europe Trends
40 US
3
EUR
U.S. consumers generate higher revenues per capita f bil i l i
34
36
38
40 39
for mobile wireless services compared to European consumers.
Revenue growth allows U.S. carriers to deploy LTE at a 26
28
30
32
carriers to deploy LTE at a much faster pace than the EU.
20
22
24
26
7 7 7 7 8 8 8 8 9 9 9 9 0 0 0 0 1 1 1 1 2 2 2
Europe US EU
25
Source: Bernstein Research (Feb 2013). Exchange rate USD/EUR as of Sep 12.
Mrz
07
Jun
07Se
p 07
Dez
07
Mrz
08
Jun
08Se
p 08
Dez
08
Mrz
09
Jun
09Se
p-09
Dez
09
Mrz
10
Jun-
10Se
p-10
Dez
10
Mrz
11
Jun
11Se
p 11
Dez
11
Mrz
12
Jun
12Se
p 12
9

TREND 4: LOW PRICE LEVEL AS WELL AS LOW NGA PENETRATION IN EUROPEPENETRATION IN EUROPE.
Monthly revenues and high speed broadband penetration levels
2012 monthly ARPU/ARPA (in EUR) 2012 LTE and FTTH/B penetration1
74 8% 48%Japan
65 3% 7%USA
40 0,4% 3%EU0 0, % 3%EU
10
1) LTE subscriber penetration; FTTH/B household penetration.Source: BCG; Informa.

TREND 4: EUROPEAN DIGITAL ECONOMY SUFFERS FROM DECLINING PROFIT POOLS FROM DECLINING PROFIT POOLS.
Europe – EU 27 North America Asia Pacific
Shares of the World’s Digital Economy EBITDA
32%
Regional Share of Global Digital Economy’s 41%36%
27% 31%
+4pp+5pp-13pp
2012
19%
2002
32%g yEBITDA
20122002 2002
27%
2012
31%
Regional Share of Global Telecoms & Cable Operators’ EBITDA 27%
38%24% 26% 33%32%
+2pp +1pp-11pp
EBITDA
2012
27%
2002 20122002
24% 26%
20122002
Source: DT Group Development, based on data from Factset (comparison of 387 listed companies).Digital Economy: Telecommunications services and equipment, Content services & applications, TV services, Software and IT services, Computer hardware, Consumer electronics
11
, p ,

TREND 5: EU LACKS INVESTMENT FOR HIGH-SPEED NEXT GENERATION NETWORKSNEXT GENERATION NETWORKS.
Telecommunications investment in EUR per capita Trends
EUR210
Investment of up to 270 bn EUR required to roll-
t fib b d hi h
US
170
190180
170out fibre based high-speed networks in Europe.
Long term investment level in Europe is well
Asia Pacific
130
150
130level in Europe is well below the U.S. and Asia/Pacific level.
EU
90
110
Source: OECD Communications Outlook 2013. Asia: Japan, South Korea, Australia, New Zealand. Data estimated for 2012 and 2013.
702003 2004 2005 2006 2007 2008 2009 2010 2011 2012e 2013e
USA EU-15 Asia Pacific
Asia Pacific: Japan, South Korea, New Zealand, Australia. Source: OECD.
12

TREND 6: REGULATORY REGIME FAVORS NON-INVESTING UNBUNDLERSUNBUNDLERS.
Average Return on Capital Employed in %
Incumbents1
CAGR 2007-2013 in %
UnbundlersIncumbents
Return on Capital: Incumbents vs. Unbundlers Market Cap Development Incumbents vs. Unbundlers
Unbundlers2
Incumbents UnbundlersIncumbents21
Source: Bernstein Research, BCG. 1 BT, DT, Orange, TEF. 2 BSkyB, Iliad, Jazztel, TalkTalk, United Internet .
2008 2009 2010 20112007
13

TREND 6: EUROPE IS CHALLENGED BY HARD REGULATION AND COMPETITION POLICYREGULATION AND COMPETITION POLICY.
US Main goal: market driven
infrastructure rollout allow Asia / Pacific Main goal: make fiber infrastructure rollout, allow
adequate financial returns Approach: favor infrastructure
Europe Main goal: competition
and low consumer prices
Main goal: make fiber accessible for everyone as part of industrial policy Approach:favor infrastructure
competition lenient access regulation for
broadband
Fi i t f d
Approach: far-reaching market
regulation,i t i d
Approach: favor service competition, open-access wholesale
networks Financing: operators fund
the fiber network intrusive access and
price regulation, complex institutional
framework with National C
Financing : government-subsidized deployments
Regulatory/Competition Authorities, Body of European Regulators and EU Commission. Source: OECD, McKinsey
14
Financing : operators fund the fiber network

TREND 6: TRADITIONAL REGULATORY PARDIGMS DO NOT MEET THE INVESTMENT CHALLENGENOT MEET THE INVESTMENT CHALLENGE.
Regulatory Regulatory concept Myth Reality Recommendation
Ladder of investment
• Providing new entrants with access to many facilities allows them to first build up a critical
• Little theoretical support in economic research, no empirical evidence.1)
• Dismiss ladder of investment concept.
• Acknowledge proven pmass of customers before they invest in infrastructure.
p• Nonetheless, ‚ladder of
investment‘ concept with majorpolitical acceptance.
g pinvestment incentives: positive financial outlook, predictability, absence of regulatory risks.
Essential facility doctrine
• Access regulation as the only way to establish competition, as the incumbent owns the ‘essential facility’.
• Price regulation needed to
• Consumers benefit from ubiquitous competing alternative infrastructures (cable, fiber, mobile).
• Extension of legacy copper
• Access and price regulation need to be fundamentally revisited (lack of justification).
• Competition law sufficient to prevent abuse of market power.g
secure consumer welfare.g y pp
regulation to new technologies.p p
Spectrum auction
• Spectrum auctions ensure efficient development of mobile markets.
• High cost of spectrum hampersfast mobile NGA rollout.
• Some EU governments
• Auction design must support sustainable and investment-friendly outcomes.
• High auction proceeds unrelated to industry development.
exploiting spectrum auctions to cover budget deficits.
• Hyper complex auction designs entailing high economic risks.
• Allow for long-term spectrum usage and trading.
15
1) See e.g. Hausman & Sidak (2005); Bauer (2010); Bourreau, Dogan & Manant (2010); Briglauer & Vogelsang (2011).

TREND 7: TELCOS SQUEEZED IN CONVERGING MARKETS.
Global competitive pressure squeezes European telecoms industry. Trends
OTT PlayersNo level playing field –compared to telcos , OTT players benefit from: Low CAPEX and sunk costs
OTT Players
Low CAPEX and sunk costs, Low risk due to instant
scalability, Global markets build on
network effects
OTT services
network effects, Proprietary standards, Less regulatory obligations.European Teleco players and services
Global TelcocompetitionEuropean Regulation
16

TREND 8: THE CYBERSECURITY CHALLENGE.
ChallengesMajor cybersecurity threats
Hacktivism Lack of security in the digital sphere threatens public
safety and economic welfare.S i h i i ll l illi
Corporate espionage
Security threats are growing in all areas – several million cyberattacks per day.
Espionage undermines trust in cybersecurity and weakens confidence in digital services.
Government-driven
T i
Comprehensive surveillance of Internet traffic and services undermines freedom of the Internet, basic human rights and cultural forms of expression.
Data protection and privacy: different legislations within Terrorism
Criminal
Data protection and privacy: different legislations within Europe and compared to the U.S.
Europe’s telcos becoming acquisition targets of players from outside Europe jeopardizes technological sovereignty and increases Europe’s dependency on nonsovereignty and increases Europe s dependency on non-European ICT companies.Source: World Economic Forum.
18

GROWTH AND EMPLOYMENT IN EUROPE DEPEND ON MORE ICT INVESTMENTMORE ICT INVESTMENT.
European economy trailing behind
ICT accounts for 21% of GDP
ICT spurs growth and employment
Poor telecom revenue outlook
ICT investment unleashes macroeconomic growth
GDP growth
growth in the last 5 years in mature countries.1)
A 10 percentage-point increase in broadband penetration raises
0 9
causes an investment gap estimated at €110-170 billion to reach DAE1) targets.
Deregulation and other C
1,6%2,7%
1,0%
U.S. Euro area
annual per-capita growth by 0.9-1.5 percentage points.
ICT contributes to productivity growth: 31% in Europe, 59% in the U S
measures boosting ICT investment in Europe could yield up to €750 billion in GDP growth and 5.5 million jobs by 2020 2)
-0,3%
2013 2014
59% in the U.S. ICT creates 2.6 new jobs for
every one destroyed.
jobs by 2020.
7,3%
12,0%
Unemployment rate1)
U.S. Euro area
Source: Economist Source: McKinsey, ifo, European Commission. Source: Boston Consulting Group, EC Scoreboard.1) August 2013
1) DAE: Digital Agenda of Europe. DAE targets: >30 Mbit/s coverage for all, 50% of households taking up > 100 Mbit/s by 2020.2) BCG estimates
1) Sweden, Germany, UK, France, USA, South Korea, Canada, Italy, Japan.
19

THE DECLINE OF EUROPE'S ICT INDUSTRY ENTAILS SUBSTANTIAL ECONOMIC AND POLITICAL RISKSSUBSTANTIAL ECONOMIC AND POLITICAL RISKS.
Economic risks: Decreasing investments in ICT, e.g. in high-
Europe’s ICT industry in decline … … entails substantial economic and political risks
speed broadband networks. Innovation rents captured by non-European
players. Reduced macroeconomic growth, loss of jobs.
Competiveness1
Sector Value2
Investments5
Regulation6 Reduced macroeconomic growth, loss of jobs.
Political risks: Loss of European ICT know how – technology
leadership overseas
Market Structure3
Revenues4
Telcos squeezed7
Cybersecurity8 leadership overseas. European economy increasingly reliant on non-
European ICT players. Europe increasingly vulnerable to cyber
i i li d i
Revenues4 Cybersecurity8
criminality and espionage. Ability to protect critical telecom infrastructures
impaired. Loss of confidence in the digital economy.
20

EUROPE NEEDS TO REGAIN A LEADING POSITION.
Vision for EU’s ICT industry:Vision for EU’s ICT industry:
Regain leading position within next 10 years: Telecom network infrastructure (fiber LTE Telecom network infrastructure (fiber, LTE, intelligent networks), Soft- and Hardware,
Internet Services.
Key priority: Key priority:
Align all EU policies to restore consistency and credibility of political decision-making: credibility of political decision making:
Economic and Competition Policy, State Aid, R&D, Justice.
21

AT A GLANCE: EIGHT TRENDS WHY EUROPE IS FALLINGBEHINDBEHIND.
Europe is losing ground in almost every segment of the ICT industry. Only 5 European companies amongst the world’s ICT leaders. They contribute less than 10% to global Competiveness1 companies amongst the world s ICT leaders. They contribute less than 10% to global ICT revenues.
Competiveness1
Eroding sector value in EU and value shifts towards the U.S. and Asia. Market capitalization of European telcos declines by 7% per year since 2005.In contrast: Global OTT and telco giants has grown by 9-11%.
Sector Value2g g y
Strong market fragmentation and insufficient scale due to 200 national operators in Europe compared to 4-5 nation-wide operators in the U.S. and China. Market Structure3
Prolonged revenue decline in Europe of -10% within 2008-2016. In contrast: Revenue o o ged e e ue dec e u ope o 0 008 0 6 co as e e uegrowth of more than 35% in the U.S. and Asia Pacific. Revenues4
EU lacks investment of up to 270 bn EUR for high-speed next generation networks. Long term investment in Europe of 130 EUR per capita is well below 170-180 EUR investment i th U S d A i P ifi
Investments5in the U.S. and Asia Pacific.
Hard regulation and competition policy in Europe favors non-investing unbundlers. Market driven infrastructure rollout in the U.S. guarantees adequate financial returns. Regulation6
No level playing field in the European telecom industry. Telcos are squeezed between global players, OTT players and services as well as regulatory measures.Telcos squeezed7
Europe lacks an integrated cybersecurity data protection and privacy strategyCybersecurity8
30
Europe lacks an integrated cybersecurity, data protection and privacy strategy.Cybersecurity8