trade, economy and investment monitor report foreign … and investment moni… · trade, economy...
TRANSCRIPT
1
Trade, Economy and Investment
Monitor Report
Foreign Trade Division
Foreign Trade Policy Department
2nd Quarter 2015
2
CONTENTS PAGE NO
EXECUTIVE SUMMARY 3
TRADE MONITOR 5
EFTA- GCC FREE TRADE AGREEMENT 6
WORLD TRADE REPORT 10
SILK ROAD ECONOMIC BELT & 21st CENTURY MARITIME SILK ROAD 13
ECONOMY MONITOR 15
WORLD BANK GLOBAL OUTLOOK REPORT 16
IRAN NUCLEAR DEAL 16
UAE STATE OF ECONOMY 18
UAE CENTRAL BANK AND MONEY SUPPLY 22
OIL PRICE AND MARKET ANALYSIS 27
GREECE CRISIS 29
DIFC 10 YEAR STRATEGY 31
INVESTMENT MONITOR 33
UNCATD GLOBAL INVESTMENT REPORT 2015 34
COUNTRY OF FOCUS – GEORGIA 35
INVESTMENT HIGHLIGHTS 46
3
EXECUTIVE SUMMARY
World trade registers modest growth in first quarter 2015 and the volume of world
merchandise trade increased modestly in the first quarter of 2015, with growth in both
exports and imports registering slower growth than over the previous six months.
Effective from July 1st Free Trade Agreement between EFTA and GCC countries will
be implemented and the Agreement covers a broad range of areas including trade in
goods, trade in services, government procurement and competition. The agreement
provides for immediate tariff elimination on most industrial goods originating from
EFTA and the GCC. This agreement will benefit International trade between
countries and also will forge a strong economic relationship between these countries.
Global Economy is expected to grow 2.8 percent in 2015, slightly less than earlier
forecasts and forecasted to strengthen moderately to 3.3 percent in 2016 and 3.2
percent in 2017. Policy Makers around the globe especially emerging nations and
low income countries are worried about two big challenges. One monetary tightening
by US Fed and the repercussions of low commodity prices.
UAE’s Gross domestic Product at current prices in 2014 was recorded at AED 1.46
trillion when compared to AED 1.42 trillion in 2013. GDP at current prices grew at a
rate of 3.2% in 2014 when compared to 3.7% in 2013. GDP growth rate in constant
2007 prices was 4.6% in 2014 when compared to 4.3% in 2013. Growth was
moderate despite low oil prices in second half of 2014.
Currently UAE Central Banks Assets has to AED 332.7 Billion in May 2015 compared
to AED 322.4 Billion in May 2014 a YOY increase of 3.2%. Creation of Money causes
increase in Assets of UAE’s Central Bank which signals an expansionary policy
adopted. Gross Assets of Banks in UAE increased by 3.3% in Q1 2015 to reach AED
2,380 Billion when compared a decline of -0.3% in Gross assets in Q4 2014.
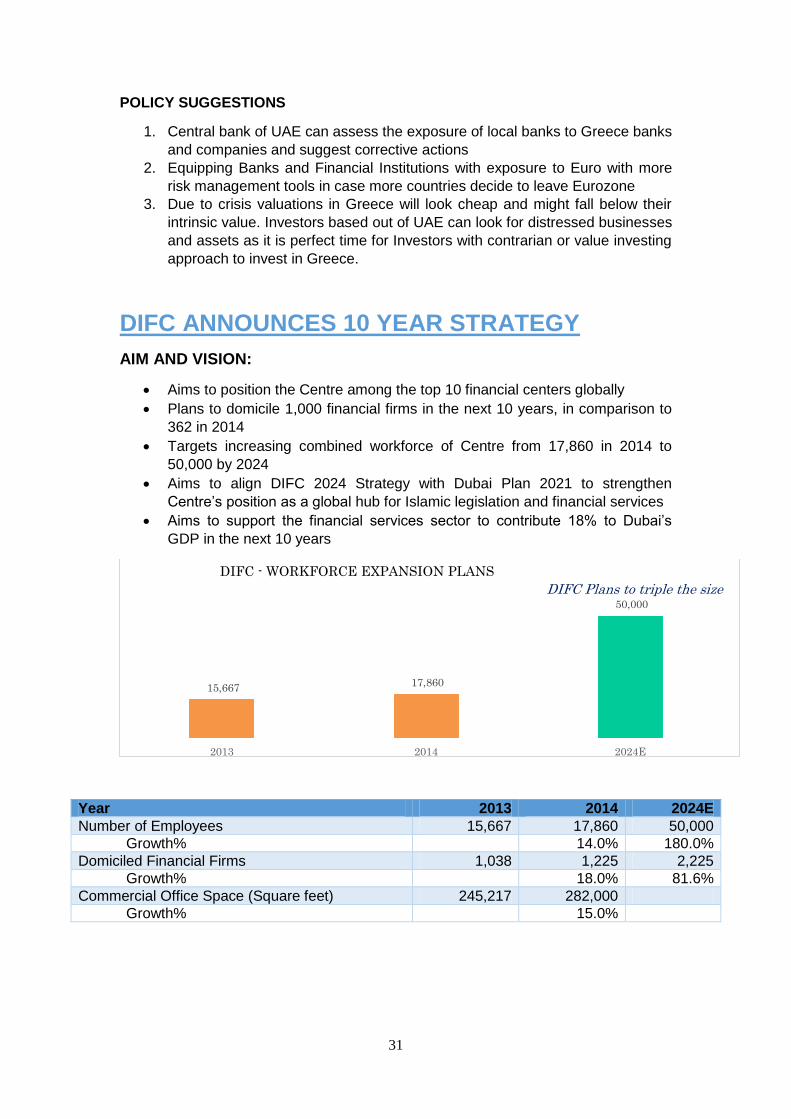
DIFC announced its 10 year Strategy which aims to position the Centre among the
top 10 financial centers globally and domicile 1000 financial firms from its current 362
firms. Apart from this also targets increasing combined workforce of Centre from
17,860 in 2014 to 50,000 by 2024.
WTI Crude Oil bench mark has fallen more than 18% to reach levels of $50 a barrel
from the Highs of $62 per barrel in mid-May. Uncertainty in global economy and
excess supply are the concerns which are driving Oil prices down again. Some of the
factors causing Oil fall are Iran Nuclear deal, Slow-down in China, Greece Crisis and
US Shale supply resilience.
Greece has voted ―no‖ on Europe’s bailout terms and it might have a severe impact
on global economy and this crisis had impacted Equity markets in most of the
developed countries. Chinese Equity markets are falling due to asset bubbles which
crept in Chinese stock markets are about burst. Though Chinese regulators and
policy makers’ efforts to save the crash have not been able to stop equity market
crashes. Turkish markets fell due to political uncertainty after recent national
elections. Though Saudi Stocks rallied due to opening up for Foreign Investors which
is seen as positive move for the region.
Diplomats from the United States, the UK, France, China, Russia and Germany have
finally completed a deal with Iran meant to prevent it from developing nuclear
weapons. In exchange for limits on its nuclear program, Iran will come out from under
4
some economic sanctions while being allowed to continue a peaceful nuclear
program. In a nutshell this deal was reached to set limits on Iran's production of
nuclear weapons
Global foreign direct investment (FDI) inflows fell by 16 per cent in 2014 to $1.23
trillion, down from $1.47 trillion in 2013. FDI inflows declined in contrast to growth in
global GDP, modest growth in Trade and employment figures. The decline in FDI
inflows I 2014 was influenced due to Global crisis and slowdown of major economies,
uncertainty for Investors over government policies, Increased Geo-political risks.
Chinese leadership announced a strategic vision to build belt and road routes
connecting through continents of Asia, Europe and Africa. This project once
succeeded will connect Vibrant East Asia economic circle at one end and developed
European economy at other end. This will be a renewed connectivity both within Asia
and between Asia and Europe, both by land and by the sea, and both by means of
strengthening traditional infrastructure and through building highways of trade,
finance and cultural exchange to strengthen connectivity.
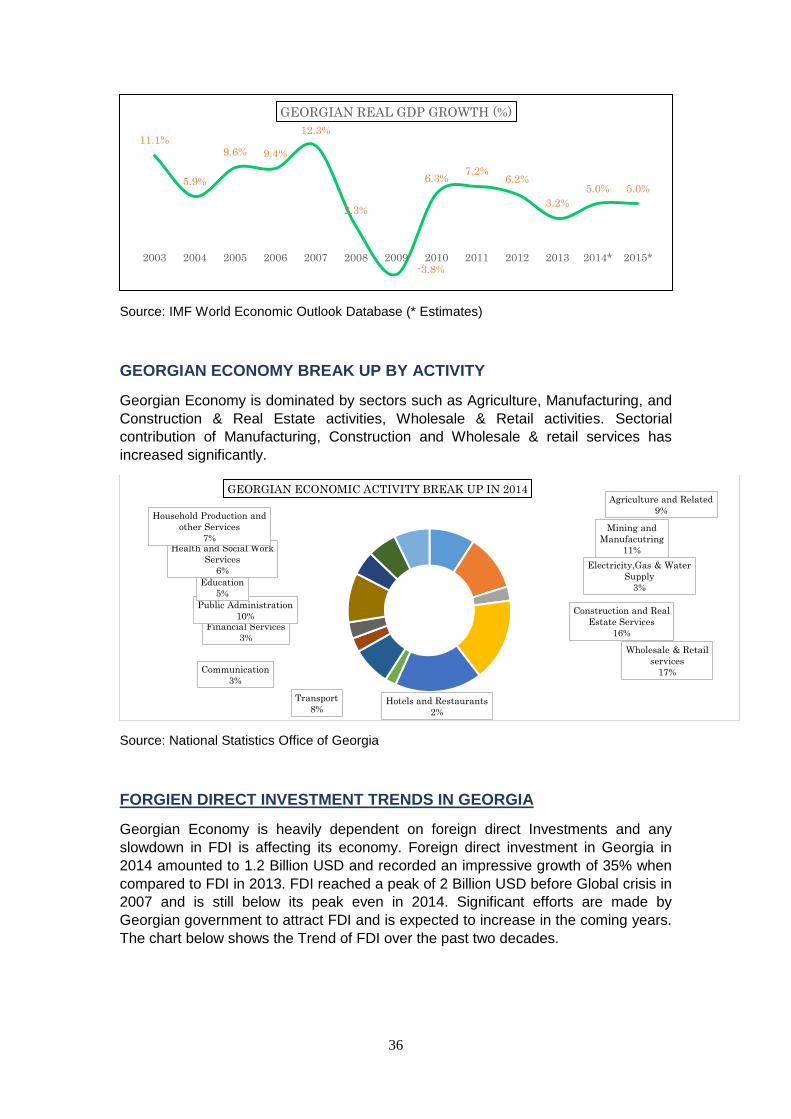
Georgian Economy recorded an impressive growth of 5% in 2014 and it is estimated
that the economy will grow by 5% in 2015. Georgian Economy is dominated by
sectors such as Agriculture, Manufacturing, and Construction & Real Estate
activities, Wholesale & Retail activities. Sectoral contribution of Manufacturing,
Construction and Wholesale & retail services has increased significantly. Georgian
Economy is heavily dependent on foreign direct Investments and any slowdown in
FDI is affecting its economy. Georgia with its competitive advantages include
strategic location, low input costs for Businesses and business friendly government
regulations.
5
TRADE MONITOR
6
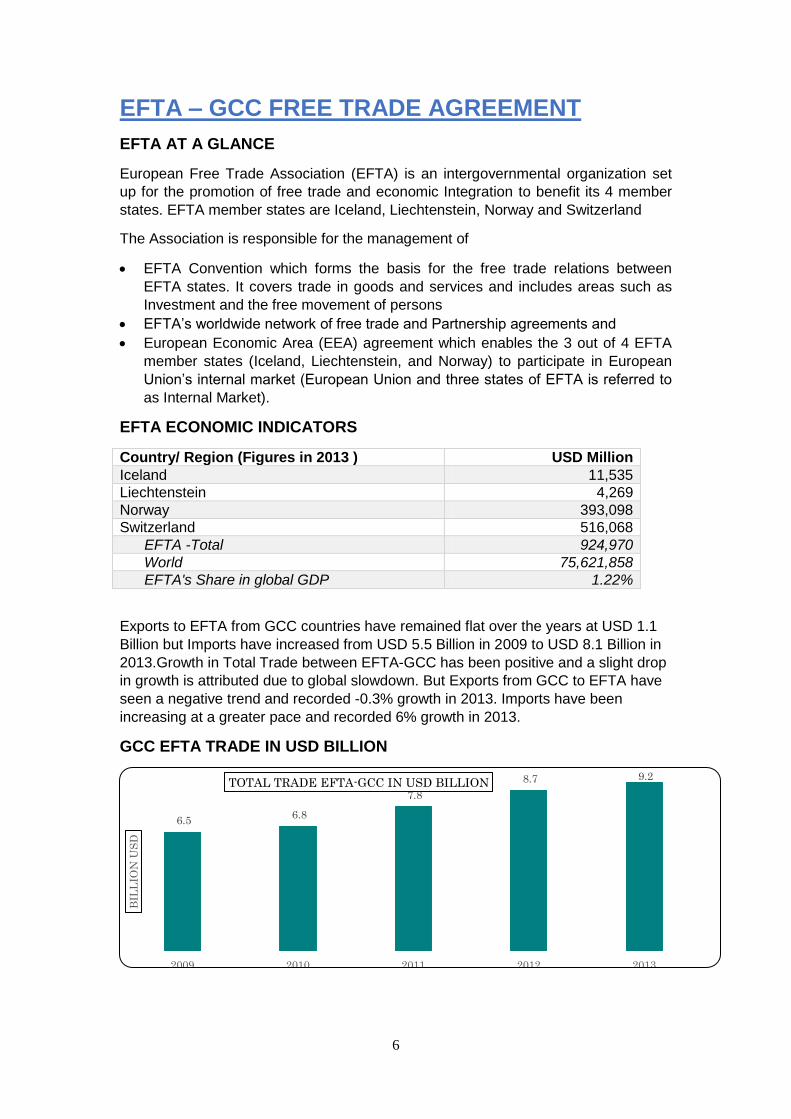
EFTA – GCC FREE TRADE AGREEMENT
EFTA AT A GLANCE
European Free Trade Association (EFTA) is an intergovernmental organization set
up for the promotion of free trade and economic Integration to benefit its 4 member
states. EFTA member states are Iceland, Liechtenstein, Norway and Switzerland
The Association is responsible for the management of
EFTA Convention which forms the basis for the free trade relations between
EFTA states. It covers trade in goods and services and includes areas such as
Investment and the free movement of persons
EFTA’s worldwide network of free trade and Partnership agreements and
European Economic Area (EEA) agreement which enables the 3 out of 4 EFTA
member states (Iceland, Liechtenstein, and Norway) to participate in European
Union’s internal market (European Union and three states of EFTA is referred to
as Internal Market).
EFTA ECONOMIC INDICATORS
Country/ Region (Figures in 2013 ) USD Million
Iceland 11,535
Liechtenstein 4,269
Norway 393,098
Switzerland 516,068
EFTA -Total 924,970
World 75,621,858
EFTA's Share in global GDP 1.22%
Exports to EFTA from GCC countries have remained flat over the years at USD 1.1
Billion but Imports have increased from USD 5.5 Billion in 2009 to USD 8.1 Billion in
2013.Growth in Total Trade between EFTA-GCC has been positive and a slight drop
in growth is attributed due to global slowdown. But Exports from GCC to EFTA have
seen a negative trend and recorded -0.3% growth in 2013. Imports have been
increasing at a greater pace and recorded 6% growth in 2013.
GCC EFTA TRADE IN USD BILLION
6.5 6.8
7.8
8.7 9.2
2009 2010 2011 2012 2013
BIL
LIO
N U
SD
TOTAL TRADE EFTA-GCC IN USD BILLION

7
EXPORTS & IMPORTS BETWEEN GCC AND EFTA
EFTA –GCC EXPORTS AND IMPORTS GROWTH
SUMMARY OF FTA BETWEEN GCC & EFTA REGIONS
The Agreement covers a broad range of areas including trade in goods, trade in
services, government procurement and competition. The agreement provides for
immediate tariff elimination on most industrial goods originating from EFTA and the
GCC. Major sectors that will benefit from the elimination of tariffs include
telecommunications, electrical and electronic equipment, petrochemicals, watches
and jewelry, machinery and iron and steel related industries
In addition to this free trade agreement, the GCC and EFTA member states have
concluded agreements on trade in basic agricultural products on a bilateral basis.
Agricultural products originating in the GCC and EFTA will benefit from the
elimination or reduction of tariffs upon the entry into force of the agreements or for a
few products imported into the GCC after a five-year transition period.
CURRENT STATUS OF FTA
The EFTA-GCC Free Trade Agreement entered into force on 1 July 2014. While the
EFTA States have fully applied the agreement since the date of entry into force, GCC
countries have not yet implemented the agreement due to some technical issues, in
particular in connection with the use of the certificate of origin (form EUR.1). Member
1.0 1.3 1.2 1.1 1.1
5.5 5.5
6.7
7.6 8.1
2009 2010 2011 2012 2013
BIL
LIO
N U
SD
EXPORTS & IMPORTS BETWEEN GCC & EFTA
GCC Exports to EFTA GCC Imports from EFTA
4.8%
15.7% 11.4%
5.3%
27.8%
-9.5% -4.7% 0.3%
0.6%
21.5%
14.2% 6.0%
-20%
-10%
0%
10%
20%
30%
2010 2011 2012 2013
GR
OW
TH
IN
PE
RC
EN
TA
GE
EFTA GCC TRADE GROWTH
Total Trade EFTA-GCC GCC Exports to EFTA GCC Imports from EFTA
8
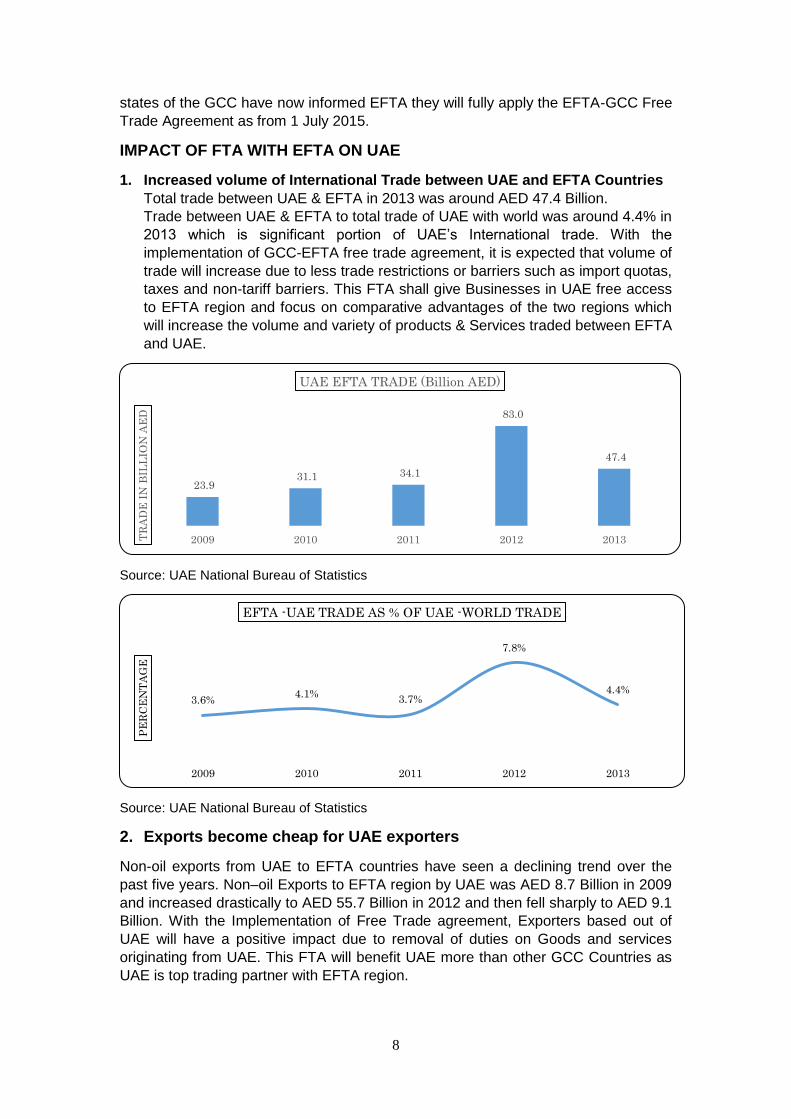
states of the GCC have now informed EFTA they will fully apply the EFTA-GCC Free
Trade Agreement as from 1 July 2015.
IMPACT OF FTA WITH EFTA ON UAE
1. Increased volume of International Trade between UAE and EFTA Countries
Total trade between UAE & EFTA in 2013 was around AED 47.4 Billion.
Trade between UAE & EFTA to total trade of UAE with world was around 4.4% in
2013 which is significant portion of UAE’s International trade. With the
implementation of GCC-EFTA free trade agreement, it is expected that volume of
trade will increase due to less trade restrictions or barriers such as import quotas,
taxes and non-tariff barriers. This FTA shall give Businesses in UAE free access
to EFTA region and focus on comparative advantages of the two regions which
will increase the volume and variety of products & Services traded between EFTA
and UAE.
Source: UAE National Bureau of Statistics
Source: UAE National Bureau of Statistics
2. Exports become cheap for UAE exporters
Non-oil exports from UAE to EFTA countries have seen a declining trend over the
past five years. Non–oil Exports to EFTA region by UAE was AED 8.7 Billion in 2009
and increased drastically to AED 55.7 Billion in 2012 and then fell sharply to AED 9.1
Billion. With the Implementation of Free Trade agreement, Exporters based out of
UAE will have a positive impact due to removal of duties on Goods and services
originating from UAE. This FTA will benefit UAE more than other GCC Countries as
UAE is top trading partner with EFTA region.
23.9 31.1 34.1
83.0
47.4
2009 2010 2011 2012 2013TR
AD
E I
N B
ILL
ION
AE
D
UAE EFTA TRADE (Billion AED)
3.6% 4.1%
3.7%
7.8%
4.4%
2009 2010 2011 2012 2013
PE
RC
EN
TA
GE
EFTA -UAE TRADE AS % OF UAE -WORLD TRADE
9
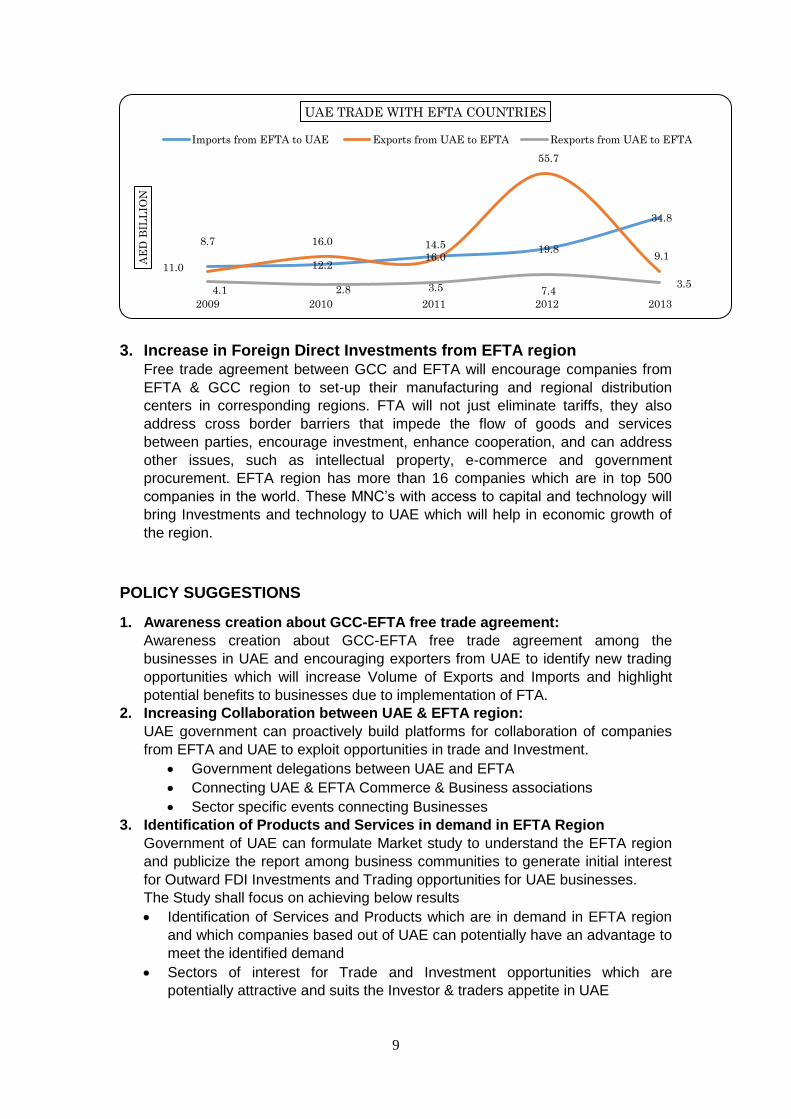
3. Increase in Foreign Direct Investments from EFTA region Free trade agreement between GCC and EFTA will encourage companies from
EFTA & GCC region to set-up their manufacturing and regional distribution
centers in corresponding regions. FTA will not just eliminate tariffs, they also
address cross border barriers that impede the flow of goods and services
between parties, encourage investment, enhance cooperation, and can address
other issues, such as intellectual property, e-commerce and government
procurement. EFTA region has more than 16 companies which are in top 500
companies in the world. These MNC’s with access to capital and technology will
bring Investments and technology to UAE which will help in economic growth of
the region.
POLICY SUGGESTIONS
1. Awareness creation about GCC-EFTA free trade agreement:
Awareness creation about GCC-EFTA free trade agreement among the
businesses in UAE and encouraging exporters from UAE to identify new trading
opportunities which will increase Volume of Exports and Imports and highlight
potential benefits to businesses due to implementation of FTA.
2. Increasing Collaboration between UAE & EFTA region:
UAE government can proactively build platforms for collaboration of companies
from EFTA and UAE to exploit opportunities in trade and Investment.
Government delegations between UAE and EFTA
Connecting UAE & EFTA Commerce & Business associations
Sector specific events connecting Businesses
3. Identification of Products and Services in demand in EFTA Region
Government of UAE can formulate Market study to understand the EFTA region
and publicize the report among business communities to generate initial interest
for Outward FDI Investments and Trading opportunities for UAE businesses.
The Study shall focus on achieving below results
Identification of Services and Products which are in demand in EFTA region
and which companies based out of UAE can potentially have an advantage to
meet the identified demand
Sectors of interest for Trade and Investment opportunities which are
potentially attractive and suits the Investor & traders appetite in UAE
11.0 12.2 16.0
19.8
34.8
8.7 16.0 14.5
55.7
9.1
4.1 2.8 3.5 7.4 3.5
2009 2010 2011 2012 2013
AE
D B
ILL
ION
UAE TRADE WITH EFTA COUNTRIES
Imports from EFTA to UAE Exports from UAE to EFTA Rexports from UAE to EFTA
10
4. Technology transfer to support Innovation strategy of UAE
EFTA region is known for some of the top companies in world. These Multi-
national companies which have access to technology and capital can be attracted
for FDI in UAE and technology transfer to support Innovation strategy.
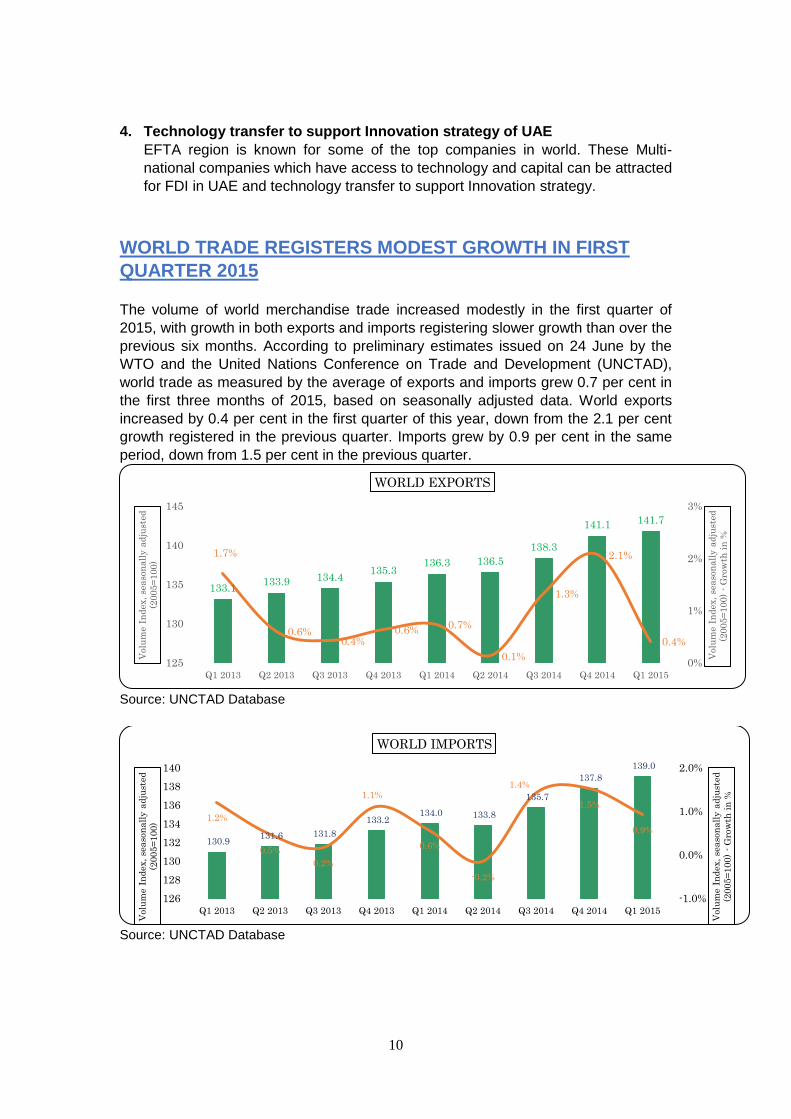
WORLD TRADE REGISTERS MODEST GROWTH IN FIRST
QUARTER 2015
The volume of world merchandise trade increased modestly in the first quarter of
2015, with growth in both exports and imports registering slower growth than over the
previous six months. According to preliminary estimates issued on 24 June by the
WTO and the United Nations Conference on Trade and Development (UNCTAD),
world trade as measured by the average of exports and imports grew 0.7 per cent in
the first three months of 2015, based on seasonally adjusted data. World exports
increased by 0.4 per cent in the first quarter of this year, down from the 2.1 per cent
growth registered in the previous quarter. Imports grew by 0.9 per cent in the same
period, down from 1.5 per cent in the previous quarter.
Source: UNCTAD Database
Source: UNCTAD Database
133.1 133.9 134.4
135.3 136.3 136.5
138.3
141.1 141.7
1.7%
0.6% 0.4%
0.6% 0.7%
0.1%
1.3%
2.1%
0.4%
0%
1%
2%
3%
125
130
135
140
145
Q1 2013 Q2 2013 Q3 2013 Q4 2013 Q1 2014 Q2 2014 Q3 2014 Q4 2014 Q1 2015
Volu
me I
nd
ex,
seaso
nall
y a
dju
sted
(2005=
100)
- G
row
th i
n %
Volu
me I
nd
ex,
seaso
nall
y a
dju
sted
(2005=
100)
WORLD EXPORTS
130.9 131.6 131.8
133.2 134.0 133.8
135.7
137.8
139.0
1.2%
0.5%
0.2%
1.1%
0.6%
-0.2%
1.4%
1.5%
0.9%
-1.0%
0.0%
1.0%
2.0%
126
128
130
132
134
136
138
140
Q1 2013 Q2 2013 Q3 2013 Q4 2013 Q1 2014 Q2 2014 Q3 2014 Q4 2014 Q1 2015
Volu
me I
nd
ex,
seaso
nall
y a
dju
sted
(2005=
100)
- G
row
th i
n %
Volu
me I
nd
ex,
seaso
nall
y a
dju
sted
(2005=
100)
WORLD IMPORTS
11
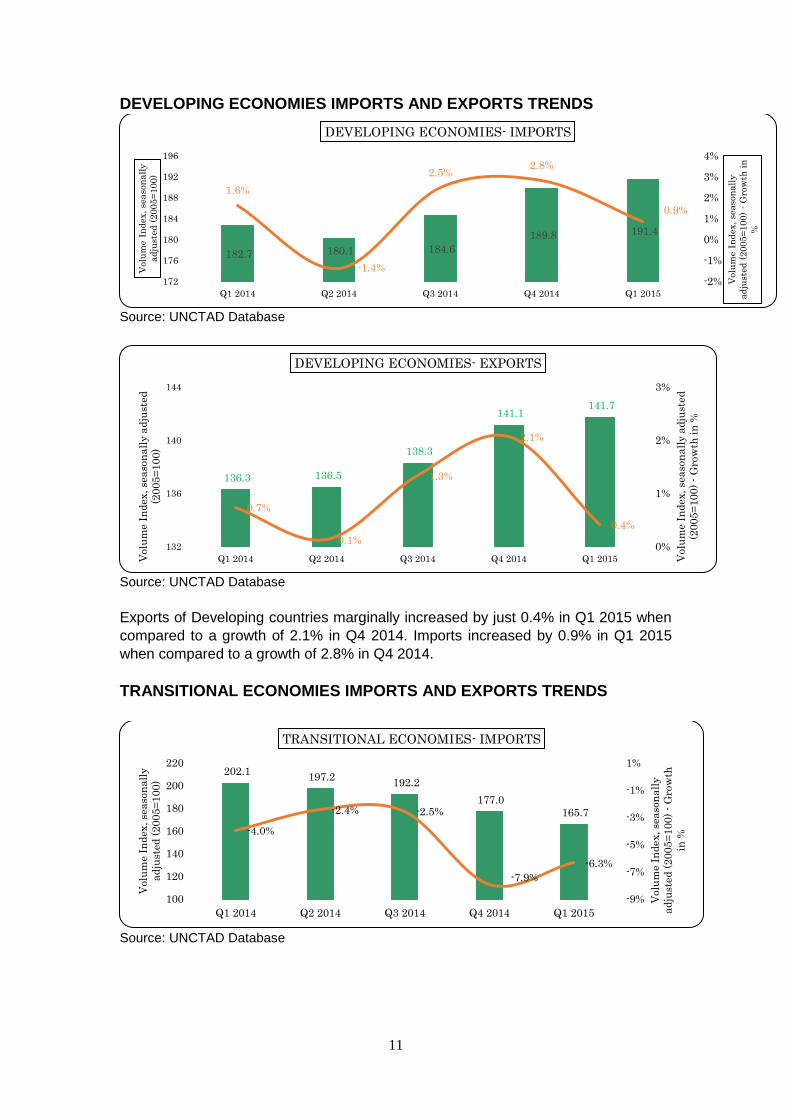
DEVELOPING ECONOMIES IMPORTS AND EXPORTS TRENDS
Source: UNCTAD Database
Source: UNCTAD Database
Exports of Developing countries marginally increased by just 0.4% in Q1 2015 when
compared to a growth of 2.1% in Q4 2014. Imports increased by 0.9% in Q1 2015
when compared to a growth of 2.8% in Q4 2014.
TRANSITIONAL ECONOMIES IMPORTS AND EXPORTS TRENDS
Source: UNCTAD Database
182.7 180.1 184.6
189.8 191.4
1.6%
-1.4%
2.5% 2.8%
0.9%
-2%
-1%
0%
1%
2%
3%
4%
172
176
180
184
188
192
196
Q1 2014 Q2 2014 Q3 2014 Q4 2014 Q1 2015
Volu
me I
nd
ex,
seaso
nall
y
ad
just
ed
(2005=
100)
- G
row
th i
n
%
Volu
me I
nd
ex,
seaso
nall
y
ad
just
ed
(2005=
100)
DEVELOPING ECONOMIES- IMPORTS
136.3 136.5
138.3
141.1 141.7
0.7%
0.1%
1.3%
2.1%
0.4%
0%
1%
2%
3%
132
136
140
144
Q1 2014 Q2 2014 Q3 2014 Q4 2014 Q1 2015 Volu
me I
nd
ex, se
aso
nall
y a
dju
sted
(2005=
100)
- G
row
th i
n %
Volu
me I
nd
ex, se
aso
na
lly a
dju
sted
(2005=
100)
DEVELOPING ECONOMIES- EXPORTS
202.1 197.2
192.2
177.0
165.7
-4.0%
-2.4% -2.5%
-7.9%
-6.3%
-9%
-7%
-5%
-3%
-1%
1%
100
120
140
160
180
200
220
Q1 2014 Q2 2014 Q3 2014 Q4 2014 Q1 2015
Volu
me I
nd
ex, se
aso
na
lly
ad
just
ed
(2005=
100)
- G
row
th
in %
Volu
me I
nd
ex, se
aso
na
lly
ad
just
ed
(2005=
100)
TRANSITIONAL ECONOMIES- IMPORTS
12
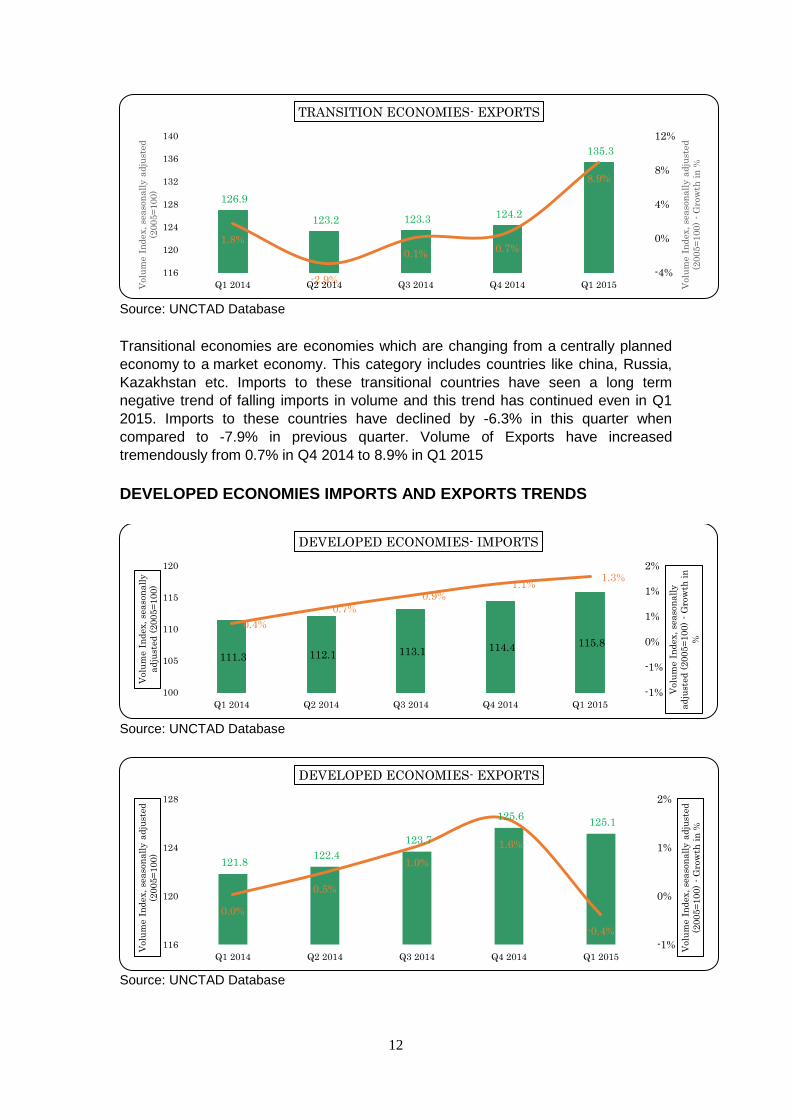
Source: UNCTAD Database
Transitional economies are economies which are changing from a centrally planned
economy to a market economy. This category includes countries like china, Russia,
Kazakhstan etc. Imports to these transitional countries have seen a long term
negative trend of falling imports in volume and this trend has continued even in Q1
2015. Imports to these countries have declined by -6.3% in this quarter when
compared to -7.9% in previous quarter. Volume of Exports have increased
tremendously from 0.7% in Q4 2014 to 8.9% in Q1 2015
DEVELOPED ECONOMIES IMPORTS AND EXPORTS TRENDS
Source: UNCTAD Database
Source: UNCTAD Database
126.9
123.2 123.3 124.2
135.3
1.8%
-2.9%
0.1% 0.7%
8.9%
-4%
0%
4%
8%
12%
116
120
124
128
132
136
140
Q1 2014 Q2 2014 Q3 2014 Q4 2014 Q1 2015 Volu
me I
nd
ex,
seaso
nall
y a
dju
sted
(2005=
100)
- G
row
th i
n %
Volu
me I
nd
ex,
seaso
nall
y a
dju
sted
(2005=
100)
TRANSITION ECONOMIES- EXPORTS
111.3 112.1 113.1 114.4 115.8
0.4%
0.7%
0.9% 1.1%
1.3%
-1%
-1%
0%
1%
1%
2%
100
105
110
115
120
Q1 2014 Q2 2014 Q3 2014 Q4 2014 Q1 2015
Volu
me I
nd
ex,
seaso
nall
y
ad
just
ed
(2005=
100)
- G
row
th i
n
%
Volu
me I
nd
ex,
seaso
nall
y
ad
just
ed
(2005=
100)
DEVELOPED ECONOMIES- IMPORTS
121.8 122.4
123.7
125.6 125.1
0.0%
0.5%
1.0%
1.6%
-0.4%
-1%
0%
1%
2%
116
120
124
128
Q1 2014 Q2 2014 Q3 2014 Q4 2014 Q1 2015
Volu
me I
nd
ex,
seaso
nall
y a
dju
sted
(2005=
100)
- G
row
th i
n %
Volu
me I
nd
ex,
seaso
nall
y a
dju
sted
(2005=
100)
DEVELOPED ECONOMIES- EXPORTS
13
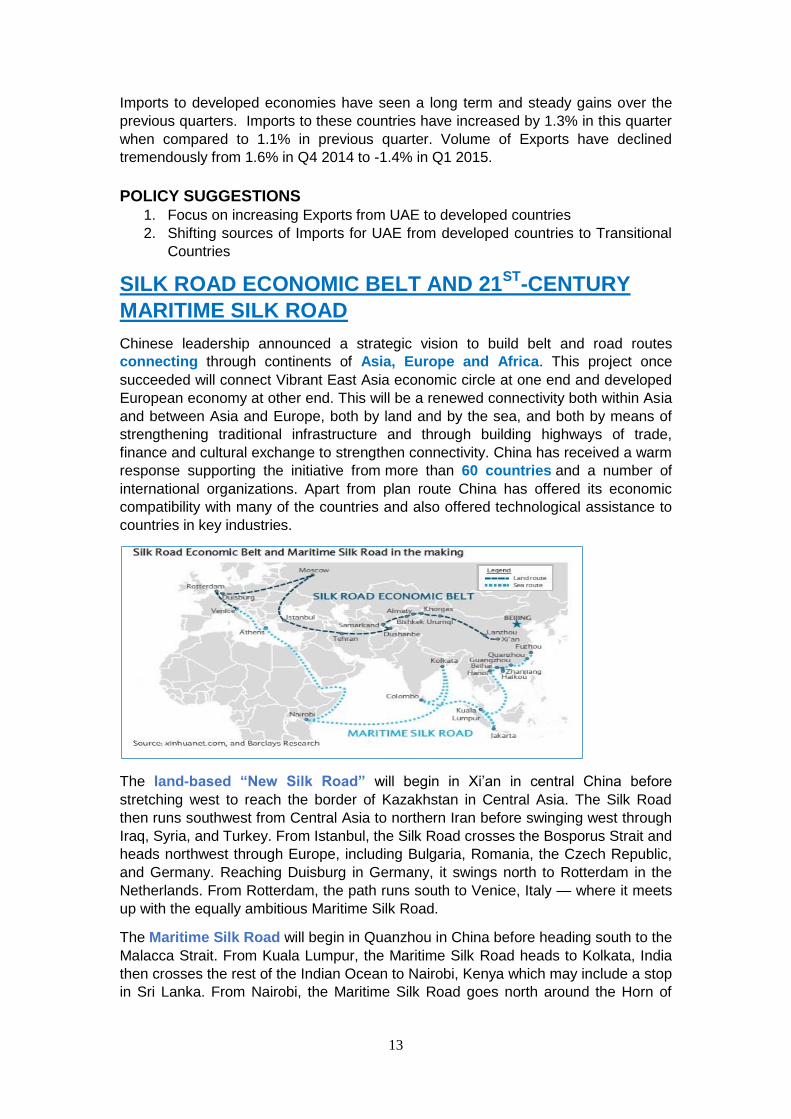
Imports to developed economies have seen a long term and steady gains over the
previous quarters. Imports to these countries have increased by 1.3% in this quarter
when compared to 1.1% in previous quarter. Volume of Exports have declined
tremendously from 1.6% in Q4 2014 to -1.4% in Q1 2015.
POLICY SUGGESTIONS 1. Focus on increasing Exports from UAE to developed countries
2. Shifting sources of Imports for UAE from developed countries to Transitional
Countries
SILK ROAD ECONOMIC BELT AND 21ST
-CENTURY
MARITIME SILK ROAD
Chinese leadership announced a strategic vision to build belt and road routes
connecting through continents of Asia, Europe and Africa. This project once
succeeded will connect Vibrant East Asia economic circle at one end and developed
European economy at other end. This will be a renewed connectivity both within Asia
and between Asia and Europe, both by land and by the sea, and both by means of
strengthening traditional infrastructure and through building highways of trade,
finance and cultural exchange to strengthen connectivity. China has received a warm
response supporting the initiative from more than 60 countries and a number of
international organizations. Apart from plan route China has offered its economic
compatibility with many of the countries and also offered technological assistance to
countries in key industries.
The land-based “New Silk Road” will begin in Xi’an in central China before
stretching west to reach the border of Kazakhstan in Central Asia. The Silk Road
then runs southwest from Central Asia to northern Iran before swinging west through
Iraq, Syria, and Turkey. From Istanbul, the Silk Road crosses the Bosporus Strait and
heads northwest through Europe, including Bulgaria, Romania, the Czech Republic,
and Germany. Reaching Duisburg in Germany, it swings north to Rotterdam in the
Netherlands. From Rotterdam, the path runs south to Venice, Italy — where it meets
up with the equally ambitious Maritime Silk Road.
The Maritime Silk Road will begin in Quanzhou in China before heading south to the
Malacca Strait. From Kuala Lumpur, the Maritime Silk Road heads to Kolkata, India
then crosses the rest of the Indian Ocean to Nairobi, Kenya which may include a stop
in Sri Lanka. From Nairobi, the Maritime Silk Road goes north around the Horn of

14
Africa and moves through the Red Sea into the Mediterranean, with a stop in Athens
before meeting the land-based Silk Road in Venice.
Strategic Objectives or Reasons for the Initiative:
Geo-Strategy: New Silk Road Strategy will increase the Chinese economic
dominance over the continents and can be seen as a counter strategy to America’s
Trans-Pacific partnership (TPP).
Access to Raw materials such as Oil and metals: China is a net importer of Oil
and metals which are consumed by its manufacturing units. It will give Chinese
companies the access to cheap raw materials available in Africa and Asia which
when connected well can be imported at cheaper costs and will also save importing
time. It will give Chinese competitive edge over other countries.
New Markets: New Silk Road Strategy will give China access to new markets
especially for its export oriented products
Creation of Jobs: Infrastructure building to support the strategy will help Chinese
companies which can execute the projects with proved technology and at best
possible price. It will create job opportunities for Chinese labor.
Drivers for the countries to join the initiative:
1. International Trade with China:
China is the No.1 trading partner with many Asian countries and many countries
trade with China has been increasing at double digit growth over the past
decade.
2. Capital and Technology:
The Silk Road Fund set up by China of $40 billion, and the AIIB with an initial
capital of $100 billion, will help jumpstart the region's infrastructure and the
overall development drive. A $40bn infrastructure fund will be used to build
bridges, roads and airports at staging posts along the route, while a new $16bn
Silk Road gold fund is intended to stockpile the metal and support mining projects
along the trade routes. It is expected that this connectivity would generate $2.5
trillion of additional trade for all those involved over the next 10 years.
Chinese companies are capable of providing high quality, low cost and affordable
infrastructure projects. They are already active in the region and Chinese
companies signed up for more than 1,000 projects for building infrastructure in
the region.
Challenges: 1. Communication:
China has to communicate to the countries that this strategy will be a win-win
situation for co-operating countries which help them in economic prosperity.
2. Dealing with Sovereign Countries:
So far China has been successful in generating positive response for the project.
Change in politics can expose to political risks for the project
3. Operational Risks:
Infrastructure projects usually run out of time and are difficult when it comes to
execution and hence poses a serious operational risks.
15
ECONOMY MONITOR

16
WORLD BANK RELEASES GLOBAL OUTLOOK REPORT
Global Economy is expected to grow 2.8 percent in 2015, slightly less than earlier
forecasts and forecasted to strengthen moderately to 3.3 percent in 2016 and 3.2
percent in 2017.
REAL GDP 2012 2013 2014E 2015F 2016F 2017F
World 2.4 2.5 2.6 2.8 3.3 3.2
Developed Countries
1.4 1.4 1.8 2.0 2.4 2.2
Developing Countries
4.9 5.1 4.6 4.4 5.2 5.4
Source: World Bank Outlook report - June 2015
Policy Makers around the globe especially emerging nations and low income
countries are worried about two big challenges. One monetary tightening by US Fed
and the repercussions of low commodity prices. US Monetary policy rate increase for
the first time after financial crisis will put downward pressure on capital flows to
developing countries and might rise borrowing costs in an already challenging
environment. Commodity-exporting countries may face downward pressures due to
decline in commodity prices and weaker demand. Oil exporting nations due to lower
oil prices are facing increasing fiscal, exchange and inflationary pressures.
Developed countries are expected to gather momentum, while a broad based
slowdown appears underway for developing countries.
IRAN NUCLEAR DEAL AND ITS ECONOMIC IMPACT
Nuclear Deal in Nutshell:
Diplomats from the United States, the UK, France, China, Russia and Germany have finally completed a deal with Iran meant to prevent it from developing nuclear weapons. In exchange for limits on its nuclear program, Iran will come out from under some economic sanctions while being allowed to continue a peaceful nuclear program. In a nutshell this deal was reached to set limits on Iran's production of nuclear weapons.
IMPACT AND POLICY SUGGESTIONS
Multi-Billion Dollar opportunity for major Oil & Gas companies
Currently Iran is opening up more than 50 projects and is targeting nearly USD 100
Billion worth of investments in the next 5 years. According to Wood Mackenzie, a
consultancy, the country ranks as the world’s third-largest holder of oil and gas, with
more than 250bn barrels of oil equivalent in remaining reserves. Iran offers a golden
opportunity for integrated Oil companies and nationally owned giants as many energy
groups are struggling to find new oil discoveries.
17
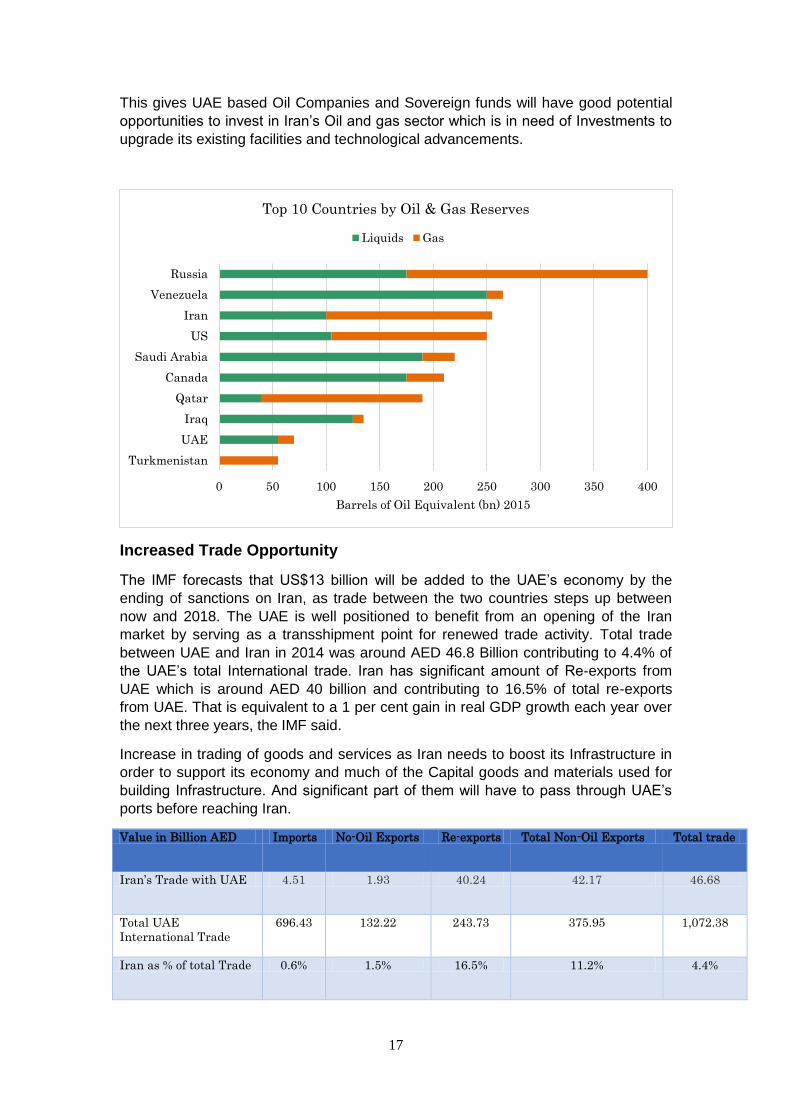
This gives UAE based Oil Companies and Sovereign funds will have good potential
opportunities to invest in Iran’s Oil and gas sector which is in need of Investments to
upgrade its existing facilities and technological advancements.
Increased Trade Opportunity
The IMF forecasts that US$13 billion will be added to the UAE’s economy by the
ending of sanctions on Iran, as trade between the two countries steps up between
now and 2018. The UAE is well positioned to benefit from an opening of the Iran
market by serving as a transshipment point for renewed trade activity. Total trade
between UAE and Iran in 2014 was around AED 46.8 Billion contributing to 4.4% of
the UAE’s total International trade. Iran has significant amount of Re-exports from
UAE which is around AED 40 billion and contributing to 16.5% of total re-exports
from UAE. That is equivalent to a 1 per cent gain in real GDP growth each year over
the next three years, the IMF said.
Increase in trading of goods and services as Iran needs to boost its Infrastructure in
order to support its economy and much of the Capital goods and materials used for
building Infrastructure. And significant part of them will have to pass through UAE’s
ports before reaching Iran.
Value in Billion AED Imports No-Oil Exports Re-exports Total Non-Oil Exports Total trade
Iran’s Trade with UAE 4.51 1.93 40.24 42.17 46.68
Total UAE
International Trade
696.43 132.22 243.73 375.95 1,072.38
Iran as % of total Trade 0.6% 1.5% 16.5% 11.2% 4.4%
0 50 100 150 200 250 300 350 400
Turkmenistan
UAE
Iraq
Qatar
Canada
Saudi Arabia
US
Iran
Venezuela
Russia
Barrels of Oil Equivalent (bn) 2015
Top 10 Countries by Oil & Gas Reserves
Liquids Gas
18
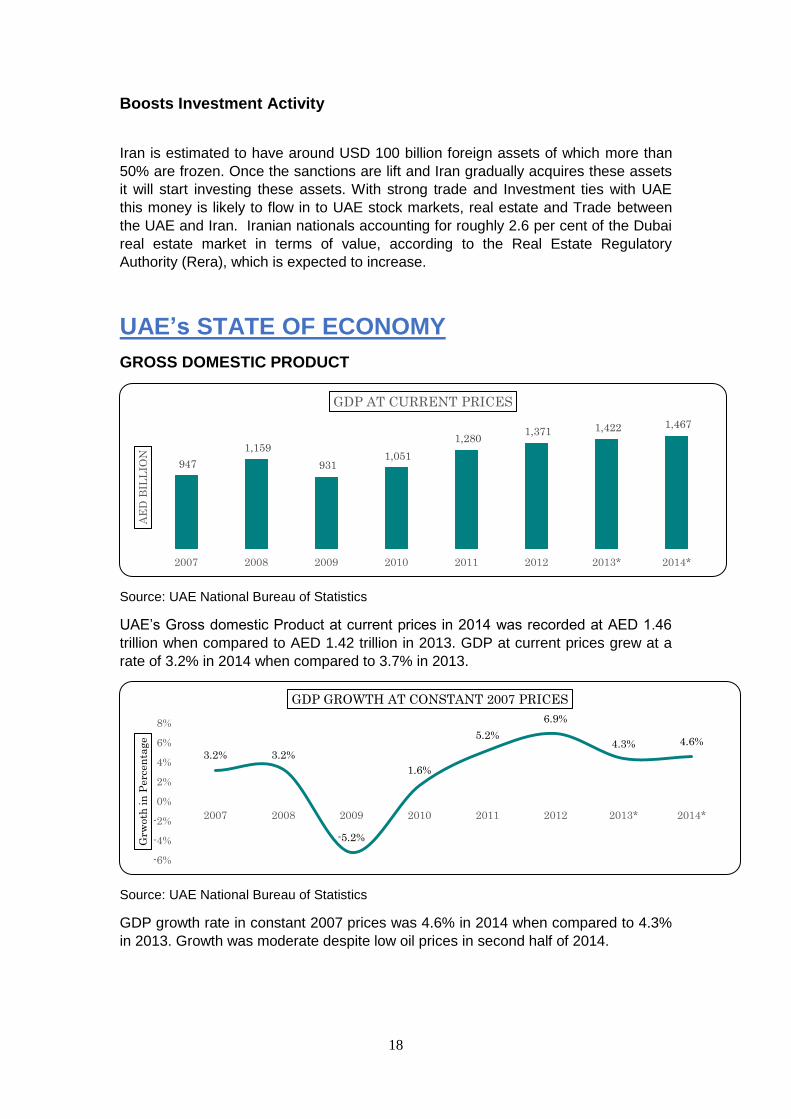
Boosts Investment Activity
Iran is estimated to have around USD 100 billion foreign assets of which more than
50% are frozen. Once the sanctions are lift and Iran gradually acquires these assets
it will start investing these assets. With strong trade and Investment ties with UAE
this money is likely to flow in to UAE stock markets, real estate and Trade between
the UAE and Iran. Iranian nationals accounting for roughly 2.6 per cent of the Dubai
real estate market in terms of value, according to the Real Estate Regulatory
Authority (Rera), which is expected to increase.
UAE’s STATE OF ECONOMY
GROSS DOMESTIC PRODUCT
Source: UAE National Bureau of Statistics
UAE’s Gross domestic Product at current prices in 2014 was recorded at AED 1.46
trillion when compared to AED 1.42 trillion in 2013. GDP at current prices grew at a
rate of 3.2% in 2014 when compared to 3.7% in 2013.
Source: UAE National Bureau of Statistics
GDP growth rate in constant 2007 prices was 4.6% in 2014 when compared to 4.3%
in 2013. Growth was moderate despite low oil prices in second half of 2014.
947
1,159
931 1,051
1,280 1,371 1,422 1,467
2007 2008 2009 2010 2011 2012 2013* 2014*
AE
D B
ILL
ION
GDP AT CURRENT PRICES
3.2% 3.2%
-5.2%
1.6%
5.2%
6.9%
4.3% 4.6%
-6%
-4%
-2%
0%
2%
4%
6%
8%
2007 2008 2009 2010 2011 2012 2013* 2014*
Grw
oth
in
Perc
en
tage
GDP GROWTH AT CONSTANT 2007 PRICES
19
Source: UAE National Bureau of Statistics
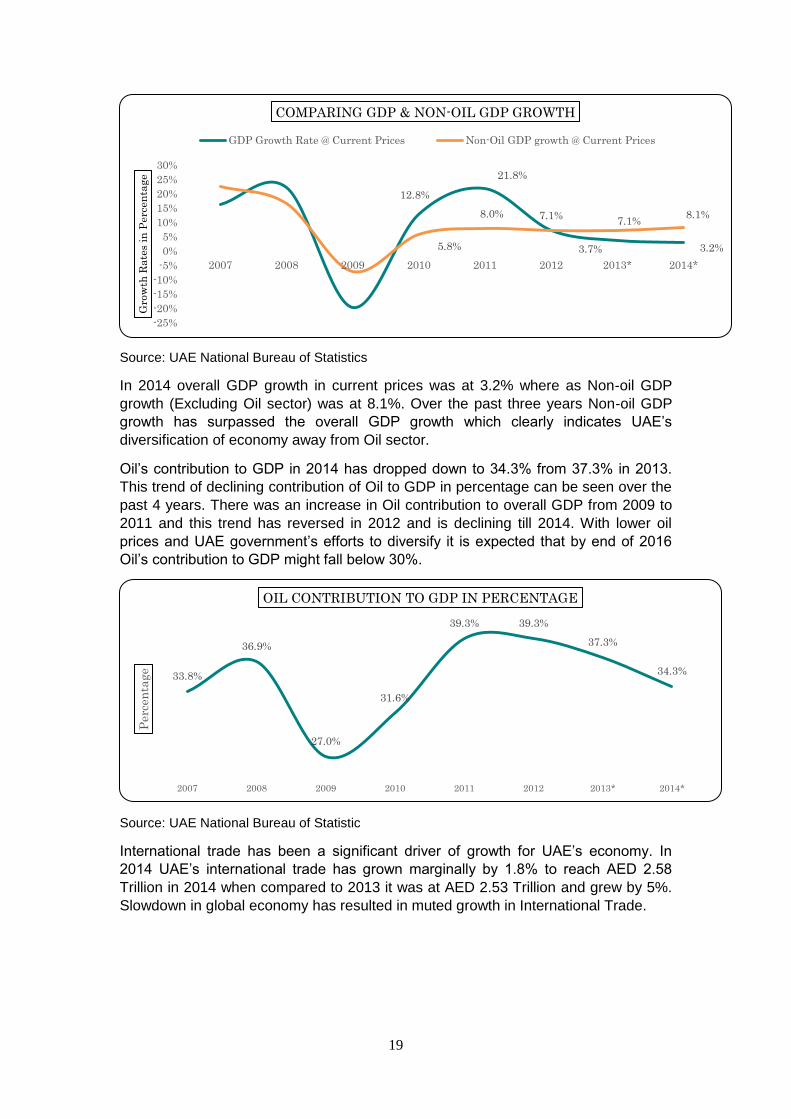
In 2014 overall GDP growth in current prices was at 3.2% where as Non-oil GDP
growth (Excluding Oil sector) was at 8.1%. Over the past three years Non-oil GDP
growth has surpassed the overall GDP growth which clearly indicates UAE’s
diversification of economy away from Oil sector.
Oil’s contribution to GDP in 2014 has dropped down to 34.3% from 37.3% in 2013.
This trend of declining contribution of Oil to GDP in percentage can be seen over the
past 4 years. There was an increase in Oil contribution to overall GDP from 2009 to
2011 and this trend has reversed in 2012 and is declining till 2014. With lower oil
prices and UAE government’s efforts to diversify it is expected that by end of 2016
Oil’s contribution to GDP might fall below 30%.
Source: UAE National Bureau of Statistic
International trade has been a significant driver of growth for UAE’s economy. In
2014 UAE’s international trade has grown marginally by 1.8% to reach AED 2.58
Trillion in 2014 when compared to 2013 it was at AED 2.53 Trillion and grew by 5%.
Slowdown in global economy has resulted in muted growth in International Trade.
12.8%
21.8%
3.7% 3.2% 5.8%
8.0% 7.1% 7.1%
8.1%
-25%
-20%
-15%
-10%
-5%
0%
5%
10%
15%
20%
25%
30%
2007 2008 2009 2010 2011 2012 2013* 2014*
Gro
wth
Rate
s in
Perc
en
tage
COMPARING GDP & NON-OIL GDP GROWTH
GDP Growth Rate @ Current Prices Non-Oil GDP growth @ Current Prices
33.8%
36.9%
27.0%
31.6%
39.3% 39.3%
37.3%
34.3%
2007 2008 2009 2010 2011 2012 2013* 2014*
Perc
en
tage
OIL CONTRIBUTION TO GDP IN PERCENTAGE

20
INTERNATIONAL TRADE
Source: UAE National Bureau of Statistics
Exports in 2014 were at AED 1.43 Trillion and Imports during the same period were
at AED 1.14 Trillion. Over the past decade exports have surpassed imports and
growth rate of exports was more or almost similar to growth rate of Imports which
makes UAE an export driven economy. But the growth of exports has dropped to 0%
and Imports increased by 5% in 2014 and Exports & Imports grew by 6% in 2013.
Source: UAE National Bureau of Statistics
Source: UAE National Bureau of Statistics
1,296 1,721 1,429 1,586
2,082 2,413 2,533 2,580 137%
149% 153% 151% 163%
176% 178% 176%
100%
140%
180%
220%
-
500
1,000
1,500
2,000
2,500
3,000
2007 2008 2009 2010 2011 2012 2013* 2014*
INT
ER
NA
TIO
NA
L T
RA
DE
AS
% O
F G
DP
INT
ER
NA
TIO
NA
L T
RA
DE
IN
AE
D B
ILL
ION
INTERNATIONAL TRADE
Total International Trade International Trade as % of GDP
686
914
742 827
1,156
1,380 1,441 1,437
610
807
687 759
925 1,033
1,092 1,143
2007 2008 2009 2010 2011 2012 2013* 2014*
AE
D B
ILL
ION
INTERNATIONAL TRADE
Exports Imports
0%
6% 5%
-30%
-20%
-10%
0%
10%
20%
30%
40%
50%
60%
2007 2008 2009 2010 2011 2012 2013* 2014*
PE
RC
EN
TA
GE
GR
OW
TH
EXPORTS AND IMPORTS GROWTH COMPARISION
Exports Growth Imports Growth
21
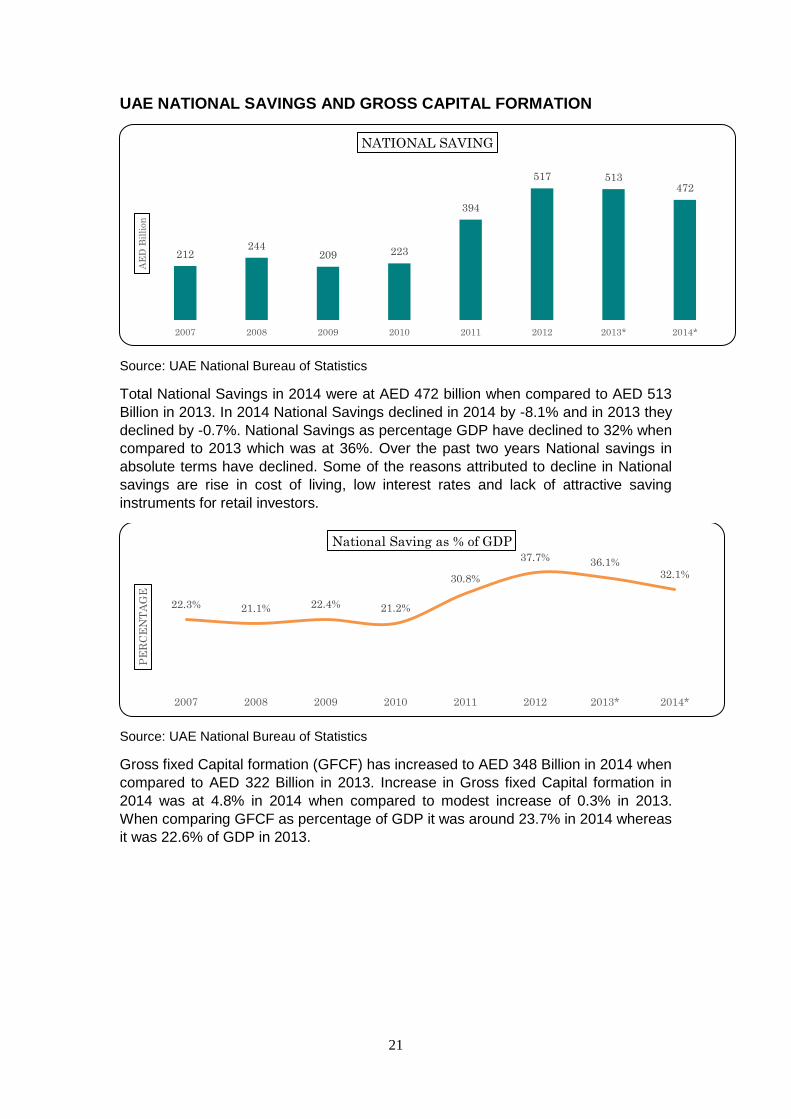
UAE NATIONAL SAVINGS AND GROSS CAPITAL FORMATION
Source: UAE National Bureau of Statistics
Total National Savings in 2014 were at AED 472 billion when compared to AED 513
Billion in 2013. In 2014 National Savings declined in 2014 by -8.1% and in 2013 they
declined by -0.7%. National Savings as percentage GDP have declined to 32% when
compared to 2013 which was at 36%. Over the past two years National savings in
absolute terms have declined. Some of the reasons attributed to decline in National
savings are rise in cost of living, low interest rates and lack of attractive saving
instruments for retail investors.
Source: UAE National Bureau of Statistics
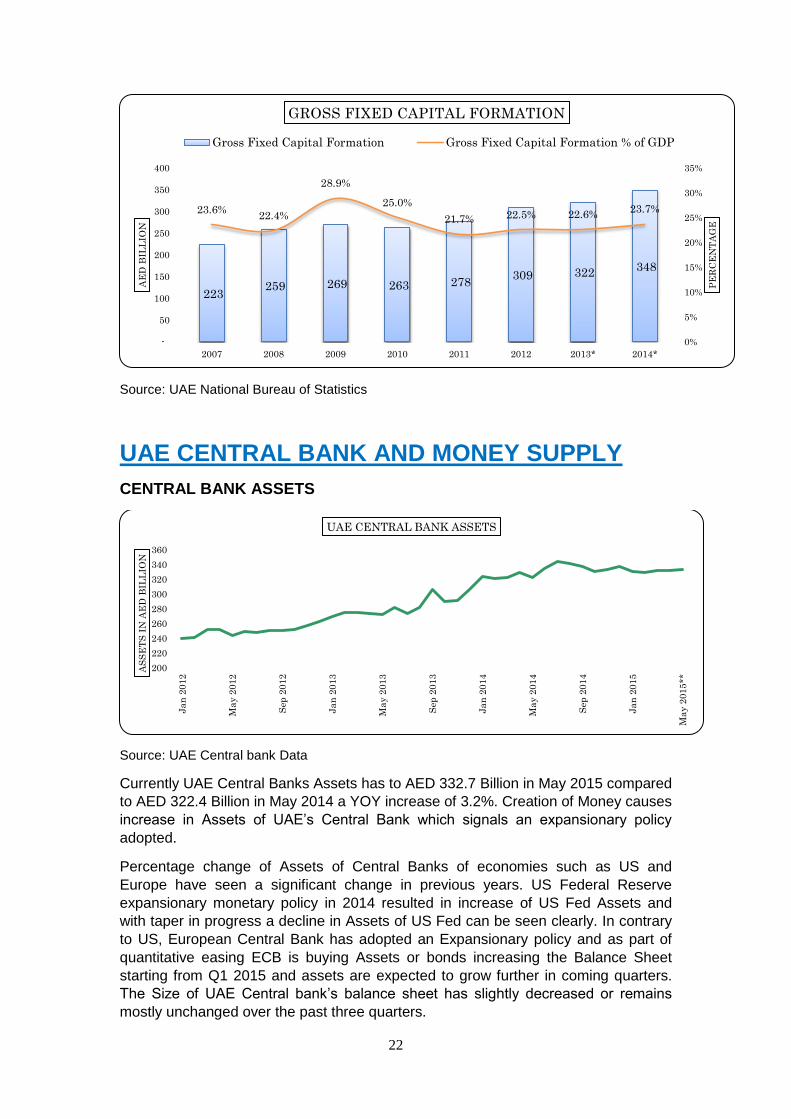
Gross fixed Capital formation (GFCF) has increased to AED 348 Billion in 2014 when
compared to AED 322 Billion in 2013. Increase in Gross fixed Capital formation in
2014 was at 4.8% in 2014 when compared to modest increase of 0.3% in 2013.
When comparing GFCF as percentage of GDP it was around 23.7% in 2014 whereas
it was 22.6% of GDP in 2013.
212 244
209 223
394
517 513 472
2007 2008 2009 2010 2011 2012 2013* 2014*
AE
D B
illi
on
NATIONAL SAVING
22.3% 21.1% 22.4% 21.2%
30.8%
37.7% 36.1% 32.1%
2007 2008 2009 2010 2011 2012 2013* 2014*
PE
RC
EN
TA
GE
National Saving as % of GDP
22
Source: UAE National Bureau of Statistics
UAE CENTRAL BANK AND MONEY SUPPLY
CENTRAL BANK ASSETS
Source: UAE Central bank Data
Currently UAE Central Banks Assets has to AED 332.7 Billion in May 2015 compared
to AED 322.4 Billion in May 2014 a YOY increase of 3.2%. Creation of Money causes
increase in Assets of UAE’s Central Bank which signals an expansionary policy
adopted.
Percentage change of Assets of Central Banks of economies such as US and
Europe have seen a significant change in previous years. US Federal Reserve
expansionary monetary policy in 2014 resulted in increase of US Fed Assets and
with taper in progress a decline in Assets of US Fed can be seen clearly. In contrary
to US, European Central Bank has adopted an Expansionary policy and as part of
quantitative easing ECB is buying Assets or bonds increasing the Balance Sheet
starting from Q1 2015 and assets are expected to grow further in coming quarters.
The Size of UAE Central bank’s balance sheet has slightly decreased or remains
mostly unchanged over the past three quarters.
223 259 269 263 278
309 322 348
23.6% 22.4%
28.9%
25.0%
21.7% 22.5% 22.6% 23.7%
0%
5%
10%
15%
20%
25%
30%
35%
-
50
100
150
200
250
300
350
400
2007 2008 2009 2010 2011 2012 2013* 2014*
PE
RC
EN
TA
GE
AE
D B
ILL
ION
GROSS FIXED CAPITAL FORMATION
Gross Fixed Capital Formation Gross Fixed Capital Formation % of GDP
200
220
240
260
280
300
320
340
360
Ja
n 2
012
Ma
y 2
012
Sep
20
12
Ja
n 2
013
Ma
y 2
013
Sep
20
13
Ja
n 2
014
Ma
y 2
014
Sep
20
14
Ja
n 2
015
Ma
y 2
015
**
AS
SE
TS
IN
AE
D B
ILL
ION
UAE CENTRAL BANK ASSETS
23
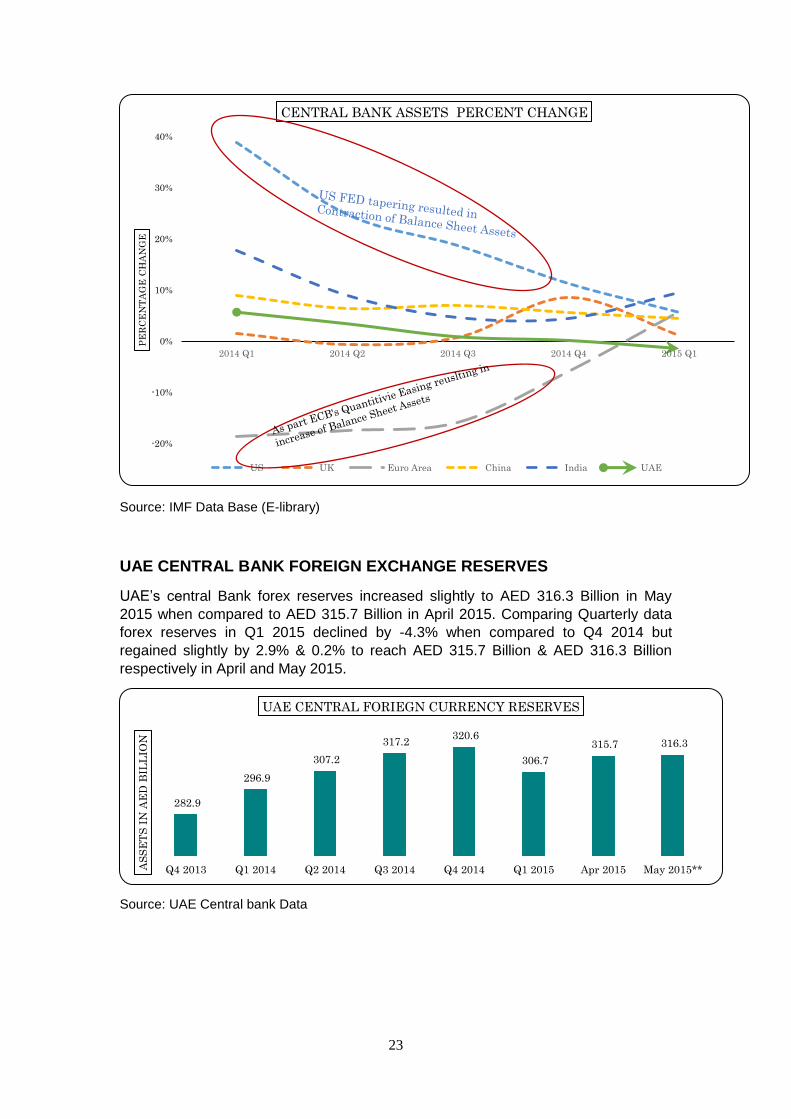
Source: IMF Data Base (E-library)
UAE CENTRAL BANK FOREIGN EXCHANGE RESERVES
UAE’s central Bank forex reserves increased slightly to AED 316.3 Billion in May
2015 when compared to AED 315.7 Billion in April 2015. Comparing Quarterly data
forex reserves in Q1 2015 declined by -4.3% when compared to Q4 2014 but
regained slightly by 2.9% & 0.2% to reach AED 315.7 Billion & AED 316.3 Billion
respectively in April and May 2015.
Source: UAE Central bank Data
-20%
-10%
0%
10%
20%
30%
40%
2014 Q1 2014 Q2 2014 Q3 2014 Q4 2015 Q1
PE
RC
EN
TA
GE
CH
AN
GE
CENTRAL BANK ASSETS PERCENT CHANGE
US UK Euro Area China India UAE
282.9
296.9
307.2
317.2 320.6
306.7
315.7 316.3
Q4 2013 Q1 2014 Q2 2014 Q3 2014 Q4 2014 Q1 2015 Apr 2015 May 2015**AS
SE
TS
IN
AE
D B
ILL
ION
UAE CENTRAL FORIEGN CURRENCY RESERVES
24
Source: UAE Central bank Data
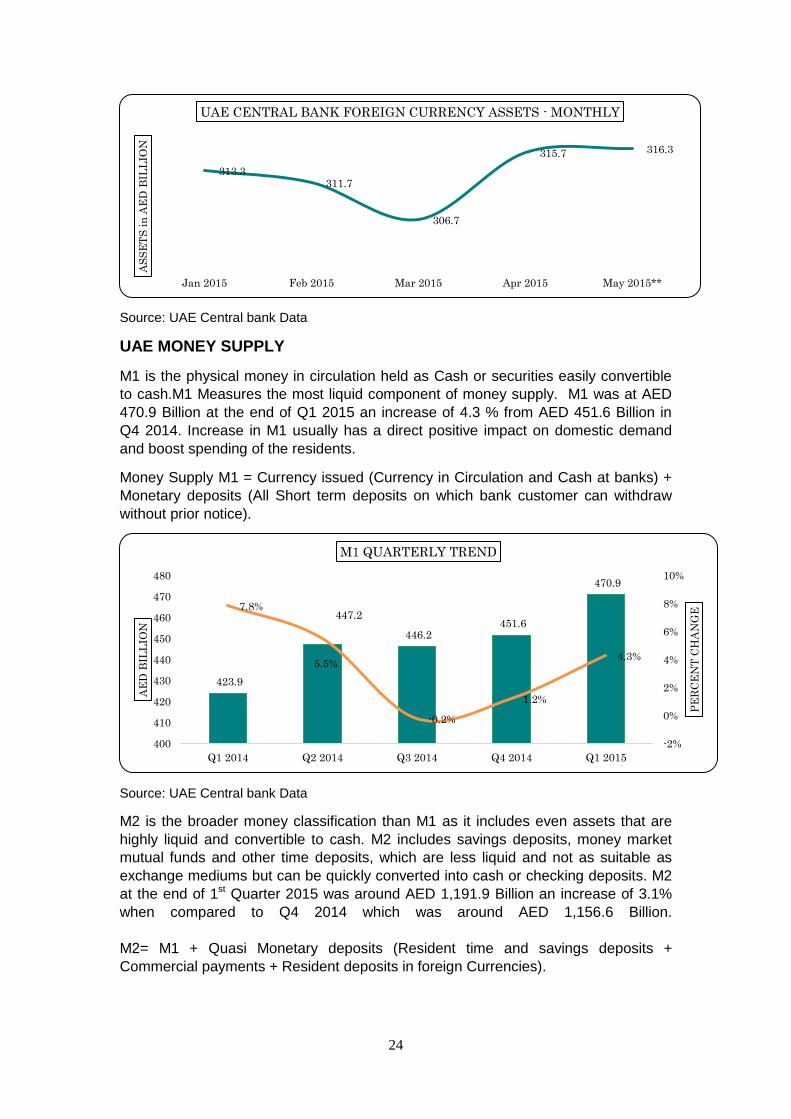
UAE MONEY SUPPLY
M1 is the physical money in circulation held as Cash or securities easily convertible
to cash.M1 Measures the most liquid component of money supply. M1 was at AED
470.9 Billion at the end of Q1 2015 an increase of 4.3 % from AED 451.6 Billion in
Q4 2014. Increase in M1 usually has a direct positive impact on domestic demand
and boost spending of the residents.
Money Supply M1 = Currency issued (Currency in Circulation and Cash at banks) +
Monetary deposits (All Short term deposits on which bank customer can withdraw
without prior notice).
Source: UAE Central bank Data
M2 is the broader money classification than M1 as it includes even assets that are
highly liquid and convertible to cash. M2 includes savings deposits, money market
mutual funds and other time deposits, which are less liquid and not as suitable as
exchange mediums but can be quickly converted into cash or checking deposits. M2
at the end of 1st Quarter 2015 was around AED 1,191.9 Billion an increase of 3.1%
when compared to Q4 2014 which was around AED 1,156.6 Billion.
M2= M1 + Quasi Monetary deposits (Resident time and savings deposits +
Commercial payments + Resident deposits in foreign Currencies).
313.3 311.7
306.7
315.7 316.3
Jan 2015 Feb 2015 Mar 2015 Apr 2015 May 2015**
AS
SE
TS
in
AE
D B
ILL
ION
UAE CENTRAL BANK FOREIGN CURRENCY ASSETS - MONTHLY
423.9
447.2
446.2 451.6
470.9
7.8%
5.5%
-0.2%
1.2%
4.3%
-2%
0%
2%
4%
6%
8%
10%
400
410
420
430
440
450
460
470
480
Q1 2014 Q2 2014 Q3 2014 Q4 2014 Q1 2015
PE
RC
EN
T C
HA
NG
E
AE
D B
ILL
ION
M1 QUARTERLY TREND
25
Source: UAE Central bank Data
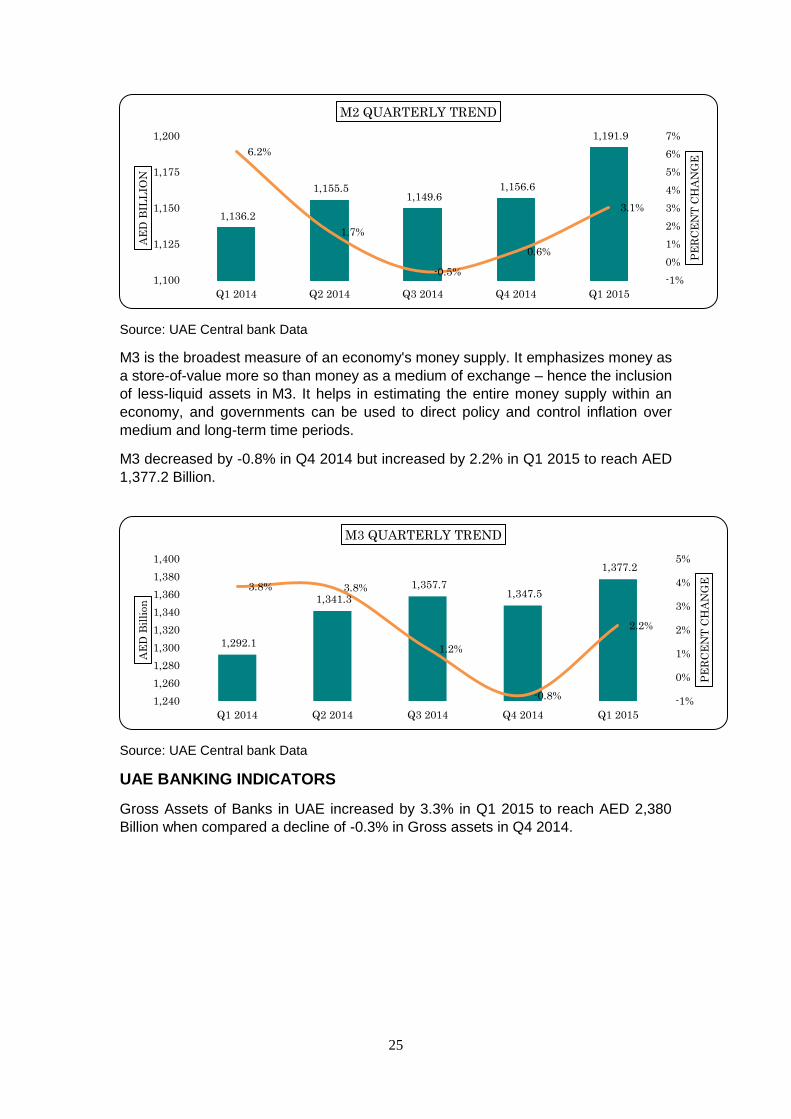
M3 is the broadest measure of an economy's money supply. It emphasizes money as
a store-of-value more so than money as a medium of exchange – hence the inclusion
of less-liquid assets in M3. It helps in estimating the entire money supply within an
economy, and governments can be used to direct policy and control inflation over
medium and long-term time periods.
M3 decreased by -0.8% in Q4 2014 but increased by 2.2% in Q1 2015 to reach AED
1,377.2 Billion.
Source: UAE Central bank Data
UAE BANKING INDICATORS
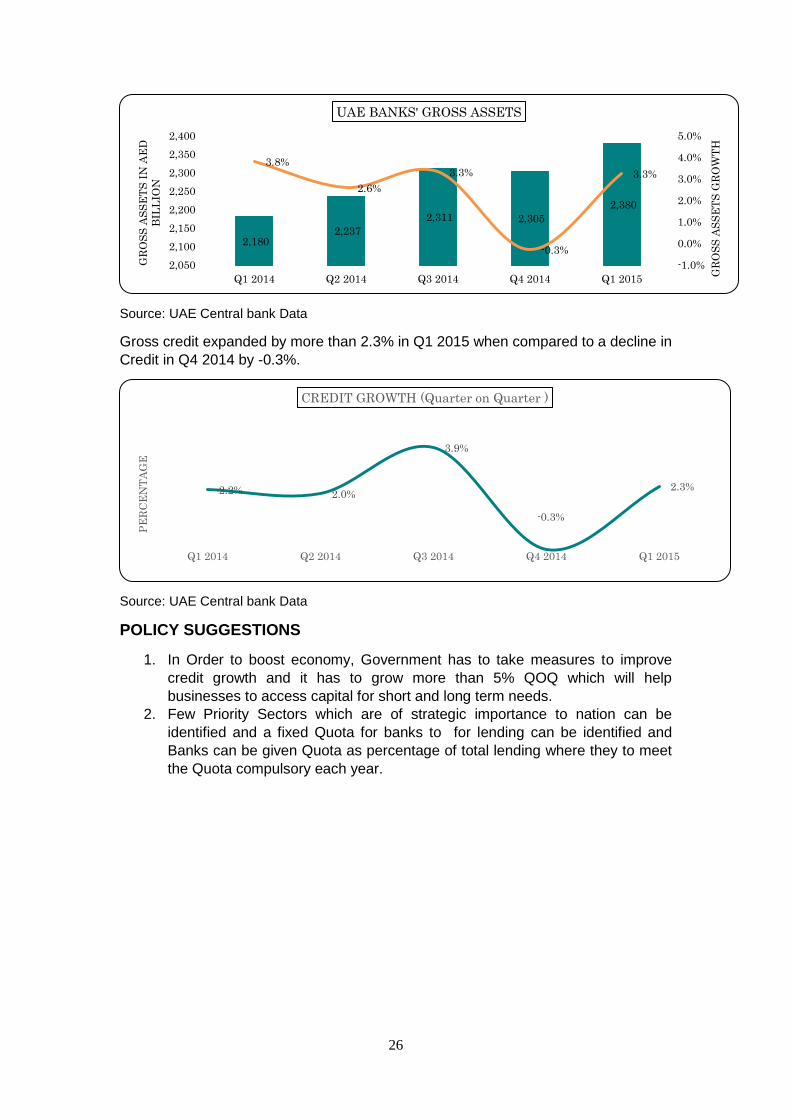
Gross Assets of Banks in UAE increased by 3.3% in Q1 2015 to reach AED 2,380
Billion when compared a decline of -0.3% in Gross assets in Q4 2014.
1,136.2
1,155.5 1,149.6
1,156.6
1,191.9
6.2%
1.7%
-0.5%
0.6%
3.1%
-1%
0%
1%
2%
3%
4%
5%
6%
7%
1,100
1,125
1,150
1,175
1,200
Q1 2014 Q2 2014 Q3 2014 Q4 2014 Q1 2015
PE
RC
EN
T C
HA
NG
E
AE
D B
ILL
ION
M2 QUARTERLY TREND
1,292.1
1,341.3
1,357.7 1,347.5
1,377.2
3.8% 3.8%
1.2%
-0.8%
2.2%
-1%
0%
1%
2%
3%
4%
5%
1,240
1,260
1,280
1,300
1,320
1,340
1,360
1,380
1,400
Q1 2014 Q2 2014 Q3 2014 Q4 2014 Q1 2015P
ER
CE
NT
CH
AN
GE
AE
D B
illi
on
M3 QUARTERLY TREND
26
Source: UAE Central bank Data
Gross credit expanded by more than 2.3% in Q1 2015 when compared to a decline in
Credit in Q4 2014 by -0.3%.
Source: UAE Central bank Data
POLICY SUGGESTIONS
1. In Order to boost economy, Government has to take measures to improve
credit growth and it has to grow more than 5% QOQ which will help
businesses to access capital for short and long term needs.
2. Few Priority Sectors which are of strategic importance to nation can be
identified and a fixed Quota for banks to for lending can be identified and
Banks can be given Quota as percentage of total lending where they to meet
the Quota compulsory each year.
2,180 2,237
2,311 2,305
2,380
3.8%
2.6%
3.3%
-0.3%
3.3%
-1.0%
0.0%
1.0%
2.0%
3.0%
4.0%
5.0%
2,050
2,100
2,150
2,200
2,250
2,300
2,350
2,400
Q1 2014 Q2 2014 Q3 2014 Q4 2014 Q1 2015
GR
OS
S A
SS
ET
S G
RO
WT
H
GR
OS
S A
SS
ET
S I
N A
ED
BIL
LIO
N
UAE BANKS' GROSS ASSETS
2.2% 2.0%
3.9%
-0.3%
2.3%
Q1 2014 Q2 2014 Q3 2014 Q4 2014 Q1 2015
PE
RC
EN
TA
GE
CREDIT GROWTH (Quarter on Quarter )

27
OIL PRICE AND MARKET ANALYSIS
OIL AGAIN APPROACHING BEAR MARKET
WTI Crude Oil bench mark has fallen more than 18% to reach levels of $50 a barrel
from the Highs of $62 per barrel in mid-May. Uncertainty in global economy and
excess supply are the concerns which are driving Oil prices down again.
Oil Prices started falling again due to several factors such as
1. Iran Nuclear deal
It is expected that Iran will reach a nuclear deal with Western countries in coming
days. Once nuclear deal is finalized it is expected that sanctions on Iranian
exports will be lifted and Iran is expected to export 800,000 to 1 Million Barrels of
Oil per day and this will add to already excess supply of Oil and may pull down
the oil prices further down. According to political analysts Iran deal is approaching
a closure and might start oil exports to Europe beginning next year. Iran is likely
to sell anywhere between 30 to 50 Million barrels from inventory the country has
stored in oil tankers at sea during sanctions which might have an immediate
impact on prices in the short term.
2. Slow-down in China
China which has emerged as a manufacturing hub of the world and growth
engine for global economy. There are clear signs of china slowing down and is
growth rate is expected to moderate in the coming quarters. Slow growth in China
45
50
55
60
65
Jan
01, 2015
Jan
21, 2015
Feb 1
1, 2015
Mar
03, 20
15
Mar
24, 20
15
Ap
r 15, 2015
May 0
6, 2015
May 2
5, 2015
Ju
n 1
5, 201
5
Ju
l 06
, 2015
US
D P
ER
BA
RR
EL
WTI CRUDE OIL
90.7 91.4
92.6 93.0
91.7 91.6
93.1 92.6
93.5 90.4
91.3 91.8 91.9 92.2
93.0
94.1
95.3 95.3
1Q
20
13
2Q
20
13
3Q
20
13
4Q
20
13
1Q
20
14
2Q
20
14
3Q
20
14
4Q
20
14
1Q
20
15
Mil
lion
Barr
els
per
day
WORLD OIL SUPPLY AND DEMAND
Total demand Total Supply
28
will put downward pressure on demand for Oil which might push Oil prices further
down.
3. Greek Crisis
Greece’s decision to reject bailout package and fears of exit from European Union
also had a significant impact on oil demand and prices. US dollar has strengthened
against Euro and other major currencies. Since oil is priced in US dollar and dollar
strengthening will have an inverse impact on oil prices.
4. US Shale Oil Supply Resilience
The number of oil rigs drilling in the US rose for the first time in 29 weeks, in a sign
some shale companies have successfully squeezed down costs and moved to
reposition drilling rigs to the most productive plays. US crude oil inventories also rose
last week and are above 465m barrels, a level never recorded before 2015. US
producers are finding the current price levels not so difficult to manage as expected
earlier.
5. Increase in OPEC Output
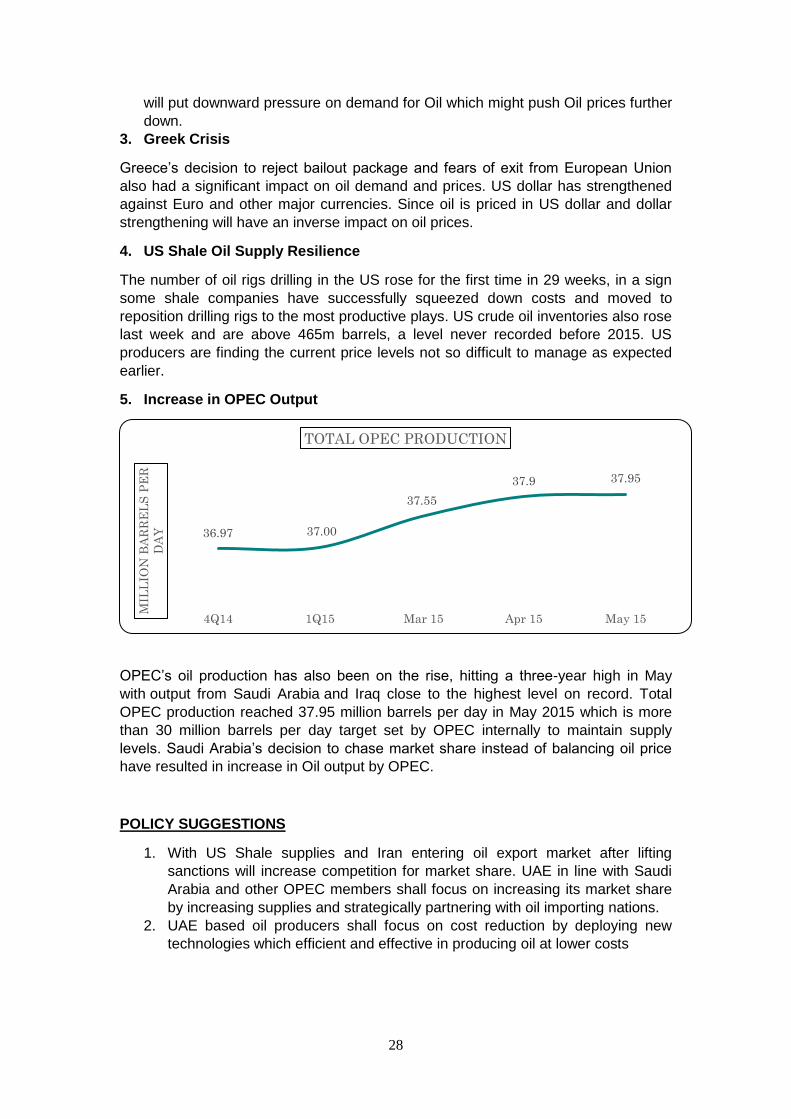
OPEC’s oil production has also been on the rise, hitting a three-year high in May
with output from Saudi Arabia and Iraq close to the highest level on record. Total
OPEC production reached 37.95 million barrels per day in May 2015 which is more
than 30 million barrels per day target set by OPEC internally to maintain supply
levels. Saudi Arabia’s decision to chase market share instead of balancing oil price
have resulted in increase in Oil output by OPEC.
POLICY SUGGESTIONS
1. With US Shale supplies and Iran entering oil export market after lifting
sanctions will increase competition for market share. UAE in line with Saudi
Arabia and other OPEC members shall focus on increasing its market share
by increasing supplies and strategically partnering with oil importing nations.
2. UAE based oil producers shall focus on cost reduction by deploying new
technologies which efficient and effective in producing oil at lower costs
36.97 37.00
37.55
37.9 37.95
4Q14 1Q15 Mar 15 Apr 15 May 15
MIL
LIO
N B
AR
RE
LS
PE
R
DA
Y
TOTAL OPEC PRODUCTION
29
GREECE CRISIS
GREECE HAS VOTED “NO” ON EUROPE’S BAILOUT TERMS AND ITS
IMPACT ON GLOBAL ECONOMY
WHAT HAS HAPPENED IN GREECE?
Crisis crept in to Greece and some of the pain points which worsened its situation are
1. External Debt
External Commercial borrowings of Greece government increased overtime
and reached more than 200% of the GDP and making difficult for the Greece
government to pay off interest payments to International agencies.
2. Uncollected Tax Receipts
Greece government was unable to collect Tax receipts and many businesses
defaulted their tax payments. It was estimated that 85% of tax receipts were
uncollected.
3. Unemployment
Unemployment remained a major challenge for Greece Economy and
reached levels of more than 25% to total labor force.
4. Withdrawal Of Deposits From Greece Banks
WHAT IS HAPPENING IN GREECE?
Greece's government last week missed a critical debt payment to the International
Monetary Fund, and its banks have been forced to close.
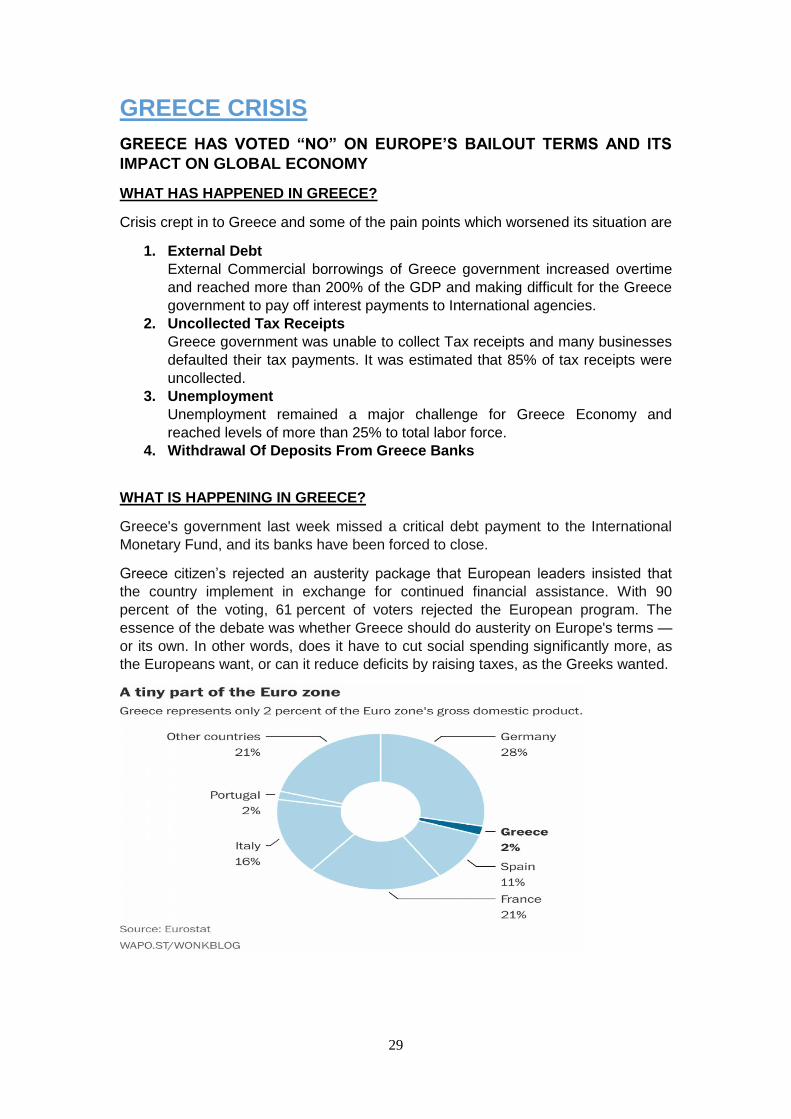
Greece citizen’s rejected an austerity package that European leaders insisted that
the country implement in exchange for continued financial assistance. With 90
percent of the voting, 61 percent of voters rejected the European program. The
essence of the debate was whether Greece should do austerity on Europe's terms —
or its own. In other words, does it have to cut social spending significantly more, as
the Europeans want, or can it reduce deficits by raising taxes, as the Greeks wanted.
30
Now Greek banks have run out of cash and there is an immediate need for Capital
injection in to Greek banks. European central bank has to give money to Greece
banks as Greek central bank do not have the capacity to print Euro and utilize it. If
ECB denies any new funding to Greece banks then Greece might consider the option
of dumping Euro as currency and printing its own currency.
IMPACT ON GREECE EXIT FROM EURO ON ITS OWN ECONOMY:
NEGATIVE IMPACT
1. Greece will have to issue its own currency ―Drachma‖ and it will depreciate
2. Inflation will increase in double digits
3. Companies based out of Greece borrowed in Euros might go bankrupt
4. Unemployment which currently at 25% might increase further in coming years
POSITIVE IMPACT:
1. After two or three years Greece with devalued currency might help exports by
making them competitive
2. Greater autonomy and control of Greece government over its economy and
monetary policy.
IMPACT ON GREECE EXIT ON EUROPE
NEGATIVE IMPACT:
1. European Central Bank which lend Greece government and Greek banks will
lose money. It is estimated that ECB has lent around Euro 240 billion to
Greece government and Euro 90 billion to Greece banks as loans. In total
ECB will lose Euro 330 billion.
2. Borrowing costs for countries facing financial difficulties such as Italy, Spain
and Portugal might increase which will be very difficult to manage.
3. If Greece succeeds in future other Euro countries might also consider leaving
European Union which will threaten stability of the Union.
POSITIVE IMPACT
1. Greece leaving Euro will add more pressure to already declining Euro and will
make exports from European region more competitive
IMPACT ON GREECE EXIT ON GOBAL ECONOMY
1. Weak Euro means a strong dollar which will make exports from US & around
the globe to Europe expensive.
2. Prices of crude oil, metals will further fall due to weak demand in Europe.
IMPACT ON UAE ECONOMY:
US dollar will become stronger which will also make AED stronger as it is pegged to
USD. Stronger AED in comparison to Euro will make exports to Europe costlier from
UAE and also Imports from Europe to UAE cheaper. Europe one of the important
trading partner will have an impact on International trade due to currency fluctuations.
31
POLICY SUGGESTIONS
1. Central bank of UAE can assess the exposure of local banks to Greece banks
and companies and suggest corrective actions
2. Equipping Banks and Financial Institutions with exposure to Euro with more
risk management tools in case more countries decide to leave Eurozone
3. Due to crisis valuations in Greece will look cheap and might fall below their
intrinsic value. Investors based out of UAE can look for distressed businesses
and assets as it is perfect time for Investors with contrarian or value investing
approach to invest in Greece.
DIFC ANNOUNCES 10 YEAR STRATEGY
AIM AND VISION:
Aims to position the Centre among the top 10 financial centers globally
Plans to domicile 1,000 financial firms in the next 10 years, in comparison to
362 in 2014
Targets increasing combined workforce of Centre from 17,860 in 2014 to
50,000 by 2024
Aims to align DIFC 2024 Strategy with Dubai Plan 2021 to strengthen
Centre’s position as a global hub for Islamic legislation and financial services
Aims to support the financial services sector to contribute 18% to Dubai’s
GDP in the next 10 years
Year 2013 2014 2024E
Number of Employees 15,667 17,860 50,000
Growth% 14.0% 180.0%
Domiciled Financial Firms 1,038 1,225 2,225
Growth% 18.0% 81.6%
Commercial Office Space (Square feet) 245,217 282,000
Growth% 15.0%
15,667 17,860
50,000
2013 2014 2024E
DIFC - WORKFORCE EXPANSION PLANS
DIFC Plans to triple the size
32
EXPECTED GROWTH POTENTIAL
1. Apart from European and American Financial companies, DIFC plans to attract
more number of financial firms from emerging countries and bridge the south-
south corridor that links Dubai with Asia & Africa
2. Private Banking and Wealth management is another area of growth as it is
estimated that the Private Wealth of Family offices and Ultra rich based out of
MENA region to be around USD 7 trillion
POTENTIAL CHALLENGES FOR DIFC
1. Global Crisis:
Financial crisis coupled with slowdown has affected the global banks negatively.
Top global banks such as HSBC are cutting their workforce and slashing the
Investment Banking operations
2. Regional Instability:
MENA region which is considered politically risky by global financial firms still
poses a challenge in attracting more number of financial firms to DIFC.
3. Competition:
Saudi Arabia, Qatar and Abu Dhabi are building financial centers which are close
to DIFC and will compete for finite pool of resources especially in the sectors of
wealth management and private banking and would look to attract part of the
market share of DIFC. Shanghai & Mumbai are also emerging as financial
centers in Asia and pose a challenge in attracting financial firms from Asia.
POLICY SUGGESTIONS
1. Aggressive marketing to Asia Pacific banks
Asia pacific banks which are emerging and trying to expand their global foot print
and Dubai which has a strategic advantage can attract these financial firms to set
their base to cater businesses in Africa and Middle East.
2. Developing Financial Markets by introduction of complex Financial
Products
Financial Markets in MENA region lack in offering complex financial products
which are required for the businesses for risk management due to volatile global
environment
3. Attracting Small & Medium sized Financial Services firm
Boutique Investment & Advisory firms, specialized financial service firms have to
be attracted as they offer niche services which are complimentary and required to
execute transactions in complex global world. These firms can be supported can
be offered Infrastructure and communication services at subsidized or
competitive prices

33
INVESTMENT MONITOR

34
UNCTAD GLOBAL INVESTMENT REPORT 2015
Global foreign direct investment (FDI) inflows fell by 16 per cent in 2014 to $1.23
trillion, down from $1.47 trillion in 2013. FDI inflows declined in contrast to growth in
global GDP, modest growth in Trade and employment figures. The decline in FDI
inflows I 2014 was influenced due to the following
1. Global crisis and slowdown of major economies
2. Uncertainty for Investors over government policies
3. Increased Geo-political risks
Source: UNCTAD Investment Report 2015
Inward FDI flows to developing economies reached their highest level at $681 billion
with a 2 per cent rise. Developing economies thus extended their lead in global
inflows. China became the world’s largest recipient of FDI. Among the top 10 FDI
recipients in the world, 5 are developing economies. Whereas FDI flows to developed
countries dropped by 28 per cent to $499 billion. Global FDI inflows are projected to
grow by 11 per cent to $1.4 trillion in 2015. Expectations are for further rises to $1.5
trillion in 2016 and to $1.7 trillion in 2017. However, a number of economic and
political risks, including ongoing uncertainties in the Eurozone, potential spillovers
from conflicts, and persistent vulnerabilities in emerging economies, may disrupt the
projected recovery.
FDI INFLOWS REGIONAL BREAKUP
1.47
1.23 1.4
1.5
1.7
2013A 2014A 2015F 2016F 2017F
FD
I In
flow
(B
illi
on
US
D)
GLOBAL FORIEGN DIRECT INVESTMENT INFLOWS
Developing Asia
40%
Europe
25%
Latin America and
Caribbean
14%
North America
12%
Transition
Economies
4%
Africa
5%
FDI BREAK UP REGION WISE IN 2014
35
FDI inflows to Africa remained flat at $54 billion. Although the services share
in Africa FDI is still lower than the global and the developing-country
averages, in 2012, services accounted for 48 per cent of the total FDI stock in
the region, more than twice the share of manufacturing (21 per cent). FDI
stock in the primary sector was 31 per cent of the total.
Developing Asia (up 9 per cent) saw FDI inflows grow to historically high
levels. Asia reached nearly half a trillion dollars in 2014, further consolidating
the region’s position as the largest recipient in the world.
FDI flows to Latin America and the Caribbean (down 14 per cent) decreased
to $159 billion in 2014, after four years of consecutive increases. This is
mainly due to a decline in cross-border M&As in Central America and the
Caribbean and to lower commodity prices, which dampened FDI to South
America.
FDI inflows to developed countries fell by 28 per cent to $499 billion.
Divestment and large swings in intracompany loans reduced inflows to the
lowest level since 2004.
FDI inflows to developed countries fell by 28 per cent to $499 billion.
Divestment and large swings in intracompany loans reduced inflows to the
lowest level since 2004.
COUNTRY OF FOCUS - GEORGIA
ECONOMIC SNAP SHOT OF GEROGIA
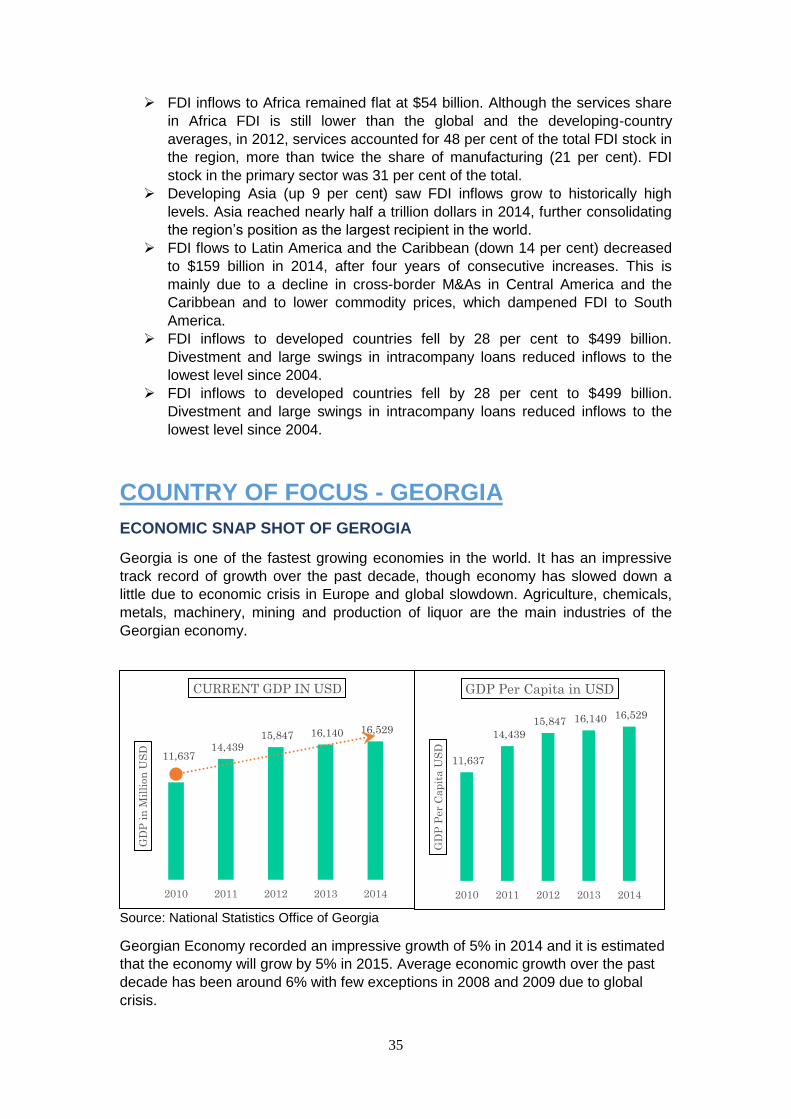
Georgia is one of the fastest growing economies in the world. It has an impressive
track record of growth over the past decade, though economy has slowed down a
little due to economic crisis in Europe and global slowdown. Agriculture, chemicals,
metals, machinery, mining and production of liquor are the main industries of the
Georgian economy.
Source: National Statistics Office of Georgia
Georgian Economy recorded an impressive growth of 5% in 2014 and it is estimated
that the economy will grow by 5% in 2015. Average economic growth over the past
decade has been around 6% with few exceptions in 2008 and 2009 due to global
crisis.
11,637 14,439
15,847 16,140 16,529
2010 2011 2012 2013 2014
GD
P i
n M
illi
on
US
D
CURRENT GDP IN USD
11,637
14,439
15,847 16,140 16,529
2010 2011 2012 2013 2014
GD
P P
er
Cap
ita U
SD
GDP Per Capita in USD
36
Source: IMF World Economic Outlook Database (* Estimates)
GEORGIAN ECONOMY BREAK UP BY ACTIVITY
Georgian Economy is dominated by sectors such as Agriculture, Manufacturing, and
Construction & Real Estate activities, Wholesale & Retail activities. Sectorial
contribution of Manufacturing, Construction and Wholesale & retail services has
increased significantly.
Source: National Statistics Office of Georgia
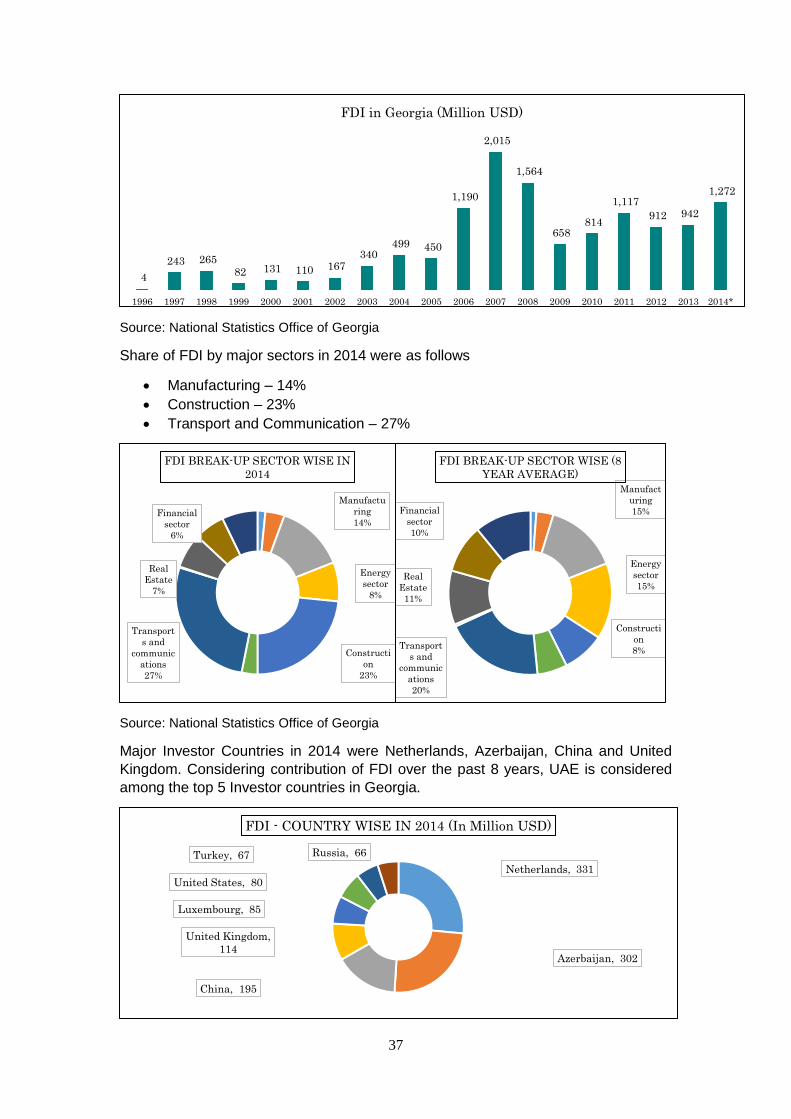
FORGIEN DIRECT INVESTMENT TRENDS IN GEORGIA
Georgian Economy is heavily dependent on foreign direct Investments and any
slowdown in FDI is affecting its economy. Foreign direct investment in Georgia in
2014 amounted to 1.2 Billion USD and recorded an impressive growth of 35% when
compared to FDI in 2013. FDI reached a peak of 2 Billion USD before Global crisis in
2007 and is still below its peak even in 2014. Significant efforts are made by
Georgian government to attract FDI and is expected to increase in the coming years.
The chart below shows the Trend of FDI over the past two decades.
11.1%
5.9%
9.6% 9.4%
12.3%
2.3%
-3.8%
6.3% 7.2%
6.2%
3.2%
5.0% 5.0%
2003 2004 2005 2006 2007 2008 2009 2010 2011 2012 2013 2014* 2015*
GEORGIAN REAL GDP GROWTH (%)
Agriculture and Related
9%
Mining and
Manufacutring
11%
Electricity,Gas & Water
Supply
3%
Construction and Real
Estate Services
16%
Wholesale & Retail
services
17%
Hotels and Restaurants
2%
Transport
8%
Communication
3%
Financial Services
3%
Public Administration
10%
Education
5%
Health and Social Work
Services
6%
Household Production and
other Services
7%
GEORGIAN ECONOMIC ACTIVITY BREAK UP IN 2014
37
Source: National Statistics Office of Georgia
Share of FDI by major sectors in 2014 were as follows
Manufacturing – 14%
Construction – 23%
Transport and Communication – 27%
Source: National Statistics Office of Georgia
Major Investor Countries in 2014 were Netherlands, Azerbaijan, China and United
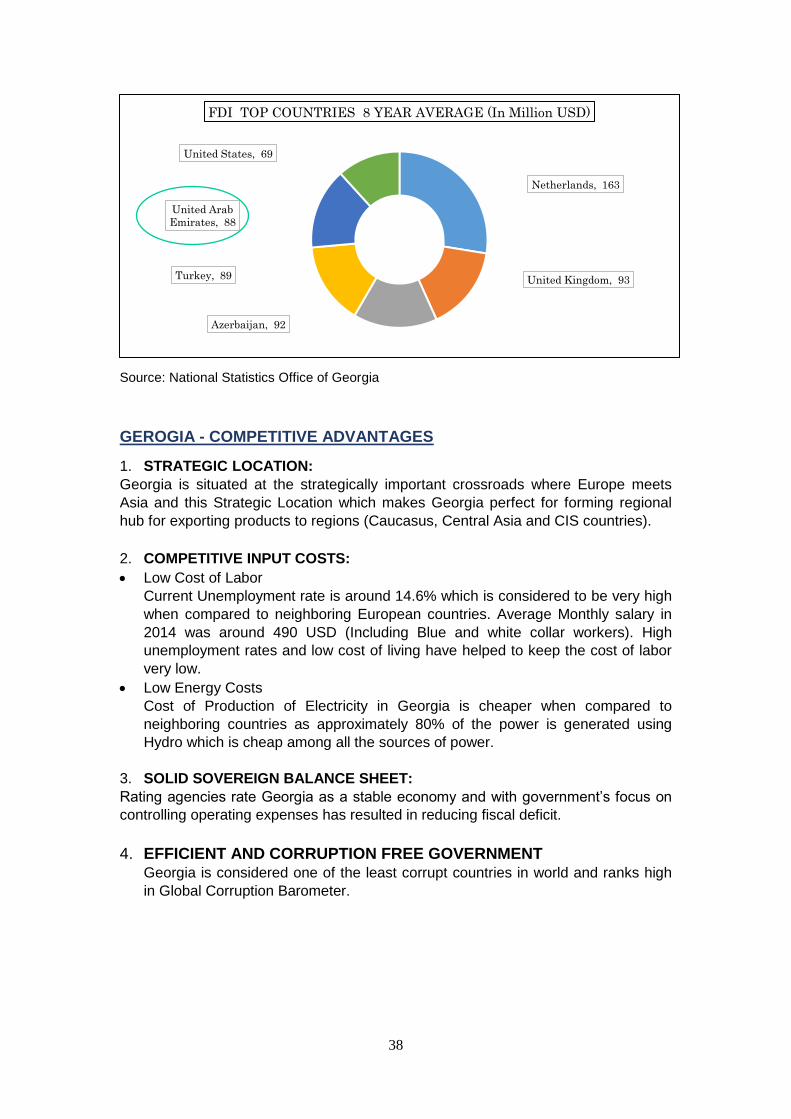
Kingdom. Considering contribution of FDI over the past 8 years, UAE is considered
among the top 5 Investor countries in Georgia.
4
243 265 82 131 110 167
340 499 450
1,190
2,015
1,564
658 814
1,117
912 942
1,272
1996 1997 1998 1999 2000 2001 2002 2003 2004 2005 2006 2007 2008 2009 2010 2011 2012 2013 2014*
FDI in Georgia (Million USD)
Manufactu
ring
14%
Energy
sector
8%
Constructi
on
23%
Transport
s and
communic
ations
27%
Real
Estate
7%
Financial
sector
6%
FDI BREAK-UP SECTOR WISE IN
2014
Manufact
uring
15%
Energy
sector
15%
Constructi
on
8% Transport
s and
communic
ations
20%
Real
Estate
11%
Financial
sector
10%
FDI BREAK-UP SECTOR WISE (8
YEAR AVERAGE)
Netherlands, 331
Azerbaijan, 302
China, 195
United Kingdom,
114
Luxembourg, 85
United States, 80
Turkey, 67 Russia, 66
FDI - COUNTRY WISE IN 2014 (In Million USD)
38
Source: National Statistics Office of Georgia
GEROGIA - COMPETITIVE ADVANTAGES
1. STRATEGIC LOCATION:
Georgia is situated at the strategically important crossroads where Europe meets
Asia and this Strategic Location which makes Georgia perfect for forming regional
hub for exporting products to regions (Caucasus, Central Asia and CIS countries).
2. COMPETITIVE INPUT COSTS:
Low Cost of Labor
Current Unemployment rate is around 14.6% which is considered to be very high
when compared to neighboring European countries. Average Monthly salary in
2014 was around 490 USD (Including Blue and white collar workers). High
unemployment rates and low cost of living have helped to keep the cost of labor
very low.
Low Energy Costs
Cost of Production of Electricity in Georgia is cheaper when compared to
neighboring countries as approximately 80% of the power is generated using
Hydro which is cheap among all the sources of power.
3. SOLID SOVEREIGN BALANCE SHEET:
Rating agencies rate Georgia as a stable economy and with government’s focus on
controlling operating expenses has resulted in reducing fiscal deficit.
4. EFFICIENT AND CORRUPTION FREE GOVERNMENT Georgia is considered one of the least corrupt countries in world and ranks high
in Global Corruption Barometer.
Netherlands, 163
United Kingdom, 93
Azerbaijan, 92
Turkey, 89
United Arab
Emirates, 88
United States, 69
FDI TOP COUNTRIES 8 YEAR AVERAGE (In Million USD)
39
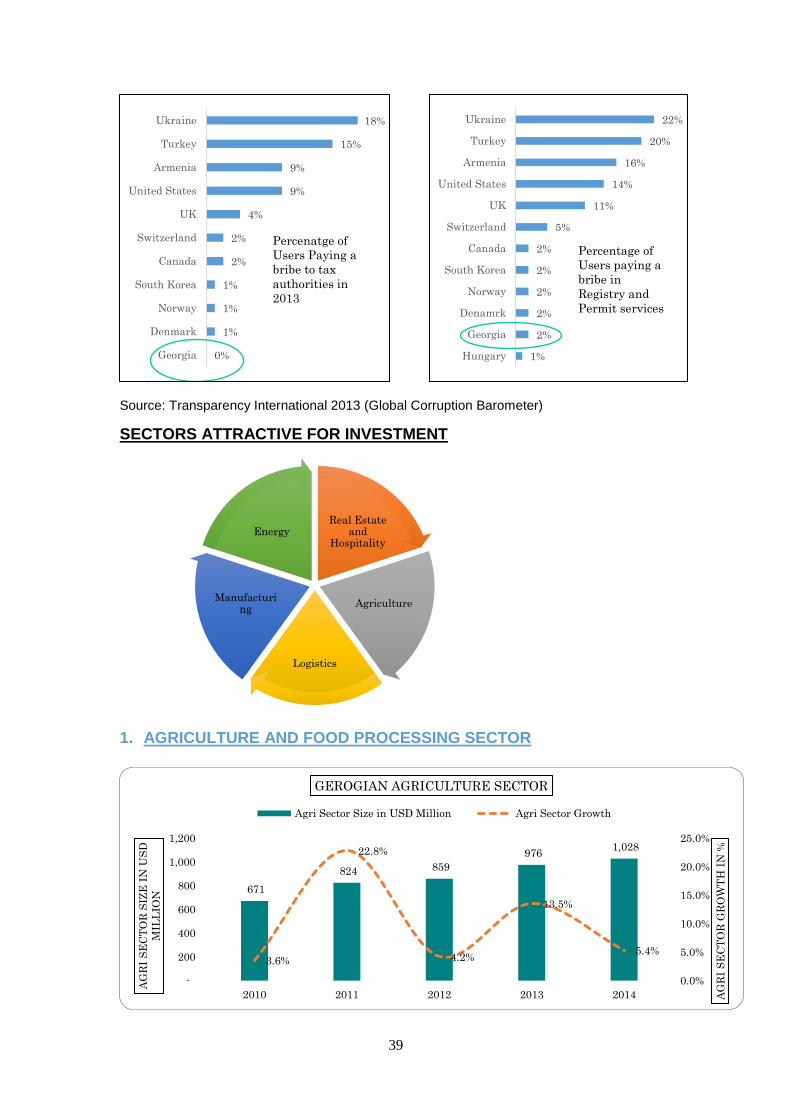
Source: Transparency International 2013 (Global Corruption Barometer)
SECTORS ATTRACTIVE FOR INVESTMENT
1. AGRICULTURE AND FOOD PROCESSING SECTOR
0%
1%
1%
1%
2%
2%
4%
9%
9%
15%
18%
Georgia
Denmark
Norway
South Korea
Canada
Switzerland
UK
United States
Armenia
Turkey
Ukraine
Percenatge of
Users Paying a
bribe to tax
authorities in
2013
1%
2%
2%
2%
2%
2%
5%
11%
14%
16%
20%
22%
Hungary
Georgia
Denamrk
Norway
South Korea
Canada
Switzerland
UK
United States
Armenia
Turkey
Ukraine
Percentage of
Users paying a
bribe in
Registry and
Permit services
Real Estate and
Hospitality
Agriculture
Logistics
Manufacturing
Energy
671
824 859
976 1,028
3.6%
22.8%
4.2%
13.5%
5.4%
0.0%
5.0%
10.0%
15.0%
20.0%
25.0%
-
200
400
600
800
1,000
1,200
2010 2011 2012 2013 2014 AG
RI
SE
CT
OR
GR
OW
TH
IN
%
AG
RI
SE
CT
OR
SIZ
E I
N U
SD
MIL
LIO
N
GEROGIAN AGRICULTURE SECTOR
Agri Sector Size in USD Million Agri Sector Growth
40
Source: National Statistics Office of Georgia
Source - Georgian National Investment Agency
Source - Georgian National Investment Agency
Sources: National Statistics Office of Georgia & Georgian National Investment Agency
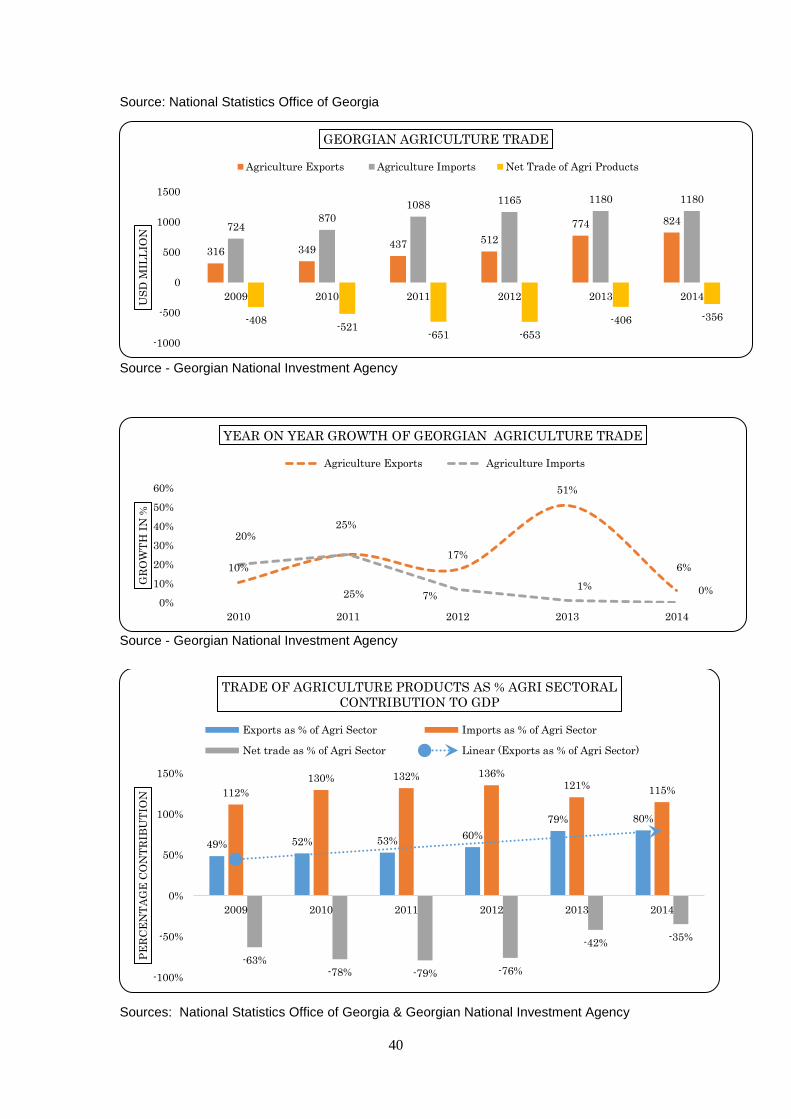
316 349 437 512
774 824 724
870
1088 1165 1180 1180
-408 -521
-651 -653
-406 -356
-1000
-500
0
500
1000
1500
2009 2010 2011 2012 2013 2014
US
D M
ILL
ION
GEORGIAN AGRICULTURE TRADE
Agriculture Exports Agriculture Imports Net Trade of Agri Products
10%
25%
17%
51%
6%
20%
25% 7% 1% 0%
0%
10%
20%
30%
40%
50%
60%
2010 2011 2012 2013 2014
GR
OW
TH
IN
%
YEAR ON YEAR GROWTH OF GEORGIAN AGRICULTURE TRADE
Agriculture Exports Agriculture Imports
49% 52% 53% 60%
79% 80%
112%
130% 132% 136% 121%
115%
-63% -78% -79% -76%
-42% -35%
-100%
-50%
0%
50%
100%
150%
2009 2010 2011 2012 2013 2014
PE
RC
EN
TA
GE
CO
NT
RIB
UT
ION
TRADE OF AGRICULTURE PRODUCTS AS % AGRI SECTORAL
CONTRIBUTION TO GDP
Exports as % of Agri Sector Imports as % of Agri Sector
Net trade as % of Agri Sector Linear (Exports as % of Agri Sector)
41
CHALLENGES:
Small and Marginal farmers –Lacking Economies of Scale
Traditional Methods of Agriculture – Need for modernization
Low Productivity
COMPETITIVE ADVANTAGES:
Growing Domestic demand for agricultural products
Increase in Per capita Income of citizens of Georgia has increased the standard
of living of the people and hence demanding for more agricultural products for
domestic consumption. Current demand is met by importing the Agricultural
products and government plans to substitute the imported products by producing
them in Georgia.
Favorable Climate for agriculture
Endowed with a rich natural abundance of fertile soil, clean water and favorable
climate, Georgia has traditionally produced a wide diversity of crops native to
temperate zones.
Availability of Agriculture land
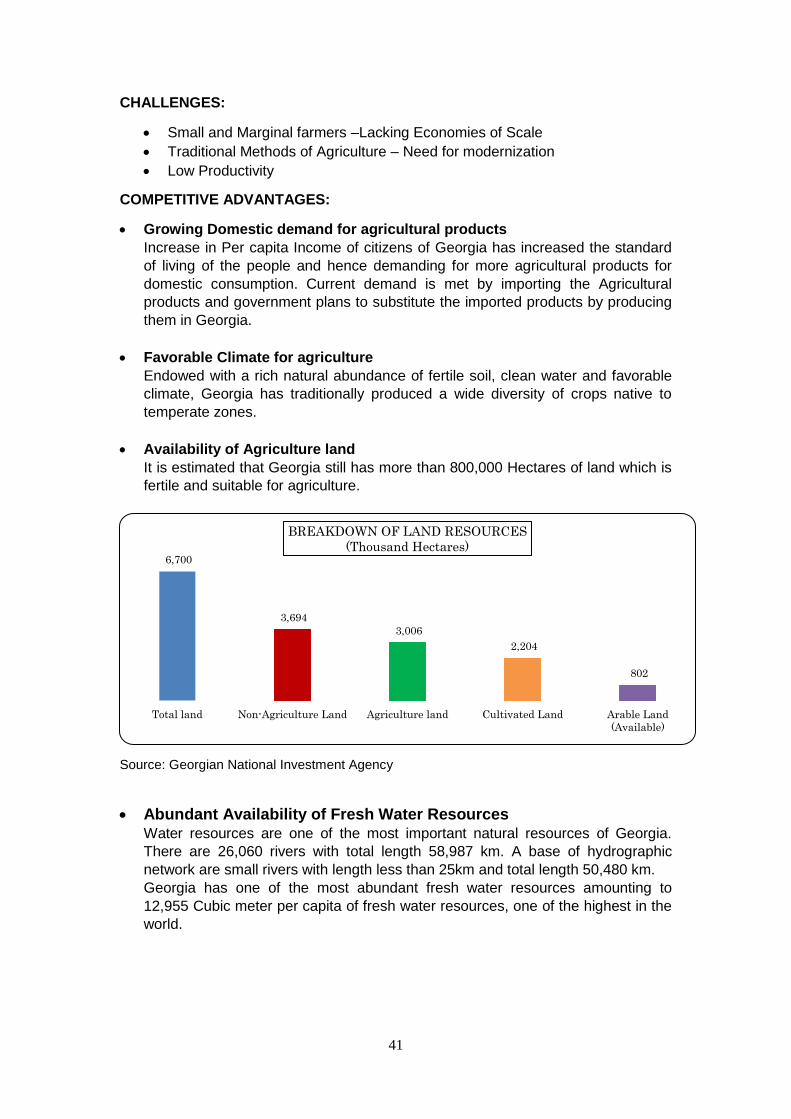
It is estimated that Georgia still has more than 800,000 Hectares of land which is
fertile and suitable for agriculture.
Source: Georgian National Investment Agency
Abundant Availability of Fresh Water Resources Water resources are one of the most important natural resources of Georgia.
There are 26,060 rivers with total length 58,987 km. A base of hydrographic
network are small rivers with length less than 25km and total length 50,480 km.
Georgia has one of the most abundant fresh water resources amounting to
12,955 Cubic meter per capita of fresh water resources, one of the highest in the
world.
6,700
3,694
3,006
2,204
802
Total land Non-Agriculture Land Agriculture land Cultivated Land Arable Land
(Available)
BREAKDOWN OF LAND RESOURCES
(Thousand Hectares)

42
Source: World Bank Database
OPPORTUNITIES:
1. Scope for Import Substitution:
Demand for Dairy Products & Meat is in increasing trend and most of the demand
is met by importing these Products. There is opportunity to invest in building
capacity which can cater to domestic market.
2. Opportunity to Mechanization of agriculture:
Most of the farmers still use traditional methods of agriculture due to which
productivity levels are very low. Investment can be made in supply of machinery
and farm equipment for sale or rent, quality fertilizers and high yielding seeds.
3. Export Opportunities – Wine & Spirits, Mineral Water:
In 2014, export of Wine and Spirits reached 183 Million USD and 95 Million USD.
With wide variety of grapes available and growing demand for Georgian wine across
the world offers a great potential for Investment.
Mineral Water from Georgia is famous for its high quality and taste and the exports
for fresh and mineral water reached 137 million USD in 2014. Government is still
open for licensing of springs and well known Georgian brands offer both green field
and brown field opportunities to Investors.
4. Food Processing Plants, Storage and distribution Infrastructure
Recently International food producer brands have set up their processing facilities
in Georgia. Imports of process food such as juices, tomato pastes and canned
vegetables was around 41 Million USD and exports just reached 18.3 Million
USD. Though Georgia is rich in Fruits and vegetables but lack in Infrastructure
which supports storage, distribution and processing of food and Beverages.
30,056
12,955
8,914
3,029 2,304 2,262 606
7,889
2,967
Russian
Federation
Georgia United
States
Turkey Armenia United
Kingdom
Hungary Europe &
Central
Asia
European
Union
CU
BIC
ME
TE
RS
RENEWABLE INTERNAL FRESHWATER RESOURCES PER CAPITA
43
2. ENERGY SECTOR:
Georgia has a developed, stable and reliable energy sector. The most promising
source of additional energy generation is hydropower and the Government is focused
on securing private investments for construction of new hydropower stations.
Currently, only 12 % of Georgia’s hydropower potential is being utilized.
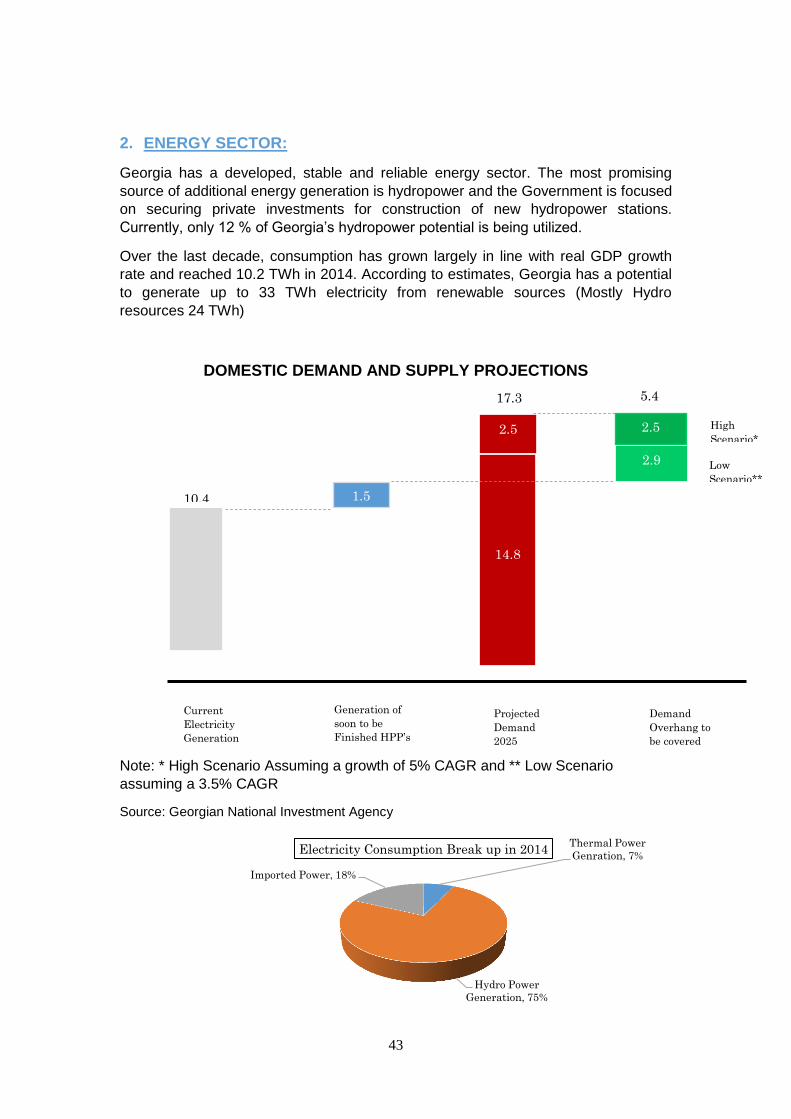
Over the last decade, consumption has grown largely in line with real GDP growth
rate and reached 10.2 TWh in 2014. According to estimates, Georgia has a potential
to generate up to 33 TWh electricity from renewable sources (Mostly Hydro
resources 24 TWh)
DOMESTIC DEMAND AND SUPPLY PROJECTIONS
Note: * High Scenario Assuming a growth of 5% CAGR and ** Low Scenario
assuming a 3.5% CAGR
Source: Georgian National Investment Agency
Thermal Power
Genration, 7%
Hydro Power
Generation, 75%
Imported Power, 18%
Electricity Consumption Break up in 2014
1.5
14.8
2.5 2.5
2.9
10.4
17.3 5.4
Current
Electricity
Generation
Generation of
soon to be
Finished HPP’s
Projected
Demand
2025
Demand
Overhang to
be covered
High
Scenario*
Low
Scenario**
44
Source: Georgian National Investment Agency
Demand Drivers
Domestic Demand is growing and estimated electricity deficit by 2025 is more
than 5 TWh
Export Opportunities to neighboring countries like Turkey, Russia, Armenia and
Azerbaijan
Competitive advantages
Government of Georgia can offer Power purchase agreement up to 100% of total
generation
860 MW Transmission lines available to Turkey and Russia and no export Tariff
set and are exempted from Value added Taxes
600 Million Euros to be invested to upgrade transmission and grid Infrastructure
by 2018-22
Georgia is surrounded by countries which have power deficit like Turkey and
Russia or countries which have high power generation costs (Armenia and
Azerbaijan)
Investment Opportunities
There are over 90 potential small and medium sized (Less than 100 MW) and 6 big
HPP projects on the Pre-feasibility study level with Financial and Technical Projection
Success Stories
Note: HPP stands for Hydro Power Projec
3. MANUFACTURING SECTOR:
Georgia has a location advantage as a gateway between the Europe and Asia which
provides benefit to the manufacturers. Apart from location advantage Georgia offers
competitive labor and low energy costs which will help manufacturers to produce
goods at reasonably low cost. Well connected logistics with neighboring countries
accompanied by numerous preferential/free trade agreements can help companies to
set up their regional manufacturing and distribution centers
15 HPP Projects -
Under Constrution
, 544
15 HPP Projects -
Awaiting Permits,
1350
36 HPP Projects -
Feasibility Studies,
600
Sucess Stories - Capacity in MW
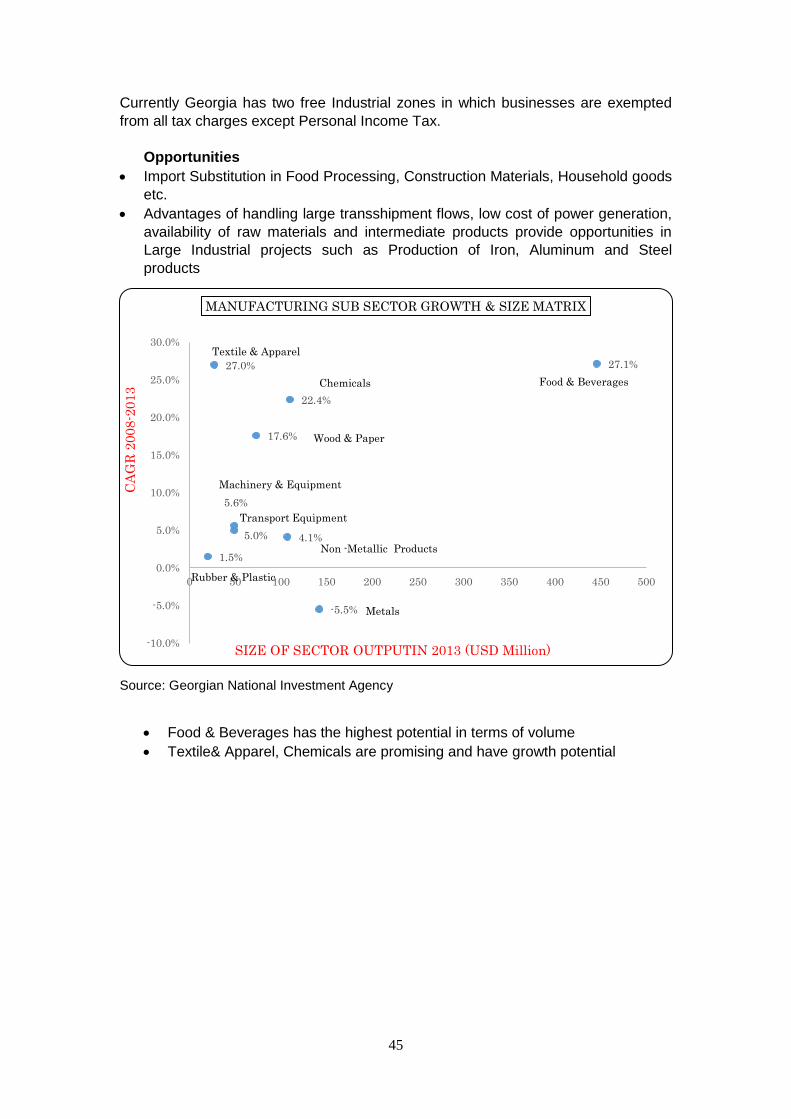
45
Currently Georgia has two free Industrial zones in which businesses are exempted
from all tax charges except Personal Income Tax.
Opportunities
Import Substitution in Food Processing, Construction Materials, Household goods
etc.
Advantages of handling large transshipment flows, low cost of power generation,
availability of raw materials and intermediate products provide opportunities in
Large Industrial projects such as Production of Iron, Aluminum and Steel
products
Source: Georgian National Investment Agency
Food & Beverages has the highest potential in terms of volume
Textile& Apparel, Chemicals are promising and have growth potential
27.0%
1.5%
5.0%
5.6%
17.6%
22.4%
4.1%
-5.5%
27.1%
-10.0%
-5.0%
0.0%
5.0%
10.0%
15.0%
20.0%
25.0%
30.0%
0 50 100 150 200 250 300 350 400 450 500
CA
GR
2008-2
013
SIZE OF SECTOR OUTPUTIN 2013 (USD Million)
MANUFACTURING SUB SECTOR GROWTH & SIZE MATRIX
Textile & Apparel
Chemicals
Wood & Paper
Machinery & Equipment
Transport Equipment
Non -Metallic Products
Food & Beverages
Rubber & Plastic
Metals
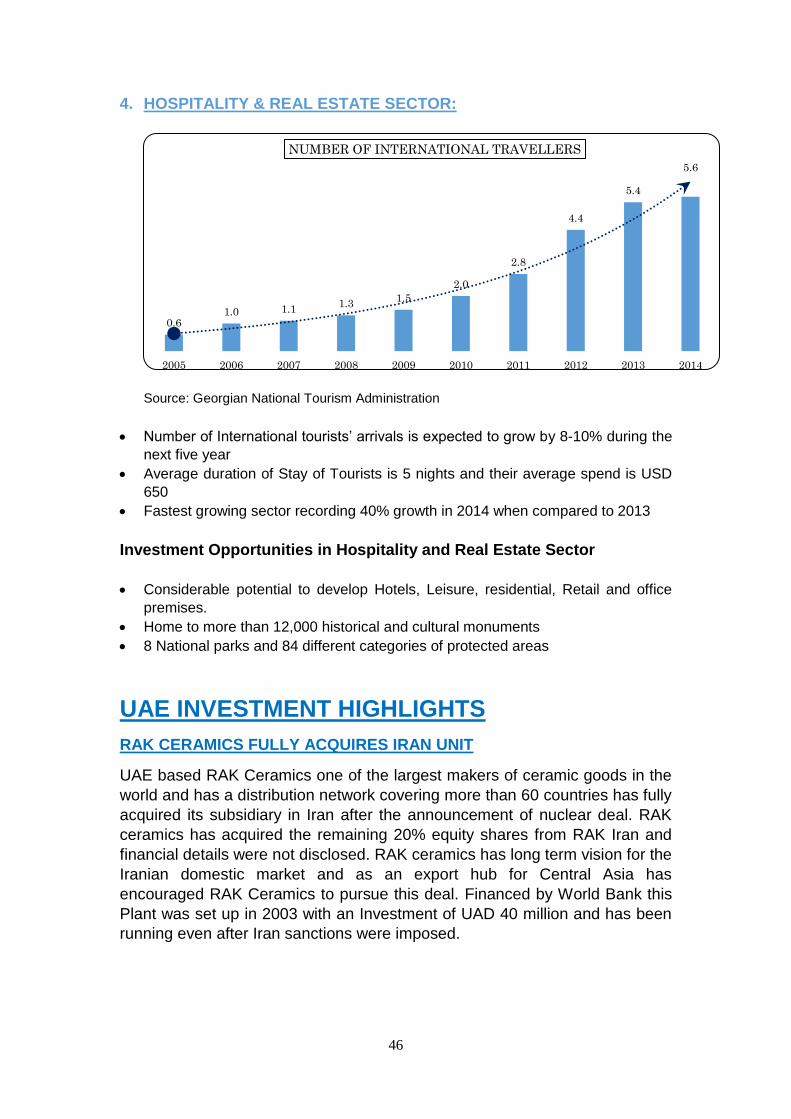
46
4. HOSPITALITY & REAL ESTATE SECTOR:
Source: Georgian National Tourism Administration
Number of International tourists’ arrivals is expected to grow by 8-10% during the
next five year
Average duration of Stay of Tourists is 5 nights and their average spend is USD
650
Fastest growing sector recording 40% growth in 2014 when compared to 2013
Investment Opportunities in Hospitality and Real Estate Sector
Considerable potential to develop Hotels, Leisure, residential, Retail and office
premises.
Home to more than 12,000 historical and cultural monuments
8 National parks and 84 different categories of protected areas
UAE INVESTMENT HIGHLIGHTS
RAK CERAMICS FULLY ACQUIRES IRAN UNIT
UAE based RAK Ceramics one of the largest makers of ceramic goods in the
world and has a distribution network covering more than 60 countries has fully
acquired its subsidiary in Iran after the announcement of nuclear deal. RAK
ceramics has acquired the remaining 20% equity shares from RAK Iran and
financial details were not disclosed. RAK ceramics has long term vision for the
Iranian domestic market and as an export hub for Central Asia has
encouraged RAK Ceramics to pursue this deal. Financed by World Bank this
Plant was set up in 2003 with an Investment of UAD 40 million and has been
running even after Iran sanctions were imposed.
0.6 1.0 1.1
1.3 1.5
2.0
2.8
4.4
5.4
5.6
2005 2006 2007 2008 2009 2010 2011 2012 2013 2014
NUMBER OF INTERNATIONAL TRAVELLERS
47
DUBAI INVESTMENT PARKS ATTRACTED 436 NEW COMPANIES IN
FIRST FIVE MONTHS 2015
Dubai Investments Park (DIP) has attracted 436 new companies in the first
five months of 2015, taking the total number of companies within the 2,300-
hectare development to nearly 4,500.
During the period, the new companies leased warehouses, distribution
centers, office spaces and light industrial units across a total area of 580,000
square feet. The sub-tenants include well-known brands such as Splash Gulf,
Majan Food Industries, Galaxy Metal Industries, Four Zone Décor, Royal
Cosmetics and 4 Corner General Trading
Also DIP plans to build eight new Hotels and Serviced Apartments Projects
over next five years within DIP in order to cater demand that will be generated
by Expo 2020.
OMAN AND BRUNEI SOVERIEGN FUNDS JOINTLY ESTABLISH AN
AIRCRAFT LEASING COMPANY
Sovereign wealth funds from Oman and Brunei are partnering to establish an
aircraft leasing firm with capital of USD 520Million. Oman's State General
Reserve Fund (SGRF) is setting up the firm with Oman Brunei Investment Co
(OBIC), which is itself a 50-50 venture between SGRF and the Brunei
Investment Agency. The new venture, Oman Brunei Aviation Leasing Co
(OBALC), will invest in and manage the purchase and lease of commercial
aircraft operated by airlines in the Middle East and globally.