2013 adestra subject line analysis report - the studio...
TRANSCRIPT

2013 Adestra Subject Line Analysis ReportKeywords for killer subject lines
Report
For email marketing that delivers results: +44 (0)1865 242425 www.adestra.com [email protected]
Alert Free deliveryDaily / % o�
Early birdMonthly
Today / Cheap

For email marketing that delivers results: +44 (0)1865 242425 www.adestra.com [email protected]
Your subject line is the key to success for your email campaigns. However, how much time do you spend developing your subject line strategy? If you’re like 9/10 marketers, then the answer is “not enough!”
Undoubtedly, you spend hours constructing great email campaigns – working on the template layout, writing effective copy, and ensuring it looks good on all the major email clients. But many marketers will do all this work and then pick a subject line as the last step, clearly forgetting that if your subject line isn’t good then no one will see all of your hard work!
In the last couple of years, the way consumers interact with email has changed drastically. Much like the broader web, email is now all about usability. Your subject line is one of the main things within your control to influence your customers' behaviour. Having an ineffective, confusing or ambiguous subject line delivers a poor user experience for their online journey.
Conversely, a subject line that is strong, effective and usable drives short and long term response rates. Further, don’t forget that more emails are being sent out than ever before. With all the clutter in the world these days, making your email stand out is more difficult than ever. In this report, you will discover the trends of subject lines from over 2.2 billion emails. These trends cover the keywords and phrases that recipients respond to better than most… and also, which ones are over-used and ineffective for your sector.
INTRODUCTION
Trends of subject lines in over
2.2bn emails
Parry Malm Account Director, Adestra
22013 Adestra Subject Line Analysis Report

For email marketing that delivers results: +44 (0)1865 242425 www.adestra.com [email protected]
2013 Adestra Subject Line Analysis Report 3
CONTENTS
Methodology 4
How do the results work? 5
What is your subject line strategy? 6
A note on split testing 7
Overall results 8
B2B Publishing 9
B2C Publishing 11
B2B Events 13
B2C Events 15
Retail and ecommerce 17
Charities 19
Appendix 21
- About the author 22
- Overall results 23
- B2B Publishing 25
- B2C Publishing 27
- B2B Events 29
- B2C Events 31
- Retail and ecommerce 33
- Charities 35

For email marketing that delivers results: +44 (0)1865 242425 www.adestra.com [email protected]
2013 Adestra Subject Line Analysis Report 4
METHODOLOGYTo generate the statistics in this report, we took a random sample of over 90,000 email campaigns, each with a list size of minimum 5000, for a total of over 2 billion emails.
Why have we ignored tiny campaigns? Smaller campaigns have a higher propensity to be statistical outliers, therefore skewing the results. By controlling for these, the overall results are more robust, and consequently more useful for your marketing decision making.
Actionable results for your industryOverall results are interesting, but what you really want to know is how you can improve your subject lines for your recipients in your industry.
To make the results more actionable, we’ve split the report into 6 key industry areas:
• B2B publishing
• B2C publishing
• B2B events
• B2C events
• Retail & ecommerce
• Charities and Not for Profit
We looked at which words and phrases were the most popular by sector, and then categorised them by objective. This gives you solid statistics by keyword for what works and what doesn’t, and will give you some great ideas on how to improve your results.
How to use this reportFor each industry, you will find a list of common keywords, and what their effect are on the response rates of the email, including:
• Open rate
• Click rate
• Click to open ratio
• Unsubscribe rate
Which keywords did we test?There were simply too many keywords to talk about! Therefore, we’ve highlighted key findings for you in the main report, but as we don’t want you to miss out, you’ll find a full list of tested keywords and phrases per sector in the appendix.

For email marketing that delivers results: +44 (0)1865 242425 www.adestra.com [email protected]
2013 Adestra Subject Line Analysis Report 5
HOW DO THE RESULTS WORK?For each keyword, you will see the average deviation from the mean for campaigns with subject lines including that keyword.
To illustrate: If the industry average open rate is 20%, and the word “Foo” shows 12% higher opens, that means that inclusion of the word “Foo” in a subject line delivered a 22.4% open rate (so, a 12% increase on 20%.)
Just a quick note of caution: your lists may respond differently to the long-run averages in the following pages. However, at the very least this report will give you some ideas on what you should be testing on a campaign-by-campaign basis, and will help you develop a robust and profitable subject line strategy. Individual campaign results will vacillate wildly from excellent to awful and all points in between; the key is to focus on a long-term subject line strategy and this report is your how-to-guide.
To help you to make probabilistically-driven choices for your subject lines, we've also included the Median, 1st and 3rd quartile points in the tables in the appendix. This will give you a broader picture of the entire data spread, and whether any outliers are affecting the average.
To illustrate, if:
20% is the industry average open rate And the word “Foo” shows 12% higher opens, that means that inclusion of the word “Foo” in a subject line delivered a 22.4% open rate (so, a 12% lift on 20%).
22.4% open rate delivered by “Foo”

For email marketing that delivers results: +44 (0)1865 242425 www.adestra.com [email protected]
2013 Adestra Subject Line Analysis Report 6
WHAT IS YOUR SUBJECT LINE STRATEGY?Not all of your emails will get opened all the time. Even market leaders routinely have less than half of their emails opened on a campaign-by-campaign basis.
Your email campaign is not solely defined by opens and clicks! Your subject line is prominent in your customers’ inboxes whether or not your emails are opened.
In the example above check out the inbox. Not all of these campaigns have been opened and yet, they are all delivering key brand and product information. Therefore, you need to think about your subject lines as a series of branding tools over a period of time, not just one-offs to drive short term response.
When planning your email marketing campaigns, make sure you have a defined subject line strategy in mind. For example:
• Are you a content producer looking to position yourself as a source of hot news? Feature snippets of your top stories.
• Are you a publisher soliciting free trials? Let your prospects know how, for no risk, they can benefit from your product.
• Are you putting on a large exhibition in a competitive marketplace? Shout about what makes your show different from all the others.
• Are you a charity soliciting donations? Focus on the outcomes of your endeavours and how your donators will be helping.
• Are you a retailer competing on price? Feature both percentage and monetary discounts for popular product ranges.
There is a multitude of ways to promote your key goal in your subject line. Taking the exhibition example above, let’s imagine that their stand sales team have brought on numerous new exhibitors. On the right are a few subject lines all driving to the same end, but stated differently.
By no means should you always use the same subject line – that would be a wasted opportunity – but by adhering to a central subject line strategy you are simultaneously building your brand and driving response.
To:
Cc:
Subject: SHOWNAME now has 50 more exhibitors than last year! Register now to meet them.
Subject: SHOWNAME
now has 50 more exhibitors than last year! Register now
to meet them.
To:
Cc:
Subject: SHOWNAME now has 50 more exhibitors than last year! Register now to meet them.
Subject: Don’t miss
SHOWNAME – meet 25% more
exhibitors than 2012’s edition
To:
Cc:
Subject: SHOWNAME now has 50 more exhibitors than last year! Register now to meet them.
Subject: Registration is now
open for SHOWNAME. Source innovative
vendors – including 50 new exhibitors
for 2013
Example subject line strategy

For email marketing that delivers results: +44 (0)1865 242425 www.adestra.com [email protected]
2013 Adestra Subject Line Analysis Report 7
A NOTE ON SPLIT TESTINGIf you aren’t split testing your subject line, start now. BUT, if you are split testing follow this cardinal rule:
Be creative but don’t be crazyWhat does this mean? Being creative is great – this report will help you generate lots of ideas for words and phrases to test. But don’t be crazy and try things for a short term gain. If you used the subject line “Free Beer!” then guess what? You’ll get a huge amount of opens. But unless the contents of the email actually pour your customers a beer, then you’ll have achieved nothing but short term response gain and long term brand harm. Other examples could be using Re: or Fw: at the beginning of your subject lines. They might get opened the first time, but you'll get ignored the next time. The results below speak for themselves.
Therefore, when you split test, ensure that all your splits, be it a simple A/B or all the way to Z, adhere to your overarching subject line strategy.
And, don’t assume what worked last time will work this time. Things change in marketing campaigns, much of which is outside of your control. The only solid testing strategy is to constantly test.
The real enemies of testing are assumptions and biases based upon past experience. What may have worked last week can stop tomorrow, and what failed epically last year may make you a million this year. That’s why you need to test, test, and test again. And again. And for good measure, do it again.
FREE BEER!
100%
80%
60%
40%
20%
0%
-20%
-40%
-60%
-3.70%Open Rate
Variance vs. Average
“Re:”
Unsub Rate Variance vs
Average
300%
250%
200%
150%
100%
50%
0%
-50%
-100%
-14.30%Open Rate
Variance vs. Average
“Fw:”
-47.50%Click Rate
Variance vs Average
Unsub Rate Variance vs
Average
277.7%42.60%
-42.60%Click Rate
Variance vs Average
Free beer can mean a high open rate but long term brand harm

For email marketing that delivers results: +44 (0)1865 242425 www.adestra.com [email protected]
2013 Adestra Subject Line Analysis Report 8
OVERALL RESULTSOverall usage patterns of email have drastically changed in the last few years, and this is strongly evidenced in how people interact with email as a communications channel.
In 2005 newsletters were standard – sending out that week’s latest news. But since then, numerous popular content aggregators (like Google News, Reddit, etc.) have taken over that space. Why bother to sign up for a newsletter when you can get a simple alert from a free web service?
For example, the word “Newsletter” shows a marginal effect on open rates (+0.7%), but a strong negative effect on click rates (-18.7%.) This should be of no surprise – the word “newsletter” harks back to the day of receiving a posted and photocopied A4 list of stories. But don’t fret – there is still an extremely valuable opportunity to provide unique content via email.
Take the word “Alert,” which shows +38.1% opens and +61.8% clicks. Why is this? The word “alert” connotes activity – something that is happening now – and incites a sense of urgency in readers. It gives the impression that the
news is breaking, that it is cutting edge, that it can’t be missed. We see the same with the word “Bulletin” (+15.8%, +12.7%).
On this point, it looks as though one of the big trends this year, Content Marketing, has over-saturated customers, both B2B and B2C, with too much information. For example, “Report” (-23.7%, -54.8%,) “Learn” (-35.5%, -60.8%,) and “Book” (-4.6%, -25.4%) are trending down. When working on your content marketing plan, bear in mind that everyone else is too. Focus on differentiating your offerings.
There is also a strong logic in creating an expectation to receive scheduled messages. Communications that are sent out “Daily” (+27.8%, +100.3%) and “Weekly” (+27.1%, +50.6%) perform strongly. This is because your customers begin to expect your emails on a frequent basis, and get into the habit of reading them.
At the other end of the spectrum, “Monthly” (-26.6%, -37.0%) is probably too infrequent, and you’re losing the top-of-mind position for which you are striving.
The statistics also show something ground-breaking: people love to save money! And, everyone loves getting a good deal. For example, simple things like offering “Free Delivery” (+50.7%, +135.4%) seem to work a treat. Or, specifying a percentage off in the subject line (+10.5%, +27.4%).
“The main thing about email is that it is trending towards usability. Having a “Sale” (+23.2%, +60.7%)? Say so! Got something “New” (+17.2%, +38.2%) to talk about?Talk about it! Just uploaded a new “Video” (+18.5%, +64.8%)? Promote it!”
Parry Malm, Adestra
1 In related news, water is wet.

For email marketing that delivers results: +44 (0)1865 242425 www.adestra.com [email protected]
2013 Adestra Subject Line Analysis Report 9
OVERALL RESULTSKeyword table
Objective KeywordOpen rate
variance vs. average
Click rate variance vs.
average
Click to open rate
variance vs. average
Unsubscribe rate variance vs.
average
Benefits Exclusive 12.3% -0.3% -11.2% 22.0%
Free -3.0% -6.3% -3.3% -1.3%
Free delivery 50.7% 135.4% 56.3% 82.4%
Gift 12.4% -11.3% -21.1% 21.2%
Latest 8.3% 11.7% 3.1% -9.9%
New 17.2% 38.2% 17.9% -2.6%
Offer 7.3% -18.6% -24.1% 22.3%
Only -4.1% -37.3% -34.7% 11.9%
Sale 23.2% 60.7% 30.5% 31.6%
Save 3.4% -25.2% -27.7% 18.1%
Voucher 20.0% -2.4% -18.7% 60.6%
Content Alert 38.1% 61.8% 17.2% -63.2%
Bulletin 15.8% 12.7% -2.6% -22.9%
Issue 10.8% 10.4% -0.4% 29.6%
Learn -35.5% -60.8% -39.2% -23.9%
News 34.8% 47.7% 9.6% -26.0%
Newsletter 0.7% -18.7% -19.2% 2.9%
Report -23.7% -54.8% -40.8% -54.6%
Today -15.9% -37.9% -26.1% 5.2%
Video 18.5% 64.8% 39.0% -26.0%
Webinar -16.6% -70.7% -64.8% 8.8%
Win 1.8% 26.7% 24.4% -2.9%
Date Daily 27.8% 100.3% 56.7% -75.0%
Monthly -26.6% -37.0% -14.2% 13.8%
Weekly 27.1% 50.6% 18.5% -49.8%
Call to action Download 1.4% -6.1% -7.4% -28.2%
Get -8.6% -16.1% -8.2% 2.5%
Register -9.6% -54.9% -50.1% 27.7%
Subscription 5.0% -19.1% -23.0% 89.3%
Urgency Don't miss -8.8% -42.9% -37.3% 33.2%
Misc iPad 31.6% 19.9% -9.0% 19.1%
Re: -3.7% -42.6% -40.4% 90.8%
Fw: -14.3% -47.5% -62.8% 135.4%

For email marketing that delivers results: +44 (0)1865 242425 www.adestra.com [email protected]
2013 Adestra Subject Line Analysis Report 10
Readers don’t need your newsletter to provide what they probably already get elsewhere. That is, unless your offering is targeted to them and provides a unique slant on things.
What people do want is to know about news as soon as it breaks – like the old time hacks called it on Fleet Street, your subject lines need to shout “Extra extra, read all about it!” Words like “Alert” and “Breaking” show extremely positive response. Especially in B2B publishing, where in this day and age we’re all increasingly time-poor, get right to the point and make sure your content really is special.
The age of content marketing has desensitised people to things like “reports”, “forecasts” and “intelligence.” As with most trends, everyone has jumped aboard the content marketing train, with mixed results. If the content you are marketing is of low quality, then, low and behold, you’ll get poor results. In all this clutter, the old adage “content is king” is more true than ever. Go buy your editor a beer and cosy up to them, as it’s his or her inside knowledge of popular well-crafted content that will get you more eyeshare.
Importantly, focus on how you frame subscription renewal emails. The evidence shows that being straight to the point works best here. As it’s effectively a basic transactional email, simply stating what needs to be done – “Renew now for £100” or the like – seems to perform more strongly than beating around the bush. However as with everything, make sure you test your message on a regular and strategic basis.
B2B PUBLISHINGNews, simply put, is no longer newsworthy. If people want to get aggregated news stories, they can access this easily via RSS, or even a Google News alert.
36%
35.5%
35%
34.5%
34%
33.5%
33%
32.5%
32%
0%
-10%
-20%
-30%
-40%
-50%
-60%
-70%
-80%
Alert ReportClick Rate
Variance vs Average
35.7%
-64.10%
Click Rate Variance vs
Average
Open Rate Variance vs.
Average
32.9%
-30.6% Open Rate
Variance vs. Average

For email marketing that delivers results: +44 (0)1865 242425 www.adestra.com [email protected]
2013 Adestra Subject Line Analysis Report 11
B2B PUBLISHINGKeyword table
Objective KeywordOpen rate
variance vs. average
Click rate variance vs.
average
Click to open rate
variance vs. average
Unsubscribe rate variance vs. average
Content *|*|* 2 27.5% 90.7% 14.2% -8.0%
Alert 32.9% 35.7% 2.1% -45.5%
Breaking 35.4% 77.6% 31.2% -65.8%
Editor 28.7% 68.3% 30.7% -15.5%
Forecast -34.0% -68.3% -51.9% -37.9%
Issue 6.9% -4.8% -11.0% 69.1%
Latest -2.0% -8.7% -6.8% 17.1%
News 20.5% 13.9% -5.4% -20.0%
Newsletter -11.2% -52.6% -46.7% 48.5%
Report -30.6% -64.1% -48.3% -43.7%
Top stories -11.2% -30.5% -21.7% -0.3%
Update 26.8% 8.9% -14.1% -5.7%
Date This week -18.5% -28.6% -12.3% 5.6%
Daily 12.6% 35.8% 20.7% -51.2%
Weekly 27.5% 24.7% -2.2% -26.5%
Monthly -6.4% -19.1% -13.6% 134.6%
Subscriptions £ 21.9% 80.5% 48.2% -19.3%
Access 2.9% -7.3% -9.9% 80.6%
Free 3.0% -8.4% -11.1% 64.9%
Renew 0.6% 22.6% -21.9% 175.6%
Subscription -8.2% -22.7% -15.8% 266.7%
Trial 8.8% -6.6% -14.1% 13.8%
“Alert” and “Breaking” boost
your open and click through
rates.
The old adage “content is king” is more true than
ever, but you need to demonstrate
the benefits.
2 This refers to a subject line that has multiple stories delineated by pipes. For example, “Headline 1 | Headline 2 | Headline 3”

For email marketing that delivers results: +44 (0)1865 242425 www.adestra.com [email protected]
2013 Adestra Subject Line Analysis Report 12
This is evidenced quite strongly! “Review”, “Update” and “Special” all test well. But there’s more: users devour “video” content. Package up your content as something special, something they can’t find elsewhere, and shout about it in your subject lines.
Dealing with money, however, is more of a slippery slope. Consumers have gotten to know your brands as content providers, and the big challenge is effectively monetising it. Try to mix up the subject lines – soft sell for a couple weeks, then go in for the kill with a hard sell. If you don’t ask for the money you’ll never get it, but if you always ask for it you’ll have angry customers!
A quick and easy way to build your lists is contests, something used by publishers around the world. However, make sure the contest is marketed effectively and that you don’t do it too often! Open rates on contest emails are trending downwards but clicks are going up, such as “Win” (-2.3%, +18.3%). Think about how you can segment your data better. Can you create a “contest” list and focus on it, thus not bugging pure content-seekers with one-offs?
B2C PUBLISHING B2C publishers are facing a revolution in the way they deliver content to their customers, and it shows – people are no longer after repurposed web content. What they want are things unique to the specific market you specialise in.
160%
140%
120%
100%
80%
60%
40%
20%
0%
0%
-5%
-20%
-15%
-20%
-25%
-30%
-35%
-40%
Video “?”
Click Rate Variance vs
Average
96.6%-22.20%
Click Rate Variance vs
Average
Open Rate Variance vs
Average
27.6%
-16.9%
Open Rate Variance vs
Average

For email marketing that delivers results: +44 (0)1865 242425 www.adestra.com [email protected]
2013 Adestra Subject Line Analysis Report 13
B2C PUBLISHING Keyword table
Objective KeywordOpen rate
variance vs. average
Click rate variance vs.
average
Click to open rate
variance vs. average
Unsubscribe rate variance vs. average
Content ? -16.9% -22.2% -6.4% -1.1%
*|*|* 3 7.2% 32.4% 23.5% -40.8%
*,*,* 4 17.8% 67.0% 41.7% -52.4%
Exclusive 11.3% -1.2% -11.2% 3.7%
Newsletter 6.4% 16.5% 9.5% 3.8%
Review 37.1% 152.3% 84.0% -66.5%
Special 12.2% -12.1% -21.7% 82.7%
Update 29.0% 6.7% -17.3% 141.2%
Video 27.6% 96.6% 54.1% -39.8%
Win -2.3% 18.3% 21.1% -5.8%
Date Daily 35.1% 115.0% 59.2% -99.2%
Weekly -1.1% 2.7% 3.8% -48.8%
Monthly -4.9% -24.6% -20.7% -9.8%
Money % off -3.6% -21.7% -18.7% -9.2%
£ -19.7% -37.7% -22.3% 9.9%
Discount -38.8% -59.2% -33.4% 2.4%
Free -10.3% -23.4% -14.7% -35.9%
Half price 9.7% -44.1% -49.1% 51.2%
Subscriptions Last chance -16.5% -50.6% -40.8% 24.1%
Limited 23.7% 16.4% -5.9% -4.6%
On sale now -2.8% 0.9% 3.8% -15.6%
Subscription -5.3% -47.8% -44.8% 68.1%
Trial -45.6% -74.6% -53.3% -8.7%
Miscellaneous Deals 7.3% -12.3% -18.3% 53.6%
Facebook -6.7% 15.2% 23.4% -58.9%
iPad 37.3% 19.4% -13.1% 16.9%
Twitter 12.2% 18.1% 5.3% -52.1%
Promoting videos in your
subject lines will drive your results
skyward.
Asking questions
has a negative impact on your
results.
3 This refers to a subject line that has multiple stories delineated by pipes. For example, “Headline 1 | Headline 2 | Headline 3”
4 This refers to a subject line that has multiple stories delineated by commas. For example, “Headline 1, Headline 3”

For email marketing that delivers results: +44 (0)1865 242425 www.adestra.com [email protected]
2013 Adestra Subject Line Analysis Report 14
In any industry sector, there are usually 2-3 market leading events, and then a litany of smaller events trying to chip away at the giants’ market share. If you’re one of the market leaders, focus on your brand. You’ll have a long list of previous attendees – let them know what’s new this year. Have you signed a number of new exhibitors? Will there be product announcements on-site? Let them know that you are the market leader for a reason – and make this clear as day in your subject lines.
If you’re a new entrant or an underdog event, focus on how your event is trendier, nimbler, or smarter than the market leaders. Re-purpose content from previous years
(i.e. speaker presentations, videos, reports etc.) and use that to generate leads. You’ll not be able to beat the big boys on brand, but you will be able to beat them on your unique content or other benefits.. Shout about this!
And don’t shy away from using transactional-style messages as a thinly veiled opportunity. Words like “Badge,” “Download,” and “Invitation” all test well. Used correctly as part of your marcomms plan you can generate massive response off the back of it. But don’t over-use it; keep it as your secret weapon to be rolled out once or twice in the event cycle, right during your prime visitor-acquisition period.
B2B EVENTSIf you’re reading this, then you know how tough it is to differentiate your events from everyone else’s. It seems like these days there is a conference, training course or exhibition about every possible topic under the sun!
0%
-1%
-2%
-3%
-4%
-5%
-6%
-7%
-8%
40%
35%
30%
25%
20%
15%
10%
5%
0%
Conference Don’t miss
-7.4%
Click Rate Variance vs Average
40%Click Rate
Variance vs Average
-1.4%
Open Rate Variance vs
Average
Open Rate Variance vs
Average
6.3%

For email marketing that delivers results: +44 (0)1865 242425 www.adestra.com [email protected]
2013 Adestra Subject Line Analysis Report 15
B2B EVENTSKeyword table
Objective KeywordOpen rate
variance vs. average
Click rate variance vs.
average
Click to open rate
variance vs. average
Unsubscribe rate variance vs. average
Product Conference -1.4% -7.4% -6.1% 0.2%
Exhibition -8.2% -1.4% 7.5% 9.6%
Forum -11.6% -49.9% -43.3% -22.1%
Training -10.1% -21.9% -13.1% -24.8%
Webinar -3.1% -28.3% -26.0% -19.2%
Discounts Discount -10.9% -37.1% -29.3% -18.0%
Early bird -4.7% -40.5% -37.5% -6.4%
Free -3.0% 3.7% 6.9% 35.7%
Offer -13.1% -30.8% -20.3% 6.4%
Urgency Don't miss 6.3% 40.0% 31.7% 9.4%
Last chance -10.1% -43.0% -36.6% -26.4%
To go -0.6% -19.0% -18.4% -12.2%
Features Agenda -2.9% -21.0% -18.6% -6.8%
Brochure -0.4% 9.7% 10.2% -26.2%
Industry -4.7% -11.4% -7.0% -0.3%
Keynote -15.3% -40.9% -30.2% 5.8%
Speakers -1.4% -36.8% -35.9% 17.2%
Benefits Exclusive 1.5% 6.6% 5.0% 0.1%
Innovation 15.0% -5.0% -17.4% 58.2%
Learn -18.8% -31.1% -15.1% 6.2%
ROI 9.3% 42.7% 30.5% -29.9%
Call to action Badge 15.6% 67.5% 44.9% 63.3%
Download 10.0% 77.4% 61.3% -31.3%
Invitation 18.1% 37.9% 16.8% 41.8%
Registration 9.2% 48.1% 35.7% 50.8%
Free Stuff Game -3.8% -45.0% -42.8% 23.7%
iPad 1.9% 17.5% 15.2% 37.4%
Kindle -15.5% -47.8% -38.3% -19.9%
Win -4.1% 30.7% 36.4% -10.3%
"The main challenge is differentiation. People know what a “conference” is, what an exhibition” is, and what a “webinar” is. They get invitations every single day. Nothing stands out. This is a fundamental challenge for B2B event marketers… and there’s no easy solution."
Parry Malm, Adestra

For email marketing that delivers results: +44 (0)1865 242425 www.adestra.com [email protected]
2013 Adestra Subject Line Analysis Report 16
Why is this? The last time you went to a friend’s birthday party, were you invited on Facebook? I bet that’s the case. Social media is simply a new channel for us to undertake one of the fundamental parts of the human experience – getting out with friends and family to enjoy ourselves!
However, despite the preceding altruism, let’s face it, another part of the human experience is we all like to save a pound. And in the B2C events space, this is as clear as day. When selling tickets, focus on savings and offers and people will respond. Just make sure you explain them as clearly as possible.
And; don’t be afraid of talking about money or stressing the urgency of the situation. No one likes to be pressured, sure but when the pressure’s on is when you take action! Don’t be pushy, don’t be rude – but do be up front about it. If a great offer is ending, say so. If there’s only two days left, say so. You’re selling a great event, not double-glazing, and people know that. Trust in your customers that they’ll do the right thing and you’ll be rewarded with response uplift.
B2C EVENTSWhen Facebook and Twitter took off, all of the doomsday pundits told us it was the end of human connections; that we’d cease to be social beings and simply live lonely, isolated lives on our computers. And yet the B2C events sector has taken off in a massive way thanks to the promotional boost from social media.
20%
10%
0%
-10%
-20%
-30%
-40%
-50%
-60%
“£”
-43.6%
Click Rate Variance vs
Average
14.6%
Open Rate Variance vs
Average
40%
35%
30%
25%
20%
15%
10%
5%
0%
Win
30.7%Click Rate
Variance vs Average
Open Rate Variance vs
Average
4.1%
"B2C events suffer the same problem as their B2B compatriots – a saturated market and the need for differentiation. Focus on what makes your event different and the savings and offers you can give to your audience. This will make you stand out from the crowd"
Parry Malm, Adestra

For email marketing that delivers results: +44 (0)1865 242425 www.adestra.com [email protected]
2013 Adestra Subject Line Analysis Report 17
B2C EVENTSKeyword table
Objective KeywordOpen rate
variance vs. average
Click rate variance vs.
average
Click to open rate
variance vs. average
Unsubscribe rate variance vs. average
Money $ 25.5% -74.9% -80.0% 81.6%
£ 14.6% -43.6% -50.8% 59.4%
€ 5.2% -42.3% -45.1% 111.8%
Ticket sales 2 for 1 30.2% -53.8% -64.5% 108.2%
Cheap 63.2% -11.0% -45.5% 82.1%
Discount 12.9% -64.4% -68.4% 72.1%
Early bird 7.3% -50.5% -53.9% 154.0%
Free 8.7% -66.4% -69.1% 85.8%
Offer 17.3% -46.1% -54.1% 145.8%
Save -3.4% -65.5% -64.3% 91.0%
Tickets 23.0% -42.8% -53.5% 72.9%
Show features Exclusive 22.6% -57.5% -65.4% 152.3%
Explore 19.3% -52.6% -60.3% 54.7%
Preview 33.3% 15.0% -13.7% 38.7%
Program 10.5% -51.2% -55.8% 56.6%
Reasons 25.1% -41.2% -53.0% 55.7%
Win 26.2% 9.0% -13.6% 100.8%
Urgency Last chance 16.8% -51.2% -58.2% 49.3%
Meet 23.7% -38.9% -50.6% 72.0%
Still time 25.9% -58.5% -67.1% 68.4%
Call to action Opens 16.1% -36.8% -45.6% 54.0%
Register 56.6% -0.8% -36.7% 93.7%
Tickets 23.0% -42.8% -53.5% 72.9%
Visit 28.0% -33.0% -47.7% 82.0%
! 24.6% -28.2% -42.4% 74.5%
Free Stuff Game -3.8% -45.0% -42.8% 23.7%
iPad 1.9% 17.5% 15.2% 37.4%
Kindle -15.5% -47.8% -38.3% -19.9%
Win -4.1% 30.7% -36.4% -10.3%
“Early bird” can have a positive
impact on your open rates but a massively negative impact on
your unsubscribe rates.
Prizes and free stuff may
give you a slightly lower open rate but
boosts your click throughs.

For email marketing that delivers results: +44 (0)1865 242425 www.adestra.com [email protected]
2013 Adestra Subject Line Analysis Report 18
Many purchases online are determined by price. Research denotes that one of the main reasons for losing a sale online is delivery charges. Simply offering “Free Delivery” (+35.9%, +81.3%) can help you keep that deal. Further, consumers love a “Sale” (+10.7%, +26.7%) and specific offers such as % off, (+6.1%, +17.7%). However, generic offers such as “Save” (-4.4%, -27.4%) and pushy calls to action like “Buy” (-19.3%, -59.1%) have a negative effect.
You also need to make sure that the way you’re communicating your offers isn't devaluing your product. Take the words “Cheap” (-67.2%, -71.6%) and “Free” (-23.7%, -34.8%) – you get what you pay for in this life. There’s no such thing as a free lunch, or so they say, and it would appear that consumers believe this too.
The challenge in this sector is to balance short term response uplifts (limited offers and the like) with long-term brand value. If you do nothing but offer discounts, guess what, you’ll be perceived as a discount brand. Make sure you know beyond a shadow of a doubt what your core brand values are, then make sure your subject lines follow this through.
RETAIL AND ECOMMERCEThe online retail sector is continuously under extreme pressure. If you Google any product under the sun you’ll get 10 pages of results of websites selling it. The key is to differentiate your offering in whatever way possible.
-65%
-66%
-67%
-68%
-69%
-70%
-71%
-72%
-73%
80%
70%
60%
50%
40%
30%
20%
10%
0%
Cheap Free delivery
-71.6%
Click Rate Variance vs
Average
81.3%Click Rate
Variance vs Average
-67.2%
Open Rate Variance vs
Average Open Rate Variance vs
Average
35.9%
Using "Cheap" can reduce your results

For email marketing that delivers results: +44 (0)1865 242425 www.adestra.com [email protected]
2013 Adestra Subject Line Analysis Report 19
RETAIL AND ECOMMERCEKeyword table
Objective KeywordOpen rate
variance vs. average
Click rate variance vs.
average
Click to open rate
variance vs. average
Unsubscribe rate variance vs. average
Incentives % off 6.1% 17.7% 10.9% 38.1%
Cheap -67.2% -71.6% -13.3% -34.6%
Free -23.7% -34.8% -14.6% 32.4%
Half price 11.5% -21.3% -29.4% 29.8%
Sale 10.7% 26.7% 14.4% 75.0%
Save -4.4% -27.4% -24.0% 38.2%
Win -21.0% -13.8% 9.2% 27.8%
Calls to Action Buy -19.3% -59.1% -49.3% 9.9%
Order 6.2% -19.8% -24.5% 2.9%
Events Birthday -6.1% -36.6% -32.4% 11.4%
Christmas -3.9% -29.2% -26.3% 35.2%
Holiday -26.3% -51.6% -34.3% 88.2%
Launch 0.3% -30.1% -30.3% 1.0%
Summer -15.1% -26.9% -13.9% 16.4%
Benefits Available 28.3% 8.3% -15.6% 47.0%
Essential -15.1% -32.7% -20.8% 31.9%
Free delivery
35.9% 81.3% 33.4% 107.0%
New 23.2% 10.2% -10.5% 32.0%
Offer -3.3% -41.2% -39.2% 34.6%
Superlatives Great 14.7% -9.6% -21.2% 47.1%
Fantastic -12.5% -48.4% -41.1% 7.9%
Good -7.3% -40.3% -35.6% 65.8%
Exclusive -6.2% -37.6% -33.5% 66.6%
Latest 95.4% -1.0% -49.3% 9.8%
“Cheap” and “free” can devalue your proposition and
cause your results to slump.
Sales and savings still work and are great for driving clicks through to
your website.

For email marketing that delivers results: +44 (0)1865 242425 www.adestra.com [email protected]
2013 Adestra Subject Line Analysis Report 20
There are so many charities for so many causes out there that it is more important than ever to ensure your supporter list engages with you not just from a monetary standpoint, but from a cause standpoint.
Donation requests can work, but it needs to be a mutual exchange. For example simply asking people to “Donate” (+17.4%, -56.9%) will get you opens, because people know what you’re going to ask. You may not get as many clicks, but it’s a simple way to separate those ready to give, and those not.
However, not all donation requests are monetary – often they are around asking for a “volunteer” (+55.6%, +44.9%,) or simply asking recipients to “help” (+34.7, +14.2%.) Sometimes
the softly-softly approach works better – consumers want to feel like they’re making a difference.
Over-soliciting donations will turn you into an online chugger! Try mixing up your engagement requests in your subject line so you aren’t perceived as the person with a jar hassling pub patrons.
Importantly, a major function of charities is acting as advocates for a given cause. People who engage with you online, regardless of their donation status, can help you advance your goals. Let them know what you are doing to solve problems. Give them an “update” (+46.2%, +18.6%) or explain how you’re helping “society” (+69.6%, +44.5%).
"Have you ever walked down the street and been accosted by a well-intentioned “chugger” trying to separate you from your hard earned cash? I have… and have never given to them. This isn’t because I’m a mean old dude, but it’s because it’s an extremely poorly targeted solicitation. I’m qualified as a lead by virtue of walking down the street.
Now, I’m sure this strategy works in certain circumstances. But in an online channel, it is evident that such a widespread approach doesn’t pay dividends."
Parry Malm, Adestra
CHARITIESEngagement is key for charities. Whether you’re asking for a donation right now, or for recipients to become advocates, focus on engagement means you’ll have that email address for life and not just a one off donation.
62%
60%
58%
56%
54%
52%
50%
48%
46%
0%
-10%
-20%
-30%
-40%
-50%
-60%
-70%
-80%
News Support
50.7%Click Rate
Variance vs Average
-66.6%
Click Rate Variance vs
Average
60.7% Open Rate Variance vs
Average
-8.5%
Open Rate Variance vs
Average

For email marketing that delivers results: +44 (0)1865 242425 www.adestra.com [email protected]
2013 Adestra Subject Line Analysis Report 21
CHARITIESKeyword table
Objective KeywordOpen rate
variance vs. average
Click rate variance vs.
average
Click to open rate
variance vs. average
Unsubscribe rate variance vs. average
Donations Cards -19.2% -48.2% -35.9% -98.3%
Donate 17.4% -56.9% -63.2% -90.0%
Gift -25.2% -46.7% -28.7% -92.2%
Give -37.0% -79.0% -66.7% -6.8%
Help 34.7% 14.2% -15.2% 296.7%
Join 12.4% -28.4% -36.3% -20.1%
Member 19.8% -34.3% -45.1% 63.0%
Order -18.8% -51.8% -40.7% -100.0%
Presents -3.3% -41.3% -39.3% 3.0%
Registration 22.0% -50.1% -59.1% 201.6%
Support -8.5% -66.6% -63.4% 110.8%
Volunteer 55.6% 44.9% -6.9% -2.6%
Money % off -1.5% 1.3% 2.8% -84.9%
£ -1.5% -71.1% -70.7% -82.7%
Events Challenge 17.8% -50.7% -58.1% -61.5%
Christmas 8.7% -13.2% -20.2% -33.9%
Event 19.6% -51.0% -59.0% -16.3%
Marathon 9.6% -71.2% -73.8% -10.0%
Run 3.3% -60.6% -61.9% -34.0%
Content Action -22.1% -57.3% -45.1% -94.7%
Campaign -15.1% -50.1% -41.3% -62.4%
Child -12.1% -65.2% -60.4% 177.0%
Difference 18.2% -70.8% -75.3% 235.6%
Inspiration -48.2% -68.1% -38.3% -100.0%
Lives -24.5% -86.2% -81.7% -88.5%
News 60.7% 50.7% -6.2% 40.9%
Society 69.6% 44.5% -14.8% 52.3%
Today -20.5% -52.2% -39.9% -100.0%
Update 46.2% 18.6% -18.9% 174.5%
Video -21.8% -67.8% -58.8% -39.9%
Views -29.6% -40.4% -15.4% -94.0%
Win -13.0% -42.5% -33.9% -65.2%
Asking for people to “give”
and “support” doesn’t have the impact that “news” and
“help” does.

For email marketing that delivers results: +44 (0)1865 242425 www.adestra.com [email protected]
2013 Adestra Subject Line Analysis Report 22
APPENDIXDefinitions for Terms Used in This Paper
Here you’ll find the definition of terms used throughout this paper and in the appendix tables.
Click rateMeasures the percentage of recipients who have clicked on a link within the email content.
Click to open rateMeasures the percentage of opened messages that recorded clicks.
Unsubscribe RateThe percentage of delivered email messages that generate unsubscribe requests.
MeanThe mean is the average of the numbers: a calculated “central” value of a set of numbers. To calculate: Just add up all the numbers, then divide by how many numbers there are.
MedianThe middle number (in a sorted list of numbers). To find the Median, place the numbers you are given in value order and find the middle number.
1st QuartileFor a set of data, the number for which 25% of the data is less than that number. To find the first quartile, place the numbers you are given in value order and find the number which represents the first quarter of values.
3rd QuartileFor a set of data, a number for which 75% of the data is less than that number. To find the first quartile, place the numbers you are given in value order and find the number which represents the first quarter of values.
Variance vs. averageIn simple terms, this is the uplift or drop in results compared to the average.

For email marketing that delivers results: +44 (0)1865 242425 www.adestra.com [email protected]
2013 Adestra Subject Line Analysis Report 23
ABOUT THE AUTHOR
ABOUT ADESTRA
Parry Malm – Account DirectorParry joined Adestra in 2010 and, having run marketing teams in his previous roles, has a deep understanding of client needs. He is a seasoned digital marketer and is responsible for running Adestra’s Account Management team and for delivering high-level strategic direction to Adestra clients. On weekends, Parry can be found policing the mean streets of London in a Mountie uniform.
Adestra is a leading email service provider. Hundreds of organisations and thousands of users trust us to grow their email marketing strategies. Our global presence spans Oxford, London and New York. So wherever you are, you’ll receive consistent email marketing solutions that deliver results.
Since forming in 2004, we’ve worked hard to become one of the industry’s most respected names. Our success is driven by our innovative technology, excellent client service and proven deliverability.
For email marketing that delivers results, call now on +44 (0)1865 242425, visit our website www.adestra.com or email [email protected]

For email marketing that delivers results: +44 (0)1865 242425 www.adestra.com [email protected]
2013 Adestra Email Subject Line Analysis 24
ALL SECTORSObjective Keyword Open rate variance vs. average Click rate variance vs. average Click to open rate variance vs. average Unsubscribe rate variance vs. average
Mean 1st Quartile Median 3rd Quartile Mean 1st Quartile Median 3rd Quartile Mean 1st Quartile Median 3rd Quartile Mean 1st Quartile Median 3rd Quartile
Benefits Exclusive 12.3% -30.7% 5.5% 53.4% -0.3% -78.7% -40.5% 46.3% -11.2% -69.9% -45.3% 14.8% 22.0% -88.7% -32.8% 63.9%
Free -3.0% -34.5% 1.0% 45.7% -6.3% -75.2% -39.0% 58.6% -3.3% -64.3% -31.1% 32.2% -1.3% -75.7% -33.3% 46.0%
Free delivery 50.7% 10.3% 46.3% 116.6% 135.4% -2.4% 73.7% 219.6% 56.3% -11.3% 22.3% 82.5% 82.4% -48.8% 10.5% 118.2%
Gift 12.4% -14.7% 20.0% 59.5% -11.3% -65.9% -20.3% 54.5% -21.1% -61.5% -30.2% 9.4% 21.2% -71.4% 11.5% 116.5%
Half price 21.5% -3.0% 25.5% 48.9% -7.0% -66.4% -23.6% 43.1% -23.5% -68.1% -40.2% 3.4% 31.4% -16.9% 27.7% 91.4%
Latest 8.3% -23.1% 6.0% 38.2% 11.7% -56.6% -15.8% 63.9% 3.1% -48.5% -12.9% 43.3% -9.9% -78.1% -44.7% 10.9%
New 17.2% -23.5% 7.1% 50.2% 38.2% -74.2% -27.5% 93.6% 17.9% -66.6% -27.0% 51.9% -2.6% -80.6% -39.0% 37.5%
Offer 7.3% -26.2% -1.1% 29.4% -18.6% -83.9% -49.5% 17.9% -24.1% -78.3% -49.1% 4.8% 22.3% -79.1% -29.5% 45.3%
Only -4.1% -32.0% -6.3% 27.7% -37.3% -86.4% -66.6% -6.7% -34.7% -79.6% -59.7% -16.4% 11.9% -71.5% -23.5% 53.3%
Sale 23.2% -6.1% 27.6% 56.3% 60.7% -42.5% 46.0% 178.0% 30.5% -41.3% 23.7% 93.0% 31.6% -80.6% -22.5% 68.2%
Save 3.4% -26.6% -3.1% 34.7% -25.2% -83.3% -62.1% -9.6% -27.7% -79.0% -58.7% -16.7% 18.1% -68.3% -19.5% 64.1%
Special 4.1% -29.2% 0.9% 29.9% -21.2% -85.3% -52.6% 21.0% -24.4% -78.3% -49.0% 0.9% 18.9% -81.4% -44.8% 37.4%
Voucher 20.0% -17.2% 8.0% 41.6% -2.4% -79.0% -27.5% 26.2% -18.7% -70.1% -38.8% -6.5% 60.6% -65.3% 17.8% 138.9%
Content Alert 38.1% 20.6% 48.1% 77.3% 61.8% -3.9% 61.2% 157.2% 17.2% -30.0% 18.3% 61.6% -63.2% -90.6% -80.1% -66.0%
Book -4.6% -32.0% -4.2% 34.7% -25.4% -82.7% -58.6% 7.7% -21.8% -77.5% -51.8% -9.5% 11.0% -80.3% -34.9% 35.7%
Bulletin 15.8% -13.9% 4.5% 51.5% 12.7% -50.8% -20.3% 54.2% -2.6% -46.9% -13.0% 33.9% -22.9% -75.6% -38.2% 0.8%
Conference -10.6% -30.3% -11.9% 9.9% -54.3% -82.3% -67.9% -41.8% -48.9% -75.9% -60.7% -38.5% 26.9% -96.7% -37.5% 44.5%
Issue 10.8% -25.4% 8.3% 41.3% 10.4% -79.5% -27.9% 63.5% -0.4% -72.1% -32.1% 26.9% 29.6% -61.8% -5.7% 77.9%
Journal -12.8% -39.6% -12.6% 39.9% -26.2% -88.0% -69.3% 30.7% -15.4% -79.6% -60.0% 17.6% 79.7% -36.3% 25.1% 124.1%
Learn -35.5% -46.5% -28.1% -4.2% -60.8% -87.4% -74.4% -41.5% -39.2% -79.0% -60.6% -19.0% -23.9% -73.1% -39.6% 42.3%
News 34.8% -1.2% 25.8% 73.7% 47.7% -45.8% 20.7% 137.5% 9.6% -41.7% -4.6% 52.2% -26.0% -86.2% -69.9% -36.9%
Newsletter 0.7% -20.4% -1.4% 35.7% -18.7% -71.6% -25.9% 27.1% -19.2% -65.3% -27.5% 13.7% -2.9% -61.4% -24.9% 53.1%
Report -23.7% -43.4% -26.9% 2.7% -54.8% -86.5% -73.8% -37.3% -40.8% -76.1% -58.9% -26.7% -54.6% -84.4% -72.1% -43.9%
Today -15.9% -33.2% -12.4% 26.0% -37.9% -85.1% -60.3% -4.1% -26.1% -76.5% -48.2% -0.6% 5.2% -81.4% -46.0% 29.6%

For email marketing that delivers results: +44 (0)1865 242425 www.adestra.com [email protected]
2013 Adestra Email Subject Line Analysis 25
Objective Keyword Open rate variance vs. average Click rate variance vs. average Click to open rate variance vs. average Unsubscribe rate variance vs. average
Mean 1st Quartile Median 3rd Quartile Mean 1st Quartile Median 3rd Quartile Mean 1st Quartile Median 3rd Quartile Mean 1st Quartile Median 3rd Quartile
Content Update 17.2% -19.2% 16.8% 48.6% 8.6% -63.1% -23.6% 45.5% -7.3% -57.9% -26.9% 40.5% 12.6% -71.0% -44.9% 9.9%
Video 18.5% -23.1% 3.0% 46.7% 64.8% -68.1% -18.0% 95.7% 39.0% -63.1% -19.2% 59.0% -26.0% -77.4% -54.8% 7.1%
Webinar -16.6% -32.1% -18.7% -1.1% -70.7% -88.3% -78.3% -62.0% -64.8% -83.1% -73.1% -56.4% 8.8% -73.7% -38.9% 23.6%
Win 1.8% -28.8% 4.3% 45.2% 26.7% -73.0% -13.5% 105.2% 24.4% -62.7% -10.9% 60.7% -2.9% -80.4% -41.0% 28.0%
Date Daily 27.8% 0.6% 45.2% 65.7% 100.3% 12.2% 115.6% 203.2% 56.7% -0.5% 67.0% 100.7% -75.0% -100.0% -90.5% -76.9%
Monthly -26.6% -17.5% 31.6% 46.1% -37.0% -64.1% 2.5% 94.2% -14.2% -60.7% -15.2% 45.9% 13.8% -56.9% -26.0% 36.6%
Weekly 27.1% 17.2% 42.5% 59.6% 50.6% -26.5% 40.4% 141.0% 18.5% -31.1% 14.2% 62.4% -49.8% -75.0% -58.3% -38.1%
Call to action Attend -12.5% -31.4% -14.4% 8.3% -60.5% -83.5% -70.3% -49.2% -54.8% -76.6% -64.3% -43.4% 4.2% -83.0% -38.4% 30.4%
Download 1.4% -24.4% -1.7% 20.9% -6.1% -70.9% -37.8% 18.8% -7.4% -62.0% -37.9% 7.7% -28.2% -67.7% -31.6% 55.5%
Get -8.6% -37.8% -5.5% 32.2% -16.1% -82.1% -47.9% 51.2% -8.2% -72.9% -36.4% 35.7% 2.5% -84.6% -41.5% 33.4%
Register -9.6% -31.8% -13.1% 14.1% -54.9% -85.1% -69.1% -36.2% -50.1% -80.2% -62.9% -36.6% 27.7% -69.8% -25.2% 53.3%
Subscription 5.0% -26.9% -4.1% 33.1% -19.1% -75.7% -24.4% 38.6% -23.0% -71.1% -27.1% 26.2% 89.3% -5.7% 136.2% 234.4%
Tickets 22.3% -14.4% 27.1% 71.7% -9.9% -63.0% -28.6% 48.0% -26.3% -61.2% -35.8% 7.6% 42.5% -43.7% 19.8% 91.7%
Money $ -14.3% -55.0% -4.8% 31.6% -27.4% -84.4% -55.8% 24.2% -15.3% -70.9% -43.7% 29.0% 35.9% -81.2% -39.1% 80.3%
% off 10.5% -14.9% 25.6% 55.9% 27.4% -54.7% 22.3% 143.1% 15.2% -52.9% 3.9% 78.5% 12.2% -53.3% -4.3% 69.4%
£ -1.6% -23.5% 14.2% 53.2% 5.6% -76.3% 9.3% 161.0% 7.4% -67.5% -2.7% 87.0% -4.2% -86.4% -57.4% 16.7%
€ -3.7% -29.3% -2.4% 31.4% -17.7% -81.2% -54.2% 30.7% -14.5% -74.8% -47.8% 14.1% 4.3% -79.6% -46.3% 23.3%
Urgency Don't miss -8.8% -38.0% -10.0% 17.3% -42.9% -88.2% -71.2% -35.6% -37.3% -82.0% -64.4% -35.2% 33.2% -60.5% -13.5% 78.1%
Early bird -20.3% -35.4% -17.8% 4.0% -70.1% -87.2% -77.5% -64.5% -62.5% -82.7% -71.6% -57.1% 72.7% -76.0% -18.4% 84.8%
Last chance -10.1% -37.6% -19.8% 9.3% -54.0% -88.7% -77.6% -49.2% -48.8% -83.7% -70.3% -45.7% 12.9% -67.9% -20.3% 64.6%
To go -1.1% -26.8% -8.3% 14.2% -38.1% -83.5% -69.0% -40.9% -37.4% -79.6% -63.7% -36.1% 7.5% -62.3% -9.3% 56.9%
Misc ! 2.9% -27.3% 1.2% 44.0% -11.3% -81.1% -52.4% 21.1% -13.7% -74.9% -49.6% 3.1% 21.0% -64.6% -15.0% 61.6%
? -11.4% -34.7% -8.6% 22.3% -25.9% -84.3% -59.2% 6.0% -16.3% -76.9% -50.5% 5.2% 18.0% -82.3% -46.1% 37.2%
iPad 31.6% -28.0% 6.8% 71.4% 19.9% -74.5% -41.9% 40.9% -9.0% -66.4% -47.2% -4.2% 19.1% -75.2% -33.0% 60.7%
ALL SECTORS

For email marketing that delivers results: +44 (0)1865 242425 www.adestra.com [email protected]
2013 Adestra Email Subject Line Analysis 26
B2B PUBLISHINGObjective Keyword Open rate variance vs. average Click rate variance vs. average Click to open rate variance vs. average Unsubscribe rate variance vs. average
Mean 1st Quartile Median 3rd Quartile Mean 1st Quartile Median 3rd Quartile Mean 1st Quartile Median 3rd Quartile Mean 1st Quartile Median 3rd Quartile
Content % -7.6% -33.1% -4.2% 20.3% -21.3% -81.8% -39.5% 51.1% -14.9% -73.6% -31.0% 41.9% 32.1% -81.8% -30.1% 53.1%
*|*|* 27.5% 7.3% 28.1% 54.5% 90.7% 7.2% 80.9% 168.9% 49.5% 5.8% 37.8% 83.3% -53.7% -88.7% -71.8% -50.9%
*,*,* 19.5% -9.8% 35.2% 79.6% 36.4% -40.6% 40.7% 153.7% 14.2% -40.6% 7.8% 56.9% -8.0% -72.4% -49.7% 0.0%
Alert 32.9% 16.7% 42.4% 71.0% 35.7% -18.7% 35.2% 117.4% 2.1% -38.7% 3.5% 41.6% -45.5% -85.9% -70.0% -49.5%
Best Practice -31.1% -56.4% -34.6% -21.4% -57.8% -93.4% -83.4% -45.6% -38.7% -87.4% -70.3% -29.8% 89.3% -61.1% -6.8% 85.7%
Book -7.2% -34.6% -10.4% 26.9% -31.6% -82.4% -57.4% 7.2% -26.3% -76.0% -47.1% -4.4% 50.5% -73.8% -11.5% 68.1%
Breaking 35.4% 14.8% 40.7% 54.9% 77.6% -0.4% 69.7% 142.6% 31.2% -16.5% 22.2% 64.7% -65.8% -81.9% -68.1% -52.5%
Bulletin 15.2% -19.1% 4.3% 55.8% 0.8% -62.1% -37.8% 54.2% -12.5% -57.5% -30.4% 50.9% 8.2% -72.9% -25.4% 40.6%
CPD 3.2% -11.5% -0.8% 16.6% -39.4% -84.9% -59.5% -34.9% -41.3% -79.9% -58.2% -40.6% 83.8% -40.7% 54.1% 132.1%
Editor 28.7% 9.2% 35.8% 49.8% 68.3% -47.4% 49.6% 150.8% 30.7% -47.1% 20.5% 73.6% -15.5% -72.5% -48.4% 30.0%
Exclusive -0.4% -20.5% -5.3% 20.9% -23.4% -81.0% -43.4% 29.5% -23.1% -77.2% -46.3% 10.5% 42.9% -86.2% -39.2% 74.3%
Forecast -34.0% -56.0% -38.9% -2.0% -68.3% -86.9% -79.1% -56.9% -51.9% -74.3% -58.2% -25.0% -37.9% -85.3% -72.0% -48.7%
Insight -15.6% -28.7% -19.5% -3.8% -76.7% -93.8% -87.8% -75.3% -72.4% -93.1% -81.0% -68.3% 44.9% -49.3% 23.4% 135.8%
Intelligence -15.7% -28.7% -19.5% -5.4% -84.1% -94.8% -89.9% -76.7% -81.1% -93.9% -86.4% -71.0% 20.9% -47.2% 11.2% 115.9%
Interview -4.3% -22.3% -6.7% 19.5% -2.4% -69.8% -5.3% 63.0% 2.0% -57.2% -8.6% 47.2% -33.8% -74.4% -54.7% -24.9%
Issue 6.9% -24.6% 8.1% 34.5% -4.8% -81.7% -17.0% 56.2% -11.0% -72.5% -20.5% 23.6% 69.1% -44.3% 19.9% 136.7%
Journal -25.3% -44.0% -22.5% 21.6% -52.3% -90.7% -78.2% -14.5% -36.2% -83.2% -68.6% -15.3% 193.4% 12.2% 104.7% 256.5%
Latest -2.0% -24.7% 0.9% 28.0% -8.7% -57.5% -23.2% 38.5% -6.8% -49.2% -11.8% 29.6% 17.1% -69.6% -26.4% 40.4%
Magazine 0.2% -31.6% -11.8% 34.8% -22.1% -78.8% -53.3% -1.1% -22.2% -69.0% -45.6% -5.1% 131.7% -36.3% 42.7% 155.6%
News 20.5% -0.8% 23.6% 67.0% 13.9% -52.8% 1.4% 102.9% -5.4% -48.1% -15.2% 38.0% -20.0% -80.0% -60.0% -25.4%
Newsletter -11.2% -25.0% -16.0% 1.8% -52.6% -84.8% -62.7% -20.9% -46.7% -77.4% -55.4% -10.7% 48.5% -45.8% 4.1% 104.0%
Policy -14.3% -55.3% -49.6% -2.6% -17.2% -82.9% -74.6% -35.3% -3.4% -64.1% -52.4% -20.1% -24.9% -72.3% -45.6% -11.2%
Report -30.6% -46.8% -31.8% -5.6% -64.1% -88.4% -78.2% -49.2% -48.3% -78.2% -64.0% -36.8% -43.7% -77.3% -61.4% -26.3%
Research 1.7% -27.2% -1.8% 23.7% -4.4% -72.7% -32.9% 47.0% -6.0% -65.6% -28.3% 31.3% 37.3% -85.6% -20.4% 73.2%

For email marketing that delivers results: +44 (0)1865 242425 www.adestra.com [email protected]
2013 Adestra Email Subject Line Analysis 27
Objective Keyword Open rate variance vs. average Click rate variance vs. average Click to open rate variance vs. average Unsubscribe rate variance vs. average
Mean 1st Quartile Median 3rd Quartile Mean 1st Quartile Median 3rd Quartile Mean 1st Quartile Median 3rd Quartile Mean 1st Quartile Median 3rd Quartile
Content Special -3.6% -30.2% -2.5% 18.1% -37.0% -87.9% -54.4% 9.2% -34.6% -81.9% -49.4% -2.1% 15.3% -72.6% -29.8% 66.3%
Tips -13.7% -34.9% -21.1% 11.4% -13.3% -83.1% -56.3% 31.7% 0.4% -71.1% -44.4% 24.3% -15.8% -75.9% -44.7% 49.6%
Top stories -11.2% -13.7% -4.3% 5.1% -30.5% -47.3% -2.9% 26.6% -21.7% -36.2% 0.5% 17.2% -0.3% -65.2% -47.9% -8.4%
Trends -14.6% -34.4% -19.0% 3.6% -51.0% -82.0% -63.5% -40.6% -42.6% -74.6% -55.5% -24.4% 56.1% -53.9% -5.9% 107.1%
Update 26.8% -7.9% 16.5% 45.0% 8.9% -52.5% -11.8% 59.9% -14.1% -52.2% -22.5% 28.0% -5.7% -56.4% -24.2% 20.5%
Video -11.6% -34.2% -15.4% 11.0% -32.0% -74.7% -53.6% -3.7% -23.1% -66.7% -42.3% -3.9% -13.7% -74.0% -55.1% 4.5%
Webinar -24.5% -34.3% -20.1% -0.3% -76.9% -89.1% -81.8% -71.7% -69.3% -84.9% -77.6% -68.9% 62.4% -45.2% 2.4% 95.3%
Date This week -18.5% -28.6% -7.8% 9.0% -28.6% -57.5% -31.4% 2.7% -12.3% -40.1% -14.9% 7.0% 5.6% -50.5% -15.7% 42.9%
Daily 12.6% -10.3% 16.4% 57.0% 35.8% -20.0% 31.4% 111.4% 20.7% -29.3% 19.6% 67.5% -51.2% -89.5% -77.7% -57.4%
Weekly 27.5% 21.9% 40.1% 53.8% 24.7% -36.5% 24.0% 108.1% -2.2% -44.6% -3.3% 41.1% -26.5% -61.8% -39.3% -13.0%
Monthly -6.4% 11.3% 31.7% 39.4% -19.1% -48.4% 24.9% 85.7% -13.6% -52.3% -2.6% 34.3% 134.6% -23.0% 13.3% 75.0%
Subscriptions $ 10.1% -8.2% 8.2% 30.2% 19.2% -44.3% 27.4% 84.0% 8.2% -41.4% 11.9% 57.2% -25.3% -100.0% -78.4% -26.1%
£ 21.9% 0.2% 23.5% 47.5% 80.5% 5.4% 97.7% 182.9% 48.2% 0.1% 61.2% 99.1% -19.3% -86.0% -69.3% -34.8%
€ 3.5% -21.9% 0.6% 27.2% 1.3% -75.3% -33.5% 50.5% -2.1% -69.0% -30.7% 36.4% 9.4% -81.9% -51.9% 14.2%
Access 2.9% -28.8% -1.8% 30.2% -7.3% -75.0% -45.6% 24.9% -9.9% -67.5% -36.5% 11.0% 80.6% -31.7% 40.0% 127.2%
Free 3.0% -31.5% -5.2% 29.5% -8.4% -79.4% -44.5% 36.9% -11.1% -68.6% -40.0% 16.1% 64.9% -60.0% -6.5% 81.9%
Renew 0.6% -17.4% 1.5% 19.5% 22.6% -60.9% -7.3% 96.1% 21.9% -45.9% -1.9% 70.3% 175.6% -72.0% 80.3% 273.5%
Subscription -8.2% -31.8% -13.3% 8.8% -22.7% -78.6% -41.7% 11.7% -15.8% -73.1% -28.3% 23.6% 266.7% 81.9% 300.6% 494.1%
Trial 8.8% -20.9% 3.3% 28.4% -6.6% -77.1% -47.5% 38.2% -14.1% -70.5% -44.2% 10.9% 13.8% -82.9% -56.8% 84.5%
Personalisation $AMF_ 18.3% -15.0% 6.8% 43.8% 6.3% -62.6% -13.1% 49.2% -10.1% -60.7% -21.8% 28.1% 115.3% -40.6% 58.4% 258.6%
Multichannel iPad 2.1% -26.9% -6.2% 24.0% -40.7% -74.1% -56.9% -23.9% -41.9% -68.5% -56.0% -36.1% 44.0% -100.0% -42.9% 93.0%
iPhone 24.5% -19.1% 4.3% 69.9% -37.4% -74.0% -54.5% -11.8% -49.7% -73.7% -60.6% -31.4% 7.8% -61.1% -30.8% 31.6%
? -11.4% -34.7% -8.6% 22.3% -25.9% -84.3% -59.2% 6.0% -16.3% -76.9% -50.5% 5.2% 18.0% -82.3% -46.1% 37.2%
iPad 31.6% -28.0% 6.8% 71.4% 19.9% -74.5% -41.9% 40.9% -9.0% -66.4% -47.2% -4.2% 19.1% -75.2% -33.0% 60.7%
B2B PUBLISHING
For email marketing that delivers results: +44 (0)1865 242425 www.adestra.com [email protected]
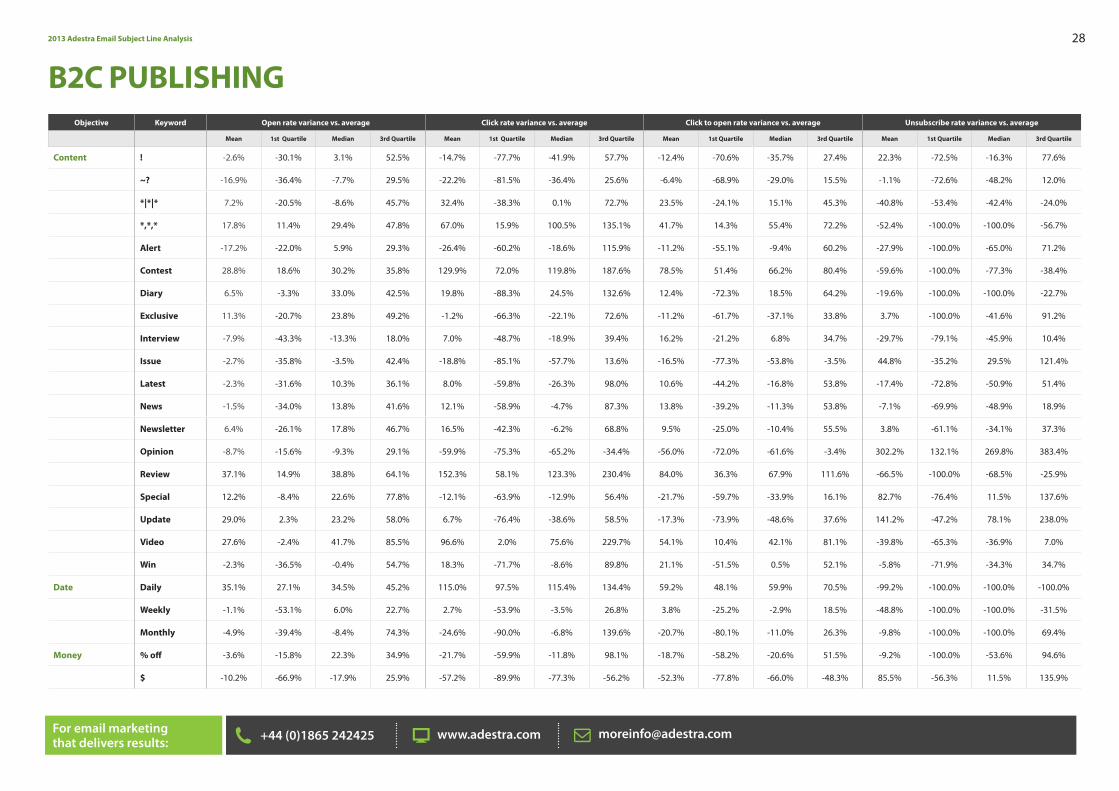
2013 Adestra Email Subject Line Analysis 28
B2C PUBLISHINGObjective Keyword Open rate variance vs. average Click rate variance vs. average Click to open rate variance vs. average Unsubscribe rate variance vs. average
Mean 1st Quartile Median 3rd Quartile Mean 1st Quartile Median 3rd Quartile Mean 1st Quartile Median 3rd Quartile Mean 1st Quartile Median 3rd Quartile
Content ! -2.6% -30.1% 3.1% 52.5% -14.7% -77.7% -41.9% 57.7% -12.4% -70.6% -35.7% 27.4% 22.3% -72.5% -16.3% 77.6%
~? -16.9% -36.4% -7.7% 29.5% -22.2% -81.5% -36.4% 25.6% -6.4% -68.9% -29.0% 15.5% -1.1% -72.6% -48.2% 12.0%
*|*|* 7.2% -20.5% -8.6% 45.7% 32.4% -38.3% 0.1% 72.7% 23.5% -24.1% 15.1% 45.3% -40.8% -53.4% -42.4% -24.0%
*,*,* 17.8% 11.4% 29.4% 47.8% 67.0% 15.9% 100.5% 135.1% 41.7% 14.3% 55.4% 72.2% -52.4% -100.0% -100.0% -56.7%
Alert -17.2% -22.0% 5.9% 29.3% -26.4% -60.2% -18.6% 115.9% -11.2% -55.1% -9.4% 60.2% -27.9% -100.0% -65.0% 71.2%
Contest 28.8% 18.6% 30.2% 35.8% 129.9% 72.0% 119.8% 187.6% 78.5% 51.4% 66.2% 80.4% -59.6% -100.0% -77.3% -38.4%
Diary 6.5% -3.3% 33.0% 42.5% 19.8% -88.3% 24.5% 132.6% 12.4% -72.3% 18.5% 64.2% -19.6% -100.0% -100.0% -22.7%
Exclusive 11.3% -20.7% 23.8% 49.2% -1.2% -66.3% -22.1% 72.6% -11.2% -61.7% -37.1% 33.8% 3.7% -100.0% -41.6% 91.2%
Interview -7.9% -43.3% -13.3% 18.0% 7.0% -48.7% -18.9% 39.4% 16.2% -21.2% 6.8% 34.7% -29.7% -79.1% -45.9% 10.4%
Issue -2.7% -35.8% -3.5% 42.4% -18.8% -85.1% -57.7% 13.6% -16.5% -77.3% -53.8% -3.5% 44.8% -35.2% 29.5% 121.4%
Latest -2.3% -31.6% 10.3% 36.1% 8.0% -59.8% -26.3% 98.0% 10.6% -44.2% -16.8% 53.8% -17.4% -72.8% -50.9% 51.4%
News -1.5% -34.0% 13.8% 41.6% 12.1% -58.9% -4.7% 87.3% 13.8% -39.2% -11.3% 53.8% -7.1% -69.9% -48.9% 18.9%
Newsletter 6.4% -26.1% 17.8% 46.7% 16.5% -42.3% -6.2% 68.8% 9.5% -25.0% -10.4% 55.5% 3.8% -61.1% -34.1% 37.3%
Opinion -8.7% -15.6% -9.3% 29.1% -59.9% -75.3% -65.2% -34.4% -56.0% -72.0% -61.6% -3.4% 302.2% 132.1% 269.8% 383.4%
Review 37.1% 14.9% 38.8% 64.1% 152.3% 58.1% 123.3% 230.4% 84.0% 36.3% 67.9% 111.6% -66.5% -100.0% -68.5% -25.9%
Special 12.2% -8.4% 22.6% 77.8% -12.1% -63.9% -12.9% 56.4% -21.7% -59.7% -33.9% 16.1% 82.7% -76.4% 11.5% 137.6%
Update 29.0% 2.3% 23.2% 58.0% 6.7% -76.4% -38.6% 58.5% -17.3% -73.9% -48.6% 37.6% 141.2% -47.2% 78.1% 238.0%
Video 27.6% -2.4% 41.7% 85.5% 96.6% 2.0% 75.6% 229.7% 54.1% 10.4% 42.1% 81.1% -39.8% -65.3% -36.9% 7.0%
Win -2.3% -36.5% -0.4% 54.7% 18.3% -71.7% -8.6% 89.8% 21.1% -51.5% 0.5% 52.1% -5.8% -71.9% -34.3% 34.7%
Date Daily 35.1% 27.1% 34.5% 45.2% 115.0% 97.5% 115.4% 134.4% 59.2% 48.1% 59.9% 70.5% -99.2% -100.0% -100.0% -100.0%
Weekly -1.1% -53.1% 6.0% 22.7% 2.7% -53.9% -3.5% 26.8% 3.8% -25.2% -2.9% 18.5% -48.8% -100.0% -100.0% -31.5%
Monthly -4.9% -39.4% -8.4% 74.3% -24.6% -90.0% -6.8% 139.6% -20.7% -80.1% -11.0% 26.3% -9.8% -100.0% -100.0% 69.4%
Money % off -3.6% -15.8% 22.3% 34.9% -21.7% -59.9% -11.8% 98.1% -18.7% -58.2% -20.6% 51.5% -9.2% -100.0% -53.6% 94.6%
$ -10.2% -66.9% -17.9% 25.9% -57.2% -89.9% -77.3% -56.2% -52.3% -77.8% -66.0% -48.3% 85.5% -56.3% 11.5% 135.9%
For email marketing that delivers results: +44 (0)1865 242425 www.adestra.com [email protected]
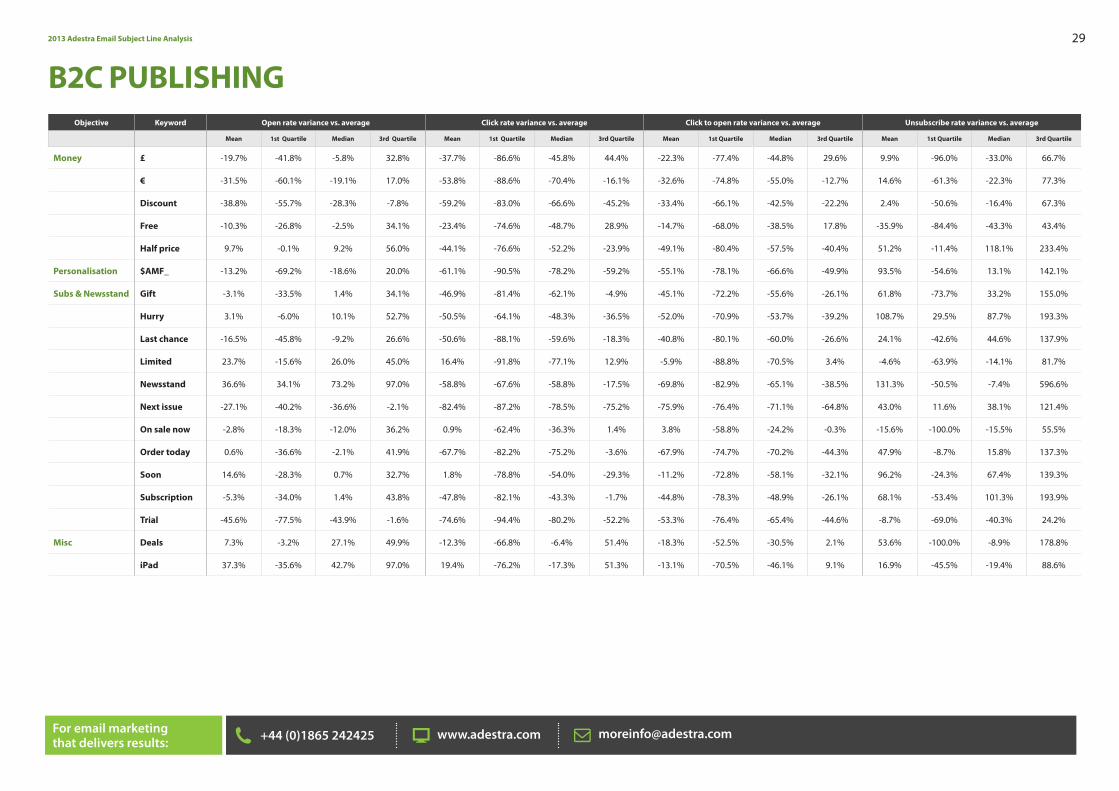
2013 Adestra Email Subject Line Analysis 29
Objective Keyword Open rate variance vs. average Click rate variance vs. average Click to open rate variance vs. average Unsubscribe rate variance vs. average
Mean 1st Quartile Median 3rd Quartile Mean 1st Quartile Median 3rd Quartile Mean 1st Quartile Median 3rd Quartile Mean 1st Quartile Median 3rd Quartile
Money £ -19.7% -41.8% -5.8% 32.8% -37.7% -86.6% -45.8% 44.4% -22.3% -77.4% -44.8% 29.6% 9.9% -96.0% -33.0% 66.7%
€ -31.5% -60.1% -19.1% 17.0% -53.8% -88.6% -70.4% -16.1% -32.6% -74.8% -55.0% -12.7% 14.6% -61.3% -22.3% 77.3%
Discount -38.8% -55.7% -28.3% -7.8% -59.2% -83.0% -66.6% -45.2% -33.4% -66.1% -42.5% -22.2% 2.4% -50.6% -16.4% 67.3%
Free -10.3% -26.8% -2.5% 34.1% -23.4% -74.6% -48.7% 28.9% -14.7% -68.0% -38.5% 17.8% -35.9% -84.4% -43.3% 43.4%
Half price 9.7% -0.1% 9.2% 56.0% -44.1% -76.6% -52.2% -23.9% -49.1% -80.4% -57.5% -40.4% 51.2% -11.4% 118.1% 233.4%
Personalisation $AMF_ -13.2% -69.2% -18.6% 20.0% -61.1% -90.5% -78.2% -59.2% -55.1% -78.1% -66.6% -49.9% 93.5% -54.6% 13.1% 142.1%
Subs & Newsstand Gift -3.1% -33.5% 1.4% 34.1% -46.9% -81.4% -62.1% -4.9% -45.1% -72.2% -55.6% -26.1% 61.8% -73.7% 33.2% 155.0%
Hurry 3.1% -6.0% 10.1% 52.7% -50.5% -64.1% -48.3% -36.5% -52.0% -70.9% -53.7% -39.2% 108.7% 29.5% 87.7% 193.3%
Last chance -16.5% -45.8% -9.2% 26.6% -50.6% -88.1% -59.6% -18.3% -40.8% -80.1% -60.0% -26.6% 24.1% -42.6% 44.6% 137.9%
Limited 23.7% -15.6% 26.0% 45.0% 16.4% -91.8% -77.1% 12.9% -5.9% -88.8% -70.5% 3.4% -4.6% -63.9% -14.1% 81.7%
Newsstand 36.6% 34.1% 73.2% 97.0% -58.8% -67.6% -58.8% -17.5% -69.8% -82.9% -65.1% -38.5% 131.3% -50.5% -7.4% 596.6%
Next issue -27.1% -40.2% -36.6% -2.1% -82.4% -87.2% -78.5% -75.2% -75.9% -76.4% -71.1% -64.8% 43.0% 11.6% 38.1% 121.4%
On sale now -2.8% -18.3% -12.0% 36.2% 0.9% -62.4% -36.3% 1.4% 3.8% -58.8% -24.2% -0.3% -15.6% -100.0% -15.5% 55.5%
Order today 0.6% -36.6% -2.1% 41.9% -67.7% -82.2% -75.2% -3.6% -67.9% -74.7% -70.2% -44.3% 47.9% -8.7% 15.8% 137.3%
Soon 14.6% -28.3% 0.7% 32.7% 1.8% -78.8% -54.0% -29.3% -11.2% -72.8% -58.1% -32.1% 96.2% -24.3% 67.4% 139.3%
Subscription -5.3% -34.0% 1.4% 43.8% -47.8% -82.1% -43.3% -1.7% -44.8% -78.3% -48.9% -26.1% 68.1% -53.4% 101.3% 193.9%
Trial -45.6% -77.5% -43.9% -1.6% -74.6% -94.4% -80.2% -52.2% -53.3% -76.4% -65.4% -44.6% -8.7% -69.0% -40.3% 24.2%
Misc Deals 7.3% -3.2% 27.1% 49.9% -12.3% -66.8% -6.4% 51.4% -18.3% -52.5% -30.5% 2.1% 53.6% -100.0% -8.9% 178.8%
iPad 37.3% -35.6% 42.7% 97.0% 19.4% -76.2% -17.3% 51.3% -13.1% -70.5% -46.1% 9.1% 16.9% -45.5% -19.4% 88.6%
B2C PUBLISHING

For email marketing that delivers results: +44 (0)1865 242425 www.adestra.com [email protected]
2013 Adestra Email Subject Line Analysis 30
B2B EVENTSObjective Keyword Open rate variance vs. average Click rate variance vs. average Click to open rate variance vs. average Unsubscribe rate variance vs. average
Mean 1st Quartile Median 3rd Quartile Mean 1st Quartile Median 3rd Quartile Mean 1st Quartile Median 3rd Quartile Mean 1st Quartile Median 3rd Quartile
Product Conference -1.4% -23.6% -2.3% 21.2% -7.4% -60.2% -28.1% 27.1% -6.1% -50.4% -20.9% 19.3% 0.2% -100.0% -55.1% 4.2%
Course -5.9% -25.5% -11.5% 6.6% -14.8% -66.9% -41.0% 6.8% -9.5% -56.8% -31.1% 6.2% -16.8% -100.0% -34.0% 17.9%
Exhibition -8.2% -31.0% 4.6% 36.8% -1.4% -57.1% -15.7% 56.5% 7.5% -50.0% -8.5% 55.9% 9.6% -66.1% -30.6% 31.7%
Expo -3.8% -18.8% 0.8% 22.5% -1.8% -59.3% -24.2% 44.0% 2.1% -56.0% -22.3% 32.4% 49.8% -68.8% -17.3% 56.9%
Forum -11.6% -25.7% -10.5% 7.9% -49.9% -70.6% -49.5% -9.6% -43.3% -63.5% -41.2% -4.2% -22.1% -100.0% -51.3% -8.5%
Seminar 0.1% -20.0% -5.4% 30.0% -19.0% -60.0% -25.5% 21.1% -19.0% -56.8% -27.1% 7.4% 69.4% -64.6% -13.6% 69.9%
Summit 8.0% -17.6% 1.0% 26.3% -28.5% -64.4% -40.9% -1.8% -33.8% -64.8% -35.4% -2.3% 2.1% -75.7% -47.7% 10.0%
Training -10.1% -27.3% -16.3% 0.8% -21.9% -66.1% -41.8% 6.9% -13.1% -57.0% -30.6% 15.4% -24.8% -100.0% -44.5% 15.8%
Webinar -3.1% -23.4% -8.6% 11.3% -28.3% -72.4% -47.8% -0.3% -26.0% -64.5% -41.6% -1.1% -19.2% -84.9% -56.3% -9.7%
Money $ 18.5% -11.2% 12.7% 50.1% 49.4% -43.7% 9.9% 104.6% 26.0% -40.0% -2.7% 56.7% 72.0% -71.5% -28.6% 44.1%
£ 1.0% -29.4% -1.5% 31.9% 27.4% -70.2% -31.6% 86.3% 26.1% -68.2% -29.0% 86.1% -15.9% -76.3% -53.5% 4.3%
€ 0.7% -25.0% -7.1% 24.3% -13.9% -69.4% -40.6% 13.4% -14.4% -64.4% -36.9% 9.1% -10.8% -81.3% -53.4% -1.6%
Discounts Discount -10.9% -27.8% -16.6% 1.1% -37.1% -73.8% -56.9% -22.0% -29.3% -63.7% -46.2% -23.3% -18.0% -91.0% -49.4% 9.3%
Early bird -4.7% -23.4% -5.7% 17.2% -40.5% -69.1% -44.4% -14.2% -37.5% -62.9% -40.8% -11.5% -6.4% -88.8% -52.2% -13.4%
Free -3.0% -25.6% -2.6% 30.3% 3.7% -63.9% -15.0% 77.8% 6.9% -54.4% -13.3% 66.7% 35.7% -70.3% -23.5% 49.2%
Offer -13.1% -30.0% -13.6% 10.3% -30.8% -76.5% -56.8% -16.9% -20.3% -70.7% -42.8% -10.2% 6.4% -90.8% -45.2% 5.9%
Save -5.7% -27.5% -6.2% 17.5% -32.4% -69.1% -47.0% -9.6% -28.4% -64.3% -41.5% -8.0% -22.6% -84.7% -44.4% 4.3%
Saving -23.5% -42.1% -17.1% 15.5% -23.7% -74.3% -48.3% -13.1% -0.3% -65.1% -42.8% -10.9% 92.5% -74.0% -49.4% 4.2%
Urgency Countdown -2.6% -33.0% -10.9% 6.4% -18.2% -68.0% -47.2% 9.1% -16.1% -61.4% -33.9% 5.3% -37.4% -100.0% -25.6% -1.1%
Don't forget 9.5% -21.2% 10.5% 46.9% 77.0% -56.1% -22.9% 76.1% 61.6% -48.2% 2.3% 77.0% -37.6% -76.8% -44.9% 47.8%
Don't miss 6.3% -20.3% -2.6% 27.2% 40.0% -64.8% -42.7% 34.7% 31.7% -59.1% -32.5% 18.9% 9.4% -63.8% -24.1% 45.3%
Last chance -10.1% -32.4% -14.6% 9.8% -43.0% -76.1% -58.6% -22.8% -36.6% -71.2% -51.4% -11.9% -26.4% -79.7% -52.3% 2.6%
To go -0.6% -21.0% -2.0% 17.7% -19.0% -66.6% -41.7% 1.8% -18.4% -62.3% -34.2% 3.9% -12.2% -66.6% -25.0% 18.7%
Features Agenda -2.9% -22.5% -1.4% 18.2% -21.0% -59.9% -23.6% 37.1% -18.6% -52.0% -20.2% 23.8% -6.8% -91.9% -53.4% 6.6%

2013 Adestra Email Subject Line Analysis 31
Objective Keyword Open rate variance vs. average Click rate variance vs. average Click to open rate variance vs. average Unsubscribe rate variance vs. average
Mean 1st Quartile Median 3rd Quartile Mean 1st Quartile Median 3rd Quartile Mean 1st Quartile Median 3rd Quartile Mean 1st Quartile Median 3rd Quartile
Features Brochure -0.4% -20.2% -1.8% 18.9% 9.7% -38.3% -1.0% 50.6% 10.2% -29.5% 2.1% 52.6% -26.2% -100.0% -63.9% -5.6%
Cpd 17.4% -19.2% 2.3% 53.3% 31.7% -43.5% -3.7% 72.5% 12.2% -37.2% -1.2% 58.8% 11.5% -66.2% -36.1% 30.0%
Exhibitor -6.3% -20.2% 7.0% 36.9% 7.1% -44.4% 10.9% 68.4% 14.3% -40.2% 1.8% 56.2% 29.2% -27.8% 8.4% 125.9%
Industry -4.7% -24.1% -2.4% 24.1% -11.4% -56.2% -26.6% 23.7% -7.0% -51.2% -22.3% 24.7% -0.3% -69.5% -31.1% 15.0%
Keynote -15.3% -33.8% -14.4% 6.9% -40.9% -63.0% -49.1% -17.1% -30.2% -53.0% -31.5% -6.4% 5.8% -100.0% -58.4% 18.0%
New 1.7% -26.4% -4.9% 22.5% -6.1% -65.4% -34.9% 29.7% -7.7% -59.1% -27.1% 22.5% 2.1% -75.8% -33.8% 28.9%
Programme 1.6% -23.5% 3.3% 29.3% -3.6% -60.3% -12.7% 47.0% -5.2% -54.5% -16.3% 40.3% 44.6% -75.3% -25.9% 49.0%
Speakers -1.4% -20.4% -3.9% 16.8% -36.8% -62.3% -38.8% 1.1% -35.9% -61.2% -36.2% -1.3% 17.2% -79.3% -44.0% 39.0%
Benefits Exclusive 1.5% -17.2% 5.3% 33.2% 6.6% -61.1% -22.8% 68.3% 5.0% -51.8% -25.8% 42.1% 0.1% -76.1% -40.7% 15.5%
Ideas -5.5% -28.8% -6.1% 10.3% -11.8% -62.0% -30.4% 25.4% -6.6% -42.2% -20.6% 12.1% 263.4% -26.4% 34.2% 236.1%
Important 24.8% -21.7% 8.2% 68.9% 49.9% -73.2% -39.1% 102.2% 20.0% -65.0% -40.2% 27.2% 16.8% -72.9% -39.4% 29.1%
Innovation 15.0% -17.5% 4.5% 43.2% -5.0% -57.9% -20.7% 36.6% -17.4% -53.6% -25.7% 11.5% 58.2% -81.6% -12.9% 64.9%
Learn -18.8% -40.2% -23.7% -3.9% -31.1% -70.0% -47.9% -7.0% -15.1% -57.0% -25.8% 22.9% 6.2% -72.4% -33.8% 35.8%
ROI 9.3% -20.1% 7.3% 51.8% 42.7% -95.7% -52.0% 177.6% 30.5% -95.8% -54.7% 119.0% -29.9% -88.2% -77.9% -7.8%
Call to action Attend -2.8% -22.7% -4.5% 22.4% -10.8% -60.9% -32.0% 14.9% -8.3% -51.6% -26.8% 13.5% -23.7% -89.8% -56.1% -2.8%
Badge 15.6% -21.0% 19.8% 100.9% 67.5% -48.2% 78.5% 261.8% 44.9% -37.7% 17.8% 97.3% 63.3% -37.2% 12.7% 59.5%
Download 10.0% -14.0% 7.0% 22.1% 77.4% -33.9% 20.8% 104.8% 61.3% -28.0% 21.2% 98.7% -31.3% -70.3% -53.4% 2.6%
Invitation 18.1% -7.3% 12.2% 37.7% 37.9% -45.1% 3.1% 68.7% 16.8% -44.0% -11.5% 39.9% 41.8% -77.0% -40.5% 48.5%
Register -1.6% -26.3% -5.7% 22.2% 1.3% -64.5% -31.0% 27.1% 3.0% -56.9% -22.8% 24.4% -3.8% -74.3% -43.2% 9.2%
Registration 9.2% -21.6% 4.4% 34.5% 48.1% -41.4% 3.1% 89.5% 35.7% -31.3% 2.7% 63.4% 50.8% -62.8% -14.3% 68.8%
Misc ~? -0.6% -27.1% -6.2% 26.7% -14.7% -72.3% -39.8% 19.7% -14.2% -67.2% -37.5% 11.1% 22.6% -76.0% -38.4% 32.1%
! 5.1% -18.8% -0.6% 28.3% -3.9% -68.3% -36.4% 20.7% -8.6% -65.5% -34.1% 11.3% 18.3% -67.4% -28.2% 33.6%
$AMF_ 21.8% -7.4% 18.0% 65.2% 44.9% -39.8% 12.1% 104.2% 18.9% -39.7% -4.5% 50.0% 102.0% -62.8% -14.1% 64.7%
Free Stuff Game -3.8% -27.4% -9.9% 15.1% -45.0% -81.7% -72.9% 7.1% -42.8% -80.6% -69.7% -16.0% 23.7% -47.9% -20.0% 111.9%
iPad 1.9% -28.6% -1.3% 52.8% 17.5% -84.9% -23.9% 76.4% 15.2% -81.8% -22.1% 78.4% 37.4% -87.8% -22.7% 74.3%
Kindle -15.5% -33.3% -27.0% 53.1% -47.8% -100.0% -99.2% -25.0% -38.3% -100.0% -98.7% -18.6% -19.9% -85.1% -73.7% 81.0%
LinkedIn -8.9% -44.3% -8.1% 29.6% 30.9% -59.8% -17.5% 97.1% 43.7% -44.9% 3.1% 174.2% -25.1% -100.0% -83.7% -66.1%
Win -4.1% -29.1% -6.7% 30.9% 30.7% -70.4% -28.5% 71.1% 36.4% -62.6% -18.0% 51.3% -10.3% -80.5% -44.0% 2.6%
B2B EVENTS

For email marketing that delivers results: +44 (0)1865 242425 www.adestra.com [email protected]
2013 Adestra Email Subject Line Analysis 32
B2C EVENTSObjective Keyword Open rate variance vs. average Click rate variance vs. average Click to open rate variance vs. average Unsubscribe rate variance vs. average
Mean 1st Quartile Median 3rd Quartile Mean 1st Quartile Median 3rd Quartile Mean 1st Quartile Median 3rd Quartile Mean 1st Quartile Median 3rd Quartile
Product Fair 22.4% -5.5% 41.2% 67.5% -17.4% -46.8% -22.7% 40.6% -32.5% -48.0% -37.6% -22.2% 119.2% 64.8% 105.0% 137.2%
Fest 27.1% -42.8% 16.3% 25.7% -31.1% -68.7% -28.1% -11.4% -45.8% -52.1% -23.8% 3.9% 95.0% -22.5% 72.6% 77.3%
Show 20.7% -13.3% 16.3% 57.2% -41.2% -73.1% -55.3% -25.8% -51.3% -73.6% -58.2% -42.1% 64.8% 24.1% 70.2% 117.5%
Money $ 25.5% 6.3% 47.6% 238.3% -74.9% -87.0% -66.8% -48.1% -80.0% -89.9% -84.7% -77.0% 81.6% 27.9% 116.1% 404.7%
£ 14.6% -15.6% 12.9% 34.3% -43.6% -70.6% -54.3% 4.3% -50.8% -67.4% -52.2% -7.5% 59.4% 13.2% 49.5% 100.1%
€ 5.2% -7.6% 7.3% 16.2% -42.3% -73.2% -29.3% -8.3% -45.1% -72.3% -32.4% -4.1% 111.8% 27.1% 139.9% 420.0%
Ticket sales 2 for 1 30.2% 17.8% 29.3% 44.2% -53.8% -66.3% -54.1% -43.9% -64.5% -72.9% -66.5% -60.0% 108.2% 69.3% 118.7% 128.7%
Cheap 63.2% 58.0% 58.1% 95.6% -11.0% -23.6% -11.6% 36.9% -45.5% -49.7% -44.0% -30.0% 82.1% 45.5% 111.3% 146.2%
Discount 12.9% -66.7% -1.4% 42.2% -64.4% -87.7% -66.8% -17.5% -68.4% -71.4% -64.9% -28.5% 72.1% -63.5% 19.5% 99.6%
Early bird 7.3% -12.2% 0.7% 35.7% -50.5% -72.9% -52.8% -28.2% -53.9% -68.2% -57.4% -22.4% 154.0% 49.0% 128.7% 245.0%
Free 8.7% -53.5% -37.6% 15.2% -66.4% -87.1% -77.7% -52.3% -69.1% -75.7% -66.2% -49.2% 85.8% 5.5% 60.3% 147.8%
Offer 17.3% -27.3% 2.1% 28.7% -46.1% -81.0% -62.9% -37.0% -54.1% -70.1% -60.3% -45.7% 145.8% 28.1% 98.5% 166.5%
Save -3.4% -27.8% -6.7% 20.0% -65.5% -77.0% -56.3% -36.0% -64.3% -72.5% -42.8% -31.2% 91.0% -0.6% 17.5% 116.3%
Tickets 23.0% -0.6% 18.5% 58.0% -42.8% -65.3% -46.8% -8.2% -53.5% -67.4% -54.8% -21.7% 72.9% 29.2% 78.6% 120.7%
Show features Advice -19.4% -30.5% -14.1% 15.9% -78.3% -82.1% -78.5% -74.5% -73.1% -79.2% -75.1% -60.9% 32.3% 11.9% 105.6% 187.5%
Exclusive 22.6% -20.0% 28.7% 45.4% -57.5% -71.2% -55.8% -38.8% -65.4% -70.6% -64.9% -50.2% 152.3% 53.6% 108.3% 197.1%
Explore 19.3% -32.4% 18.2% 23.3% -52.6% -88.6% -53.9% -49.3% -60.3% -83.1% -61.0% -58.9% 54.7% 66.2% 72.8% 133.9%
Live 1.5% -35.0% -2.2% 25.2% -64.4% -82.7% -73.3% -51.8% -64.9% -78.1% -69.6% -53.5% 92.3% -4.9% 84.9% 159.0%
Preview 33.3% 26.0% 57.2% 314.2% 15.0% -2.4% 5.7% 1038.2% -13.7% -36.5% -16.1% 174.8% 38.7% 41.0% 73.8% 195.5%
Program 10.5% -28.1% -18.0% 39.4% -51.2% -90.1% -72.7% -14.2% -55.8% -80.4% -70.7% -37.1% 56.6% 11.5% 121.6% 190.8%
Reasons 25.1% -27.3% 39.3% 79.4% -41.2% -62.4% -46.2% 2.8% -53.0% -63.0% -55.8% -42.7% 55.7% 16.8% 31.2% 185.7%
Win 26.2% -5.5% 41.4% 76.1% 9.0% -36.4% -4.3% 68.1% -13.6% -45.6% -32.5% 18.1% 100.8% 45.5% 116.3% 137.2%
Urgency Don't miss -5.7% -39.7% -14.1% 44.7% -65.6% -83.3% -65.6% -51.7% -63.5% -75.5% -62.1% -56.3% 87.0% 31.8% 55.8% 87.8%
Ends 2.2% -27.9% -6.2% 20.0% -60.1% -77.7% -63.3% -30.7% -61.0% -68.6% -60.5% -36.8% 83.3% 56.8% 134.9% 174.9%

For email marketing that delivers results: +44 (0)1865 242425 www.adestra.com [email protected]
2013 Adestra Email Subject Line Analysis 33
Objective Keyword Open rate variance vs. average Click rate variance vs. average Click to open rate variance vs. average Unsubscribe rate variance vs. average
Mean 1st Quartile Median 3rd Quartile Mean 1st Quartile Median 3rd Quartile Mean 1st Quartile Median 3rd Quartile Mean 1st Quartile Median 3rd Quartile
Urgency Final 13.7% -26.0% -13.9% 10.4% 119.0% -88.6% -82.0% -18.7% 92.6% -89.2% -68.8% -8.5% 19.6% -35.2% 29.5% 59.8%
Last chance 16.8% -25.4% 2.6% 40.5% -51.2% -80.6% -63.9% -43.9% -58.2% -74.5% -67.9% -56.0% 49.3% -54.3% 13.2% 99.6%
Meet 23.7% 13.2% 43.5% 213.6% -38.9% -77.1% -52.6% 8.5% -50.6% -78.7% -63.2% -36.6% 72.0% 57.7% 125.1% 300.2%
Still time 25.9% 14.0% 29.3% 135.5% -58.5% -74.3% -62.4% -43.5% -67.1% -76.0% -72.9% -63.2% 68.4% 47.0% 69.3% 103.9%
To go 37.2% -16.9% 18.2% 57.2% -17.9% -77.4% -58.7% 53.5% -40.2% -77.9% -64.6% -26.4% 104.5% 59.0% 93.8% 189.0%
Call to action Buy 7.0% -37.6% 10.0% 18.5% -60.2% -87.1% -72.2% -61.0% -62.8% -75.7% -71.4% -64.6% 89.5% 43.0% 63.8% 90.7%
Come 16.5% -40.1% -5.4% 35.2% -67.5% -82.3% -62.6% -48.7% -72.1% -75.0% -68.2% -54.0% 1.5% -7.5% -4.2% 19.9%
Invit 41.6% -1.4% 40.5% 56.3% -40.6% -62.1% -53.6% -10.5% -58.0% -71.7% -61.6% -37.9% 193.9% 143.6% 197.1% 395.7%
Opens 16.1% -5.7% 23.8% 56.3% -36.8% -71.0% -51.6% 20.4% -45.6% -70.8% -57.3% -20.9% 54.0% 28.6% 78.6% 175.4%
Register 56.6% 47.1% 66.0% 78.8% -0.8% -28.8% -4.3% 35.1% -36.7% -51.6% -38.4% -24.5% 93.7% 32.1% 89.2% 136.5%
Tickets 23.0% -0.6% 18.5% 58.0% -42.8% -65.3% -46.8% -8.2% -53.5% -67.4% -54.8% -21.7% 72.9% 29.2% 78.6% 120.7%
Visit 28.0% 16.3% 35.3% 79.4% -33.0% -66.1% -38.4% 180.1% -47.7% -68.3% -48.3% 70.3% 82.0% 2.5% 54.0% 195.5%
Misc $AMF_ 25.5% 6.3% 47.6% 238.3% -74.9% -87.0% -66.8% -48.1% -80.0% -89.9% -84.7% -77.0% 81.6% 27.9% 116.1% 404.7%
! 24.6% -13.3% 18.0% 58.1% -28.2% -73.2% -46.8% -7.5% -42.4% -72.5% -56.4% -32.4% 74.5% 15.1% 68.2% 125.9%
~? 6.4% -25.9% -13.4% 44.3% -49.2% -81.4% -69.7% -34.6% -52.2% -80.3% -63.4% -39.2% 68.0% 12.8% 71.4% 133.0%
B2C EVENTS

For email marketing that delivers results: +44 (0)1865 242425 www.adestra.com [email protected]
2013 Adestra Email Subject Line Analysis 34
RETAILObjective Keyword Open rate variance vs. average Click rate variance vs. average Click to open rate variance vs. average Unsubscribe rate variance vs. average
Mean 1st Quartile Median 3rd Quartile Mean 1st Quartile Median 3rd Quartile Mean 1st Quartile Median 3rd Quartile Mean 1st Quartile Median 3rd Quartile
Incentives % off 6.1% -15.2% 11.8% 43.2% 17.7% -43.5% 15.8% 83.5% 10.9% -43.5% 9.1% 53.4% 38.1% -30.7% 6.9% 76.5%
Cheap -67.2% -66.4% -41.9% -30.3% -71.6% -95.3% -34.2% -9.3% -13.3% -81.8% 10.5% 40.5% -34.6% -56.8% -39.8% -13.9%
Deal -10.5% -40.1% 18.8% 105.0% 28.6% -60.1% -7.2% 211.9% 43.7% -35.2% 5.0% 87.3% 31.4% -67.2% -12.5% 139.7%
Free -23.7% -47.5% 1.2% 62.0% -34.8% -78.3% -22.8% 80.5% -14.6% -62.8% -13.0% 32.5% 32.4% -70.2% -33.2% 59.6%
Half price 11.5% -1.0% 13.9% 30.5% -21.3% -66.8% -31.5% 23.0% -29.4% -66.7% -40.0% 0.6% 29.8% -20.4% 28.7% 80.7%
Only 7.1% -12.9% 10.1% 44.8% -27.7% -64.2% -27.8% 23.1% -32.5% -60.1% -39.8% 4.8% 17.3% -39.9% 12.5% 79.6%
Prize -13.8% -43.1% -22.2% 20.7% 14.4% -51.5% 0.4% 53.5% 32.7% -24.3% 12.1% 54.0% 5.2% -44.4% -19.6% 33.4%
Sale 10.7% -17.8% 12.2% 50.4% 26.7% -51.6% 21.0% 116.0% 14.4% -41.8% 10.3% 72.3% 75.0% -28.8% 19.4% 134.8%
Save -4.4% -14.5% 7.7% 59.8% -27.4% -64.6% -35.5% 46.1% -24.0% -63.7% -40.3% 27.2% 38.2% -51.0% -14.8% 99.2%
Savings -0.3% -29.4% -10.5% 18.6% -30.9% -65.3% -41.4% 17.5% -30.7% -58.8% -25.8% 18.6% 55.4% -30.8% 37.8% 156.6%
Voucher 6.4% -26.3% 1.0% 73.6% -22.7% -63.9% -21.6% 63.1% -27.3% -60.9% -33.7% 38.8% 19.4% -35.8% 11.5% 70.3%
Win -21.0% -35.6% -3.6% 54.1% -13.8% -55.1% -0.1% 68.4% 9.2% -48.7% -6.6% 49.1% 27.8% -53.9% -3.0% 96.2%
Calls to Action Buy -19.3% -40.3% 10.2% 87.0% -59.1% -78.7% -50.4% -3.9% -49.3% -68.5% -57.2% -33.7% 9.9% -36.8% 35.4% 155.3%
Get -39.8% -72.0% -33.9% 6.2% -59.7% -94.1% -72.2% -25.1% -33.2% -80.5% -56.5% -13.9% 8.2% -68.4% -26.2% 31.0%
Order 6.2% -18.2% 4.0% 41.6% -19.8% -52.2% -17.5% 34.9% -24.5% -51.9% -17.4% 10.3% 2.9% -100.0% -40.7% 30.7%
Own -12.7% -32.4% 4.0% 37.5% -44.1% -75.4% -44.3% 33.6% -36.0% -60.8% -43.7% 16.4% 43.1% -26.4% 72.8% 131.8%
Today -32.8% -72.7% -7.9% 21.3% -41.7% -87.9% -65.0% 0.0% -13.3% -65.2% -45.9% 1.7% -2.3% -65.8% -25.0% 22.1%
Events Birthday -6.1% -27.6% -11.6% 1.0% -36.6% -59.1% -44.9% -26.3% -32.4% -49.3% -37.5% -15.1% 11.4% -32.2% 1.4% 40.0%
Christmas -3.9% -24.1% -3.3% 26.2% -29.2% -77.7% -37.4% 19.4% -26.3% -74.5% -41.5% 6.5% 35.2% -44.0% 8.0% 118.1%
Holiday -26.3% -40.3% -20.3% 11.4% -51.6% -86.1% -46.0% 10.3% -34.3% -76.4% -34.6% 6.9% 88.2% -13.9% 45.3% 171.4%
Launch 0.3% -32.1% 3.2% 43.7% -30.1% -66.8% -38.5% 17.8% -30.3% -54.4% -34.5% 0.7% 1.0% -93.5% 52.8% 153.5%
Party 8.3% -11.0% 15.5% 42.2% -14.1% -67.8% -30.0% 25.4% -20.6% -62.7% -34.9% -2.9% 15.9% -29.0% 32.3% 204.4%
Summer -15.1% -38.9% -9.9% 15.7% -26.9% -71.1% -38.5% 10.3% -13.9% -49.1% -26.2% 16.0% 16.4% -43.2% 0.9% 139.4%
Valentines -7.8% -43.3% -35.3% 39.7% -17.2% -78.1% -73.0% 52.0% -10.2% -61.2% -59.2% 9.6% 327.0% 94.1% 133.0% 621.9%

For email marketing that delivers results: +44 (0)1865 242425 www.adestra.com [email protected]
2013 Adestra Email Subject Line Analysis 35
RETAILObjective Keyword Open rate variance vs. average Click rate variance vs. average Click to open rate variance vs. average Unsubscribe rate variance vs. average
Mean 1st Quartile Median 3rd Quartile Mean 1st Quartile Median 3rd Quartile Mean 1st Quartile Median 3rd Quartile Mean 1st Quartile Median 3rd Quartile
Benefits Available 28.3% 3.0% 30.4% 75.0% 8.3% -56.1% -4.8% 104.4% -15.6% -66.3% -25.7% 35.5% 47.0% -12.9% 57.5% 127.0%
Essential -15.1% -50.4% -21.6% 4.0% -32.7% -68.6% -49.7% -24.3% -20.8% -49.0% -34.4% -16.2% 31.9% -34.9% 15.6% 136.3%
Free delivery 35.9% -3.3% 29.0% 106.0% 81.3% -16.0% 37.9% 148.0% 33.4% -18.3% 6.0% 55.1% 107.0% -47.2% 1.5% 109.5%
Gift 0.9% -13.7% 5.2% 38.5% -26.1% -61.8% -28.7% 21.8% -26.8% -60.0% -28.2% 4.8% 33.0% -32.9% 12.7% 98.2%
Limited -38.7% -57.8% -14.9% 107.9% -71.7% -85.0% -54.5% 53.4% -53.8% -73.7% -54.2% -7.9% -3.7% -35.2% 7.2% 78.7%
New 23.2% -17.4% 14.8% 80.5% 10.2% -62.5% -4.0% 76.2% -10.5% -63.1% -27.1% 28.4% 32.0% -42.6% 0.9% 80.5%
Next day 10.5% -16.5% -3.5% 16.1% -53.1% -76.0% -69.5% -45.4% -57.5% -70.9% -64.9% -39.8% 31.8% -7.8% 15.5% 58.7%
Offer -3.3% -21.1% -1.5% 25.6% -41.2% -74.8% -49.3% -6.3% -39.2% -70.8% -48.1% -9.2% 34.6% -47.8% -9.8% 68.6%
VIP -0.2% -13.6% -5.1% 26.7% -16.1% -33.7% 0.1% 16.7% -15.9% -16.3% 6.3% 17.8% 107.4% 7.3% 52.0% 101.8%
Superlatives Great 14.7% -29.1% -3.5% 50.1% -9.6% -66.7% -32.2% 75.0% -21.2% -55.9% -34.2% -0.1% 47.1% -58.0% -11.6% 80.1%
Fantastic -12.5% -29.4% -10.5% 16.3% -48.4% -82.0% -71.2% -26.0% -41.1% -74.2% -64.6% -13.9% 7.9% -57.9% -20.6% 57.5%
Good -7.3% -54.8% -10.0% 21.0% -40.3% -83.6% -37.9% 7.9% -35.6% -63.8% -38.7% 10.4% 65.8% -54.0% 12.6% 118.6%
Exclusive -6.2% -57.9% 11.7% 65.5% -37.6% -83.9% -59.3% 15.4% -33.5% -70.9% -54.8% -19.1% 66.6% -56.2% -12.4% 96.8%
Exciting 36.3% -11.5% 14.8% 83.2% -11.0% -60.5% -13.4% 34.3% -34.7% -59.9% -52.8% 18.3% 95.3% -50.9% 150.6% 275.2%
Best -8.3% -29.5% -0.7% 59.6% -40.2% -63.0% -36.4% 15.3% -34.8% -61.9% -46.3% 12.3% -3.5% -43.9% -15.7% 49.5%
Latest 95.4% -0.7% 119.2% 151.5% -1.0% -64.0% -4.9% 25.4% -49.3% -61.4% -47.8% -22.1% 9.8% -48.1% -18.1% 38.6%
Golden -16.8% -38.5% -17.2% 2.0% 11.9% -58.2% -30.0% 83.4% 34.5% -45.5% 8.5% 77.6% -26.9% -100.0% -100.0% 110.2%
Really 5.2% -11.1% 2.6% 39.5% -21.4% -34.1% 1.2% 29.4% -25.3% -42.0% -9.2% 11.6% 16.2% -22.5% 34.7% 77.4%
Money £ -22.7% -60.2% -7.6% 49.4% -40.1% -90.3% -49.4% 44.3% -22.4% -73.8% -42.1% 18.5% 8.4% -68.1% -33.5% 57.0%
$ -43.0% -72.2% -39.3% 27.1% -49.9% -96.4% -77.4% 22.9% -12.1% -83.5% -50.1% 15.7% -2.9% -84.2% -39.2% 130.7%
€ 3.2% -20.3% 10.1% 63.8% -5.8% -62.8% -7.6% 85.8% -8.7% -60.3% -17.6% 38.8% 53.7% -46.1% -3.9% 78.5%
Misc $AMF_ -47.1% -78.4% -43.0% 24.7% -57.0% -97.6% -88.2% -12.7% -18.7% -87.1% -73.3% -9.4% -0.9% -76.2% -29.8% 177.3%
Facebook 34.1% 23.8% 35.5% 70.9% 61.9% -15.2% 75.3% 176.4% 20.8% -24.3% 6.1% 99.3% 39.0% -100.0% -100.0% 23.5%
iPad -7.7% -37.7% -7.7% 63.0% -37.5% -89.9% -30.5% 63.6% -32.3% -66.1% -43.8% 8.8% 107.8% -36.3% 25.4% 188.8%
iPhone -68.2% -83.5% -63.0% -44.0% -84.1% -91.3% -85.0% -79.9% -50.0% -64.0% -50.3% -35.4% -38.0% -59.5% -35.6% -3.8%
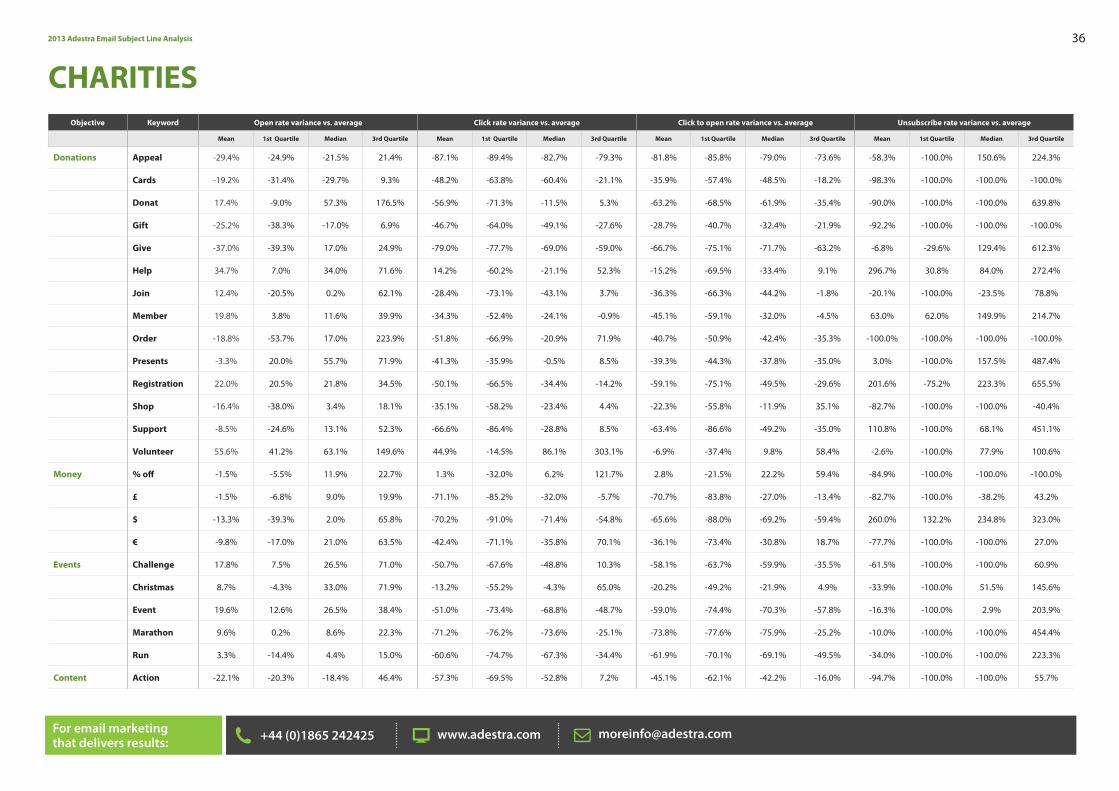
For email marketing that delivers results: +44 (0)1865 242425 www.adestra.com [email protected]
2013 Adestra Email Subject Line Analysis 36
CHARITIESObjective Keyword Open rate variance vs. average Click rate variance vs. average Click to open rate variance vs. average Unsubscribe rate variance vs. average
Mean 1st Quartile Median 3rd Quartile Mean 1st Quartile Median 3rd Quartile Mean 1st Quartile Median 3rd Quartile Mean 1st Quartile Median 3rd Quartile
Donations Appeal -29.4% -24.9% -21.5% 21.4% -87.1% -89.4% -82.7% -79.3% -81.8% -85.8% -79.0% -73.6% -58.3% -100.0% 150.6% 224.3%
Cards -19.2% -31.4% -29.7% 9.3% -48.2% -63.8% -60.4% -21.1% -35.9% -57.4% -48.5% -18.2% -98.3% -100.0% -100.0% -100.0%
Donat 17.4% -9.0% 57.3% 176.5% -56.9% -71.3% -11.5% 5.3% -63.2% -68.5% -61.9% -35.4% -90.0% -100.0% -100.0% 639.8%
Gift -25.2% -38.3% -17.0% 6.9% -46.7% -64.0% -49.1% -27.6% -28.7% -40.7% -32.4% -21.9% -92.2% -100.0% -100.0% -100.0%
Give -37.0% -39.3% 17.0% 24.9% -79.0% -77.7% -69.0% -59.0% -66.7% -75.1% -71.7% -63.2% -6.8% -29.6% 129.4% 612.3%
Help 34.7% 7.0% 34.0% 71.6% 14.2% -60.2% -21.1% 52.3% -15.2% -69.5% -33.4% 9.1% 296.7% 30.8% 84.0% 272.4%
Join 12.4% -20.5% 0.2% 62.1% -28.4% -73.1% -43.1% 3.7% -36.3% -66.3% -44.2% -1.8% -20.1% -100.0% -23.5% 78.8%
Member 19.8% 3.8% 11.6% 39.9% -34.3% -52.4% -24.1% -0.9% -45.1% -59.1% -32.0% -4.5% 63.0% 62.0% 149.9% 214.7%
Order -18.8% -53.7% 17.0% 223.9% -51.8% -66.9% -20.9% 71.9% -40.7% -50.9% -42.4% -35.3% -100.0% -100.0% -100.0% -100.0%
Presents -3.3% 20.0% 55.7% 71.9% -41.3% -35.9% -0.5% 8.5% -39.3% -44.3% -37.8% -35.0% 3.0% -100.0% 157.5% 487.4%
Registration 22.0% 20.5% 21.8% 34.5% -50.1% -66.5% -34.4% -14.2% -59.1% -75.1% -49.5% -29.6% 201.6% -75.2% 223.3% 655.5%
Shop -16.4% -38.0% 3.4% 18.1% -35.1% -58.2% -23.4% 4.4% -22.3% -55.8% -11.9% 35.1% -82.7% -100.0% -100.0% -40.4%
Support -8.5% -24.6% 13.1% 52.3% -66.6% -86.4% -28.8% 8.5% -63.4% -86.6% -49.2% -35.0% 110.8% -100.0% 68.1% 451.1%
Volunteer 55.6% 41.2% 63.1% 149.6% 44.9% -14.5% 86.1% 303.1% -6.9% -37.4% 9.8% 58.4% -2.6% -100.0% 77.9% 100.6%
Money % off -1.5% -5.5% 11.9% 22.7% 1.3% -32.0% 6.2% 121.7% 2.8% -21.5% 22.2% 59.4% -84.9% -100.0% -100.0% -100.0%
£ -1.5% -6.8% 9.0% 19.9% -71.1% -85.2% -32.0% -5.7% -70.7% -83.8% -27.0% -13.4% -82.7% -100.0% -38.2% 43.2%
$ -13.3% -39.3% 2.0% 65.8% -70.2% -91.0% -71.4% -54.8% -65.6% -88.0% -69.2% -59.4% 260.0% 132.2% 234.8% 323.0%
€ -9.8% -17.0% 21.0% 63.5% -42.4% -71.1% -35.8% 70.1% -36.1% -73.4% -30.8% 18.7% -77.7% -100.0% -100.0% 27.0%
Events Challenge 17.8% 7.5% 26.5% 71.0% -50.7% -67.6% -48.8% 10.3% -58.1% -63.7% -59.9% -35.5% -61.5% -100.0% -100.0% 60.9%
Christmas 8.7% -4.3% 33.0% 71.9% -13.2% -55.2% -4.3% 65.0% -20.2% -49.2% -21.9% 4.9% -33.9% -100.0% 51.5% 145.6%
Event 19.6% 12.6% 26.5% 38.4% -51.0% -73.4% -68.8% -48.7% -59.0% -74.4% -70.3% -57.8% -16.3% -100.0% 2.9% 203.9%
Marathon 9.6% 0.2% 8.6% 22.3% -71.2% -76.2% -73.6% -25.1% -73.8% -77.6% -75.9% -25.2% -10.0% -100.0% -100.0% 454.4%
Run 3.3% -14.4% 4.4% 15.0% -60.6% -74.7% -67.3% -34.4% -61.9% -70.1% -69.1% -49.5% -34.0% -100.0% -100.0% 223.3%
Content Action -22.1% -20.3% -18.4% 46.4% -57.3% -69.5% -52.8% 7.2% -45.1% -62.1% -42.2% -16.0% -94.7% -100.0% -100.0% 55.7%
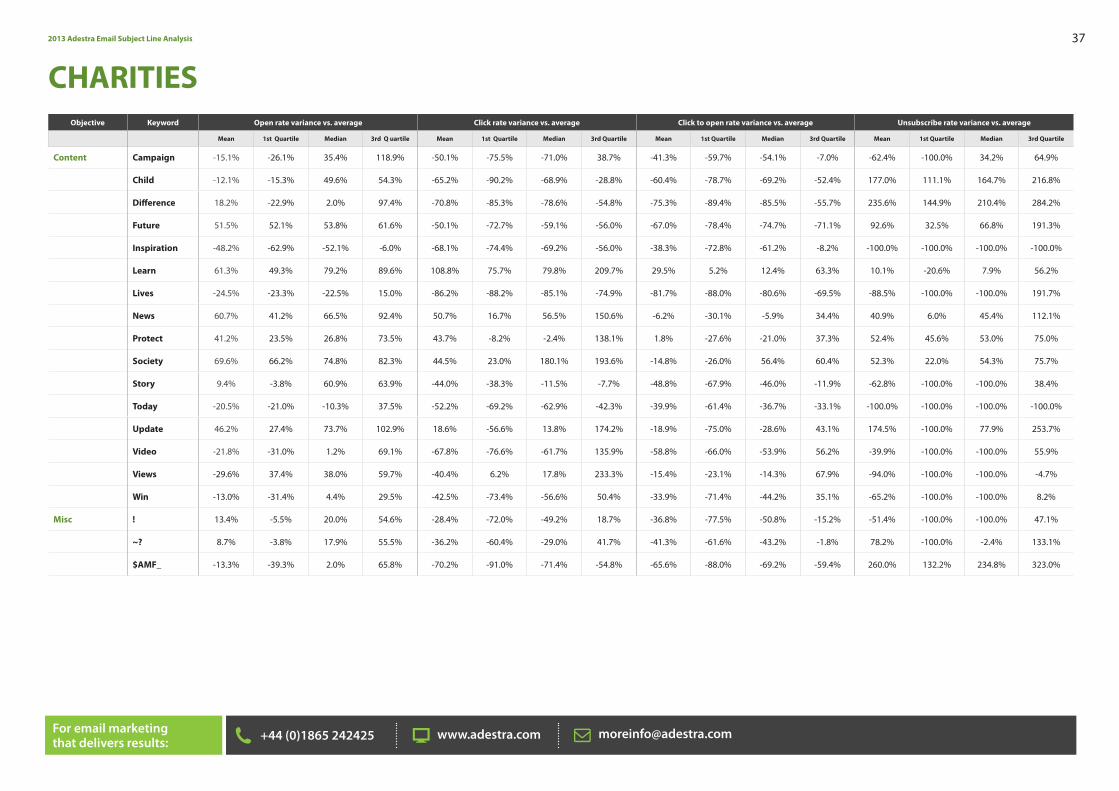
For email marketing that delivers results: +44 (0)1865 242425 www.adestra.com [email protected]
2013 Adestra Email Subject Line Analysis 37
CHARITIESObjective Keyword Open rate variance vs. average Click rate variance vs. average Click to open rate variance vs. average Unsubscribe rate variance vs. average
Mean 1st Quartile Median 3rd Q uartile Mean 1st Quartile Median 3rd Quartile Mean 1st Quartile Median 3rd Quartile Mean 1st Quartile Median 3rd Quartile
Content Campaign -15.1% -26.1% 35.4% 118.9% -50.1% -75.5% -71.0% 38.7% -41.3% -59.7% -54.1% -7.0% -62.4% -100.0% 34.2% 64.9%
Child -12.1% -15.3% 49.6% 54.3% -65.2% -90.2% -68.9% -28.8% -60.4% -78.7% -69.2% -52.4% 177.0% 111.1% 164.7% 216.8%
Difference 18.2% -22.9% 2.0% 97.4% -70.8% -85.3% -78.6% -54.8% -75.3% -89.4% -85.5% -55.7% 235.6% 144.9% 210.4% 284.2%
Future 51.5% 52.1% 53.8% 61.6% -50.1% -72.7% -59.1% -56.0% -67.0% -78.4% -74.7% -71.1% 92.6% 32.5% 66.8% 191.3%
Inspiration -48.2% -62.9% -52.1% -6.0% -68.1% -74.4% -69.2% -56.0% -38.3% -72.8% -61.2% -8.2% -100.0% -100.0% -100.0% -100.0%
Learn 61.3% 49.3% 79.2% 89.6% 108.8% 75.7% 79.8% 209.7% 29.5% 5.2% 12.4% 63.3% 10.1% -20.6% 7.9% 56.2%
Lives -24.5% -23.3% -22.5% 15.0% -86.2% -88.2% -85.1% -74.9% -81.7% -88.0% -80.6% -69.5% -88.5% -100.0% -100.0% 191.7%
News 60.7% 41.2% 66.5% 92.4% 50.7% 16.7% 56.5% 150.6% -6.2% -30.1% -5.9% 34.4% 40.9% 6.0% 45.4% 112.1%
Protect 41.2% 23.5% 26.8% 73.5% 43.7% -8.2% -2.4% 138.1% 1.8% -27.6% -21.0% 37.3% 52.4% 45.6% 53.0% 75.0%
Society 69.6% 66.2% 74.8% 82.3% 44.5% 23.0% 180.1% 193.6% -14.8% -26.0% 56.4% 60.4% 52.3% 22.0% 54.3% 75.7%
Story 9.4% -3.8% 60.9% 63.9% -44.0% -38.3% -11.5% -7.7% -48.8% -67.9% -46.0% -11.9% -62.8% -100.0% -100.0% 38.4%
Today -20.5% -21.0% -10.3% 37.5% -52.2% -69.2% -62.9% -42.3% -39.9% -61.4% -36.7% -33.1% -100.0% -100.0% -100.0% -100.0%
Update 46.2% 27.4% 73.7% 102.9% 18.6% -56.6% 13.8% 174.2% -18.9% -75.0% -28.6% 43.1% 174.5% -100.0% 77.9% 253.7%
Video -21.8% -31.0% 1.2% 69.1% -67.8% -76.6% -61.7% 135.9% -58.8% -66.0% -53.9% 56.2% -39.9% -100.0% -100.0% 55.9%
Views -29.6% 37.4% 38.0% 59.7% -40.4% 6.2% 17.8% 233.3% -15.4% -23.1% -14.3% 67.9% -94.0% -100.0% -100.0% -4.7%
Win -13.0% -31.4% 4.4% 29.5% -42.5% -73.4% -56.6% 50.4% -33.9% -71.4% -44.2% 35.1% -65.2% -100.0% -100.0% 8.2%
Misc ! 13.4% -5.5% 20.0% 54.6% -28.4% -72.0% -49.2% 18.7% -36.8% -77.5% -50.8% -15.2% -51.4% -100.0% -100.0% 47.1%
~? 8.7% -3.8% 17.9% 55.5% -36.2% -60.4% -29.0% 41.7% -41.3% -61.6% -43.2% -1.8% 78.2% -100.0% -2.4% 133.1%
$AMF_ -13.3% -39.3% 2.0% 65.8% -70.2% -91.0% -71.4% -54.8% -65.6% -88.0% -69.2% -59.4% 260.0% 132.2% 234.8% 323.0%