2013 annual report performance the following graph compares our cumulative total shareholder return...
TRANSCRIPT

2013 annual report

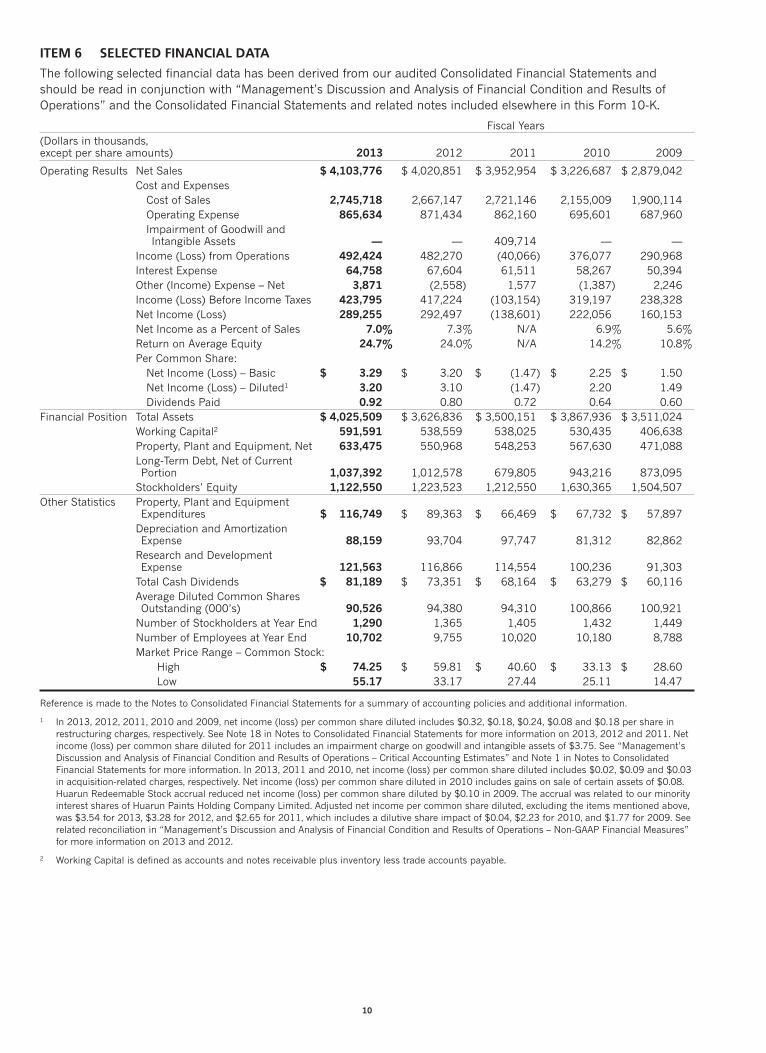
Stock performanceThe following graph compares our cumulative total shareholder return on common stock for the last fi ve fi scal years with the cumulative total return of the Standard & Poor’s 500 Stock Index and a peer group of companies selected by us on a line-of-business basis. The cumulative fi ve-year total return assumes the investment of $100 in our common stock, the S&P 500 Index and the Peer Group on October 31, 2008 and the reinvestment of all dividends.
Comparison of fi ve-year cumulative total return*
* The companies selected to form the Peer Group index are: Akzo Nobel N.V.; Ferro Corporation; H.B. Fuller Company; Masco Corporation; Newell Rubbermaid Inc.; PPG Industries, Inc.; RPM International Inc. and The Sherwin-Williams Company.
S&P 500 Valspar Peer Group
201320122011201020092008
$350
$300
$250
$200
$150
$100
$400 $380
$297
$203
About the cover Left to right: Our facility in Minerbio, Italy, produces general industrial coatings and is one of fi ve facilities acquired through the Inver Group acquisition in 2013.
Our Pipeclad 2000® protects pipelines throughout the world, including this pipe being delivered to the construction site of a new pipeline, which will deliver crude oil from the Bakken production area of North Dakota to a petroleum facility in Oklahoma.
expo
rt a
s sp
read
s

Building value through strong brands, innovation and global expansion
Dedication to customersValspar offers a broad product portfolio and operates
in over 25 countries around the world. Our customers
benefi t from our value-driven innovative solutions,
technical expertise and superior service. We are focused
on delivering new and differentiated technologies to
our customers.
Strong global brandsOur extensive brand portfolio, including Valspar, Cabot,
Huarun, Wattyl, Solver and Guardsman, is trusted by
consumers and businesses around the world to deliver
superior durability and performance. Valspar’s products
are backed by more than 200 years of experience.
Strategic acquisitions and investmentsOur market share is increasing, and we are continuing
to position Valspar for long-term global growth. The
purchase of Inver Group accelerates our growth in the
$6 billion European industrial coatings market. We
also acquired Ace Hardware’s U.S. paint assets and have
the opportunity to expand our brand into more than
3,000 Ace retail locations.
Leading-edge innovation and technologyValspar is a leader in coatings research and development.
Our state-of-the-art laboratories worldwide employ more
than 1,000 chemists and material scientists dedicated
to developing a broad range of high-performing and
durable consumer and industrial products.
We signifi cantly increased Valspar’s presence in the large European industrial coatings market with the acquisition of Inver Group.
manufacturer. Inver expands our geographic presence and increases our distribution capabilities in Europe and beyond. In our packaging product line, we won signifi cant new busi-ness in all of our geographies, particularly in the beverage can market. Our coil and wood product lines also delivered improved growth as we grew new business in 2013. Our general industrial product line faced a challenging market as customer demand declined in several product areas. Despite these near term headwinds, we won new business in this product line and are well positioned with customers as the market recovers.
Paints Our Paints segment results were strong in 2013, with net sales increasing 4 percent to $1.7 billion. We increased market share through several strategic initiatives and new business wins. The United States housing market continued to improve and investments in our brand fueled growth at retail partners like Lowe’s. We also launched an enhanced professional painter program at Lowe’s, including expanded product offerings for these customers. The strength of our brand and the high quality of our paint products helped us win signifi cant new business with the addition of Ace Hardware in 2013. In this partnership, we will supply all of Ace’s private label paint and expect to introduce Valspar-branded paint to over 3,000 Ace Hardware stores. In fi scal 2014, Valspar-branded paint products will be available in nearly 10,000 retail outlets throughout North America. Finally, following a successful testing period this year in B&Q, one of Europe’s leading home improvement retailers, we will distribute Valspar-branded products to 350 B&Q stores in the United Kingdom and Ireland in early 2014.
Geographically well-positionedValspar’s strategy of geographic diversity ensures that the company is well positioned for market fl uctuations around the world. This geographic diversity worked well in 2013 as
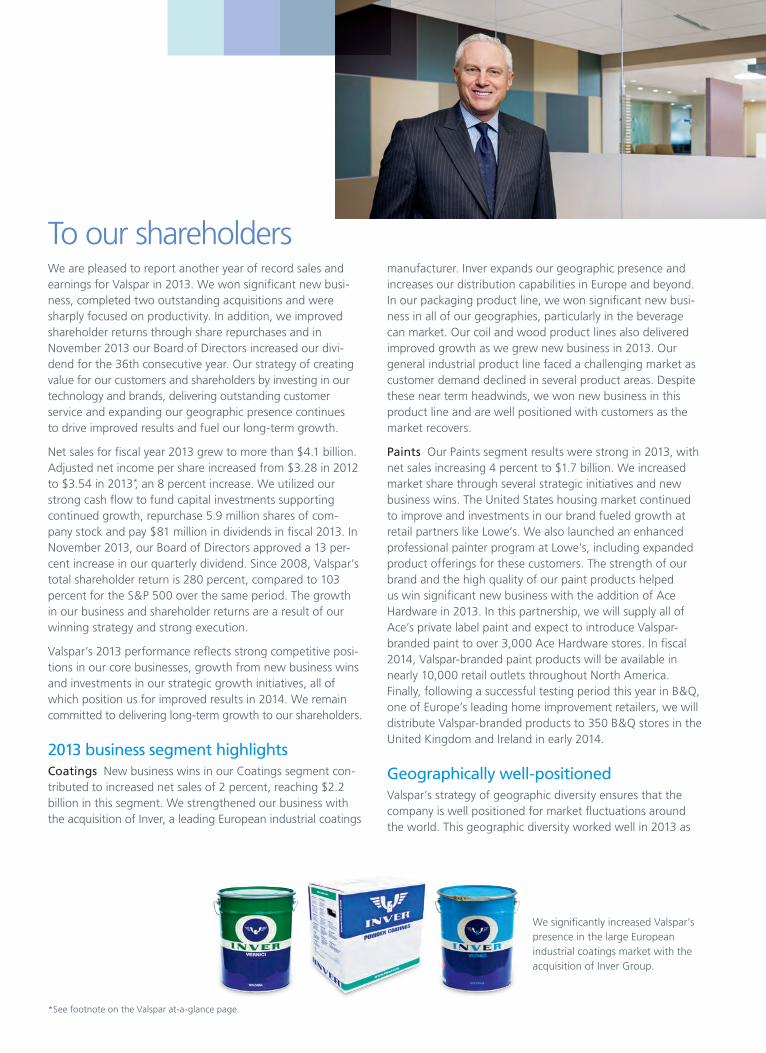
To our shareholdersWe are pleased to report another year of record sales and earnings for Valspar in 2013. We won signifi cant new busi-ness, completed two outstanding acquisitions and were sharply focused on productivity. In addition, we improved shareholder returns through share repurchases and in November 2013 our Board of Directors increased our divi-dend for the 36th consecutive year. Our strategy of creating value for our customers and shareholders by investing in our technology and brands, delivering outstanding customer service and expanding our geographic presence continues to drive improved results and fuel our long-term growth.
Net sales for fi scal year 2013 grew to more than $4.1 billion. Adjusted net income per share increased from $3.28 in 2012 to $3.54 in 2013*, an 8 percent increase. We utilized our strong cash fl ow to fund capital investments supporting continued growth, repurchase 5.9 million shares of com-pany stock and pay $81 million in dividends in fi scal 2013. In November 2013, our Board of Directors approved a 13 per-cent increase in our quarterly dividend. Since 2008, Valspar’s total shareholder return is 280 percent, compared to 103 percent for the S&P 500 over the same period. The growth in our business and shareholder returns are a result of our winning strategy and strong execution.
Valspar’s 2013 performance refl ects strong competitive posi-tions in our core businesses, growth from new business wins and investments in our strategic growth initiatives, all of which position us for improved results in 2014. We remain committed to delivering long-term growth to our shareholders.
2013 business segment highlightsCoatings New business wins in our Coatings segment con-tributed to increased net sales of 2 percent, reaching $2.2 billion in this segment. We strengthened our business with the acquisition of Inver, a leading European industrial coatings
* See footnote on the Valspar at-a-glance page.

our strong business performance in the United States offset softness in Europe and China. With the ebbs and fl ows in global markets, we remained fl exible, won new customers and took actions to improve the long term profi tability of our business.
Our business in North America, which accounts for more than half of our total sales, delivered strong sales and volume growth. All of our product lines won new business, and we drove sales growth in consumer paint, automotive, packag-ing, coil and wood. This growth refl ects improvements in the United States residential housing market and construction spending, coupled with our new business wins.
Supporting our communities, employees and the environmentThroughout 2013, we continued our support in the com-munities where we operate. Our partnership with Habitat for Humanity delivered the third year of the Valspar “Hearts & Hands for Habitat”, donating more than a quarter million gallons of paint to Habitat’s affi liates and other charitable organizations in 2013. Our employees also generously devoted their time to various Habitat programs.
With more than 10,000 employees in over 25 countries, the safety of our employees remains a top priority. Our outstand-ing safety record continued with another year-over-year improvement in workplace safety.
Our sustainability programs made progress toward better environmental stewardship in our facilities and delivering solutions to our customers that enable them to meet their environmental objectives. We have now replaced many of our solventborne products with waterborne products to improve performance, reduce energy consumption and lower emissions in the environment. For example, we recently
announced an agreement to provide our Aquaguard® water-borne coating for more sustainable shipping containers to Maersk, the world’s largest shipping container company.
Board of Directors transitionsAfter 21 years of service, Gregory R. Palen retired from our board in February. We thank Greg for his loyal and dedicated service and wish him the best. In April, Shane D. Fleming, chairman, president and chief executive offi cer of Cytec Industries, Inc., was elected to our Board of Directors. His global perspective and business insight will be a tremendous asset as we continue to expand our presence in global Paint and Coatings segments.
Outlook for continued growthLooking ahead, we expect stronger sales and earnings growth in fi scal 2014 driven by the benefi ts from the Inver acquisition, new business wins, and a continued focus on growing the business through each of our product lines.
Our focus on the long term has not changed. We remain committed to our strategy of creating value for our custom-ers and shareholders by investing in our technology and brands, delivering outstanding customer service and expand-ing our geographic presence.
Valspar’s global leadership position would not be possible without the dedication of our employees. I want to thank all of our employees for their passion for our business and their outstanding service to our customers.
As always, thank you for your support.
Gary E. HendricksonChairman and Chief Executive Offi cer
Like our chameleon friend, Jon, consumers are assured their perfect color choice through Valspar’s “Love Your Color Guarantee™.” Jon and his equally colorful wife, Val, starred in our playful integrated marketing campaign.
Two new Century Pearl products under the Huarun umbrella brand have been well received in China’s large and lucrative affordable housing segment.

Valspar at-a-glance
Net sales(Dollars in millions)
$3,953.0
2012
$4,020.9
2013
$4,103.8
2011
Adjusted net income percommon share – diluted1
(Dollars)
2011
$2.65
2012
$3.28
2013
$3.54
2011
16.8%
2012
22.2%
2013
21.3%
Adjusted pre-taxreturn on capital 2
(Percent)
Financial highlights
% Change % Change (Dollars in thousands, except per share amounts) 2013 from 2012 2012 from 2011
Net sales $4,103,776 2.1 $4,020,851 1.7
Income before income taxes $ 423,795 1.6 $ 417,224 504.5
Net income $ 289,255 (1.1) $ 292,497 311.0
Net income per common share – diluted $ 3.20 3.2 $ 3.10 310.9
Adjusted net income per common share – diluted1 $ 3.54 7.9 $ 3.28 23.8
Dividends per share $ 0.92 15.0 $ 0.80 11.1
Total assets $4,025,509 11.0 $3,626,836 3.6
Total debt $1,478,557 28.4 $1,151,109 8.9
Stockholders’ equity $1,122,550 (8.3) $1,223,523 0.9
Number of shares outstanding (year end) 85,793,957 (4.8) 90,165,805 (3.6)
1 In 2013, 2012, and 2011, net income (loss) per common share diluted includes $0.32, $0.18, and $0.24 per share in restructuring charges, respectively. See Note 18 in Notes to Consolidated Financial Statements for more information. Net income (loss) per common share diluted for 2011 includes an impairment charge on goodwill and intangible assets of $3.75. See “Management’s Discussion and Analysis of Financial Condition and Results of Operations – Critical Accounting Estimates” and Note 1 in Notes to Consolidated Financial Statements for more information. In 2013 and 2011, net income (loss) per common share diluted includes $0.02 and $0.09 in acquisition-related charges, respectively. Adjusted net income per common share diluted, excluding the items mentioned above, was $3.54 for 2013, $3.28 for 2012, and $2.65 for 2011, which includes a dilutive share impact of $0.04. See related reconciliation in “Management’s Discussion and Analysis of Financial Condition and Results of Operations – Non-GAAP Financial Measures” for more information on 2013 and 2012.
2 Adjusted pre-tax return on capital = Adjusted EBIT / ((Beginning of the year (Equity + Total debt – Total cash + Deferred income taxes) + End of the year (Equity + Total debt – Total cash + Deferred income taxes)) / 2). Adjusted EBIT has been determined by adjusting EBIT for the following: (i) pre-tax restructuring charges of $36,433, $25,845 and $34,439 in fiscal years 2013, 2012 and 2011, respectively; (ii) pre-tax acquisition-related charges of $2,242 and $13,275 in fiscal years 2013 and 2011, respectively; and (iii) a pre-tax impairment charge of $409,714 in fiscal year 2011.
2013 Net sales by segment(Dollars in billions)
Total $4.1 billion
Coatings $2.2 billion
Other
$0.2 billion
Paints
$1.7 billion
2013 Net sales by region(Percent)
North America
58%
Asia Pacific 23%
Europe
13%
Latin America
6%

Improving returns for shareholdersWe have consistently returned a portion of our cash generated from operations to shareholders through cash dividends and share repurchases. In 2013, we declared dividends totaling $0.92 per share, marking the 35th consecutive year we increased our dividend.
Share repurchases are another way of improving returns for shareholders. In 2013, we purchased 5.9 million shares on the open market. Over the past 10 years, we have reduced our average diluted common shares outstanding by 14.9 million shares.
Dividends per share
85 86 87 88 89 90 9179 80 81 82 83 84 92 93 94 95 96 97 98 99 00 01 02 03 04 05 06 07 08 09 10 11 12 13
$0.92$1.00
0.80
0.60
0.40
0.20
0.00
Share repurchases(millions of shares)
2004 2005 2006 2007 2008 2009 2010 2011 2012 2013
Average diluted common shares outstanding
105.4 104.2 102.7 102.6 100.3 100.9 100.9 94.3 94.4 90.5
0.2
3.5
0.6 0.6
1.9 2.0
4.0
6.8
5.8 5.9
Product lines
• Packaging coatings
Beverage cans Food cans Closures General packaging
• General industrial coatings
Heavy machinery Industrial fi nishes Protective coatings Shipping containers
• Coil coatings
Construction Appliances
• Wood coatings
Cabinetry
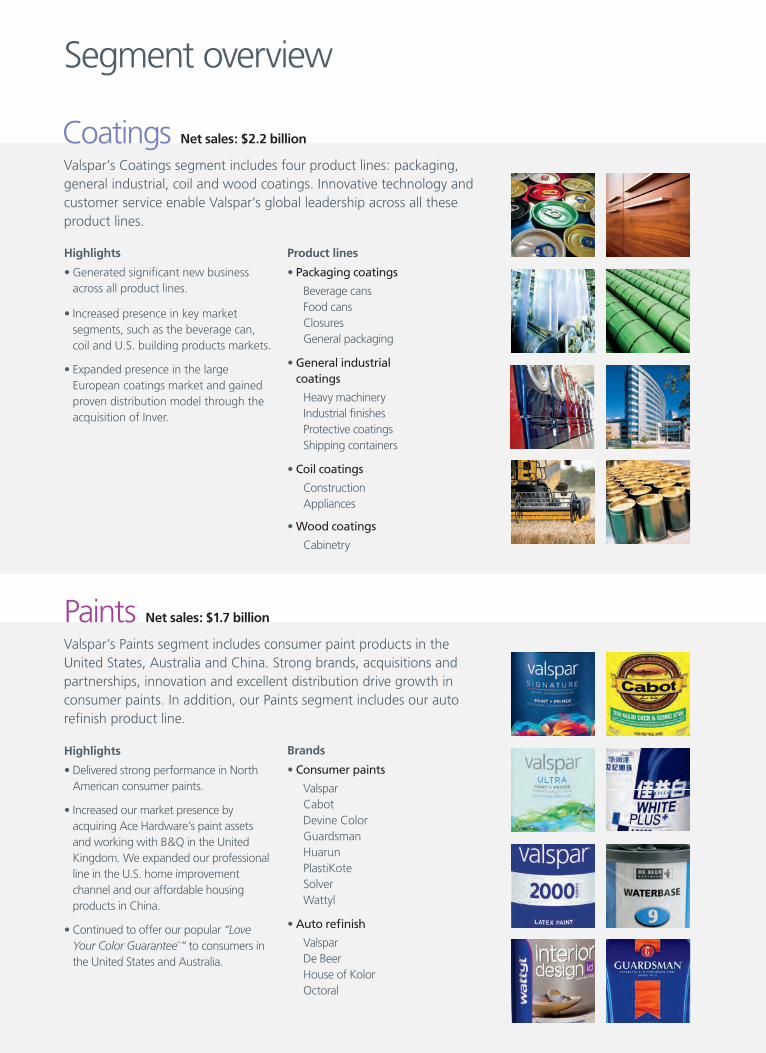
Coatings Net sales: $2.2 billion
Valspar’s Coatings segment includes four product lines: packaging, general industrial, coil and wood coatings. Innovative technology and customer service enable Valspar’s global leadership across all these product lines.
Highlights
• Generated signifi cant new business across all product lines.
• Increased presence in key market segments, such as the beverage can, coil and U.S. building products markets.
• Expanded presence in the large European coatings market and gained proven distribution model through the acquisition of Inver.
Brands
• Consumer paints
Valspar Cabot Devine Color Guardsman Huarun PlastiKote Solver Wattyl
• Auto refi nish
Valspar De Beer House of Kolor Octoral
Highlights
• Delivered strong performance in North American consumer paints.
• Increased our market presence by acquiring Ace Hardware’s paint assets and working with B&Q in the United Kingdom. We expanded our professional line in the U.S. home improvement channel and our affordable housing products in China.
• Continued to offer our popular “Love Your Color Guarantee™” to consumers in the United States and Australia.
Paints Net sales: $1.7 billion
Valspar’s Paints segment includes consumer paint products in the United States, Australia and China. Strong brands, acquisitions and partnerships, innovation and excellent distribution drive growth in consumer paints. In addition, our Paints segment includes our auto refi nish product line.
Segment overview

UNITED STATES SECURITIES AND EXCHANGE COMMISSIONWASHINGTON, D.C. 20549
FORM 10-K
(Mark One)
⌧ ANNUAL REPORT PURSUANT TO SECTION 13 OR 15(d) OF THE SECURITIES EXCHANGE ACT OF 1934For the fiscal year ended October 25, 2013
or
� TRANSITION REPORT PURSUANT TO SECTION 13 OR 15(d) OF THE SECURITIES EXCHANGE ACT OF 1934For the transition period from _______________________ to ___________________
Commission File Number 1-3011
THE VALSPAR CORPORATION(Exact name of registrant as specified in its charter)
Delaware 36-2443580(State of incorporation) (I.R.S. Employer Identification No.)
901 3rd Avenue SouthMinneapolis, Minnesota 55402
(Address of principal executive offices) (Zip Code)
Registrant’s telephone number, including area code: (612) 851-7000
Securities registered pursuant to Section 12(b) of the Act:
Title of Each Class Name of Each Exchange on which Registered
Common Stock, $.50 Par Value New York Stock Exchange
Securities registered pursuant to Section 12(g) of the Act: None
Indicate by check mark if the registrant is a well-known seasoned issuer, as defined in Rule 405 of the Securities Act.⌧ Yes � No
Indicate by check mark if the registrant is not required to file reports pursuant to Section 13 or Section 15(d) of theAct. � Yes ⌧ No
Indicate by check mark whether the registrant (1) has filed all reports required to be filed by Section 13 or 15(d) ofthe Securities Exchange Act of 1934 during the preceding 12 months (or for such shorter period that the registrantwas required to file such reports), and (2) has been subject to the filing requirements for the past 90 days.⌧ Yes � No
Indicate by check mark whether the registrant has submitted electronically and posted on its corporate Web site, ifany, every Interactive Data File required to be submitted and posted pursuant to Rule 405 of Regulation S-T(§232.405 of this chapter) during the preceding 12 months (or for such shorter period that the registrant wasrequired to submit and post such files). ⌧ Yes � No
Indicate by check mark if disclosure of delinquent filers pursuant to Item 405 of Regulation S-K is not containedherein, and will not be contained, to the best of registrant’s knowledge, in definitive proxy or information statementsincorporated by reference in Part III of this Form 10-K or any amendment to this Form 10-K. ⌧Indicate by check mark whether the registrant is a large accelerated filer, an accelerated filer, a non-accelerated filer,or a smaller reporting company. See definition of “large accelerated filer,” “accelerated filer” and “smaller reportingcompany” in Rule 12b-2 of the Exchange Act. (Check one):
Large accelerated filer ⌧ Accelerated filer � Non-accelerated filer � Smaller reporting company �Indicate by check mark whether the registrant is a shell company (as defined in Rule12b-2 of the Act). � Yes ⌧ No
The aggregate market value of the voting stock held by persons other than officers, directors and more than 10%stockholders of the registrant as of April 26, 2013 was approximately $3.9 billion based on the closing sales price of$63.58 per share as reported on the New York Stock Exchange. As of December 10, 2013, 85,401,609 shares ofCommon Stock, $0.50 par value per share (net of 33,041,015 shares in treasury), were outstanding.
DOCUMENTS INCORPORATED IN PART BY REFERENCE
Portions of The Valspar Corporation’s definitive Proxy Statement (the “Proxy Statement”), to be filed with theSecurities and Exchange Commission within 120 days after the end of the fiscal year ended October 25, 2013, areincorporated by reference into Part III to the extent described in this report.

(This page has been left blank intentionally.)

The Valspar CorporationForm 10-KTable of Contents
Page
PART I
Item 1. Business ................................................................................................................................................................................... 1
Item 1A. Risk Factors............................................................................................................................................................................. 3
Item 1B. Unresolved Staff Comments ........................................................................................................................................... 6
Item 2. Properties ................................................................................................................................................................................ 6
Item 3. Legal Proceedings................................................................................................................................................................ 7
Item 4. Mine Safety Disclosures .................................................................................................................................................... 7
PART II
Item 5. Market for Registrant’s Common Equity, Related Stockholder Matters and IssuerPurchases of Equity Securities....................................................................................................................................... 8
Item 6. Selected Financial Data ..................................................................................................................................................... 10
Item 7. Management’s Discussion and Analysis of Financial Condition and Results of Operations .............. 11
Item 7A. Quantitative and Qualitative Disclosures About Market Risk............................................................................ 22
Item 8. Financial Statements and Supplementary Data .................................................................................................... 23
Item 9. Changes in and Disagreements with Accountants on Accounting and Financial Disclosure ............ 52
Item 9A. Controls and Procedures .................................................................................................................................................. 52
Item 9B. Other Information ................................................................................................................................................................ 53
PART III
Item 10. Directors, Executive Officers and Corporate Governance................................................................................... 53
Item 11. Executive Compensation................................................................................................................................................... 53
Item 12. Security Ownership of Certain Beneficial Owners and Management and RelatedStockholder Matters............................................................................................................................................................ 53
Item 13. Certain Relationships and Related Transactions and Director Independence.......................................... 53
Item 14. Principal Accountant Fees and Services .................................................................................................................... 53
PART IV
Item 15. Exhibits and Financial Statement Schedules........................................................................................................... 54
Signatures................................................................................................................................................................................ 56

(This page has been left blank intentionally.)

PART IITEM 1 BUSINESS
BUSINESS & PRODUCT OVERVIEW
The Valspar Corporation is a global leader in the paintand coatings industry. With fiscal 2013 net sales of$4,103.8 million, we believe we are the fifth largest paintand coatings supplier in the world. We manufacture anddistribute a broad range of coatings, paints and relatedproducts, and we operate our business in two reportablesegments: Coatings and Paints. Net sales for our Coat-ings and Paints segments in 2013 were $2,209.5 millionand $1,671.2 million, respectively. We have grown ourbusiness internally and through acquisitions, focusing onthe needs of our customers and investing in our brandsand proprietary technology.
The Valspar Corporation is a Delaware corporation andwas founded in 1806. Our principal executive officesare located at 901 3rd Avenue South, Minneapolis,Minnesota 55402, and our telephone number at thataddress is (612) 851-7000. Our corporate websiteaddress is www.valsparglobal.com. The information onour website is not part of this filing.
Coatings Segment
Our Coatings segment includes our industrial productlines and our packaging product line. We offer a broadrange of decorative and protective coatings for metal,wood and plastic, primarily for sale to original equip-ment manufacturing (OEM) customers in Asia, Australia,Europe, North America and South America. Productswithin our Coatings segment include primers, top coats,varnishes, sprays, stains, fillers and other coatings usedby customers in a wide range of manufacturing indus-tries, including agricultural and construction equipment,appliances, building products, furniture, metal fabrica-tion, metal packaging and transportation.
We utilize a wide variety of technologies to providedifferentiated coatings that meet our customers’requirements and enable value creation within themarkets in which they are used. These technologiesinclude electrodeposition, powder, solvent-based, water-borne, UV curing and laser sintering. Our capability todesign and manufacture resins allows us to customizeproducts and provide leading solutions for a range ofmarket applications.
Our industrial product lines include coil, general indus-trial and wood. Our coil product line produces coatingsthat are applied to metal coils used to manufacture pre-engineered buildings and building components, othermetal building and architectural products and appli-ances. Our general industrial product line providescustomers a single source for powder, liquid and elec-trodeposition coatings technologies in a wide variety ofindustries, including agricultural and construction equip-ment, pipe, lawn and garden, appliance, transportation,and marine shipping containers. Our wood product line
supplies decorative and protective coatings for woodfurniture, building products, cabinets and floors. Wealso provide color design and technical service toour customers. We supply our industrial productsthroughout the world.
Our packaging product line includes coatings for theinterior and exterior of packaging containers, principallymetal food containers and beverage cans. We alsoproduce coatings for aerosol and paint cans, crowns forglass bottles, plastic packaging and bottle closures. Webelieve we are the world’s largest supplier of metal pack-aging coatings. We supply our packaging productsthroughout the world.
Paints Segment
Our Paints segment includes a wide variety of productssuch as paints, primers, topcoats and aerosol spraypaints sold primarily through retailers, distributionnetworks and company-owned stores. This segmentincludes our consumer paints and automotive refinishproduct lines.
Our consumer paints product line comprises the largestpart of our Paints segment. We offer a broad portfolio ofinterior and exterior decorative paints, stains, primers,varnishes, high performance floor paints and specialtydecorative products, such as enamels, aerosols and fauxfinishes, used in both the do-it-yourself and professionalmarkets. In the U.S. and Canada, we offer our brandedproducts and private label brands for customers. Theprimary distribution channels for these products arehome centers, hardware wholesalers, distributors andindependent dealers. In China, we sell Huarun brandedconsumer paints through distributors and retailers. InAustralia and New Zealand, we sell Wattyl and Valsparbrands of consumer paints through independentdealers, hardware chains, home centers and company-owned stores. In the U.K. and Ireland, we sell Valsparbranded products through a large home centercustomer. At certain customers, we also offer additionalmarketing and customer support by providing Valsparpersonnel to train paint department employees and toanswer paint questions in stores.
We develop highly customized merchandising andmarketing support programs for our consumer paintcustomers, enabling them to differentiate their paintdepartments from their competitors’ through productand color selection assistance, point-of-purchase mate-rials and labeling. Our primary brands include Valsparand Cabot in the U.S., Huarun in China, and Wattyl,Valspar and Solagard in Australia and New Zealand. Wecontinue to invest in and support these brands throughadvertising and marketing programs.
Our automotive product line includes refinish paints andaerosol spray paints that are sold through automotiverefinish distributors, body shops, automotive supplydistributors and automotive supply retailers. We manu-facture these products in Europe and North Americaand distribute them under the Valspar, DeBeer, Octoral
1

and House of Kolor brands in many countries aroundthe world.
Other and Administrative
In addition to the main product lines within our Coatingsand Paints segments, we manufacture and sell specialtypolymers and colorants, and we sell furniture protectionplans and furniture care and repair products under theGuardsman brand. The specialty polymers and colorantsare manufactured for internal use and for external saleto other coatings manufacturers. In the fourth quarter offiscal year 2012, we exited the gelcoat products market.
COMPETITION
All aspects of the coatings and paints business arehighly competitive. Some of our competitors are largerand have greater financial resources than us.
Competition in our Coatings segment is based onformulating products for specific customer applications,meeting customer delivery requirements and providingtechnical assistance to the customer in product applica-tion, new technology offerings and prices. We canprovide global coatings solutions to customers dueto our position as one of the world’s largest industrialcoatings manufacturers and our commitment to devel-oping new technologies.
Competition in our Paints segment is based on factorssuch as consumer brand recognition, product quality,distribution and price. In this segment, we support ourbrand awareness through advertising and highlycustomized merchandising and marketing supportprograms provided to our customers.
RAW MATERIALS
We obtain raw materials from a number of suppliers.The raw materials are derived from petrochemicals,minerals and metals. Our most significant raw materialsinclude solvents, titanium dioxide and epoxy and otherresins. Historically, these materials have been generallyavailable on the open market, with pricing and avail-ability subject to fluctuation. Most of the raw materialsused in production are purchased from outside sources.We have made, and plan to continue to make, supplyarrangements to meet our current and future usagerequirements. We manage sourcing of critical raw mate-rials by establishing contracts, buying from multiplesources and identifying alternative or lower cost mate-rials or technology, when possible. We have active initia-tives to find lower cost materials, to reformulateproducts with lower cost and more environmentallyfriendly raw materials and to qualify multiple and localsources of supply, including suppliers from Asia andother lower cost regions of the world.
INTELLECTUAL PROPERTY
Our practice is to seek patent protection for our prod-ucts and manufacturing processes when appropriate.We also license some patented technology from othersources. Our business is not materially dependentupon licenses or similar rights or on any single patentor group of related patents. Although we believe ourpatent rights are valuable, our knowledge and tradesecret information regarding our manufacturingprocesses and materials have also been important inmaintaining our competitive position. We requirecertain employees to sign confidentiality agreementsrelating to proprietary information.
While we make efforts to protect our trade secret infor-mation, others may independently develop or otherwiseacquire substantially equivalent proprietary informationor techniques or inappropriately gain access to ourproprietary technology or disclose this technology.Any of these factors could adversely impact the valueof our proprietary trade secret information and harmour business.
SEASONALITY AND WORKING CAPITAL ITEMS
Our sales volume is traditionally lowest during the firstquarter of the fiscal year (November, December andJanuary), and highest in the third quarter of the fiscalyear (May, June and July), primarily due to weather andthe buying cycle in our Coatings and Paints segments.When sales are lowest, we build inventory, the financingfor which is provided by internally generated funds,short-term debt and long-term credit lines discussed inNote 9 of Notes to Consolidated Financial Statements.
SIGNIFICANT CUSTOMERS
In 2013, our sales to Lowe’s Companies, Inc. exceeded10% of consolidated net sales. Our ten largestcustomers accounted for approximately 33% of consoli-dated net sales. Our five largest customers in the Paintssegment accounted for approximately 52% of our netsales in the segment. Our five largest customers in theCoatings segment accounted for approximately 19% ofour net sales in the segment.
BACKLOG AND GOVERNMENT CONTRACTS
We have no significant backlog of orders and generallyare able to fill orders on a current basis. No materialportion of our business is subject to renegotiation ofprofits or termination of contracts or subcontracts at theelection of the government.
2

RESEARCH AND DEVELOPMENT
The base technologies that support our coatings’product performance and application have been devel-oped and optimized over many years. Our on-goingapplied science and development efforts are focused ondelivering premium, differentiated coatings solutionsthat meet or exceed market needs for improvedperformance, consistent quality and system value. Wework closely with our customers to build a deep under-standing of their challenges and objectives and to fosterinnovation in the products and services that we provide.
Research and development costs for fiscal 2013 were$121.6 million, or 3.0% of net sales, compared to$116.9 million, or 2.9% of net sales, for fiscal 2012 and$114.6 million, or 2.9% of net sales, for fiscal 2011.
ENVIRONMENTAL COMPLIANCE
We undertake to comply with applicable regulationsrelating to protection of the environment and workers’safety. Capital expenditures for this purpose were notmaterial in fiscal 2013, and we do not expect suchexpenditures will be material in fiscal 2014.
EMPLOYEES
We employ approximately 10,700 people globally,approximately 400 of whom are subject to collectivebargaining agreements in the United States. We believethat our relationship with our union employees is good.
FOREIGN OPERATIONS AND EXPORT SALES
Our foreign operations are conducted primarily throughmajority-owned subsidiaries and, to a limited extent,through joint ventures. Revenues from foreignsubsidiaries and operations comprised approximately44% of our total consolidated net sales in 2013.
In addition to our manufacturing plants in the UnitedStates, we have manufacturing plants in Australia, Brazil,Canada, China, France, Germany, India, Ireland, Italy,Malaysia, Mexico, The Netherlands, New Zealand,Poland, Singapore, South Africa, Switzerland, Thailand,the United Kingdom and Vietnam. We also have jointventures in Japan, South Africa, Switzerland andVietnam and sales offices in other countries.
During fiscal 2013, export sales from the United Statesrepresented 3.9% of our business.
ITEM 1A RISK FACTORS
You should consider the following risk factors, in addition tothe other information presented or incorporated by refer-ence into this Annual Report on Form 10-K, in evaluatingour business and your investment in us.
Deterioration of economic conditions could harmour business.
Our business may be adversely affected by changes innational or global economic conditions, including infla-tion, interest rates, access to and the functioning ofcapital markets, consumer spending rates, energy avail-ability and costs (including fuel surcharges), and theeffects of governmental initiatives to manage economicconditions. Deterioration in national or global economicconditions may reduce demand for our products andoverall growth of the coatings industry.
Volatility in financial markets and the deterioration ofnational or global economic conditions could impact ouroperations as follows:
• the value of our investments in debt and equitysecurities may decline, including our assets held inpension plans;
• the financial stability of our customers and suppliersmay be compromised, which could result in addi-tional bad debts for us or non-performance bysuppliers; and
• it may become more costly or difficult to obtainfinancing to fund operations or investment opportu-nities, or to refinance our debt in the future.
At various times, we utilize hedges and other derivativefinancial instruments to reduce our exposure to variousinterest rate risks, which qualify for hedge accounting forfinancial reporting purposes. Volatile fluctuations inmarket conditions could cause these instruments tobecome ineffective, which could require any gains orlosses associated with these instruments to be reportedin our earnings each period.
Fluctuations in the availability and prices ofraw materials could negatively impact our finan-cial results.We purchase the raw materials needed to manufactureour products from a number of suppliers. The majorityof our raw materials are derived from petroleum,minerals and metals. Under normal market conditions,these materials are generally available from one or moresuppliers on the open market. From time to time,however, the availability and costs of raw materials mayfluctuate significantly, which could impair our ability toprocure necessary materials, or increase the cost ofmanufacturing our products. Our raw material costshave been volatile, and we have experienced disruptionsin supplies of certain raw materials at various times.These disruptions could affect our ability to manufactureproducts ordered by our customers, which could nega-tively impact sales.
3

When raw material costs increase, our profit marginsare reduced unless and until we are able to pass alongthe increases to our customers through higher prices.If raw material costs increase and if we are unable topass along, or are delayed in passing along, thoseincreases to our customers, we will experience profitmargin reductions.
Many of our customers are in cyclical industries,which may affect the demand for our products.Many of our customers are in businesses or industriesthat are cyclical and sensitive to changes in generaleconomic conditions. As a result, the demand for ourproducts by these customers depends, in part, uponeconomic cycles affecting their businesses or industriesand general economic conditions. Downward economiccycles affecting the industries of our customers, and thedeterioration of global economic conditions, may reduceour sales and profitability.
The industries in which we operate are highlycompetitive, and some of our competitors arelarger than us and may have greater financialresources than we do.All aspects of the coatings and paints business arehighly competitive. We face strong competitors in allareas of our business. Any increase in competition maycause us to lose market share or compel us to reduceprices to remain competitive, which could result inreduced margins for our products. Competitive pres-sures may not only impair our margins but may alsoimpact our revenues and our growth. A number of ourcompetitors are larger than us and may have greaterfinancial resources than we do. Competition with thesecompanies could curtail price increases or require pricereductions or increased spending on marketing, salesand research and development, any of which couldadversely affect our results of operations.
Industry sources estimate that the top ten largest coat-ings manufacturers represent more than half of theworld’s coatings sales. Our larger competitors may havemore resources to finance acquisitions or internalgrowth in this competitive environment. Also, we buy ourraw materials from large suppliers, primarily chemicalcompanies. In many of our product lines, we then sellour finished goods to large customers, such as do-it-yourself home centers, large equipment manufacturersand can makers. Our larger competitors may have moreresources or capabilities to conduct business with theselarge suppliers and large customers. Finally, many of ourlarger competitors operate businesses in addition topaints and coatings. These competitors may be betterable to compete during coatings industry downturns.
We have a significant amount of debt.
Our total long-term and short-term debt was$1,478.6 million at October 25, 2013. Our debt cate-gorized as short-term was $441.2 million at October 25,2013. Our level of debt may have important conse-quences. For example, it:
• may require us to dedicate a material portion ofour cash flow from operations to make payments onour indebtedness, thereby reducing our ability tofund working capital, capital expenditures or othergeneral corporate purposes;
• could make us less attractive to prospective orexisting customers or less able to fund potentialacquisitions; and
• may limit our flexibility to adjust to changing busi-ness and market conditions and make us morevulnerable to a downturn in general economicconditions as compared to a competitor that mayhave less indebtedness.
Acquisitions are an important part of ourgrowth strategy, and future acquisitions maynot be available or successful.
Acquisitions have historically contributed significantly tothe growth of our company. As part of our growthstrategy, we intend to continue to pursue acquisitions ofcomplementary businesses and products. If we are notable to identify and complete future acquisitions, ourgrowth may be negatively affected. Even if we aresuccessful in completing future acquisitions, we mayexperience:
• difficulties in assimilating acquired companies andproducts into our existing business;
• delays in realizing the benefits from the acquiredcompanies or products;
• difficulties due to lack of or limited prior experiencein any new markets we may enter;
• unforeseen claims and liabilities, including unex-pected environmental exposures or product liability;
• unforeseen adjustments, charges and write-offs;
• unexpected losses of customers of, or suppliers to,acquired businesses;
• difficulty in conforming the acquired business’standards, processes, procedures and controls withour operations;
• variability in financial information arising from theapplication of purchase price accounting;
• difficulties in retaining key employees of theacquired businesses; and
• challenges arising from the increased geographicdiversity and complexity of our operations.
4

Any of these factors may make it more difficult to repayour debt or have an adverse effect on results of opera-tions. In addition, an acquisition could materially impairour operating results by causing us to incur debt orrequiring us to amortize acquisition-related costs or thecost of acquired assets.
We derive a substantial portion of our revenuesfrom foreign markets, which subjects us to addi-tional business risks.We conduct a substantial portion of our businessoutside of the United States. We currently have produc-tion facilities, research and development facilities, andadministrative and sales offices located outside theUnited States, including facilities and offices locatedin Australia, Brazil, Canada, China, Finland, France,Germany, Greece, India, Indonesia, Ireland, Italy, Japan,Malaysia, Mexico, The Netherlands, New Zealand,Poland, Russia, Singapore, South Africa, Spain, Switzer-land, Thailand, the United Arab Emirates, the UnitedKingdom and Vietnam. In 2013, revenues from productssold outside the United States accounted for approxi-mately 44% of our consolidated net sales.
We expect sales in international markets to representa significant portion of our consolidated net sales.Notwithstanding the benefits of geographic diversifica-tion, our ability to achieve and maintain profitablegrowth in international markets is subject to risks relatedto the differing legal, political, social and regulatoryrequirements and economic conditions of many jurisdic-tions. Risks inherent in international operations includethe following:
• agreements may be difficult to enforce, and receiv-ables may be difficult to collect or have longerpayment cycles;
• foreign countries may impose additional with-holding taxes or otherwise tax our foreign income,or adopt other restrictions on foreign trade orinvestment, including currency exchange controls;
• foreign operations may experience labor disputesand difficulties in attracting and retaining keyemployees;
• transportation and other shipping costs mayincrease;
• foreign governments may nationalize privateenterprises;
• unexpected adverse changes may occur in exportduties, quotas and tariffs and difficulties inobtaining export licenses;
• intellectual property rights may be more difficultto enforce;
• fluctuations in exchange rates may affect productdemand and may adversely affect the profitability inU.S. dollars of products and services we provide ininternational markets where payment for our prod-ucts and services is made in the local currency;
• our business and profitability in a particularcountry could be affected by political or economicchanges or terrorist activities and responses tosuch activities;
• unexpected adverse changes in foreign laws orregulatory requirements may occur; and
• compliance with a variety of foreign laws and regu-lations may be burdensome.
We have certain key customers, and the lossof key customers could negatively affectour business.
Our relationships with certain key customers are impor-tant to us. From 2011 through 2013, sales to our largestcustomer exceeded 10% of our consolidated net sales.In 2013, our ten largest customers accounted forapproximately 33% of our consolidated net sales.Although we sell various types of products throughvarious channels of distribution, we believe that the lossof a substantial portion of net sales to our largestcustomers could have a material adverse impact on us.
If the reputation of our company or one or moreof its key brands is damaged, it could harm ourbusiness.
Our reputation is one of the foundations of our relation-ships with key customers and other stakeholders. If weare unable to effectively manage real or perceivedissues that negatively affect our reputation, our abilityto conduct our business could be impaired, and ourfinancial results could suffer. As we continue to investin advertising and promotion for our key brands, ourfinancial success is becoming more dependent on thesuccess of our brands. The success of these brandscould suffer if our marketing plans or product initiativesdo not have the desired effect on a brand’s image,reputation or ability to attract customers. Further, ourgrowth and results could be harmed if the reputationof our company or a key brand is damaged due toreal or perceived quality issues, product recalls,regulatory enforcement or actions or customer claimsand litigation.
Technology changes, and our ability to protect ourtechnology, could affect our business.
Our product and application technology is supportedby underlying chemistry that has been developed overmany years. Ongoing research and developmentefforts focus on improving our internally developedand acquired technology and formulating changesto improve the performance, profitability and costcompetitiveness of our products. If our competitorsdevelop new technology, or if our customers’ technologyrequirements change, and we are not able to developcompetitive technology, our business and financialresults could suffer. Further, although we seek to protect
5

our proprietary technology and information throughconfidentiality and trade secret protection programs andpractices, patents, cybersecurity measures and othermeans, if we were unable to protect our material propri-etary technology or information, our business and finan-cial results could suffer.
Interruption, failure or compromise of ourinformation systems could adversely affectour business.
We rely on information systems to run most aspects ofour business, including sales and distribution of prod-ucts, purchases of raw materials and supplies,accounting for purchase and sale transactions, manufac-turing processes, billing and collections, and managingdata and records for employees and other parties. Ourbusiness may be adversely affected if these systems areinterrupted, damaged, or compromised, or if they fail forany extended period of time, due to user errors,programming errors, computer viruses, securitybreaches or other problems. Information security riskshave generally increased in recent years because of theproliferation of new technologies and the increasedsophistication and activities of cyber attackers. Althoughwe strive to have appropriate security controls in place,prevention of security breaches cannot be assured,particularly as cyber threats continue to evolve. We maybe required to expend additional resources to continueto enhance our security measures or to investigateand remediate any security vulnerabilities. In addition,third-party service providers manage a portion of ourinformation systems, and we are subject to risk as aresult of interruption, failure or security breaches ofthose systems. The consequences of these riskscould adversely impact our results of operations andcash flows.
Numerous laws and regulations affect our business.
We are subject to numerous laws and regulations thatcontrol the manufacturing, marketing, sale, use anddisposal of our products. These laws and regulationsinclude health, safety, product liability, environmentaland labeling requirements applicable to our productsand business.
Environmental laws and regulations control, amongother things, the discharge of pollutants into the air andwater, the handling, use, treatment, storage and clean-upof hazardous and non-hazardous wastes, the investiga-tion and remediation of soil and groundwater affectedby hazardous substances, or otherwise relating to envi-ronmental protection and various health and safetymatters. These environmental laws and regulationsimpose strict, retroactive and joint and several liabilityfor the costs of, and damages resulting from, cleaningup current sites, past spills, disposals and other releasesof hazardous substances and violations of these lawsand regulations can also result in fines and penalties.
We are currently undertaking remedial activities at anumber of our facilities and properties, and havereceived notices under the Comprehensive Environ-mental Response, Compensation and Liability Act, orCERCLA, or analogous state laws, of liability or potentialliability in connection with the disposal of material fromour operations or former operations. Pursuant to health,safety, product liability and labeling laws and regula-tions, we have also been subject to various governmentalenforcement actions and litigation by individuals relatingto the sale, use of or exposure to our products or mate-rials used or contained in our products, including claimsfor property damage or personal injury claimed to havebeen caused by our products or materials used orcontained in our products.
We are subject to the risk that adverse decisions relatingto our compliance with existing laws and regulations andnew laws or regulations, or changes in existing laws orregulations or their interpretation, could increase ourcompliance costs and expand our potential liability forenforcement actions by governmental authorities andlitigation by individuals.
In addition, our customers’ or consumers’ perceptionsabout the acceptability or potential environmental orhealth effects of certain substances could require us toinvest additional amounts to develop products thatexclude those substances. If we are unable to developproducts that exclude those substances when and ifrequired by our customers, we may experience reducedsales and profitability.
ITEM 1B UNRESOLVED STAFF COMMENTS
Not applicable.
ITEM 2 PROPERTIES
We lease our principal offices located in Minneapolis,Minnesota. Our North American manufacturing opera-tions are conducted at 26 locations (24 owned; 2leased) in the United States, Canada and Mexico. Thetotal combined square footage for our principal officesand manufacturing operations in North America isapproximately 4,367,000. Asia Pacific manufacturingoperations are conducted at 15 locations (12 owned; 3leased) in Australia, China, Malaysia, New Zealand,Singapore, Thailand and Vietnam, with a total combinedsquare footage of approximately 1,995,000. Europeanmanufacturing operations are conducted at thirteenlocations (10 owned; 3 leased) in France, Germany,Ireland, The Netherlands, Switzerland, Poland, Italy, andthe United Kingdom, with a total combined squarefootage of approximately 1,403,000. In South America,we own two manufacturing facilities in Brazil with squarefootage of approximately 468,000. In India, we own onemanufacturing facility with square footage of approxi-mately 121,000. In South Africa, we own one manufac-turing facility with square footage of approximately54,000.
6
Set forth below is a breakdown of principal facilitiessquare footage by business segment:
ApproximateBusiness Segment Square Footage
Coatings 4,138,000Paints 3,443,000Other and Administrative 827,000Total 8,408,000
We believe our manufacturing properties are well main-tained, in good operating condition and adequate for thepurposes for which they are being used. Operatingcapacity varies by product line, but additional produc-tion capacity is available for most product lines byincreasing the number of days and/or shifts worked.
ITEM 3 LEGAL PROCEEDINGS
Environmental Matters
We are involved in various claims relating to environ-mental matters at a number of current and former plantsites and waste and management sites. We engage orparticipate in remedial and other environmental compli-ance activities at certain of these sites. At other sites, wehave been named as a potentially responsible party(“PRP”) under federal and state environmental laws forsite remediation. We analyze each individual site, consid-ering the number of parties involved, the level of ourpotential liability or contribution relative to the otherparties, the nature and magnitude of the hazardouswastes involved, the method and extent of remediation,the potential insurance coverage, the estimated legaland consulting expense with respect to each site andthe time period over which any costs would likely beincurred. Based on the above analysis, we estimate theclean-up costs and related claims for each site. The esti-mates are based in part on discussion with other PRPs,governmental agencies and engineering firms.
We accrue appropriate reserves for potential environ-mental liabilities, which are reviewed and adjusted asadditional information becomes available. While uncertain-ties exist with respect to the amounts and timing of ourultimate environmental liabilities, management believes itis neither probable nor reasonably possible that suchliabilities, individually or in the aggregate, will have amaterial adverse effect on our financial condition, resultsof operations or cash flows.
Other Legal Matters
We are involved in a variety of legal claims andproceedings relating to personal injury, product liability,warranties, customer contracts, employment, tradepractices, environmental and other legal matters that arisein the normal course of business. These claimsand proceedings include cases where we are one of anumber of defendants in proceedings alleging that theplaintiffs suffered injuries or contracted diseases fromexposure to chemicals or other ingredients used in theproduction of some of our products or waste disposal. Weare also subject to claims related to the performance ofour products. We believe these claims and proceedingsare in the ordinary course for a business of the type andsize in which we are engaged. While we are unable topredict the ultimate outcome of these claims andproceedings, we believe it is neither probable nor reason-ably possible that the costs and liabilities of such matters,individually or in the aggregate, will have a materialadverse effect on our financial condition, results of opera-tions or cash flows.
ITEM 4 MINE SAFETY DISCLOSURESNot applicable.
7
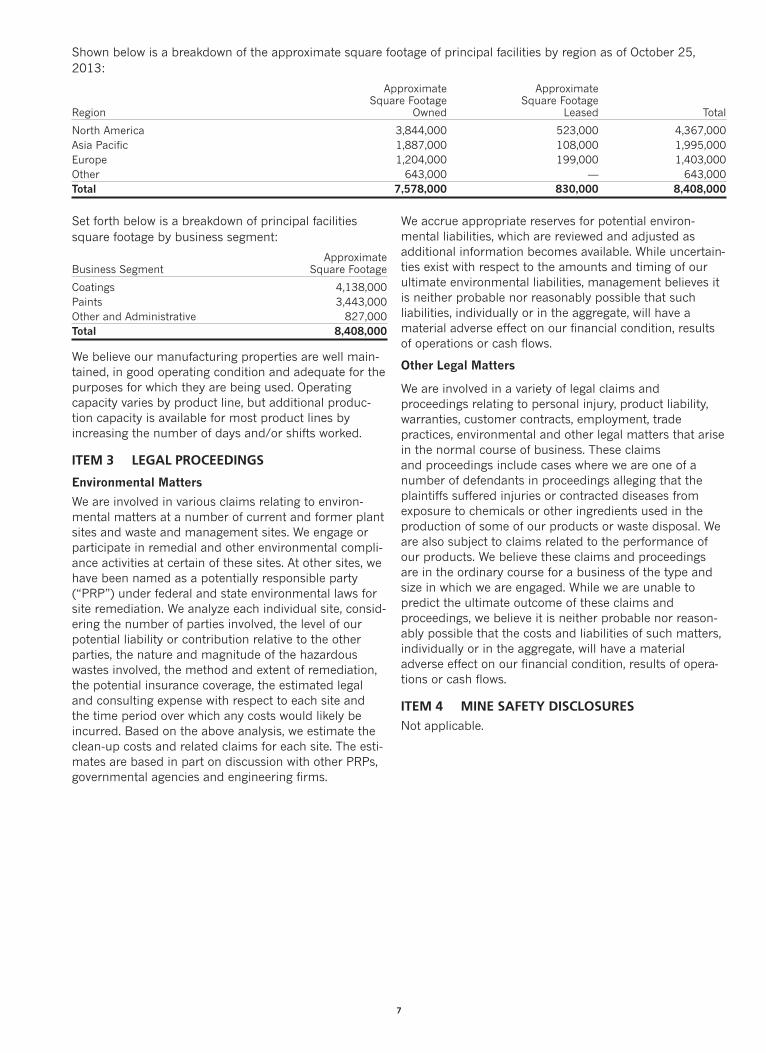
Shown below is a breakdown of the approximate square footage of principal facilities by region as of October 25,2013:
Approximate ApproximateSquare Footage Square Footage
Region Owned Leased Total
North America 3,844,000 523,000 4,367,000Asia Pacific 1,887,000 108,000 1,995,000Europe 1,204,000 199,000 1,403,000Other 643,000 — 643,000Total 7,578,000 830,000 8,408,000

PART IIITEM 5 MARKET FOR REGISTRANT’S COMMON
EQUITY, RELATED STOCKHOLDERMATTERS AND ISSUER PURCHASES OFEQUITY SECURITIES
Our Common Stock is listed on the New York StockExchange under the trading symbol VAL. The tablebelow sets forth the quarterly high and low marketprices of the Common Stock for fiscal years 2013 and2012 as quoted on the New York Stock Exchange.
Market Price (high/low)
For the Fiscal Year 2013 2012
First Quarter $ 68.42–55.17 $ 43.40–33.17Second Quarter $ 68.30–58.97 $ 52.12–42.50Third Quarter $ 74.25–62.32 $ 53.75–45.29Fourth Quarter $ 71.32–61.13 $ 59.81–48.05
The quarterly dividend declared November 19, 2013, tobe paid on December 13, 2013 to common stock-holders of record December 2, 2013, was increased to$0.26 per share. The table below sets forth the quarterlydividends paid for fiscal years 2013 and 2012.
Per Share Dividends
For the Fiscal Year 2013 2012
First Quarter $ 0.23 $ 0.20Second Quarter $ 0.23 $ 0.20Third Quarter $ 0.23 $ 0.20Fourth Quarter $ 0.23 $ 0.20
$ 0.92 $ 0.80
The number of record holders of our Common Stock atDecember 10, 2013 was 1,276.
8
ISSUER PURCHASES OF EQUITY SECURITIESTotal Number of Maximum Number
Total Number Average Shares Purchased as Part of Shares that Mayof Shares Price Paid of Publicly Announced Yet be Purchased Under
Period Purchased1 per Share Plans or Programs1 the Plans or Programs1
7/27/13 – 8/23/13Repurchase program 404,100 $ 66.45 404,100 10,894,600Other transactions2 2,891 $ 69.92 — —
8/24/13 – 9/20/13Repurchase program 530,000 63.50 530,000 10,364,600
9/21/13 – 10/25/13Repurchase program 640,045 64.97 640,045 9,724,555
1 On December 5, 2012, the board approved a new share repurchase authorization of 15,000,000 shares, with no predetermined end date,which replaced the October 13, 2010 authorization. In fiscal 2013 we repurchased 5,889,945 shares (5,275,445 shares under the new authoriza-tion and 614,500 under the 2010 authorization).
2 Other transactions include our acquisition of common stock in satisfaction of tax-payment obligations upon vesting of restricted stock and ourreceipt of surrendered shares in connection with the exercise of stock options.
EXECUTIVE OFFICERS OF THE REGISTRANT
The names and ages of all of our executive officers, all of whom are approved by the Board of Directors for re-electionin February of each year, and the positions held by them are as listed below. There are no family relationshipsbetween any of the officers or between any officer and director.
Name Age Position
Gary E. Hendrickson 57 Chairman since June 2012, Chief Executive Officer since June 2011 andPresident and Chief Operating Officer since February 2008
James L. Muehlbauer 52 Executive Vice President and Chief Financial and Administrative Officer sinceMarch 2013
Rolf Engh 60 Executive Vice President since July 2005, General Counsel and Secretarysince April 1993
Anthony L. Blaine 46 Senior Vice President Human Resources since January 2007Cynthia A. Arnold 56 Senior Vice President and Chief Technology Officer since January 2011
The foregoing executive officers have served in the stated capacity for the registrant during the past five years, exceptfor the following:
Prior to March 2013, Mr. Muehlbauer was Executive Vice President and Chief Financial Officer at Best Buy Co., Inc.since April 2008.
Prior to January 2011, Ms. Arnold was Chief Technology Officer at Sun Chemical Corporation since July 2004.
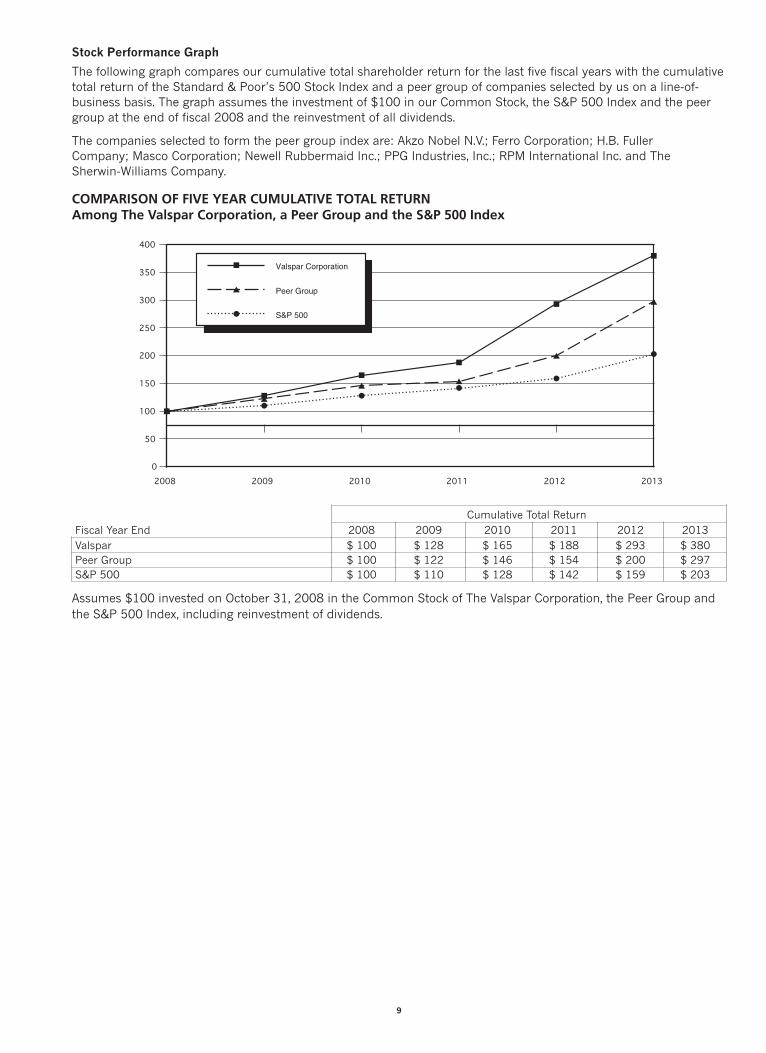
Stock Performance Graph
The following graph compares our cumulative total shareholder return for the last five fiscal years with the cumulativetotal return of the Standard & Poor’s 500 Stock Index and a peer group of companies selected by us on a line-of-business basis. The graph assumes the investment of $100 in our Common Stock, the S&P 500 Index and the peergroup at the end of fiscal 2008 and the reinvestment of all dividends.
The companies selected to form the peer group index are: Akzo Nobel N.V.; Ferro Corporation; H.B. FullerCompany; Masco Corporation; Newell Rubbermaid Inc.; PPG Industries, Inc.; RPM International Inc. and TheSherwin-Williams Company.
COMPARISON OF FIVE YEAR CUMULATIVE TOTAL RETURNAmong The Valspar Corporation, a Peer Group and the S&P 500 Index
Cumulative Total ReturnFiscal Year End 2008 2009 2010 2011 2012 2013Valspar $ 100 $ 128 $ 165 $ 188 $ 293 $ 380Peer Group $ 100 $ 122 $ 146 $ 154 $ 200 $ 297S&P 500 $ 100 $ 110 $ 128 $ 142 $ 159 $ 203
Assumes $100 invested on October 31, 2008 in the Common Stock of The Valspar Corporation, the Peer Group andthe S&P 500 Index, including reinvestment of dividends.
9
2008 2009 2010 2011 2012 20130
50
100
150
200
250
300
350
400
Valspar Corporation
Peer Group
S&P 500
ITEM 6 SELECTED FINANCIAL DATA
The following selected financial data has been derived from our audited Consolidated Financial Statements andshould be read in conjunction with “Management’s Discussion and Analysis of Financial Condition and Results ofOperations” and the Consolidated Financial Statements and related notes included elsewhere in this Form 10-K.
Fiscal Years(Dollars in thousands,except per share amounts) 2013 2012 2011 2010 2009
Operating Results Net Sales $ 4,103,776 $ 4,020,851 $ 3,952,954 $ 3,226,687 $ 2,879,042Cost and ExpensesCost of Sales 2,745,718 2,667,147 2,721,146 2,155,009 1,900,114Operating Expense 865,634 871,434 862,160 695,601 687,960Impairment of Goodwill andIntangible Assets — — 409,714 — —
Income (Loss) from Operations 492,424 482,270 (40,066) 376,077 290,968Interest Expense 64,758 67,604 61,511 58,267 50,394Other (Income) Expense – Net 3,871 (2,558) 1,577 (1,387) 2,246Income (Loss) Before Income Taxes 423,795 417,224 (103,154) 319,197 238,328Net Income (Loss) 289,255 292,497 (138,601) 222,056 160,153Net Income as a Percent of Sales 7.0% 7.3% N/A 6.9% 5.6%Return on Average Equity 24.7% 24.0% N/A 14.2% 10.8%Per Common Share:Net Income (Loss) – Basic $ 3.29 $ 3.20 $ (1.47) $ 2.25 $ 1.50Net Income (Loss) – Diluted1 3.20 3.10 (1.47) 2.20 1.49Dividends Paid 0.92 0.80 0.72 0.64 0.60
Financial Position Total Assets $ 4,025,509 $ 3,626,836 $ 3,500,151 $ 3,867,936 $ 3,511,024Working Capital2 591,591 538,559 538,025 530,435 406,638Property, Plant and Equipment, Net 633,475 550,968 548,253 567,630 471,088Long-Term Debt, Net of CurrentPortion 1,037,392 1,012,578 679,805 943,216 873,095Stockholders’ Equity 1,122,550 1,223,523 1,212,550 1,630,365 1,504,507
Other Statistics Property, Plant and EquipmentExpenditures $ 116,749 $ 89,363 $ 66,469 $ 67,732 $ 57,897Depreciation and AmortizationExpense 88,159 93,704 97,747 81,312 82,862Research and DevelopmentExpense 121,563 116,866 114,554 100,236 91,303Total Cash Dividends $ 81,189 $ 73,351 $ 68,164 $ 63,279 $ 60,116Average Diluted Common SharesOutstanding (000’s) 90,526 94,380 94,310 100,866 100,921Number of Stockholders at Year End 1,290 1,365 1,405 1,432 1,449Number of Employees at Year End 10,702 9,755 10,020 10,180 8,788Market Price Range – Common Stock:
High $ 74.25 $ 59.81 $ 40.60 $ 33.13 $ 28.60Low 55.17 33.17 27.44 25.11 14.47
Reference is made to the Notes to Consolidated Financial Statements for a summary of accounting policies and additional information.
1 In 2013, 2012, 2011, 2010 and 2009, net income (loss) per common share diluted includes $0.32, $0.18, $0.24, $0.08 and $0.18 per share inrestructuring charges, respectively. See Note 18 in Notes to Consolidated Financial Statements for more information on 2013, 2012 and 2011. Netincome (loss) per common share diluted for 2011 includes an impairment charge on goodwill and intangible assets of $3.75. See “Management’sDiscussion and Analysis of Financial Condition and Results of Operations – Critical Accounting Estimates” and Note 1 in Notes to ConsolidatedFinancial Statements for more information. In 2013, 2011 and 2010, net income (loss) per common share diluted includes $0.02, $0.09 and $0.03in acquisition-related charges, respectively. Net income (loss) per common share diluted in 2010 includes gains on sale of certain assets of $0.08.Huarun Redeemable Stock accrual reduced net income (loss) per common share diluted by $0.10 in 2009. The accrual was related to our minorityinterest shares of Huarun Paints Holding Company Limited. Adjusted net income per common share diluted, excluding the items mentioned above,was $3.54 for 2013, $3.28 for 2012, and $2.65 for 2011, which includes a dilutive share impact of $0.04, $2.23 for 2010, and $1.77 for 2009. Seerelated reconciliation in “Management’s Discussion and Analysis of Financial Condition and Results of Operations – Non-GAAP Financial Measures”for more information on 2013 and 2012.
2 Working Capital is defined as accounts and notes receivable plus inventory less trade accounts payable.
10

ITEM 7 MANAGEMENT’S DISCUSSION ANDANALYSIS OF FINANCIAL CONDITIONAND RESULTS OF OPERATIONS(Dollars in thousands, except per shareamounts)
Management’s Discussion and Analysis of FinancialCondition and Results of Operations (MD&A) is intendedto provide a reader of our financial statements with anarrative from the perspective of management on ourfinancial condition, results of operations, liquidity andcertain other factors that may affect our future results.Unless otherwise noted, transactions, trends and otherfactors significantly impacting our financial condition,results of operations and liquidity are discussed in orderof magnitude. In addition, unless expressly stated other-wise, the comparisons presented in this MD&A refer tothe same period in the prior year. Our MD&A ispresented in eight sections:
• Overview
• Global Economic and Industry-Wide Factors
• Results of Operations
• Financial Condition
• Non-GAAP Financial Measures
• Critical Accounting Estimates
• Off-Balance Sheet Arrangements
• Forward-Looking Statements
Our MD&A should be read in conjunction with theConsolidated Financial Statements and related Notesincluded in Item 8, Financial Statements and Supple-mentary Data, of this Form 10-K.
OVERVIEW
The Valspar Corporation is a global leader in the paintand coatings industry. Our strong consumer brandsand leading technologies, together with our technicalexpertise and customer service, differentiate us fromour competition and allow us to grow and create valuewith customers in a wide variety of geographic andend-use markets. We operate our business in tworeportable segments: Coatings and Paints. Our Coatingssegment aggregates our industrial product lines andour packaging product line. Our Paints segment aggre-gates our consumer paints and automotive refinishproduct lines. See Note 15 in Notes to ConsolidatedFinancial Statements for further information on ourreportable segments.
We operate in over 25 countries, and approximately44% of our total net sales in 2013 were generatedoutside of the U.S. In the discussions of our operatingresults, we sometimes refer to the impact of changes inforeign currency exchange rates or the impact of foreigncurrency exchange rate fluctuations, which are refer-
11
ences to the differences between the foreign currencyexchange rates we use to convert international operatingresults from local currencies into U.S. dollars forreporting purposes. The impact of foreign currencyexchange rate fluctuations is calculated as the differencebetween current period activity translated using thecurrent period’s currency exchange rates and thecomparable prior-year period’s currency exchange rates.We use this method to calculate the impact of changesin foreign currency exchange rates for all countrieswhere the functional currency is not the U.S. dollar.
Our fundamental business objective is to create long-term value for our shareholders. We intend to accom-plish this by:
• focusing on our customers and delivering coatingsproducts and solutions based on a deep under-standing of their needs;
• investing in our brands and developing innovative,proprietary technologies;
• expanding our global presence;
• enhancing the productivity of our business by maxi-mizing efficiencies in procurement, manufacturingand process adherence;
• maintaining operational discipline and prudentcost control;
• generating strong cash flow; and
• allocating our capital to maintain and grow the busi-ness, fund internal growth initiatives and strategicacquisitions and pay dividends.
In addition to creating value for our shareholders, we arecommitted to:
• adhering to our values, ethical business conductand doing business with integrity;
• improving the safety and reducing the environ-mental footprint of our business and the productswe manufacture while also delivering solutions thatenable our customers to meet their environmentaland safety objectives; and
• demonstrating our corporate citizenship bysupporting the communities in which we work andlive through volunteer efforts and philanthropy.
The following discussion of financial condition andresults of operations should be read in the context ofthis overview.
General Economic and Industry-Wide Factors
In North America, many of the markets in which wecompete continued to improve, particularly those relatedto residential construction. Outside North America, weexperienced softening demand, particularly in Europe,Australia and Asia. Demand in Latin America continuedto grow, but at a slower rate than prior years.
Raw material costs increased significantly in 2011and through part of 2012. These costs moderated in thesecond half of 2012 and remainded stable throughout2013. Since our raw material costs average approxi-mately 80% of our cost of goods sold, the efficient useof raw materials is a critical cost component of the prod-ucts we manufacture.
Despite the challenging global economic conditions, wecontinued to make solid progress on our long-termgrowth initiatives. In particular:
• We completed the acquisition of Inver Holdings S.r.l.(Inver Group) and the paint manufacturing businessof Ace Hardware (Ace paints). The Inver Groupacquisition expanded our presence in the Europeancoatings market. As a result of the Ace paints acqui-sition, we expect to offer Valspar branded paints inmore than 3,000 Ace retail locations in the UnitedStates.
• We won new business across all significant productlines, particularly in our consumer paints businesswhere we made substantial gains with our profes-sional paint product lines.
• We increased our capability to develop new tech-nology by expanding our R&D centers inMinneapolis and China.
• We continued our initiatives to enhance productivityon a permanent basis across our operationsincluding additional restructuring actions to improveour overall cost structure.
• We returned cash to shareholders by increasing ourannual dividend 15.0% to $0.92 per share in fiscalyear 2013, our 35th consecutive year with a divi-dend increase, and by repurchasing 5,889,945shares for $378,141.
Results of Operations
Overview
Net sales in 2013 increased 2.1% to $4,103,776 from$4,020,851 in 2012, primarily due to new businessacross all significant product lines and regions and ourAce paints and Inver Group acquisitions, partially offsetby volume declines in our general industrial product lineand weakness in our Australia and China paints busi-nesses. Our gross profit rate of 33.1% decreased from33.7% in the prior year. Net income as a percent ofsales of 7.0% was flat compared to last year. In 2013, wemade investments in strategic acquisitions, which hadlower initial margins, and invested in long-term growthinitiatives. Additionally, restructuring charges increaseddue to current year initiatives. These costs were offset byslightly lower raw material costs and lower incentivecompensation costs.
During the 2013 fiscal year, we generated $200,566 infree cash flow (defined as net cash provided by oper-ating activities of $398,504, less capital expendituresand dividends), an increase of $14,412 from the prioryear due to improved operating results, partially offset
by increased investments in capital expenditures andincreased dividends. We believe this non-GAAP measure(free cash flow) provides useful information to bothmanagement and investors by including the amountreinvested in the business for capital expenditures andthe return on investment to our shareholders throughpayment of dividends. Our total debt of $1,478,557increased by $327,448 due to our share repurchases,debt used to finance acquisitions and capital expendi-tures, partially offset by operating cash flow and optionexercise proceeds. In July 2013, we entered into a U.S.dollar equivalent unsecured committed revolving bilat-eral credit facility, expiring July 2014 with total capacityof $107,767, which was used to partially finance theInver Group acquisition. Our liquidity position is strong,with $216,150 in cash and cash equivalents and$427,517 in unused committed bank credit facilitiesproviding total committed liquidity of $643,667compared to $760,655 at the end of 2012.
Restructuring
Fiscal year 2013 restructuring initiatives included thefollowing: (i) actions in the Paints segment to consoli-date manufacturing and distribution operationsfollowing the acquisition of Ace Hardware Corporation’spaint manufacturing business, ongoing profit improve-ment plans in Australia, and other actions in Asia,(ii) actions in our Coatings segment to consolidatemanufacturing operations in Europe following the acqui-sition of the Inver Group, and other actions to rationalizemanufacturing operations and lower operating expenses,and (iii) overall initiatives to improve our global coststructure, including non-manufacturing headcountreductions. We expect the majority of the restructuringactivities commenced in fiscal year 2013 to becompleted by the end of fiscal year 2014. Theserestructuring activities resulted in pre-tax charges of$36,433 or $0.32 per share in fiscal year 2013, and weexpect the total pre-tax cost of all restructuring activitiesto be approximately $68,000 to $74,000 or $0.59 to$0.64 per share in 2013 and 2014. Included in fiscalyear 2013 restructuring charges is $6,664 of non-cashpre-tax asset impairment charges. Subsequent to theend of the fiscal year and prior to filing this report, weincurred approximately $12,000 in pre-tax restructuringcharges related to the continuation of these actions. SeeNote 2 in Notes to Consolidated Financial Statementsfor further information on our Inver Group acquisitionand Note 18 in Notes to Consolidated Financial State-ments for further information on restructuring. Seereconciliation in “Management’s Discussion and Analysisof Financial Condition and Results of Operations – Non-GAAP Financial Measures” for more information on theper share impact of restructuring charges.
In fiscal year 2012, we exited the gelcoat productsmarket and consolidated a manufacturing facility in ourPaints segment. Our gelcoat product line was catego-rized in Other and Administrative. During fiscal year2012, we also completed restructuring initiativesannounced in 2011, including certain actions in ourCoatings and Paints segments. In our Coatings segment,
12

we rationalized our manufacturing capacity and reducedour overall global headcount, primarily in our woodproduct line. In our Paints segment, we completed thefirst phase of actions to improve the profitability of ourAustralian operations, which included facility consolida-tions in manufacturing and distribution, store rationali-zation and the reduction of other related costs. Theserestructuring activities resulted in pre-tax charges of$25,845 or $0.18 per share in fiscal year 2012.
Vendor Support Program Change
We provide our customers a number of cooperativemarketing and trade promotional programs (vendorsupport programs). Our consumer directed and specifi-cally identifiable cooperative marketing programs andactivities are recorded in operating expense, and ourtrade promotional funding is recorded as a reduction tonet sales. In 2013, the agreement with respect to coop-erative advertising programs with a large customer inour Paints segment was changed. These programs arenow included as reduction in price. Previously, theseprograms were specifically identifiable and included inoperating expense. As a result, compared to last year,our net sales, gross margins and operating expensesare lower. There was no impact on net income for thechange in our vendor support programs.
Financial Results 2013 vs. 2012
The following tables present selected financial data forthe years ended October 25, 2013 and October 26, 2012.
Net Sales 2013 2012 % Change
Coatings $ 2,209,492 $ 2,175,687 1.6%Paints 1,671,228 1,604,599 4.2%Other andAdministrative 223,056 240,565 (7.3)%ConsolidatedNet Sales $ 4,103,776 $ 4,020,851 2.1%
• Consolidated Net Sales – Consolidated net sales forthe year increased 2.1%, including a positive impactof 2.4% from acquisitions and a negative impact of0.5% from foreign currency. The remaining increasein sales of 0.2% was due to new business across allsignificant product lines and regions. The increasewas partially offset by volume declines caused bycontinued weakness in our global general industrialproduct line, a weak residential housing market inAustralia and lower sales in our China consumerpaints product line.
• Coatings Segment Net Sales – Our Coatingssegment net sales for the year increased 1.6%,including a positive impact of 1.4% from acquisi-tions and a negative impact of 0.6% from foreigncurrency. The remaining increase in sales of 0.8%was primarily due to volume growth driven by newbusiness in all significant product lines, which waspartially offset by continued weakness in ourgeneral industrial product line.
• Paints Segment Net Sales – Our Paints segmentnet sales for the year increased 4.2%, including apositive impact of 4.2% from acquisitions and anegative impact of 0.3% from foreign currency.The remaining increase in sales of 0.3% reflects newbusiness in our North America consumer paintsmarket, partially offset by declines in internationalconsumer markets due to a weak residentialhousing market in Australia and lower sales inChina.
• Other and Administrative Net Sales – The Otherand Administrative category includes the followingproduct lines: resins, furniture protection plans,colorants and gelcoats. Other and Administrative netsales decreased 7.3%, including a negative impactof 0.1% from foreign currency. The decline wasprimarily due to our exit from the gelcoat productsmarket in the fourth quarter of 2012.
Gross Profit 2013 2012
Consolidated Gross Profit $ 1,358,058 $ 1,353,704As a percent of Net Sales 33.1% 33.7%
• Gross Profit – The gross profit rate decreased0.6% primarily due to investments in strategicacquisitions, which had lower initial margins,changes in certain vendor support programs andhigher restructuring charges, partially offset byslightly lower raw material costs. Restructuringcharges of $21,916 or 0.5% of net sales and$16,199 or 0.4% of net sales were included in the2013 and 2012 periods, respectively. Acquisition-related charges were $513, or 0.01% of net sales.There were no acquisition-related charges includedin gross profit in the 2012 period.
Operating Expenses 2013 2012
Consolidated Operating Expenses1 $ 865,634 $ 871,434As a percent of Net Sales 21.1% 21.7%
1 Includes research and development, selling, general and adminis-trative, restructuring and acquisition-related costs. For breakout seeConsolidated Statements of Operations.
• Consolidated Operating Expenses (dollars) – Consoli-dated operating expenses decreased 0.7%compared to the prior year primarily due tochanges in certain vendor support programs in ourPaints segment and lower incentive compensation,partially offset by investments to support growthinitiatives in both our Paints and Coatings segmentsand higher restructuring charges. Restructuringcharges of $14,517 or 0.4% of net sales and $9,646or 0.2% of net sales were included in the 2013 and2012 periods, respectively. Acquisition-relatedcharges were $1,729, or 0.04% of net sales in 2013.There were no acquisition-related charges includedin operating expenses in the 2012 period.
13

EBIT1 2013 2012
Coatings $ 329,886 $ 356,428As a percent of Net Sales 14.9% 16.4%
Paints 168,395 159,598As a percent of Net Sales 10.1% 9.9%
Other and Administrative (9,728) (31,198)As a percent of Net Sales (4.4)% (13.0)%
Consolidated EBIT $ 488,553 $ 484,828
As a percent of Net Sales 11.9% 12.1%
1 EBIT is defined as earnings before interest and taxes.
• Consolidated EBIT – EBIT for 2013 increased$3,725 or 0.8% from the prior year. Fiscal year2013 results included restructuring charges of$36,433 or 0.9% of net sales, compared to $25,845or 0.6% of net sales in fiscal year 2012. Fiscal year2013 also included acquisition-related charges of$2,242 or 0.1% of net sales. There were no acquisi-tion-related charges in the 2012 period. Foreigncurrency exchange fluctuation had an immaterialeffect on Consolidated EBIT, as well as EBIT of thesegments discussed below.
• Coatings Segment EBIT – EBIT as a percent of netsales decreased 150 basis points from the prioryear, primarily due to higher restructuring charges,price declines and investments in long-term growthinitiatives, partially offset by slightly lower raw mate-rial costs and lower incentive compensation costs.Restructuring charges for the 2013 and 2012periods were $19,492 or 0.9% of net sales and$1,418 or 0.1% of net sales, respectively. Acquisi-tion-related charges were $2,242 or 0.1% of netsales. There were no acquisition-related charges inthe 2012 period.
• Paints Segment EBIT – EBIT as a percent of netsales increased 20 basis points from the prior year,primarily due to slightly lower raw material costsand lower restructuring charges, partially offset bythe effect of our Ace paints acquisition, which hadlower initial margins, and investments in long-termgrowth initiatives. Restructuring charges for 2013and 2012 periods were $14,953 or 0.9% of netsales and $18,392 or 1.1% of net sales, respectively.
• Other and Administrative EBIT – Other and Admin-istrative EBIT includes corporate expenses. EBIT asa percent of net sales increased 860 basis pointsfrom the prior year primarily due to lower incentivecompensation and lower restructuring charges. EBITincluded restructuring charges of $1,988 or 0.9% ofnet sales and $6,035 or 2.5% of net sales in the2013 and 2012 periods, respectively.
Interest Expense 2013 2012
Consolidated Interest Expense $ 64,758 $67,604
• Interest Expense – Interest expense decreased infiscal year 2013 due to lower average interest rates,partially offset by a higher average debt balance. In2013, although our average debt levels increased, agreater percentage of our debt was commercialpaper, which carries a lower interest rate.
Effective Tax Rate 2013 2012
Effective Tax Rate 31.7% 29.9%
• Effective Tax Rate – The higher 2013 effective taxrate was primarily due to unfavorable changes ingeographical mix of earnings.
Net Income (Loss) 2013 2012 % Change
Consolidated NetIncome (Loss) $ 289,255 $ 292,497 (1.1)%
Financial Results 2012 vs. 2011
Net Sales 2012 2011 % Change
Coatings $ 2,175,687 $ 2,092,490 4.0%Paints 1,604,599 1,612,219 (0.5)%Other andAdministrative 240,565 248,245 (3.1)%ConsolidatedNet Sales $ 4,020,851 $ 3,952,954 1.7%
• Consolidated Net Sales – Adjusting for the negativeimpact of 1.3% from foreign currency and the posi-tive impact of 0.4% from acquisitions, sales for2012 increased 2.6%. The increase in sales was dueto carryover selling price increases in all productlines and new business, primarily in our Coatingssegment. The increase was partially offset byvolume declines caused by uneven demand in ourglobal markets.
• Coatings Segment Net Sales – Adjusting for thenegative impact of 2.3% from foreign currency andthe positive impact of 0.8% from acquisitions, salesfor 2012 increased 5.5%. The increase in sales wasprimarily due to new business and carryover sellingprice increases in all product lines. The increase waspartially offset by volume declines caused by ourdecision to exit a small number of relatively highvolume, unprofitable products and customers, andoverall market softness.
• Paints Segment Net Sales – Sales for 2012decreased 0.5%. There was no net foreign currencyimpact. The decrease in sales was primarily drivenby declines in our Australia region due to a weakresidential housing market, our efforts to rationalizecompany stores and loss of a large retail customer.This was partially offset by higher sales volumes inour China consumer paints product line.
14

• Other and Administrative Net Sales – The Otherand Administrative category includes the followingproduct lines: resins, furniture protection plans,colorants and gelcoats. Adjusting for the negativeimpact of 0.7% from foreign currency, sales forthe 2012 period decreased 2.4%. The declinewas primarily due to lower sales in the gelcoatproducts market which we exited in the fourthquarter of 2012.
Gross Profit 2012 2011
Consolidated Gross Profit $ 1,353,704 $ 1,231,808As a percent of Net Sales 33.7% 31.2%
• Gross Profit – Gross profit as a percent of net salesincreased primarily due to our carryover sellingprice increases, productivity improvements,including savings from our previously completedrestructuring actions, new business at higheraverage gross margins, acquisition-related chargesrecognized in 2011 and lower restructuring chargesin 2012. The improvement was partially offset byhigher raw material costs. Restructuring charges of$16,199 or 0.4% of net sales and $25,563 or 0.6%of net sales were included in the 2012 and 2011periods, respectively. There were no acquisition-related charges included in gross profit in the 2012period. Acquisition-related charges were $11,416 or0.3% of net sales in the 2011 period.
Operating Expenses 2012 2011
Consolidated Operating Expenses1 $ 871,434 $ 862,160As a percent of Net Sales 21.7% 21.8%
1 Includes research and development, selling, general andadministrative and restructuring costs. For breakout see Consoli-dated Statements of Operations.
• Consolidated Operating Expenses (dollars) –Consolidated operating expenses increased 1.1% or$9,274 compared to the prior year. The increasewas driven primarily by higher incentive compensa-tion and investments in growth initiatives, partiallyoffset by savings from previously completed restruc-turing initiatives. Restructuring charges of $9,646 or0.2% of net sales and $8,876 or 0.2% of net saleswere included in the 2012 and 2011 periods,respectively. There were no acquisition-relatedcharges included in operating expenses in the 2012period. Acquisition-related charges of $1,859 or0.1% of net sales were included in operatingexpenses in the 2011 period.
EBIT1 2012 2011
Coatings $ 356,428 $ (112,209)As a percent of Net Sales 16.4% (5.4)%
Paints 159,598 134,886As a percent of Net Sales 9.9% 8.4%
Other and Administrative (31,198) (64,320)As a percent of Net Sales (13.0)% (25.9)%
Consolidated EBIT $ 484,828 $ (41,643)
As a percent of Net Sales 12.1% (1.1)%
1 EBIT is defined as earnings before interest and taxes
• Consolidated EBIT – EBIT for 2012 increased$526,471 from the prior year. Fiscal year 2012includes restructuring charges of $25,845 or 0.6%of net sales. Fiscal year 2011 includes the impair-ment charge of $409,714 or 10.4% of net sales,restructuring charges of $34,439 or 0.9% of netsales and acquisition-related charges of $13,275 or0.3% net sales. Foreign currency exchange fluctua-tion had an immaterial effect on Consolidated EBIT,as well as EBIT of the segments discussed below.
• Coatings Segment EBIT – EBIT as a percent of netsales increased primarily due to the impairmentcharge recognized in 2011, carryover selling priceincreases, productivity improvements, includingsavings from our previously completed restructuringactions, higher margin new business and lowerrestructuring charges in 2012. The increase waspartially offset by higher raw material costs. Therestructuring charges for 2012 and 2011 periodswere $1,418 or 0.1% of net sales and $20,940 or1.0% of net sales, respectively. There were no acqui-sition-related charges included in EBIT in the 2012period. EBIT included acquisition-related charges of$1,859 or 0.1% of net sales in the 2011 period.There was no impairment charge on goodwill andintangible assets included in EBIT in the 2012period. EBIT included an impairment charge of$368,062 or 17.6% of net sales in the 2011 period.
• Paints Segment EBIT – EBIT as a percent of netsales increased primarily due to selling priceincreases, productivity improvements, includingsavings from our previously completed restructuringactions particularly in our Australia paints productline, and acquisition-related charges recognized inthe first half of 2011. These improvements werepartially offset by higher raw material costs andhigher restructuring charges in 2012 versus 2011.The restructuring charges for 2012 and 2011periods were $18,392 or 1.1% of net sales and$13,013 or 0.8% of net sales, respectively. Therewere no acquisition-related charges included in EBITin the 2012 period. EBIT included acquisition-related charges of $11,416 or 0.7% of net sales inthe 2011 period.
15

• Other and Administrative EBIT – Other and Admin-istrative EBIT includes corporate expenses. EBIT as apercent of net sales increased compared to the prioryear primarily due to the impairment charge of$41,652 or 16.8% of net sales recognized in thefourth quarter of 2011, partially offset by higherrestructuring charges in the 2012 period. EBITincluded restructuring charges of $6,035 or 2.5% ofnet sales and $486 or 0.2% of net sales in the 2012and 2011 periods, respectively.
Interest Expense 2012 2011
Consolidated Interest Expense $ 67,604 $ 61,511
• Interest Expense – The 2012 increase reflects theissuance of $400,000 in Senior Notes in the firstquarter of 2012 and an increase in our weightedaverage interest rate to 5.70% in 2012 from 5.36%in 2011.
Effective Tax Rate 2012 2011
Effective Tax Rate 29.9% 34.4%
• Effective Tax Rate – The lower effective tax rate in2012 is due to the impact of impairment charges in2011, which are nondeductible for tax purposes.Excluding the impact of the impairment charges,our fiscal 2011 effective tax rate was 26.7%. Thecomparatively higher 2012 effective tax rate of29.9% was driven by an unfavorable geographicmix of earnings in 2012, favorable tax rulings in2011 and lower discrete benefits from statutelapses in 2012.
Net Income (Loss) 2012 2011 % Change
Consolidated NetIncome (Loss) $ 292,497 $ (138,601) 311.0%
FINANCIAL CONDITION
Cash Flow and Net Working Capital
Cash flow from operations was $398,504 in 2013,compared to $348,868 in 2012 and $291,174 in 2011.The improvement in cash flow in 2013 was primarilydriven by efficient working capital management. A keymetric we use to measure the effectiveness of ourworking capital management is net working capital as apercentage of annual net sales:
% of % ofOct. 25, Net Oct. 26, Net2013 Sales 2012 Sales
Accounts andnotes receiv-able, net $ 771,396 18.8% $ 681,099 16.9%Inventories 438,982 10.7% 360,427 9.0%Trade accountspayable (618,787) (15.1)% (502,967) (12.5)%Net WorkingCapital $ 591,591 14.4% $ 538,559 13.4%
Our net working capital as a percentage of net salesincreased to 14.4% from 13.4%, primarily due toacquisitions and growth initiatives. Accounts receivableincreased primarily due to acquisitions. Inventoriesincreased primarily due to our new business initiativesand acquisitions. Accounts payable increased due toacquisitions as well as the improvement in our dayspayable outstanding. Excluding the effect of the InverGroup acquisition, our working capital as a percentageof net sales was 12.7%. Inver Group net working capitalwas $75,347 as of October 25, 2013.
During the 2013 period, we used cash flow from opera-tions and $297,906 in net proceeds from bank borrow-ings and commercial paper to fund $378,141 in sharerepurchases, $219,912 in acquisitions and $116,749in capital expenditures. We used cash on hand and$32,596 in proceeds from the sale of treasury stock tofund $81,189 in dividend payments.
See Notes 1 and 7 in Notes to Consolidated FinancialStatements for more information related to ourrestricted cash which is restricted from withdrawal forcontractual or legal reasons.
Debt and Capital Resources
The ratio of total debt to capital was 56.8% atOctober 25, 2013, compared to 48.5% at October 26,2012. Average debt outstanding during 2013 was$1,338,557 at a weighted average interest rate of 4.84%versus $1,185,272 at 5.70% last year. Interest expensefor 2013 was $64,758 compared to $67,604 in 2012.
Under various agreements, we are obligated to makefuture cash payments in fixed amounts. These includepayments under our multi-currency credit facilities,senior notes, industrial development bonds, employeebenefit plans, non-cancelable operating leases withinitial or remaining terms in excess of one year, capitalexpenditures, commodity purchase commitments,telecommunication commitments and marketingcommitments. Some of our interest charges are variableand are assumed at current rates.
We maintain an unsecured revolving credit facility witha syndicate of banks. Subsequent to October 25, 2013,we entered into an amended and restated $750,000credit facility with a syndicate of banks with a maturitydate of December 14, 2018 to replace the previous$550,000 credit facility scheduled to expireDecember 31, 2014. In July 2013, we entered into a U.S.dollar equivalent unsecured committed revolving bilat-eral credit facility, expiring July 2014 and terminated aprior facility scheduled to expire in September 2013.
We maintain uncommitted bank lines of credit to meetshort-term funding needs in certain of our internationallocations. These arrangements are reviewed periodicallyfor renewal and modification.
16
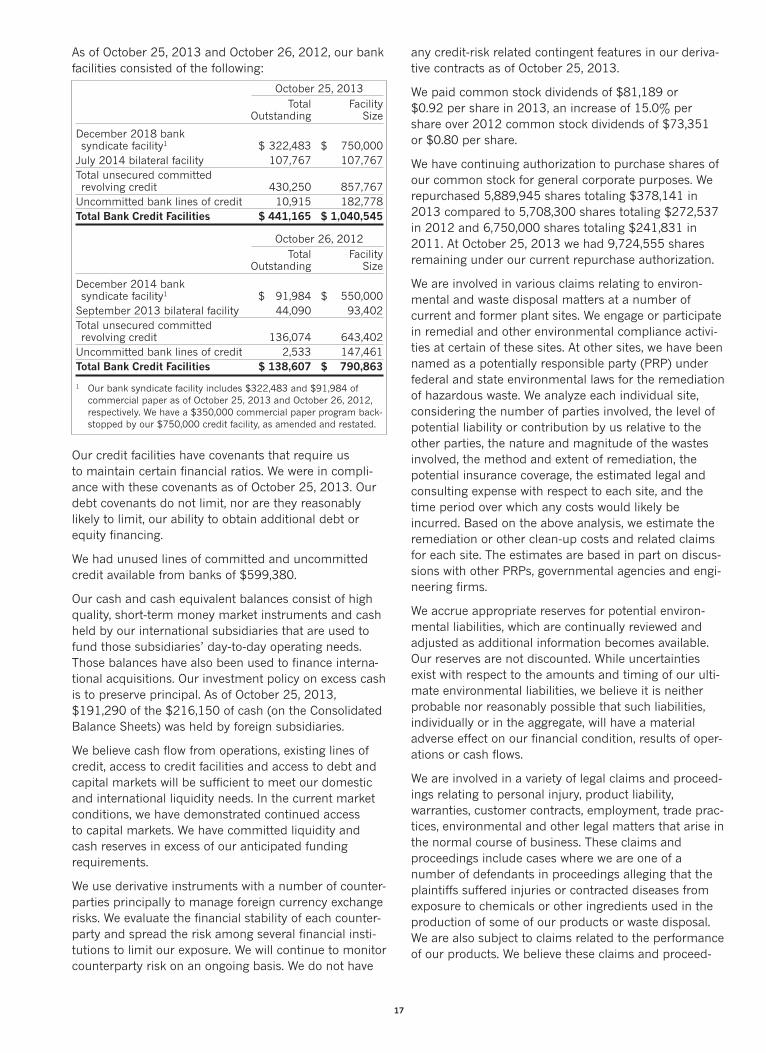
As of October 25, 2013 and October 26, 2012, our bankfacilities consisted of the following:
October 25, 2013Total Facility
Outstanding Size
December 2018 banksyndicate facility1 $ 322,483 $ 750,000July 2014 bilateral facility 107,767 107,767Total unsecured committedrevolving credit 430,250 857,767Uncommitted bank lines of credit 10,915 182,778Total Bank Credit Facilities $ 441,165 $ 1,040,545
October 26, 2012Total Facility
Outstanding Size
December 2014 banksyndicate facility1 $ 91,984 $ 550,000September 2013 bilateral facility 44,090 93,402Total unsecured committedrevolving credit 136,074 643,402Uncommitted bank lines of credit 2,533 147,461Total Bank Credit Facilities $ 138,607 $ 790,863
1 Our bank syndicate facility includes $322,483 and $91,984 ofcommercial paper as of October 25, 2013 and October 26, 2012,respectively. We have a $350,000 commercial paper program back-stopped by our $750,000 credit facility, as amended and restated.
Our credit facilities have covenants that require usto maintain certain financial ratios. We were in compli-ance with these covenants as of October 25, 2013. Ourdebt covenants do not limit, nor are they reasonablylikely to limit, our ability to obtain additional debt orequity financing.
We had unused lines of committed and uncommittedcredit available from banks of $599,380.
Our cash and cash equivalent balances consist of highquality, short-term money market instruments and cashheld by our international subsidiaries that are used tofund those subsidiaries’ day-to-day operating needs.Those balances have also been used to finance interna-tional acquisitions. Our investment policy on excess cashis to preserve principal. As of October 25, 2013,$191,290 of the $216,150 of cash (on the ConsolidatedBalance Sheets) was held by foreign subsidiaries.
We believe cash flow from operations, existing lines ofcredit, access to credit facilities and access to debt andcapital markets will be sufficient to meet our domesticand international liquidity needs. In the current marketconditions, we have demonstrated continued accessto capital markets. We have committed liquidity andcash reserves in excess of our anticipated fundingrequirements.
We use derivative instruments with a number of counter-parties principally to manage foreign currency exchangerisks. We evaluate the financial stability of each counter-party and spread the risk among several financial insti-tutions to limit our exposure. We will continue to monitorcounterparty risk on an ongoing basis. We do not have
any credit-risk related contingent features in our deriva-tive contracts as of October 25, 2013.
We paid common stock dividends of $81,189 or$0.92 per share in 2013, an increase of 15.0% pershare over 2012 common stock dividends of $73,351or $0.80 per share.
We have continuing authorization to purchase shares ofour common stock for general corporate purposes. Werepurchased 5,889,945 shares totaling $378,141 in2013 compared to 5,708,300 shares totaling $272,537in 2012 and 6,750,000 shares totaling $241,831 in2011. At October 25, 2013 we had 9,724,555 sharesremaining under our current repurchase authorization.
We are involved in various claims relating to environ-mental and waste disposal matters at a number ofcurrent and former plant sites. We engage or participatein remedial and other environmental compliance activi-ties at certain of these sites. At other sites, we have beennamed as a potentially responsible party (PRP) underfederal and state environmental laws for the remediationof hazardous waste. We analyze each individual site,considering the number of parties involved, the level ofpotential liability or contribution by us relative to theother parties, the nature and magnitude of the wastesinvolved, the method and extent of remediation, thepotential insurance coverage, the estimated legal andconsulting expense with respect to each site, and thetime period over which any costs would likely beincurred. Based on the above analysis, we estimate theremediation or other clean-up costs and related claimsfor each site. The estimates are based in part on discus-sions with other PRPs, governmental agencies and engi-neering firms.
We accrue appropriate reserves for potential environ-mental liabilities, which are continually reviewed andadjusted as additional information becomes available.Our reserves are not discounted. While uncertaintiesexist with respect to the amounts and timing of our ulti-mate environmental liabilities, we believe it is neitherprobable nor reasonably possible that such liabilities,individually or in the aggregate, will have a materialadverse effect on our financial condition, results of oper-ations or cash flows.
We are involved in a variety of legal claims and proceed-ings relating to personal injury, product liability,warranties, customer contracts, employment, trade prac-tices, environmental and other legal matters that arise inthe normal course of business. These claims andproceedings include cases where we are one of anumber of defendants in proceedings alleging that theplaintiffs suffered injuries or contracted diseases fromexposure to chemicals or other ingredients used in theproduction of some of our products or waste disposal.We are also subject to claims related to the performanceof our products. We believe these claims and proceed-
17

We expect to make cash outlays in the future related touncertain tax positions. However, due to the uncertaintyof the timing of future cash flows, we are unable to makereasonably reliable estimates of the period of cashsettlement, if any, with the respective taxing authorities.Accordingly, unrecognized tax benefits of $15,363 asof October 25, 2013, have been excluded from thecontractual obligations table above. For further informa-tion related to unrecognized tax benefits see Note 12 inNotes to Consolidated Financial Statements.
NON-GAAP FINANCIAL MEASURES
This section includes financial information prepared inaccordance with accounting principles generallyaccepted in the United States (GAAP), as well as certainnon-GAAP financial measures such as adjusted grossprofit, adjusted operating expense, adjusted earningsbefore interest and taxes (EBIT), adjusted net incomeand adjusted net income per common share – diluted.Generally, a non-GAAP financial measure is a numericalmeasure of financial performance that excludes (orincludes) amounts that are included in (or excludedfrom) the most directly comparable measure calculatedand presented in accordance with GAAP. The non-GAAPfinancial measures should be viewed as a supplementto, and not a substitute for, financial measures presentedin accordance with GAAP. Non-GAAP measures aspresented herein may not be comparable to similarlytitled measures used by other companies.
We believe that the non-GAAP financial measuresprovide meaningful information to assist investors inunderstanding our financial results and assessingprospects for future performance without regard torestructuring and acquisition-related charges. We believeadjusted gross profit, adjusted operating expense,adjusted EBIT, adjusted net income and adjusted netincome per common share – diluted are important indi-cators of our operations because they exclude items thatmay not be indicative of or are unrelated to our coreoperating results and provide a baseline for analyzingtrends in our underlying business. To measure adjustedgross profit, adjusted operating expense and adjustedEBIT, we remove the impact of before-tax restructuringand acquisition-related charges. Adjusted net incomeand adjusted net income per common share – dilutedare calculated by removing the after-tax impact ofrestructuring and acquisition-related charges from ourcalculated net income and net income per commonshare – diluted. Since non-GAAP financial measures arenot standardized, it may not be possible to comparethese financial measures with other companies’ non-GAAP financial measures. These non-GAAP financialmeasures are an additional way to view aspects of ouroperations that, when viewed with our GAAP results andthe reconciliations to corresponding GAAP financialmeasures below, provide a more complete under-standing of our business. We strongly encourageinvestors and shareholders to review our financial state-ments and publicly filed reports in their entirety and notto rely on any single financial measure.
18
ings are in the ordinary course for a business of the type and size in which we are engaged. While we are unable topredict the ultimate outcome of these claims and proceedings, we believe it is neither probable nor reasonablypossible that the costs and liabilities of such matters, individually or in the aggregate, will have a material adverseeffect on our financial condition, results of operations or cash flows.
Contractual Obligations
The following table summarizes our contractual obligations as of October 25, 2013 for the fiscal years endingin October:
2019 and2014 2015 2016 2017 2018 thereafter Total
Notes & Interest to Banks $ 442,758 $ 239 $ 216 $ 216 $ 17,395 $ 7,682 $ 468,506Senior Notes & Interest 55,275 203,363 47,625 193,087 38,550 768,194 1,306,094Industrial Development Bonds & Interest 31 12,522 — — — — 12,553Medical Retiree/SERP/Pension 4,370 1,703 1,510 1,862 1,578 18,931 29,954Operating Leases 35,359 27,139 21,941 15,068 9,541 43,453 152,501Capital Expenditures 27,314 — — — — — 27,314Commodity Purchase Commitments 10,264 70,148 76,592 — — — 157,004Telecommunication Commitments 885 — — — — — 885Marketing Commitments 10,840 51,840 12,035 12,237 5,340 5,340 97,632Total Contractual Cash Obligations $ 587,096 $ 366,954 $ 159,919 $ 222,470 $ 72,404 $ 843,600 $ 2,252,443

The following table reconciles gross profit, operating expense, EBIT, net income and net income per commonshare – diluted (GAAP financial measures) to adjusted gross profit, adjusted operating expense, adjusted EBIT,adjusted net income and adjusted net income per common share – diluted (non-GAAP financial measures) for theperiods presented:
Fiscal Years2013 2012
Coatings SegmentEarnings before interest and taxes (EBIT) $ 329,886 $ 356,428Restructuring charges – cost of sales 11,718 1,070Acquisition-related charges – cost of sales 513 —Restructuring charges – operating expense 7,774 348Acquisition-related charges – operating expense 1,729 —Adjusted EBIT $ 351,620 $ 357,846
Paints SegmentEBIT $ 168,395 $ 159,598Restructuring charges – cost of sales 9,781 10,589Restructuring charges – operating expense 5,172 7,803Adjusted EBIT $ 183,348 $ 177,990
Other and AdministrativeEBIT $ (9,728) $ (31,198)Restructuring charges – cost of sales 417 4,540Restructuring charges – operating expense 1,571 1,495Adjusted EBIT $ (7,740) $ (25,163)
ConsolidatedGross profit $ 1,358,058 $ 1,353,704Restructuring charges – cost of sales 21,916 16,199Acquisition-related charges – cost of sales 513 —Adjusted gross profit $ 1,380,487 $ 1,369,903
Operating expense $ 865,634 $ 871,434Restructuring charges – operating expense (14,517) (9,646)Acquisition-related charges – operating expense (1,729) —Adjusted operating expense $ 849,388 $ 861,788
EBIT $ 488,553 $ 484,828Restructuring charges – total 36,433 25,845Acquisition-related charges – total 2,242 —Adjusted EBIT $ 527,228 $ 510,673
Net income $ 289,255 $ 292,497After tax restructuring charges – total1 29,094 17,422After tax acquisition-related charges – total1 2,083 —Adjusted net income $ 320,432 $ 309,919
Net income per common share – diluted $ 3.20 $ 3.10Restructuring charges – total 0.32 0.18Acquisition-related charges – total 0.02 —Adjusted net income per common share – diluted $ 3.54 $ 3.28
1 The tax effect of restructuring and acquisition-related charges is calculated using the effective tax rate of the jurisdiction in which the chargeswere incurred.
See Note 18 in Notes to Consolidated Financial Statements for further information on restructuring.
19

CRITICAL ACCOUNTING ESTIMATES
The discussion and analysis of our financial conditionand results of operations are based upon our Consoli-dated Financial Statements, which have been preparedin accordance with generally accepted accounting prin-ciples in the United States (GAAP). The preparation ofthese financial statements requires us to make estimatesand assumptions that affect the reported amounts ofassets and liabilities, revenues and expenses, and relateddisclosure of any contingent assets and liabilities at thedate of the financial statements. We regularly review ourestimates and assumptions, which are based on histor-ical experience and on various other factors that arebelieved to be reasonable under the circumstances, theresults of which form the basis for making judgmentsabout the carrying values of assets and liabilities that arenot readily apparent from other sources. Actual resultsmay differ from these estimates under different assump-tions or conditions.
We believe the following areas are affected by significantjudgments and estimates used in the preparation of ourConsolidated Financial Statements and that the judg-ments and estimates are reasonable:
Revenue Recognition
Other than extended furniture protection plans, revenuefrom sales is recognized at the time the product is deliv-ered or title has passed, a sales agreement is in place,pricing is fixed or determinable and collection is reason-ably assured. Discounts provided to customers at thepoint of sale are recognized as a reduction in revenue asthe products are sold. In the U.S., we sell extended furni-ture protection plans for which revenue is deferred andrecognized over the life of the contract. An actuarialstudy utilizing historical claims data is used to forecastclaim payments over the contract period, and revenue isrecognized based on the forecasted claims payments.Actual claims costs are reflected in earnings in theperiod incurred. Anticipated losses on programs inprogress are charged to earnings when identified.
Supplier and Customer Rebates
In accordance with underlying agreements, as they areearned, we estimate and record supplier and customerrebates as a reduction of cost of goods sold or a reduc-tion to revenue, respectively. The customer rebate esti-mate is developed based on historical experience pluscurrent activity for the customer’s purchases. Customerrebates that increase based on different levels of salesvolume are recognized immediately when the currentactivity plus expected volume triggers a higher earnedrebate. The supplier rebate estimate is developed basedon contractual terms of our current purchasing activity.Supplier rebates that increase based on different levelsof purchases are recognized when there is certaintythat the current level of purchases will trigger a higherrebate earned.
Valuation of Goodwill and Indefinite-LivedIntangible Assets
Goodwill represents the excess of cost over the fairvalue of identifiable net assets of businesses acquired.Other intangible assets consist of customer listsand relationships, purchased technology and patentsand trademarks.
Evaluating goodwill for impairment involves the determi-nation of the fair value of our reporting units in which wehave recorded goodwill. A reporting unit is a componentof an operating segment for which discrete financialinformation is available and reviewed by managementon a regular basis. We have determined that we havefive separate reporting units.
Goodwill for each of our reporting units is reviewed forimpairment at least annually using a two-step process,as we have chosen not to perform a qualitative assess-ment for impairment. In the first step, we compare thefair value of each reporting unit to its carrying value,including goodwill. We use the following four materialassumptions in our fair value analysis: (a) discountrates; (b) long-term sales growth rates; (c) forecastedoperating margins; and (d) market multiples. If the fairvalue exceeds the carrying value, no further work isrequired and no impairment loss is recognized. If thecarrying value exceeds the fair value, the goodwill of thereporting unit is potentially impaired and we would thencomplete step 2 in order to measure the impairmentloss. In step 2, we would calculate the implied fair valueof goodwill by deducting the fair value of all tangible andintangible net assets (including unrecognized intangibleassets) of the reporting unit from the fair value of thereporting unit. If the implied fair value of goodwill is lessthan the carrying value of goodwill, we would recognizean impairment loss, in the period identified, equal tothe difference.
We review indefinite-lived intangible assets at leastannually for impairment by calculating the fair value ofthe assets and comparing those fair values to thecarrying value, as we have chosen not to perform a qual-itative assessment for impairment. In assessing fairvalue, we generally utilize a relief from royalty method. Ifthe carrying value of the indefinite-lived intangible assetsexceeds the fair value of the asset, the carrying value iswritten down to fair value in the period identified.
During the fourth quarters of 2013 and 2012, wecompleted our annual goodwill and indefinite-livedintangible asset impairment reviews with no impair-ments to the carrying values identified. There was nochange to our reporting units in 2013 or 2012, otherthan our exit from the gelcoat products market infiscal 2012.
In the fourth quarter of 2011, we completed our annualgoodwill and indefinite-lived intangible asset impairmentreviews. During the goodwill review, the carrying valuefor the wood coatings and gelcoat reporting units
20

exceeded the fair value, requiring a step 2 valuationusing an income approach (Level 3 measurement in thefair value hierarchy). As a result, we recorded a pre-taximpairment loss of $409,714 in the fourth quarter of2011. This represents impairment of goodwill and intan-gible assets in our wood coatings reporting unit, part ofour Coatings segment, and in our gelcoat reporting unit,part of Other and Administrative. There is no goodwillremaining in the reporting units in which impairmentwas recorded. In addition, no impairment to the carryingvalues of the other reporting units was identified.
Considerable management judgment is necessary toevaluate the impact of operating and macroeconomicchanges and to estimate future cash flows. Assumptionsused in our impairment evaluations, such as long-termsales growth rates, forecasted operating margins, marketmultiples and our discount rate, are based on the bestavailable market information at the time of our analysisand are consistent with our internal forecasts and oper-ating plans. Additionally, in assessing goodwill impair-ment we considered the implied control premium andconcluded it was reasonable based on other recentmarket transactions. Changes in these estimates or acontinued decline in general economic conditions couldchange our conclusion regarding an impairment ofgoodwill and potentially result in a non-cash impairmentloss in a future period.
The discount rate, long-term sales growth rate, fore-casted operating margins and market multiple assump-tions are the four material assumptions utilized in ourcalculations of the present value cash flows and thebusiness enterprise fair value used to estimate the fairvalue of the reporting units when performing the annualgoodwill impairment test and in testing indefinite-livedintangible assets for impairment. We utilize a cash flowapproach (Level 3 valuation technique) in estimating thefair value of the reporting units for the income approach,where the discount rate reflects a weighted average costof capital rate. The cash flow model used to derive fairvalue is most sensitive to the discount rate, long-termsales growth rate and forecasted operating marginassumptions used. For the market approach, averagerevenue and earnings before interest, tax, depreciationand amortization multiples derived from our peer groupare weighted and adjusted for size, risk and growth ofthe individual reporting unit to determine the reportingunit’s business enterprise fair value. The resulting valuesfrom the two approaches are weighted to derive the finalfair value of the reporting units that will be comparedwith the reporting units carrying value when assessingimpairment in step 1.
For reporting units that pass step 1, we perform a sensi-tivity analysis on the discount rate, long-term salesgrowth rate and forecasted operating margin assump-tions. The discount rate could increase by more than10% of the discount rate utilized, the long-term salesgrowth rate assumption could decline to a zero growthenvironment, or costs could remain at the current
spending level with no cost savings realized in futureperiods and our reporting units and indefinite-livedintangible assets would continue to have fair value inexcess of carrying value. In fiscal 2013, we have noreporting units that are at risk of failing step 1 of ourgoodwill or indefinite-lived intangible asset impairmenttests as the fair values of the reporting units substan-tially exceed their respective carrying values. There havebeen no significant events since the timing of ourimpairment tests that would have triggered additionalimpairment testing.
The assumptions used in our impairment testing couldbe adversely affected by certain risks discussed in “RiskFactors” in Item 1A of this report. For additional informa-tion about goodwill and intangible assets, see Note 1and 4 in Notes to Consolidated Financial Statements.
Pension and Post-Retirement Medical Obligations
We sponsor several defined benefit plans for certainhourly and salaried employees. We sponsor post-retire-ment medical benefits for certain U.S. employees. Theamounts recognized in our financial statements aredetermined on an actuarial basis. To accomplish this,extensive use is made of assumptions about inflation,investment returns, mortality, turnover, medical trendrates and discount rates. A change in these assumptionscould cause actual results to differ from those reported.A reduction of 50 basis points in the long-term rate ofreturn and a reduction of 50 basis points in the discountrate would have increased our pension expense $3,066in fiscal 2013. A 1% increase in the medical trend rateswould not have a material effect on post-retirementmedical expense or the post-retirement benefit obliga-tion. See Note 11 in Notes to Consolidated FinancialStatements, for further details regarding accounting forpensions and post-retirement medical benefits.
Income Taxes
At each period end, it is necessary for us to make certainestimates and assumptions to compute the provision forincome taxes including, but not limited to the projec-tions of the proportion of income (or loss) earned andtaxed in the foreign jurisdictions and the extent to whichthis income (or loss) may also be taxed in the UnitedStates, permanent and temporary differences, the likeli-hood of deferred tax assets being recovered and theoutcome of uncertain tax positions. Our income taxreturns, like those of most companies, are periodicallyaudited by domestic and foreign tax authorities. Theseaudits include questions regarding our tax filing posi-tions, including the timing and amount of deductionsand the allocation of income among various tax jurisdic-tions. At any one time, multiple tax years are subject toaudit by the various tax authorities. We record anaccrual for more likely than not exposures after evalu-ating the positions associated with our various incometax filings. A number of years may elapse before aparticular matter for which we have established anaccrual is audited and fully resolved or clarified. We
21

adjust our tax contingencies accrual and income taxprovision in the period in which matters are effectivelysettled with tax authorities at amounts different from ourestablished accrual, the statute of limitations expires forthe relevant taxing authority to examine the tax positionor when more information becomes available. TheInternal Revenue Service (IRS) concluded its examina-tion of our U.S. federal tax returns for the fiscal yearsended 2009 and 2010 in October 2012. There were nomaterial adjustments to our income tax expense orbalance of unrecognized tax benefits as a result of theIRS examination. We are currently under audit in severalstate and foreign jurisdictions. We also expect variousstatutes of limitation to expire during the next 12months. While we do not expect any material adjust-ments in the next twelve months due to the pendingaudit activity or expiring statutes, we are unable to esti-mate a range of outcomes at this time.
OFF-BALANCE SHEET ARRANGEMENTS
We do not have off-balance sheet arrangements thathave, or are reasonably likely to have, a current orfuture material effect on our financial condition,changes in financial condition, revenues or expenses,results of operations, liquidity, capital expenditures orcapital resources.
FORWARD-LOOKING STATEMENTS
Certain statements contained in “Management’sDiscussion and Analysis of Financial Condition andResults of Operations” and elsewhere in this reportconstitute “forward-looking statements” within themeaning of Section 27A of the Securities Act of 1933, asamended, and Section 21E of the Securities ExchangeAct of 1934, as amended. The Private Securities Litiga-tion Reform Act of 1995 provides a safe harbor forforward-looking statements.
Forward-looking statements are based on management’scurrent expectations, estimates, assumptions and beliefsabout future events, conditions and financial perform-ance. Forward-looking statements are subject to risks,uncertainties and other factors, many of which areoutside our control and could cause actual results todiffer materially from such statements. Any statementthat is not historical in nature is a forward-looking state-ment. We may identify forward-looking statements withwords and phrases such as “expects,” “projects,” “esti-mates,” “anticipates,” “believes,” “could,” “may,” “will,”“plans to,” “intend,” “should” and similar expressions.
These risks, uncertainties and other factors include, butare not limited to, deterioration in general economicconditions, both domestic and international, that mayadversely affect our business; fluctuations in availabilityand prices of raw materials, including raw materialshortages and other supply chain disruptions, and theinability to pass along or delays in passing along rawmaterial cost increases to our customers; dependence ofinternal sales and earnings growth on business cycles
affecting our customers and growth in the domestic andinternational coatings industry; market share loss to,and pricing or margin pressure from, larger competitorswith greater financial resources; significant indebtednessthat restricts the use of cash flow from operations foracquisitions and other investments; dependence onacquisitions for growth, and risks related to future acqui-sitions, including adverse changes in the results ofacquired businesses, the assumption of unforeseenliabilities and disruptions resulting from the integrationof acquisitions; risks and uncertainties associated withoperations and achievement of profitable growth indeveloping markets, including Asia and Central andSouth America; loss of business with key customers;damage to our reputation and business resulting fromproduct claims or recalls, litigation, customer perceptionand other matters; our ability to respond to technologychanges and to protect our technology; possible inter-ruption, failure or compromise of the informationsystems we use to operate our business; changes ingovernmental regulation, including more stringent envi-ronmental, health and safety regulations; our relianceon the efforts of vendors, government agencies, utilitiesand other third parties to achieve adequate complianceand avoid disruption of our business; unusual weatherconditions adversely affecting sales; changes inaccounting policies and standards and taxation require-ments such as new tax laws or revised tax law interpre-tations; the nature, cost and outcome of pending andfuture litigation and other legal proceedings; and civilunrest and the outbreak of war and other significantnational and international events.
We undertake no obligation to subsequently revise anyforward-looking statement to reflect new information,events or circumstances after the date of such state-ment, except as required by law.
ITEM 7A QUANTITATIVE AND QUALITATIVEDISCLOSURES ABOUT MARKET RISK
Our foreign sales and results of operations are subjectto the impact of foreign currency fluctuations. Asmost of our underlying costs are denominated in thesame currency as our sales, the effect has not beenmaterial. We have not hedged our exposure to transla-tion gains and losses; however, we have reduced ourexposure by borrowing funds in local currencies. A 10%adverse change in foreign currency rates is not expectedto have a material effect on our results of operations orfinancial position.
We are also subject to interest rate risk. At October 25,2013, approximately 32.4% of our total debt consistedof floating rate debt. From time to time, we may enterinto interest rate derivatives to hedge a portion of eitherour variable or fixed rate debt. Assuming the currentlevel of borrowings, a 10% increase in interest ratesfrom those in effect at the end of the fourth quarterwould not have a material impact on our results of oper-ations or financial position.
22

ITEM 8 FINANCIAL STATEMENTS AND SUPPLEMENTARY DATA
REPORT OF MANAGEMENT ON INTERNAL CONTROL OVER FINANCIAL REPORTING
Board of Directors and StockholdersThe Valspar Corporation
The Valspar Corporation’s (the “Company”) management is responsible for establishing and maintaining adequateinternal control over financial reporting, as such term is defined in Exchange Act Rules 13a-15(f). The Company’sinternal control system is designed to provide reasonable assurance regarding the reliability of financial reporting andthe preparation of financial statements in accordance with U.S. generally accepted accounting principles. Because ofits inherent limitations, internal control over financial reporting may not prevent or detect misstatements.
Under the supervision and with the participation of management, including its principal executive officer andprincipal financial officer, the Company’s management assessed the design and operating effectiveness of internalcontrol over financial reporting as of October 25, 2013 based on criteria set forth in Internal Control – IntegratedFramework issued by the Committee of Sponsoring Organizations of the Treadway Commission (1992 framework)(COSO).
Based on this assessment, management concluded that the Company’s internal control over financial reporting waseffective as of October 25, 2013. Ernst & Young LLP, an independent registered public accounting firm, has issued anattestation report on the Company’s internal control over financial reporting as of October 25, 2013. That report isincluded herein.
Gary E. HendricksonChairman and Chief Executive Officer
James L. MuehlbauerChief Financial and Administrative Officer
23
REPORT OF INDEPENDENT REGISTERED PUBLIC ACCOUNTING FIRM ON INTERNAL CONTROL OVERFINANCIAL REPORTING
The Board of Directors and StockholdersThe Valspar Corporation
We have audited The Valspar Corporation and subsidiaries’ internal control over financial reporting as of October 25,2013, based on criteria established in Internal Control – Integrated Framework issued by the Committee of SponsoringOrganizations of the Treadway Commission (1992 framework) (the COSO criteria). The Valspar Corporation’s manage-ment is responsible for maintaining effective internal control over financial reporting, and for its assessment of theeffectiveness of internal control over financial reporting included in the accompanying Report of Management onInternal Control over Financial Reporting. Our responsibility is to express an opinion on the corporation’s internalcontrol over financial reporting based on our audit.
We conducted our audit in accordance with the standards of the Public Company Accounting Oversight Board (UnitedStates). Those standards require that we plan and perform the audit to obtain reasonable assurance about whethereffective internal control over financial reporting was maintained in all material respects. Our audit included obtainingan understanding of internal control over financial reporting, assessing the risk that a material weakness exists, testingand evaluating the design and operating effectiveness of internal control based on the assessed risk, and performingsuch other procedures as we considered necessary in the circumstances. We believe that our audit provides a reason-able basis for our opinion.
A company’s internal control over financial reporting is a process designed to provide reasonable assurance regardingthe reliability of financial reporting and the preparation of financial statements for external purposes in accordancewith generally accepted accounting principles. A company’s internal control over financial reporting includes thosepolicies and procedures that (1) pertain to the maintenance of records that, in reasonable detail, accurately and fairlyreflect the transactions and dispositions of the assets of the company; (2) provide reasonable assurance that transac-tions are recorded as necessary to permit preparation of financial statements in accordance with generally acceptedaccounting principles, and that receipts and expenditures of the company are being made only in accordance withauthorizations of management and directors of the company; and (3) provide reasonable assurance regardingprevention or timely detection of unauthorized acquisition, use or disposition of the company’s assets that could havea material effect on the financial statements.
Because of its inherent limitations, internal control over financial reporting may not prevent or detect misstatements.Also, projections of any evaluation of effectiveness to future periods are subject to the risk that controls may becomeinadequate because of changes in conditions, or that the degree of compliance with the policies or procedures maydeteriorate.
In our opinion, The Valspar Corporation and subsidiaries maintained, in all material respects, effective internal controlover financial reporting as of October 25, 2013, based on the COSO criteria.
We also have audited, in accordance with the standards of the Public Company Accounting Oversight Board (UnitedStates), the consolidated balance sheets of The Valspar Corporation as of October 25, 2013 and October 26, 2012,and the related consolidated statements of operations, comprehensive income, changes in equity and cash flows foreach of the three years in the period ended October 25, 2013, and our report dated December 20, 2013, expressedan unqualified opinion thereon.
Minneapolis, MinnesotaDecember 20, 2013
24

REPORT OF INDEPENDENT REGISTERED PUBLIC ACCOUNTING FIRM ON CONSOLIDATEDFINANCIAL STATEMENTS
The Board of Directors and StockholdersThe Valspar Corporation
We have audited the accompanying consolidated balance sheets of The Valspar Corporation and subsidiaries (theCorporation) as of October 25, 2013 and October 26, 2012, and the related consolidated statements of operations,comprehensive income, changes in equity, and cash flows for each of the three years in the period ended October 25,2013. Our audits also included the financial statement schedule listed in Item 15 (a). These financial statements andschedule are the responsibility of the Corporation’s management. Our responsibility is to express an opinion on thesefinancial statements and schedule based on our audits.
We conducted our audits in accordance with the standards of the Public Company Accounting Oversight Board(United States). Those standards require that we plan and perform the audit to obtain reasonable assurance aboutwhether the financial statements are free of material misstatement. An audit includes examining, on a test basis,evidence supporting the amounts and disclosures in the financial statements. An audit also includes assessing theaccounting principles used and significant estimates made by management, as well as evaluating the overall financialstatement presentation. We believe that our audits provide a reasonable basis for our opinion.
In our opinion, the financial statements referred to above present fairly, in all material respects, the consolidatedfinancial position of The Valspar Corporation and subsidiaries at October 25, 2013 and October 26, 2012, and theconsolidated results of their operations and their cash flows for each of the three years in the period ended October25, 2013, in conformity with U.S. generally accepted accounting principles. Also, in our opinion, the related financialstatement schedule, when considered in relation to the basic financial statements taken as a whole, presents fairly, inall material respects, the information set forth therein.
We also have audited, in accordance with the standards of the Public Company Accounting Oversight Board (UnitedStates), The Valspar Corporation’s internal control over financial reporting as of October 25, 2013, based on criteriaestablished in Internal Control – Integrated Framework issued by the Committee of Sponsoring Organizations of theTreadway Commission (1992 framework), and our report dated December 20, 2013, expressed an unqualifiedopinion thereon.
Minneapolis, MinnesotaDecember 20, 2013
25
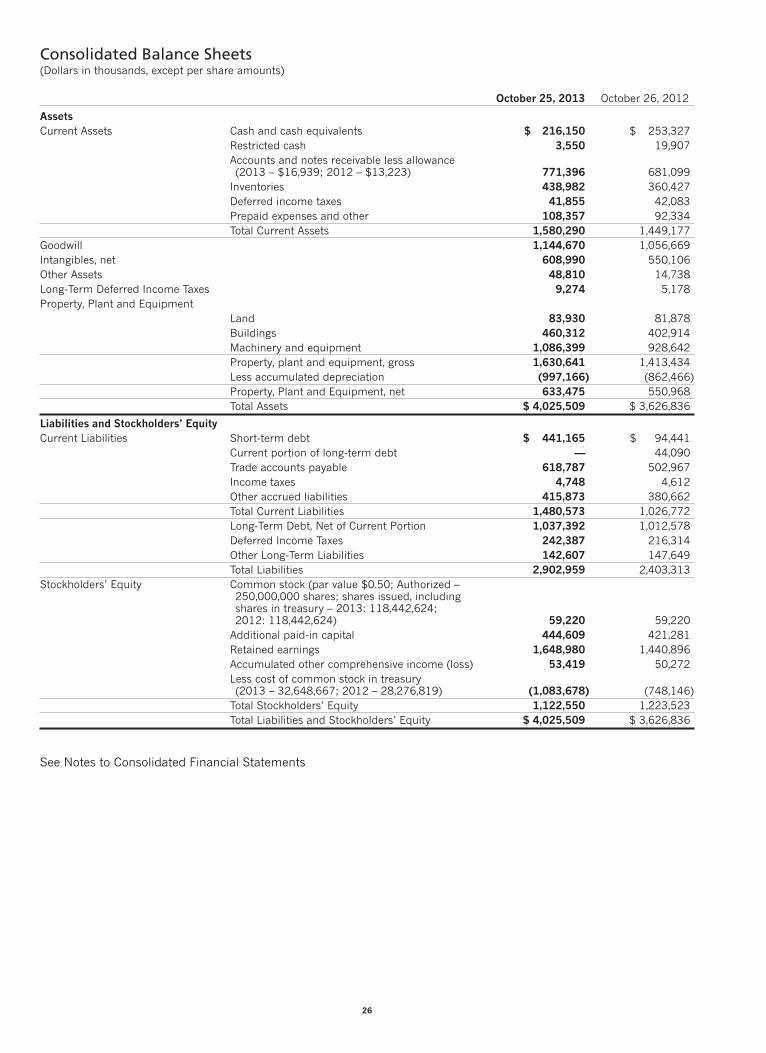
Consolidated Balance Sheets(Dollars in thousands, except per share amounts)
October 25, 2013 October 26, 2012
AssetsCurrent Assets Cash and cash equivalents $ 216,150 $ 253,327
Restricted cash 3,550 19,907Accounts and notes receivable less allowance(2013 – $16,939; 2012 – $13,223) 771,396 681,099Inventories 438,982 360,427Deferred income taxes 41,855 42,083Prepaid expenses and other 108,357 92,334Total Current Assets 1,580,290 1,449,177
Goodwill 1,144,670 1,056,669Intangibles, net 608,990 550,106Other Assets 48,810 14,738Long-Term Deferred Income Taxes 9,274 5,178Property, Plant and Equipment
Land 83,930 81,878Buildings 460,312 402,914Machinery and equipment 1,086,399 928,642Property, plant and equipment, gross 1,630,641 1,413,434Less accumulated depreciation (997,166) (862,466)Property, Plant and Equipment, net 633,475 550,968Total Assets $ 4,025,509 $ 3,626,836
Liabilities and Stockholders’ EquityCurrent Liabilities Short-term debt $ 441,165 $ 94,441
Current portion of long-term debt — 44,090Trade accounts payable 618,787 502,967Income taxes 4,748 4,612Other accrued liabilities 415,873 380,662Total Current Liabilities 1,480,573 1,026,772Long-Term Debt, Net of Current Portion 1,037,392 1,012,578Deferred Income Taxes 242,387 216,314Other Long-Term Liabilities 142,607 147,649Total Liabilities 2,902,959 2,403,313
Stockholders’ Equity Common stock (par value $0.50; Authorized –250,000,000 shares; shares issued, includingshares in treasury – 2013: 118,442,624;2012: 118,442,624) 59,220 59,220Additional paid-in capital 444,609 421,281Retained earnings 1,648,980 1,440,896Accumulated other comprehensive income (loss) 53,419 50,272Less cost of common stock in treasury(2013 – 32,648,667; 2012 – 28,276,819) (1,083,678) (748,146)Total Stockholders’ Equity 1,122,550 1,223,523Total Liabilities and Stockholders’ Equity $ 4,025,509 $ 3,626,836
See Notes to Consolidated Financial Statements
26
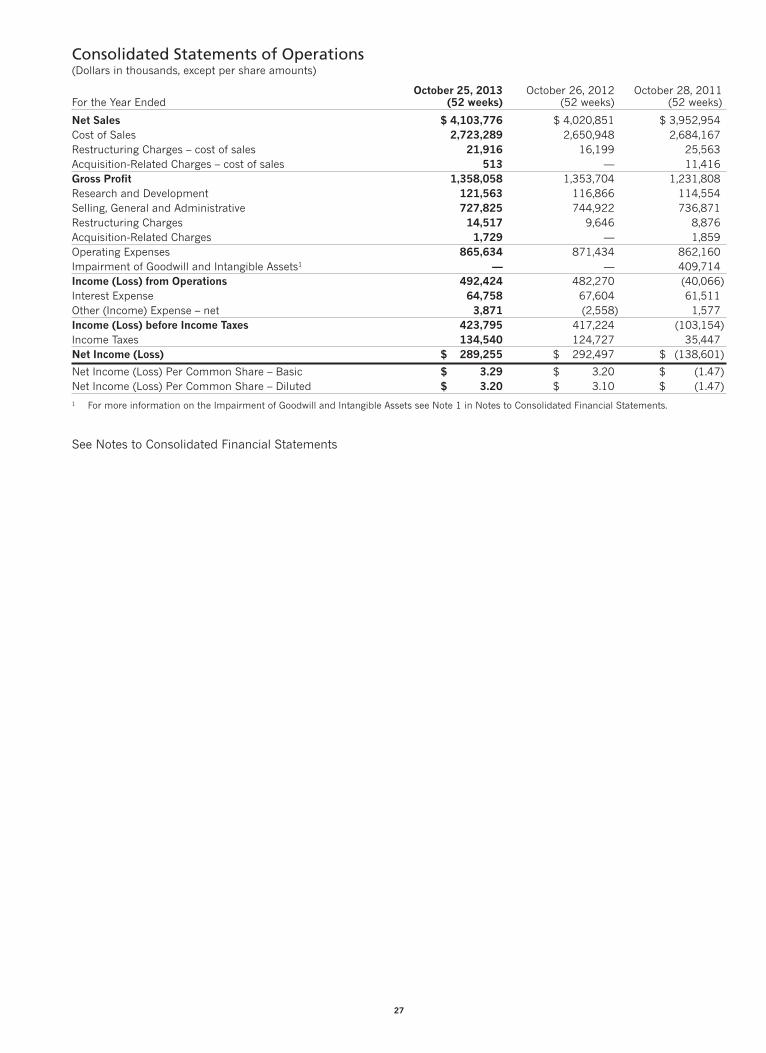
Consolidated Statements of Operations(Dollars in thousands, except per share amounts)
October 25, 2013 October 26, 2012 October 28, 2011For the Year Ended (52 weeks) (52 weeks) (52 weeks)
Net Sales $ 4,103,776 $ 4,020,851 $ 3,952,954Cost of Sales 2,723,289 2,650,948 2,684,167Restructuring Charges – cost of sales 21,916 16,199 25,563Acquisition-Related Charges – cost of sales 513 — 11,416Gross Profit 1,358,058 1,353,704 1,231,808Research and Development 121,563 116,866 114,554Selling, General and Administrative 727,825 744,922 736,871Restructuring Charges 14,517 9,646 8,876Acquisition-Related Charges 1,729 — 1,859Operating Expenses 865,634 871,434 862,160Impairment of Goodwill and Intangible Assets1 — — 409,714Income (Loss) from Operations 492,424 482,270 (40,066)Interest Expense 64,758 67,604 61,511Other (Income) Expense – net 3,871 (2,558) 1,577Income (Loss) before Income Taxes 423,795 417,224 (103,154)Income Taxes 134,540 124,727 35,447Net Income (Loss) $ 289,255 $ 292,497 $ (138,601)
Net Income (Loss) Per Common Share – Basic $ 3.29 $ 3.20 $ (1.47)Net Income (Loss) Per Common Share – Diluted $ 3.20 $ 3.10 $ (1.47)
1 For more information on the Impairment of Goodwill and Intangible Assets see Note 1 in Notes to Consolidated Financial Statements.
See Notes to Consolidated Financial Statements
27

Consolidated Statements of Comprehensive Income(Dollars in thousands)
October 25, 2013 October 26, 2012 October 28, 2011For the Year Ended (52 weeks) (52 weeks) (52 weeks)
Net Income (Loss) $ 289,255 $ 292,497 $ (138,601)Other Comprehensive Income (Loss):Foreign Currency Translation (26,007) 6,819 (7,175)Change in Benefit Obligations 45,496 (19,615) (9,540)Change in Financial Instruments 1,118 (7,074) (20,815)Income Tax Benefit (Expense) (17,460) 7,363 12,222
Other Comprehensive Income (Loss) 3,147 (12,507) (25,308)Comprehensive Income (Loss) $ 292,402 $ 279,990 $ (163,909)
See Notes to Consolidated Financial Statements
28

Statement of Changes in Equity(Dollars in thousands, except per share amounts)
AccumulatedAdditional Other
Common Paid-in Retained Treasury ComprehensiveStock Capital Earnings Stock Income (Loss) Total
Balance, October 29, 2010 $ 59,220 $ 383,167 $ 1,428,515 $ (328,624) $ 88,087 $ 1,630,365Net Income (Loss) — — (138,601) — — (138,601)Other Comprehensive Income (Loss) — — — — (25,308) (25,308)Restricted Stock Granted for225,691 Shares, net of forfeitures — 4,223 — 4,054 — 8,277Director Stock Granted for 21,258 Shares — — — 452 — 452Common Stock Options Exercised of2,122,962 Shares — 13,487 — 36,957 — 50,444Purchase of Shares of Common Stockfor Treasury of 6,750,000 Shares — — — (241,831) — (241,831)Cash Dividends on Common Stock –$0.72 per Share — — (68,164) — — (68,164)Stock Option Expense — 8,370 — — — 8,370Purchase of equity award shares — (11,454) — — — (11,454)Balance, October 28, 2011 $ 59,220 $ 397,793 $ 1,221,750 $ (528,992) $ 62,779 $ 1,212,550Net Income (Loss) — — 292,497 — — 292,497Other Comprehensive Income (Loss) — — — — (12,507) (12,507)Restricted Stock Granted for 77,622Shares, net of forfeitures — 1,588 — 1,707 — 3,295Director Stock Granted for 11,847 Shares — — — 309 — 309Common Stock Options Exercised of2,315,413 Shares — 18,068 — 51,367 — 69,435Purchase of Shares of Common Stockfor Treasury of 5,708,300 Shares — — — (272,537) — (272,537)Cash Dividends on Common Stock –$0.80 per Share — — (73,351) — — (73,351)Stock Option Expense — 7,801 — — — 7,801Purchase of equity award shares — (3,969) — — — (3,969)Balance, October 26, 2012 $ 59,220 $ 421,281 $ 1,440,896 $ (748,146) $ 50,272 $ 1,223,523Net Income (Loss) — — 289,255 — — 289,255Other Comprehensive Income (Loss) — — — — 3,147 3,147Restricted Stock Granted for 64,883Shares, net of forfeitures — 2,456 — 1,889 — 4,345Director Stock Granted for 12,958 Shares — — — 424 — 424Common Stock Options Exercised of1,500,661 Shares — 13,746 — 40,296 — 54,042Purchase of Shares of Common Stockfor Treasury of 5,889,945 Shares — — — (378,141) — (378,141)Cash Dividends on Common Stock –$0.92 per Share (net of forfeitedrestricted stock dividends of $18) — — (81,171) — — (81,171)Stock Option Expense — 7,189 — — — 7,189Purchase of equity award shares — (63) — — — (63)Balance, October 25, 2013 $ 59,220 $ 444,609 $ 1,648,980 $ (1,083,678) $ 53,419 $ 1,122,550
See Notes to Consolidated Financial Statements
29

Consolidated Statements of Cash Flows(Dollars in thousands)
October 25, 2013 October 26, 2012 October 28, 2011For the Year Ended (52 weeks) (52 weeks) (52 weeks)
Operating Activities:Net income (loss) $ 289,255 $ 292,497 $ (138,601)Adjustments to reconcile net income (loss) to netcash (used in)/provided by operating activities:Depreciation 81,122 87,151 90,109Amortization 7,037 6,553 7,638Stock-based compensation 20,807 14,352 9,783Deferred income taxes (12,740) 12,321 (35,906)Impairment of Goodwill and Intangible Assets — — 409,714(Gain)/loss on disposal of assets (376) (1,311) (420)
Changes in certain assets and liabilities, net ofeffects of acquired businesses:(Increase)/decrease in accounts and notes receivable (18,770) (10,883) (32,038)(Increase)/decrease in inventories and other assets (64,025) (35,678) 30,667Increase/(decrease) in trade accounts payable andother accrued liabilities 112,942 55,785 2,641Increase/(decrease) in income taxes payable (29,516) (32,002) (23,979)Increase/(decrease) in other deferred liabilities 6,299 (18,011) (31,925)
Settlement of Treasury Lock Contracts — (27,875) —Other 6,469 5,969 3,491
Net Cash (Used In)/Provided By Operating Activities 398,504 348,868 291,174Investing Activities:
Purchases of property, plant and equipment (116,749) (89,363) (66,469)Acquisition of businesses, net of cash acquired (219,912) — (30,579)Cash proceeds on disposal of assets 6,344 6,205 3,649(Increase)/decrease in restricted cash 16,357 471 (3,589)
Net Cash (Used In)/Provided By Investing Activities (313,960) (82,687) (96,988)Financing Activities:
Net proceeds from issuance of debt — 396,816 —Payment on retirement of debt — (200,000) —Net change in other borrowings 67,407 (46,582) (53,408)Net proceeds (repayments) of commercial paper 230,499 (61,971) 153,955Proceeds from sale of treasury stock 32,596 49,989 41,087Treasury stock purchases (378,141) (272,537) (241,831)Excess tax benefit from stock-based compensation 20,789 17,093 7,239Dividends paid (81,189) (73,351) (68,164)Purchase of equity award shares — (7,614) (11,454)
Net Cash (Used In)/Provided By Financing Activities (108,039) (198,157) (172,576)Increase/(Decrease) in Cash and Cash Equivalents (23,495) 68,024 21,610Effect of exchange rate changes on Cash andCash Equivalents (13,682) 7,136 (11,064)
Cash and Cash Equivalents at Beginning of Period 253,327 178,167 167,621Cash and Cash Equivalents at End of Period $ 216,150 $ 253,327 $ 178,167
See Notes to Consolidated Financial Statements
30
Notes to Consolidated Financial StatementsThe Valspar Corporation • Years Ended October 2013, 2012 and 2011
(Dollars in thousands, except per share amounts)
31
NOTE 1 – SIGNIFICANT ACCOUNTING POLICIESFiscal Year: The Valspar Corporation has a 4-4-5 weekaccounting cycle with the fiscal year ending on theFriday on or immediately preceding October 31. Fiscalyears 2013, 2012 and 2011 all include 52 weeks.
Principles of Consolidation: The consolidated financialstatements include the accounts of the parent companyand its subsidiaries. All intercompany accounts andtransactions have been eliminated in consolidation.Investments in which we have a 20-50% interest andwhere we do not have management control and are notthe primary beneficiary are accounted for using theequity method. In order to facilitate our year-endclosing process, foreign subsidiaries’ financial results areincluded in our consolidated financial statements on aone-month lag.
Estimates: The preparation of financial statements inconformity with United States GAAP requires us to makeestimates and assumptions that affect the amountsreported in the financial statements and accompanyingnotes. Such estimates and assumptions impact, amongothers, the following: the amount of revenue deferredunder extended furniture protection plans, the amountof supplier rebates earned, the amount of customerrebates owed, the amount to be paid for other liabilities,including contingent liabilities, assumptions around thevaluation of goodwill and indefinite-lived intangibleassets, including impairment, our pension expense andpension funding requirements, and the computation ofour income tax expense and liability. Actual results coulddiffer from these estimates.
Revenue Recognition: Other than extended furnitureprotection plans, revenue from sales is recognized atthe time the product is delivered or title has passed, asales agreement is in place, pricing is fixed or deter-minable and collection is reasonably assured. Discountsprovided to customers are recognized as a reduction inrevenue as the products are sold. In the U.S. we sellextended furniture protection plans for which revenue isdeferred and recognized over the life of the contract. Anactuarial study utilizing historical claims data is used toforecast claims payments over the contract period andrevenue is recognized over the contract period based onthe forecasted claims payments. Actual claims costs arereflected in earnings in the period incurred. Anticipatedlosses are charged to earnings when identified. Revenuesexclude sales taxes collected from our customers.
Allowance for Doubtful Accounts: We estimate theallowance for doubtful accounts by analyzing accountsreceivable by age and specific collection risk. Accountsare written off sooner in the event of bankruptcy or othercircumstances that make further collection unlikely.When it is deemed probable that a customer account is
uncollectible, that balance is written off against theexisting allowance.
Cash Equivalents: We consider all highly liquid instru-ments purchased with an original maturity of less thanthree months to be cash equivalents.
Restricted Cash: Restricted cash represents cashthat is restricted from withdrawal for contractual orlegal reasons.
Inventories: Inventories are stated at the lower of costor market. Our domestic inventories are recorded onthe last-in, first-out (LIFO) method. The remaininginventories are recorded using the first-in, first-out(FIFO) method.
Property, Plant and Equipment: Property, plant andequipment are recorded at cost. Expenditures thatimprove or extend the life of the respective assets arecapitalized, while maintenance and repairs are expensedas incurred. Provision for depreciation of property ismade by charges to operations at rates calculated toamortize the cost of the property over its useful life(twenty years for buildings; three to ten years formachinery and equipment) primarily using the straight-line method.
Impairment of Long-Lived Tangible and IntangibleAssets with Finite Lives: We evaluate long-lived assets,including tangible and intangible assets with finite lives,for indicators of impairment. An impairment loss isrecognized whenever events or changes in circum-stances indicate the carrying amount of an asset is notrecoverable. When reviewing for impairment, assets aregrouped and evaluated at the lowest level for whichthere are identifiable cash flows that are largely inde-pendent of the cash flows of other groups of assets. Weconsider historical performance and future estimatedresults in our evaluation of impairment. If the carryingamount of the asset exceeds expected undiscountedfuture cash flows, we measure the amount of impair-ment by comparing the carrying amount of the asset toits fair value, generally by discounting expected futurecash flows. Intangibles with finite lives (patents andcustomer lists) are amortized using the straight-linemethod over the estimated useful lives.
Goodwill and Indefinite-Lived Intangible Assets: Good-will represents the excess of cost over the fair value ofidentifiable net assets of businesses acquired. Indefinite-lived intangible assets primarily consist of purchasedtechnology, trademarks and trade names.
Evaluating goodwill for impairment involves the determi-nation of the fair value of our reporting units in which wehave recorded goodwill. A reporting unit is a component

of an operating segment for which discrete financialinformation is available and reviewed by managementon a regular basis. We have determined that we havefive separate reporting units.
Goodwill for each of our reporting units is reviewed forimpairment at least annually using a two-step processas we have chosen not to perform a qualitative assess-ment for impairment. In the first step, we compare thefair value of each reporting unit to its carrying value,including goodwill. We use the following four materialassumptions in our fair value analysis: (a) discountrates; (b) long-term sales growth rates; (c) forecastedoperating margins; and (d) market multiples. If the fairvalue exceeds the carrying value, no further work isrequired and no impairment loss is recognized. If thecarrying value exceeds the fair value, the goodwill of thereporting unit is potentially impaired and we would thencomplete step 2 in order to measure the impairmentloss. In step 2, we would calculate the implied fair valueof goodwill by deducting the fair value of all tangible andintangible net assets (including unrecognized intangibleassets) of the reporting unit from the fair value of thereporting unit. If the implied fair value of goodwill is lessthan the carrying value of goodwill, we would recognizean impairment loss, in the period identified, equal tothe difference.
We review indefinite-lived intangible assets at leastannually for impairment by calculating the fair valueof the assets and comparing those fair values to thecarrying value, as we have chosen not to perform a qual-itative assessment for impairment. In assessing fairvalue, we generally utilize a relief from royalty method. Ifthe carrying value of the indefinite-lived intangible assetsexceeds the fair value of the asset, the carrying value iswritten down to fair value in the period identified.
During the fourth quarters of 2013 and 2012, wecompleted our annual goodwill and indefinite-livedintangible asset impairment reviews with no impair-ments to the carrying values identified. There was nochange to our reporting units in 2013 or 2012, otherthan our exit from the gelcoat products market infiscal 2012.
In the fourth quarter of 2011, we completed ourannual goodwill and indefinite-lived intangible assetimpairment reviews. During the goodwill review, thecarrying value for the wood coatings and gelcoatreporting units exceeded the fair value, requiring a step 2valuation using an income approach (Level 3 measure-ment in the fair value hierarchy). As a result, we recordeda pre-tax impairment loss of $409,714 in the fourthquarter of 2011. This represents impairment of goodwilland intangible assets in our wood coatings reportingunit, part of our Coatings segment, and in our gelcoatreporting unit, part of Other and Administrative. Thereis no goodwill remaining in the reporting units in whichimpairment was recorded. In addition, no impairmentto the carrying values of the other reporting units wasidentified.
In performing the 2011 impairment analysis, we recon-sidered the appropriate reporting units as a result of:(i) the long-term financial outlook determined as part ofour strategic planning process which occurs in thefourth quarter; (ii) the current volatility in the markets inwhich we compete; and (iii) a change in our Chief Oper-ating Decision Maker (CODM). We enhanced our good-will impairment model from prior years to incorporateadditional market participant assumptions and marketcomparables at a reporting unit level. We also used anoutside provider to assist us in developing our model.The expected trends for the U.S. housing market are akey input for our internal forecast, which serves as thebasis for our strategic plan process. While in previousyears we had expected the U.S. housing market to returnto more normal levels during our planning horizon, infiscal year 2011 we concluded that this would not occur.As a result, the long-term financial outlook for the woodcoatings and gelcoat product lines diverged from that ofour other product lines and no longer met the criteriafor aggregation within our historical reporting units. Theresulting impairment charge also reflected our view ofanticipated risks based on our expectations of marketand general economic conditions.
See Note 4 for more details on the results of ourannual goodwill and indefinite-lived intangible assetimpairment reviews.
Stock-Based Compensation: Our stock-based employeecompensation plans are comprised primarily of stockoptions, but also include cash-settled restricted stockunits and restricted stock. Options generally havea contractual term of 10 years, vest ratably over threeto five years for employees and immediately upongrant for non-employee directors. Restricted sharesand cash-settled restricted stock units vest after threeto five years. We account for our stock-based compensa-tion using a fair value method. Share awards are issuedfrom common stock in treasury. See Note 10 for addi-tional information.
Contingent Liabilities: We are involved in various claimsrelating to environmental and waste disposal matters ata number of current and former plant sites. We engageor participate in remedial and other environmentalcompliance activities at certain of these sites. At othersites, we have been named as a potentially responsibleparty (PRP) under federal and state environmental lawsfor the remediation of hazardous waste. We analyzeeach individual site, considering the number of partiesinvolved, the level of potential liability or contribution byus relative to the other parties, the nature and magni-tude of the wastes involved, the method and extent ofremediation, the potential insurance coverage, the esti-mated legal and consulting expense with respect to eachsite, and the time period over which any costs wouldlikely be incurred. Based on the above analysis, we esti-mate the remediation or other cleanup costs and relatedclaims for each site. The estimates are based in part on
32

discussions with other PRPs, governmental agencies andengineering firms.
We accrue appropriate reserves for potential environ-mental liabilities, which are continually reviewed andadjusted as additional information becomes available.Our reserves are not discounted. While uncertaintiesexist with respect to the amounts and timing of our ulti-mate environmental liabilities, we believe it is neitherprobable nor reasonably possible that such liabilities,individually or in the aggregate, will have a materialadverse effect on our financial condition, results of opera-tions or cash flows.
We are involved in a variety of legal claims and proceed-ings relating to personal injury, product liability,warranties, customer contracts, employment, trade prac-tices, environmental and other legal matters that arise inthe normal course of business. These claims andproceedings include cases where we are one of anumber of defendants in proceedings alleging that theplaintiffs suffered injuries or contracted diseases fromexposure to chemicals or other ingredients used in theproduction of some of our products or waste disposal.We are also subject to claims related to the performanceof our products. We believe these claims and proceed-ings are not out of the ordinary course for a business ofthe type and size in which we are engaged. While we areunable to predict the ultimate outcome of these claimsand proceedings, we believe it is neither probable norreasonably possible that the costs and liabilities of suchmatters, individually or in the aggregate, will have amaterial adverse effect on our financial condition, resultsof operations or cash flows.
Advertising Costs: Advertising costs are expensed asincurred and totaled $87,498 (2.1% of net sales),$88,934 (2.2% of net sales) and $90,769 (2.3% of netsales) in 2013, 2012 and 2011, respectively.
Foreign Currency: Foreign currency denominated assetsand liabilities are translated into U.S. dollars using theexchange rates in effect at the balance sheet date.Results of operations are translated using the averageexchange rates throughout the period. The effect ofexchange rate fluctuations on translation of assets andliabilities is recorded as a component of stockholders’equity (accumulated other comprehensive income(loss)). Gains and losses from foreign currency transac-tions are included in other expense (income), net.
Financial Instruments: All financial instruments are heldfor purposes other than trading. See Note 8 for addi-tional information.
Research and Development: Research and developmentis expensed as incurred.
Reclassification: Certain amounts in the prior years’financial statements have been reclassified to conformto the 2013 presentation. Such reclassifications had noeffect on net income (loss), cash flows or stockholders’equity as previously reported.
NOTE 2 – ACQUISITIONSOn August 1, 2013 we purchased all the outstandingshares of Inver Holding S.r.l. (Inver Group), for totalconsideration of approximately $210,000, includingthe assumption of Inver Group’s existing debt. InverGroup is an Italian-based industrial coatings companyserving customers in Italy, France, the UK, Germanyand other countries. The acquisition strengthens ourpresence in the large European industrial coatingsmarket and broadens our range of technologies for thegeneral industrial product line. Inver Group had netsales of approximately $200,000 in 2012. The acquisi-tion was recorded in our Coatings segment in the fourthquarter of fiscal year 2013 at preliminary fair valuesand an allocation of the purchase price has beencompleted, with the exception of certain tax items. Theassets and operating results have been included in ourfinancial statements from the date of acquisition.
On December 28, 2012, we purchased Ace HardwareCorporation’s paint manufacturing business, includingtwo manufacturing facilities near Chicago, IL for approxi-mately $34,811 in cash. We manufacture and supplypaint to Ace Hardware Corporation for sale at Ace retaillocations. The acquisition was recorded in our Paintssegment at fair value and an allocation of the purchaseprice has been completed. The assets and operatingresults have been included in our financial statementsfrom the date of acquisition.
In February 2011, we acquired Isocoat Tintas e VernizesLtda. (Isocoat), a Brazilian powder coatings businessserving customers in Brazil, Argentina and Colombia.The acquisition strengthened our manufacturing,marketing and distribution in a growing region. Isocoathad 2010 sales of approximately $35,000. The acquisi-tion was recorded in our Coatings segment at fair valueand an allocation of the purchase price has beencompleted. Accordingly, the net assets and operatingresults are included in our financial statements from thedate of acquisition.
Pro forma results of operations for the acquisitionsnoted above have not been presented, as they wereimmaterial to the reported results on an individual andcombined basis.
NOTE 3 – INVENTORIESThe major classes of inventories consist of the following:
2013 2012
Manufactured products $ 267,680 $ 215,790Raw materials, supplies andwork-in-progress 171,302 144,637Total Inventories $ 438,982 $ 360,427
The amounts above include inventories stated at costdetermined by the last-in, first-out (LIFO) method. TotalLIFO inventories were $187,781 at October 25, 2013and $144,693 at October 26, 2012, approximately$86,337 and $88,342 lower, respectively, than suchcosts determined under the first-in, first-out (FIFO)method.
33

NOTE 5 – SUPPLEMENTAL DISCLOSURES RELATEDTO CURRENT LIABILITIES
Other accrued liabilities include the following:
2013 2012
Employee compensation $ 122,111 $ 124,617Customer volume rebatesand incentives 80,024 66,194Uninsured loss reserves anddeferred revenue 63,254 72,533Taxes, insurance, professionalfees and services 53,209 37,950Restructuring 26,949 6,924Interest 19,244 19,145Contribution to employees’retirement trusts 16,281 18,624Advertising and promotions 13,361 16,038Deferred tax liability 2,961 1,460Derivative liability 885 —Other 17,594 17,177Total Other Accrued Liabilities $ 415,873 $ 380,662
NOTE 6 – GUARANTEES AND CONTRACTUALOBLIGATIONS
Furniture Protection Plans and Warranties: In the U.S.,we sell extended furniture protection plans and offerwarranties for certain products. Revenue related to furni-ture protection plans is deferred and recognized overthe contract life. Historical claims data is used to fore-cast claims payments over the contract period andrevenue is recognized based on the forecasted claimspayments. Actual claims costs are reflected in earningsin the period incurred. Anticipated losses are charged toearnings when identified. For product warranties, weestimate the costs that may be incurred under thesewarranties based on historical claims data and record aliability in the amount of such costs at the time revenueis recognized. Anticipated losses are charged to earningswhen identified.
34
NOTE 4 – GOODWILL AND OTHER INTANGIBLE ASSETSThe changes in the carrying amount of goodwill for the fiscal years ended October 25, 2013 and October 26, 2012are as follows:
Coatings Paints Other Total
Balance, October 28, 2011 $ 789,306 $ 244,438 $ 24,262 $ 1,058,006Currency translation gain (loss) (4,918) 905 2,676 (1,337)
Balance, October 26, 2012 $ 784,388 $ 245,343 $ 26,938 $ 1,056,669Goodwill acquired 73,507 17,557 — 91,064Currency translation gain (loss) (5,860) 3,217 (420) (3,063)
Balance, October 25, 2013 $ 852,035 $ 266,117 $ 26,518 $ 1,144,670
Information regarding our other intangible assets is as follows:
Estimated Carrying AccumulatedUseful Life Amount Amortization Net
Balance, October 25, 2013Customer lists 20 to 40 years $ 285,104 $ (60,925) $ 224,179Technology Indefinite 177,877 — 177,877Trademarks Indefinite 204,117 — 204,117Other 10 to 40 years 14,638 (11,821) 2,817
Total $ 681,736 $ (72,746) $ 608,990
Balance, October 26, 2012Customer lists 20 to 40 years $ 253,349 $ (54,047) $ 199,302Technology Indefinite 169,690 — 169,690Trademarks Indefinite 178,070 — 178,070Other 10 to 40 years 14,706 (11,662) 3,044
Total $ 615,815 $ (65,709) $ 550,106
The increase in total intangible assets during fiscal year 2013 is due to customer lists, trademarks and acquired tech-nology recognized in the Inver Group acquisition valued at $29,181, $22,416 and $6,367, respectively. The acquiredcustomer lists are being amortized over 20 years from the date of acquisition.
During the fourth quarter of 2013 and 2012, we completed our annual goodwill and indefinite-lived intangible assetimpairment reviews with no impairments to the carrying values identified.
Amortization lives are based on management’s estimates. Amortization lives for intangible assets range from 10 to 40years. The remaining life averages for assets included in the customer lists and other categories were 28 years and 37years, respectively.
Total intangible asset amortization expense was $7,037, $6,553, and $7,638 in 2013, 2012, and 2011, respectively.Estimated amortization expense for each of the five succeeding fiscal years is approximately $9,000 annually.

We periodically assess the adequacy of these recordedamounts and adjust as necessary. Provisions for esti-mated losses on uncompleted contracts are made in theperiod in which such losses can be estimated. Theextended furniture protection plans that we enter intohave fixed prices. To the extent the actual costs tocomplete contracts differ from the amounts estimatedas of the date of the financial statements, gross marginwould be affected in future periods when we reviseour estimates.
Changes in the recorded amounts included in otherliabilities, both short-term and long-term, during theperiod are as follows:
Balance, October 29, 2010 $ 74,907Additional net deferred revenue/warrantyaccrual made during the period 12,381Warranty payments made during the period (13,609)
Balance, October 28, 2011 $ 73,679Additional net deferred revenue/warrantyaccrual made during the period 17,596Warranty payments made during the period (11,003)
Balance, October 26, 2012 $ 80,272Amount acquired through acquisitions 260Additional net deferred revenue/warrantyaccrual made during the period 7,436Warranty payments made during the period (9,150)
Balance, October 25, 2013 $ 78,818
Contractual Purchase Commitments: Valspar is obli-gated to make payments under contractual purchasecommitments, including unconditional purchase obliga-tions. The majority of Valspar’s unconditional purchaseobligations relate to the supply of raw materials with afive year term. The contracts require the purchase ofminimum quantities of raw materials, at current marketprices. We have estimated our payment obligationsunder existing contracts using current market prices.Payments for contracts with remaining terms in excessof one year are summarized below:
Maturities
2014 $ 10,2642015 70,1482016 76,5922017 —2018 —Thereafter —Total $ 157,004
Total payments relating to unconditional purchase obli-gations were approximately $50.9 million in 2013,$48.7 million in 2012 and $48.4 million in 2011.
NOTE 7 – FAIR VALUE MEASUREMENT
We measure certain assets and liabilities at fair value ordisclose the fair value of certain assets and liabilitiesrecorded at cost in the Consolidated Financial State-ments on both a recurring and non-recurring basis. Fairvalue is defined as an exit price, or the amount thatwould be received to sell an asset or paid to transfer aliability in an orderly transaction between market partici-pants at the measurement date. The fair valueaccounting rules establish a hierarchy for inputs used inmeasuring fair value that maximizes the use of observ-able inputs and minimizes use of unobservable inputs.Observable inputs must be used when available. Observ-able inputs are inputs that market participants woulduse in valuing the asset or liability based on market dataobtained from independent sources. Unobservableinputs are inputs that reflect our assumptions about thefactors market participants would use in valuing theasset or liability based upon the best information avail-able. Assets and liabilities measured at fair value are tobe categorized into one of the three hierarchy levelsbased on the inputs used in the valuation. We classifyassets and liabilities in their entirety based on the lowestlevel of input significant to the fair value measurement.Transfers of instruments between levels are recordedbased on end of period values. There were no transfersbetween levels for all periods presented. The three levelsare defined as follows:
• Level 1: Observable inputs based on quoted prices(unadjusted) in active markets for identical assets orliabilities.
• Level 2: Observable inputs based on quoted pricesfor similar assets and liabilities in active markets, orquoted prices for identical assets and liabilities ininactive markets.
• Level 3: Unobservable inputs that reflect an entity’sown assumptions about what inputs a marketparticipant would use in pricing the asset or liabilitybased on the best information available in thecircumstances.
35
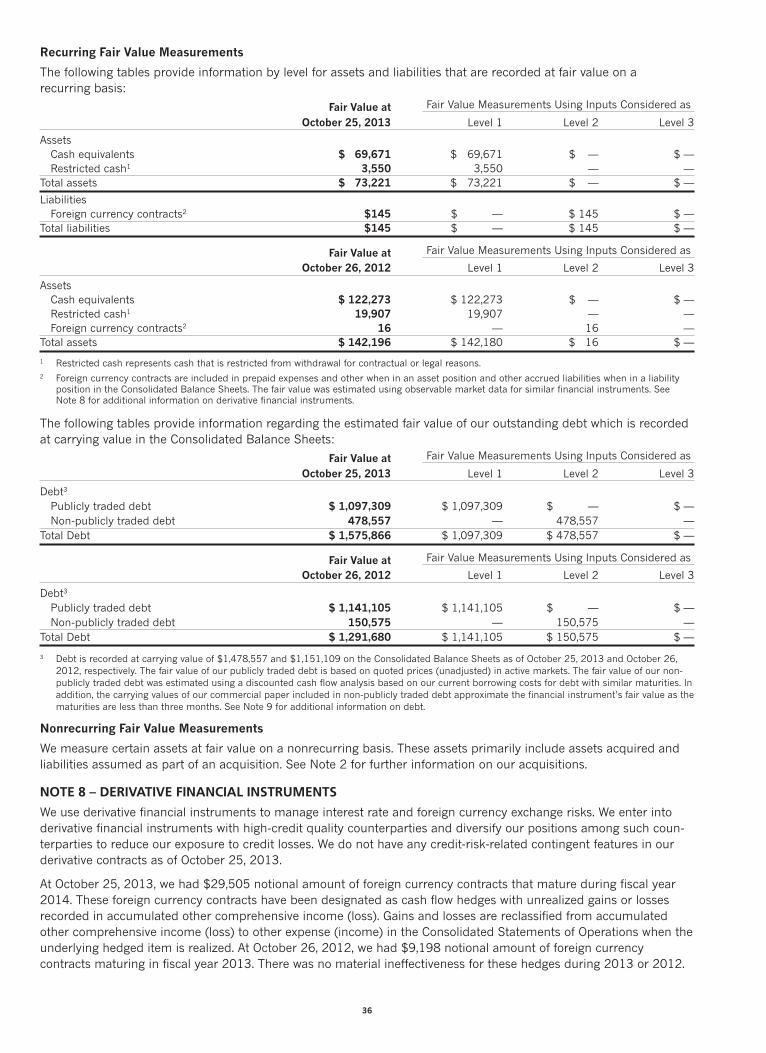
Recurring Fair Value Measurements
The following tables provide information by level for assets and liabilities that are recorded at fair value on arecurring basis:
Fair Value at Fair Value Measurements Using Inputs Considered as
October 25, 2013 Level 1 Level 2 Level 3
AssetsCash equivalents $ 69,671 $ 69,671 $ — $ —Restricted cash1 3,550 3,550 — —
Total assets $ 73,221 $ 73,221 $ — $ —
LiabilitiesForeign currency contracts2 $145 $ — $ 145 $ —
Total liabilities $145 $ — $ 145 $ —
Fair Value at Fair Value Measurements Using Inputs Considered as
October 26, 2012 Level 1 Level 2 Level 3
AssetsCash equivalents $ 122,273 $ 122,273 $ — $ —Restricted cash1 19,907 19,907 — —Foreign currency contracts2 16 — 16 —
Total assets $ 142,196 $ 142,180 $ 16 $ —
1 Restricted cash represents cash that is restricted from withdrawal for contractual or legal reasons.2 Foreign currency contracts are included in prepaid expenses and other when in an asset position and other accrued liabilities when in a liability
position in the Consolidated Balance Sheets. The fair value was estimated using observable market data for similar financial instruments. SeeNote 8 for additional information on derivative financial instruments.
The following tables provide information regarding the estimated fair value of our outstanding debt which is recordedat carrying value in the Consolidated Balance Sheets:
Fair Value at Fair Value Measurements Using Inputs Considered as
October 25, 2013 Level 1 Level 2 Level 3
Debt3
Publicly traded debt $ 1,097,309 $ 1,097,309 $ — $ —Non-publicly traded debt 478,557 — 478,557 —
Total Debt $ 1,575,866 $ 1,097,309 $ 478,557 $ —
Fair Value at Fair Value Measurements Using Inputs Considered as
October 26, 2012 Level 1 Level 2 Level 3
Debt3
Publicly traded debt $ 1,141,105 $ 1,141,105 $ — $ —Non-publicly traded debt 150,575 — 150,575 —
Total Debt $ 1,291,680 $ 1,141,105 $ 150,575 $ —
3 Debt is recorded at carrying value of $1,478,557 and $1,151,109 on the Consolidated Balance Sheets as of October 25, 2013 and October 26,2012, respectively. The fair value of our publicly traded debt is based on quoted prices (unadjusted) in active markets. The fair value of our non-publicly traded debt was estimated using a discounted cash flow analysis based on our current borrowing costs for debt with similar maturities. Inaddition, the carrying values of our commercial paper included in non-publicly traded debt approximate the financial instrument’s fair value as thematurities are less than three months. See Note 9 for additional information on debt.
Nonrecurring Fair Value Measurements
We measure certain assets at fair value on a nonrecurring basis. These assets primarily include assets acquired andliabilities assumed as part of an acquisition. See Note 2 for further information on our acquisitions.
NOTE 8 – DERIVATIVE FINANCIAL INSTRUMENTS
We use derivative financial instruments to manage interest rate and foreign currency exchange risks. We enter intoderivative financial instruments with high-credit quality counterparties and diversify our positions among such coun-terparties to reduce our exposure to credit losses. We do not have any credit-risk-related contingent features in ourderivative contracts as of October 25, 2013.
At October 25, 2013, we had $29,505 notional amount of foreign currency contracts that mature during fiscal year2014. These foreign currency contracts have been designated as cash flow hedges with unrealized gains or lossesrecorded in accumulated other comprehensive income (loss). Gains and losses are reclassified from accumulatedother comprehensive income (loss) to other expense (income) in the Consolidated Statements of Operations when theunderlying hedged item is realized. At October 26, 2012, we had $9,198 notional amount of foreign currencycontracts maturing in fiscal year 2013. There was no material ineffectiveness for these hedges during 2013 or 2012.
36

At October 25, 2013 and October 26, 2012, we had no interest rate hedges in place. During the first quarter of 2012,we settled $200,000 notional amount of treasury lock contracts as a result of issuing $400,000 of Senior Notes,yielding a pretax loss of $27,875. This loss was recognized net of tax, in accumulated other comprehensive income(loss) in the first quarter of fiscal year 2012. The accumulated other comprehensive loss amount in our ConsolidatedBalance Sheets as of October 25, 2013 and October 26, 2012 represent the unamortized gains and losses, net of tax,from our settled contracts. Unamortized gains and losses are reclassified ratably to interest expense in our Consoli-dated Statements of Operations over the term of the related debt. There was no material ineffectiveness related tothese hedges for the 2013 and 2012 fiscal periods.
Our derivative assets and liabilities subject to fair value measurement (see Note 7) include the following:
Fair Value at Fair Value atOctober 25, 2013 October 26, 2012
AssetsPrepaid expenses and other:Foreign currency contracts $ — $ 16
Total Assets $ — $ 16
LiabilitiesAccrued liabilities other:Foreign currency contracts $ 145 $ —
Total Liabilities $ 145 $ —
Derivative gains (losses) recognized in AOCI1 and on the Consolidated Statements of Operations for fiscal year endedOctober 25, 2013 and October 26, 2012, respectively, are as follows:
Amount of Gain Amount of Gain(Loss) (Loss)
Recognized in Statement of Operations Recognized inFor the Year Ended October 25, 2013 AOCI1 Classification Earnings1
Derivatives designated as cash flow hedgesForeign currency contracts $ (160) Other income (expense), net $ 135Treasury lock contracts 1,278 Interest expense (1,278)
Total derivatives designated as cash flow hedges $ 1,118 Total $ (1,143)
Amount of Gain Amount of Gain(Loss) (Loss)
Recognized in Statement of Operations Recognized inFor the Year Ended October 26, 2012 AOCI1 Classification Earnings1
Derivatives designated as cash flow hedgesForeign currency contracts $ 12 Other income (expense), net $ 434Treasury lock contracts (7,086) Interest expense (784)
Total derivatives designated as cash flow hedges $ (7,074) Total $ (350)
1 Accumulated other comprehensive income (loss) (AOCI) is included on the Consolidated Balance Sheet in the Stockholders’ Equity section and isreported net of tax. The amounts disclosed in the above table are reported pretax and represent the full year derivative activity.
37

NOTE 9 – DEBT
Our debt consists of the following:
2013 2012
Notes to banks(weighted average interest rateof 2.03% at October 25, 2013and 9.52% at October 26, 2012) $ 118,682 $ 2,457Commercial Paper(0.31% – 0.43% at October 25,2013 and 0.43% – 0.44% atOctober 26, 2012) 322,483 91,984Total Short-term Debt 441,165 94,441Notes to banks(4.34% – 5.20% atOctober 26, 2012) — 44,090Total Current Portion ofLong-term Debt — 44,090Notes to banks(weighted average interest rate0.89% at October 25, 2013 and4.49% at October 26, 2012) 24,890 76Senior notes (at fixed rates)Due 2015 at 5.10% 150,000 150,000Due 2017 at 6.05% 150,000 150,000Due 2019 at 7.25% 300,000 300,000Due 2022 at 4.20% 400,000 400,000
Industrial development bonds(0.25% at October 25, 2013 and0.36% at October 26, 2012payable in 2015) 12,502 12,502Total Long-term Debt 1,037,392 1,012,578Total Debt $ 1,478,557 $ 1,151,109
In the first quarter of 2012, we issued $400,000 ofunsecured Senior Notes that mature on January 15,2022 with a coupon rate of 4.20%. The proceeds, net ofissuance costs, were $396,816. The public offering wasmade pursuant to a registration statement filed with theU.S. Securities and Exchange Commission. We used thenet proceeds for general corporate purposes, includingpaying down our commercial paper borrowings andretiring our $200,000 of 5.625% Senior Notes thatmatured on May 1, 2012.
We maintain an unsecured revolving credit facility witha syndicate of banks. Subsequent to October 25,2013, we entered into an amended and restated$750,000 credit facility with a syndicate of banks with amaturity date of December 14, 2018 to replace theprevious $550,000 credit facility scheduled to expireDecember 31, 2014. In July 2013 we entered into aU.S. dollar equivalent unsecured committed revolvingbilateral credit facility, expiring July 2014, and termi-nated a prior facility scheduled to expire inSeptember 2013.
38
We maintain uncommitted bank lines of credit to meetshort-term funding needs in certain of our internationallocations. These arrangements are reviewed periodicallyfor renewal and modification. Borrowings under thesedebt arrangements had an average annual interest rateof 11.63% in 2013, 9.52% in 2012 and 6.59% in 2011.
As of October 25, 2013 and October 26, 2012, our bankfacilities consisted of the following:
October 25, 2013
Total FacilityOutstanding Size
December 2018 banksyndicate facility1 $ 322,483 $ 750,000July 2014 bilateral facility 107,767 107,767Total unsecured committedrevolving credit 430,250 857,767Uncommitted bank linesof credit 10,915 182,778Total Bank Credit Facilities $ 441,165 $ 1,040,545
October 26, 2012
Total FacilityOutstanding Size
December 2014 banksyndicate facility1 $ 91,984 $ 550,000September 2013 bilateralfacility 44,090 93,402Total unsecured committedrevolving credit 136,074 643,402Uncommitted bank linesof credit 2,533 147,461Total Bank Credit Facilities $ 138,607 $ 790,863
1 Our bank syndicate facility includes $322,483 and $91,984 ofcommercial paper as of October 25, 2013 and October 26, 2012,respectively. We have a $350,000 commercial paper program back-stopped by our $750,000 credit facility, as amended and restated.
Our credit facilities have covenants that require us tomaintain certain financial ratios. We were in compliancewith these covenants as of October 25, 2013. Our debtcovenants do not limit, nor are they reasonably likely tolimit, our ability to obtain additional debt or equityfinancing.
The future maturities of long-term debt are as follows:
Maturities
2014 $ —2015 162,5242016 —2017 150,0002018 23,072Thereafter 701,796
Interest paid during 2013, 2012, and 2011 was$66,451, $68,714, and $62,095, respectively.

NOTE 10 – STOCK-BASED COMPENSATION
We issue stock-based compensation through our 2009Omnibus Equity Plan (Omnibus Plan), which permits theissuance of stock options, restricted stock, stock awards,and restricted stock units which can be granted to offi-cers, employees, non-employee directors and consult-ants. Restricted stock grants awarded through theOmnibus Plan reduce the pool of reserved shares at amultiple of 2.53 times the actual number of sharesawarded. Stock options awarded through the OmnibusPlan reduce the reserved shares pool at a rate equal tothe number of options granted. Cash-settled restrictedstock units do not impact the reserved shares pool.Restricted shares vest after three to five years. Optionsgenerally have a contractual term of 10 years, vestratably over three to five years for employees and vestimmediately upon grant for non-employee directors.Stock awards are issued and outstanding upon dateawarded. The table below summarizes the stock optionand restricted stock activity for the three years endedOctober 25, 2013. The table below presents the sharesreserved for options and awards, which includes prede-cessor plans and the Omnibus Plan.
39
Shares SharesReserved Outstanding
Balance, October 29, 2010 4,991,940 10,890,660Granted – restricted stock (609,159) 240,774Granted – stock options (752,500) 752,500Issued – stock awards (53,783) —Vested – restricted stock — (149,379)Exercised – stock options — (2,122,962)Forfeited – restricted stock 32,087 (15,083)Canceled – stock options 76,507 (76,507)
Balance, October 28, 2011 3,685,092 9,520,003Granted – restricted stock (196,943) 77,843Granted – stock options (516,058) 516,058Issued – stock awards (29,973) —Vested – restricted stock — (214,130)Exercised – stock options — (2,315,413)Forfeited – restricted stock 559 (221)Canceled – stock options 9,663 (9,663)
Balance, October 26, 2012 2,952,340 7,574,477Granted – restricted stock (191,840) 75,826Granted – stock options (463,900) 463,900Issued – stock awards (32,783) —Vested – restricted stock — (182,659)Exercised – stock options — (1,500,661)Forfeited – restricted stock 27,686 (10,943)Canceled – stock options 200 (200)
Balance, October 25, 2013 2,291,703 6,419,740
Stock Options: Stock-based compensation expense included in our Consolidated Statements of Operations for stockoptions was $7,189, $7,801, and $8,370 in fiscal year 2013, 2012, and 2011, respectively. Awards to retirement-eligible employees are expensed at the grant date.
As of October 25, 2013, there was $7,012 of total unrecognized pre-tax compensation cost related to non-vestedawards that are expected to be recognized over a weighted-average period of 2.4 years.
Stock option activity for the three years ended October 25, 2013 is summarized as follows:
Weighted Average Weighted AverageOptions Exercise Price Remaining Aggregate
Outstanding per share Contractual Life Intrinsic Value
Balance, October 29, 2010 10,355,765 $ 23.52 6.0 years $ 88,858Granted 752,500 32.42Exercised (2,122,962) 20.94 30,676Canceled (76,507) 24.15
Balance, October 28, 2011 8,908,796 $ 24.88 6.0 years $ 97,560Granted 516,058 55.64Exercised (2,315,413) 23.01 57,466Canceled (9,663) 26.37
Balance, October 26, 2012 7,099,778 $ 27.73 6.1 years $ 194,442Granted 463,900 64.36Exercised (1,500,661) 24.32 61,042Canceled (200) 17.50
Balance, October 25, 2013 6,062,817 $ 31.37 5.9 years $ 235,887Exercisable 5,068,438 26.81 5.3 years 220,331

Options exercisable of 5,823,529 at October 26, 2012 and 7,132,818 at October 28, 2011 had weighted-averageexercise prices of $24.87 and $23.62, respectively.
The total intrinsic value at October 25, 2013 is based on our closing stock price on the last trading day of the year forin-the-money options. The exercise prices of the options granted during these periods are equal to the market price ofthe underlying stock on the date of grant. The fair value of each option grant is estimated on the date of grant usingthe Black-Scholes option pricing model. The following table sets forth the weighted-average fair values and assump-tions on which the fair values are determined:
2013 2012 2011
Expected dividend yield 1.4% 1.5% 2.2%Expected stock price volatility 30.0% 29.0% 28.9%Risk-free interest rate 2.0% 1.2% 1.7%Expected life of options 7.4 years 7.4 years 7.4 yearsWeighted average fair value on the date of grant $ 19.12 $ 15.10 $ 8.06
Restricted Stock and Cash-Settled Restricted Stock Units: We grant restricted stock to certain employees throughour Omnibus Plan. As of October 25, 2013, there was $2,292 of total unrecognized pre-tax compensation cost relatedto restricted stock that is expected to be recognized over a weighted-average period of 2.8 years. Stock-basedcompensation expense included in our Consolidated Statements of Operations for restricted stock was $1,998 and$8,488 in fiscal year 2013 and 2012, respectively.
In fiscal year 2013 and 2012, we granted cash-settled restricted stock units to certain employees through ourOmnibus Plan. Since the compensation expense is payable in cash, these restricted stock units are classified as liabili-ties within other long-term liabilities and are marked-to-market each period. These awards do not impact the sharesreserved under the Omnibus Plan. As of October 25, 2013, there was $12,318 of total unrecognized pre-tax compen-sation cost related to restricted stock units that is expected to be recognized over a weighted-average period of2.2 years. Stock-based compensation expense included in our Consolidated Statements of Operations for theserestricted stock units was $13,618 and $6,551 in fiscal year 2013 and 2012, respectively.
The following table sets forth a reconciliation of restricted shares (equity classified) and cash-settled restricted stockunits (liability classified) for the three years ended October 25, 2013:
Equity Classified Liability Classified______________________________________________ _____________________________________________Weighted WeightedAverage Aggregate Average Aggregate
Shares Grant Date Intrinsic Units Grant Date IntrinsicOutstanding Fair Value Value Outstanding Fair Value Value
Balance, October 29, 2010 534,895 $ 25.01 $ 17,170 — $ — $ —Granted 240,774 34.34 8,268 221,066 36.21 8,005Vested (149,379) 24.30 5,420 (1,459) 34.27 56Forfeited (15,083) 27.32 (412) (8,141) 34.27 (279)
Balance, October 28, 2011 611,207 $ 28.80 $ 21,900 211,466 $ 36.30 $ 7,577Granted 77,843 40.03 3,116 243,753 41.52 10,119Vested (214,130) 26.08 8,033 (3,685) 37.30 169Forfeited (221) 27.59 (6) (6,281) 35.97 (226)
Balance, October 26, 2012 474,699 $ 31.87 $ 26,089 445,253 $ 39.15 $ 24,471Granted 75,826 63.32 4,801 190,609 63.72 12,145Vested (182,659) 29.35 11,727 (15,219) 51.49 942Forfeited (10,943) 41.62 (455) (22,120) 46.03 (1,018)
Balance, October 25, 2013 356,923 $ 39.54 $ 25,085 598,523 $ 46.41 $ 42,064
NOTE 11 – PENSIONS AND OTHER POST-RETIREMENT BENEFITS
Savings and Retirement Plan: We sponsor a Savings and Retirement Plan for substantially all of our U.S. employees.Under the Plan, we match employee contributions up to a maximum of 3% of employees’ compensation. In additionto matching employees’ contributions throughout the year, there is a year-end contribution that can range from 4%to 13% of eligible employees’ pay as defined in the Plan. U.S. employees who are not eligible for the Savings andRetirement Plan have the option to participate in a separate 401(k) Employee Stock Ownership Plan. We matchemployee contributions made by participants in that plan up to a maximum of 3% of employees’ compensation.In addition to matching employees’ contributions throughout the year, there is a discretionary year-end matchingcontribution that can range from 0-3%. Employer contributions to the Plans totaled $25,609, $27,629, and $31,060for 2013, 2012, and 2011, respectively.
40

Executive Retirement Plans: We have Supplemental Executive Retirement Plans (SERPs) to provide retirement, deathand disability benefits to a limited number of former employees. Annual benefits under the SERPs are based on yearsof service and individual compensation near retirement.
Pension and Post-Retirement Medical Plans: We sponsor several defined benefit pension plans for certain hourlyand salaried employees. The benefits for most of these plans are generally based on stated amounts for each year ofservice. We fund the plans in amounts consistent with the limits of allowable tax deductions. During fiscal year 2013,we made contributions of approximately $3,490 to our pension plans. We also sponsor a post-retirement medicalplan that provides subsidized medical benefits for eligible retired employees and their eligible dependents. The planchanged on January 1, 2009 to eliminate the subsidy for future retirees with the exception of a small group ofemployees near retirement that will still be eligible for the subsidized coverage at retirement. A 1% increase in themedical trend rates would not have a material effect on post-retirement medical expense or the post-retirementbenefit obligation. For the fiscal year ending October 31, 2014, we expect our total contributions to our fundedpension plans, unfunded pension, non-qualified plans and post-retirement medical plans to be at least $4,370.
The cost of pension and post-retirement medical benefits recognized in the Consolidated Statement of Operations isas follows:
Pension
2013 2012 2011
Service cost $ 4,846 $ 4,185 $ 4,496Interest cost 13,203 14,077 14,691Expected return on plan assets (19,699) (19,379) (17,625)Amortization of prior service cost 448 435 397Recognized actuarial loss 9,577 6,865 6,055Settlement gain (110) (35) (16)Curtailment — — —Net Periodic Benefit Cost $ 8,265 $ 6,148 $ 7,998
Post-Retirement Medical
2013 2012 2011
Service cost $ 238 $ 124 $ 188Interest cost 360 448 510Expected return on plan assets N/A N/A N/AAmortization of prior service cost (128) (128) (128)Recognized actuarial loss 469 471 304Net Periodic Benefit Cost $ 939 $ 915 $ 874
The plans’ funded status is shown below, along with a description of how the status changed during the past twoyears. The benefit obligation is the projected benefit obligation—the actuarial present value, as of a date, of all bene-fits attributed by the pension benefit formula to employee service rendered prior to that date.
Pension Post-Retirement Medical
Change in Benefit Obligation 2013 2012 2013 2012
Benefit obligation beginning of year $ 327,859 $ 278,152 $ 9,544 $ 9,467Service cost 4,846 4,185 238 124Interest cost 13,203 14,077 360 448Plan participants’ contributions 677 735 — —Plan amendments 470 223 — —Actuarial loss/(gain) (17,004) 43,055 (757) 816Benefits paid (14,815) (14,385) (836) (1,311)Expenses paid from assets (143) (290) — —Currency impact 440 1,226 — —Acquisition 4,437 — — —Curtailments (3,873) — — —Other — 881 — —Benefit Obligation at End of Year $ 316,097 $ 327,859 $ 8,549 $ 9,544
41

42
Pension Post-Retirement Medical
Change in Plan Assets 2013 2012 2013 2012
Fair value of plan assets at beginning of year $ 279,238 $ 237,658 $ — $ —Actual return on plan assets 34,227 36,543 — —Employer contributions 3,490 16,095 836 1,311Plan participants’ contributions 677 735 — —Benefit payments (14,815) (14,385) (836) (1,311)Expenses paid from assets (143) (290) — —Currency impact (742) 2,001 — —Other — 881 — —Fair Value of Assets at End of Year $ 301,932 $ 279,238 $ — $ —
Pension Post-Retirement Medical
Funded Status 2013 2012 2013 2012
Projected benefit obligation $ (316,097) $ (327,859) $ (8,549) $ (9,544)Plan assets at fair value 301,932 279,238 — —Net Funded Status – Over / (Under) $ (14,165) $ (48,621) $ (8,549) $ (9,544)
Funded status – overfunded plans $ 14,572 $ 686 $ — $ —Funded status – underfunded plans (28,737) (49,307) (8,549) (9,544)
Pension Post-Retirement Medical
Amounts Recognized in Balance Sheet 2013 2012 2013 2012
Noncurrent assets $ 14,572 $ 686 $ — $ —Current liabilities (491) (455) (987) (1,058)Noncurrent liabilities (28,246) (48,852) (7,562) (8,486)
Pension Post-Retirement Medical
Amounts in Accumulated Other Comprehensive Income 2013 2012 2013 2012
Net (gain) loss $ 100,181 $ 144,613 $ 4,146 $ 5,372Net prior service cost (credit) 4,813 4,779 (439) (567)Other Comprehensive (Income) Loss – Total $ 104,994 $ 149,392 $ 3,707 $ 4,805
Amortization Expense Expected to Be Recognized Pension Post-Retirement Medical
During Next Fiscal Year 2013 2012 2013 2012
Prior service cost (credits) $ 480 $ 448 $ (128) $ (128)Net loss 6,168 9,828 369 469
Our pension and post-retirement medical plans with accumulated benefit obligations in excess of plan assets wereas follows:
Pension Post-Retirement Medical
2013 2012 2013 2012
Projected/accumulated post-retirement benefit obligation $ 93,298 $ 265,706 $ 8,549 $ 9,544Accumulated benefit obligation 88,765 256,936 N/A N/AFair value of plan assets 64,561 219,245 N/A N/A
Our pension and post-retirement medical plans with projected benefit obligations in excess of plan assets wereas follows:
Pension Post-Retirement Medical
2013 2012 2013 2012
Projected benefit obligation $ 93,298 $ 314,414 N/A N/AAccumulated benefit obligation 88,765 301,706 N/A N/AFair value of plan assets 64,561 265,107 N/A N/A
Our pension and post-retirement medical plans with projected benefit obligations less than plan assets wereas follows:
Pension Post-Retirement Medical
Funded Status 2013 2012 2013 2012
Projected benefit obligation $ 222,798 $ 13,445 N/A N/AAccumulated benefit obligation 219,155 12,421 N/A N/AFair value of plan assets 237,371 14,131 N/A N/A

Actuarial Assumptions: We determine our actuarial assumptions on an annual basis. These assumptions areweighted to reflect each country having requirements that may impact the cost of providing retirement benefits. Weemploy a total return investment approach for the domestic and foreign pension plan assets. A mix of equities andfixed income investments are used to maximize the long-term return on plan assets for a prudent level of risk. Indetermining the expected long-term rate of return, management considers the historical rates of return, the nature ofinvestments and an expectation of future investment strategies.
Pension Post-Retirement Medical
Assumption ranges used in net periodic benefit cost 2013 2012 2013 2012
Discount rate 3.00% – 4.75% 4.25% – 5.50% 4.00% 5.00%Expected long-term return on plan assets 3.75% – 7.75% 5.50% – 8.00% N/A N/AAverage increase in compensation 2.25% – 3.75% 2.25% – 4.00% N/A N/AInitial medical trend rate N/A N/A 8.00% 8.50%Ultimate medical trend rate N/A N/A 5.00% 5.00%Years to ultimate rate N/A N/A 6 Years 7 Years
Pension Post-Retirement Medical
Assumption ranges used to determine benefit obligation 2013 2012 2013 2012
Discount rate 3.00% – 5.00% 3.00% – 4.75% 4.75% 4.00%Rate of compensation increase 2.25% – 3.25% 2.25% – 3.75% N/A N/AInitial medical trend rate N/A N/A 7.50% 8.00%Ultimate medical trend rate N/A N/A 5.00% 5.00%Years to ultimate rate N/A N/A 5 Years 6 Years
43
Investment Strategy: We have a master trust that holdsthe assets for all our U.S. pension plans. For investmentpurposes, the plans are managed in an identical way, astheir objectives are similar. The Benefit Funds Invest-ment Committee (Committee), along with assistancefrom external consultants, sets investment guidelinesand makes asset allocation decisions based on marketconditions, risk tolerance, funding requirements andexpected benefit payments. The Committee also over-sees the selection of investment managers and monitorsasset performance. As pension liabilities are long-term innature, the Committee employs a long-term rate ofreturn on plan assets approach for a prudent level ofrisk. Historical returns are considered as well as advicefrom investment experts. Annually, the Committee andthe consultants review the risk versus the return of theinvestment portfolio to assess the long-term rate ofreturn assumption.
The U.S. investment portfolio contains a diversified port-folio of investment categories, including domestic andinternational equities and short and long-term fixedincome securities. Among the equity investments thereis also diversity of style, growth versus value. Plan assetsdid not include investments in our stock as of thereported dates. The Committee believes with prudentrisk tolerance and asset diversification, the plans shouldbe able to meet their pension obligations in the future.
The weighted average asset allocations for the past twofiscal years by asset category are as follows:
Pension PlansTarget
Asset Allocation 2013 2012 Allocation
Equity securities 56% 56% 50 – 60%Debt securities 37% 38% 40 – 50%Other 7% 6% 0%Total 100% 100% 100%

44
The following tables provide information on the fair value of pension plan assets. See Note 7 for more information onfair value measurements.
Fair Value at Fair Value Measurements Using Inputs Considered as
October 25, 2013 Level 1 Level 2 Level 3
Domestic Equity SecuritiesCommingled Trust $ 71,410 $ — $ 71,410 $ —Mutual Fund 29,378 29,378 — —
International Equity SecuritiesMutual Funds 68,374 33,659 34,715 —
Total Equity Securities 169,162 63,037 106,125 —Domestic Fixed IncomeMutual Funds 86,587 86,587 — —
International Fixed IncomeDebt Securities 3,974 — 3,974 —Mutual Funds 19,739 — 19,739 —
Total Fixed Income 110,300 86,587 23,713 —Other InvestmentsInsurance Contracts 14,456 — — 14,456Cash 5,458 5,458 — —Real Estate 2,556 — 2,056 500
Total Other Investments 22,470 5,458 2,056 14,956Total $ 301,932 $ 155,082 $ 131,894 $ 14,956
Fair Value at Fair Value Measurements Using Inputs Considered as
October 26, 2012 Level 1 Level 2 Level 3
Domestic Equity SecuritiesCorporate Stocks $ 25,050 $ 25,050 $ — $ —Commingled Trust 66,692 — 66,692 —
International Equity SecuritiesMutual Funds 65,578 — 65,578 —
Total Equity Securities 157,320 25,050 132,270 —Domestic Fixed IncomeMutual Funds 83,467 — 83,467 —
International Fixed IncomeDebt Securities 4,211 — 4,211 —Mutual Funds 18,110 — 18,110 —
Total Fixed Income 105,788 — 105,788 —Other InvestmentsInsurance Contracts 12,385 — — 12,385Cash 1,988 1,988 — —Real Estate 1,757 — 1,172 585
Total Other Investments 16,130 1,988 1,172 12,970Total $ 279,238 $ 27,038 $ 239,230 $ 12,970
Pension plan investments in corporate stocks andmutual funds are classified as Level 1 investmentswithin the fair value hierarchy, as determined by quotedmarket prices. Pension plan investments in mutualfunds that are not exchange-traded, and commingledtrusts, and certain other investments are classified asLevel 2 investments within the fair value hierarchy.These investments are valued at net asset value basedon the underlying securities, as determined by thesponsor. Level 3 investments are primarily related toinsurance contracts required in certain foreign-basedplans. The fair value is determined based on theexpected benefits to be paid under the contract,discounted at a rate consistent with the related benefit
obligation. There were no transfers between levels for allperiods presented.
Investment securities, in general, are exposed to variousrisks such as interest rate, credit and overall marketvolatility. Due to the level of risk associated with certaininvestment securities, it is reasonably possible thatchanges in the values of investment securities will occurin the near term and that such changes could materiallyaffect the amounts reported. The valuation methodspreviously described above may produce a fair valuecalculation that may not be indicative of net realizedvalue or reflective of future fair values.

45
The following table provides a reconciliation of thebeginning and ending balances of pension assets meas-ured at fair value that used significant unobservableinputs (Level 3):
Total U.S. Non-U.S.
Balance, October 28, 2011 $ 7,716 $ 500 $ 7,216Actual return on plan assetsRelating to assets still heldat reporting date 3,474 85 3,389
Purchases 2,279 — 2,279Settlements (82) — (82)Transfers in and/or out ofLevel 3 — — —Currency impact (417) — (417)Balance, October 26, 2012 $ 12,970 $ 585 $ 12,385Actual return on plan assetsRelating to assets still heldat reporting date 212 (85) 297
Purchases 1,215 — 1,215Settlements (97) — (97)Transfers in and/or out ofLevel 3 — — —Currency impact 656 — 656Balance, October 25, 2013 $ 14,956 $ 500 $ 14,456
Estimated Future Benefits: The following benefitpayments, which reflect expected future service, asappropriate, are expected to be paid as follows:
Post-retirementPension Medical
2014 $ 16,774 $ 1,0112015 15,815 9522016 15,753 8522017 16,407 7742018 16,726 6172019 – 2023 90,649 2,513Total $ 172,124 $ 6,719
NOTE 12 – INCOME TAXES
Income (loss) before income taxes consisted of thefollowing:
2013 2012 2011
Domestic $ 331,482 $ 265,681 $ (109,281)Foreign 92,313 151,543 6,127Total Income (Loss)Before Income Taxes $ 423,795 $ 417,224 $ (103,154)
Significant components of the provision for income taxesare as follows:
2013 2012 2011
CurrentFederal $ 101,169 $ 66,957 $ 39,274State 14,084 7,696 6,803Foreign 32,027 37,753 25,276
Total Current 147,280 112,406 71,353
DeferredFederal (6,160) 15,927 (19,681)State (6,921) 2,230 (3,822)Foreign 341 (5,836) (12,403)
Total Deferred (12,740) 12,321 (35,906)
Total Income Taxes $ 134,540 $ 124,727 $ 35,447
Significant components of our deferred tax assets andliabilities are as follows:
2013 2012 2011
Deferred tax assetsInsurance reserves $ 8,689 $ 11,030 $ 8,781Compensation 40,442 39,099 36,294Deferred revenue 11,077 10,273 10,400Pension 2,288 13,882 15,001Accrued expenses 32,750 27,582 30,237Tax credits andcarryforwards 29,191 28,550 30,608Other 9,009 9,624 10,090
133,446 140,040 141,411Less: ValuationAllowance (23,075) (15,377) (15,475)Total DeferredTax Assets 110,371 124,663 125,936
Deferred tax liabilitiesTax in excess of bookdepreciation (45,066) (47,963) (55,126)LIFO (11,796) (15,257) (4,975)Intangible assets (242,465) (223,300) (223,108)Other (5,262) (8,656) (6,970)
Total Deferred TaxLiabilities (304,589) (295,176) (290,179)
Net Deferred TaxLiabilities $ (194,218) $ (170,513) $ (164,243)
We recognize a valuation allowance if, based on theweight of available evidence, it is more likely than notthat some portion, or all, of a deferred tax asset will notbe realized. The valuation allowances of $23,075,$15,377 and $15,475 at the end of fiscal years 2013,2012, and 2011, respectively, primarily relates to foreignnet operating losses.
Cumulative foreign tax loss carryforwards at the end offiscal year 2013 were $75,665. Of this amount, $38,114will be subject to expiration between fiscal year 2014and fiscal year 2026. The remaining losses of $37,551are not subject to expiration. Cumulative foreign taxcredits on our U.S. tax return at the end of fiscal year2013 were $10,300. The majority of these foreign taxcredits will be subject to expiration between fiscal year2017 and fiscal year 2023.
A reconciliation of income tax computed at the U.S.federal statutory tax rate to the effective income tax rateis as follows:
2013 2012 2011
Tax (benefit) at U.S.statutory rate 35.0% 35.0% (35.0)%State income taxes,net of federal benefit 2.0% 1.3% 5.7%Domestic manufacturingactivities (2.0)% (1.3)% (3.8)%Non-U.S. taxes (1.8)% (5.1)% (17.5)%Valuation allowance 1.8% — (0.5)%Non-deductibleimpairment charges — — 94.2%Other (3.3)% — (8.7)%Total EffectiveIncome Tax Rate 31.7% 29.9% 34.4%

46
The tax rate for fiscal 2011 reflects the impact of good-will and intangible asset impairment charges, themajority of which are nondeductible for income taxpurposes. Excluding the impact of the impairmentcharges, our fiscal 2011 effective tax rate was 26.7%.
No provision has been made for U.S. federal incometaxes on certain undistributed earnings of foreignsubsidiaries that we intend to permanently invest or thatmay be remitted substantially tax-free. The total ofundistributed earnings that would be subject to federalincome tax if remitted under existing law is approxi-mately $398,793 at October 25, 2013. Determination ofthe unrecognized deferred tax liability related to theseearnings is not practicable because of the complexitieswith its hypothetical calculation. Upon distribution ofthese earnings, we will be subject to U.S. taxes and with-holding taxes payable to various foreign governments. Acredit for foreign taxes already paid would be availableto reduce the U.S. tax liability.
Income taxes paid during 2013, 2012, and 2011 were$124,530, $110,124, and $83,051, respectively.
Our income tax returns, like those of most companies,are periodically audited by domestic and foreign taxauthorities. These audits include questions regarding ourtax filing positions, including the timing and amount ofdeductions and the allocation of income among varioustax jurisdictions. At any one time, multiple tax years aresubject to audit by the various tax authorities. We recordan accrual for uncertain tax positions after evaluatingthe positions associated with our various income taxfilings. A number of years may elapse before a particularmatter for which we have established an accrual isaudited and fully resolved or clarified. We adjust our taxcontingencies accrual and income tax provision in theperiod in which matters are effectively settled with taxauthorities at amounts different from our establishedaccrual, the statute of limitations expires for the relevanttaxing authority to examine the tax position or whenmore information becomes available.
A reconciliation of the beginning and ending amountof unrecognized tax benefits (excluding interest andpenalties) for fiscal year 2010 through 2013 isas follows:
Unrecognized tax benefitsat October 29, 2010 $ 17,817Increases in tax positions for prior years 323Decreases in tax positions for prior years (505)Increases in tax positions for current year 2,164Settlements (171)Lapse in statute of limitations (6,680)Unrecognized tax benefitsat October 28, 2011 $ 12,948Increases in tax positions for prior years 159Decreases in tax positions for prior years (447)Increases in tax positions for current year 2,165Settlements (2,957)Lapse in statute of limitations (1,903)Unrecognized tax benefitsat October 26, 2012 $ 9,965Increases in tax positions for prior years 5,265Decreases in tax positions for prior years (864)Increases in tax positions for current year 2,719Settlements —Lapse in statute of limitations (1,722)Unrecognized tax benefitsat October 25, 2013 $ 15,363
We recognize interest and penalties related to unrecog-nized tax benefits in income tax expense. We had recog-nized accrued interest and penalties relating tounrecognized tax benefits of $4,461, $2,582, and$4,620 as of October 25, 2013, October 26, 2012, andOctober 28, 2011, respectively. The gross amount ofinterest expense/(income) and penalties included in taxexpense for the year ended October 25, 2013, October26, 2012, and October 28, 2011 was $(422), $(2,038),and $(1,287), respectively.
The total amount of unrecognized tax benefits thatwould affect our effective tax rate if recognized was$14,485, $8,718, and $12,203 as of October 25, 2013,October 26, 2012, and October 28, 2011, respectively.
The company and its subsidiaries file income tax returnsin the U.S. federal jurisdiction, and numerous state andforeign jurisdictions. With few exceptions, we are nolonger subject to U.S. federal, state and local, or non-U.S.income tax examinations by tax authorities for yearsbefore 2008. The Internal Revenue Service (IRS)concluded its examination of our U.S. federal tax returnsfor the fiscal years ended 2009 and 2010 in October2012. There were no material adjustments to ourincome tax expense or balance of unrecognized taxbenefits as a result of the IRS examination. We arecurrently under audit in several state and foreign juris-dictions. We also expect various statutes of limitation toexpire during the next 12 months. Due to the uncertainresponse of taxing authorities, a range of outcomescannot be reasonably estimated at this time.

NOTE 13 – NET INCOME (LOSS) PER COMMON SHARE
The following table presents the net income (loss) per common share calculations for the three most recent fiscalyears:
2013 2012 2011
BasicNet income (loss) $ 289,255 $ 292,497 $ (138,601)Weighted-average common shares outstanding – basic 87,793,543 91,415,055 94,309,679
Net Income (Loss) per Common Share – Basic $ 3.29 $ 3.20 $ (1.47)
DilutedNet income (loss) $ 289,255 $ 292,497 $ (138,601)Weighted-average common shares outstanding – basic 87,793,543 91,415,055 94,309,679Dilutive effect of stock options and unvested restricted stock 2,732,742 2,965,421 —
Equivalent average common shares outstanding – diluted 90,526,285 94,380,476 94,309,679Net Income (Loss) per Common Share – Diluted $ 3.20 $ 3.10 $ (1.47)
Basic earnings per share are based on the weighted-average number of common shares outstanding during eachperiod. In computing diluted earnings per share, the number of common shares outstanding is increased by commonstock options with exercise prices lower than the average market prices of common shares during each period andreduced by the number of shares assumed to have been purchased with proceeds from the exercised options. If weare in a net loss position, these shares are excluded as they are antidilutive. Potential common shares of 284,663,67,411, and 3,057,297 related to our outstanding stock options were excluded from the computation of diluted earn-ings per share for 2013, 2012, and 2011, respectively, as inclusion of these shares would have been antidilutive.
NOTE 14 – ACCUMULATED OTHER COMPREHENSIVE INCOME (LOSS)
Accumulated other comprehensive income (loss), net of tax, consists of the following:
AccumulatedOther
Foreign Currency Benefit Financial ComprehensiveTranslation Obligations Instruments Income (Loss)
Balance, October 29, 2010 $ 159,966 $ (79,100) $ 7,221 $ 88,087Other comprehensive income (loss), net of tax (7,175) (5,332) (12,801) (25,308)Balance, October 28, 2011 152,791 (84,432) (5,580) 62,779Other comprehensive income (loss), net of tax 6,819 (14,975) (4,351) (12,507)Balance, October 26, 2012 159,610 (99,407) (9,931) 50,272Other comprehensive income (loss), net of tax (26,007) 28,467 687 3,147Balance, October 25, 2013 $ 133,603 $ (70,940) $ (9,244) $ 53,419
The tax effects of each component of other comprehensive income (loss) are as follows:
For the Year Ended October 25, 2013 October 26, 2012 October 28, 2011
Foreign Currency Translation $ (26,007) $ 6,819 $ (7,175)Change in Benefit Obligations(Increase)/decrease in net loss 35,612 (27,049) (15,495)Reclassification for recognition of net loss includedin net periodic benefit cost 10,046 7,336 6,359(Increase)/decrease in net prior service cost (482) (209) (673)Reclassification for amortization of prior service (credit)cost included in net periodic pension cost 320 307 269Income tax benefit (expense) (17,029) 4,640 4,208
Change in Benefit Obligations 28,467 (14,975) (5,332)Change in Financial InstrumentsNet unrealized holding gains (losses) (25) (7,424) (20,286)Reclassification adjustment for net (gains) lossesincluded in net income 1,143 350 (529)Income tax benefit (expense) (431) 2,723 8,014
Change in Financial Instruments 687 (4,351) (12,801)Other Comprehensive Income (Loss) $ 3,147 $ (12,507) $ (25,308)
47

We deem our foreign investments to be permanent innature and therefore do not provide for taxes on foreigncurrency translation adjustments.
Amounts related to financial instruments are reclassifiedto net income based on the nature of the adjustment.See Note 8 for further information on financial instru-ment reclassifications.
Amounts related to pension and post-retirement medicaladjustments are reclassified to pension cost, which isallocated to cost of sales and operating expenses basedon salaries and wages, approximately as follows(in thousands):
2013 2012 2011
Cost of sales $ 4,056 $ 3,056 $ 2,700Research and Development 1,352 1,039 876Selling, General andAdministrative 4,958 3,548 3,052Total Before Income Taxes $ 10,366 $ 7,643 $ 6,628
NOTE 15 – SEGMENT INFORMATION
Based on the nature of our products, technology, manu-facturing processes, customers and regulatory environ-ment, we aggregate our operating segments into tworeportable segments: Coatings and Paints. We arerequired to report segment information in the same waythat management internally organizes its business forassessing performance and making decisions regardingallocation of resources. We evaluate the performance ofoperating segments and allocate resources based onprofit or loss from operations before interest expenseand taxes (EBIT).
The Coatings segment aggregates our industrial productlines and packaging product line. Industrial productsinclude a broad range of decorative and protective coat-ings for metal, wood and plastic. Packaging productsinclude both interior and exterior coatings used in pack-aging containers, principally metal food containers andbeverage cans. The products of this segment are soldthroughout the world.
The Paints segment aggregates our consumer paintsand automotive refinish product lines. Consumer paintproducts include interior and exterior decorative paints,stains, primers, varnishes, high performance floor paintsand specialty decorative products, such as enamels,aerosols and faux finishes primarily distributed for thedo-it-yourself and professional markets in Australia,China and North America. Automotive paint productsinclude refinish paints and aerosol spray paints soldthrough automotive refinish distributors, body shopsand automotive supply distributors and retailers inmany countries around the world.
48
Our remaining activities are included in Other andAdministrative (formerly All Other). These activitiesinclude specialty polymers and colorants that are usedinternally and sold to other coatings manufacturers, aswell as related products and furniture protection plans.In the fourth quarter of fiscal year 2012, we exited thegelcoat products market. Also included within Otherand Administrative are our corporate administrativeexpenses. The administrative expenses include expensesnot directly allocated to any other reportable segment.
In the following table, sales between segments arerecorded at selling prices that are below market prices,generally intended to recover internal costs. SegmentEBIT includes income realized on inter-segment sales.Comparative segment data for fiscal years 2013, 2012,and 2011 are as follows:
2013 2012 2011
Net SalesCoatings $ 2,209,492 $ 2,175,687 $ 2,092,490Paints 1,671,228 1,604,599 1,612,219Other andAdministrative 377,991 380,698 360,059Less Intersegmentsales (154,935) (140,133) (111,814)
Total Net Sales $ 4,103,776 $ 4,020,851 $ 3,952,954
2013 2012 2011
EBITCoatings $ 329,886 $ 356,428 $ (112,209)Paints 168,395 159,598 134,886Other andAdministrative (9,728) (31,198) (64,320)
Total EBIT 488,553 484,828 (41,643)Interest Expense 64,758 67,604 61,511Income (Loss)before IncomeTaxes $ 423,795 $ 417,224 $ (103,154)
2013 2012 2011
Depreciation andAmortizationCoatings $ 39,705 $ 39,166 $ 47,205Paints 33,825 35,220 34,202Other andAdministrative 14,629 19,318 16,340
Total Depreciationand Amortization $ 88,159 $ 93,704 $ 97,747
2013 2012 2011
Identifiable AssetsCoatings $ 2,346,701 $ 2,071,211 $ 2,118,589Paints 1,309,214 1,174,252 1,030,712Other andAdministrative1 369,594 381,373 350,850
Total IdentifiableAssets $ 4,025,509 $ 3,626,836 $ 3,500,151
1 Includes our consolidated cash and cash equivalent balances andrestricted cash.
2013 2012 2011
Capital ExpendituresCoatings $ 46,194 $ 52,575 $ 32,284Paints 32,856 20,839 18,650Other andAdministrative 37,699 15,949 15,535
Total CapitalExpenditures $ 116,749 $ 89,363 $ 66,469
It is not practicable to obtain the information needed todisclose revenues attributable to each of our identifiedproduct lines within our reportable segments.
Geographic net sales are based on the country fromwhich the customer was billed for the products sold. TheUnited States is the largest country for customer sales.China and Australia are the only countries outside of theUnited States that represent more than 10% of consoli-dated sales. Long-lived assets include property, plantand equipment, intangibles and goodwill attributable toeach country’s operations. Net sales and long-livedassets by geographic region are as follows:
2013 2012 2011
Net Sales – ExternalUnited States $ 2,310,786 $ 2,177,694 $ 2,055,494China 484,689 498,352 488,272Australia 356,780 411,433 481,578Other Countries 951,521 933,372 927,610
Total Net Sales –External $ 4,103,776 $ 4,020,851 $ 3,952,954
2013 2012 2011
Long-lived AssetsUnited States $ 1,215,784 $ 1,171,027 $ 1,186,267China 412,122 377,593 366,417Australia 121,700 142,603 144,316Other Countries 637,529 466,520 462,545
Total Long-livedAssets $ 2,387,135 $ 2,157,743 $ 2,159,545
We have one significant customer in the Paints seg-ment whose net sales were 17.9%, 16.8%, and 16.4%of total consolidated net sales in 2013, 2012, and2011 respectively.
NOTE 16 – LEGAL PROCEEDINGS
Environmental Matters
We are involved in various claims relating to environ-mental matters at a number of current and former plantsites and waste and management sites. We engage orparticipate in remedial and other environmental compli-ance activities at certain of these sites. At other sites, wehave been named as a potentially responsible party(PRP) under federal and state environmental laws forsite remediation. We analyze each individual site, consid-ering the number of parties involved, the level of ourpotential liability or contribution relative to the otherparties, the nature and magnitude of the hazardouswastes involved, the method and extent of remediation,the potential insurance coverage, the estimated legal
49
and consulting expense with respect to each site andthe time period over which any costs would likely beincurred. Based on the above analysis, we estimate theclean-up costs and related claims for each site. The esti-mates are based in part on discussion with other PRPs,governmental agencies and engineering firms.
We accrue appropriate reserves for potential environ-mental liabilities, which are reviewed and adjusted asadditional information becomes available. While uncer-tainties exist with respect to the amounts and timing ofour ultimate environmental liabilities, managementbelieves it is neither probable nor reasonably possiblethat such liabilities, individually or in the aggregate, willhave a material adverse effect on our financial condition,results of operations or cash flows.
Other Legal Matters
We are involved in a variety of legal claims and proceed-ings relating to personal injury, product liability,warranties, customer contracts, employment, trade prac-tices, environmental and other legal matters that arise inthe normal course of business. These claims and pro-ceedings include cases where we are one of a numberof defendants in proceedings alleging that the plaintiffssuffered injuries or contracted diseases from exposure tochemicals or other ingredients used in the production ofsome of our products or waste disposal. We are alsosubject to claims related to the performance of ourproducts. We believe these claims and proceedings arein the ordinary course for a business of the type andsize in which we are engaged. While we are unable topredict the ultimate outcome of these claims andproceedings, we believe it is neither probable norreasonably possible that the costs and liabilities of suchmatters, individually or in the aggregate, will have amaterial adverse effect on our financial condition, resultsof operations or cash flows.
NOTE 17 – LEASING ARRANGEMENTS
We have operating lease commitments outstanding atOctober 25, 2013, for plant and warehouse equipment,office and warehouse space, automobiles and retailstores. The leases have initial periods ranging fromone to ten years, with minimum lease payments asfollows:
MinimumLease Payments
2014 $35,3592015 27,1392016 21,9412017 15,0682018 9,5412019 and beyond 43,453Total $152,501
Rent expense for operating leases was $40,266 in 2013,$44,167 in 2012, and $45,154 in 2011.

NOTE 18 – RESTRUCTURING
Fiscal year 2013 restructuring initiatives included thefollowing: (i) actions in the Paints segment to consoli-date manufacturing and distribution operationsfollowing the acquisition of Ace Hardware Corporation’spaint manufacturing business, ongoing profit improve-ment plans in Australia, and other actions in Asia,(ii) actions in our Coatings segment to consolidatemanufacturing operations in Europe following the acqui-sition of the Inver Group, and other actions to rationalizemanufacturing operations and lower operating expenses,and (iii) overall initiatives to improve our global coststructure, including non-manufacturing headcountreductions. These restructuring activities resulted inpre-tax charges of $36,433 in fiscal year 2013. Includedin fiscal year 2013 restructuring charges is $6,664 innon-cash pre-tax asset impairment charges. Subse-quent to the end of the fiscal year and prior to filing thisreport, we incurred approximately $12,000 in pre-taxrestructuring charges related to the continuation ofthese actions. See Note 2 in Notes to ConsolidatedFinancial Statements for further information on our InverGroup acquisition.
In fiscal year 2012, we exited the gelcoat productsmarket and consolidated a manufacturing facility in ourPaints segment. Our gelcoat product line was catego-rized in Other and Administrative. During fiscal year2012, we also completed restructuring initiativesannounced in 2011, including certain actions in our
50
Coatings and Paints segments. In our Coatings segment,we rationalized our manufacturing capacity and reducedour overall global headcount, primarily in our woodproduct line. In our Paints segment, we completed thefirst phase of actions to improve the profitability ofAustralia operations, which included facility consolida-tions in manufacturing and distribution, store rationali-zation and the reduction of other related costs. Theserestructuring activities were completed in 2012 andresulted in pre-tax charges of $25,845 and $33,093 infiscal years 2012 and 2011, respectively.
In fiscal year 2008, we initiated a comprehensive seriesof restructuring activities that were completed in fiscalyear 2011. These restructuring initiatives included plantclosures, reductions to research and development andselling, general and administrative expenses, manufac-turing consolidation and relocation, and our exit fromnon-strategic product lines in certain geographies. Werationalized our manufacturing capacity and reducedour overall global headcount to lower our costs in lightof the challenging global economic conditions. Restruc-turing charges for these initiatives were $1,346 pre-taxin fiscal year 2011.
The total resulting expenses recognized in fiscal year2013, 2012, and 2011 included severance andemployee benefits, asset impairments, professionalservices and site clean-up. We plan to pay the majorityof the current restructuring liabilities within the nexttwelve months.
The following restructuring charges by segment were recorded in 2013, 2012 and 2011:
Liability LiabilityBeginning EndingBalance Balance
For the Year Ended October 25, 2013 10/26/2012 Expense Activity 10/25/2013
CoatingsSeverance and employee benefits $ 2,234 $ 17,772 $ (1,107) $ 18,899Asset impairments — 1,565 (1,565) —Exit costs (consulting/site clean-up) 390 155 (426) 119Total Coatings 2,624 19,492 (3,098) 19,018
PaintsSeverance and employee benefits 2,104 9,470 (5,456) 6,118Asset impairments — 5,038 (5,038) —Exit costs (consulting/site clean-up) 3,984 445 (2,233) 2,196Total Paints 6,088 14,953 (12,727) 8,314
Other and AdministrativeSeverance and employee benefits 297 1,779 (285) 1,791Asset impairments — 61 (61) —Exit costs (consulting/site clean-up) — 148 (148) —Total Other and Administrative 297 1,988 (494) 1,791
Total $ 9,009 $ 36,433 $ (16,319) $ 29,123

Liability LiabilityBeginning EndingBalance Balance
For the Year Ended October 26, 2012 10/28/2011 Expense Activity 10/26/2012
CoatingsSeverance and employee benefits $ 3,884 $ 545 $ (2,195) $ 2,234Asset impairments — 658 (658) —Exit costs (consulting/site clean-up) 2,802 215 (2,627) 390Total Coatings 6,686 1,418 (5,480) 2,624
PaintsSeverance and employee benefits 2,915 5,544 (6,355) 2,104Asset impairments — 7,447 (7,447) —Exit costs (consulting/site clean-up) 408 5,401 (1,825) 3,984Total Paints 3,323 18,392 (15,627) 6,088
Other and AdministrativeSeverance and employee benefits 437 1,551 (1,691) 297Asset impairments — 3,616 (3,616) —Exit costs (consulting/site clean-up) — 868 (868) —Total Other and Administrative 437 6,035 (6,175) 297
Total $ 10,446 $ 25,845 $ (27,282) $ 9,009
Liability LiabilityBeginning EndingBalance Balance
For the Year Ended October 28, 2011 10/29/2010 Expense Activity 10/28/2011
CoatingsSeverance and employee benefits $ 1,139 $ 10,044 $ (7,299) $ 3,884Asset impairments — 5,644 (5,644) —Exit costs (consulting/site clean-up) 2,034 5,252 (4,484) 2,802Total Coatings 3,173 20,940 (17,427) 6,686
PaintsSeverance and employee benefits 19 7,945 (5,049) 2,915Asset impairments — 4,169 (4,169) —Exit costs (consulting/site clean-up) 2,763 899 (3,254) 408Total Paints 2,782 13,013 (12,472) 3,323
Other and AdministrativeSeverance and employee benefits — 486 (49) 437Total Other and Administrative — 486 (49) 437
Total $ 5,955 $ 34,439 $ (29,948) $ 10,446
The ending liability balance at October 25, 2013, October 26, 2012, and October 28, 2011 is included in otheraccrued liabilities on our Consolidated Balance Sheets. For 2013, $21,916 was charged to cost of sales, $5,524 wasrecorded to research and development (R&D) expenses and $8,993 was charged to selling, general and administra-tive (SG&A) expenses. For 2012, $16,199 was charged to cost of sales, $243 was recorded to R&D expenses and$9,403 was charged to SG&A expenses. For 2011, $25,563 was charged to cost of sales, $862 was recorded to R&Dexpenses and $8,014 was charged to SG&A expenses. The restructuring reserve balances presented are consideredadequate to cover committed restructuring actions. The restructuring expenses recorded are included in the Consoli-dated Statements of Operations.
51

NOTE 19 – QUARTERLY RESULTS OF OPERATIONS (UNAUDITED)
The following is a tabulation of the unaudited quarterly results for the years ended October 25, 2013 andOctober 26, 2012:
Net Income Net Income(Loss) per (Loss) perCommon Common
Gross Net Income Share – Share –Net Sales Profit (Loss) Basic Diluted
2013 Quarter EndedJanuary 25 $ 875,242 $ 294,351 $ 55,029 $ 0.62 $ 0.60April 26 1,031,219 338,553 76,908 0.87 0.84July 26 1,089,013 369,361 93,808 1.08 1.04October 25 1,108,302 355,793 63,510 0.74 0.72
$ 4,103,776 $ 1,358,058 $ 289,255 $ 3.29 $ 3.20
2012 Quarter EndedJanuary 27 $ 885,647 $ 293,316 $ 55,782 $ 0.60 $ 0.58April 27 1,032,572 355,440 76,540 0.83 0.80July 27 1,078,348 363,950 86,406 0.95 0.92October 26 1,024,284 340,998 73,769 0.82 0.79
$ 4,020,851 $ 1,353,704 $ 292,497 $ 3.20 $ 3.10
The quarters will not sum to the fiscal year amount due to rounding and the effect of weighting.
52
NOTE 20 – RECENTLY ISSUED ACCOUNTINGSTANDARDS
In July 2013, the Financial Accounting StandardsBoard (“FASB”) issued guidance on classification of anunrecognized tax benefit. An unrecognized tax benefitshould be presented as a reduction of a deferred taxasset for a net operating loss carry-forward or other taxcredit carry-forward when settlement in this manner isavailable under the tax law. The change is effective forfiscal years, and interim periods within those years,beginning after December 15, 2013, which means thefirst quarter of our fiscal year 2015, and is to be appliedprospectively. We do not expect the adoption of thisaccounting guidance to have an effect on our consoli-dated financial statements.
In March 2013, the FASB issued guidance on a parent’saccounting for the cumulative translation adjustment(CTA) under certain circumstances. The new guidancerequires a transfer from CTA into net income when aparent either sells a part or all of its investment in aforeign entity, or no longer holds a controlling financialinterest in a subsidiary or group of assets that is a busi-ness. This update aims to resolve diversity in practice inaccounting for the CTA transfer into net income. Thechange is effective for fiscal years, and interim reportingperiods within those years, beginning after December15, 2013, which means the first quarter of our fiscalyear 2015, and is to be applied prospectively. We do notexpect the adoption of these updated disclosure require-ments to have an effect on our consolidated results ofoperations, financial condition or liquidity.
In February 2013, the FASB further amended the disclo-sure requirements for comprehensive income. Theupdate requires companies to disclose items reclassified
out of accumulated other comprehensive income (AOCI)and into net income in a single location either in thenotes to the consolidated financial statements orparenthetically on the face of the Statements ofOperations. The change is effective for fiscal years, andinterim periods within those years, beginning afterDecember 15, 2012, which means the first quarter ofour fiscal year 2014, and is to be applied prospectively.We early adopted the new requirements in the fourthquarter of our 2013 fiscal year. The adoption of theseupdated disclosure requirements did not have an effecton our consolidated results of operations, financialcondition or liquidity.
ITEM 9 CHANGES IN AND DISAGREEMENTSWITH ACCOUNTANTS ON ACCOUNTINGAND FINANCIAL DISCLOSURE
None.
ITEM 9A CONTROLS AND PROCEDURES
Disclosure controls and procedures (as defined inExchange Act Rules 13a-15(e) and 15d-15(e)) are ourcontrols and other procedures that are designed toensure that information required to be disclosed by us inthe reports that we file or submit under the Exchange Actis recorded, processed, summarized and reported withinthe time periods specified in the Securities and ExchangeCommission’s rules and forms. Disclosure controls andprocedures include, without limitation, controls andprocedures designed to ensure that information requiredto be disclosed by us in the reports that we file or submitunder the Exchange Act is accumulated and communi-cated to our management, including our Chief ExecutiveOfficer and Chief Financial Officer, as appropriate, toallow timely decisions regarding required disclosure.
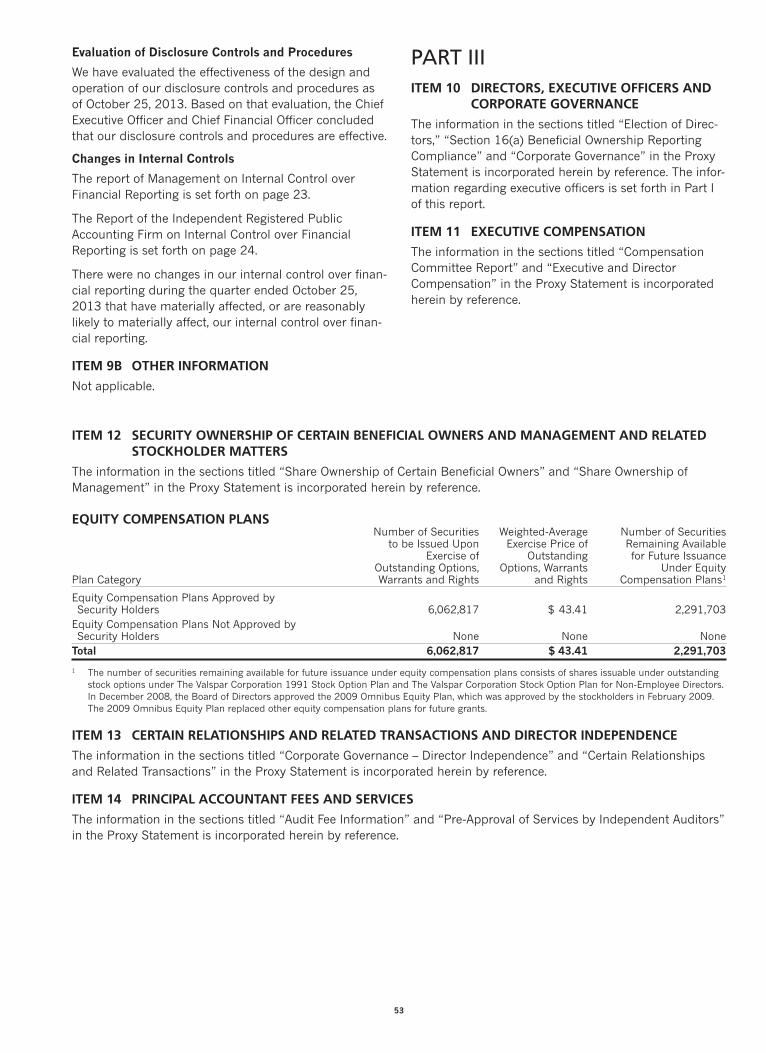
53
Evaluation of Disclosure Controls and Procedures
We have evaluated the effectiveness of the design andoperation of our disclosure controls and procedures asof October 25, 2013. Based on that evaluation, the ChiefExecutive Officer and Chief Financial Officer concludedthat our disclosure controls and procedures are effective.
Changes in Internal Controls
The report of Management on Internal Control overFinancial Reporting is set forth on page 23.
The Report of the Independent Registered PublicAccounting Firm on Internal Control over FinancialReporting is set forth on page 24.
There were no changes in our internal control over finan-cial reporting during the quarter ended October 25,2013 that have materially affected, or are reasonablylikely to materially affect, our internal control over finan-cial reporting.
ITEM 9B OTHER INFORMATION
Not applicable.
PART IIIITEM 10 DIRECTORS, EXECUTIVE OFFICERS AND
CORPORATE GOVERNANCE
The information in the sections titled “Election of Direc-tors,” “Section 16(a) Beneficial Ownership ReportingCompliance” and “Corporate Governance” in the ProxyStatement is incorporated herein by reference. The infor-mation regarding executive officers is set forth in Part Iof this report.
ITEM 11 EXECUTIVE COMPENSATION
The information in the sections titled “CompensationCommittee Report” and “Executive and DirectorCompensation” in the Proxy Statement is incorporatedherein by reference.
ITEM 12 SECURITY OWNERSHIP OF CERTAIN BENEFICIAL OWNERS AND MANAGEMENT AND RELATEDSTOCKHOLDER MATTERS
The information in the sections titled “Share Ownership of Certain Beneficial Owners” and “Share Ownership ofManagement” in the Proxy Statement is incorporated herein by reference.
EQUITY COMPENSATION PLANSNumber of Securities Weighted-Average Number of Securitiesto be Issued Upon Exercise Price of Remaining Available
Exercise of Outstanding for Future IssuanceOutstanding Options, Options, Warrants Under Equity
Plan Category Warrants and Rights and Rights Compensation Plans1
Equity Compensation Plans Approved bySecurity Holders 6,062,817 $ 43.41 2,291,703Equity Compensation Plans Not Approved bySecurity Holders None None NoneTotal 6,062,817 $ 43.41 2,291,703
1 The number of securities remaining available for future issuance under equity compensation plans consists of shares issuable under outstandingstock options under The Valspar Corporation 1991 Stock Option Plan and The Valspar Corporation Stock Option Plan for Non-Employee Directors.In December 2008, the Board of Directors approved the 2009 Omnibus Equity Plan, which was approved by the stockholders in February 2009.The 2009 Omnibus Equity Plan replaced other equity compensation plans for future grants.
ITEM 13 CERTAIN RELATIONSHIPS AND RELATED TRANSACTIONS AND DIRECTOR INDEPENDENCE
The information in the sections titled “Corporate Governance – Director Independence” and “Certain Relationshipsand Related Transactions” in the Proxy Statement is incorporated herein by reference.
ITEM 14 PRINCIPAL ACCOUNTANT FEES AND SERVICES
The information in the sections titled “Audit Fee Information” and “Pre-Approval of Services by Independent Auditors”in the Proxy Statement is incorporated herein by reference.

PART IVITEM 15 EXHIBITS AND FINANCIAL STATEMENT
SCHEDULES
(a) Documents filed as part of this report.
(1) Financial Statements
Page
Report of Management on Internal ControlOver Financial Reporting .................................................... 23Report of Independent Registered PublicAccounting Firm on Internal Control OverFinancial Reporting ............................................................... 24Report of Independent Registered PublicAccounting Firm on Consolidated FinancialStatements................................................................................ 25Consolidated Balance Sheets – October 25, 2013and October 26, 2012 ......................................................... 26Consolidated Statements of Operations –Years ended October 25, 2013,October 26, 2012, and October 28, 2011 .................. 27Consolidated Statements of ComprehensiveIncome – Years ended October 25, 2013,October 26, 2012, and October 28, 2011 .................. 28Consolidated Statement of Changes in Equity –Years ended October 25, 2013,October 26, 2012, and October 28, 2011 .................. 29Consolidated Statements of Cash Flows –Years ended October 25, 2013,October 26, 2012, and October 28, 2011 .................. 30Notes to Consolidated Financial Statements ...............31–52Selected Quarterly Financial Data (Unaudited)........... 52
(2) Financial Statement Schedules
Schedule II – Valuation and Qualifying Accountsand Reserves can be found on page 57.
All other schedules for which provision is made inthe applicable accounting regulations of the Securi-ties and Exchange Commission are not requiredunder the related instructions or are inapplicableand therefore have been omitted.
(3) Exhibits
ExhibitNumber Description
3.1 Certificate of Incorporation – as amended toand including June 30, 1970, with furtheramendments to Article Four dated February29, 1984, February 25, 1986, February 26,1992, February 26, 1997 and May 22, 2003and to Article Eleven dated February 25, 1987(incorporated by reference to Form 10-K forthe period ended October 31, 1997, amend-ment filed with Form 10-Q for the quarterended April 25, 2003)
3.2 By-Laws – as amended and restated, effectiveAugust 19, 2009 (incorporated by reference toForm 10-Q for the quarter ended July 31,2009)
4.1 Indenture dated April 24, 2002, between theRegistrant and Bank One Trust Company, N.A.,as Trustee, relating to Registrant’s 6% Notesdue 2007 (The Bank of New York TrustCompany, N.A. is the successor in interest toBank One) (incorporated by reference to Form10-K for the period ended October 25, 2002,amendment filed with Form 10-Q for thequarter ended April 30, 2004)
4.2 Second Supplemental Indenture, dated as ofApril 17, 2007, to indenture dated as of April24, 2002, between the Registrant and TheBank of New York Trust Company, N.A. relatingto the Registrant’s 5.625% Notes due 2012and 6.050% Notes due 2017 (incorporated byreference to Exhibit 4.2 to Form 8-K filed onApril 18, 2007)
4.3 Indenture dated July 15, 2005 between theRegistrant and The Bank of New York TrustCompany, N.A., as Trustee, relating to theCompany’s 5.100% Notes due 2015, includingform of Registrant’s 5.100% Notes due 2015(incorporated by reference to Form 8-K filed onJuly 18, 2005)
4.4 Third Supplemental Indenture, between theRegistrant and U.S. Bank, National Association,as Trustee, dated June 19, 2009, to Indenturedated April 24, 2002, between the Registrantand The Bank of New York Trust Company,N.A. relating to the Registrant’s 7.250% Notesdue 2019 (incorporated by reference to Form8-K filed on June 23, 2009)
4.5 Fourth Supplemental Indenture, betweenthe Registrant and U.S. Bank, NationalAssociation, as Series Trustee, and The Bankof New York Mellon Trust Company, N.A., asOriginal Trustee, dated January 13, 2012,to Indenture dated April 24, 2002, betweenthe Registrant and The Bank of New YorkMellon Trust Company, N.A. relating to theRegistrant’s 4.200% Notes due 2022(incorporated by reference to Form 8-K filedon January 17, 2012)
10.1 The Valspar Corporation Key Employees’Supplementary Retirement Plan, restatedeffective October 15, 2008 (incorporated byreference to Form 10-K for the period endedOctober 31, 2008)*
10.2 The Valspar Corporation 1991 Stock OptionPlan – as amended through August 21, 2007(incorporated by reference to Form 10-K forthe period ended October 31, 2008)*
10.3 The Valspar Corporation Key Employee AnnualBonus Plan for Officers – as amended andrestated on June 8, 2010 (incorporated byreference to Form 8-K filed on June 14, 2010)*
54
10.4 The Valspar Corporation Stock Option Plan forNon-Employee Directors – as amendedthrough October 17, 2007 (incorporated byreference to Form 10-K for the period endedOctober 31, 2008)*
10.5 Form of Change in Control Employment Agree-ment between the Registrant and the Regis-trant’s Named Executives – as amendedthrough December 10, 2008 (incorporated byreference to Form 10-K for the period endedOctober 31, 2008)*
10.6 Form of Nonstatutory Stock Option Agreementfor Officers under the Corporation’s 1991Stock Option Plan – as amended August 21,2007 (incorporated by reference to Form 10-Kfor the period ended October 31, 2008)*
10.7 Three-Year Credit Agreement dated June 30,2009 with Wells Fargo Bank, National Associa-tion, as administrative agent and an issuingbank, Wachovia Bank, National Association, asan issuing bank, and certain other lenders,together with First Amendment to Three-YearCredit Agreement dated August 17, 2009(incorporated by reference to Form 10-Q forthe quarter ended January 29, 2010)
10.8 Form of Stock Option Granted to Non-Employee Directors – as amended October 17,2007 (incorporated by reference to Form 10-Kfor the period ended October 31, 2008)*
10.9 Form of Stock Option Granted to Certain Exec-utive Officers (incorporated by reference toForm 10-Q for the quarter ended April 28,2006)*
10.10 The Valspar Corporation 2009 Omnibus EquityPlan – as amended and restated on June 8,2010 (incorporated by reference to Form 10-Qfor the quarter ended April 30, 2010)*
10.11 Form of Indemnification Letter Agreement toNon-Employee Directors and Certain ExecutiveOfficers (incorporated by reference to Form10-Q for the quarter ended January 30, 2009)*
10.12 Term Sheet for Compensation Program forNon-Employee Directors (incorporated byreference to Form 8-K filed on October 23,2009)*
10.13 Second Amendment to Credit Agreement withWells Fargo Bank, National Association, asadministrative agent and an issuing bank, andcertain other lenders, dated as of November15, 2010 (incorporated by reference to Form8-K filed on November 19, 2010)
10.14 Letter Agreement between Registrant and GaryE. Hendrickson dated as of February 17, 2011(incorporated by reference to Form 10-Q filedfor the quarter ended January 28, 2011)*
55
10.15 Confidentiality and Noncompetition Agreementbetween Registrant and Gary E. Hendricksondated as of February 17, 2011 (incorporatedby reference to Form 10-Q filed for the quarterended January 28, 2011)
10.16 Restricted Stock Unit Agreement betweenRegistrant and Gary E. Hendrickson datedeffective as of June 1, 2011 (incorporated byreference to Form 10-Q filed for the quarterended January 28, 2011)*
10.17 Transition Agreement with Lori A. Walker datedas of November 2, 2012 (incorporated byreference to Form 8-K filed on November 7,2012)
10.18 Letter Agreement with James L. Muehlbauerdated as of February 11, 2013 (incorporatedby reference to Form 8-K filed on March 4,2013)*
10.19 Form of Change in Control Employment Agree-ment (for executive officers first elected infiscal 2013) (incorporated by reference toForm 10-Q filed for the quarter ended April 26,2013)*
14.1† Code of Ethics and Business Conduct (incorpo-rated by reference to Form 10-K for the periodended October 29, 2004)
21.1** Subsidiaries of the Registrant23.1** Consent of Independent Registered Public
Accounting Firm – Ernst & Young LLP31.1** Section 302 Certification of the Chief Executive
Officer31.2** Section 302 Certification of the Chief Financial
Officer32.1** Certification of Chief Executive Officer and
Chief Financial Officer Pursuant to 18 U.S.C.§1350, as Adopted Pursuant to Section 906 ofthe Sarbanes-Oxley Act of 2002
101.INS** XBRL Instance Document101.SCH** XBRL Schema Document101.CAL** XBRL Calculation Linkbase Document101.DEF** XBRL Definition Linkbase Document101.LAB** XBRL Label Linkbase Document101.PRE** XBRL Presentation Linkbase Document
*Compensatory plans or arrangements required to be filed pursuant toItem 15(b) of Form 10-K.
**Filed electronically herewith.
†Available at the Registrant’s website at http://www.valsparglobal.com.
Portions of the 2014 Proxy Statement are incorporated herein by refer-ence as set forth in Items 10, 11, 12, 13 and 14 of this report. Onlythose portions expressly incorporated by reference herein shall bedeemed filed with the Commission.

56
SIGNATURES
Pursuant to the requirements of Section 13 or 15(d) of the Securities Exchange Act of 1934, the registrant has dulycaused this report to be signed on its behalf by the undersigned, thereunto duly authorized.
THE VALSPAR CORPORATION
/s/ Rolf Engh 12/20/13
Rolf Engh, Secretary
Pursuant to the requirements of the Securities Exchange Act of 1934, this report has been signed below by thefollowing persons on behalf of the registrant and in the capacities and on the dates indicated.
/s/ Jack J. Allen 12/20/13
Jack J. Allen, Director
/s/ John M. Ballbach 12/20/13
John M. Ballbach, Director
/s/ John S. Bode 12/20/13
John S. Bode, Director
/s/ William M. Cook 12/20/13
William M. Cook, Director
/s/ Jeffrey H. Curler 12/20/13
Jeffrey H. Curler, Director
/s/ Shane D. Fleming 12/20/13
Shane D. Fleming, Director
/s/ Ian R. Friendly 12/20/13
Ian R. Friendly, Director
/s/ Janel S. Haugarth 12/20/13
Janel S. Haugarth, Director
/s/ Mae C. Jemison 12/20/13
Mae C. Jemison, Director
/s/ Gary E. Hendrickson 12/20/13
Gary E. Hendrickson, Chairmanand Chief Executive Officer(principal executive officer)
/s/ James L. Muehlbauer 12/20/13
James L. Muehlbauer, Executive Vice Presidentand Chief Financial and Administrative Officer(principal financial officer)
/s/ Brenda A. McCormick 12/20/13
Brenda A. McCormick, Corporate Controller(principal accounting officer)

The Valspar CorporationSchedule II – Valuation and Qualifying Accounts and Reserves
Changes in the allowance for doubtful accounts were as follows:
(dollars in thousands) 2013 2012 2011
Beginning balance $ 13,223 $ 14,977 $ 17,459Amount acquired through acquisitions 7,273 — 309Bad debt expense 669 4,009 2,992Uncollectable accounts written off, net of recoveries (4,226) (5,763) (5,783)Ending balance $ 16,939 $ 13,223 $ 14,977
57

Exhibit 21.1
Subsidiaries of The Valspar Corporation
The following are the significant subsidiaries of The Valspar Corporation. Where the name of the subsidiary includesthe “Valspar” name, that subsidiary does business under the Valspar corporate name:
Place of Incorporation
Engineered Polymer Solutions, Inc. (engaged in the manufacture and sale ofpaints, coatings, polymers and colorants itself and through 2 foreign subsidiaries) Delaware
Plasti-Kote Co., Inc. Ohio
Valspar Coatings Finance Corporation Minnesota
Valspar Finance Corporation Minnesota
Valspar Inc. Canada
Valspar Refinish, Inc. Mississippi
Valspar Sourcing, Inc. Minnesota
Valspar Mexicana, S.A. de C.V. (engaged in the manufacture and sale ofpaints and coatings itself and through 2 foreign subsidiaries) Mexico
The Valspar Corporation Limitada Brazil
Isocoat Tintas e Vernizes Limitada Brazil
Valspar (Uruguay) Corporation S.A. Uruguay
Valspar B.V. (engaged in the manufacture and sale of paints itself andthrough 1 foreign subsidiary) The Netherlands
The Valspar (Nantes) Corporation, S.A.S. France
The Valspar (France) Corporation, S.A.S. France
The Valspar (France) Research Corporation, S.A.S. France
Valspar Industries GmbH Germany
The Valspar (Germany) GmbH Germany
The Valspar (UK) Holding Corporation, Limited United Kingdom
The Valspar (UK) Corporation, Limited United Kingdom
Plasti-kote Limited United Kingdom
Valspar Powder Coatings Limited United Kingdom
The Valspar (Switzerland) Corporation AG Switzerland
The Valspar (Finland) Corporation Oy Finland
The Valspar (Spain) Corporation S.R.L. Spain
The Valspar (Italy) Corporation S.r.l. Italy
Inver S.p.A. (engaged in the manufacture and sale of coatings itselfand through 14 foreign subsidiaries) Italy
Valspar (India) Coatings Corporation Private Limited India
Valspar (South Africa) (Pty) Limited South Africa
The Valspar (South Africa) Corporation (Pty) Limited South Africa
Valspar Rock Company Ltd. Japan
The Valspar (Singapore) Corporation Pte Limited Singapore
The Valspar (Malaysia) Corporation Sdn Bhd Malaysia
The Valspar (Thailand) Corporation Limited Thailand
The Valspar (Vietnam) Corporation Limited Vietnam
The Valspar (Asia) Corporation Limited Hong Kong
The Valspar (H.K.) Corporation Limited Hong Kong
Hua Run Paints Holdings Company Limited Hong Kong
Valspar (Asia) Paints Holdings Limited Hong Kong
Valspar (Asia) Industrial Holdings Limited Hong Kong
Valspar (Asia) Trading Holdings Limited Hong Kong
Valspar (Asia) Operations Holdings Limited Hong Kong
Huarun Trading (China) Co., Ltd. Hong Kong
Valspar Hong Kong Holdings Limited Hong Kong
Valspar (Shanghai) Management Co., Ltd. PRC
Dongguan Lilly Paint Industries Limited PRC
58

Valspar Coatings (Shanghai) Co. Ltd. PRC
Guangdong Yuegang Dadi Paints Co. Ltd. PRC
Dongguan Huarun Paints Co., Ltd. PRC
Foshan Shunde Yueda Chemical Trading Company Limited PRC
Valspar Huarun Coatings (Guangdong) Co. Ltd. PRC
Valspar Coatings (Guangdong) Co., Ltd. PRC
Valspar Coatings (Shanghai) Co., Ltd. PRC
Valspar Coatings (Tianjin) Co., Ltd. PRC
Valspar Yueda Coatings (Foshan) Co., Ltd PRC
Valspar (Australia) Acquisition Corporation Pty Limited Australia
Valspar (Australia) Holdings Pty Limited Australia
The Valspar (Australia) Corporation Pty Limited Australia
Valspar Paint Holdings (Australia) Pty Limited Australia
Valspar Paint (Australia) Pty Ltd Australia
Valspar Paint Services Pty Ltd Australia
Valspar (WPC) Pty Ltd Australia
Valspar Automotive Australia Pty Limited Australia
Valspar Paint (NZ) Limited New Zealand
The Valspar (New Zealand) Corporation, Ltd. New Zealand
Subsidiaries not listed would not, if considered in the aggregate as a single subsidiary, constitute a significantsubsidiary.
59

60
Exhibit 23.1
Consent of Independent Registered Public Accounting Firm
We consent to the incorporation by reference in the following Registration Statements of our reports datedDecember 20, 2013, with respect to the consolidated financial statements and schedule of The Valspar Corporationand subsidiaries and the effectiveness of internal control over financial reporting of The Valspar Corporation andsubsidiaries, included in its Annual Report (Form 10-K) for the year ended October 25, 2013.
Registration Statement Form S-3 No. 333-178948, Registration Statement Form S-8 Nos. 33-51224 and 33-51226pertaining to The Valspar Stock Ownership Trusts; Form S-8 Nos. 33-51222 and 333-46865 pertaining to The ValsparProfit Sharing Retirement Plan; and Form S-8 Nos. 333-158588 and 333-167419 pertaining to The Valspar Corpora-tion 2009 Omnibus Equity Plan.
/s/ Ernst & Young LLP
Minneapolis, MinnesotaDecember 20, 2013

61
Exhibit 31.1
Section 302 Certification
I, Gary E. Hendrickson, certify that:
1. I have reviewed this annual report on Form 10-K of The Valspar Corporation;
2. Based on my knowledge, this report does not contain any untrue statement of a material fact or omit to state amaterial fact necessary to make the statements made, in light of the circumstances under which such statementswere made, not misleading with respect to the period covered by this report;
3. Based on my knowledge, the financial statements, and other financial information included in this report, fairlypresent in all material respects the financial condition, results of operations and cash flows of the registrant as of,and for, the periods presented in this report;
4. The registrant’s other certifying officer(s) and I are responsible for establishing and maintaining disclosurecontrols and procedures (as defined in Exchange Act Rules 13a-15(e) and 15d-15(e)) and internal control overfinancial reporting (as defined in Exchange Act Rules 13a-15(f) and 15d-15(f)) for the registrant and have:
(a) Designed such disclosure controls and procedures, or caused such disclosure controls and procedures tobe designed under our supervision, to ensure that material information relating to the registrant,including its consolidated subsidiaries, is made known to us by others within those entities, particularlyduring the period in which this report is being prepared;
(b) Designed such internal control over financial reporting, or caused such internal control over financialreporting to be designed under our supervision, to provide reasonable assurance regarding the reliabilityof financial reporting and the preparation of financial statements for external purposes in accordancewith generally accepted accounting principles;
(c) Evaluated the effectiveness of the registrant’s disclosure controls and procedures and presented in thisreport our conclusions about the effectiveness of the disclosure controls and procedures, as of the end ofthe period covered by this report based on such evaluation; and
(d) Disclosed in this report any change in the registrant’s internal control over financial reporting thatoccurred during the registrant’s most recent fiscal quarter (the registrant’s fourth fiscal quarter in thecase of an annual report) that has materially affected, or is reasonably likely to materially affect, theregistrant’s internal control over financial reporting; and
5. The registrant’s other certifying officer(s) and I have disclosed, based on our most recent evaluation of internalcontrol over financial reporting, to the registrant’s auditors and the audit committee of the registrant’s board ofdirectors (or persons performing the equivalent functions):
(a) All significant deficiencies and material weaknesses in the design or operation of internal control overfinancial reporting which are reasonably likely to adversely affect the registrant’s ability to record,process, summarize and report financial information; and
(b) Any fraud, whether or not material, that involves management or other employees who have a significantrole in the registrant’s internal control over financial reporting.
Date: December 20, 2013 /s/ Gary E. Hendrickson
Gary E. HendricksonChairman and Chief Executive Officer

62
Exhibit 31.2
Section 302 Certification
I, James L. Muehlbauer, certify that:
1. I have reviewed this annual report on Form 10-K of The Valspar Corporation;
2. Based on my knowledge, this report does not contain any untrue statement of a material fact or omit to state amaterial fact necessary to make the statements made, in light of the circumstances under which such statementswere made, not misleading with respect to the period covered by this report;
3. Based on my knowledge, the financial statements, and other financial information included in this report, fairlypresent in all material respects the financial condition, results of operations and cash flows of the registrant as of,and for, the periods presented in this report;
4. The registrant’s other certifying officer(s) and I are responsible for establishing and maintaining disclosurecontrols and procedures (as defined in Exchange Act Rules 13a-15(e) and 15d-15(e)) and internal control overfinancial reporting (as defined in Exchange Act Rules 13a-15(f) and 15d-15(f)) for the registrant and have:
(a) Designed such disclosure controls and procedures, or caused such disclosure controls and procedures tobe designed under our supervision, to ensure that material information relating to the registrant,including its consolidated subsidiaries, is made known to us by others within those entities, particularlyduring the period in which this report is being prepared;
(b) Designed such internal control over financial reporting, or caused such internal control over financialreporting to be designed under our supervision, to provide reasonable assurance regarding the reliabilityof financial reporting and the preparation of financial statements for external purposes in accordancewith generally accepted accounting principles;
(c) Evaluated the effectiveness of the registrant’s disclosure controls and procedures and presented in thisreport our conclusions about the effectiveness of the disclosure controls and procedures, as of the end ofthe period covered by this report based on such evaluation; and
(d) Disclosed in this report any change in the registrant’s internal control over financial reporting thatoccurred during the registrant’s most recent fiscal quarter (the registrant’s fourth fiscal quarter in thecase of an annual report) that has materially affected, or is reasonably likely to materially affect, theregistrant’s internal control over financial reporting; and
5. The registrant’s other certifying officer(s) and I have disclosed, based on our most recent evaluation of internalcontrol over financial reporting, to the registrant’s auditors and the audit committee of the registrant’s board ofdirectors (or persons performing the equivalent functions):
(a) All significant deficiencies and material weaknesses in the design or operation of internal control overfinancial reporting which are reasonably likely to adversely affect the registrant’s ability to record,process, summarize and report financial information; and
(b) Any fraud, whether or not material, that involves management or other employees who have a significantrole in the registrant’s internal control over financial reporting.
Date: December 20, 2013 /s/ James L. Muehlbauer
James L. MuehlbauerExecutive Vice President and Chief Financial andAdministrative Officer

Exhibit 32.1
Certification Pursuant to 18 U.S.C. §1350, as Adopted Pursuant to Section 906 of theSarbanes-Oxley Act of 2002
In connection with the Annual Report of The Valspar Corporation (the “Company”) on Form 10-K for the fiscal yearended October 25, 2013 as filed with the Securities and Exchange Commission on the date hereof (the “Report”), I,Gary E. Hendrickson, Chief Executive Officer of the Company and I, James L. Muehlbauer, Chief Financial Officer of theCompany, certify, pursuant to 18 U.S.C. §1350, as adopted pursuant to Section 906 of the Sarbanes-Oxley Act of2002, that:
1. The Report fully complies with the requirements of Section 13(a) or 15(d) of the Securities Act of 1934; and
2. The information contained in the Report fairly presents, in all material respects, the financial condition and resultsof operations of the Company.
/s/ Gary E. Hendrickson
Gary E. HendricksonChairman and Chief Executive Officer
December 20, 2013
/s/ James L. Muehlbauer
James L. MuehlbauerExecutive Vice President and Chief Financial andAdministrative Officer
December 20, 2013
63

Valspar corporate headquartersP.O. Box 1461
Minneapolis, MN 55440-1461
T 1-612-851-7000
F 1-612-486-9034
www.valsparglobal.com
Registrar and transfer agentComputershare
250 Royall Street
Canton, MA 02021
1-800-205-8318
www.computershare.com/investor
Annual meetingWednesday, February 19, 2014
11:00 AM, CST
Corporate Headquarters
901 Third Avenue South
Minneapolis, MN 55402
Gary E. Hendrickson Chairman, President and
Chief Executive Officer
Rolf Engh
Executive Vice President,
General Counsel and
Secretary
Steven L. Erdahl
Executive Vice President
James L. Muehlbauer
Executive Vice President,
Chief Financial and
Administrative Officer
Cynthia A. Arnold
Senior Vice President and
Chief Technology Officer
João R. Benites
Senior Vice President
Anthony L. Blaine
Senior Vice President
Howard C. Heckes
Senior Vice President
Bernard J. Ouimette
Senior Vice President
Roeland H. Polet
Senior Vice President
John R. Wardzel
Senior Vice President
Samuel W. Shoemaker
Group Vice President
Cordell S. Dietz
Vice President
Aaron M. Erter
Vice President
Andrew R. Hecker
Vice President
Tracy C. Jokinen
Vice President
Steven D. Person
Vice President
James E. Randolph
Vice President
Derrick Tay
Vice President
Tyler N. Treat
Vice President and
Treasurer
Corporate information
Corporate reports, earnings, announcements and news releasesStockholders seeking information about Valspar are invited
to call or write to the Corporate Secretary at Corporate
Headquarters. Quarterly earnings releases, stock split history
and other company announcements are published on Valspar’s
corporate website at www.valsparglobal.com.
Stock tradingValspar’s common stock is traded on the New York Stock
Exchange under the symbol VAL.
Investor services program and dividend reinvestment planComputershare
Online at: www.computershare.com/investor
Officers

Jack J. AllenExecutive Vice President and
Chief Operating Officer,
Navistar, Inc.
John M. BallbachFormer Chairman, President
and Chief Executive Officer,
VWR International, LLC
John S. BodeRetired Partner,
KPMG LLP
William M. CookChairman,
Chief Executive Officer
and President,
Donaldson Company, Inc.
Jeffrey H. CurlerRetired Executive Chairman,
Bemis Company, Inc.
Shane D. Fleming Chairman, President and
Chief Executive Officer,
Cytec Industries Inc.
Ian R. Friendly Executive Vice President,
Chief Operating Officer,
U.S. Retail,
General Mills, Inc.
Janel S. HaugarthExecutive Vice President,
President, Independent
Business and Supply Chain
Services
SUPERVALU INC.
Gary E. HendricksonChairman, President and
Chief Executive Officer,
The Valspar Corporation
Mae C. Jemison, M.D.President,
The Jemison Group, Inc.
Board of Directors
Left to right: Jack Allen, Shane Fleming, Jeffrey Curler, Mae Jemison, William Cook, Gary Hendrickson, John Ballbach, Ian Friendly, John Bode and Janel Haugarth.

Please recycle. Printed in U.S.A.© Valspar 2014. All rights reserved.
The Valspar CorporationP.O. Box 1461Minneapolis, MN 55440www.valsparglobal.com
R Printed on recycled paper using soy inks. Cover and pages 1-6 contain 10% total recovered fi ber/all post-consumer waste. Form 10-K contains 50% total recovered fi ber/all post-consumer waste.
10%10%