2013 annual report - home - australian vintage · pdf file · 2014-07-21are proud...
TRANSCRIPT

2013 ANNUAL REPORT
White Winemaker of the Year
2013International Wine
Challenge
International Winemaker of the Year 2012
International Wine & Spirits Competition

As a company so reliant on our environment and natural resources, we at Australian Vintage Limited are proud to produce our 2013 Annual Report on Carbon Neutral and 100% recycled paper.
EcoStar is an environmentally responsible paper made carbon neutral (CN) and the fibre source has been independently certified
by the Forest Stewardship Council (FSC). ecoStar is manufactured from 100% post consumer recycled paper in a process chlorine
free environment under the ISO 14001 environmental management system which guarantees continuous improvement. Carbon
Neutral: the carbon emissions of the manufacturing process for ecoStar include: Incoming deliveries – raw materials and wrapping;
Premises – energy consumption on site, waste treatment and disposal; Energy of materials – raw materials; Outgoing deliveries –
transportation of the finished product to Raleigh Paper warehouses have been measured and offset.
White Winemaker of the Year 2013International Wine Challenge
International Winemaker of the Year 2012 International Wine & Spirits Competition

Board of Directors 2
Chairman’s Report 3
Chief Executive Officer’s Report 4
Company Profile 6
Corporate Governance Statement 9
Shareholders’ Information 17
Directors’ Report 19
Declaration of Independence 32
Independent Audit Report 33
Directors’ Declaration 34
Financial Report
Consolidated Statement of Profit or Loss and Other Comprehensive Income 36
Consolidated Statement of Financial Position 37
Consolidated Statement of Changes in Equity 38
Consolidated Statement of Cash Flows 39
Notes to the Financial Statements 40
Note 1: General Information 40
Note 2: Adoption of new and revised Accounting Standards 40
Note 3: Summary of accounting policies 41
Note 4: Critical accounting judgements and key sources of estimation uncertainty 50
Note 5: Profit / (Loss) from operations 51
Note 6: Income taxes 52
Note 7: Key management personnel compensation 54
Note 8: Executive share option plan 54
Note 9: Remuneration of auditors 56
Note 10: Current trade and other receivables 56
Note 11: Current inventories 57
Note 12: Other current assets 57
Note 13: Non-current trade and other receivables 57
Note 14: Non-current inventories 57
Note 15: Other non-current financial assets 57
Note 16: Biological assets 58
Note 17: Property, plant and equipment 59
Note 18: Goodwill 60
Note 19: Water licences 61
Note 20: Other intangible assets 62
Note 21: Assets pledged as security 63
Note 22: Current trade and other payables 63
Note 23: Current borrowings 63
Note 24: Other current financial liabilities 63
Note 25: Current provisions 63
Note 26: Other current liabilities 63
Note 27: Non-current borrowings 64
Note 28: Non-current other financial liabilities 64
Note 29: Non-current provisions 64
Note 30: Provisions 65
Note 31: Foreign currency balances 66
Note 32: Issued capital 66
Note 33: Reserves 66
Note 34: Accumulated losses 66
Note 35: Earnings per share 67
Note 36: Dividends 67
Note 37: Leases and other commitments 68
Note 38: Contingent liabilities 68
Note 39: Subsidiaries 69
Note 40: Segment information 72
Note 41: Related party transactions 73
Note 42: Notes to the cash flow statement 75
Note 43: Financial instruments 77
Note 44: Events after the reporting period 83
Note 45: Parent Entity Disclosures 84
CONTENTS

Ian D Ferrier AM
Brian J McGuigan AM
Neil A McGuigan
Richard H Davis
Perry R Gunner
2 | BOARD OF DIRECTORS
3 | IAN FERRIER AM | CHAIRMAN’S REPORT
Dear shareholder
I am pleased to report that Australian Vintage delivered a Net Profit of $7.1 million, in line with the previous year. This represents a strong result when considered in the context of continuing difficult industry conditions and the comparatively small and, as a result, high cost 2012 vintage.
The Directors announced a fully franked dividend of 2.6 cents per share payable on 18 November 2013, demonstrating once again that the Board has faith in the Company’s ability to continue to perform well under current trading conditions.
A strong result The business has continued to reduce its cost base while running its core assets hard, and at the same time improving the reputation and value of its wines. During the year we have successfully renegotiated our vineyard leases resulting in a cost savings of $4.5 million per annum.
The 2013 vintage was up 28% to 153,000 tonnes, which has resulted in a reduction in our average wine cost per litre.
Our brands have continued to grow globally on the back of international awards recognising the ability of the Company to consistently deliver outstanding quality wines. The benefits have resulted in increased brand strength with the McGuigan brand growing by 10%, Tempus Two by 26% and Nepenthe by 18%.
Australian Vintage is in a strong financial position with secure banking facilities in place from our financiers who continue to support us.
AwardsAustralian Vintage has a very strong foundation for long term success and the Company’s assets, production and management are world class.
The Company’s commitment to its mission – to create great quality wines and brands that our consumers know and love was demonstrated during the year when the Company was again awarded the White Winemaker of the Year at one of the world’s most prestigious wine competitions – The International Wine Challenge. This latest award, together with previously being named International Winemaker of the Year three times at the International Wine and Spirits Competition, has given Australian Vintage six awards across two of the world’s premier wine competitions.
Global MarketsWe believe the global wine industry is moving towards balance and entering a new phase of its supply / demand cycle.
Global output fell from 26,400 million litres in 2011 to 24,800 million litres in 2012 and the 2012 vintage was the smallest since 1975. At the same time, increases in consumption have outpaced production for more than 6 years, and global inventories are now 7,500 million litres below the highs reached in 2006, a drop of approximately 40%(1).
Ian Ferrier AM Chairman
OutlookThe wine industry continues to restructure and markets and margins remain under pressure. The Company continues to respond to these conditions with ongoing cost control and branded sales momentum.
We expect improvements in our cash flow in 2014 as a result of initiatives that have been executed during the year, from improved exchange rates and from the fact that there is no need for the Company to purchase any significant bulk wine in the immediate future.
Since the release of our Financial Report on the 2 September 2013, the Company has successfully undertaken a capital raising which has raised approximately $42.0 million from the issue of additional shares to new and existing shareholders. The net proceeds from the capital raising were used to reduce bank debt and have enabled the Company to improve its balance sheet by significantly reducing debt and gearing. Further, having strengthened its capital position the Company is in a better position to take advantage of opportunities that may arise.
The Company also has carried forward tax losses which will minimise future tax payments and assist cash flow.
The improved trading conditions we are beginning to see are encouraging for Australian Vintage. We have turned the corner away from the corrective action that needed to be taken in the past and we see some positives as the industry cycle swings and supply and demand move further into balance. The weakening Australian dollar and the higher quality and quantity of our 2013 vintage, is reason to be optimistic.
While the UK market remains a challenge, the weakening of the Australian dollar should improve our margins as should the increased awareness of the company’s major brands in this market, driven by our brand focused strategy. We are also continuing to build on Australian reputation as a quality new wine producer in Asia.
On behalf of the Board and shareholders I would like to thank Neil McGuigan, his management team and all of the staff of Australian Vintage who continue to meet the challenges with commitment, innovation and effort.
The Board has focussed on its structure and composition and continues to assess options for renewal. It is satisfied that the current directors have the appropriate experience, stability and independence necessary to guide the Company in the current environment. I thank my fellow directors for their contribution during the year.
Finally I would like to thank all of our shareholders for your ongoing support
(1) Source : International Organisation of Vine and Wine, Rabobank Wine Quaterly
4 | NEIL MCGUIGAN | CHIEF EXECUTIVE OFFICER’S REPORT
Other achievements include:
• The McGuigan brand sales grew 10% in FY13.
• The Tempus Two brand sales grew 26% in FY13.
• The Nepenthe brand sales grew 18% in FY13.
McGuigan Awards
• International Winemaker of the Year at the International Wine & Spirits Competition in London – 2009 | 2011 | 2012.
• White Winemaker of the Year at the International Wine Challenge in London – 2009 | 2012 | 2013.
• Winemaker Peter Hall recognised as Hunter Valley Winemaker of the Year 2013.
• Champion White Wine of Show – Bin 9000 Semillon 2005 – International Wine Challenge 2013.
• International Semillon Trophy | Australian White Wine Trophy | Hunter Valley Semillon Trophy – Bin 9000 Semillon 2005 – International Wine Challenge 2013.
• Australian Single Varietal White Wine Trophy – Bin 9000 Semillon 2007 – Decanter World Wine Awards 2013.
• Gold ‘Best in Class’ – Farms Shiraz 2009 – International Wine & Spirits Competition 2012.
• Top Gold – Bin 9000 Semillon 2007 – Cairns Wine Show.
Nepenthe Awards
• Trophy Best Australian Sauvignon Blanc £10+ – Altitude Sauvignon Blanc 2011 – Decanter World Wine Awards 2012.
• Gold – Pinnacle Ithaca Chardonnay 2011 – Australian Cool Climate Wine Show 2012.
• 5* Winery – James Halliday Australian Wine Companion 2013.
Tempus Two
• Trophy Best Semillon Blend – Varietal Semillon Sauvignon Blanc 2012 – Perth Royal Show 2012 Riverina Wine Show 2012.
• Gold – Copper Wilde Chardonnay 2011 – Hong Kong International Wine Challenge 2012.
• Gold – Copper Zenith Semillon 2005 | 2009 | 2010 – International Wine Challenge 2013.
Our wine show results have also continued this year with McGuigan wines winning the International Winemaker of the Year Trophy at the International Wine and Spirit Competition in London for the third time – a feat never achieved by any other wine company and in July McGuigan Wines also was named the International White Winemaker of the year at the International Wine Challenge in London also for the third time.
Dear fellow shareholders,
This year has been another tough year for the Australian wine industry but I am happy to report that AVL is still in positive territory and has made a modest profit in a very difficult environment. There is a lot of good news relating to the business which includes the continued growth of our core brands and the unparalleled performance of the company’s brands in the domestic and international show arena.
International and domestic growth of our brands has been a highlight this year with the McGuigan brand now the 7th largest wine brand in the UK, the largest global brand in Ireland and McGuigan has be recognised by the UK Drinks Business magazine as the 14th most admired wine brand in the world.

Making the wine the hero is still forefront of mind for everyone engaged in viticulture, winemaking and in production. At the same time this focused approach has created a culture for excellence throughout the whole business and there is a great sense of purpose and direction about what everyone is doing in the company.
The innovation in the business is not just aligned with wine styles but extends to how, and where, we market and promote our brands. Innovation, and achieving real cut through is the key.
Highlights for McGuigan Wines over the past year include McGuigan City Vineyard Dublin, the ongoing brand alignment with UK celebrity chef John Torode through, amongst others, a food and wine matching ebook, the Black Label Alfa Romeo car promotion in the domestic market and the high profile sponsorship of the St George Illawarra Dragons in the NRL. Tempus Two has continued its alignment with Mercedes Benz Fashion Week in Australia, and through this sponsorship, formed a close association with up and coming fashion label Aje. Later in 2013 Tempus Two will also be unveiled as the official wine partner of Portsea Polo in Victoria. Nepenthe has long been a supporter of the AAMI Kooyong Classic tennis in Melbourne – a partnership that continues in 2013 – and has also formed an association with well-known Australian chef and TV personality Lyndey Milan which has resulted in a series of exclusive video recipes matched to key wines in the portfolio.
Despite the difficult trading conditions, the comparatively small 2012 vintage and uncertain economic conditions we maintained our profit and dividend to shareholders -
• Net profit of $7.1 million, same as the previous year
• Total sales down 8.5% with lower UK and bulk wine contribution partially offset by increased sales of high value branded wines.
• 2013 vintage up 28% to 153,000 tonnes
Our strategies for the business have not changed from last year and your board have been very clear that the focus must remain on the following key points:
• Growing and strengthening our distribution channels in the China / Asia region, UK and Canada.
• Building sales and profitability of our core brands both domestically and internationally.
• Reviewing and decreasing our cost base.
• Creating appropriate new products for developing and emerging markets.
There are still many challenges in front of the business but our focus on quality wine production and driving branded sales throughout the world will create a platform that we believe will provide a more appropriate return on the capital employed to the business.
AVL is cautiously optimistic about the future of the business as the decreasing Australian dollar will provide opportunities for the company to create new profitable sales opportunities in markets that have been restrictive in the past plus will provide more profit in the markets where we already have significant sales.
Neil McGuigan Chief Executive Officer
5 | CHIEF EXECUTIVE OFFICER’S REPORT

6 | COMPANY PROFILE
Australian Vintage is a leading Australian wine company. With a fully integrated wine business model, the breadth of our capabilities extends to vineyards, boutique and large volume wine production, packaging, marketing and distribution.
As one of the largest vineyard owners and managers in Australia, Australian Vintage prides itself on producing outstanding and innovative wines for wine lovers the world over. This is reflected in our commitment to quality grape and wine production, the strength of our dynamic and award-winning wine brands, and the passion of the people behind them.
Today Australian Vintage is at the forefront of the Australian wine industry. Crushing approx-imately 10% of total Australian annual production, our vineyards and grape supply capacity extends through some of Australia’s most captivating and diverse wine regions including the Hunter and Barossa Valleys; the Murray-Darling, Langhorne Creek and Limestone Coast regions; as well as Griffith and the Adelaide Hills.
Our dynamic and award-winning wine brands are recognised and enjoyed across the globe. Over the past twelve months we continued our international awards success at two of the world’s most prestigious wine competitions, with McGuigan Wines having been recognised as International Winemaker of the Year at the International Wine & Spirits Challenge in London in late 2012. This is the third time in four years that McGuigan Wines has been crowned ‘the world’s best winemaker’ having previously won in 2009 and 2011. In the competitions 43 year history, no other winery world-wide has taken the title three times – something of which to be immensely proud.
In 2013 our awards success continued, this time at the International Wine Challenge in London where McGuigan Wines received the coveted White Winemaker of the Year trophy. This is the third time in the past five years that McGuigan Wines has been named the ‘world’s best white winemaker’, having already received the award in 2009 and 2011. McGuigan Wines was also nominated for the award in 2010.
Acclaim for our winemakers continues to grow, and is reflected in the continuing success of our brands and private label solutions in both the domestic market and in key export markets.
Diversity in winemaking techniques and regionality allows our viticulture and winemaking teams to be leaders in innovation and in the creation of a wide range of wine styles and varietals. Our wines are designed to reflect the tastes of wine lovers everywhere thanks to the individuality, personality, passion and commitment of our brands and the people behind them.
It’s an exciting time for the Australian Vintage and our brands, which continue to go from strength to strength on the back of the underlying principles of quality, consistency, innovation and value.

7 | COMPANY PROFILE
Our wine brands
McGuigan Wines The McGuigan name is synonymous with Australian winemaking. Four generations of the McGuigan family have made wine their life demonstrating a deep commitment and passion for Australian wine.
This energy, drive and uncompromising dedication to craft the finest Australian wines is reflected in McGuigan Wines international success, having been crowned International Winemaker of the Year at the prestigious International Wine & Spirits Competition (IWSC) in London for a record third time in 2012. Having already been recognised as the ‘world’ best winemaker’ by the IWSC in both 2009 and 2011, McGuigan Wines became the only winery world-wide to have won the award three times in the competitions 43 year history. The success continued at the equally prestigious International Wine Challenge (IWC) in London with McGuigan Wines awarded White Winemaker of the Year for the third time in 2013, having also won in 2009 and 2012.
The McGuigan spirit and dedication to modern Australian winemaking drives our brand today – when it comes to making wine we have a different point of view, a different mindset. We are entirely focused on the continuing evolution of the Australian wine
style, delivering wines that not only excite, but over deliver on quality at every price point.
Tempus TwoTempus Two’s roots are firmly planted in one of Australia’s oldest wine regions, the Hunter Valley, and one of Australia’s best known wine families, the McGuigan family.
Our award winning, architecturally designed Cellar Door is set among the rolling green vineyards of Pokolbin, in the heart of the Hunter Valley and reflects the Tempus Two spirit to blend the essence of tradition with the magic of innovation.
Today, the vision for Tempus Two remains; to create a unique and distinctive range of wines from Australia’s premier wine growing regions. By blending substance with style, Tempus Two creates wines that are affordable, luxurious and artisan showcasing familiar and new varietals in innovative, eye catching packaging. Inovation, elegance and finesse are the hallmarks
of the Tempus Two brand.
Nepenthe
Nepenthe is situated in the cool climate, high altitude and picturesque Adelaide Hills region in South Australia. Our hand-crafted, premium and award-winning cult wines are built on the strength of varietal faithfulness and subtle regional nuances. Passionate winemaking, innovative grape varieties and careful vineyard management ensure that Nepenthe’s exciting and elegant range of wines are the benchmark for the region. No more evident is this benchmark that in our fantastic achievement of being awarded Australia’s ‘best Sauvignon Blanc over $16’ at the revered Decanter World Wine Awards in London in 2012, the second time in four years we’ve been awarded this highly coveted trophy.
Miranda Miranda Wines was founded in 1938, when Francesco Miranda arrived in Australia from Naples, Italy. With him came a passion and desire to build a winemaking empire that led him to the fertile soils of the Riverina in regional NSW. Over 70 years later and with three generations of winemaking experience, Miranda is still crafting and developing wine styles that would make Francesco proud. Miranda now sources wines from some of Australia’s leading wine growing regions made in a style that reflects the richness of the Australian climate and terrain while still remaining true to its heritage, none more so than the multi-award winning
Golden Botrytis.
Yaldara Yaldara was established in 1947 by German winemaker, Hermann Thumm. Nestled in South Australia’s famous Barossa Valley, Yaldara and its magnificent Château have long been recognised as one of the most picturesque and attractive wineries in the country. Showcasing over 65 years of winemaking, this brand is led by its flagship 40 Year Old Premium Port, plus a superb range of fortified wines.
Passion Pop
Passion Pop has led the flavoured sparkling category for over 30 years. A true market leader, this iconic brand is synonymous with Australia retro-culture. Passion Pop continues to lead the market in flavoured sparkling wine product under $7.99.

EBITDA - $M
2009 - $M 24.52010 - $M 30.82011 - $M 29.42012 - $M 30.42013 - $M 31.1 0 10 20 30 40 50 60 70 80
8 | COMPANY PROFILE
CASH FLOW FROM OPERATING ACTIVITIES
2009 - $M 17.72010 - $M 5.72011 - $M 1.32012 - $M 10.62013 - $M (4.3) -5 0 5 10 15 20 25 30 35
EARNINGS PER SHARE - CENTS
2009 - $M (96.0)2010 - $M 7.02011 - $M 5.12012 - $M 5.42013 - $M 5.3 -100 -80 -60 -40 -20 0 20 40 60
EBIT - $M
2009 - $M 16.52010 - $M 23.62011 - $M 29.32012 - $M 23.42013 - $M 24.1 0 10 20 30 40 50 60 70 80
TOTAL REVENUE - $M
2009 - $M 288.32010 - $M 237.72011 - $M 223.22012 - $M 228.02013 - $M 208.5 0 50 100 150 200 250 300 350 400
NET PROFIT - $M
2009 - $M (123.6)2010 - $M 9.02011 - $M 6.62012 - $M 7.12013 - $M 7.1 -150 -120 -90 -60 -30 0 30 60 90
Note : EBITDA and EBIT are before significant items.
NET PROFIT - $M (before significant items)
2009 - $M 4.32010 - $M 5.92011 - $M 10.22012 - $M 7.1 2013 - $M 7.1 -6 0 6 12 18 24 30 36 42

9 | CORPORATE GOVERNANCE STATEMENT
The Directors are responsible for the corporate governance practices of the Company. This statement sets out the main corporate governance practices of the Company which the Directors, Management and Employees of the Company are required to follow. As at the date of this report, the Company’s corporate governance practices have, in the opinion of the Board, complied with the second edition of the Corporate Governance Principles and Recommendations published by the ASX Corporate Governance Council.
Each of the Corporate Governance Principles and Recommendations published by the ASX Corporate Governance Council (“ASX Principles”) are referred to consecutively below and the information provided under each Principle is done so in accordance with recommendations made by the ASX Corporate Governance Council.
Introduction
Corporate Governance is the system or process by which a company is directed or controlled. It is concerned with the manner in which the Directors ensure that an organisation’s systems and processes are properly controlled and functioning effectively and that management is complying with the policies and directives of the Board. Corporate Governance structures provide a controlled process for risks taken by a company to be subjected to accountability and control systems commensurate with the risks involved.
ASX Principle 1: Lay Solid Foundations for Management and Oversight
Board of Directors
Board information contained in this Corporate Governance Statement and the Board Charter can be found at www.australianvintage.com.au
Responsibility for the overall direction and management of the Company, the Company’s corporate governance and the internal workings, including establishing goals for management and monitoring the attainment of these goals, of the Company will rest with its board of Directors (the “Board”)
The primary responsibilities of the Board include:
• The establishment of the long-term goals of the Company and strategic plans to achieve those goals;
• Ensuring that the Company has implemented adequate systems of internal controls and codes of conduct together with appropriate monitoring of compliance activities;
• Provision of strategic guidance for the Company and oversight of management of the Company including ensuring that systems are in place to facilitate the effective management of the principal risks of the Company;
• Appointing and overseeing the Chief Executive Officer and ratifying the appointments of the Chief Financial Officer and the Company Secretary;
• The review and adoption of annual budgets for the financial performance of the Company and monitoring the results on a monthly basis; and
• Establishment of proper succession plans for management of the Company.
A further detailed list of Board responsibilities can be found in the Board Charter available at www.australianvintage.com.au under “Corporate Governance”.

10 | CORPORATE GOVERNANCE STATEMENT
ASX Principle 2: Structure the Board to Add Value
Composition and Criteria of Board Membership
The Company’s aim in determining Board membership is to create a balanced and informed Board to assist the Company in making decisions relating to all corporate matters. New Directors are nominated by existing Board Members through the delegated functions of the Remuneration and Nomination Committee and invited to become members on the basis of a majority vote of Directors. Consideration is given to Director’s experience and qualifications with a view to ensuring effectiveness and an appropriate balance of skills.
The Board is to comprise a majority of non-executive Directors where the Chairman of the Board is also a non-executive, independent Director and hence not the Chief Executive Officer (Managing Director). Non-executive Directors are appointed for an indefinite time on terms and conditions voted on from time to time. With the exception of the Chairman all non-executive Directors are appointed on the same terms and conditions. No Director, other than the Chief Executive Officer (Managing Director), shall hold office for any longer than three years without submitting themselves for re-election.
Members of the Board have been brought together to provide a blend of qualifications, skills and experience required for managing a Company operating in the wine industry. The skills, experience, expertise and period in office of each Director is detailed in this Annual Report.
Details of the members of the Remuneration and Nomination Committee, attendance at meetings by members and its function are provided below under ASX Principle 8: “Remunerate Responsibly and Fairly”.
Board Independence:
The Board currently consists of:
Ian D Ferrier Chairman Independent, Non-Executive
Neil A McGuigan Chief Executive Officer Non-Independent, Executive
Richard H Davis Independent, Non-Executive
Perry R Gunner Independent, Non-Executive
Brian J McGuigan Independent, Non-Executive
The terms of office held by each Director are detailed in the Director’s Report enclosed in this Annual Report.
The Board has adopted the definition of independence set out in the ASX Principles.
There are several tests that are applied in determining the independence of each Director.
An independent Director must:
• Not be a substantial shareholder of the Company (or be associated with a substantial shareholder of the Company);
• Not have been employed in an executive capacity within the Company (or a member of the Company’s group) in the last three years;
• Not have acted as a material professional adviser or consultant, or a material supplier, customer or contractor to the Company within the last three years.
• Not have a material contractual relationship with the Company (other than his or her relationship as Director of the Company). A material financial relationship between the Company and another entity that a Director is associated with or employed by is based by the Company on a 5% materiality level.
• Be free from any interest or business which could be perceived as having a material affect on the Company, or the best interests of the Company.
• Each non-executive Director was considered to be free of any relationship that could possibly interfere with the Director acting in the best interests of the Company.
11 | CORPORATE GOVERNANCE STATEMENT
Having regard to the criteria above, the Board generally considers a Director to be independent if he or she is not a member of management and is free of any interest and any other business relationship which could, or could reasonably be perceived to, materially interfere with the Director’s ability to act in the best interests of the Company.
Each Director’s independence is assessed by the Board on an individual basis, having regard to the materiality guidelines detailed above and focussing on an assessment of each Director’s capacity to bring independence of judgement to Board decisions. In this context, Directors are required to promptly disclose to the Board their interests in contracts, family ties and cross-directorships which may be relevant in considering their independence.
Board and Executive Performance Evaluation
The Board undertakes a peer assessment review of the performance of the Chief Executive Officer each year. Numerous performance indicators have been developed to assist in the assessment. The Board also conducts an annual review of Board performance in accordance with the Company’s Board Performance Measurement policy, which is available at www.australianvintage.com.au under “Corporate Governance”.
The Chief Executive Officer reviews performance of key executives continuously on an informal basis (by assessing achievements against budgets and other goals and key performance indicators) and at least twice in each year on a formal basis with a face-to-face performance review.
Relationship with Management
The Company’s management has authority to implement all other aspects of the management of the Company which are not reserved to the Board or Board committees (including the implementation of Board strategies). The management of the Company is conducted by the Chief Executive Officer. The Chief Executive Officer is accountable to the Board for all authority delegated to executive management. The roles of Chairman and Chief Executive Officer are separate.
The division of responsibilities between the Board and management is set out in the Board Charter available at www.australianvintage.com.au under “Corporate Governance”.
Independent Professional Advice
With the prior approval of the Chairman, each Director has the right to seek independent legal and other professional advice at the Company’s expense concerning any aspect of the Company’s operations or undertakings in order to fulfill their duties and responsibilities as a Director of the Company.
Committees
The Board has established three separate committees of Directors, namely the Audit Committee, the Remuneration and Nomination Committee and the Occupational Health and Safety and Environment Committee. Each committee has a dedicated Terms of Reference and Committee Charter.
The Audit Committee and its function are described below under ASX Principle 4: “Safeguard Integrity of Financial Reporting”.
The Occupational Health and Safety and Environment Committee and its function are described below under ASX Principle 7: “Recognise and Manage Risk”.
The Remuneration and Nomination Committee and its function are described below under ASX Principle 8: “Remunerate Fairly and Responsibly”.
The Audit Committee and Remuneration and Nomination Committee Charters can be viewed at www.australianvintage.com.au under “Corporate Governance”.

12 | CORPORATE GOVERNANCE STATEMENT
ASX Principle 3: Promote Ethical and Responsible Decision Making
Ethics and Code of Conduct
The Board and management ensure that the business processes of the Company are at all times conducted according to sound ethical and legal principles. The Board has established a formal Ethics and General Conduct Code. Compliance with the Code is mandatory for each Director and key executive of the Company.
The Code has been established to define the practices necessary to maintain confidence in the Company’s integrity and comply with the Company’s legal obligations and other obligations to legitimate stakeholders. The Code deals with numerous issues including confidentiality, conflicts of interest, compliance with the law, fair dealing, unethical behaviour, corporate fiduciary duties, care and diligence as well as the reporting requirements and action to be taken in the event of failure to comply with the Code.
The Company has also implemented a confidentiality policy relating to matters including amongst others the non-disclosure of business affairs, trade secrets and customer information. This policy is available at www.australianvintage.com.au under “Continuous Disclosure and Policies and Procedures”.
Workplace Diversity
At Australian Vintage we recognise that an inclusive culture which embraces diversity is integral to our continuing success. The Company is committed to diversity in the workplace and has implemented a group-wide Diversity Policy which is available at www.australianvintage.com.au under “Corporate Governance”.
In accordance with its Diversity Policy, the Board has adopted measurable objectives for achieving gender diversity. All levels of management are required under the Company’s Diversity Policy to monitor and report annually to the Remuneration and Nomination Committee of the Board on the progress and effectiveness of these objectives.
The measurable objectives set by the Board for achieving gender diversity by the end of the 2013/2014 financial year are as follows:
• female representation among Non-Executive Directors on the Board will be at least 20%;
• female representation among senior management (known as the Company’s Leadership Team) will be at least 20%; and
• engagement of female employees at other levels will be in line with national benchmarks.
The following tables show the proportional representation of men and women at various levels within the Company’s workforce as at 30 June 2012.
Workforce Gender Profile MALES FEMALES
Non-Executive Directors 100% 0%
Senior Executives 87.5% 12.5%
Other 68% 32%
Directors, Officers and Executives Trading in Company Shares
The Company has implemented a share trading policy as set out in the Corporate Governance Statement available at www.australianvintage.com.au under “Corporate Governance”.
The policy requires that Directors, Officers, Executives and their associates neither buy nor sell shares when they possess inside information nor engage in short term selling of Company shares. Directors and Officers are to notify the Board in advance of any intended material transactions involving the Company’s shares.

13 | CORPORATE GOVERNANCE STATEMENT
In addition, Directors, Officers and Executives (and their associates) are not permitted to trade in Company shares except within one month of and commencing one trading day after the:
• release of the annual financial reports;
• release of the half yearly financial reports; and
• Annual General Meeting.
All Company Corporate Governance charters, policies and procedures are publicly available. This information can be located on the Australian Vintage Limited website at www.australianvintage.com.au under “Corporate Governance”.
See also discussion below under ASX Principle 5: “Shareholders and Continuous Disclosure”.
ASX Principle 4: Safeguard Integrity in Financial Reporting
Audit Committee (incorporating Corporate Governance)
The Audit Committee consists of three independent non-executive Directors. The current members of the Audit Committee are:
• Richard H Davis (Chairman)
• Ian D Ferrier
• Brian J McGuigan
Details of the qualifications of Audit Committee members and their attendance at committee meetings throughout the financial year are detailed in the Directors’ Report enclosed in this Annual Report.
The nomination and review of existing audit arrangements is undertaken by the Audit Committee. The Audit Committee addresses issues surrounding the integrity of financial information presented to the Board and shareholders, including the review of external auditor engagements and internal financial reporting policies and controls.
The Audit Committee is responsible for reviewing the consistency of the Company’s internal accounting policies on a year-to-year basis as well as their compliance with relevant accounting standards and legislation.
The Audit Committee also advises the Board and makes recommendations in relation to policy and procedures and application of principles of Corporate Governance. The Committee addresses issues of proper Corporate Governance procedures and practices in order to ensure that the Company maintains the highest integrity and best practice with respect to such matters.
The Audit Committee generally invites the Chief Financial Officer and (on suitable occasions) external auditors to attend Audit Committee meetings.
The Audit Committee or its Chairperson meets formally with the Board at least twice a year to discuss the relationship with external auditors, the Company’s financial reporting and any other matters of relevance called upon by the Board or the Chairperson of the Audit Committee for discussion.
The Chairperson of the Audit Committee, who is not the Chair of the Board, attends the Annual General Meeting of the Company in order to respond to any questions which may be raised by shareholders in relation to accounting / financial management, information, control or the contents of any financial reports.
The Chief Financial Officer and Chief Executive Officer state in writing to the Board that the Company’s financial reports present a true and fair value in all material respects of the Company’s financial condition and operational results and are in accordance with relevant accounting standards. The integrity of the reports are founded on a sound system of risk management and internal compliance and control which operates efficiently and effectively in all material respects.
The Company’s external auditor attends the Annual General Meeting of the Company and is available to answer questions from shareholders about the conduct of the audit and the preparation and content of the Audit Report.
The Audit Committee’s Terms of Reference and Charter can be viewed at www.australianvintage.com.au under “Corporate Governance”.
.
14 | CORPORATE GOVERNANCE STATEMENT
ASX Principle 5: Make Timely and Balanced Disclosure; and
ASX Principle 6: Respect the Rights of Shareholders
Shareholders and Continuous Disclosure
The Board has primary responsibility to the shareholders as owners of the Company. Shareholders also play a key direct role in the Company’s Governance by electing the Directors of the Company at the Annual General Meeting.
Shareholders and the market generally receive information from the Company through distribution of the Annual Report, the Half Yearly Report, the Chairman’s and Chief Executive Officer’s addresses to the Annual General Meeting, the provision of information on the Company’s website and through the release of announcements from time to time in compliance with the Company’s responsibilities to make continuous disclosure under the Australian Securities Exchange Listing Rules and the Corporations Act 2001 (the “Act”). Shareholders and other stakeholders are also encouraged to contact the Company directly regarding any enquiries they may have.
The Company has implemented and complied with a Continuous Disclosure Policy and a Communications with Shareholders and other Stakeholders Strategy, both of which are available at www.australianvintage.com.au under “Corporate Governance”.
These policies and strategies establish procedures to ensure that the Directors and management are aware of and fulfil their obligations in relation to the timely disclosure of material price-sensitive information. When the Company makes an announcement the announcement is released to the ASX and the Company Secretary is responsible for communications with the ASX. All material information released to the ASX is published on the Company’s website at www.australianvintage.com.au under “Company Announcements”. This includes ASX announcements, annual reports, notices of meetings, media releases etc. The policies set out the type of information which requires disclosure as well as the internal policies governing the method and timing of disclosure.
In addition, the Company’s external auditor attends the Annual General Meeting of the Company and is available to answer questions from shareholders about the conduct of the audit and the preparation and content of the Audit Report.
ASX Principle 7: Recognise and Manage Risk
Risk Management
The Board identifies and discusses areas of significant business risk. The Board ensures, together with management, that processes are in place to manage those risks and reviews those arrangements at monthly Board meetings.
These systems require management to be responsible for identifying and managing the Company’s material business risks, which include financial and non-financial risks, such as environmental and investment risks.
The Board and management ensure that appropriate insurance programmes for the Company are also in place to provide insurance cover in areas of the business assessed as appropriate for cover having regard to all of the relevant circumstances.
Comprehensive practices are established such that:
• Capital expenditure and revenue commitments above a certain size require prior Board approval;
• Financial exposures are controlled, including the use of derivatives;
• Occupational health and safety standards and management systems are monitored and reviewed to achieve high standards of performance and compliance with regulations; and
• Business transactions are properly authorised and executed.
All reports to the Board on strategic and operational issues incorporate an assessment by management of the associated risks, which ensures that the Board is in a position to make fully-informed business judgements on these issues. In addition, the Board receives dedicated risk management updates which address the material business risks facing the Company and the systems and policies in place to manage those risks.
In addition to these periodic updates, the Board and management give ongoing consideration to the effectiveness of the Company’s risk management and internal compliance and controls systems, and whether there is scope for further improvement of these systems.

15 | CORPORATE GOVERNANCE STATEMENT
In accordance with section 295A of the Act, the Chief Executive Officer and the Chief Financial Officer have declared, in writing to the Board, that the financial reporting risk management and associated compliance and controls are founded on a sound system of risk management and internal control and that the system has been assessed and found to be operating efficiently and effectively in all material respects in relation to financial reporting risks.
Formal risk analysis and management of material risks to the Company’s operations include formal HACCP Australian Food Safety Accreditation Programmes on vineyards and at wineries and bottling plants and the implementation of an OH&S, environment and audit committee as described in this report. These committees separately deal with specific areas of ‘risk’ to the Company’s business.
Occupational Health and Safety and Environment Committee
The Occupational Health and Safety and Environment Committee (“OH&S Committee”) consists of two non-executive Directors. The current members of the OH&S Committee are:
• Perry R Gunner (Chairman)
• Brian J McGuigan
The occupational health and safety related duties of the OH&S Committee include:
• Establishment and supervision of broad policies on matters of occupational health and safety including ensuring documented management systems are established;
• Establish occupational health and safety responsibilities for employees and all levels of management;
• Evaluate the Company’s occupational health and safety performance on a regular basis; and
• Protection of workplace safety to the greatest extent including ensuring that all relevant legislation is complied with.
The environmental related duties of the OH&S Committee include:
• Establishment and supervision of broad policies on matters of environmental compliance and protection of the environment generally;
• Keep up-to-date with the environmental issues facing the Company and the industry generally; and
• Establishment of management responsibility for environmental matters and evaluation of the Company’s environmental performance and progress.
The OH&S Committee generally invites the Chief Executive Officer, Group Production Manager and National Vineyard Manager to its meetings.
Internal Audit
The consolidated entity has a separate internal audit function.
Internal control framework
The Board is responsible for the overall internal control framework, but recognises that no cost effective internal control system will preclude all errors and irregularities. The Board has instigated the following internal control framework:
• Financial reporting – Monthly actual results are reported against budgets approved by the directors and revised forecasts for the year are prepared regularly.
• Continuous disclosure – A comprehensive policy and process is in place to identify matters that may have a material effect on the price of the Company’s securities and notify them to the ASX and post them on the Company’s web site. The Board of Directors and the Chief Financial Officer / Company Secretary are responsible for all communications with the ASX.

16 | CORPORATE GOVERNANCE STATEMENT
• Quality and integrity of personnel – Formal appraisals are conducted at least annually for all employees.
• Operating units control – The Chief Executive Officer and Chief Financial Officer ensure compliance with financial controls and procedures including information systems controls detailed in procedures manuals.
• Investment appraisal – Guidelines for capital expenditure include annual budgets, detailed appraisal and review procedures, levels of authority and due diligence requirements where businesses are being acquired or divested.
ASX Principle 8: Remunerate Fairly and Responsibly
Remuneration and Nomination Committee
The Remuneration and Nomination Committee consists of three independent non-executive Directors. The current members of the Remuneration and Nomination Committee are:
• Perry R Gunner (Chairman)
• Ian D Ferrier
• Richard H Davis
The attendance of committee members at each committee meeting during the financial year are detailed in the Directors’ Report enclosed in this Annual Report.
The procedure for establishing and reviewing remuneration for senior executives and non-executive members of the Board is undertaken by the Remuneration and Nomination Committee. The shareholders in general meeting approve the aggregate remuneration for non-executive Directors.
Particulars concerning Directors’ and Executives’ remuneration and the Company’s performance rights and option plan are set out in notes to the financial statements and the Remuneration Report.
The criteria for selection of Board Members are determined by, and the recommendation of Board Members is carried out by, the Remuneration and Nomination Committee. Consideration is given to the Director’s experience and qualifications with a view to ensuring effectiveness and an appropriate balance of skills. A regular review of the structure, size and composition of the Board is also to be undertaken by the Remuneration and Nomination Committee as well as recommendations as to Board succession plans.
The Company has developed a Remuneration Policy which describes the Company’s remuneration policies and the rationale behind them. Non executive directors will be paid in cash in line with a resolution passed at the company’s Annual General Meeting dated 25th November 2009. Executives are paid primarily by cash salary (but also, in some cases as to part, with performance rights and options). The Company’s Remuneration Policy is reviewed annually by the Remuneration and Nomination Committee.
In determining Executive remuneration, regard is had to the Executive’s level of responsibility, skills, experience, reputation, efforts and results and the ability to retain executives having regard to the competitive nature of hiring key staff.
For further details on the roles and responsibilities of the Remuneration and Nomination Committee see the Committee’s Charter and terms of reference available at www.australianvintage.com.au under “Corporate Governance”.
For more information on the Company’s remuneration, see the Remuneration Report within this Annual Report.
The Company issued performance rights and/or options pursuant to the AVG Performance Rights and Option Plan (“Plan”) which received approval of shareholders of the company at the Annual General Meeting on 28 November 2012.
For further information regarding Executive remuneration through options see the Remuneration Report in this Annual Report at www.australianvintage.com.au.

17 | SHAREHOLDERS’ INFORMATION
The shareholders’ information set out below was applicable at 9th September, 2013.
Shareholders
Distribution of shareholders
Analysis of shareholders of fully paid ordinary shares by size of holding:-
NUMBER OF SHARES NUMBER OF SHAREHOLDERS
1 – 1,000 1,931
1,001 – 5,000 2,308
5,001 – 10,000 552
10,001 – 100,000 720
100,001 + 94
5,605
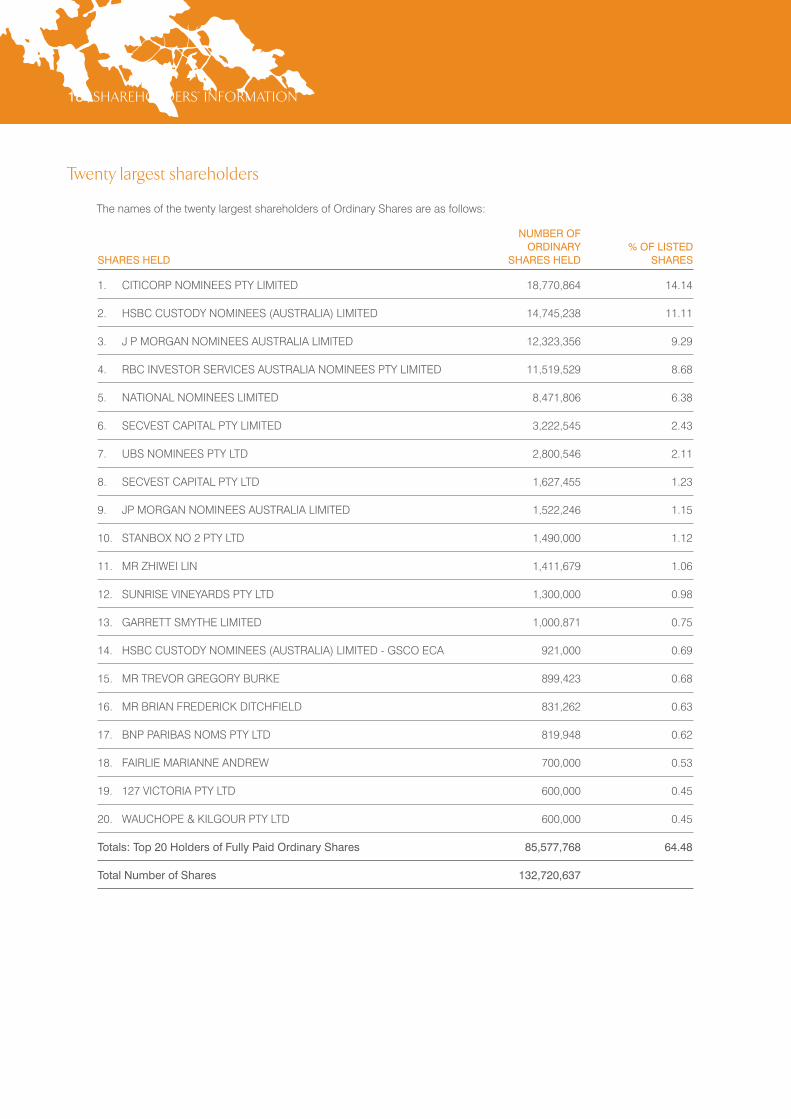
The percentage of the total holding of the twenty largest holders of Ordinary Shares was 64.48%.
Substantial shareholders
The names of substantial shareholders who have notified the Company in accordance with section 671B of the Corporations Law are:-
NAME ORDINARY SHARES (AS PER LAST SUBSTANTIAL HOLDER NOTICE)
Allan Gray Investment Management (formerly Orbis Investment Management (Australia) Pty Ltd) 26,093,481
Maple Brown Abbott Limited 11,313,068
Schroder Investment Management Australia Limited 9,631,634
Brandes Investment Partners, L.P. 8,136,302
State Teachers Retirement System of Ohio 6,045,000
18 | SHAREHOLDERS’ INFORMATION
Twenty largest shareholders
The names of the twenty largest shareholders of Ordinary Shares are as follows:
NUMBER OF ORDINARY % OF LISTED SHARES HELD SHARES HELD SHARES
1. CITICORP NOMINEES PTY LIMITED 18,770,864 14.14
2. HSBC CUSTODY NOMINEES (AUSTRALIA) LIMITED 14,745,238 11.11
3. J P MORGAN NOMINEES AUSTRALIA LIMITED 12,323,356 9.29
4. RBC INVESTOR SERVICES AUSTRALIA NOMINEES PTY LIMITED 11,519,529 8.68
5. NATIONAL NOMINEES LIMITED 8,471,806 6.38
6. SECVEST CAPITAL PTY LIMITED 3,222,545 2.43
7. UBS NOMINEES PTY LTD 2,800,546 2.11
8. SECVEST CAPITAL PTY LTD 1,627,455 1.23
9. JP MORGAN NOMINEES AUSTRALIA LIMITED 1,522,246 1.15
10. STANBOX NO 2 PTY LTD 1,490,000 1.12
11. MR ZHIWEI LIN 1,411,679 1.06
12. SUNRISE VINEYARDS PTY LTD 1,300,000 0.98
13. GARRETT SMYTHE LIMITED 1,000,871 0.75
14. HSBC CUSTODY NOMINEES (AUSTRALIA) LIMITED - GSCO ECA 921,000 0.69
15. MR TREVOR GREGORY BURKE 899,423 0.68
16. MR BRIAN FREDERICK DITCHFIELD 831,262 0.63
17. BNP PARIBAS NOMS PTY LTD 819,948 0.62
18. FAIRLIE MARIANNE ANDREW 700,000 0.53
19. 127 VICTORIA PTY LTD 600,000 0.45
20. WAUCHOPE & KILGOUR PTY LTD 600,000 0.45
Totals: Top 20 Holders of Fully Paid Ordinary Shares 85,577,768 64.48
Total Number of Shares 132,720,637

19 | DIRECTORS’ REPORT
The Directors of Australian Vintage Ltd submit herewith the annual financial report for the financial year ended 30 June 2013. In order to comply with the provisions of the Corporations Act 2001, the Directors report as follows:
Directors
The names and particulars of the Directors of the Company during or since the end of the financial year are:
Ian D Ferrier AM, CA, Age 73 (Chairman, Non-Executive) Director since 20 November 1991
Fellow of The Institute of Chartered Accountants in Australia and Chairman of BRI Ferrier. In this capacity, he has gained extensive experience in the management and administration of both private and public companies at all levels. He is presently Chairman of InvoCare Limited and Goodman Management Limited and a Director of Reckon Limited and Energy One Limited.
Neil A McGuigan, Age 55(Chief Executive Officer) Director since 21 July 2010
Neil was previously the General Manager of Production and Wine Supply at Australian Vintage Ltd. He was appointed as a director and as the CEO on 21 July 2010. Neil has over 27 years’ experience in the wine industry. He previously worked at the then privately owned Briar Ridge before leaving in 2000 to run Rothbury Estate and its satellites in the Upper Hunter, Cowra and Mudgee for the Foster’s Group.
Brian J McGuigan AM, Age 71 (Non-Executive) Executive Director from 20 November 1991 to 31 December 2007 Non-Executive Director from 1 January 2008
Over 45 years’ experience in the wine industry. Formerly Managing Director of Wyndham Estate Wines Ltd then of Australian Vintage Ltd. He is currently on the Membership Committee of the Winemakers Federation of Australia, a Director of Hunter Wine Country Private Irrigation District as well as the Chairman and Director of a number of private companies.
Perry R Gunner, B. Ag. Sc, Grad. Dip, Bus. Admin, Age 66(Non-Executive) Director since 28 June 2002
Over 30 years’ experience in the Wine Industry. Former Chairman and Chief Executive Officer of Orlando Wyndham Group Pty Ltd. Chairman of Freedom Nutritional Products Ltd and Deputy Chairman of A2 Corporation Ltd (N.Z.). Chairman of the Occupational Health and Safety Committee and Remuneration Committee.
Richard H Davis, B. Ec, Age 57(Non-Executive, Chairman of the Audit Committee) Director since 5 May 2009
Director (and previously CEO) of InvoCare Limited where he previously spent almost 20 years growing and managing the business. Former accounting partner for a national accounting firm. Chairman of the Audit Committee.

20 | DIRECTORS’ REPORT
Directorships of other listed companies
Directorships of other listed companies held by Directors in the 3 years immediately before the end of the financial year are as follows:
NAME COMPANY PERIOD OF DIRECTORSHIP
Ian D Ferrier InvoCare Limited Since 2001
Goodman Management Limited Since 2003
Reckon Limited Since 2004
Energy One Limited Since 2007
Perry R Gunner ABB Grain Limited / Viterra Inc. Since 2004 to 2012
Freedom Nutritional Products Limited Since 2003
A2 Corporation Ltd (N.Z.) Since 2010
Richard H Davis InvoCare Limited Since 2012
Company Secretary
Michael H Noack (appointed 23 November 2005)
B Accountancy (University of South Australia), Fellow of ASCPA, Graduate Diploma in Systems Analysis (University of South Australia) and Fellow of the Chartered Secretaries Australia. Michael has been with Australian Vintage Ltd since the merger in 2002 and was previously Chief Financial Officer and Company Secretary of Simeon Wines Limited.
Michael has been the Chief Financial Officer since 2002.
Principal activities
The consolidated entity’s principal activities in the course of the financial year were wine making, wine marketing, vineyard management and development.
Changes in state of affairs
During the financial year there was no significant change in the state of affairs of the consolidated entity other than that referred to in the financial statements or notes thereto.
Environmental regulations
The consolidated entity holds licences issued by the Environmental Protection Authorities in various states which specify limits associated with the discharge of winery waste. There have been no known breaches of the licence conditions.
Dividends
In respect of the financial year ended 30 June 2013, a final fully franked dividend of 2.6 cents per share out of current year profits was declared on 23rd August 2013 and will be paid on 18th November 2013.
In respect of the financial year ended 30 June 2012, a final fully franked dividend of 2.6 cents per share out of current year profits was declared on 22nd August 2012 and paid on 19th November 2012.

21 | DIRECTORS’ REPORT
Review of operations and future developments
The group reported a net profit of $7.1 million.
Despite the difficult trading conditions, the comparatively small 2012 vintage and uncertain economic conditions we maintained our profit and return to shareholders.
Underpinning this year’s result was the continued improvement in the company’s branded bottled business on the back of international awards and increasing brand strength in Australia and recognition globally. Sales of the McGuigan brand grew by 10%, Tempus Two by 26% and Nepenthe by 18%.
The company has achieved a $4.5 million reduction in vineyard leasing, a $1.25 million contribution towards the upgrade and maintenance of our leased vineyards, access to an additional $2.2 million of water entitlements and maintained a disciplined focus on operating capital.
Vintage was up 28% to 153,000 tonnes, compared to a national tonnage increase of around 10%. The pleasing aspect is that our wine stock continues to be in balance with our forecast needs. The company expects that the benefits from the increased quantity and quality and from the reduced leasing costs will be reflected in the 2014 financial year.
All other things being equal, these factors, together with the recent weakening of the Australian dollar and our increased brand success, should improve margins and profitability in 2014 on branded product. However, non branded bulk wine margins could be challenging.
Sales and production
Overall, sales for the 2013 financial year reached $208.5 million, down 8.5% on the prior corresponding period predominantly as a result of reduced sales in UK / Europe and reduced bulk wine sales in Australasia / North America.
Australasia / North American packaged sales were strong and in line with the previous year at $79.9 million notwithstanding overall volume declined 12% due to reduced low margin cask sales.
Australasia / North American bulk wine sales were $29.5 million, down 27%, due to reduced low margin bulk wine sales.
UK / Europe sales reached $88.8 million, down 8.7%, of which reduced low margin bulk wine represented 6% and the strengthening of the Australian dollar accounted for 1%. Approximately 68% of our total export sales are in GBP, 9% in EURO and 2% in CAD. The average weighted GBP in FY 2013 was 65.7 compared to 65.0 in the previous year. The average weighted EURO in FY 2013 was 81.1 compared to 77.2 in the previous year.
Vineyard revenues for FY 2013 reached $3.4 million, down 10.3%, due to the reduction of vineyard contract services during the year.
Cellar Door sales achieved sales of $6.8 million, impacted by the reduction in the NSW cellar door rebates ($0.4 million).
McGuigan has been named the 14th most admired wine brand in the world. It is the number one selling brand in Ireland, and in addition to that McGuigan Black Label Red was named the number one selling red wine in Australia by volume. The McGuigan brand grew sales by 10% (19% in Australia and 6% in the UK) during the year.
In the past three years AVL has won six awards in two of the world’s premier wine competitions in London, including Winemaker of the Year at the International Wine and Spirit Competition in London, and International White Winemaker at the International Wine Challenge. Making the wine the hero is still at the fore front of the mind of everyone engaged in our business.

22 | DIRECTORS’ REPORT
Review of operations and future developments (continued)
EBIT and Net Profit
EBIT increased $0.7 million or 3% notwithstanding the adverse impact of higher per unit wine costs amounting to $2.2 million attributable to the low 2012 vintage and the strong Australian dollar for most of the financial year.
Australasia / North America EBIT declined $1.1 million or 17.9% with the EBIT decline due in part to the fall in cask wine sales ($0.3 million) and higher overall wine production costs ($0.7 million) attributable to the smaller 2012 vintage.
Australasia / North American bulk wine and processing’s EBIT improved $0.4 million as a consequence of the reduced 2013 per unit vintage costs attributable to the larger vintage amounting to $0.9 million, offset by some reduced processing volumes.
UK / Europe’s EBIT fell $3.7 million or 52.8% as a consequence of higher 2012 vintage costs ($1.5 million), reduced low margin bulk ($0.5 million), the impact of the higher Australian dollar for most of the year ($0.7 million) and reduced profit in Ireland ($1.0 million) from lower sales following the large duty increase in March 2013 and higher marketing costs (Dublin City Vineyard).
The underlining EBIT achieved by Cellar door outlets was pleasing. However, with the removal of the NSW rebates ($0.4 million), Cellar door results were $0.2 million below last year.
Vineyard EBIT improved $2 million or 137.7% as a result of the higher grape yield on company owned vineyards amounting to $1.1 million and some loss making grape sales in the prior year totaling $0.9 million.
Unallocated costs declined $4.2 million due to the gain on provision for onerous contracts ($4.2 million) and reduced net interest costs ($0.9 million), offset by the water licence impairment ($0.9 million).
The company’s effective tax rate reverted to 34% as a consequence of capital losses in the current year not recognised for tax purposes.
Outlook
The company has continued to reduce its cost base while running its core assets hard, and improving the reputation and value of its wines in a tough market and under tough economic conditions.
The Board has resolved to pay a fully franked dividend of 2.6 cents per share, payable on 18 November 2013. The Record Date to establish shareholder dividend entitlements was 6 September 2013. The company’s Dividend Reinvestment Plan (DRP) has been suspended.
The company has challenges to address with cash flow but we believe that our cash flow will improve in 2014 as a result of the initiatives put in place, the improved exchange rates and the fact that we do not need to purchase any significant bulk wine in the immediate future. The company also has carried forward tax losses which will minimise future tax payments and assist cash flow. The existing banking facility expires in September 2014 and we are negotiating a further one year extension. The company is also considering other capital management alternatives.
The improved trading conditions we are beginning to see are encouraging for Australian Vintage. The company has turned the corner away from the corrective action that needed to be taken in the past and we see positives as the industry cycle swings and supply and demand move further into balance. The weakening Australian dollar and the higher quality and quantity of our 2013 vintage, is reason to be optimistic about what can be achieved in the 2014 financial year and beyond.
While the UK market remains a challenge, the weakening of the Australian dollar should improve our margins as should the increased awareness of the company’s major brands in this market, driven by our brand-focused strategy. The company also continues to build opportunistically on Australia’s reputation as a quality new wine producer in Asia.
Considering the benefits of the 2013 vintage, the recent weakening of the Australian dollar and the results of cost reduction efforts, we expect that our 2014 full year net profit (after tax) will improve by somewhat in excess of a third on the 2013 net profit of $7.1 million.
This forecast is based on normal vintage conditions, expected sales (based on historical sales patterns) and Bloomberg average forecasts for the GBP and the Euro. Any change to these factors could materially impact our 2014 result. We will update the market at our AGM in November.

23 | DIRECTORS’ REPORT
Directors’ meetings
The following table sets out the number of Directors’ meetings (including meetings of Committees of Directors) held during the financial year and the number of meetings attended by each Director (while they were a Director or Committee Member).
During the financial year the company held 13 Board Meetings, 3 Audit Committee Meetings, 1 Occupational Health and Safety Meeting and 2 Remuneration Committee meetings.
BOARD AUDIT OH&S REMUNERATION MEETINGS COMMITTEE COMMITTEE COMMITTEE DIRECTORS’ ATTENDED MEETINGS ATTENDED MEETINGS ATTENDED MEETINGS ATTENDED
Ian D Ferrier 13 3 - 2
Neil A McGuigan 13 3 1 2
Brian J McGuigan 13 3 1 1
Perry R Gunner 12 2 1 2
Richard H Davis 13 3 - 2
Total Meetings Held 13 3 1 2
Directors’ shareholdings
The following table sets out each Director’s relevant interest in shares and options in shares of the Company as at the date of this report.
FULLY PAID ORDINARY SHARES EXECUTIVE SHARE OPTIONS
Ian D Ferrier 650,159 -
Neil A McGuigan 150,000 652,260
Brian J McGuigan 308,670 -
Perry R Gunner 265,670 -
Richard H Davis - -
Details of unissued shares or interests under option / performance right as at the date of this report are:
NUMBER OF SHARES UNDER CLASS OF EXERCISE PRICE OF EXPIRY DATE OF DIRECTORS’ OPTION / RIGHT SHARES OPTION / RIGHT OPTION / RIGHT
Australian Vintage Ltd 1,383,400 Ordinary * 12 September 2016
Australian Vintage Ltd 1,156,514 Ordinary * 22 August 2017
TOTAL 2,539,914
* Performance Rights entitle the owner to an issue of shares at the vesting date subject to certain performance criteria.

24 | DIRECTORS’ REPORT
Remuneration Report
Directors and Key Management Personnel Details
The Directors of Australian Vintage Ltd during the year were:
• Ian D Ferrier (Chairman, Non-Executive)
• Neil A McGuigan (Chief Executive Officer)
• Brian J McGuigan (Non-Executive)
• Perry R Gunner (Non-Executive)
• Richard H Davis (Non-Executive)
The Key Management Personnel of Australian Vintage Ltd during the year were:
• Michael H Noack (Company Secretary & Chief Financial Officer)
• Flora Sarris (General Counsel)
• Cameron Ferguson (General Manager – Sales and Marketing, Australasia / North America)
• Julian Dyer (General Manager – UK / Europe – appointed 3rd September 2012)
• Paul Schaafsma (General Manager, UK & Europe) – resigned 21st August 2012)
The named persons held their current position for the whole of the financial year, except as noted.
Remuneration Committee and Key Management Personnel Compensation
The Remuneration Committee reviews the compensation packages of all key management personnel on an annual basis and makes recommendations to the board. Compensation packages are reviewed and determined with due regard to current market rates and are benchmarked against comparable industry salaries. Remuneration packages are set at levels that are intended to attract and retain executives capable of managing the consolidated entity’s diverse operations.
The Key Management Personnel compensation packages have three components:
1. Base Compensation
This component is not performance linked and generally consists of salary, motor vehicle, wine and post-employment superannuation entitlement (where applicable). The base amount is reviewed annually by the Remuneration Committee. Any adjustments made during the year will either be as a result of market rate changes in order for the Company to remain competitive or to reflect any changes in level of responsibility in the event the role has broadened.
2. Short Term Incentives
Short term incentive payments take into account the extent to which specific operating targets set at the start of the financial year have been achieved. The operational targets consist of a number of key performance indicators (KPI’s) covering both financial and non-financial measures of performance, the primary measure being the performance against profit targets. Short term incentive payments are normally made by way of a cash bonus.
Objectives and performance indicators are determined annually by the Chief Executive Officer (CEO) following consultation with each employee.
The maximum amount of bonus payable in respect of the financial year is determined by the CEO and the Remuneration Committee. For the purpose of determining any bonus entitlement, individual performance is assessed against the set objectives and performance indicators by the CEO. The objectives and performance indicators relate to specific duties and Company performance.

25 | DIRECTORS’ REPORT
Remuneration Report (continued)
Non-executive Directors receive remuneration in cash.
The Board reviews the level of fees from time to time, and sets individual non-executive Directors fees based on the levels of fees for comparable listed companies in the appropriate parts of the world.
All key management personnel, senior management and the Chief Executive Officer are entitled to a bonus on the achievement of pre-determined key performance criteria.
Bonuses and performance rights are the only parts of remuneration which are performance related.
The table below shows the maximum entitled bonus for the current financial year and following financial year:
2013 2013 2013 2014 2014 MINIMUM MAXIMUM % OF MAXIMUM MINIMUM MAXIMUM BONUS $ BONUS $ GRANTED BONUS $ BONUS $
Neil McGuigan 0 150,000 72.25% 0 300,000
Michael Noack 0 116,435 63.75% 0 119,636
Cameron Ferguson 0 101,530 80.75% 0 104,321
Julian Dyer 0 52,702 65.00% 0 54,283
Flora Sarris 0 94,923 80.75% 0 97,534
3. Long Term Incentives
The company currently has two long term incentive plans in place.
Executive and Employee Share Option Plan:
Long term incentive is provided as options over ordinary shares in the company or as rights to the issue of shares. |The ability to exercise options is conditional upon the achievement of certain performance hurdles which are designed to drive the financial performance of the consolidated entity and deliver shareholder value in the long term. There will be no further issues to employees under this plan as it is now replaced by the Performance Rights and Option Plan.
Performance Rights and Option Plan:
Established in August 2012, this long term incentive is provided as a right to an issue of shares. This right is subject to the achievement of set growth rates in earnings per share over a 4 year period up until the vesting date. The plan is available to senior management as approved by the Board.

26 | DIRECTORS’ REPORT
Remuneration Report (continued)
Key Management Personnel and employee share option and performance rights plans
For the purpose of the disclosure ‘Key Management Personnel’ is defined as an individual who is responsible for strategic planning, management and performance of a division or function and reports directly to the Chief Executive Officer.
During and since the end of the financial year under the Performance Rights and Option Plan, 745,310 (2012 : 909,091) share performance rights were granted to the five highest remunerated members of key management personnel as part of their remuneration. No shares were issued during or since the end of the financial year as a result of the exercise of options under either of the above Plans.
In accordance with the provisions of the Company’s share option and performance rights plan, as at the date of this report, key management personnel are entitled to exercise the following performance rights:
KEY MANAGEMENT NUMBER OF PERSONNEL RIGHTS GRANTED EXERCISE PRICE ISSUE DATE EXPIRY DATE
Neil McGuigan 395,257 N/A 12 August 2012 12 September 2016 257,003 N/A 22 July 2013 22 August 2017
Michael Noack 158,103 N/A 12 August 2012 12 September 2016 128,502 N/A 22 July 2013 22 August 2017
Cameron Ferguson 197,628 N/A 12 August 2012 12 September 2016 128,502 N/A 22 July 2013 22 August 2017
Julian Dyer - - - - 128,502 N/A 22 July 2013 22 August 2017
Flora Saris 158,103 N/A 12 August 2012 12 September 2016 102,801 N/A 22 July 2013 22 August 2017
TOTAL 1,654,401
Details of share options granted to Key Management Personnel are included in notes 7 and 8 of the financial statements.
Value of performance rights issued to directors and senior management FAIR VALUE VALUATION RIGHTS RIGHTS OPTIONS OF RIGHTS OF RIGHTS TOTAL GRANTED – EXERCISED – LAPSED – GRANTED, INCLUDED IN REMUNERATIONKEY MANAGEMENT VALUE @ VALUE @ VALUE @ EXERCISED REMUNERATION THAT CONSISTS PERSONNEL GRANT DATE EXERCISE DATE TIME OF LAPSE & LAPSED FOR THE YEAR OF OPTIONS $ $ $ $ $ $
Neil McGuigan 105,020 - - - 23,002 2.9%
Mike Noack 42,008 - - - 9,201 1.7%
Cameron Ferguson 52,510 - - - 11,501 2.6%
Julian Dyer - - - - - -
Flora Saris 42,008 - - - 9,201 2.4%
TOTAL 241,546 - - - 52,905 -

27 | DIRECTORS’ REPORT
Remuneration Report (continued)
Company Performance
The tables below set out summary information about the Group’s earnings and movements in shareholder wealth for the five years to 30 June 2013: 30 JUNE 30 JUNE 30 JUNE 30 JUNE 30 JUNE 2009 (a) 2010 2011 2012 2013 $ M $ M $ M $ M $ M
Total Revenue (excluding sale of assets) 288.3 237.7 223.2 228.0 208.5
EBIT (155.7) 23.6 29.4 23.4 24.1
Net Profit / (Loss) (123.6) 9.0 6.6 7.1 7.1
(a) The 30 June 2009 year includes $172.9M of adverse significant items relating to EBIT and $127.9M relating to Net Profit / (Loss).
30 JUNE 30 JUNE 30 JUNE 30 JUNE 30 JUNE 2009 20 2011 2012 2013
Earnings per share - cents (96.0) 7.0 5.1 5.4 5.3
Dividends declared - cents * - - 2.5 2.6 2.6
Share price at start of year - $ per share 1.15 0.15 0.20 0.27 0.34
Share price at end of year - $ per share 0.15 0.20 0.27 0.34 0.475
* The 2013 dividend is fully franked, will be paid out of current year profits and was declared on 23rd August 2013 with payment to be made on 18th November 2013.
There were no shares repurchased in the current year.
Key management personnel options granted, exercised or lapsed
There were no options granted or exercised during the year. There were 234,569 options which lapsed during the year. There was no value attributed to these lapsed options.

28 | DIRECTORS’ REPORT
Remuneration Report (continued)
Directors’ and Executives’ Remuneration
The following table discloses the remuneration of the Directors and Executives of the Company:
2013 SHORT-TERM BENEFITS POST-EMPLOYMENT SHARE-BASED PAYMENTS TOTAL
Salary Non - Super - Cash Equity Equity & Bonus Other Monetary annuation Other Settled Settled Settled Fees (c) Options Shares $ $ $ $ $ $ $ $ $ $
Non-Executive directors
Ian D Ferrier 100,000 - - 2,000 9,000 - - - - 111,000
Brian J McGuigan 60,000 - - 2,000 5,400 - - - - 67,400
Perry R Gunner 60,000 - - 2,000 5,400 - - - - 67,400
Richard Davis 60,000 - - 2,000 5,400 - - - - 67,400
Executive directors
Neil McGuigan 599,339 108,375 - 28,042 25,503 - - 23,002 - 784,261
Executives
Paul Schaafsma (a) 57,527 - - - 26,813 34,172 - - - 118,512
Michael Noack 347,346 74,227 - 85,857 25,000 - - 9,201 - 541,631
Cameron Ferguson 290,084 81,985 - 26,200 26,108 - - 11,501 - 435,878
Flora Sarris 270,551 76,651 - 1,200 24,350 - - 9,201 - 381,953
Julian Dyer (b) 190,901 34,269 - - 39,927 - - - - 265,097
TOTAL 2,035,748 375,507 - 149,299 192,901 34,172 - 52,905 - 2,840,532
(a) Resigned 21st August 2012.
(b) Appointed 3rd September 2012.
(c) Non-monetary items include provision of motor vehicle, wine, rent, travel, health benefits and applicable fringe benefits tax.
2012 SHORT-TERM BENEFITS POST-EMPLOYMENT SHARE-BASED PAYMENTS TOTAL
Salary Non - Super - Cash Equity Equity & Bonus Other Monetary annuation Other Settled Settled Settled Fees (b) Options Shares $ $ $ $ $ $ $ $ $ $
Non-Executive directors
Ian D Ferrier 100,000 - - 2,000 9,000 - - - - 111,000
Brian J McGuigan 60,000 - - 2,000 5,400 - - - - 67,400
Perry R Gunner 60,000 - - 2,000 5,400 - - - - 67,400
Richard Davis 60,000 - - 2,000 5,400 - - - - 67,400
Executive directors
Neil McGuigan 547,216 105,000 - 27,623 49,249 - - - 729,088
Executives
Paul Schaafsma (a) 256,932 60,430 - 154,732 120,929 68,310 - - - 661,333
Michael Noack 330,856 79,130 - 71,758 33,129 - - - - 514,873
Cameron Ferguson 289,266 64,980 - 26,200 26,034 - - - - 406,480
Flora Sarris 262,568 64,511 - 1,200 23,631 - - - - 351,910
TOTAL 1,966,838 374,051 - 289,513 278,172 68,310 - - - 2,976,884
(a) Resigned 21st August 2012. Other post employment benefit is a cash payment of accrued leave entitlements.
(b) Non-monetary items include provision of motor vehicle, wine, rent, travel, health benefits and applicable fringe benefits tax.
No director or senior management person appointed during the period received a payment as part of his or her consideration for agreeing to the position.

29 | DIRECTORS’ REPORT
Remuneration Report (continued)
Senior management details
The senior managers of the Company and Group are:
• Michael Noack • Flora Saris
• Cameron Ferguson • Julian Dyer
Service Agreements of Key Management Personnel
Compensation and other terms of employment for directors and executives are formalised in service agreements or letters of appointment. Termination benefits disclosed below do not apply in cases of misconduct or other specified circumstances.
Neil McGuigan
(i) Term of agreement – no specified term.
(ii) Compensation includes:
a. Base salary, superannuation, motor vehicle allowance and wine allowance.
b. Short term incentive – entitlement to a bonus subject to certain key performance criteria.
c. Long term incentive – entitlement to equity under the Performance Rights and Options Plan subject to meeting growth rates in earnings per share over a 4 year period.
(iii) If Mr McGuigan’s employment is terminated by the Company, the Company must pay the equivalent of one year’s total remuneration (excluding short term incentive).
Michael Noack
(i) Term of agreement – no specified term.
(ii) Compensation includes:
a. Base salary, superannuation, life / trauma insurance, motor vehicle allowance and wine allowance.
b. Short term incentive – entitlement to a bonus subject to certain key performance criteria.
c. Long term incentive – entitlement to equity under the Performance Rights and Options Plan subject to meeting growth rates in earnings per share over a 4 year period.
(iii) If Mr Noack’s employment is terminated by the company, the company must pay Mr Noack the equivalent of one year’s total remuneration.
Cameron Ferguson
(i) Term of agreement – no specified term.
(ii) Compensation includes:
a. Base salary, superannuation, motor vehicle allowance and wine allowance.
b. Short term incentive – entitlement to a bonus subject to certain key performance criteria.
c. Long term incentive – entitlement to equity under the Performance Rights and Options Plan subject to meeting growth rates in earnings per share over a 4 year period.
(iii) If Mr Ferguson’s employment is terminated by the company, the company must pay Mr Ferguson the equivalent of one year’s base remuneration (including motor vehicle allowance).

30 | DIRECTORS’ REPORT
Remuneration Report (continued)
Flora Sarris
(i) Term of agreement – no specified term.
(ii) Compensation includes:
a. Base salary, superannuation and wine allowance.
b. Short term incentive – entitlement to a bonus subject to certain key performance criteria.
c. Long term incentive – entitlement to equity under the Performance Rights and Options Plan subject to meeting growth rates in earnings per share over a 4 year period.
(iii) If Ms Sarris’s employment is terminated by the company, the company must pay Ms Sarris the equivalent of one year’s total remuneration.
Julian Dyer
(i) Term of agreement – no specified term.
(ii) Compensation includes:
a. Base salary and United Kingdom pension payment.
b. Short term incentive – entitlement to a bonus subject to certain key performance criteria.
c. Long term incentive – entitlement to equity under the Performance Rights and Options Plan subject to meeting growth rates in earnings per share over a 4 year period.
.

31 | DIRECTORS’ REPORT
Non-audit services
The Directors are satisfied that the provision of non-audit services, during the year, by the auditor (or by another person or firm on the auditor’s behalf) is compatible with the general standard of independence for auditors imposed by the Corporations Act 2001. The Audit Committee, in conjunction with the Chief Financial Officer, assesses the provision of non-audit services by the auditors to ensure that the auditor independence requirements of the Corporation Act 2001 in relation to the audit are met.
Details of amounts paid or payable to the auditor for non-audit services provided during the year by the auditor are outlined in note 9 to the financial statements.
The directors are of the opinion that the services as disclosed in note 9 to the financial statements do not compromise the external auditor’s independence, based on advice received from the Audit Committee, for the following reasons:
• All non-audit services have been reviewed and approved to ensure that they do not impact the integrity and objectivity of the auditor, and
• one of the services undermine the general principles relating to auditor independence as set out in Code of Conduct APES 110 Code of Ethics for Professional Accountants issued by the Accounting Professional & Ethical Standards Board, including reviewing or auditing the auditor’s own work, acting in a management or decision-making capacity for the company, acting as advocate for the company or jointly sharing economic risks and rewards.
Auditor’s independence declaration
The Auditor’s independence declaration is included on page 32.
Indemnification of officers and auditors
During the financial year, the Company paid a premium in respect of a contract insuring the Directors of the Company (as named previously), the Company Secretaries and all Executive Officers of the Company and of any related Body Corporate against a liability incurred as a Director, Secretary or Executive officer to the extent permitted by the Corporations Act 2001. The contract of insurance prohibits disclosure of the nature of the liability and the amount of the premium. The Company has not otherwise, during or since the financial year, indemnified or agreed to indemnify an officer or auditor of the Company or of any related body corporate against a liability incurred as such an officer or auditor.
Rounding off of amounts
The Company is a company of the kind referred to in ASIC Class Order 98/100, dated 10 July 1998, and in accordance with that Class Order amounts in the Directors’ Report and the Financial Report have been rounded off to the nearest thousand dollars, unless otherwise indicated.
Subsequent events
There have been no matters or circumstances, other than that referred to in the financial statements or notes thereto, that have arisen since the end of the financial year, that have significantly affected, or may significantly affect, the operations of the Group, the results of those operations, or the state of affairs of the Group in future financial years.
Signed in accordance with a resolution of the Directors made pursuant to section 298(2) of the Corporations Act 2001.
On behalf of the Directors
Ian D Ferrier AMChairman 2nd September 2013

32 | DECLARATION OF INDEPENDENCE
Deloitte Touche TohmatsuA.B.N. 74 490 121 060
11 Waymouth Street Adelaide SA 5000 GPO Box 1969 Adelaide SA 5001 Australia
DX 664Tel: +61 (0) 8 8407 7000Fax: +61 (0) 8 8407 7001www.deloitte.com.au
The Board of DirectorsAustralian Vintage Ltd275 Sir Donald Bradman DriveCOWANDILLA SA 5033
2nd September 2013
Dear Board Members
Australian Vintage Ltd
In accordance with section 307C of the Corporations Act 2001, I am pleased to provide the following declaration of independence to the directors of Australian Vintage Ltd.
As lead audit partner for the audit of the financial statements of Australian Vintage Ltd for the financial year ended 30 June 2013, I declare that to the best of my knowledge and belief, there have been no contraventions of:
(i) the auditor independence requirements of the Corporations Act 2001 in relation to the audit; and
(ii) any applicable code of professional conduct in relation to the audit.
Yours sincerely
DELOITTE TOUCHE TOHMATSU
Stephen Harvey, Partner Chartered Accountants
Liability limited by a scheme approved under Professional Standards Legislation.
Member of Deloitte Touche Tohmatsu Limited

33 | INDEPENDENT AUDIT REPORT
Independent Auditor’s Report to the members of Australian Vintage Ltd
We have audited the accompanying financial report of Australian Vintage Ltd, which comprises the statement of financial position as at 30 June 2013, the statement of comprehensive income, the statement of cash flows and the statement of changes in equity for the year ended on that date, notes comprising a summary of significant accounting policies and other explanatory information, and the directors’ declaration of the consolidated entity, comprising the company and the entities it controlled at the year’s end or from time to time during the financial year as set out on pages 34 to 84.
Directors’ Responsibility for the Financial ReportThe directors of the company are responsible for the preparation of the financial report that gives a true and fair view in accordance with Australian Accounting Standards and the Corporations Act 2001 and for such internal control as the directors determine is necessary to enable the preparation of the financial report that gives a true and fair view and is free from material misstatement, whether due to fraud or error. In note 3, the directors also state, in accordance with Accounting Standard AASB 101 Presentation of Financial Statements, that the consolidated financial statements comply with International Financial Reporting Standards.
Auditor’s ResponsibilityOur responsibility is to express an opinion on the financial report based on our audit. We conducted our audit in accordance with Australian Auditing Standards. Those standards require that we comply with relevant ethical requirements relating to audit engagements and plan and perform the audit to obtain reasonable assurance whether the financial report is free from material misstatement. An audit involves performing procedures to obtain audit evidence about the amounts and disclosures in the financial report. The procedures selected depend on the auditor’s judgement, including the assessment of the risks of material misstatement of the financial report, whether due to fraud or error. In making those risk assessments, the auditor considers internal control, relevant to the company’s preparation of the financial report that gives a true and fair view, in order to design audit procedures that are appropriate in the circumstances, but not for the purpose of expressing an opinion on the effectiveness of the company’s internal control. An audit also includes evaluating the appropriateness of accounting policies used and the reasonableness of accounting estimates made by the directors, as well as evaluating the overall presentation of the financial report.We believe that the audit evidence we have obtained is sufficient and appropriate to provide a basis for our audit opinion.
Auditor’s Independence DeclarationIn conducting our audit, we have complied with the independence requirements of the Corporations Act 2001. We confirm that the independence declaration required by the Corporations Act 2001, which has been given to the directors of Australian Vintage Ltd, would be in the same terms if given to the directors as at the time of this auditor’s report.
OpinionIn our opinion:(a) the financial report of Australian Vintage Ltd is in accordance with the Corporations Act 2001, including: (i) giving a true and fair view of the consolidated entity’s financial position as at 30 June 2013 and of its performance for the year ended
on that date; and (ii) complying with Australian Accounting Standards and the Corporations Regulations 2001; and(b) the consolidated financial statements also comply with International Financial Reporting Standards as disclosed in note 3.
Report on the Remuneration Report We have audited the Remuneration Report included in pages 24 to 30 of the directors’ report for the year ended 30 June 2013. The directors of the company are responsible for the preparation and presentation of the Remuneration Report in accordance with section 300A of the Corporations Act 2001. Our responsibility is to express an opinion on the Remuneration Report, based on our audit conducted in accordance with Australian Auditing Standards.
OpinionIn our opinion the Remuneration Report of Australian Vintage Ltd for the year ended 30 June 2013 complies with section 300A of the Corporations Act 2001.
DELOITTE TOUCHE TOHMATSU
Stephen Harvey, Partner Chartered Accountants Adelaide, 2nd September 2013
Liability limited by a scheme approved under Professional Standards Legislation.
Member of Deloitte Touche Tohmatsu Limited
Deloitte Touche TohmatsuA.B.N. 74 490 121 060
11 Waymouth Street Adelaide SA 5000 GPO Box 1969 Adelaide SA 5001 Australia
DX 664Tel: +61 (0) 8 8407 7000Fax: +61 (0) 8 8407 7001www.deloitte.com.au

34 | DIRECTORS’ DECLARATION
Directors’ declaration
The Directors declare that:
(a) In the Directors’ opinion, there are reasonable grounds to believe that the company will be able to pay its debts as and when they become due and payable;
(b) the attached financial statements are in compliance with International Financial Reporting Standards as stated in note 3 to the financial statements;
(c) In the Directors’ opinion, the attached Financial Statements and notes thereto are in accordance with the Corporations Act 2001, including compliance with accounting standards and giving true and fair view of the financial position and performance of the consolidated entity; and
(d) The Directors’ have been given the declarations required by s.295A of the Corporations Act 2001.
At the date of this declaration, the Company is within the class of companies affected by ASIC class order 98/1418. The nature of the deed of cross guarantee is such that each company which is party to the deed guarantees to each creditor payment in full of any debt in accordance with the deed of cross guarantee.
In the Director’s opinion, there are reasonable grounds to believe that the Company and the companies to which the ASIC class order applies, as detailed in note 39 to the Financial Statements will, as a group, be able to meet any obligations or liabilities to which they are or may become, subject by virtue of the deed of cross guarantee.
Signed in accordance with a resolution of the Directors made pursuant to s.295(5) of the Corporations Act 2001.
On behalf of the Directors
Ian D FerrierChairman 2nd September 2013

For the year ended 30 June 2013
FINANCIAL REPORT

36 | CONSOLIDATED STATEMENT OF PROFIT OR LOSS AND OTHER COMPREHENSIVE INCOME
FOR THE FINANCIAL YEAR ENDED 30 JUNE 2013
NOTE CONSOLIDATED
2013 2012 $’000 $’000
Revenue 5 208,549 227,962Cost of sales 5 (151,380) (165,633)Gross Profit 57,169 62,329
Fair value of grapes picked during the financial year less estimated costs to sell 3,171 967Investment Income 5 403 458Other gains and losses 5 917 1,425Distribution expenses (10,856) (12,269)Gain on provision for onerous contracts 4,223 -Sales and marketing expenses (23,646) (22,349)Administration expenses (6,531) (6,271)Loss on foreign exchange (459) (601)Finance costs – interest paid 5 (12,920) (12,835)Finance costs – interest un-wind 5 (990) (1,916)
Profit before income tax 10,481 8,938Income tax expense 6 (3,411) (1,871)Net profit for the year 7,070 7,067 Other comprehensive loss net of income tax: Items that may be subsequently classified to the profit or loss: Profit / (Loss) on interest rate swaps 1,453 (1,716)Valuation of foreign exchange hedges (1,571) 6Exchange differences arising on translation of foreign operations 45 34Income tax relating to components of other comprehensive income 21 503Other comprehensive income / (loss) for the year, net of income tax (52) (1,173)Total comprehensive income for the year 7,018 5,894 Earnings Per Share: Basic (cents per share) 35 5.3 5.4Diluted (cents per share) 35 5.3 5.4
Notes to the financial statements are included on pages 40 to 84.

AS AT 30 JUNE 2013
NOTE CONSOLIDATED
2013 2012 $’000 $’000
Current Assets
Cash and cash equivalents 42 995 237
Trade and other receivables 10 35,613 39,546
Inventories 11 151,376 130,624
Current tax assets 6 79 200
Other 12 3,637 4,105
Total Current Assets 191,700 174,712
Non-Current Assets
Trade and other receivables 13 - 1,843
Inventories 14 20,858 21,878
Other financial assets 15 59 59
Biological assets 16 33,184 33,169
Property, plant and equipment 17 93,171 95,613
Goodwill 18 37,685 37,685
Other intangible assets 20 7,405 7,780
Water Licences 19 7,467 8,692
Deferred tax assets 6 52,288 55,123
Total Non-Current Assets 252,117 261,842
Total Assets 443,817 436,554
Current Liabilities
Trade and other payables 22 33,019 36,918
Borrowings 23 2,305 1,993
Other financial liabilities 24 1,559 1,618
Provisions 25 6,061 8,016
Other 26 48 42
Total Current Liabilities 42,992 48,587
Non-Current Liabilities
Borrowings 27 140,748 127,329
Deferred tax liabilities 6 10,773 10,232
Other financial liabilities 28 430 751
Provisions 29 7,975 12,786
Total Non-Current Liabilities 159,926 151,098
Total Liabilities 202,918 199,685
Net Assets 240,899 236,869
Equity
Issued capital 32 403,155 402,792
Reserves 33 670 641
Accumulated losses 34 (162,926) (166,564)
Total Equity 240,899 236,869
Notes to the financial statements are included on pages 40 to 84.
37 | CONSOLIDATED STATEMENT OF FINANCIAL POSITION

FOR THE FINANCIAL YEAR ENDED 30 JUNE 2013
EQUITY - SETTLED FOREIGN EMPLOYEE CURRENCY SHARE BENEFITS HEDGING TRANSLATION ACCUMULATED CAPITAL RESERVE RESERVE RESERVE LOSSES TOTAL $’000 $’000 $’000 $’000 $’000 $’000
Balance at 1 July 2012 402,792 1,497 (865) 9 (166,564) 236,869
Profit for the period - - - - 7,070 7,070
Profit on interest rate swaps - - 1,453 - - 1,453
Valuation of foreign exchange hedges - - (1,571) - - (1,571)
Exchange differences arising on - - - 45 - 45 translation of foreign operations
Income tax relating to components - - 35 (14) - 21 of other comprehensive income
Total comprehensive income for the period - - (83) 31 7,070 7,018
Transactions with owners in their capacity as owners:
Dividend paid - - - - (3,432) (3,432)
Recognition of share based payments - 81 - - - 81
Issue of shares 363 - - - - 363
Balance at 30 June 2013 403,155 1,578 (948) 40 (162,926) 240,899
Balance at 1 July 2011 401,831 1,497 332 (15) (170,417) 233,228
Profit for the period - - - - 7,067 7,067
Loss on interest rate swaps - - (1,716) - - (1,716)
Valuation of foreign exchange hedges - - 6 - - 6
Exchange differences arising - - - 34 - 34 on translation of foreign operations
Income tax relating to components - - 513 (10) - 503 of other comprehensive income
Total comprehensive income for the period - - (1,197) 24 7,067 5,894
Transactions with owners in their capacity as owners:
Dividend paid - - - - (3,214) (3,214)
Issue of shares 961 - - - - 961
Balance at 30 June 2012 402,792 1,497 (865) 9 (166,564) 236,869
Notes to the financial statements are included on pages 40 to 84.
38 | CONSOLIDATED STATEMENT OF CHANGES IN EQUITY

FOR THE FINANCIAL YEAR ENDED 30 JUNE 2013
NOTE CONSOLIDATED
2013 2012 $’000 $’000
Cash flows from operating activities
Receipts from customers 223,481 241,448
Payments to suppliers and employees (217,164) (217,723)
Cash generated from operations 6,317 23,725
Interest and other costs of finance paid (10,935) (13,292)
Interest and bill discounts received 284 157
Net cash (used in) / provided by operating activities 42 (d) (4,334) 10,590
Cash flows from investing activities
Payments for property, plant and equipment (4,224) (5,183)
Payments for intangibles 20 (136) (151)
Proceeds from sale of property, plant & equipment 1,316 26,151
Net cash (used in) / provided by investing activities (3,044) 20,817
Cash flows from financing activities
Loan payment received 188 2,313
Dividends paid (3,069) (2,253)
Proceeds from borrowings 13,700 -
Repayment of borrowings (2,683) (37,654)
Net cash provided by / (used in) financing activities 8,136 (37,594)
Net increase / (decrease) in cash and cash equivalents 758 (6,187)
Cash and cash equivalents at the beginning of the financial year 237 6,424
Cash and cash equivalents at the end of the financial year 42 995 237
Notes to the financial statements are included on pages 40 to 84.
39 | CONSOLIDATED STATEMENT OF CASH FLOWS

40 | NOTES TO THE FINANCIAL STATEMENTS
Note 1: General Information
Australian Vintage Ltd is a public company listed on the Australian Securities Exchange (trading under the symbol ‘AVG’), incorporated in Australia and with operations in Australia and the United Kingdom.
Australian Vintage Ltd’s registered office and principal place of business are as follows:
Registered Office and principal place of business
275 Sir Donald Bradman Drive Cowandilla SA 5033 Tel: (08) 8172 8333
The consolidated entity’s principal activities in the course of the financial year were wine making, wine marketing, vineyard management and development.
Approval of financial statements
The financial statements were approved by the board of directors and authorised for issue on 2nd September 2013.
Note 2: Adoption of new and revised Accounting Standards
Adoption of new and revised Accounting Standards
The following new and revised Standards and Interpretations have been adopted in the current year and have affected the amounts reported in these financial statements. Details of other Standards and Interpretations adopted in these financial statements but that have had no effect on the amounts reported are set out below.
Standards affecting presentation and disclosure
Amendments to AASB 101‘Presentation of Financial Statements’. The amendment (part of AASB 2011-9 ‘Amendments to Australian Accounting Standards - Presentation of Items of Other Comprehensive Income’) introduce new terminology for the statement of comprehensive income and income statement. Under the amendments to AASB 101, the statement of comprehensive income is renamed as a statement of profit or loss and other comprehensive income and the income statement is renamed as a statement of profit or loss. The amendments to AASB 101 retain the option to present profit or loss and other comprehensive income in either a single statement or in two separate but consecutive statements. However, the amendments to AASB 101 require items of other comprehensive income to be grouped into two categories in the other comprehensive income section: (a) items that will not be reclassified subsequently to profit or loss and (b) items that may be reclassified subsequently to profit or loss when specific conditions are met. Income tax on items of other comprehensive income is required to be allocated on the same basis – the amendments do not change the option to present items of other comprehensive income either before tax or net of tax. The amendments have been applied retrospectively, and hence the presentation of items of other comprehensive income has been modified to reflect the changes. Other than the above mentioned presentation changes, the application of the amendments to AASB 101 does not result in any impact on profit or loss, other comprehensive income and total comprehensive income.
The amendments (part of AASB 2012-5 ‘Further Amendments to Australian Accounting Standards arising from Annual Improvements 2009-2011 Cycle’) requires an entity that changes accounting policies retrospectively, or makes a retrospective restatement or reclassification to present a statement of financial position as at the beginning of the preceding period (third statement of financial position), when the retrospective application, restatement or reclassification has a material effect on the information in the third statement of financial position. The related notes to the third statement of financial position are not required to be disclosed.
Standards and Interpretations affecting the reported results or financial position
There are no new and revised Standards and Interpretations adopted in these financial statements affecting the reporting results or financial position.
Standards and Interpretations in issue not yet adopted
At the date of authorisation of the financial statements, the Standards and Interpretations listed below were in issue but not yet effective.
STANDARD / INTERPRETATION
EFFECTIVE FOR ANNUAL REPORTING PERIODS BEGINNING ON OR AFTER
EXPECTED TO BE INITIALLY APPLIED IN THE FINANCIAL YEAR ENDING
AASB 9 ‘Financial Instruments’, AASB 2009-11 ‘Amendments to Australian Accounting Standards arising from AASB9’ and AASB 2012-6 ‘Amendments to Australian Accounting Standards – Mandatory Effective Date of AASB 8 and Transition Disclosure’
1 January 2015 30 June 2016
AASB 9 ‘Financial Instruments’ (December 2010), AASB 2010-7 ‘Amendments to Australian Accounting Standards arising from AASB 9 (December 2010)’ and AASB2012-6 ‘Amendments to Australian Accounting Standards – Mandatory Effective Date of AASB 8 and Transition Disclosure’
1 January 2015 30 June 2016
AASB 10 ‘Consolidated Financial Statements’ and AASB 2011-7 ‘Amendments to Australian Accounting Standards arising from the consolidation and Joint Arrangements standards’
1 January 2013 30 June 2014

41 | NOTES TO THE FINANCIAL STATEMENTS
Note 2: Adoption of new and revised Accounting Standards (continued)
STANDARD / INTERPRETATION
EFFECTIVE FOR ANNUAL REPORTING PERIODS BEGINNING ON OR AFTER
EXPECTED TO BE INITIALLY APPLIED IN THE FINANCIAL YEAR ENDING
AASB 11 ‘Joint Arrangements’ and AASB 2011-7 ‘Amendments to Australian Accounting Standards arising from the consolidation and Joint Arrangements standards’
1 January 2013 30 June 2014
AASB 12 ‘Disclosure of Interests in Other Entities’ and AASB 2011-7 ‘Amendments to Australian Accounting Standards arising from the consolidation and Joint Arrangements standards’
1 January 2013 30 June 2014
AASB 127 ‘Separate Financial Statements’ (2011) and AASB 2011-7 ‘Amendments to Australian Accounting Standards arising from the consolidation and Joint Arrangements standards’
1 January 2013 30 June 2014
AASB 13 ‘Fair Value Measurement’ and AASB 2011-8 ‘Amendments to Australian Accounting Standards arising from AASB 13’
1 January 2013 30 June 2014
AASB 119 ‘Employee Benefits’ (2011) and AASB 2011-10 ‘Amendments to Australian Accounting Standards arising from AASB 119 (2011)’
1 January 2013 30 June 2014
AASB 2010-10 ‘Further Amendments to Australian Accounting Standards – Removal of Fixed Dates for First-time Adopters’
1 January 2013 30 June 2014
AASB 2011-4 ‘Amendments to Australian Accounting Standards to Remove Individual Key Management Personnel Disclosure Requirements’
1 July 2013 30 June 2014
AASB 2012-2 ‘Amendments to Australian Accounting Standards – Disclosures – Offsetting Financial Assets and Financial Liabilities’
1 January 2013 30 June 2014
AASB 2012-3 ‘Amendments to Australian Accounting Standards – Offsetting Financial Assets and Financial Liabilities’
1 January 2014 30 June 2015
AASB 2012-5 ‘Amendments to Australian Accounting Standards arising from Annual Improvements 2009–2011 Cycle’
1 January 2013 30 June 2014
AASB 2012-10 ‘Amendments to Australian Accounting Standards – Transition Guidance and Other Amendments’
1 January 2013 30 June 2014
AASB 2012-3 ‘Amendments to AASB 136 – Recoverable Amount Disclosures for Non-Financial Assets’
1 January 2014 30 June 2015
AASB 2013-4 ‘Amendments to Australian Accounting Standards – Novation of Derivatives and Continuation of Hedge Accounting’
1 January 2014 30 June 2015
The potential effects of the above Standards and Interpretations on the Group’s financial statements has not yet been determined.
At the date of authorisation of the financial statements, there were no IASB Standards and IFRIC Interpretations in issue but not yet effective, although Australian equivalent Standards and Interpretations have not yet been issued.
Note 3: Summary of accounting policies
3.1 Statement of compliance
The financial report is a general purpose financial report which has been prepared in accordance with the Corporations Act 2001, Accounting Standards and Interpretations, and complies with other requirements of the law.
The financial report comprises the consolidated financial statements of the Group. For the purposes of preparing the consolidated financial statements, the company is a for-profit entity.
Accounting Standards include Australian equivalents to International Financial Reporting Standards (‘A-IFRS’). Compliance with the A-IFRS ensures that the financial statements and notes of the Group comply with International Financial Reporting Standards (‘IFRS’).
3.2 Basis of preparation
The financial report has been prepared on the basis of historical cost, except for the revaluation of financial instruments and biological assets. Historical cost is based on the fair values of the consideration given in exchange for assets. All amounts are presented in Australian dollars, unless otherwise noted.
The company is a company of the kind referred to in ASIC Class Order 98/0100, dated 10 July 1998, and in accordance with that Class Order amounts in the financial report are rounded off to the nearest thousand dollars, unless otherwise indicated.
42 | NOTES TO THE FINANCIAL STATEMENTS
Note 3: Summary of accounting policies (continued)
3.3 Basis of consolidation
The consolidated financial statements incorporate the financial statements of the Company and entities (including special purpose entities) controlled by the Company (its subsidiaries) (referred to as ‘the Group’ in these financial statements). Control is achieved where the Company has the power to govern the financial and operating policies of an entity so as to obtain benefits from its activities.
The results of subsidiaries acquired or disposed of during the year are included in the consolidated statement of comprehensive income from the effective date of acquisition or up to the effective date of disposal, as appropriate.
Where necessary, adjustments are made to the financial statements of subsidiaries to bring their accounting policies into line with those used by other members of the Group.
All intra-group transactions, balances, income and expenses are eliminated in full on consolidation.
3.4 Business combinations
Acquisitions of subsidiaries and businesses are accounted for using the acquisition method. The cost of the business combination is measured as the aggregate of the fair values (at the date of exchange) of assets given, liabilities incurred or assumed, and equity instruments issued by the Group in exchange for control of the acquiree. Acquisition related costs are recognised in profit or loss as incurred.
Where applicable, the consideration for the acquisition includes any asset or liability resulting from a contingent consideration arrangement, measured at its acquisition-date fair value. Changes in the fair value of the contingent consideration that qualify as measurement period adjustments are adjusted for retrospectively, with corresponding adjustments against goodwill. Measurement period adjustments are adjustments that arise from additional information obtained during the ‘measurement period’ (which cannot exceed one year from the acquisition date) about facts and circumstances that existed at the acquisition date. Contingent consideration that is classified as an asset or liability is remeasured at subsequent reporting dates in accordance with AASB 139, or AASB 137 ‘Provisions, Contingent Liabilities and Contingent Assets’, as appropriate, with the corresponding gain or loss being recognised in profit or loss.
The acquiree’s identifiable assets, liabilities and contingent liabilities that meet the conditions for recognition under AASB 3(2008) are recognised at their fair value at the acquisition date, except that:
• deferred tax assets or liabilities and liabilities or assets related to employee benefit arrangements are recognised and measured in accordance with AASB 112 Income Taxes and AASB 119 Employee Benefits respectively;
• liabilities or equity instruments related to the replacement by the Group of an acquiree’s share-based payment awards are measured in accordance with AASB 2 Share-based Payment; and
• assets (or disposal groups) that are classified as held for sale in accordance with AASB 5 Non-current Assets Held for Sale and Discontinued Operations are measured in accordance with that Standard.
If the initial accounting for a business combination is incomplete by the end of the reporting period in which the combination occurs, the Group reports provisional amounts for the items for which the accounting is incomplete. Those provisional amounts are adjusted during the measurement period, or additional assets or liabilities are recognised, to reflect new information obtained about facts and circumstances that existed as of the acquisition date that, if known, would have affected the amounts recognised as of that date.
The measurement period is the period from the date of acquisition to the date the Group obtains complete information about facts and circumstances that existed at the acquisition date – and is subject to a maximum of one year.
3.5 Borrowing costs
Borrowing costs directly attributable to the acquisition, construction or production of qualifying assets, which are assets that necessarily take a substantial period of time to get ready for their intended use or sale, are added to the cost of those assets, until such time as the assets are substantially ready for their intended use or sale. Investment income earned on the temporary investment of specific borrowings pending their expenditure on qualifying assets is deducted from the borrowing costs eligible for capitalisation.
All other borrowing costs are recognised in profit or loss in the period in which they are incurred.
3.6 Cash and cash equivalents
Cash comprises cash on hand and demand deposits. Cash equivalents are short term, highly liquid investments that are readily convertible to known amounts of cash and have maturity of less than 3 months at date of acquisition.
3.7 Derivative financial instruments
The Group enters into a variety of derivative financial instruments to manage its exposure to interest rate and foreign exchange rate risk, including foreign exchange forward contracts and interest rate swaps. Further details of derivative financial instruments are disclosed in note 43 to the financial statements.
Derivatives are initially recognised at fair value at the date a derivative contract is entered into and are subsequently remeasured to their fair value at each reporting date. The resulting gain or loss is recognised in profit or loss immediately unless the derivative is designated and effective as a hedging instrument, in which event, the timing of the recognition in profit or loss depends on the nature of the hedge relationship.
The Group designates certain derivatives as either hedges of the fair value of recognised assets or liabilities or firm commitments (fair value hedges), hedges of highly probable forecast transactions or hedges of foreign currency risk of firm commitments (cash flow hedges), or hedges of net investments in foreign operations.

43 | NOTES TO THE FINANCIAL STATEMENTS
Note 3: Summary of accounting policies (continued)
The fair value of a hedging derivative is presented as a non-current asset or a non-current liability if the remaining maturity of the instrument is more than 12 months and it is not expected to be realised or settled within 12 months. Other derivatives are presented as current assets or current liabilities.
Embedded derivatives
Derivatives embedded in other financial instruments or other host contracts are treated as separate derivatives when their risks and characteristics are not closely related to those of host contracts and the host contracts are not measured at fair value with changes in fair value recognised in profit or loss.
Hedge accounting
The Group designates certain hedging instruments, which include derivatives, embedded derivatives and non-derivatives in respect of foreign currency risk, as either fair value hedges, cash flow hedges, or hedges of net investments in foreign operations.
Hedges of foreign exchange risk on firm commitments are accounted for as cash flow hedges. At the inception of the hedge relationship the Group documents the relationship between the hedging instrument and hedged item, along with its risk management objectives and its strategy for undertaking various hedge transactions. Furthermore, at the inception of the hedge and on an ongoing basis, the Group documents whether the hedging instrument that is used in a hedging relationship is highly effective in offsetting changes in fair values or cash flows of the hedged item.
Note 43 contains details of the fair values of the derivative instruments used for hedging purposes. Movements in the hedging reserve are shown in the Statement of Changes in Equity.
Fair value hedge
Changes in the fair value of derivatives that are designated and qualify as fair value hedges are recorded in profit or loss immediately, together with any changes in the fair value of the hedged item that is attributable to the hedged risk.
Hedge accounting is discontinued when the Group revokes the hedging relationship, the hedging instrument expires or is sold, terminated, or exercised, or no longer qualifies for hedge accounting. The adjustment to the carrying amount of the hedged item arising from the hedged risk is amortised to profit or loss from that date.
Cash flow hedge
The effective portion of changes in the fair value of derivatives that are designated and qualify as cash flow hedges are deferred in equity. The gain or loss relating to the ineffective portion is recognised immediately in profit or loss as part of other expenses or other income. Amounts deferred in equity are recycled in profit or loss in the periods when the hedged item is recognised in profit or loss in the same line of the statement of comprehensive income as the recognised hedged item. However, when the forecast transaction that is hedged results in the recognition of a non-financial asset or a non-financial liability, the gains and losses previously deferred in equity are transferred from equity and included in the initial measurement of the cost of the asset or liability.
Hedge accounting is discontinued when the Group revokes the hedging relationship, the hedging instrument expires or is sold, terminated, or exercised, or no longer qualifies for hedge accounting. Any cumulative gain or loss deferred in equity at that time remains in equity and is recognised when the forecast transaction is ultimately recognised in profit or loss. When a forecast transaction is no longer expected to occur, the cumulative gain or loss that was deferred in equity is recognised immediately in profit or loss.
3.8 Employee benefits
A liability is recognised for benefits accruing to employees in respect of wages and salaries, annual leave and long service leave when it is probable that settlement will be required and they are capable of being measured reliably.
Liabilities recognised in respect of short term employee benefits, are measured at their nominal values using the remuneration rate expected to apply at the time of settlement.
Liabilities recognised in respect of long term employee benefits are measured as the present value of the estimated future cash outflows to be made by the Group in respect of services provided by employees up to reporting date.
Defined contribution plans
Contributions to defined contribution superannuation plans are expensed when employees have rendered service entitling them to the contributions.
3.9 Financial instruments
Financial assets and financial liabilities are recognised when a group entity becomes a party to the contractual provisions of the instrument.
Financial assets and financial liabilities are initially measured at fair value. Transaction costs that are directly attributable to the acquisition or issue of financial assets and financial liabilities (other than financial assets and financial liabilities at fair value through profit or loss) are added to or deducted from the fair value of the financial assets or financial liabilities, as appropriate, on initial recognition. Transaction costs directly attributable to the acquisition of financial assets or financial liabilities at fair value through profit and loss are recognised immediately in profit or loss.
Financial assets
Financial assets are classified into the following specified categories: financial assets ‘at fair value through profit or loss’ (FVTPL), ‘held to maturity’ investments, ‘available-for-sale’ (AFS) financial assets and ‘loans and receivables’. The classification depends on the nature and purpose of the financial assets and is determined at the time of initial recognition.

44 | NOTES TO THE FINANCIAL STATEMENTS
Note 3: Summary of accounting policies (continued)
Investments in controlled entities
Investments in controlled entities are recorded at cost. Investments in associates have been accounted for under the equity method in the consolidated financial statements and the cost method in the Company financial statements. Other investments are recorded at fair value with gains or losses arising on re-measurement recognised in profit or loss.
Dividends are recognised on a receivable basis. Interest revenue is recognised on a time proportionate basis that takes into account the effective yield on the financial assets.
Effective interest method
The effective interest method is a method of calculating the amortised cost of a financial asset and of allocating interest income over the relevant period.
Income is recognised on an effective interest rate basis for debt instruments.
Loans and receivables
Trade receivables, loans, and other receivables that have fixed or determinable payments that are not quoted in an active market are classified as ‘loans and receivables’. Loans and receivables are measured at amortised cost using the effective interest method less impairment.
Interest is recognised by applying the effective interest rate.
Impairment of financial assets
Financial assets, other than those at fair value through profit or loss, are assessed for indicators of impairment at each balance sheet date. Financial assets are impaired where there is objective evidence that as a result of one or more events that occurred after the initial recognition of the financial asset the estimated future cash flows of the investment have been impacted. For financial assets carried at amortised cost, the amount of the impairment is the difference between the asset’s carrying amount and the present value of estimated future cash flows, discounted at the original effective interest rate.
The carrying amount of the financial asset is reduced by the impairment loss directly for all financial assets with the exception of trade receivables where the carrying amount is reduced through the use of an allowance account. When a trade receivable is uncollectible, it is written off against the allowance account. Subsequent recoveries of amounts previously written off are credited against the allowance account. Changes in the carrying amount of the allowance account are recognised in profit or loss.
If, in a subsequent period, the amount of the impairment loss decreases and the decrease can be related objectively to an event occurring after the impairment was recognised, the previously recognised impairment loss is reversed through profit or loss to the extent the carrying amount of the investment at the date the impairment is reversed does not exceed what the amortised cost would have been had the impairment not been recognised.
Derecognition of financial assets
The Group derecognises a financial asset only when the contractual rights to the cash flows from the asset expire, or when it transfers the financial asset and substantially all the risks and rewards of ownership of the asset to another entity. If the Group neither transfers nor retains substantially all the risks and rewards of ownership of a transferred financial asset, the Group continues to recognise the financial asset and also recognises a collateralised borrowing for the proceeds received.
On derecognition of a financial asset in its entirety, the difference between the asset’s carrying amount and the sum of the consideration received and receivable and the cumulative gain or loss that has been recognised in other comprehensive income and accumulated in equity is recognised in profit and loss.
On derecognition of a financial asset other than in its entirety, (e.g. when the Group retains an option to repurchase part of the transferred asset or retains a residual interest that does not result in the retention of substantially all the risks and rewards of ownership and the Group retains control), the Group allocates the previous carrying amount of the financial asset between the part it continues to recognise under continuing involvement, and the part it no longer recognises on the basis of amount allocated to the part that is no longer recognised and the sum of the consideration received for the part no longer recognised and any cumulative gain or loss allocated to it that had been recognised in other comprehensive income is recognised in profit and loss. A cumulative gain or loss that has been recognised in other comprehensive income is allocated between the part that continues to be recognised and the part that is no longer recognised on the basis of the relative fair values of those parts.
3.10 Financial instruments issued by the company
Debt and equity instruments
Debt and equity instruments are classified as either liabilities or as equity in accordance with the substance of the contractual arrangement.
Financial guarantee contract liabilities
Financial guarantee contract liabilities are measured initially at their fair values and subsequently at the higher of the amount recognised as a provision and the amount initially recognised less cumulative amortisation in accordance with the revenue recognition policies.
Financial liabilities
Financial liabilities are classified as either financial liabilities ‘at fair value through profit or loss’ or other financial liabilities.

45 | NOTES TO THE FINANCIAL STATEMENTS
Note 3: Summary of accounting policies (continued)
Other financial liabilities
Other financial liabilities, including borrowings, are initially measured at fair value, net of transaction costs.
Other financial liabilities are subsequently measured at amortised cost using the effective interest method, with interest expense recognised on an effective yield basis.
The effective interest method is a method of calculating the amortised cost of a financial liability and of allocating interest expense over the relevant period. The effective interest rate is the rate that exactly discounts estimated future cash payments through the expected life of the financial liability, or, where appropriate, a shorter period.
De-recognition of financial liabilities
The Group derecognises financial liabilities when, and only when, the Group’s obligations are discharged, cancelled or they expire. The difference between the carrying amount of the financial liability derecognised and the consideration paid and payable is recognised in profit or loss.
3.11 Foreign currency
Foreign currency transactions
All foreign currency transactions during the financial year are brought to account using the exchange rate in effect at the date of the transaction. Foreign currency monetary items at reporting date are translated at the exchange rate existing at reporting date. Non-monetary assets and liabilities carried at fair value that are denominated in foreign currencies are translated at the rates prevailing at the date when the fair value was determined.
The individual financial statements of each group entity are presented in the currency of the primary economic environment in which the entity operates (its functional currency). For the purpose of the consolidated financial statements, the results and financial position of each entity are expressed in Australian dollars, which is the functional currency of Australian Vintage Ltd, and the presentation currency for the consolidated financial statements.
In preparing the financial statements of the individual entities, transactions in currencies other than the entity’s functional currency (foreign currencies) are recorded at the rates of exchange prevailing on the dates of the transactions. At each balance sheet date, monetary items denominated in foreign currencies are retranslated at the rates prevailing at the balance sheet date. Non-monetary items carried at fair value that are denominated in foreign currencies are retranslated at the rates prevailing on the date when the fair value was determined. Non-monetary items that are measured in terms of historical cost in a foreign currency are not retranslated.
Exchange differences are recognised in profit or loss in the period in which they arise except for:
• exchange differences which relate to assets under construction for future productive use, which are included in the cost of those assets where they are regarded as an adjustment to interest costs on foreign currency borrowings (refer note 3.7);
• exchange differences on transactions entered into in order to hedge certain foreign currency risks (refer note 3.7); and
• exchange differences on monetary items receivable from or payable to a foreign operation for which settlement is neither planned or likely to occur, which form part of the net investment in a foreign operation, and which are recognised in the foreign currency translation reserve and recognised in profit or loss on disposal of the net investment.
Foreign operations
On consolidation, the assets and liabilities of the Group’s overseas operations are translated into Australian dollars at exchange rates prevailing at the balance sheet date. Income and expense items are translated at the average exchange rates for the period.
Goodwill and fair value adjustments arising on the acquisition of a foreign entity are treated as assets and liabilities of the foreign entity and translated at exchange rates prevailing at the reporting date. Exchange differences arising are recognised in equity.
3.12 Goodwill
Goodwill arising in a business combination is recognised as an asset at the date that control is acquired (the acquisition date). Goodwill is measured as the excess of the sum of the consideration transferred, the amount of any non-controlling interests in the acquiree, and the fair value of the acquirer’s previously held equity interest in the acquiree (if any) over the net of the acquisition-date amounts of the identifiable assets acquired and the liabilities assumed.
If, after reassessment, the Group’s interest in the fair value of the acquiree’s identifiable net assets exceeds the sum of the consideration transferred, the amount of any non-controlling interests in the acquiree and the fair value of the acquirer’s previously held equity interest in the acquiree (if any), the excess is recognised immediately in profit or loss as a bargain purchase gain.
Goodwill is not amortised but is reviewed for impairment at least annually. For the purpose of impairment testing, goodwill is allocated to each of the Group’s cash-generating units expected to benefit from the synergies of the combination. Cash-generating units to which goodwill has been allocated are tested for impairment annually, or more frequently when there is an indication that the unit may be impaired. If the recoverable amount of the cash-generating unit is less than its carrying amount, the impairment loss is allocated first to reduce the carrying amount of any goodwill allocated to the unit and then to the other assets of the unit pro-rata on the basis of the carrying amount of each asset in the unit. An impairment loss recognised for goodwill is not reversed in a subsequent period. Any impairment loss for goodwill is recognised directly in profit or loss in the consolidated statement of comprehensive income.
On disposal of a subsidiary, the attributable amount of goodwill is included in the determination of the profit or loss on disposal.

46 | NOTES TO THE FINANCIAL STATEMENTS
Note 3: Summary of accounting policies (continued)
3.13 Goods and services tax
Revenues, expenses and assets are recognised net of the amount of goods and services tax (GST), except:
(i) where the amount of GST incurred is not recoverable from the taxation authority, it is recognised as part of the cost of acquisition of an asset or as part of an item of expense; or
(ii) for receivables and payables which are recognised inclusive of GST.
The net amount of GST recoverable from, or payable to, the taxation authority is included as part of receivables or payables.
Cash flows are included in the cash flow statement on a gross basis. The GST component of cash flows arising from investing and financing activities which is recoverable from, or payable to, the taxation authority is classified as operating cash flows.
3.14 Grape vines and produce extracted from vines
Grape vines are classified as a separate biological asset class in accordance with Australian Accounting Standard AASB 141 “Agriculture”. The biological assets are measured on initial recognition and at each reporting date at their fair value less costs to sell unless the market determined prices or values are not available and for which alternative estimates of fair value are determined to be clearly unreliable. In the current financial year and the comparative financial year, the fair values have been estimated by the directors based on discounted cash flow analysis of each vineyard and reference to the current market value of similar assets recently exchanged in the open market. Produce harvested from vines owned by the Company are measured as revenue at fair value less estimated costs to sell at the point of harvest (including production costs). A gain or loss arising from a change in fair values less estimated costs to sell is included in the profit and loss in the period in which the gain / loss arises. The agricultural produce is recorded within inventory.
3.15 Impairment of long-lived assets
At each reporting date, the Group reviews the carrying amounts of its tangible and intangible assets to determine whether there is any indication that those assets have suffered an impairment loss. If any such indication exists, the recoverable amount of the asset is estimated in order to determine the extent of the impairment loss (if any). Where the asset does not generate cash flows that are independent from other assets, the Group estimates the recoverable amount of the cash-generating unit to which the asset belongs.
Goodwill, intangible assets with indefinite useful lives and intangible assets not yet available for use are tested for impairment annually and whenever there is an indication that the asset may be impaired. An impairment of goodwill is not subsequently reversed.
Recoverable amount is the higher of fair value less costs to sell and value in use. In assessing value in use, the estimated future cash flows are discounted to their present value using a pre-tax discount rate that reflects current market assessments of the time value of money and the risks specific to the asset for which the estimates of future cash flows have not been adjusted.
If the recoverable amount of an asset (or cash-generating unit) is estimated to be less than its carrying amount, the carrying amount of the asset (cash-generating unit) is reduced to its recoverable amount. An impairment loss is recognised in profit or loss immediately, unless the relevant asset is carried at fair value, in which case the impairment loss is treated as a revaluation decrease.
Where an impairment loss subsequently reverses, the carrying amount of the asset (cash-generating unit) is increased to the revised estimate of its recoverable amount, but only to the extent that the increased carrying amount does not exceed the carrying amount that would have been determined had no impairment loss been recognised for the asset (cash-generating unit) in prior years. A reversal of an impairment loss is recognised in profit or loss immediately, unless the relevant asset is carried at fair value, in which case the reversal of the impairment loss is treated as a revaluation increase.
3.16 Income tax
Income tax expense represents the sum of the tax currently payable and deferred tax.
Current tax
Current tax is calculated by reference to the amount of income taxes payable or recoverable in respect of the taxable profit or tax loss for the period. It is calculated using tax rates and tax laws that have been enacted or substantively enacted by reporting date. Current tax for current and prior periods is recognised as a liability (or asset) to the extent that it is unpaid (or refundable).
Deferred tax
Deferred tax is accounted for using the balance sheet liability method in respect of temporary differences arising from differences between the carrying amount of assets and liabilities in the financial statements and the corresponding tax base of those items.
In principle, deferred tax liabilities are recognised for all taxable temporary differences. Deferred tax assets are recognised to the extent that it is probable that sufficient taxable amounts will be available against which deductible temporary differences or unused tax losses and tax offsets can be utilised. However, deferred tax assets and liabilities are not recognised if the temporary differences giving rise to them arise from the initial recognition of assets and liabilities (other than as a result of a business combination) which affects neither taxable income nor accounting profit. Furthermore, a deferred tax liability is not recognised in relation to taxable temporary differences arising from goodwill.
Deferred tax liabilities are recognised for taxable temporary differences arising on investments in subsidiaries and associates except where the Group is able to control the reversal of the temporary differences and it is probable that the temporary differences will not reverse in the foreseeable future. Deferred tax assets arising from deductible temporary differences associated with these investments and interests are only recognised to the extent that it is probable that there will be sufficient taxable profits against which to utilise the benefits of the temporary differences and they are expected to reverse in the foreseeable future.

47 | NOTES TO THE FINANCIAL STATEMENTS
Note 3: Summary of accounting policies (continued)
Deferred tax assets and liabilities are measured at the tax rates that are expected to apply to the period(s) when the asset and liability giving rise to them are realised or settled, based on tax rates (and tax laws) that have been enacted or substantively enacted by reporting date. The measurement of deferred tax liabilities and assets reflects the tax consequences that would follow from the manner in which the Group expects, at the reporting date, to recover or settle the carrying amount of its assets and liabilities.
Deferred tax assets and liabilities are offset when they relate to income taxes levied by the same taxation authority and the company/Group intends to settle its current tax assets and liabilities on a net basis.
Current and deferred tax for the period
Current and deferred tax is recognised as an expense or income in the statement of comprehensive income, except when it relates to items credited or debited directly to equity, in which case the deferred tax is also recognised directly in equity, or where it arises from the initial accounting for a business combination, in which case it is taken into account in the determination of goodwill or excess.
Tax consolidation
The company and all its wholly-owned Australian resident entities are part of a tax-consolidated group under Australian taxation law. Australian Vintage Ltd is the head entity in the tax-consolidated group.
Current tax liabilities and assets, and deferred tax assets arising from unused tax losses and relevant tax credits of the members of the tax-consolidated group are recognised by the company (as head entity in the tax-consolidated group).
Entities within the tax-consolidated group have entered into a tax funding arrangement and a tax-sharing agreement with the head entity. Under the terms of the tax funding arrangement, Australian Vintage Ltd and each of the entities in the tax-consolidated group has agreed to pay a tax equivalent payment to or from the head entity, based on the current tax liability or current tax asset of the entity.
3.17 Intangible assets
Brand names and Registered Trademarks
Brand names recognised by the company are considered to have an indefinite useful life and are not amortised. Each period, the useful life of this type of asset is reviewed to determine whether events and circumstances continue to support an indefinite useful life assessment for the asset. Such assets are tested for impairment in accordance with the policy stated in Note 3.15.
Software
Software is carried at cost less any accumulated amortisation and accumulated impairment losses. Amortisation is recognised on a straight line basis over the estimated useful life. The estimated useful life of the software package is 10 years. Estimated useful lives and amortisation methods are reviewed at the end of each annual reporting period, with the effect of any changes in estimate being accounted for on a prospective basis.
3.17.1 Intangible assets acquired in a business combination
Intangible assets acquired in a business combination and recognised separately from goodwill are initially recognised at their fair value at the acquisition date (which is regarded as their cost).
Subsequent to initial recognition, intangible assets acquired in a business combination are reported at cost less accumulated amortisation and accumulated impairment losses, on the same basis as intangible assets that are acquired separately.
3.18 Inventories
Inventories are valued at the lower of cost and net realisable value. Costs, including an appropriate portion of fixed and variable overhead expenses, are assigned to inventory on hand by the method most appropriate to each particular class of inventory, with the majority being valued on a first in first out basis. Net realisable value represents the estimated selling price in the ordinary course of business less the estimated costs of completion and estimated costs necessary to make the sale.
3.19 Investments in associates
An associate is an entity over which the Group has significant influence. The results and assets and liabilities of associates are incorporated into the financial statements under the equity method of accounting.
Losses of an associate in excess of the Group’s interest in that associate (which includes any long-term interests that, in substance, form part of the Group’s net investment in the associate) are recognised only to the extent that the Group has incurred legal or constructive obligations or made payments on behalf of the associate.
3.20 Leased assets
Leases are classified as finance leases whenever the terms of the lease transfer substantially all the risks and rewards of ownership to the lessee. All other leases are classified as operating leases.
Group as lessor
Rental income from operating leases is recognised on a straight line basis over the term of the relevant lease. However, contingent rentals arising under operating leases are recognised as income in a manner consistent with the basis on which they are determined.
Group as lessee
Assets held under finance leases are initially recognised at their fair value or, if lower, at amounts equal to the present value of the minimum lease payments, each determined at the inception of the lease. The corresponding liability to the lessor is included in the statement of financial position as a finance lease obligation.

48 | NOTES TO THE FINANCIAL STATEMENTS
Note 3: Summary of accounting policies (continued)
Lease payments are apportioned between finance charges and reduction of the lease obligation so as to achieve a constant rate of interest on the remaining balance of the liability. Finance expenses are charged directly against income, unless they are directly attributable to qualifying assets, in which case they are capitalised in accordance with the Group’s general policy on borrowing costs. Refer to note 3.5.
Finance leased assets are amortised on a straight line basis over the estimated useful life of the asset.
Operating lease payments are recognised as an expense on a straight-line basis over the lease term, except where another systematic basis is more representative of the time pattern in which economic benefits from the leased asset are consumed.
3.21 Non-current assets held for sale
Non-current assets classified as held for sale are measured at the lower of carrying amount and fair value less costs to sell.
Non-current assets are classified as held for sale if their carrying amount will be recovered through a sale transaction rather than through continuing use. This condition is regarded as met only when management are committed to the sale, the sale is highly probable and the asset is available for immediate sale in its present condition and the sale of the asset is expected to be completed within one year from the date of classification.
3.22 Payables
Trade payables and other accounts payable are recognised when the Group becomes obliged to make future payments resulting from the purchase of goods and services.
3.23 Property, plant and equipment
Property, plant and equipment are initially measured at cost. Cost includes expenditure that is directly attributable to the acquisition of the item. In the event that settlement of all or part of the purchase consideration is deferred, cost is determined by discounting the amounts payable in the future to their present value as at the date of acquisition.
Buildings, plant and equipment, vineyard improvements and equipment under finance lease are measured at cost less accumulated depreciation and impairment. Freehold land is not depreciated.
Depreciation is provided on property, plant and equipment, including freehold buildings but excluding land. Depreciation is calculated on a straight line basis so as to write off the net cost of each asset over its expected useful life to its estimated residual value. The estimated useful lives, residual values and depreciation method are reviewed at each year end, with the effect of any changes in estimate accounted for on a prospective basis. Vineyard improvements are depreciated over the period of the lease or estimated useful life, whichever is the shorter, using the straight line method. The estimated useful lives, residual values and depreciation method are reviewed at the end of each annual reporting period, with the effect of any changes recognised on a prospective basis. Depreciation related to wineries, production and some vineyards is capitalised into inventory.
Assets held under finance leases are depreciated over their expected useful lives on the same basis as owned assets or, where shorter, the term of the relevant lease. The gain or loss arising on the disposal or retirement of an item of property, plant and equipment is determined as the difference between the sales proceeds and the carrying amount of the asset and is recognised in profit and loss.
The following estimated useful lives are used in the calculation of depreciation:
• Buildings 50 years
• Vineyard improvements 15-20 years
• Plant and equipment 5-33 years
• Plant and equipment under lease 5-15 years
3.24 Provisions
Provisions are recognised when the Group has a present obligation (legal or constructive), the future sacrifice of economic benefits is probable, and the amount of the provision can be measured reliably.
The amount recognised as a provision is the best estimate of the consideration required to settle the present obligation at reporting date, taking into account the risks and uncertainties surrounding the obligation. Where a provision is measured using the cash flows estimated to settle the present obligation, its carrying amount is the present value of those cash flows.
When some or all of the economic benefits required to settle a provision are expected to be recovered from a third party, the receivable is recognised as an asset if it is virtually certain that recovery will be received and the amount of the receivable can be measured reliably.
An onerous contract is considered to exist where the Group has a contract under which the unavoidable cost of meeting the contractual obligations exceed the economic benefits estimated to be received. Present obligations arising under onerous contracts are recognised as a provision to the extent that the present obligation exceeds the economic benefits estimated to be received.
A restructuring provision is recognised when the Group has developed a detailed formal plan for the restructuring and has raised a valid expectation in those affected that it will carry out the restructuring by starting to implement the plan or announcing its main features to those affected by it. The measurement of a restructuring provision includes only the direct expenditures arising from the restructuring, which are those amounts that are both necessarily entailed by the restructuring and not associated with the ongoing activities of the entity.

49 | NOTES TO THE FINANCIAL STATEMENTS
Note 3: Summary of accounting policies (continued)
3.25 Revenue
Revenue is measured at the fair value of the consideration received or receivable. Revenue is reduced for estimated customer returns, rebates, discounts and other similar allowances.
Sale of goods
Revenue from the sale of goods is recognised when all the following conditions are satisfied:
• the Group has transferred to the buyer the significant risks and rewards of ownership of the goods;
• the Group retains neither continuing managerial involvement to the degree usually associated with ownership nor effective control over the goods sold;
• the amount of revenue can be measured reliably;
• it is probable that the economic benefits associated with the transaction will flow to the entity; and
• the costs incurred or to be incurred in respect of the transaction can be measured reliably.
Vineyard development / management contracts
Revenue from cost plus development contracts is recognised by reference to the recoverable costs incurred during the financial year plus the percentage of fees earned. Percentage of fees earned is measured by the proportion that costs incurred to date relate to the estimated total cost of the stage of the contract. Where a loss is expected to occur it is recognised immediately. Revenue from vineyard management contracts is recognised based on a percentage of fees earned.
Contract Processing
Revenue from contract processing is recognised based on the percentage of winemaking process completed.
Interest Revenue
Interest revenue is accrued on a time basis by reference to the principal balance and the effective interest rate, which is the rate that exactly discounts estimated future cash receipts through the expected life of the financial asset to that asset’s net carrying amount. Interest income from a financial asset is recognised when it is probable that the economic benefit will flow to the Group and the amount of revenue can be measured reliably.
Rental Income
Rent is accrued on a time basis by reference to the total rent due to the Company for the reporting period.
3.26 Share-based payments
For cash-settled share-based payments, a liability equal to the portion of the goods or services received is recognised at the current fair value determined at each reporting date. Equity-settled share-based payments to employees are measured at the fair value of the equity instruments at the grant date.
3.27 Trade credits
Trade credits are recorded at the net present value of expected future usage. The Company reviews the recoverable amount of the trade credits at each reporting date and any shortfall against carrying value is charged to profit and loss.
3.28 Water licences
Water allocations with permanent rights are measured at cost on the date of acquisition. The permanent water licences have an indefinite useful life and are not subject to amortisation. Water allocations with permanent rights are assessed for impairment in each reporting period.
Water allocations with temporary rights are expensed in the year of purchase.

50 | NOTES TO THE FINANCIAL STATEMENTS
Note 4: Critical accounting judgments and key sources of estimation uncertainty
In the application of the Group’s accounting policies, management is required to make judgments, estimates and assumptions about carrying values of assets and liabilities that are not readily apparent from other sources. The estimates and associated assumptions are based on historical experience and other factors that are believed to be reasonable under the circumstance, the results of which form the basis of making the judgments. Actual results may differ from these estimates. The estimates and underlying assumptions are reviewed on an ongoing basis. Revisions to accounting estimates are recognised in the period in which the estimate is revised if the revision affects only that period, or in the period of the revision and future periods if the revision affects both current and future periods.
The following are the critical judgments that management has made in applying the Group’s accounting policies:
Inventories
The net realisable value of inventories is the estimated selling price in the ordinary course of business less estimated costs to sell which approximates fair value less cost to sell. The key assumptions require the use of management judgment. These key assumptions are the variables affecting the estimated costs to sell and the expected selling price.
The write down is based on assuming a selling price of the wine either through packaged goods or as bulk wine. Should the key assumptions applied in the estimation of revenue from the sale of the inventory when sold vary the ultimate realisable value may differ from that recorded at balance date.
Income tax losses
The company has recognised deferred tax assets in relation to unused tax losses and temporary differences as at the end of the reporting period. The recognition of deferred tax assets is after considering whether it is probable that the company will have sufficient taxable income in the foreseeable future and against which the deferred tax assets can be recovered.
The assessment of whether there will be sufficient taxable income is subject to a level of judgment and if the actual conditions vary to the assumptions adopted, the carrying value of the asset would need to be reassessed.
Onerous Contracts
The Company is party to a variety of grape supply agreements including vineyard lease agreements; grower grape supply agreements; and management of vineyard agreements. The agreements provide for the Company to acquire grapes at various prices some of which exceed market values.
The agreements in the current market have become onerous. The Company is attempting to mitigate the losses associated with the agreements.
Each contract has been reviewed and it has been determined that there is an unavoidable cost of meeting the obligations under the grape supply agreements that exceeds the forecast economic benefits (the onerous amount).
The provision for the onerous contracts has been brought to account using the best estimate of the onerous amount.
There are a number of future events the Company expects will affect the amount required to settle the contracts and these events are reflected in the amount of the provisions where there is sufficient objective evidence that they will occur.
The onerous contracts provision has been adjusted to the present value (at 8.5% discount rate – 2012 : 8.5%) of the expenditures expected to be required to settle the onerous obligations.
Impairment of goodwill and other intangibles
The goodwill arising from the acquisition of businesses has been reassessed through the estimation of the value in use of the cash generating units to which goodwill has been allocated. The value in use calculations require the Group to estimate the future cash flows expected to arise from the cash generating unit and select a risk adjusted discount rate in order to calculate present value.
A discounted cash flow analysis was performed on the cash generating units associated with the goodwill balances, using a pre-tax discount rate of 13.12% (2012: 13.34%), which indicated that the fair value of assets (including goodwill), based upon discounted cash flows, was higher than the carrying value.
The carrying value of the brand names have been individually assessed as part of separate cash generating units (CGUs).
Impairment tests were performed on brand names using a discounted cash flow model and a pre-tax discount rate of 20% (2012 : 20%) (branded wine business).
There have been estimations applied to assumptions in the cash flow from the CGUs. Should these estimations vary, the carrying amount of the intangible assets would need to be reassessed.
Useful lives of property, plant and equipment
The Group reviews the estimated useful lives of property, plant and equipment at the end of each annual reporting period. During the financial year, the directors determined that the useful lives of certain items of equipment should be shortened, due to developments in technology.
Revaluation of biological assets
The Company reviewed the long term value of vineyards and adopted the net present values of the cash flows as a Directors’ Valuation for the period ended 30 June 2013.
In determining the fair value of the biological assets, the forecast cash flows from the vineyards have been discounted using a 14.32% (2012 : 14.53%) pre-tax discount rate.
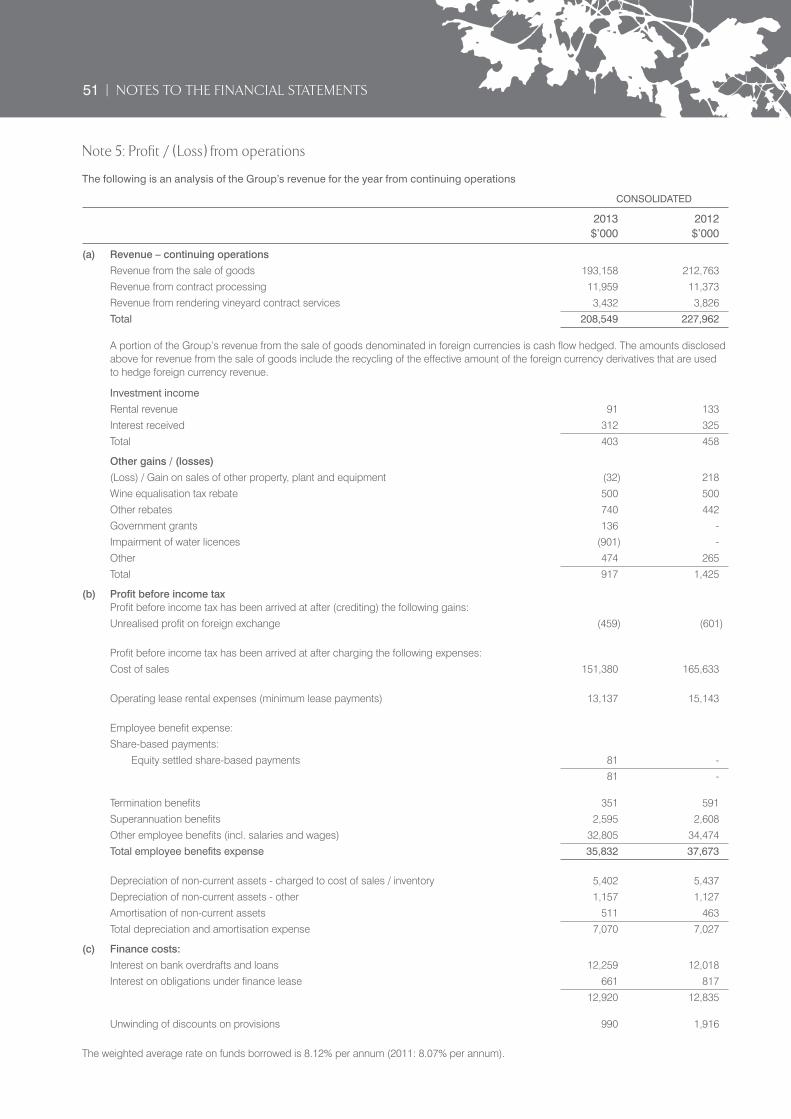
51 | NOTES TO THE FINANCIAL STATEMENTS
Note 5: Profit / (Loss) from operations
The following is an analysis of the Group’s revenue for the year from continuing operations
CONSOLIDATED
2013 2012 $’000 $’000
(a) Revenue – continuing operations
Revenue from the sale of goods 193,158 212,763
Revenue from contract processing 11,959 11,373
Revenue from rendering vineyard contract services 3,432 3,826
Total 208,549 227,962 A portion of the Group’s revenue from the sale of goods denominated in foreign currencies is cash flow hedged. The amounts disclosed above for revenue from the sale of goods include the recycling of the effective amount of the foreign currency derivatives that are used to hedge foreign currency revenue.
Investment income
Rental revenue 91 133
Interest received 312 325
Total 403 458
Other gains / (losses)
(Loss) / Gain on sales of other property, plant and equipment (32) 218
Wine equalisation tax rebate 500 500
Other rebates 740 442
Government grants 136 -
Impairment of water licences (901) -
Other 474 265
Total 917 1,425
(b) Profit before income tax Profit before income tax has been arrived at after (crediting) the following gains:
Unrealised profit on foreign exchange (459) (601)
Profit before income tax has been arrived at after charging the following expenses:
Cost of sales 151,380 165,633
Operating lease rental expenses (minimum lease payments) 13,137 15,143
Employee benefit expense:
Share-based payments:
Equity settled share-based payments 81 -
81 - Termination benefits 351 591
Superannuation benefits 2,595 2,608
Other employee benefits (incl. salaries and wages) 32,805 34,474
Total employee benefits expense 35,832 37,673
Depreciation of non-current assets - charged to cost of sales / inventory 5,402 5,437
Depreciation of non-current assets - other 1,157 1,127
Amortisation of non-current assets 511 463
Total depreciation and amortisation expense 7,070 7,027
(c) Finance costs:
Interest on bank overdrafts and loans 12,259 12,018
Interest on obligations under finance lease 661 817
12,920 12,835 Unwinding of discounts on provisions 990 1,916
The weighted average rate on funds borrowed is 8.12% per annum (2011: 8.07% per annum).

52 | NOTES TO THE FINANCIAL STATEMENTS
Note 6: Income taxes
CONSOLIDATED
2013 2012 $’000 $’000
(a) Income tax recognised in profit or loss
Current tax
Tax expense comprises:
Current tax expense in respect of the current year 89 1,010
89 1,010
Deferred tax
Deferred tax expense relating to the origination and reversal of temporary differences 3,376 1,358
Adjustments recognised in the current year in relation to the current tax of prior years (54) (497)
Total tax expense attributable to continuing operations 3,322 861
Total income tax expense recognised in the current year relating to continuing operations 3,411 1,871
The prima facie income tax expense/(benefit) on pre-tax accounting income/(loss) from operations reconciles to the income tax expense in the financial statements as follows:
Profit from operations 10,481 8,938
Income tax expense calculated at 30% 3,144 2,681
Non-deductible expenses 51 23
Current year capital losses not recognised 270 -
Capital losses utilised (not previously recorded) - (336)
3,465 2,368
Adjustments recognised in the current year in relation to tax of prior years (54) (497)
Total tax expense 3,411 1,871
The tax rate used for the 2013 and 2012 reconciliations above is the corporation tax rate of 30% payable by Australian Corporate entities on taxable profits under Australian tax law.
(b) Income tax recognised in other comprehensive income 21 503
(c) Current tax assets and liabilities
Current tax assets 79 200
(d) Deferred tax balances
Deferred tax assets comprise:
Tax losses – revenue 34,250 33,353
Temporary differences 18,038 21,770
52,288 55,123
Deferred tax liabilities comprise:
Temporary differences 10,773 10,232
Total income tax recognised directly in equity 21 503

53 | NOTES TO THE FINANCIAL STATEMENTS
Note 6: Income taxes (continued)
(e) Taxable and deductible temporary differences arise from the following:
CONSOLIDATED
Opening Charged to Charged to Acquisitions/ Closing Balance Income Equity Disposals Balance Temporary differences 2013 $’000 $’000 $’000 $’000 $’000
Gross deferred tax liabilities: Work in progress (1,948) 283 - - (1,665)Property, plant and equipment (6,629) (819) - - (7,448)Intangible assets (370) 26 - - (344)Inventories (1,256) (32) - - (1,288)Other (29) (20) 21 - (28) (10,232) (562) 21 - (10,773)
Gross deferred tax assets: Property, plant and equipment - 10 - - 10Provisions and accruals 11,824 (3,130) - - 8,694Financial liabilities 711 (436) - - 275Inventories 9,235 (176) - - 9,059Tax losses 33,353 897 - - 34,250 55,123 (2,835) - - 52,288
Temporary differences 2012
Gross deferred tax liabilities: Work in progress (2,376) 428 - - (1,948)Property, plant and equipment (9,415) 2,786 - - (6,629)Intangible assets (406) 36 - - (370)Inventories - (1,256) - - (1,256)Other (47) 18 - - (29) (12,244) 2,012 - - (10,232)Gross deferred tax assets: Property, plant and equipment 15 (15) - - -Provisions and accruals 17,446 (5,622) - - 11,824Financial liabilities - 711 - - 711Inventories - 9,235 - - 9,235Tax losses 40,913 (7,560) - - 33,353Other 119 (622) 503 - - 58,493 (3,873) 503 - 55,123
There are no unrecognised revenue tax losses relating to the Group or the Company. The company has not recognised $6,710,000 (2012: $5,769,000) of capital losses. The Directors expect the future financial performance of the company will facilitate the full recovery of the tax losses.
Tax Consolidation Relevance of tax consolidation to the GroupThe company and its wholly-owned Australian resident entities have formed a tax-consolidated group with effect from 1 July 2003 and are therefore taxed as a single entity from that date. The head entity within the tax-consolidated group is Australian Vintage Ltd. The members of the tax-consolidated group are identified in note 39.
Nature of tax funding arrangements and tax sharing agreementsEntities within the tax-consolidated group have entered into a tax funding arrangement and a tax-sharing agreement with the head entity. Under the terms of the tax funding arrangement, Australian Vintage Ltd and each of the entities in the tax-consolidated group has agreed to pay a tax equivalent payment to or from the head entity, based on the current tax liability or current tax asset of the entity. The tax funding arrangement requires each subsidiary to prepare an individual tax calculation to determine the amount payable or receivable. Such amounts are reflected in amounts receivable from or payable to other entities in the tax-consolidated group.
The tax sharing agreement entered into between members of the tax-consolidated group provides for the determination of the allocation or income tax liabilities between the entities should the head entity default on its tax payment obligation. No amounts have been recognised in the financial statements in respect of this agreement as payment of any amounts under the tax sharing agreement is considered remote. The effect of the tax sharing agreement is that each member’s liability for tax payable by the tax-consolidated group is limited to the amount payable to the head entity under the tax funding arrangement.

54 | NOTES TO THE FINANCIAL STATEMENTS
Note 7: Key management personnel compensation
Details of Key Management Personnel
The key management personnel of Australian Vintage Ltd during the year were, except as noted below:
Ian Ferrier Michael Noack (Chairman – Non-Executive Director) (Chief Financial Officer and Company Secretary)
Brian McGuigan Flora Sarris (Non-Executive Director) (General Counsel)
Perry Gunner Cameron Ferguson (Non-Executive Director) (General Manager – Sales and Marketing)
Richard Davis Julian Dyer (Non-Executive Director) (General Manager – UK / Europe – appointed 3rd September 2012)
Neil McGuigan Paul Schaafsma (Chief Executive Officer) (General Manager – UK / Europe – resigned 21st August 2012)
The aggregate compensation of the key management personnel of the Group and the company is set out below:
CONSOLIDATED
2013 2012 $ $
Short-term employee benefits 2,560,554 2,630,402
Post-employment benefits 227,073 346,482
Share based payments 52,905 -
Termination benefits - -
2,840,532 2,976,884
Note 8: Executive share option plan
The Company currently has two long term incentive plans in place.
Australian Vintage Ltd Executive Option Acquisition Plan (“Plan”) – option series 1 to 3.
The Company has an executive and senior employee option scheme which allows for the granting of share options over unissued shares of the company. The company also issues share options under the Australian Vintage Ltd Executive Option Acquisition Plan (“Plan”). These options are granted over issued shares of the company.
During the year the company did not contribute any amounts to the trustee of the Australian Vintage Ltd Executive Option Acquisition Plan (“Plan”) to acquire call options over ordinary shares in Australian Vintage Ltd.
The table below summarises all share options on issue:
2013 2012 WEIGHTED AVERAGE NUMBER NUMBER EXERCISE PRICE
2013 2012 $ $
Balance at the beginning of the financial year (i) 259,261 376,058 1.76 1.76
Granted during the financial year (ii) - - - -
Exercised during the financial year (ii) - - - -
Lapsed / cancelled during the financial year (iii) (259,261) (116,797) 1.76 3.02
Balance at the end of the financial year (iv) - 259,261 - 1.64
The call options are exercisable subject to a performance hurdle which is satisfied if, the Earnings per Share performance for the pre-determined year (“Performance Year”), is greater than the EPS for the base year (“Base Year”), where the base year is the year the options are issued. Additionally, the call options are exercisable when there is a takeover event.
The options can be exercised on the following basis:
• Where EPS performance is 15% - 19.99% greater than base EPS, 50% of the options can be exercised
• Where EPS performance is 20% - 24.99% greater than base EPS, 75% of the options can be exercised
• Where EPS performance is 25% or more greater than base EPS, 100% of the options can be exercised

55 | NOTES TO THE FINANCIAL STATEMENTS
Note 8: Executive share option plan (continued)
(i) Balance at the beginning of the financial year
2013 VESTED UNVESTED GRANT VESTING EXPIRY EXERCISE OPTIONS – SERIES No. No. No. DATE DATE DATE PRICE $
(3) Issued 20 December 2007 259,261 259,261 - 20/12/07 20/12/10 30/12/12 1.64
259,261 259,261 -
2012 VESTED UNVESTED GRANT EXERCISE EXPIRY EXERCISE OPTIONS – SERIES No. No. No. DATE DATE DATE PRICE $
(1) Issued 16 November 2006 69,697 69,697 - 16/11/06 16/11/09 30/12/11 2.90
(2) Issued 3 April 2007 47,100 47,100 - 03/04/07 05/04/10 30/12/11 3.20
(3) Issued 20 December 2007 259,261 259,261 - 20/12/07 20/12/10 30/12/12 1.64
376,058 376,058 -
(ii) Granted / Exercised during the financial year
There were no options granted or exercised during the current or prior financial year.
(iii) Lapsed / Cancelled during the financial year
2013 GRANT EXPIRY OPTIONS – SERIES No. DATE DATE
(3) Issued 20 December 2007 259,261 20/12/07 30/12/12
2012 GRANT EXPIRY OPTIONS – SERIES No. DATE DATE
(1) Issued 16 November 2006 69,697 16/11/06 30/12/11
(2) Issued 3 April 2007 47,100 03/04/07 30/12/11
116,797
(iv) Balance at end of financial year
2013 VESTED UNVESTED GRANT VESTING EXPIRY EXERCISE OPTIONS – SERIES No. No. No. DATE DATE DATE PRICE $
NIL
2012 VESTED UNVESTED GRANT VESTING EXPIRY EXERCISE OPTIONS – SERIES No. No. No. DATE DATE DATE PRICE $
(3) Issued 20 December 2007 259,261 259,261 - 20/12/07 20/12/10 30/12/12 1.64
259,261 259,261 -
Australian Vintage Ltd Performance Rights and Option Plan
Established in August 2012, this long term incentive is provided as a right to an issue of shares. This right is subject to the achievement of set growth rates in earnings per share over a 4 year period up until the vesting date. The plan is available to senior management as approved by the board. On the 12th August 2012, 1,383,400 performance rights were issued under this plan to employees. These performance rights have a vesting date of 12th August 2016 and an expiry date of 12th September 2016. The fair value of these performance rights was $367,569 at the grant date. These rights were priced using a binominal option pricing model.

56 | NOTES TO THE FINANCIAL STATEMENTS
Note 9: Remuneration of auditors
CONSOLIDATED
2013 2012 $ $
Auditor of the parent company
Audit or review of financial report 334,750 325,000
Other services – other audit services 9,500 21,525
Other services – taxation advice 13,931 26,205
Other services – grant advice 6,500 -
Other services – taxation compliance 35,500 39,000
400,181 411,730
The external auditor of Australian Vintage Ltd is Deloitte Touche Tohmatsu.
Note 10: Current trade and other receivables
CONSOLIDATED
2013 2012 $’000 $’000
Trade receivables (i) 33,247 39,573
Allowance for doubtful debts (122) (303)
33,125 39,270
Loans to other entities (ii) 1,843 188
Other receivables 645 88
35,613 39,546
(i) The average credit period on sales of goods and rendering of services is 64 days (2012: 65 days). No interest is charged on outstanding trade receivables. An allowance has been made for estimated irrecoverable trade receivable amounts arising from the past sale of goods and rendering of services, determined by reference to past default experience.
(ii) Loan payable in instalments up to 30th June 2014, secured against a vineyard. The interest rate charged is 10.25% (2012: 10.25%).
Before accepting any new customers, the Group uses a third party to assess the potential customer’s credit quality and defines credit limits by customer. Limits provided on customer accounts are reviewed throughout the year. Of the trade receivables balance at the end of the year, $15.8 million (2012: $24.4 million) is due from international and domestic supermarket groups and two major wine entities. There are no other customers who represent more than 5% of the total balance of trade receivables.
Included in the Group’s trade receivable balance are debtors with a carrying amount of $3.6 million (2012: $1.6 million) which are past due at the reporting date for which the Group has not provided as there has not been a significant change in credit quality and the amounts are still considered recoverable. The Group does not hold any collateral over these balances.
Ageing of past due but not impaired
30 – 60 days 3,010 1,438
60 – 90 days 239 95
90 – 120 days 397 100
Total 3,646 1,633
Average age (days) 50 44
Movement in the allowance of doubtful debts
Balance at the beginning of the year (303) (410)
Impairment reversals / (losses) recognised on receivables 68 4
Amounts written off as not collectable 113 103
Balance at the end of the year (122) (303)
In determining the recoverability of a trade receivable, the Group considers any change in the credit quality of the trade receivable from the date credit was initially granted up to the reporting date. Accordingly, the directors believe that there is no further credit provision required in excess of the allowance for doubtful debts.

57 | NOTES TO THE FINANCIAL STATEMENTS
Note 11: Current inventories
CONSOLIDATED
2013 2012 $’000 $’000
Bulk wine 112,996 100,023
Other stores and raw materials 3,727 3,417
Work in progress 5,551 6,493
Bottled wine 29,102 20,691
151,376 130,624
The cost of inventory recognised as an expense (or cost of sales) during the year in respect of continuing operations was $151.4 million (2012: $165.6 million).
Note 12: Other current assets
Prepayments 3,637 2,636
Hedge assets – foreign exchange contracts (note 31) - 1,469
3,637 4,105
Note 13: Non-current trade and other receivables
Loans carried at amortised cost:
Loans to other entities - 1,843
- 1,843
Note 14: Non-current inventories
Bulk wine 19,326 20,789
Bottled wine 1,532 1,089
20,858 21,878
Note 15: Other non-current financial assets
Investments in companies (i) 59 59
59 59(i) Relates to investments in wine related businesses.

58 | NOTES TO THE FINANCIAL STATEMENTS
Note 16: Biological assets
CONSOLIDATED
2013 2012 $’000 $’000
Fair value less costs to sell of vines at beginning of year 33,169 33,048
Valuation adjustment 15 121
Fair value less costs to sell of vines at end of year 33,184 33,169
(a) Impact on Consolidated Statement of Comprehensive Income
The profit / (loss) before income tax included in the Consolidated statement of comprehensive income resulting from the fair value less costs to sell of produce extracted from the biological assets is a profit of $3,171,000 (2012: $967,000).
(b) Physical quantity of vines
CONSOLIDATED
2013 2012 No. No.
Number of vines owned 1,429,364 1,429,364
Acres owned 1,923 1,923
Number of grapes crushed - owned vineyards (tonnes) 20,165 16,786
(c) Nature of asset
Australian Vintage Ltd owns vineyards in several regions across Australia (primarily the Sunraysia, Riverland and Adelaide Hills regions).
There are two resulting assets:
(i) grapes (agricultural produce) – recorded within inventory
(ii) vines (biological asset)
(d) Significant assumptions
Significant assumptions made in determining the net market value of the vines are:
(i) 100% of the vines are currently mature and will be productive for periods up to 40 years per vine;
(ii) the expected price of the vines is constant in real terms, based on average prices throughout the current year;
(iii) the costs expected to arise throughout the life of the vines are constant in real terms, based on average costs throughout the year; and
(iv) inflation will continue at the current rate; and
(v) discount rate of 14.32% (2012 : 14.53%).
Significant assumptions made in determining the net market value of grapes picked are:
(i) grapes crushed valued at management estimate of market price; and
(ii) costs are those costs incurred in the 12 months preceding harvest.
.
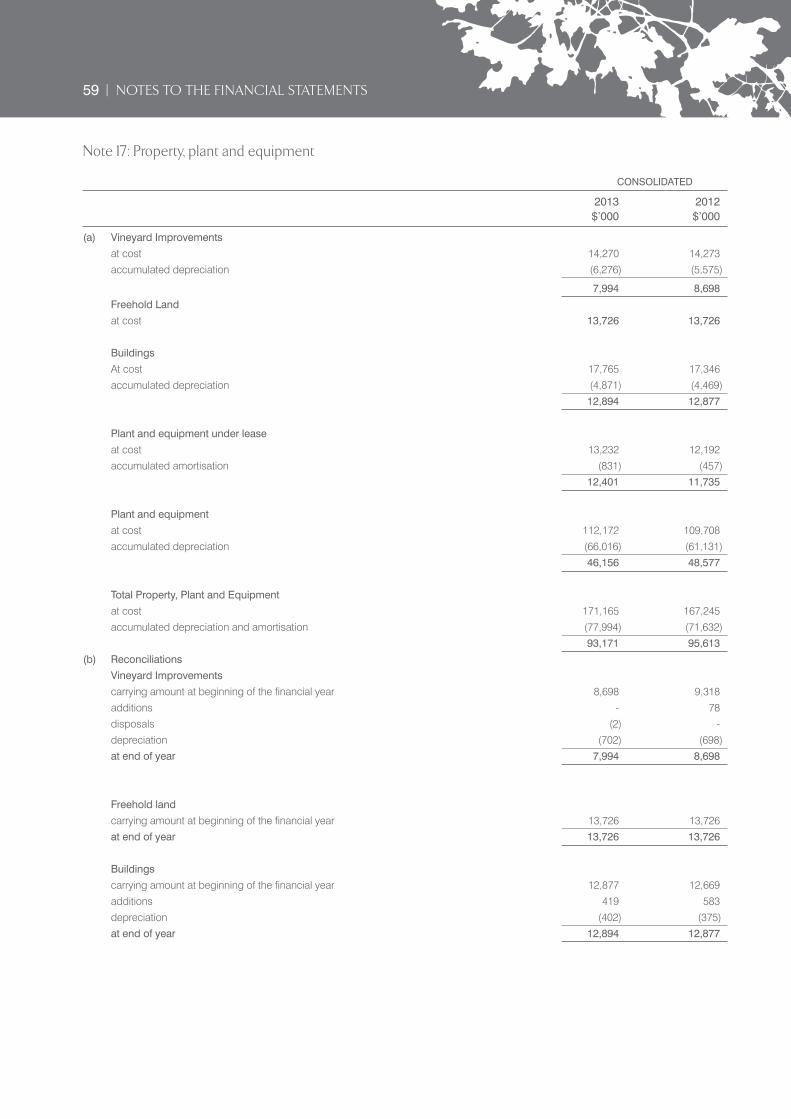
59 | NOTES TO THE FINANCIAL STATEMENTS
Note 17: Property, plant and equipment
CONSOLIDATED
2013 2012 $’000 $’000
(a) Vineyard Improvements
at cost 14,270 14,273
accumulated depreciation (6,276) (5,575)
7,994 8,698
Freehold Land
at cost 13,726 13,726
Buildings
At cost 17,765 17,346
accumulated depreciation (4,871) (4,469)
12,894 12,877
Plant and equipment under lease
at cost 13,232 12,192
accumulated amortisation (831) (457)
12,401 11,735
Plant and equipment
at cost 112,172 109,708
accumulated depreciation (66,016) (61,131)
46,156 48,577
Total Property, Plant and Equipment
at cost 171,165 167,245
accumulated depreciation and amortisation (77,994) (71,632)
93,171 95,613
(b) Reconciliations
Vineyard Improvements
carrying amount at beginning of the financial year 8,698 9,318
additions - 78
disposals (2) -
depreciation (702) (698)
at end of year 7,994 8,698
Freehold land
carrying amount at beginning of the financial year 13,726 13,726
at end of year 13,726 13,726
Buildings
carrying amount at beginning of the financial year 12,877 12,669
additions 419 583
depreciation (402) (375)
at end of year 12,894 12,877

60 | NOTES TO THE FINANCIAL STATEMENTS
Note 17: Property, plant and equipment (continued)
CONSOLIDATED
2013 2012 $’000 $’000
Plant and equipment under lease
carrying amount at beginning of the financial year 11,735 12,101
additions 1,040 -
amortisation (374) (366)
at end of year 12,401 11,735
Plant and equipment
carrying amount at beginning of the financial year 48,577 49,334
additions 2,727 4,402
disposals (67) (34)
depreciation (5,081) (5,125)
at end of year 46,156 48,577
Aggregate depreciation and amortisation allocated, and impairment recognised as an expense during the year:
Buildings 402 375
Vineyard improvements 702 698
Plant and equipment 5,081 5,125
Plant and equipment under lease 374 366
6,559 6,564
Note 18: Goodwill
Gross carrying amount:
Balance at beginning of the financial year 44,085 44,085
Balance at end of the financial year 44,085 44,085
Accumulated impairment losses
Balance at beginning of financial year 6,400 6,400
Balance at end of financial (i) 6,400 6,400
Net book value
At the beginning of the financial year 37,685 37,685
At the end of the financial year 37,685 37,685
Allocation of goodwill to cash-generating units
Goodwill has been allocated for impairment testing purposes to the following cash generating unit:
Bulk wine business 37,685 37,685
(i) The impairment of goodwill is tested each reporting date and is based on determining the recoverable amount the businesses’ cash generating units (CGU). To assess the recoverable amount of each CGU, the company has determined both the fair value less costs to sell and the value in use of the assets in each CGU. Given the unique nature of the assets, it is not always possible to obtain comparable fair values to the assets owned by this company and therefore the value in use method is the primary method used by the company for assessing whether the assets in the CGU are impaired. The recoverable amount of each cash generating unit has been determined based on a value in use method which calculates the net present value of the forecast cash flows expected from the CGU. The cash flows are based on the current management forecasts for the following 5 years and a terminal value to account for the cash flows beyond the 5th year. In preparing the impairment models for each CGU the company started with the cash flows from the year ended 30 June 2013 and adjusted that base year for the budgets and plans approved by the Board of Directors.

61 | NOTES TO THE FINANCIAL STATEMENTS
Note 18: Goodwill (continued)
The cash flows in the impairment model have been discounted to present value using a discount rate applicable to each cash flow. The company has used the weighted average cost of capital as a guide to determine the discount rate applied to the cash flows as it is considered the most appropriate discount rate for the risk specific to the assets in the CGU’s. The net present value of the cash flows has been compared to the assets within the CGU which include the goodwill balances above. In the current year, the company applied a pre-tax discount rate of 13.12% p.a. (2012: 13.34% p.a.) to account for the risk associated with the assets in the current financial markets.
Discount Rate
The discount rate was determined after considering an appropriate: Beta; risk free interest rate; incremental cost of borrowing for the company; and the debt /equity ratio. The inputs used in the model have been sourced from industry and financial market reports relevant to the company and the Australian wine industry and have been considered in relation to the company.
Key Assumptions
The other key assumptions used in the value in use calculations are as follows:
• Working capital levels used in future years adjust in line with future sales growth.
• Terminal Growth Rate of 3% (2012 : 3%)
• Pre-tax Weighted Average Cost of Capital/ Discount rate of 13.12% (2012 : 13.34%)
• Cost of debt 8.5% (2012 : 8.5%)
• Levered Beta of 0.85 (2012 : 0.85)
Sensitivity Analysis
The Company has performed sensitivity analysis on the value in use calculation as follows:
The discount rate can be increased by 1.4 percentage points (to 14.5%) before an impairment is recognised.
Reducing revenue growth rates to 0% does not cause the associated goodwill to be impaired.
Reducing the terminal growth rate to 1% does not cause the associated goodwill to be impaired. However, a reduction in the terminal growth rate to 0% would generate an impairment charge of $2.2 million.
The calculations are not very sensitive to exchange rates as the majority of cash flows from the business unit are denominated in Australian dollars.
Management believes that any reasonable possible change in the key assumptions on which recoverable amount or the inputs to the discount rate are based would not cause the carrying amount of the individual cash-generating units to exceed their recoverable amount.
Note 19: Water licences
CONSOLIDATED
2013 2012 $’000 $’000
Permanent water licences – at cost 7,467 8,692
Balance at 1 July 8,692 8,692
Acquired during the year 751 -
Impairment during the year (901) -
Disposed during the year (1,075) -
Balance at 30 June 7,467 8,692
During the year the Group carried out a review of the recoverable amount of water licences. The review led to the recognition of an impairment loss of $901,000, which has been recognised in the profit or loss. The water licneces were subsequently sold at the impaired value.

62 | NOTES TO THE FINANCIAL STATEMENTS
Note 20: Other intangible assets
CONSOLIDATED
2013 2012 $’000 $’000
Brand Names and Registered Trademarks:
Balance at 1 July 5,488 5,488
Balance at 30 June 5,488 5,488
Software:
Balance at 1 July 2,292 2,604
Costs incurred during the year 136 151
Amortisation expense (511) (463)
Balance at 30 June 1,917 2,292
Total other intangible assets 7,405 7,780
Brand names have been assessed as having an indefinite useful life as the assets are integral to the business. Brand names can be managed by another management team and similar assets in the wine industry are commonly defined as having an indefinite useful life.
The impairment of brand names is tested each reporting date and is based on determining the recoverable amount of the cash flows generated by each brand. The cash flows are based on the current management forecasts for the following 5 years and a terminal value to account for the cash flows beyond the 5th year.
Discount Rate
The cash flows have been discounted to present value. In the current year, the company applied a pre-tax discount rate of 19.56% p.a. (2012: 19.5% p.a.) to account for the risk associated with the assets in the current financial markets.
The discount rate was determined after considering an appropriate: Beta; risk free interest rate; incremental cost of borrowing for the company; and the debt / equity ratio. The inputs used in the model have been sourced from industry and financial market reports relevant to the company and the Australian wine industry and have been considered in relation to the company.
Key Assumptions
The key assumptions used in the value in use calculations are as follows:
• Terminal Growth Rate of 3% (2012 : 3%)
• Pre-tax Weighted Average Cost of Capital / Discount rate of 19.56% (2012 : 19.5%)
• Cost of debt 9% (2012 : 9%)
• Levered Beta of 1.19 (2012 : 1.08)
• Revenue growth rate of 3% (2012 : 3%)
No impairment charges relating to brands were recorded as the cash flows continued to support the carrying values of these brands.
Sensitivity Analysis
The Company has performed sensitivity analysis on the brand names valuation models as follows:
• Reducing revenue growth rates to 0% does not cause the brand names to be impaired.
• Reducing the terminal growth rate to 0% does not cause the brand names to be impaired.
Management believes that any reasonable possible change in the key assumptions on which recoverable amount or the inputs to the discount rate are based would not cause the carrying amount of the brand names to exceed their recoverable amount.

63 | NOTES TO THE FINANCIAL STATEMENTS
Note 21: Assets pledged as security
In accordance with the security arrangements of liabilities, as disclosed in notes 23 and 27 to the financial statements, the majority of tangible assets of the Group have been covered by a first registered fixed and floating charge to the lending institutions, with the exception of assets under hire purchase arrangements. The following assets have been pledged as security:
CONSOLIDATED
2013 2012 $’000 $’000
Inventory 172,234 152,502
Receivables 35,613 39,546
Property, plant and equipment (including Biological Assets) 126,355 128,782
334,202 320,830
The holder of the security does not have the right to sell or re-pledge the assets other than in an event of default. Assets under finance lease are pledged as security.
Note 22: Current trade and other payables
Trade payables(i) 23,595 26,580
Goods and services tax payable 996 597
Value added tax payable 297 472
Other accounts payable and accruals 8,131 9,269
33,019 36,918
(i) The average credit period on purchase of goods is 34 days (2012: 34 days); no interest is charged on trade payables. The Group has financial risk management policies in place to ensure that all payables are paid within the credit timeframe.
Note 23: Current borrowings
At amortised cost:
Finance lease liabilities - secured (i) 2,305 1,993
2,305 1,993
(i) Secured by assets subject to the finance lease.
Note 24: Other current financial liabilities
Hedge liabilities – foreign exchange contracts 1,073 -
Interest rate swap 486 1,618
1,559 1,618
Note 25: Current provisions
Directors retirement benefit (note 30) 149 149
Onerous contracts (note 30) 2,045 3,849
Employee entitlements (i) 3,867 4,018
6,061 8,016
(i) The current provision for employee entitlements includes $3,180,735 (2012 : $3,909,599) of annual leave and vested long service leave entitlements.
Note 26: Other current liabilities
Income in advance 48 42
48 42

64 | NOTES TO THE FINANCIAL STATEMENTS
Note 27: Non-current borrowings
CONSOLIDATED
2013 2012 $’000 $’000
Secured - at amortised cost:
Commercial Bills (i) (note 42(b)) 135,700 122,000
Accrued interest 813 -
Prepaid interest - (512)
136,513 121,488
Finance lease liabilities (ii) 4,235 5,841
140,748 127,329
(i) Commercial bills with a variable interest rate were issued in 2013. The current weighted average interest rate on the bills is 7.73% (2012: 8.12%). The bank overdraft and commercial bills are subject to fixed and floating charges over the majority of the Group’s assets (refer note 21).
(ii) Secured by assets subject to the finance lease.
Note 28: Non-current other financial liabilities
Interest rate swap 430 751
430 751
Note 29: Non-current provisions
Employee entitlements 1,030 817
Onerous contracts (note 30) 6,945 11,969
7,975 12,786
Note 30: Provisions
CONSOLIDATED
$’000 $’000 Onerous Directors Contracts (i) Retirement Benefit (ii)
Balance at 30 June 2012 15,818 149
Reductions arising from payments/other sacrifices of future economic benefits (3,418) -
Unwinding of discount and effect of changes in the discount rate 990 -
Reductions resulting from re-measurement, contract re-negotiation or settlement without cost (4,400) -
Balance at 30 June 2013 8,990 149
(i) The provision for onerous contracts represents the present value of the future grape payment that the Group is presently obligated to make in respect of onerous grape purchase contracts under non-cancellable grape agreements, less the estimate of the market value of the grapes. The estimate may vary as a result of changes in the market.
(ii) The provision for Directors’ Retirement represents the present value of the directors’ best estimate of the costs likely to be incurred as a result of either termination or retirement of directors.
30.1 Defined Contribution plans
The total expense recognised in the statement of comprehensive income of $2,595,000 (2012: $2,608,000) represents contributions payable to these plans by the Group at rates specified in the rules of the plans. As at 30 June 2013, contributions of $111,964 (2012: $108,521) due in respect of the reporting period had not been paid over to the plans. The amounts were paid in July 2013.

65 | NOTES TO THE FINANCIAL STATEMENTS
Note 31: Foreign currency balances
The following table details the forward foreign currency contracts outstanding as at 30 June 2013:
CURRENCY EXCHANGE RATE FOREIGN CONTRACT VALUE FAIR VALUE CURRENCY AUD $’000 AUD $’000 FC ‘000
Forward Contracts:
Sell GB Pounds 0.6427 2,000 3,175 (75)
Sell GB Pounds 0.6125 1,000 1,632 632
Buy GB Pounds 0.5894 1,000 1,696 (696)
Sell GB Pounds 0.6620 2,000 3,022 1,022
Buy GB Pounds 0.5856 2,000 3,415 (1,412)
Sell Euro 0.8115 750 949 (31)
Sell Euro 0.6865 500 728 228
Buy Euro 0.6826 500 732 (232)
Sell Euro 0.7373 400 545 145
Buy Euro 0.6491 400 615 (215)
Cap / Collar Contracts:
Sell GB Pounds 0.5635 – 0.6300 2,000 3,549 (6)
Sell GB Pounds 0.5780 – 0.7000 6,000 10,380 (306)
Sell Euro 0.7030 – 0.7800 750 1,067 (30)
Sell Euro 0.7055 – 0.8600 1,200 1,701 (97)
The following table details the forward foreign currency contracts outstanding as at 30th June 2012: CURRENCY EXCHANGE RATE FOREIGN CONTRACT VALUE FAIR VALUE
CURRENCY AUD $’000 AUD $’000 FC ‘000
Forward Contracts:
Sell GB Pounds 0.6192 2,200 3,583 131
Sell GB Pounds 0.6283 2,200 3,501 77
Sell GB Pounds 0.6235 3,000 4,811 170
Sell GB Pounds 0.6064 5,000 8,245 220
Sell GB Pounds 0.6000 4,900 8,166 326
Sell GB Pounds 0.6300 2,000 3,175 38
Sell GB Pounds 0.6427 2,500 3,890 149
Sell Euro 0.7900 1,000 1,432 10
Sell Euro 0.7099 2,700 3,803 378
Cap / Collar Contracts:
Sell GB Pounds 0.5635 – 0.6300 2,000 3,362 93
Sell GB Pounds 0.6100 – 0.6600 8,000 12,618 184
Sell GB Pounds 0.6060 – 0.6600 4,700 7,486 28
Sell Euro 0.7030 – 0.7800 1,000 1,432 10
Sell Euro 0.7450 – 0.8300 450 571 1

66 | NOTES TO THE FINANCIAL STATEMENTS
Note 32: Issued capital
CONSOLIDATED
2013 2012 $’000 $’000
132,720,637 Fully paid ordinary shares (2012: 131,993,692) 403,155 402,792
CONSOLIDATED
2013 2013 2012 2012 Number $’000 Number $’000
Fully paid ordinary share capital
Beginning of financial year 131,993,692 402,792 128,580,317 401,831
Issued during the year
Shares issued under dividend re-investment plan 726,945 363 3,413,375 961
End of financial year 132,720,637 403,155 131,993,692 402,792
Changes to the Corporations Act 2001 abolished the authorised capital and par value concept in relation to share capital from 1 July 1998. Therefore, the company does not have a limited amount of authorised capital and issued shares do not have a par value.
All fully paid ordinary shares carry one vote per share and carry the right to dividends.
Share options
Details of share options granted and on issue are disclosed in note 8.
Share options or performance rights carry no rights to dividends and no voting rights.
Note 33: Reserves
CONSOLIDATED
2013 2012 $’000 $’000
Employee equity-settled benefits (i) 1,578 1,497
Hedging reserve (ii) (948) (865)
Foreign currency translation reserve (iii) 40 9
670 641
(i) The employee equity-settled benefits reserve arises on the granting of shares and share options to directors and employees. The fair value of share based payments provided to directors and employees of the company are recorded within the reserve account and amounts are released into issued capital as options are exercised. Further details on share based payments are made in note 8.
(ii) The hedging reserve represents hedging gains and losses recognised on the effective portion of cash flow hedges. The cumulative deferred gain or loss on the hedge is recognised in the profit and loss when the hedge transaction impacts the profit or loss, or is included as a basis adjustment to the non- financial hedged item, consistent with the applicable accounting policy.
(iii) The foreign currency translation reserve contains exchange differences relating to the translation from the functional currencies of the Group’s foreign controlled entities into Australian dollars.
Movements in reserves balances are disclosed in the Statement of Changes in Equity.
Note 34: Accumulated losses
Balance at beginning of financial year (166,564) (170,417)
Net profit 7,070 7,067
Dividends paid (3,432) (3,214)
End of financial year (162,926) (166,564)

67 | NOTES TO THE FINANCIAL STATEMENTS
Note 35: Earnings per share
CONSOLIDATED
2013 2012 Cents Cents Per Share Per Share
Basic earnings per share 5.3 5.4
Diluted earnings per share 5.3 5.4
Basic earnings per share:
The earnings and weighted average numbers of ordinary shares used in the calculation of basic earnings per share are as follows: $’000 $’000
Profit for the year 7,070 7,067
2013 2012 ’000 ’000 Number Number of Shares of Shares
Basic earnings per share
Weighted average number of ordinary shares used in calculating basic earnings per share (i) 132,438 131,037
Dilutive earnings per share
Weighted average number of ordinary shares used in calculating diluted earnings per share (i) 132,438 131,037
(i) The basic and diluted EPS are the same.
Note 36: Dividends
2013 2012
Cents Total Cents Total Per Share $’000 Per Share $’000
Fully paid ordinary shares: - - - -Interim dividend – franked to 30% 2.6 3,432 2.6 3,214Final dividend – franked to 30% 2.6 3,432 2.6 3,214
Adjusted franking account balance 12,588 14,059
In respect of the financial year ended 30 June 2013, a fully franked final dividend of 2.6 cents per share was declared on 23rd August 2013 and will be paid on 18th November 2013. In respect of the financial year ended 30 June 2012, a final dividend of 2.6 cents per share was declared on 22nd August 2012 and was paid on 19th November 2012. There are no income tax consequences of unrecognised dividends.

68 | NOTES TO THE FINANCIAL STATEMENTS
Note 37: Leases and other commitments
(a) Non-cancellable operating leases
The Group leases the following assets under normal economic terms. All operating lease contracts contain market review clauses in the event the Group exercises its option to renew.
– Vineyards
– Winery equipment
Operating leases relate to leases of plant and equipment with lease terms of between 3 and 7 years.
The following sets out payments recognised as an expense
CONSOLIDATED
2013 2012 $’000 $’000
Minimum lease payments 82,534 15,143
The following sets out the commitments to future lease payments relating to operating leases:
– not longer than 1 year 11,219 15,352
– longer than 1 year and not longer than 5 years 38,930 42,758
– longer than 5 years 32,385 -
82,534 58,110
In respect of non cancellable operating leases the following liabilities have been recognised:
Current 171 2,179
Non Current 2,131 6,582
2,302 8,761
(b) Finance leasesFinance leases relate to plant and equipment with a lease term of up to 5 years, expiring between 30 June 2013 and March 2018.
MINIMUM FUTURE PRESENT VALUE OF MINIMUM LEASE PAYMENTS FUTURE LEASE PAYMENTS CONSOLIDATED CONSOLIDATED
2013 2012 2013 2012 $’000 $’000 $’000 $’000
No Later than 1 year 2,820 2,638 2,336 1,993 Later than 1 year and not later than 5 years 4,637 6,595 4,204 5,841 Minimum lease payments* 7,457 9,233 6,540 7,834 Less future finance changes (917) (1,399) - - Present value of minimum lease payments 6,540 7,834 6,540 7,834 Current borrowings (note 23) 2,305 1,993 Non-Current borrowings (note 27) 4,235 5,841 6,540 7,834
* Minimum lease payments include the aggregate of all lease payments and any guaranteed residual.
(c) Capital expenditure commitments
CONSOLIDATED
2013 2012 $’000 $’000
Property, Plant and Equipment – not longer than 1 year 83 33 83 33
Note 38: Contingent liabilities
There are no material contingent liabilities the company is aware of as at the date of this report.
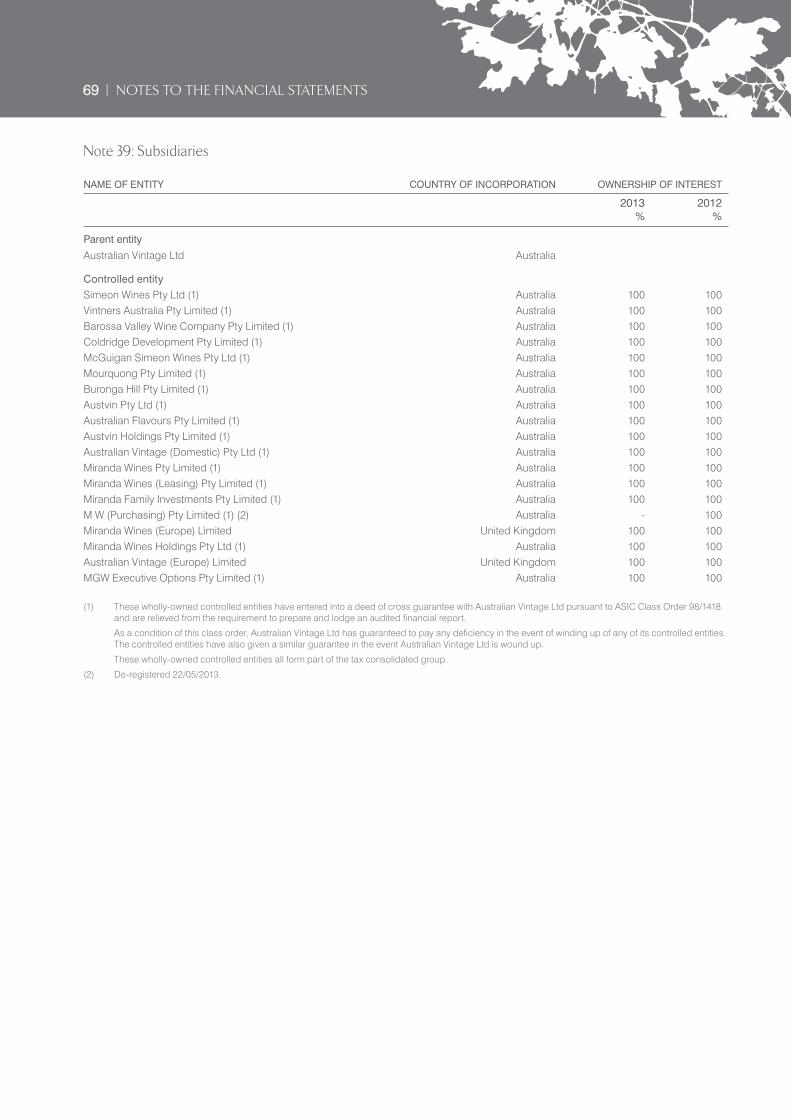
69 | NOTES TO THE FINANCIAL STATEMENTS
Note 39: Subsidiaries
NAME OF ENTITY COUNTRY OF INCORPORATION OWNERSHIP OF INTEREST
2013 2012 % %
Parent entity
Australian Vintage Ltd Australia
Controlled entitySimeon Wines Pty Ltd (1) Australia 100 100Vintners Australia Pty Limited (1) Australia 100 100Barossa Valley Wine Company Pty Limited (1) Australia 100 100Coldridge Development Pty Limited (1) Australia 100 100McGuigan Simeon Wines Pty Ltd (1) Australia 100 100Mourquong Pty Limited (1) Australia 100 100Buronga Hill Pty Limited (1) Australia 100 100Austvin Pty Ltd (1) Australia 100 100Australian Flavours Pty Limited (1) Australia 100 100Austvin Holdings Pty Limited (1) Australia 100 100Australian Vintage (Domestic) Pty Ltd (1) Australia 100 100Miranda Wines Pty Limited (1) Australia 100 100Miranda Wines (Leasing) Pty Limited (1) Australia 100 100Miranda Family Investments Pty Limited (1) Australia 100 100M W (Purchasing) Pty Limited (1) (2) Australia - 100Miranda Wines (Europe) Limited United Kingdom 100 100Miranda Wines Holdings Pty Ltd (1) Australia 100 100Australian Vintage (Europe) Limited United Kingdom 100 100MGW Executive Options Pty Limited (1) Australia 100 100
(1) These wholly-owned controlled entities have entered into a deed of cross guarantee with Australian Vintage Ltd pursuant to ASIC Class Order 98/1418 and are relieved from the requirement to prepare and lodge an audited financial report.
As a condition of this class order, Australian Vintage Ltd has guaranteed to pay any deficiency in the event of winding up of any of its controlled entities. The controlled entities have also given a similar guarantee in the event Australian Vintage Ltd is wound up.
These wholly-owned controlled entities all form part of the tax consolidated group.
(2) De-registered 22/05/2013.

70 | NOTES TO THE FINANCIAL STATEMENTS
Note 39: Subsidiaries (continued)
The consolidated statement of comprehensive income and consolidated statement of financial position of the entities party to the deed of cross guarantee are:
Consolidated Statement of Comprehensive Income – Closed Group For the financial year ended 30 June 2013
CONSOLIDATED
2013 2012 $’000 $’000
Revenue 208,549 227,962
Cost of sales (151,380) (165,633)
Gross Profit 57,169 62,329
Fair value of grapes picked during the financial year less estimated costs to sell 3,171 967
Investment income 403 458
Other gains and losses 1,818 1,425
Impairment of water licences (901) -
Distribution expenses (10,856) (12,269)
Gain on provision for onerous contracts 4,223 -
Sales and marketing expenses (23,646) (22,349)
Administration expenses (6,531) (6,271)
Gain / (Loss) on foreign exchange (459) (601)
Finance costs – interest paid (12,920) (12,835)
Finance costs – interest un-wind (990) (1,916)
Profit before income tax 10,481 8,938
Income tax expense (3,411) (1,871)
Net profit for the year 7,070 7,067
Other comprehensive income / (loss) net of income tax:
Loss on interest rate swaps 1,453 (1,716)
Valuation of foreign exchange hedges (1,571) 6
Exchange differences arising on translation of foreign operations 45 34
Income tax relating to components of other comprehensive income 21 503
Other comprehensive income / (loss) for the year, net of income tax (52) (1,173)
Total comprehensive income for the year 7,018 5,894

71 | NOTES TO THE FINANCIAL STATEMENTS
Note 39: Subsidiaries (continued)
Consolidated Statement of Financial Position – Closed Group As at 30 June 2013
CONSOLIDATED
2013 2012 $’000 $’000
Current Assets
Cash and cash equivalents 703 -
Trade and other receivables 35,613 39,546
Inventories 151,376 130,624
Current tax assets 49 200
Other 3,906 4,310
Total Current Assets 191,647 174,680
Non-Current Assets
Trade and other receivables - 1,843
Inventories 20,858 21,878
Other financial assets 59 59
Biological assets 33,184 33,169
Property, plant and equipment 93,171 95,613
Goodwill 37,685 37,685
Other intangible assets 7,405 7,780
Water Licences 7,467 8,692
Deferred tax assets 52,288 55,123
Total Non-Current Assets 252,117 261,842
Total Assets 443,764 436,522
Current Liabilities
Trade and other payables 33,004 36,921
Borrowings 2,305 1,993
Other financial liabilities 1,901 1,618
Provisions 6,061 8,016
Other 48 42
Total Current Liabilities 43,319 48,590
Non-Current Liabilities
Borrowings 140,748 127,329
Deferred tax liabilities 10,773 10,232
Other financial liabilities 88 751
Provisions 7,975 12,786
Total Non-Current Liabilities 159,584 151,098
Total Liabilities 202,903 199,688
Net Assets 240,861 236,834
Equity
Issued capital 403,066 402,703
Reserves 693 667
Accumulated losses (162,898) (166,536)
Total Equity 240,861 236,834

72 | NOTES TO THE FINANCIAL STATEMENTS
Note 40: Segment information
The Company’s reportable segments are as follows:
Australia / North America Packaged– supplies packaged wine within Australia, New Zealand, Asia and North America through retail and wholesale channels.
UK / Europe– supplies packaged and bulk wine in the United Kingdom and Europe through retail and distributer channels.
Cellar Door – supplies wine direct to the consumer through regional outlets.
Australasia / North America bulk wine and processing– supplies bulk wine, concentrate and winery processing services throughout Australia, New Zealand, Asia and North America.
Vineyards– provides vineyard management and maintenance services within Australia and includes biological assets income.
The revenue reported represents revenue generated from external customers.
The accounting policies of the reportable segments are the same as the Group’s accounting policies described in note 3. Segment revenue represents revenue generated from external customers. There were no inter-segment sales in the current year (2012 : Nil).
Segment profit represents the profit earned by each segment without allocation of share of profits of associates, investment and interest revenue, gain on onerous contracts, impairment of water licences, finance costs and income tax expense. This is the measure reported to the chief operating decision maker for the purposes of resource allocation and assessment of segment performance.
The following is an analysis of the group’s revenue and results by reportable operating segment for the period under review:
Segments
Segments Revenue, Results and other segmental information
REVENUE REVENUE RESULTS RESULTS ACQUISITION OF DEPN. & AMORT. OF SEGMENT ASSETS SEGMENT ASSETS
2013 2012 2013 2012 2013 2012 2013 2012 $’000 $’000 $’000 $’000 $’000 $’000 $’000 $’000
Australasia / North America packaged 79,903 79,371 5,214 6,353 1,171 1,237 2,198 1,848
UK / Europe 88,847 97,302 3,350 7,098 1,403 1,576 2,633 2,514
Cellar door 6,843 6,913 708 885 46 207 123 118
Australasia / North America bulk wine and processing 29,524 40,550 8,000 7,562 1,970 1,894 594 1,118
Vineyards 3,432 3,826 3,485 1,466 480 250 806 790
Unallocated - - - - 17 142 716 639
Total 208,549 227,962 20,757 23,364 5,087 5,306 7,070 7,027
Finance costs – interest paid (12,920) (12,835)
Finance costs – interest un-wind (990) (1,916)
Impairment of water licences (901) -
Gain on provision for onerous contracts 4,223 -
Interest received 312 325
Profit before tax 10,481 8,938

73 | NOTES TO THE FINANCIAL STATEMENTS
Note 40: Segment information (continued)
Geographical Segments
REVENUE FROM SEGMENT NON-CURRENT CUSTOMERS ASSETS (a)
2013 2012 2013 2012 $’000 $’000 $’000 $’000
Australia 99,091 99,423 199,771 206,660
UK / Europe 88,847 97,302 - -
North America 7,926 18,137 - -
Other 12,685 13,100 - -
208,549 227,962 199,771 206,660
The group has sales to three major customers who individually account for greater than 10% of annual sales. The total sales for these customers were $96.4M (2012: $105.6M). Of these sales, $61.0M (2012: $71.3M) is included within the UK / Europe division and $35.4M (2012: $34.3M) is included within the Australasia / North America Packaged division.(a) Geographical segment non-current assets exclude financial instruments and deferred tax assets.
Note 41: Related party transactions
Balances and transactions between the Company and its subsidiaries, which are related parties of the Company are eliminated on consolidation and are not disclosed in this note. Details of transactions between the Group and other related parties are disclosed below.
(a) Equity interests in related parties
Details of the percentage of ordinary shares held in controlled entities are disclosed in note 39 to the financial statements.
(b) Key management personnel remuneration
Details of key management personnel compensation are disclosed in note 7 to the financial statements.
(c) Key management personnel equity holdings
Fully paid ordinary shares issued by Australian Vintage Ltd and held by key management personnel are as follows:
GRANTED AS RECEIVED ON BALANCE HELD BALANCE @ REMUNERATION EXERCISE OF NET OTHER BALANCE @ NOMINALLY2013 1/7/12 No. No. OPTIONS No. CHANGE No. 30/6/13 No. No.
Ian D Ferrier 618,044 - - 32,115 650,159 -
Brian J McGuigan 308,670 - - - 308,670 -
Perry R Gunner 265,670 - - - 265,670 -
Neil McGuigan 150,000 - - - 150,000 -
Michael Noack 2,043 - - - 2,043 -
Flora Saris 30,000 - - - 30,000 -
1,374,427 - - 32,115 1,406,542 -
GRANTED AS RECEIVED ON BALANCE HELD BALANCE @ REMUNERATION EXERCISE OF NET OTHER BALANCE @ NOMINALLY2012 1/7/11 No. No. OPTIONS No. CHANGE No. 30/6/12 No. No.
Ian D Ferrier 567,631 - - 50,413 618,044 -
Brian J McGuigan 308,670 - - - 308,670 -
Perry R Gunner 269,420 - - (3,750) 265,670 -
Neil McGuigan 150,000 - - - 150,000 -
Michael Noack 1,875 - - 168 2,043 -
Flora Saris - - - 30,000 30,000 -
1,297,596 - - 76,831 1,374,427 -
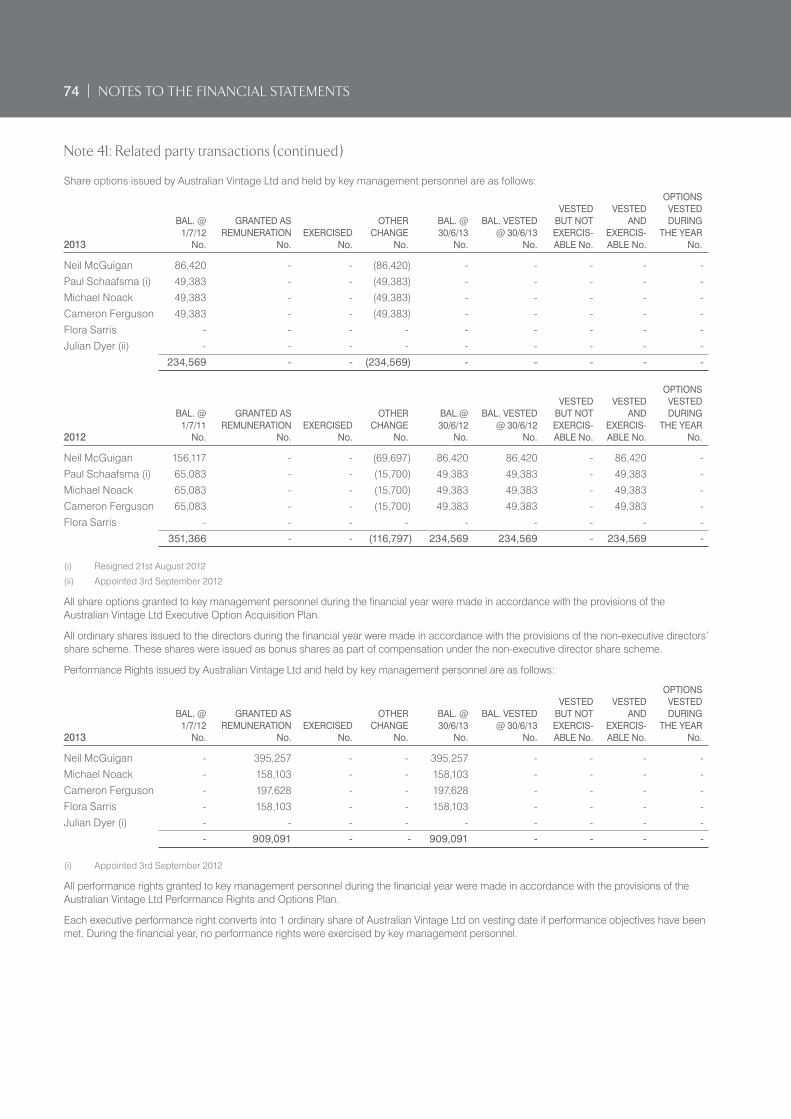
74 | NOTES TO THE FINANCIAL STATEMENTS
Note 41: Related party transactions (continued)
Share options issued by Australian Vintage Ltd and held by key management personnel are as follows: OPTIONS VESTED VESTED VESTED BAL. @ GRANTED AS OTHER BAL. @ BAL. VESTED BUT NOT AND DURING 1/7/12 REMUNERATION EXERCISED CHANGE 30/6/13 @ 30/6/13 EXERCIS- EXERCIS- THE YEAR 2013 No. No. No. No. No. No. ABLE No. ABLE No. No.
Neil McGuigan 86,420 - - (86,420) - - - - -
Paul Schaafsma (i) 49,383 - - (49,383) - - - - -
Michael Noack 49,383 - - (49,383) - - - - -
Cameron Ferguson 49,383 - - (49,383) - - - - -
Flora Sarris - - - - - - - - -
Julian Dyer (ii) - - - - - - - - -
234,569 - - (234,569) - - - - -
OPTIONS VESTED VESTED VESTED BAL. @ GRANTED AS OTHER BAL.@ BAL. VESTED BUT NOT AND DURING 1/7/11 REMUNERATION EXERCISED CHANGE 30/6/12 @ 30/6/12 EXERCIS- EXERCIS- THE YEAR 2012 No. No. No. No. No. No. ABLE No. ABLE No. No.
Neil McGuigan 156,117 - - (69,697) 86,420 86,420 - 86,420 -
Paul Schaafsma (i) 65,083 - - (15,700) 49,383 49,383 - 49,383 -
Michael Noack 65,083 - - (15,700) 49,383 49,383 - 49,383 -
Cameron Ferguson 65,083 - - (15,700) 49,383 49,383 - 49,383 -
Flora Sarris - - - - - - - - -
351,366 - - (116,797) 234,569 234,569 - 234,569 -
(i) Resigned 21st August 2012
(ii) Appointed 3rd September 2012
All share options granted to key management personnel during the financial year were made in accordance with the provisions of the Australian Vintage Ltd Executive Option Acquisition Plan.
All ordinary shares issued to the directors during the financial year were made in accordance with the provisions of the non-executive directors’ share scheme. These shares were issued as bonus shares as part of compensation under the non-executive director share scheme.
Performance Rights issued by Australian Vintage Ltd and held by key management personnel are as follows:
OPTIONS VESTED VESTED VESTED BAL. @ GRANTED AS OTHER BAL. @ BAL. VESTED BUT NOT AND DURING 1/7/12 REMUNERATION EXERCISED CHANGE 30/6/13 @ 30/6/13 EXERCIS- EXERCIS- THE YEAR 2013 No. No. No. No. No. No. ABLE No. ABLE No. No.
Neil McGuigan - 395,257 - - 395,257 - - - -
Michael Noack - 158,103 - - 158,103 - - - -
Cameron Ferguson - 197,628 - - 197,628 - - - -
Flora Sarris - 158,103 - - 158,103 - - - -
Julian Dyer (i) - - - - - - - - -
- 909,091 - - 909,091 - - - -
(i) Appointed 3rd September 2012
All performance rights granted to key management personnel during the financial year were made in accordance with the provisions of the Australian Vintage Ltd Performance Rights and Options Plan.
Each executive performance right converts into 1 ordinary share of Australian Vintage Ltd on vesting date if performance objectives have been met. During the financial year, no performance rights were exercised by key management personnel.

75 | NOTES TO THE FINANCIAL STATEMENTS
Note 41: Related party transactions (continued)
(d) Other transactions with key management personnel
2013 2012 $ $
Consolidated revenue includes the following amounts arising from transactions with key management personnel of the Group or their related parties:
Revenue 66,137 204,802
Consolidated profit includes the following expenses arising with key management personnel of the Group or their related parties:
Cost of goods sold 492,572 731,842
Total assets arising from transactions other than loans and amounts receivable in relation to equity instruments with key management personnel:
Current - -
Allowance for doubtful receivables - -
Non-current - -
- -
(i) During the year the company entered into the following transactions with entities associated with Brian McGuigan:
(a) The company purchased grapes from Australian Horticultural Management Pty Limited (“AHM”) to the value of $142,430 (2012: $90,298) on normal commercial terms. A balance of $94,696 (2012: $60,040) is owed by the company at 30 June 2013.
(b) In the prior year, the company purchased bulk wine from AHM to the value of $301,144 (2013: Nil) on normal commercial terms. A balance of $25,988 (2013 : Nil) was owed by the company at 30 June 2012.
(c) The company sold bottled wine to AHM to the value of $20,975 (2012: $91,462) on normal commercial terms.
(d) The company sold bulk wine to AHM to the value of $16,498 (2012 : Nil) on normal commercial terms.
(e) The company sold bottled wine to Premier Wines 4 Pty Ltd to the value of $10,356 (2012: $18,260) on commercial terms. No balance (2012: $4,129) is owed to the company at 30 June 2013.
(f) McGuigan Nominees Pty Ltd holds a minority interest in an entity which received $284,385 (2012: $275,351) from the company for fruit, paid $15,614 (2012: $20,013) to the company for the contract processing of fruit to wine and received $65,757 (2012 : $67,049) from the company for the sale of bulk wine. All transactions were on the same terms and conditions as other investors in that project.
(ii) During the year the company entered into the following transactions with Woodnibs Pty Ltd (an entity associated with Neil McGuigan):
(a) In the prior year, the company sold bulk wine the value of $35,548 (2013 : Nil) on normal commercial terms.
(b) The company sold concentrate to the value of $2,694 (2012 : $10,743) on normal commercial rates.
(e) Parent Entity
The ultimate parent company in the wholly-owned group is Australian Vintage Ltd.
Note 42: Notes to the cash flow statement
(a) Reconciliation of cash
For the purposes of the cash flow statement, cash and cash equivalents includes cash on hand and in banks and investments in money market instruments, net of outstanding bank overdrafts. Cash and cash equivalents at the end of the financial year as shown in the cash flow statement is reconciled to the related items in the balance sheet as follows:
CONSOLIDATED
2013 2012 $’000 $’000
Cash 995 237

76 | NOTES TO THE FINANCIAL STATEMENTS
Note 42: Notes to the cash flow statement (continued)
(b) Financing Facilities
CONSOLIDATED
2013 2012 $’000 $’000
Unsecured bank overdraft facility, reviewed annually and payable at call: Amount Used - 912 Amount Unused 5,000 4,088 5,000 5,000 Reducing lease facility: Amount Used 5,841 7,838 Amount Unused - - 5,841 7,838 Unsecured revolving lease facility: Amount Used - - Amount Unused 250 2,000
250 2,000 Bank Guarantee / Surrender facility: Amount Used 1,351 2,626 Amount Unused 1,399 8,374
2,750 11,000 Corporate purchasing card facility: Amount Used 216 154 Amount Unused 284 346
500 500 Cash advance facility: Amount Used 135,700 122,000 Amount Unused 12,000 21,600 147,700 143,600 Total facility 162,041 169,938
(c) Non-cash financing and investing activities / businesses acquiredDuring the financial year the company issued 726,945 (2012 : 3,413,375) ordinary shares for $363,000 (2012 : $961,000) under the Dividend Reinvestment Plan. There were no other movements in ordinary share capital or issued capital in the current or prior period.
(d) Reconciliation of profit / (loss) for the period to net cash flows from operating activities
Profit from ordinary activities after income tax 7,070 7,067 Depreciation and amortisation of non-current assets 7,070 7,027 Loss / (Profit) on sale of non-current assets 32 (218) Bad and doubtful debts (181) (106) Interest on finance leases 661 817 Share option costs expensed 81 - Impairment of water licences 901 - Changes in net assets and liabilities, net of effects from acquisition and disposal of businesses (Increase) / decrease in assets Trade and other receivables 4,115 4,396 Inventories (19,732) 7,087 Other current assets 589 (1,608) Prepaid interest 1,325 (1,274) Deferred tax assets 2,835 3,370 Other non-current assets - 5 Increase / (decrease) in liabilities Current trade and other payables (3,899) (4,515) Provisions (5,748) (9,266) Deferred tax liabilities 541 (2,012) Other 6 (180) Net cash provided by / (used in) operating activities (4,334) 10,590

77 | NOTES TO THE FINANCIAL STATEMENTS
Note 43: Financial instruments
(a) Capital risk management
The Group manages its capital to ensure that entities in the Group will be able to continue as a going concern while maximising the return to stakeholders through the optimisation of the debt and equity balance. The group’s general strategy remains unchanged from 2012.
The capital structure of the Group consists of debt, which includes the borrowings disclosed in notes 23 and 27, cash and cash equivalents and equity attributable to equity holders of the parent, comprising issued capital, reserves and accumulated losses as disclosed in notes 32, 33 and 35 respectively. The Group operates primarily through distributor relationships established in the markets in which the Group trades. None of the Group’s entities are subject to externally imposed capital requirements.
Operating cash flows are used to maintain and expand the group’s assets, as well as to make the routine outflows of tax, dividends and repayment of maturing debt. The Group’s policy is to borrow centrally to meet anticipated future funding requirements.
Gearing ratio
The Board reviews the capital structure on an annual basis. As a part of this review the Board considers the cost of capital and the risks associated with each class of capital. The Group has a target gearing ratio of 40% in line with the industry norm, that is determined as the proportion of net debt to equity.
The company has not classified any assets as held for sale in the current period (2012 : Nil). Based on recommendations of the Board, the Group will balance its overall capital structure through the payment of dividends, new share issues and share buy-backs as well as the issue of new debt or the redemption of existing debt.
The gearing ratio at year end was as follows:
CONSOLIDATED
2013 2012 $’000 $’000
Financial assets
Debt (i) 143,053 129,322
Cash and cash equivalents (net of bank overdraft) (995) (237)
Net Debt 142,058 129,085
Equity (ii) 240,899 236,689
Net debt to equity ratio 59% 55%
(i) Debt is defined as long- and short-term borrowings, as detailed in notes 23 and 27.
(ii) Equity includes all capital and reserves.
The Group is also subject to bank covenants with its primary financier as follows:
– Equity must be above $210 million.
– Gross profit and earnings before interest and tax must exceed pre-defined levels.
Significant accounting policies
Details of the significant accounting policies and methods adopted (including the criteria for recognition, the bases of measurement, and the bases for recognition of income and expenses) for each class of financial asset, financial liability and equity instrument are disclosed in note 3.
(b) Categories of financial instruments
Financial assets
Available for sale 59 59
Loans and receivables 35,613 41,201
Cash and cash equivalents 995 237
Derivative instruments in designated hedge accounting relationships - 1,469
Financial liabilities
Derivative instruments in designated hedge accounting relationships 1,989 2,369
Amortised cost 175,259 166,752
At the reporting date there are no significant concentrations of credit risk relating to loans and receivables at fair value through profit or loss.
The carrying amount reflected above represents the company’s and the Groups maximum exposure to credit risk for such loans and receivables.

78 | NOTES TO THE FINANCIAL STATEMENTS
Note 43: Financial instruments (continued)
(c) Financial risk management objectives
The Group’s Corporate Treasury function provides services to the business, co-ordinates access to domestic and international financial markets, monitors and manages the financial risks relating to the operations of the Group through internal risk reports which analyses exposures by degree and magnitude of risks. These risks include market risk (including currency risk, fair value interest rate risk and price risk), credit risk, liquidity risk and cash flow interest rate risk.
The Group seeks to minimise the effects of these risks, by using derivative financial instruments to hedge these risk exposures. The use of financial derivatives is governed by the Group’s policies approved by the board of directors, which provide principles on foreign exchange risk, interest rate risk, credit risk, the use of financial derivatives and non-derivative financial instruments, and the investment of excess liquidity. Compliance with policies and exposure limits is reviewed on a continuous basis. The Group does not enter into or trade financial instruments, including derivative financial instruments, for speculative purposes.
(d) Market risk
The Group’s activities expose it primarily to the financial risks of changes in foreign currency exchange rates (refer note 31) and interest rates (refer note 43 (f)). The Group enters into a variety of derivative financial instruments to manage its exposure to interest rate and foreign currency risk, including:
• foreign exchange forward contracts to hedge the exchange rate risk arising on the export of wine to the United States, Europe and United Kingdom; and
• interest rate swaps to mitigate the risk of rising interest rates.
There has been no change to the Group’s exposure to market risks or the manner in which it manages and measures the risk from the previous period.
(e) Foreign currency risk management
The Group undertakes certain transactions denominated in foreign currencies, hence exposures to exchange rate fluctuations arise. Exchange rate exposures are managed within approved policy parameters utilising forward foreign exchange contracts.
The carrying amount of the Group’s foreign currency denominated monetary assets and monetary liabilities at the reporting date are as follows:
LIABILITIES ASSETS
2013 2012 2013 2012 $’000 $’000 $’000 $’000
US dollars 92 72 88 11
GB pounds 1,105 2,624 4,135 8,348
Euro - - 693 442
Canadian Dollars - - 757 725
Foreign currency sensitivity analysis
The Group is exposed to US dollars (USD), GB pounds, EURO’s and Canadian Dollars.
The following table details the Group’s sensitivity to a 10% increase and decrease in the Australian Dollar against the relevant foreign currencies.
10% is the sensitivity rate used when reporting foreign currency risk internally to key management and represents management’s assessment of the reasonably possible change in foreign exchange rates. The sensitivity analysis includes only outstanding foreign currency denominated monetary items and adjusts their translation at the period end for a 10% change in foreign currency rates.
The sensitivity analysis includes external loans as well as loans to foreign operations within the Group where the denomination of the loan is in a currency other than the currency of the lender or the borrower. A positive number indicates an increase in profit or loss and other equity where the Australian Dollar weakens 10% against the relevant currency. For a 10% strengthening of the Australian dollar against the currency, there would be a comparable impact on the profit or equity and the balances below would be negative.

79 | NOTES TO THE FINANCIAL STATEMENTS
Note 43: Financial instruments (continued)
For a weakening or strengthening of the Australian Dollar against the respective currency, the impact on the net profit would be as follows:
CONSOLIDATED
2013 2012 $’000 $’000
Increase (Deterioration) in foreign exchange rate by 10% Profit or loss – GBP Impact (192) (364) Profit or loss – USD Impact 6 4 Profit or loss – EURO Impact (47) (28) Profit or loss – CAD Impact (48) (46) Decrease (Improvement) in foreign exchange rate by 10% Profit or loss – GBP Impact 236 445 Profit or loss – USD Impact (7) (5) Profit or loss – EURO Impact 58 34 Profit or loss – CAD Impact 59 56
Forward foreign exchange contracts – note 31
It is the policy of the Group to enter into forward foreign exchange contracts to cover specific foreign currency payments. The Group also enters into forward foreign exchange contracts to manage the risk associated with anticipated sales and purchase transactions out 12 months which is based on 50-75% coverage of highly probable sales and 25-50% of coverage on foreign currency sales out 13-24 months. Foreign currency expenses are estimated and the net exposure is hedged. Basis adjustments are made to the carrying amounts of non-financial hedged items when the anticipated sale or purchase transaction takes place.
The Group has entered into contracts to supply wine to customers in the UK, Europe and United States. The Group has entered into forward foreign exchange contracts to hedge the exchange rate risk arising from these anticipated future transactions, which are designated as cash flow hedges.
As at reporting date the aggregate amount of unrealised profits under forward foreign exchange contracts deferred in the hedging reserve relating to the exposure on anticipated future transactions is $439 thousand loss (2012: profit of $1,469 thousand). It is anticipated that the sales will take place in the next financial year at which stage the amount deferred in equity will be released in profit or loss.
OUTSTANDING YEAR END FOREIGN CURRENCY NOTIONAL VALUE FAIR VALUECONTRACTS EXCHANGE RATE FC ‘000 $’000 $’000
30/06/13 30/06/12 30/06/13 30/06/12 30/06/13 30/06/12 30/06/13 30/06/12
Cash flow hedges
Buy Euro
Less than 3 months 0.7028 0.8089 600 1,050 816 1,298 (15) 179
3 to 6 months 1,100 650 1,530 803 (45) 30
6 to 9 months 600 450 818 556 (25) 67
9 to 12 months 500 300 714 371 (30) 47
Buy GB Pounds
Less than 3 months 0.6011 0.6521 3,500 6,700 5,888 10,274 (171) 208
3 to 6 months 2,000 5,300 3,286 8,128 (200) 186
6 to 9 months 2,500 5,800 4,077 8,894 (187) (45)
9 to 12 months 1,000 5,500 1,730 8,434 (50) 24

80 | NOTES TO THE FINANCIAL STATEMENTS
Note 43: Financial instruments (continued)
(f) Interest rate risk management
The company and the Group are exposed to interest rate risk as entities in the Group borrow funds at floating interest rates. The risk is managed by the Group by the use of interest rate swap contracts. Hedging activities are evaluated regularly to align with interest rate views and defined risk appetite; ensuring optimal hedging strategies are applied, by either positioning the balance sheet or protecting interest expense through different interest rate cycles.
It is the policy of the group to designate the Interest Rate Swap as a hedge against the variability in the cash flow arising from future changes in the interest rate.
The company policy requires fixed interest cover on 75% of all outstanding average net debt usage.
Interest rate sensitivity analysis
The sensitivity analysis below has been determined based on the exposure to interest rates for both derivative and non-derivative instruments at the reporting date and the stipulated change taking place at the beginning of the financial year and held constant throughout the reporting period. A 50 basis point increase or decrease represents management’s assessment of the possible change in interest rates.
At reporting date, if interest rates had been 50 basis points higher or lower and all other variables were held constant, the Group’s:
• net profit after tax would decrease and increase by $313,000 (2012: increase/decrease by $130,000). This is mainly attributable to the Group’s exposure to interest rates on its variable rate borrowing which are not covered by the interest rate swap agreements.
Interest rate swap contracts
Under interest rate swap contracts, the Group agrees to exchange the difference between fixed and floating rate interest amounts calculated on agreed notional principal amounts. Such contracts enable the Group to mitigate the risk of changing interest rates on the cash flow exposures on the issued variable rate debt held. The fair value of interest rate swaps at the reporting date is determined by discounting the future cash flows at reporting date. The average interest rate is based on the outstanding balances at the end of the financial year.
At balance date, the Group and the Company had four (4) interest rate swap agreements with a notional amount of $100 million (2012: $115 million), as follows:
PAY RECEIVE
ROLLOVER EXPIRY DATE CURRENCY AMOUNT RATE FREQUENCY RATE
2-Jul-13 AUD $30,000,000 5.12% Quarterly AUD-BBR-BBSY
26-Nov-13 AUD $25,000,000 5.60% Monthly AUD-BBR-BBSW
13-Jan-14 AUD $20,000,000 5.36% Monthly AUD-BBR-BBSY
03-Sep-15 AUD $25,000,000 3.40% Quarterly AUD-BBR-BBSY
The swaps in place cover 74% (2012: 94%) of the total borrowings as at 30 June 2013.
The following table details the notional principal amounts and remaining terms of interest rate swap contracts outstanding as at reporting date:
Cash flow hedges
AVERAGE CONTRACTED NOTIONAL FAIR VALUE FIXED INTEREST RATE PRINCIPAL AMOUNT
Outstanding floating 2013 2012 2013 2012 2013 2012 for fixed contracts % % $’000 $’000 $’000 $’000
Less than 1 year 4.75 4.76 75,000 40,000 75,000 40,000
1 – 2 years - 5.35 - 75,000 - 75,000
2 – 5 years 3.40 - 25,000 - 25,000 -
The interest rate swaps settle on a monthly or quarterly basis. The Group will settle the difference between the fixed and floating interest rate on a net basis.
All interest rate swap contracts exchanging floating rate interest amounts for fixed rate interest amounts are designated as cash flow hedges in order to reduce the Group’s cash flow exposure resulting from variable interest rates on borrowings. The interest rate swaps and the interest payments on the loan occur simultaneously and the amount deferred in equity is recognised in profit or loss over the period that the floating interest payments on debt impact profit or loss.

81 | NOTES TO THE FINANCIAL STATEMENTS
Note 43: Financial instruments (continued)
(g) Credit risk management
Credit risk refers to the risk that a counterparty will default on its contractual obligations resulting in financial loss to the Group.
The Group has adopted a policy of only dealing with creditworthy counterparties and obtaining sufficient collateral where appropriate, as a means of mitigating the risk of financial loss from defaults.
The Group undertake credit worthiness reviews on all customers and look to obtain debtor insurance for all significant customers. Credit exposure is controlled by counterparty limits that are reviewed and approved.
Trade receivables consist of a large number of customers, spread across several geographical areas. Ongoing credit evaluation is performed on the financial condition of accounts receivable and, where appropriate, credit guarantee insurance cover is purchased.
The credit risk on liquid funds and derivative financial instruments is limited because the counterparties are banks with high credit-ratings assigned by international credit-rating agencies.
The carrying amount of financial assets recorded in the financial statements, net of any allowances for losses, represents the Group’s maximum exposure to credit risk without taking account of the value of any collateral obtained.
The Group does not hold any collateral or other credit enhancements to cover this credit risk.
The table below shows the balance of 4 major counterparties at the end of the reporting period:
30/06/13 30/06/12 COUNTERPARTY LOCATION CARRYING AMOUNT CARRYING AMOUNT
$000 $000
International supermarkets (2) United Kingdom 4,205 9,664
Australian supermarkets (2) Australia 8,212 6,631
Activities that give rise to credit risk and the associated maximum exposure to credit risk include, but are not limited to:
• granting loans and receivables to customers and placing deposits with other entities. In these cases, the maximum exposure to credit risk is the carrying amount of the related financial assets;
• entering into derivative contracts for example, foreign exchange contracts, interest rate swaps and credit derivatives. When the resulting asset is measured at fair value, the maximum exposure to credit risk at the reporting date will equal the carrying amount;
(h) Liquidity risk management
Ultimate responsibility for liquidity risk management rests with the board of directors who have built an appropriate liquidity risk management framework for the management of the Group’s short, medium and long-term funding and liquidity management requirements.
The Group manages liquidity risk by maintaining adequate reserves, banking facilities and reserve borrowing facilities by continuously monitoring forecast and actual cash flows and matching the maturity profiles of financial assets and liabilities. Included in note 43 (b) is a listing of additional undrawn facilities that the Company / Group has at its disposal to further reduce liquidity risk.

82 | NOTES TO THE FINANCIAL STATEMENTS
Note 43: Financial instruments (continued)
The following table details the Group’s and Company’s remaining contractual maturity for its non-derivative financial assets and liabilities. The contractual maturity is based on the earliest date on which the Group may be required to pay. The amounts below are based on undiscounted cash flows and include principal and interest:
CONSOLIDATED WEIGHTED LESS THAN 3 MONTHS AVERAGE 1 MONTH 1-3 MONTHS TO 1 YEAR 1-5 YEARS 5+ YEARS INTEREST RATE $’000 $’000 $’000 $’000 $’000
2013 Non-interest bearing assets - 8,312 17,269 8,312 - -Non-interest bearing liabilities - 14,154 18,868 606 308 -Finance Lease liability 9.02 - 556 1,120 4,864 -Floating interest rate liabilities 6.76 201 402 1,810 35,700 -Fixed interest rate liabilities 7.73 504 1,009 2,305 102,129 -Fixed interest rate assets 10.25 14 91 1,927 - -Financial Guarantees - - - 1,351 - -
2012 Non-interest bearing assets - 9,846 19,781 9,846 - -Non-interest bearing liabilities - 15,875 21,044 1,618 751 -Finance Lease liability 9.02 - 659 1,977 5,198 -Floating interest rate liabilities 7.83 46 91 411 7,000 -Fixed interest rate liabilities 8.14 780 1,431 4,694 116,802 -Fixed interest rate assets 10.25 14 91 222 1,843 -Financial Guarantees - 1,360 - 1,266 - - The amounts included above for financial guarantee contract are the maximum amounts the Group could be forced to settle under the arrangement for the full guaranteed amount if that amount is claimed by the counterparty to the guarantee. Based on expectations at the end of the reporting period, the Group considers that it is more likely than not that such an amount will not be payable under the arrangement. However, the estimate is subject to change depending on the probability if the counterparty claiming under the guarantee which is a function of the likelihood that the financial receivables held by the counterparty which are guaranteed suffer credit losses.
The variable interest rate instruments for both non-derivative financial assets and liabilities is subject to change if changes in variable interest rates differ to those estimates of interest rates determined at the end of the reporting period.
The Group has access to financing facilities of which $18.9 million were unused at the end of the reporting period (2012: $36.4 million). The Group expects to meet its other obligations from operating cash flows and proceeds of maturing financial assets.
The following table details the Group’s liquidity analysis for its derivative financial instruments. The table has been drawn up based on the undiscounted net cash inflows / (outflows) on the derivative instrument that settle on a net basis and the undiscounted gross inflows / (outflows) on those derivatives that require gross settlement. When the amount payable or receivable is not fixed, the amount disclosed has been determined by reference to the projected interest rates as illustrated by the yield curves existing at the reporting date.
LESS THAN 3 MONTHS 1 MONTH 1-3 MONTHS TO 1 YEAR 1-5 YEARS 5+ YEARS $’000 $’000 $’000 $’000 $’000
2013 Net settled: Interest rate swaps 504 1,009 2,305 2,129 -Gross settled: Foreign currency forward contracts 110 76 482 405 - 614 1,085 2,787 2,534 -2012 Net settled: Interest rate swaps 780 1,431 4,694 1,802 -Gross settled: Foreign currency forward contracts - 387 309 429 - 780 1,818 5,003 2,231 -

83 | NOTES TO THE FINANCIAL STATEMENTS
Note 43: Financial instruments (continued)
(i) Fair value of financial instruments
The fair values of financial assets and financial liabilities are determined as follows:
• the fair value of financial assets and financial liabilities with standard terms and conditions and traded on active liquid markets are determined with reference to quoted market prices
• the fair value of other financial assets and financial liabilities (excluding derivative instruments) are determined in accordance with generally accepted pricing models based on discounted cash flow analysis using prices from observable current market transactions
• the fair value of derivative instruments, are calculated using quoted prices. Where such prices are not available use is made of discounted cash flow analysis using the applicable yield curve for the duration of the instruments for non-optional derivatives, and option pricing models for optional derivatives
• the fair value of financial guarantee contracts is determined using option pricing models where the main assumptions are the probability of default by the specified counterparty extrapolated from market-based credit information and the amount of loss, given the default.
Foreign currency forward contracts are measured using quoted forward exchange rates and yield curves derived from quoted interest rates matching maturities of the contracts.
Interest rate swaps are measured at the present value of future cash flows estimated and discounted based on the applicable yield curves derived from quoted interest rates.
The financial statements include holdings in unlisted shares which are measured at cost.
The directors consider that the carrying amounts of financial assets and financial liabilities recorded in the financial statements approximate their fair values.
The following table provides an analysis of financial instruments that are measured subsequent to initial recognition at fair value, grouped into Levels 1 to 3 based on the degree to which the fair value is observable.
• Level 1 fair value measurements are those derived from quoted prices (unadjusted) in active markets for identical assets or liabilities.
• Level 2 fair value measurements are those derived from inputs other than quoted prices included within Level 1 that are observable for the asset or liability, either directly (i.e. as prices) or indirectly (i.e. derived from prices).
• Level 3 fair value measurements are those derived from valuation techniques that include inputs for the asset or liability that are not based on observable market data (unobservable inputs).
LEVEL 1 LEVEL 2 LEVEL 3 TOTAL
$’000 $’000 $’000 $’000
Financial assets at FVTPL Derivative financial assets – 30 June 2013 - - - - Derivative financial assets – 30 June 2012 - 1,469 - 1,469
Financial liabilities at FVTPL Derivative financial liabilities – 30 June 2013 - 1,901 - 1,901 Derivative financial liabilities – 30 June 2012 - 2,369 - 2,369
There were no items relating to Levels 1 and 3 in the year or the prior year.
Note 44: Events after the reporting period
In respect of the financial year ended 30 June 2013, a final dividend of 2.6 cents per share was declared on 23rd August 2013 and will be paid on 18th November 2013.
There have been no other matters or circumstances, other than that referred to in the financial statements or notes thereto, that have arisen since the end of the financial year, that have significantly affected, or may significantly affect, the operations of the Group, the results of those operations, or the state of affairs of the Group in future financial years.

Note 45: Parent Entity Disclosures
CONSOLIDATED
45.1 Financial Position 2013 2012 $’000 $’000
Assets
Current assets 196,440 179,871
Non-current assets 240,914 246,719
Total assets 437,354 426,590
Liabilities
Current liabilities 40,310 37,507
Non-current liabilities 191,609 181,925
Total liabilities 231,920 219,432
Net Assets 205,434 207,158
Equity
Issued Capital 403,155 402,792
Accumulated Losses (198,273) (196,189)
Reserves
Equity settled employee benefits 1,578 1,497
Hedging (949) (865)
Foreign currency translation (77) (77)
Total reserves 552 555
Total equity 205,434 207,158
CONSOLIDATED
45.2 Financial Performance Year ended Year ended 30 June 2013 30 June 2012 $’000 $’000
Profit / (Loss) for the year 1,348 (5,597)
Other comprehensive income / (Loss) (84) (1,197)
Total comprehensive income 1,264 (6,794)
CONSOLIDATED
45.3 Guarantees entered into by parent entity 2013 2012 $’000 $’000
Guarantee provided under the deed of cross guarantee (i) 202,903 199,688
(i) The parent entity has entered into a deed of cross guarantee with subsidiaries as indicated in note 39.
45.4 Contingent liabilities of the parent entity Nil Nil
45.5 Capital Commitments of the parent entity
Plant and Equipment
Not longer than 1 year 83 33
84 | NOTES TO THE FINANCIAL STATEMENTS

Head Office275 Sir Donald Bradman Drive Cowandilla SA 5033 T +61 8 8172 8333 F +61 8 8172 8399
Sydney Office2 Queens Place Balmain NSW 2041 T +61 2 8345 6377 F +61 2 8345 6366
Registered Office275 Sir Donald Bradman Drive Cowandilla SA 5033 T +61 8 8172 8333 F +61 8 8172 8399
Company SecretaryMichael Noack
Chief Financial Officer Michael Noack
AuditorDeloitte Touche Tohmatsu 11 Waymouth Street Adelaide SA 5001
BankersNational Australia Bank 500 Bourke Street Melbourne Vic 3000
Share RegisterComputershare Investor Services 115 Grenfell Street Adelaide SA 5000 T +61 8 8236 2300 F +61 8 8236 2305
McGuigan Hunter Valley AdministrationCnr Broke & McDonalds Roads Pokolbin NSW 2320 T +61 2 4998 4199 F +61 2 4998 4188
McGuigan Barossa ValleyHermann Thumm Drive Lyndoch SA 5351 T +61 8 8524 0200 F +61 8 8524 0240
Tempus Two Cellar DoorCnr Broke & McDonalds Roads Pokolbin NSW 2320 T +61 2 4993 3999 F +61 2 4993 3988
Nepenthe Cellar DoorJones Road Balhannah SA 5242 T +61 8 8398 8899 F +61 8 8398 8895
Buronga Hill WinerySilver City Highway Buronga NSW 2739 T +61 3 5022 5100 F +61 3 5022 5135
Merbein Packaging2 Wentworth Road Merbein Vic 3505 T +61 3 5021 9303 F +61 3 5021 6490
www.australianvintage.com.auACN 052 179 932

....to create great quality wines and brands that our
consumers know and love...
ACN 052 179 932