2013 geneva motor show oica press conference
TRANSCRIPT

2013 GENEVA
MOTOR SHOW
OICA PRESS
CONFERENCE
Patrick BLAIN – President
6 March, 2013
6 March, 20131

I. Vehicle production (1900 to 2012)
II. Vehicle production (2005 to 2012)
III. New vehicle sales (2005 to 2012)
OICA statistics
III. New vehicle sales (2005 to 2012)
IV. Production/sales ratios (2012)
V. 2013 sales forecasts by country
All data are “all vehicle”: PC, LCV, trucks…
6 March, 20132

40
50
60
70
80
90
Mill
ion
s
84.1 million
I. Vehicle production: global
2012/2011: +5% (+4.1 million)
0
10
20
30
40
1,900 1,904 1,908 1,912 1,916 1,920 1,924 1,928 1,932 1,936 1,940 1,944 1,948 1,952 1,956 1,960 1,964 1,968 1,972 1,976 1,980 1,984 1,988 1,992 1,996 2,000 2,004 2,008 2,012
A strong continuous growth with short crisis periods
6 March, 20133
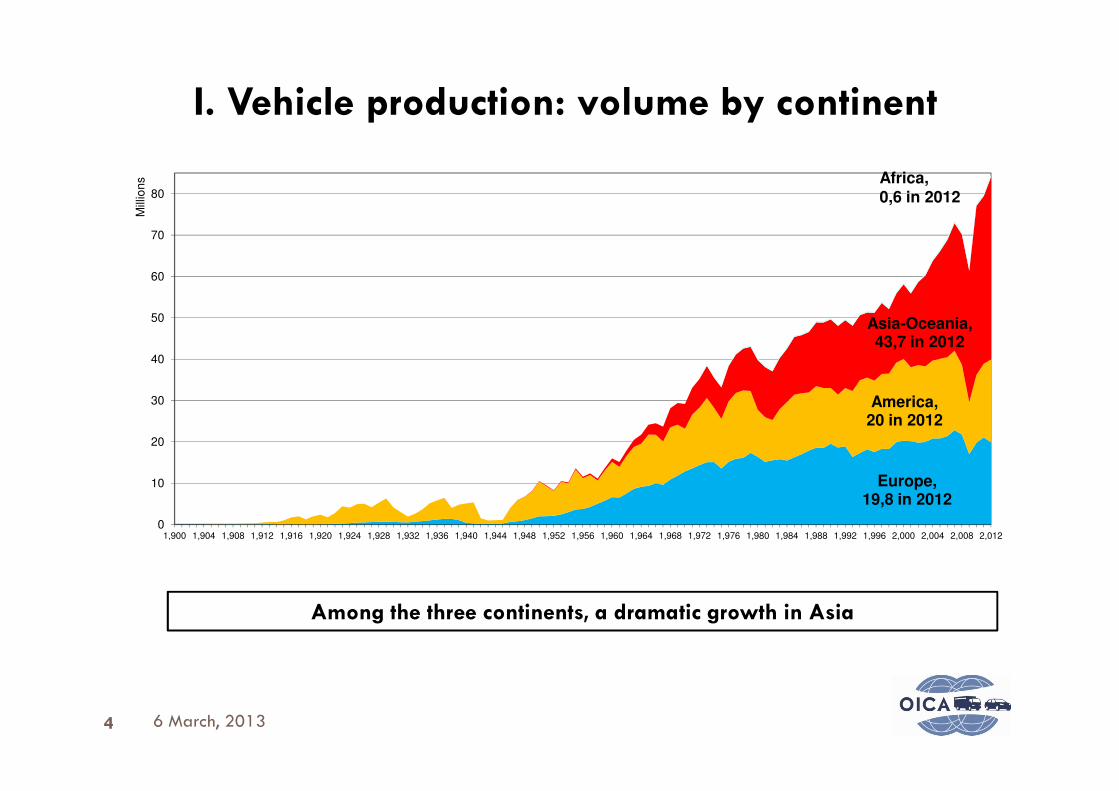
America,
Asia-Oceania,43,7 in 2012
30
40
50
60
70
80
Mill
ion
s Africa,
0,6 in 2012
I. Vehicle production: volume by continent
Europe,19,8 in 2012
America,20 in 2012
0
10
20
30
1,900 1,904 1,908 1,912 1,916 1,920 1,924 1,928 1,932 1,936 1,940 1,944 1,948 1,952 1,956 1,960 1,964 1,968 1,972 1,976 1,980 1,984 1,988 1,992 1,996 2,000 2,004 2,008 2,012
Among the three continents, a dramatic growth in Asia
6 March, 20134

I. Vehicle production: growth by continent
15
20
25
30
35
40
45
50
Mill
ion
s
0
5
10
15
1,900 1,904 1,908 1,912 1,916 1,920 1,924 1,928 1,932 1,936 1,940 1,944 1,948 1,952 1,956 1,960 1,964 1,968 1,972 1,976 1,980 1,984 1,988 1,992 1,996 2,000 2,004 2,008 2,012
America Europe Asia-Oceania Africa
Asian production is skyrocketing since 2000
6 March, 20135

I. Vehicle production: share by continent
America
Europe
Asia-Oceania
Africa
50%
60%
70%
80%
90%
100%
0%
10%
20%
30%
40%
1,900 1,904 1,908 1,912 1,916 1,920 1,924 1,928 1,932 1,936 1,940 1,944 1,948 1,952 1,956 1,960 1,964 1,968 1,972 1,976 1,980 1,984 1,988 1,992 1,996 2,000 2,004 2,008 2,012
Asia now 51% of the world production, America is back on track
6 March, 20136

66,669,4
73,470,7
61,8
77,680,0
84,1
30
40
50
60
70
80
90Millions
II. Vehicle production: highlight 2005-2012
+10%
+8%
-16%
0
10
20
30
2005 2006 2007 2008 2009 2010 2011 2012
After the 2008 crisis, production restarted globally
6 March, 20137

5
10
15
20
25
30
35M
illio
ns2 011 2 012
+6%
II. Vehicle production: volume and growth by region
+17% +11%
+4%+5%
-8%
-2%
0
A world production growing, except in Europe and South-Central America
+5%
6 March, 20138
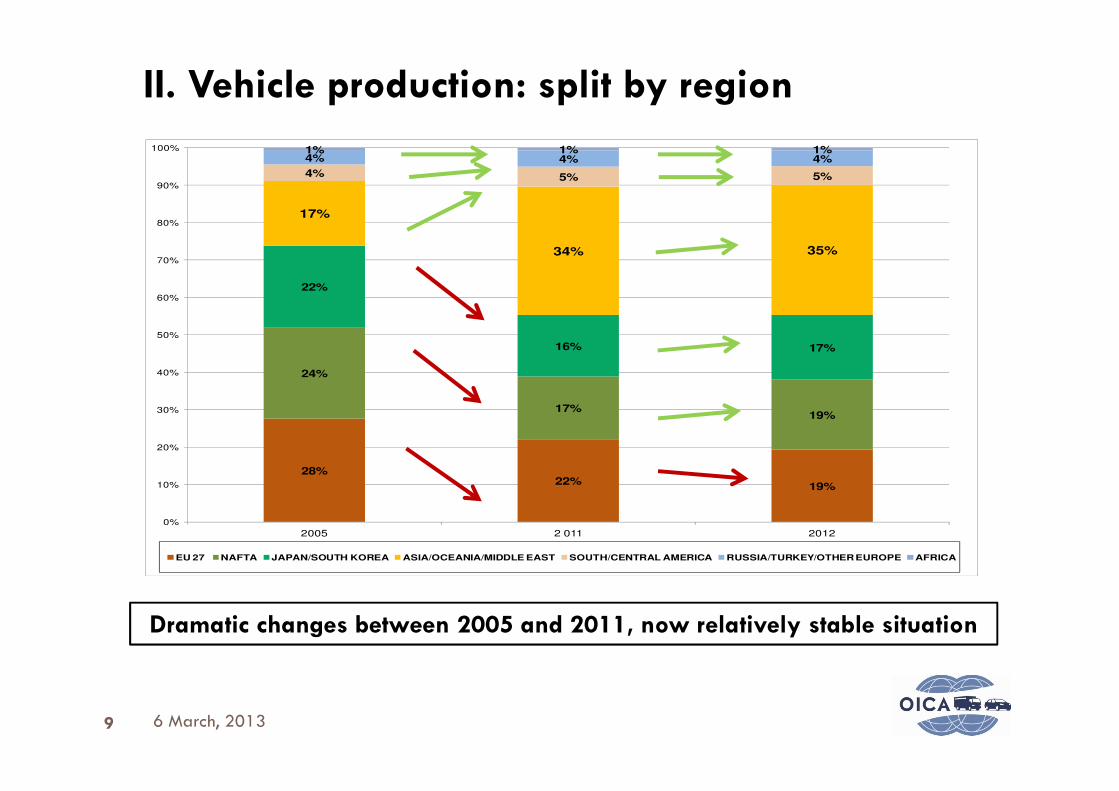
24%
22%
16% 17%
17%
34% 35%
4% 5% 5%
4% 4% 4%1% 1% 1%
40%
50%
60%
70%
80%
90%
100%
II. Vehicle production: split by region
28%22%
19%
17%19%
0%
10%
20%
30%
2005 2 011 2012
EU 27 NAFTA JAPAN/SOUTH KOREA ASIA/OCEANIA/MIDDLE EAST SOUTH/CENTRAL AMERICA RUSSIA/TURKEY/OTHER EUROPE AFRICA
Dramatic changes between 2005 and 2011, now relatively stable situation
6 March, 20139

6
8
10
12
14
16
18
20
6
8
10
12
14
16
18
20Millions
II. Vehicle production: top 15 countries
4,9%5,4%
6,7%
11,8%12,2%
22,8%
200517,7%
16%
8,5% 8,5%
5,5%
2012
0
2
4
6
0
2
4
6
1,4%
1,9%2,3%2,3%
2,6%2,9%
2,9%3,6%4%
4,9%5,4%5,5%5,3%
4,1%4%
3,7%2,7%2,5%2,4%2%
1,7%1,5%
A brand new world for production
6 March, 201310
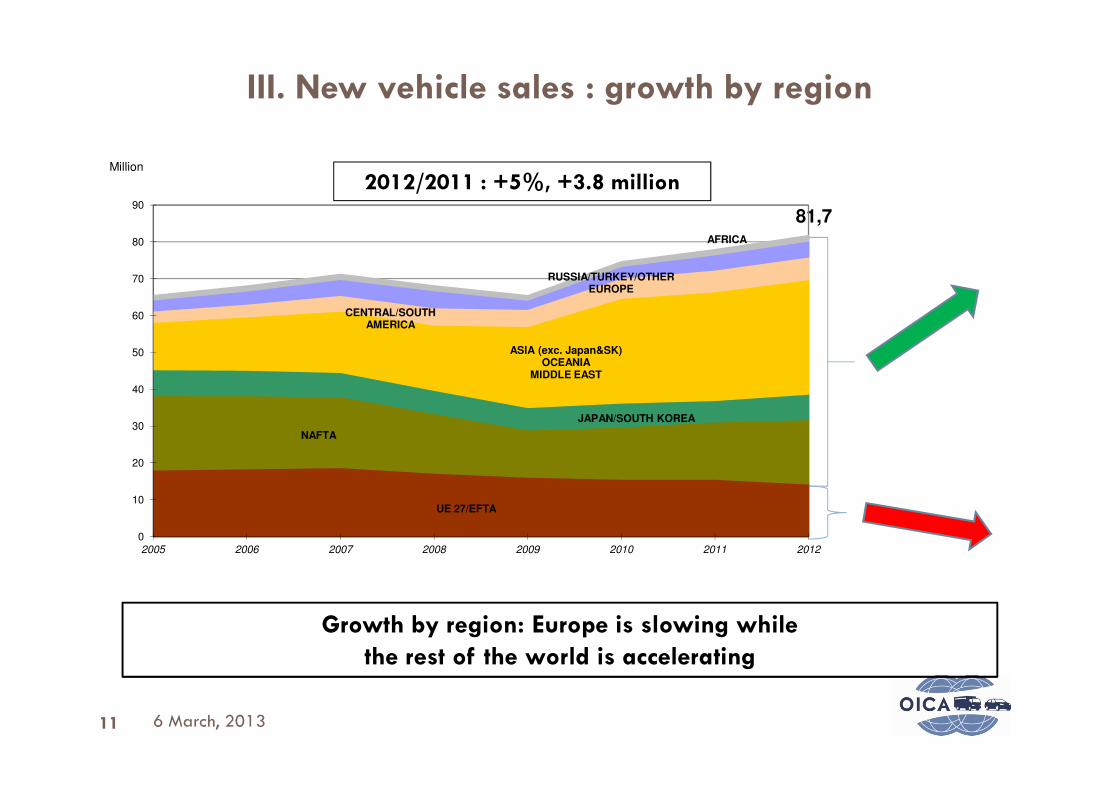
III. New vehicle sales : growth by region
2012/2011 : +5%, +3.8 million
81,7
ASIA (exc. Japan&SK)OCEANIA
MIDDLE EAST
CENTRAL/SOUTH AMERICA
RUSSIA/TURKEY/OTHER EUROPE
AFRICA
40
50
60
70
80
90
Million
UE 27/EFTA
NAFTA
JAPAN/SOUTH KOREA
0
10
20
30
2005 2006 2007 2008 2009 2010 2011 2012
Growth by region: Europe is slowing while
the rest of the world is accelerating
6 March, 201311

31%
11%
7% 8%
20%
38% 38%
5%8% 7%
5% 5% 5%2% 2% 2%
40%
50%
60%
70%
80%
90%
100%
III. New vehicle sales : regions
28%20% 18%
20%21%
0%
10%
20%
30%
UE 27/EFTA NAFTA JAPAN/SOUTH KOREA ASIA (exc. Japan&SK)… CENTRAL/SOUTH AMERICA RUSSIA/TURKEY/OTHER EUROPE AFRICA
2005 2011 2012
Europe is slowing while the rest of the world is accelerating
6 March, 201312

23,6%
18,1%
8
10
12
14
16
18
20
2012
26,7%
8
10
12
14
16
18
20
2005
Million Million
III. New vehicle sales: top 10 countries
6,6%
4,7% 4,4% 4,2% 3,8%2,9% 2,9%
2,1%
0
2
4
6
8
CHINA USA JAPAN BRAZIL INDIAGERMANYRUSSIA UK FRANCECANADA
8,9% 8,8%
5,5%4,3% 4% 3,8%
3% 2,8% 2,6%
0
2
4
6
USA JAPAN CHINAGERMANY UK FRANCE ITALY SPAIN RUSSIA BRAZIL
Markets moved to emerging markets (with a still strong USA)
6 March, 201313

1 - CHINA50,8%
4 - SOUTH KOREA4%
5 - THAILAND3,6%
6 - INDONESIA2,9%
7 - AUSTRALIA2,9%
- IRAN2,6%
9 - SAUDI ARABIA1,8%
10 - MALAYSIA1.7%
-3%
+75%
+25%
+10%
-39%
+13%
+5%
2012
III. New vehicle sales: Asia/Oceania/Middle east
China: the
2 - JAPAN14,1%
3 - INDIA9,4%
+4%
+9%
+28%
-3%
China: the
largest
market in
Asia (and
the world)
6 March, 201314

IV. Production/sales ratios: region
17%
19%
35%
19%18%
38%
21%
2,1
1,10,9
0,9
1,0
1,5
2,0
2,5
20%
25%
30%
35%
40%
45%
50%
Prod/SalesRegion Share
4%5%
1%
8%
5%
7%
2%
0,90,8
0,7
0,4
0,0
0,5
0%
5%
10%
15%
JAPAN/SOUTH KOREA
UE 27/EFTA ASIA (exc. Japan&SK)OCEANIA
MIDDLE EAST
NAFTA RUSSIATURKEY
OTHER EUROPE
CENTRAL/SOUTH AMERICA
AFRICA
Prod 2012 Sales 2012 Prod/Sales Ratios
Biggest “Net exporter” profile as a region: Japan/South Korea
6 March, 201315
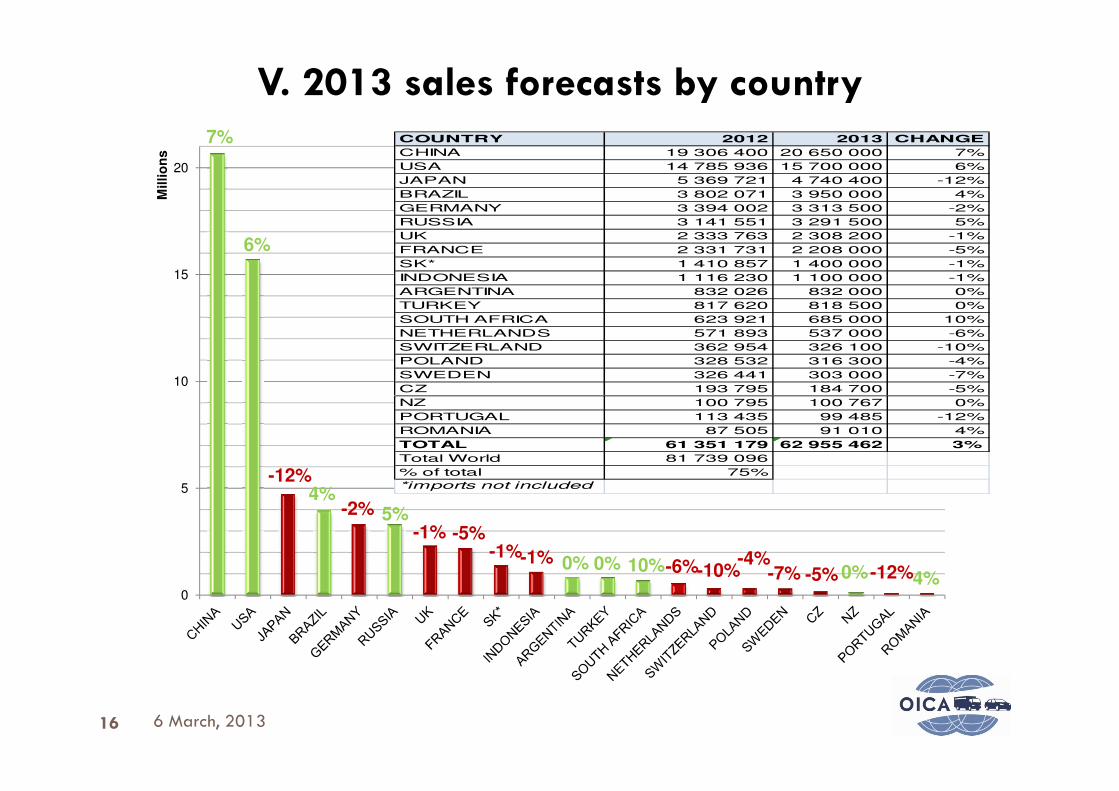
V. 2013 sales forecasts by country7%
6%
10
15
20M
illio
ns
COUNTRY 2012 2013 CHANGE
CHINA 19 306 400 20 650 000 7%
USA 14 785 936 15 700 000 6%
JAPAN 5 369 721 4 740 400 -12%
BRAZIL 3 802 071 3 950 000 4%
GERMANY 3 394 002 3 313 500 -2%
RUSSIA 3 141 551 3 291 500 5%
UK 2 333 763 2 308 200 -1%
FRANCE 2 331 731 2 208 000 -5%
SK* 1 410 857 1 400 000 -1%
INDONESIA 1 116 230 1 100 000 -1%
ARGENTINA 832 026 832 000 0%
TURKEY 817 620 818 500 0%
SOUTH AFRICA 623 921 685 000 10%
NETHERLANDS 571 893 537 000 -6%
SWITZERLAND 362 954 326 100 -10%
POLAND 328 532 316 300 -4%
SWEDEN 326 441 303 000 -7%
CZ 193 795 184 700 -5%
-12%
0
5 4%-2% 5%
-1% -5%-1%-1% 0% 0% 10%-6%-10%
-4%-7% -5% 0%-12%4%
NZ 100 795 100 767 0%
PORTUGAL 113 435 99 485 -12%
ROMANIA 87 505 91 010 4%
TOTAL 61 351 179 62 955 462 3%
Total World 81 739 096
% of total 75%
*imports not included
6 March, 201316

Thank you for
your attentionyour attention
www.oica.net
6 March, 201317