2013 global logistics, trends and their impact on industrial re
DESCRIPTION
2013 Global Logistics, Trends and Their Impact on Industrial RE. Prepared By: Curtis D. Spencer, President IMS Worldwide, Inc. IMS Worldwide, Inc. 35 Years of Industry Experience Over 300 FTZ Projects Conducted Applications (New Zones, Expansion, ASF, MBMs, Subzones, etc.) Activations - PowerPoint PPT PresentationTRANSCRIPT

Prepared By: Curtis D. Spencer, PresidentIMS Worldwide, Inc.

IMS Worldwide, Inc.
• 35 Years of Industry Experience• Over 300 FTZ Projects Conducted
• Applications (New Zones, Expansion, ASF, MBMs, Subzones, etc.)
• Activations • Manufacturing Authorizations
• Strategic Development and/or Marketing Partner to top REITs, Developers and EDC groups
• C-TPAT and Supply Chain Security Audits
www.imsw.comForeign-Trade Zone, Logistics and Supply Chain Consulting

IMSW Overview of National FTZ and Strategic Development
Projects 1977-2012
www.imsw.comForeign-Trade Zone, Logistics and Supply Chain Consulting

Agenda
• What is Industrial Real Estate in 2013?• How Trade Impacts Real Estate• Logistics and Transportation Trends• Panama Canal• Shifts in E-commerce Fulfillment Centers• Impact on Industrial Real Estate
www.imsw.comwww.imsw.comForeign-Trade Zone, Logistics and Supply Chain Consulting

What is Industrial Real Estate in 2013?
• Manufacturing Buildings: The “norm” in 1950-1970, then manufacturing shifted to Mexico, then China in 2001. Now we are seeing it come back to North America
• Growth of E-Commerce Fulfillment Centers
• Continued demand for cross-dock, transload, distribution and warehousing facilities in growth markets
• Export Centers for consolidation of containers and goods
www.imsw.comForeign-Trade Zone, Logistics and Supply Chain Consulting

Top Industrial Real Estate US Markets4th Quarter 2012
Source: CBRE 4th Quarter 2012
Market Total Market Space (SF x1000)
Availability Rate
NNN Asking Rent
Greater Los Angeles 1,653,763 8.3% $6.18
Chicago 1,191,438 9.1% $4.05
New York-New Jersey 800,264 10.25% $5.24
Dallas-Fort Worth 709,063 13.6% $3.82
Atlanta 547,781 17.6% $3.34
Detroit 509,918 11.0% $4.50
Houston 447,239 8.9% $3.91
Other Key Distribution Markets:
Phoenix 277,424 13.6% $7.08
Columbus 208,207 12.7% $2.78
www.imsw.comForeign-Trade Zone, Logistics and Supply Chain Consulting

How Trade How Trade Affects Affects
Real EstateReal Estate
www.imsw.comForeign-Trade Zone, Logistics and Supply Chain Consulting

Trade Impacts Real Estate
• Shifts in all industry levels can directly impact the size, shape, type, locations, infrastructure and demand levels for real estate
• Manufacturing–Shift of building type: From smoke stack to high-tech and from off-shore, to near-shore
• “Retail” now involves Industrial buildings! (E-commerce fulfillment centers, traditional Distribution Centers (DCs), etc.) Transportation (new routes, infrastructure, trends)
www.imsw.comForeign-Trade Zone, Logistics and Supply Chain Consulting

SLIDE FROM 2005, SHOWING THE CONNECTION BETWEEN GDP AND TRADE
Notice 2x to 3x Trade Volumes to GDP relationship exists “+ or –”
Real Exports to US in TEUs

www.imsw.comForeign-Trade Zone, Logistics and Supply Chain Consulting
NOW -- THAT TRUTH IS IN QUESTION!

www.imsw.comForeign-Trade Zone, Logistics and Supply Chain Consulting

www.imsw.comForeign-Trade Zone, Logistics and Supply Chain Consulting

2012 Total TEU Growth YOY vs. 2011
Source: Individual Port Websites*Estimate based on Nov YTD numbers
Port of Entry2012 TEU Volume
2012 TEU Growth over 2011
LA/LB 14,123,376 1.70%
NY/NJ* 5,520,211 .30%
Savannah 2,966,221 0.7%
Oakland 2,344,424 0.1%
Houston 1,922,479 3.0%
Hampton Roads 2,105,887 8.92%
Seattle 1,869,492 -9.2%
Tacoma 1,711,133 8.62%
Charleston 1,514,585 9.6%
www.imsw.comForeign-Trade Zone, Logistics and Supply Chain Consulting
TransportationTrends
www.imsw.comForeign-Trade Zone, Logistics and Supply Chain Consultingwww.imsw.comForeign-Trade Zone, Logistics and Supply Chain Consulting

Panama Canal
• Canal operating at capacity today
• Limited ship-sizes that can operate, 110 feet wide max, going to 185 feet wide!
• Impact on USEC and Gulf Ports
• Completion date; Dec 2014, start up Q1 2015
• Main “shift” will not be in West Coast, vs. East Coast, Asia-traffic market share, but in 1 ship carrying 12,000 TEUs vs. 3 ships carrying 3500 TEUs each!
www.imsw.comForeign-Trade Zone, Logistics and Supply Chain Consulting


`
THE PROBLEM!

THE FIX – up to 12,000 TEUs


EC Ports Will Grow Because:
• Increasing Eastern Europe/Indian Trade- Via the Suez. “Watch out for Pirates!”
• Increasing S. American (Brazil, Chile, etc.)
• GDP Growth
• Proximity to Major Markets
• Small increase in Asia-US trade through Panama and Suez routings
www.imsw.comForeign-Trade Zone, Logistics and Supply Chain Consulting

WC Ports Will Grow Because:
• Increasing Asian China Trade (GDP lowered to 7% Growth Rate for 2013)
• Increasing SE Asia Trade, non-China
• GDP Growth
• Proximity to quicker/cheaper Intermodal Routings that can penetrate to within 250 miles of East Coast.
• Small decrease in market share of China-based-US trade through Panama and Suez routings.
www.imsw.comForeign-Trade Zone, Logistics and Supply Chain Consulting

Panama Canal Bottom Line
• BALANCE – In Market Share after 2014 will be the answer. Approx. 52%-48% today, 50%-50% after 2014.
• IF- Ocean Carriers re-work pricing after Panama Canal Expansion- lowering prices by 30% for all water, compared to LA/LB + Intermodal, AND the RRs do not drop correspondingly—you could see 10%-20% Market Share drop from WC to EC.
• Likelihood of this happening? 1 in 10.
www.imsw.comForeign-Trade Zone, Logistics and Supply Chain Consulting

Why are Ports, Inland Ports, and Shipping Costs Important to Ind. RE?
• The means, method and pathway that goods flow through the country directly impacts the markets that win and those that miss out.
• Port and Inland Port markets that retain or absorb a large amount of the containers that are received have larger industrial real estate demand and opportunities.
• Still, the most important location decision is based on demographics (where are the people moving from 2015-2030 and “landed cost”.
www.imsw.comForeign-Trade Zone, Logistics and Supply Chain Consulting

Source: ShipmentLink.com (Evergreen) Sailing SchedulesFrom China, it takes about 2 weeks to bring cargo to the west coast and about 4 weeks to bring it in on the east coast. (2000)
3517
34
36 36
17$2,226
$3,380
$3,300
Shanghai to North American Ports: Slow Steaming Effects –2000 & 2013
Pricing as of April 2013
$1,200

www.imsw.comForeign-Trade Zone, Logistics and Supply Chain Consulting

The Future Port Model
• Select port gateways will serve near-port and inland port distribution and manufacturing• One, two or more inland ports supported by
truck and rail networks, in state and soon, out of states
• Increase the connectivity between ports and inland ports for imports and exports
• Support traditional distribution services with E-commerce fulfillment services that operate together from the same facility or separate facilities
www.imsw.comForeign-Trade Zone, Logistics and Supply Chain Consulting

z
Sources: Population, employment, and real estate growth forecasts by Robert Lang and Arthur Nelson of the Metropolitan Institute at Virginia Tech
and Phil Hopkins of Global Insight; Business 2.0, November 2005
East Coast-West Coast TEUCost Line Equilibrium- Mar. 2013
I-35 Corridor +40%
Gulf Coast Belt +31%
Cascadia +38%
Southland +35%
Valley of the Sun +81%
Great Lakes Horseshoe +10%
Atlantic Seaboard
+12%
Southern Florida +52%
Equilibrium
Line Q1 2013
I-85 Corridor +35%

New Types of Industrial Real Estate: Export Centers & E-Commerce
• Export Centers match up empty-import Containers with Export Loads.
• Where? At Inland Ports!
• E-commerce fulfillment center (like DC’s) are going to be different, larger, more diverse and in different markets.
www.imsw.comForeign-Trade Zone, Logistics and Supply Chain Consulting

www.imsw.comForeign-Trade Zone, Logistics and Supply Chain Consulting

Many Areas are Significantly Imbalanced …But This Can Be Addressed
Source: JOC Piers 1/30/13
www.imsw.comForeign-Trade Zone, Logistics and Supply Chain Consulting

Export Center
www.imsw.comForeign-Trade Zone, Logistics and Supply Chain Consulting

Retail Trends
www.imsw.comForeign-Trade Zone, Logistics and Supply Chain Consulting

E-Commerce Fulfillment

Types of E-Commerce
• E-Commerce = Electronic Commerce (Computer, Laptop, Desktop)
• M-Commerce = Mobile Commerce (Phone, tablets, readers etc.)
• S-Commerce = Social Commerce (Derived from Social Networks such as Facebook, Twitter, Groupon, etc.
www.imsw.comForeign-Trade Zone, Logistics and Supply Chain Consulting

Projected Impact of E-Commerce
• By 2025 it has been estimated that Ecommerce will represent 30% of all Retail Sales and account from 2.7 trillion in total sales (Source: Dematic)
• Within 5 years, the percentage of sales closed at physical stores vs. alternative sales channels (E-Commerce, M-Commerce and S-Commerce) will drop from 91% (today) to 76% (Deloitte Study)
www.imsw.comForeign-Trade Zone, Logistics and Supply Chain Consulting

E-Commerce Impact on Industrial
• One-third of all demand for big-box space in the US in 2012 was tied to multi-channel retail or E-Commerce (Area Development Magazine, 2013)
• The E-Commerce generation of industrial is up to 5 times more labor intensive than traditional retail/distribution: more parking, mezzanine build-outs and increased automation are some of the features difficult to retrofit to older buildings, but many can be converted. (Area Development Magazine, 2013)
www.imsw.comForeign-Trade Zone, Logistics and Supply Chain Consulting

E-Commerce Key Criteria for Site Selectors
• Avoidance of Nexus Tax (may get mitigated, but not yet….)
• Proximity to major markets • Inexpensive land• UPS and FedEx Truck Hubs nearby• Ample seasonal/surge labor pool• Reasonable proximity/access to interstates• Local incentives: Tax breaks—FTZ!!
www.imsw.comForeign-Trade Zone, Logistics and Supply Chain Consulting

Bottom Line for Industrial RE?
• Stay in the Markets where the PEOPLE ARE!
• Invest where they PEOPLE ARE GOING TO BE!
• 10 and 20 year Demographics are changing.
• Northeast did not sustain the “hit” that everyone predicted, because of the Recession.
• Florida and PHX actually stayed the same from 2008-2010. PHX and HOU fastest growing metros last 12 months.
• Look for where the demographic trends are likely to emerge in 10 year segments and plan accordingly.
www.imsw.comForeign-Trade Zone, Logistics and Supply Chain Consulting


z
Sources: Population, employment, and real estate growth forecasts by Robert Lang and Arthur Nelson of the Metropolitan Institute at Virginia Tech
and Phil Hopkins of Global Insight; Business 2.0, November 2005
Megapolitan Outlook2010-2030 (Post-Recession)
I-35 Corridor +40%
GROWS
Gulf Coast Belt +31%
GROWS
Cascadia +38%
Norcal +35%
Southland +35%
Valley of the Sun +81%
SLOWER RATE OF GROWTH
Great Lakes Horseshoe +10%
SUSTAINS
Atlantic Seaboard
+12%
SUSTAINS
I-85 Corridor +35%
GROWS
Southern Florida +52%
SUSTAINS
DECLINES
SUSTAINS
SUSTAINS
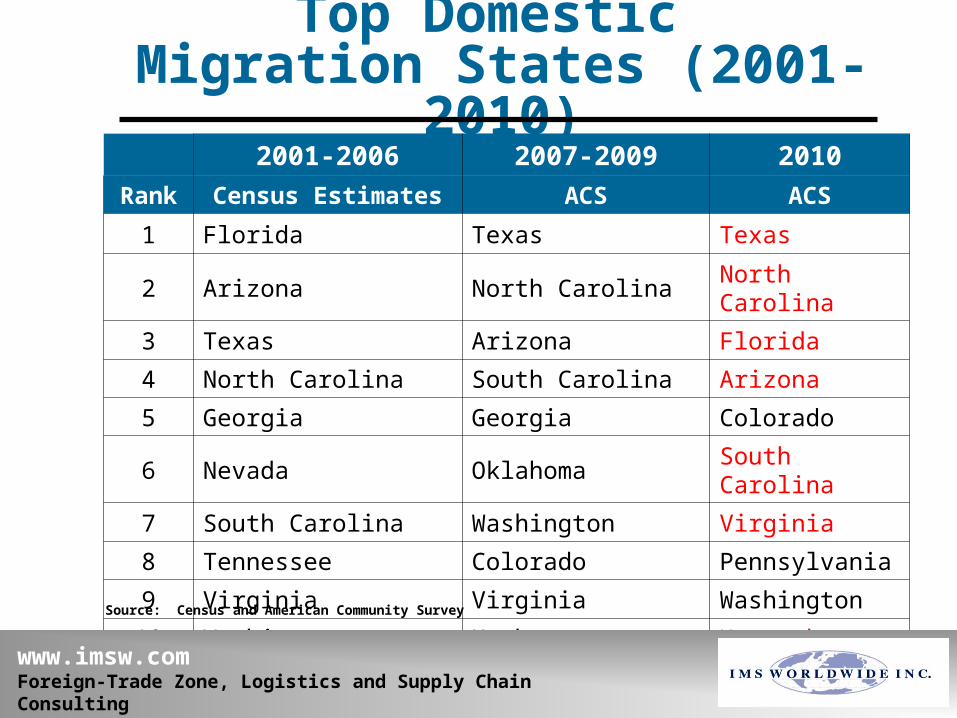
Top Domestic Migration States (2001-2010)
2001-2006 2007-2009 2010
Rank Census Estimates ACS ACS
1 Florida Texas Texas
2 Arizona North Carolina North Carolina
3 Texas Arizona Florida
4 North Carolina South Carolina Arizona
5 Georgia Georgia Colorado
6 Nevada Oklahoma South Carolina
7 South Carolina Washington Virginia
8 Tennessee Colorado Pennsylvania
9 Virginia Virginia Washington
10 Washington Utah KentuckySource: Census and American Community Survey
www.imsw.comForeign-Trade Zone, Logistics and Supply Chain Consulting

Conclusion: What Does This All Mean to Me?
• Recession is over, but growth is slow.• Supply Chains create need for more space. (E-
Commerce and export centers)• We are seeing this now in continued consolidation to
large “Big Box” DC’s.• New E-Commerce phenomenon will create more
demand for Industrial Space.• Incentives (like FTZ, large truck courts etc.) will
continue to distinguish Big Boxes. • Never forget…We add 4 Million new mouths to feed
each year in the USA!
www.imsw.comForeign-Trade Zone, Logistics and Supply Chain Consulting

Prepared By: Curtis D. Spencer, PresidentIMS Worldwide, Inc.