© 2013 international monetary fund imf country report no ... · saudi population out of the labor...
TRANSCRIPT

© 2013 International Monetary Fund July 2013 IMF Country Report No. 13/230
July 29, 2012 January 29, 2001 January 29, 2001 January 29, 2001 January 29, 2001
Saudi Arabia: Selected Issues This paper on Saudi Arabia was prepared by a staff team of the International Monetary Fund as background documentation for the periodic consultation with the member country. It is based on the information available at the time it was completed on June 24, 2013. The views expressed in this document are those of the staff team and do not necessarily reflect the views of the government of Saudi Arabia or the Executive Board of the IMF. The policy of publication of staff reports and other documents by the IMF allows for the deletion of market-sensitive information.
Copies of this report are available to the public from
International Monetary Fund Publication Services 700 19th Street, N.W. Washington, D.C. 20431
Telephone: (202) 623-7430 Telefax: (202) 623-7201 E-mail: [email protected] Internet: http://www.imf.org
International Monetary Fund
Washington, D.C.

SAUDI ARABIA SELECTED ISSUES Approved By Alfred Kammer
Prepared By Cornelius Fleischhaker, Malin Hu, Padamja Khandelwal, Jimmy McHugh, Haonan Qu, and Niklas Westelius;
ASSESSING SAUDI ARABIA'S SYSTEMIC ROLE IN THE OIL MARKET AND GLOBAL ECONOMY __________________________________________________________________________________ 4 A. A Historic Perspective of Saudi Arabia in the Global Oil Market _________________________ 4 B. Quantifying Saudi Arabia’s Systemic Role in the Current Global Environment _______________ 8 C. Conclusion _____________________________________________________________________________ 13 References _______________________________________________________________________________ 13 BOX 1. The Global Economy Mode _______________________________________________________________ 9 FIGURES 1. Saudi Crude Oil Production, 1962–2012 __________________________________________________ 5 2. The Global Oil Market and the First Gulf War, 1990–91 __________________________________ 6 3. The Venezuelan General Strike and the Second Gulf War, 2002–03 ______________________ 7 4. The Libyan Crisis, 2010–11 ________________________________________________________________ 7 5. Oil Price Volatility, 2011 __________________________________________________________________ 8 6. Global Impact of a Permanent 2 Percent Oil Supply Shock _____________________________ 12
LABOR MARKET POLICIES FOR ADDRESSING SAUDI UNEMPLOYMENT _____________ 14 A. The Labor Market in Saudi Arabia ______________________________________________________ 14 B. Labor Market Policies and Their Impact ________________________________________________ 19 C. Conclusion _____________________________________________________________________________ 23 References _______________________________________________________________________________ 24 BOX 1. What Explains Low Female Labor Force Participation in the GCC? _____________________ 18
CONTENTS
June 24, 2013
SAUDI ARABIA
2 INTERNATIONAL MONETARY FUND
FIGURES 1. Employment Trends ____________________________________________________________________ 15 2. Labor Market Segmentation ____________________________________________________________ 16 3. Factors Affecting Female Labor Force Participation In Islamic Emerging Markets ______ 17 4. Domestic Enrollment in Tertiary Education by Gender, 1995/96 & 2010/11 ___________ 19 5. Saudi Population Out of the Labor Force by Education and Gender, 2012 _____________ 19 6. Saudi Unemployment by Education and Gender, 2012 _________________________________ 20 7. Changes in Saudi Employment by Gender, Education, and Average Wages, Dec. 2009–
Dec. 2012 _____________________________________________________________________________ 22 8. Change in Employment by Sector and Nationality, Dec. 2011–Dec. 2012 ______________ 22
ASSESSING FISCAL POLICY AND FISCAL RISKS IN SAUDI ARABIA ___________________ 25 A. Fiscal Risks from Oil Prices _____________________________________________________________ 25 B. Oil Revenue Volatility and Expenditure Management __________________________________ 26 C. The Fiscal Stance 2003–13 ______________________________________________________________ 27 D. Assessing Fiscal Risks __________________________________________________________________ 30 E. Managing Future Fiscal Policy __________________________________________________________ 34 F. Conclusion ______________________________________________________________________________ 34 References _______________________________________________________________________________ 35 FIGURES 1. Central Government Revenues, 2012 ___________________________________________________ 25 2. Oil Spot Prices, 1997–2013 _____________________________________________________________ 26 3. Saudi Arabian Expenditures, 2006–12 __________________________________________________ 26 4. Oil Prices and Additional Within-year Expenditures ____________________________________ 27 5. Saudi Structural Revenue and Spending Decomposition, 2003–13 _____________________ 27 6. Projected and Sustainable Non-oil Primary Deficit, 2010–18 ___________________________ 29 7. Saudi Arabia: Fiscal Risk Indicators, 2012 _______________________________________________ 32 8. Saudi Arabia: Fiscal Risk Indicators, 2012 _______________________________________________ 33 9. Path of Real Government Spending, 2003–18 __________________________________________ 34
PRODUCTIVITY GROWTH AND POTENTIAL OUPUT IN SAUDI ARABIA ______________ 36 A. Dynamics of Output and Factor Inputs _________________________________________________ 36 B. Investigating Productivity Growth in the Saudi Arabian Economy ______________________ 38 C. Estimates of Potential Output in Saudi Arabia _________________________________________ 42 D. Conclusion _____________________________________________________________________________ 44 References _______________________________________________________________________________ 45 FIGURES 1. Real Output Growth, 1990–2012 _______________________________________________________ 36 2. Sector Shares in Real GDP, 1990–2012 ________________________________________________ 36 3. Non-oil Growth Revision, 2000–11 ____________________________________________________ 37 4. Employment, 1990–2012 _______________________________________________________________ 37
SAUDI ARABIA
INTERNATIONAL MONETARY FUND 3
5. Real Investment, 1990–2011 ___________________________________________________________ 37 6. Unit Labor Output, 1990–2012 __________________________________________________________ 38 7. Growth Decomposition with Assumed Cost Share of Capital __________________________ 39 8. Growth Decomposition with Estimated Cost Share of Capital _________________________ 41 9. Trend Growth Projections, 2000–18 ____________________________________________________ 43 10. Non Oil Sector Growth, 2000–18 ______________________________________________________ 44 TABLES 1. TFP Growth Estimates, 1990–2011 ______________________________________________________ 39 2. Solow Residual Estimates _______________________________________________________________ 40 3. Average Contribution to Real Output Growth, 2000–11 ________________________________ 42 4. Average Estimated Output Growth, 2012–18 ___________________________________________ 42 5. Non-oil Sector Growth Projections, 2000–18 ___________________________________________ 43

SAUDI ARABIA
4 INTERNATIONAL MONETARY FUND
ASSESSING SAUDI ARABIA'S SYSTEMIC ROLE IN THE OIL MARKET AND GLOBAL ECONOMY1
Oil remains the most important energy source in the global economy, accounting for approximately one third of total global energy consumption. Consequently, it comes as no surprise that disturbances in the oil market have the potential to significantly impact global economic activity. Saudi Arabia, the world’s largest producer and exporter of oil, has long played a systemically important role in the global oil market. In particular, with its unique ability to relatively quickly raise production due to its sizable spare capacity, Saudi Arabia is a stabilizing force in case of oil supply disturbances. This chapter attempts to quantify the importance of Saudi Arabia for the global economy, using both event studies and model simulations.
A. A Historic Perspective of Saudi Arabia in the Global Oil Market
1. Saudi Arabia is a central player in the global oil market. Over the period 1990–2011, Saudi Arabia produced over 78 billion barrels of oil (approximately 13 percent of global supply). This is significantly more than both Russia and the U.S. which come in second and third place with cumulative production levels of 70 and 60 billion barrels, respectively (see Table 1). Moreover, Saudi Arabia accounts for 16 percent of global proven reserves, lagging only Venezuela at 18 percent. However, Venezuelan reserves are generally viewed as less easily accessible and more costly to extract. Finally, and perhaps more importantly, Saudi Arabia has the ability over a short amount of time to substantially increase its supply to the global oil market. With a spare production capacity of over 2 million barrels per day (mbd), Saudi Arabia accounts for over 50 percent of global spare production capacity and can raise global oil production by over 2 percent within 30 days (roughly equivalent to Korea’s total consumption).2 In addition, to ensure smooth delivery of crude exports in case of transportation disruptions or other market disturbances, Saudi
1 Prepared by Niklas Westelius. 2 The data on spare capacity numbers for 2012 are taken from IEA which reports capacity levels that can be reached within 30 days and sustained for 90 days.
Billon barrels
Percent of global supply
Million barrels/day
Percent of global supply
Billion barrels
Percent of global reserves
Saudi Arabia 78.0 12.7 2.0 2.2 265.9 15.9Russia 69.9 11.4 … … 87.2 5.2US 60.2 9.8 … … 35.0 2.1Iran 32.4 5.3 0.3 0.3 157.0 9.4China 28.5 4.7 … … 17.3 1.0Mexico 27.6 4.5 … … 11.4 0.7Venezuela 26.0 4.2 0.1 0.1 297.6 17.8Canada 22.1 3.6 … … 173.9 10.4Norway 21.6 3.5 … … 7.5 0.4U.A.E 21.4 3.5 0.1 0.1 97.8 5.9Nigeria 18.1 3.0 0.4 0.5 37.2 2.2Kuwait 18.0 2.9 0.1 0.1 101.5 6.1United Kingdom 16.6 2.7 … … 3.1 0.2Iraq 14.7 2.4 0.2 0.2 150.0 9.0
OPEC 251.8 41.1 3.6 4.0 1211.9 72.6Global 612.1 100.0 3.6 4.0 1668.9 100.0
Sources: BP Statistical Review of World Energy 2012; IEA; and IMF staff calculations.
Saudi Arabia's Role in the Global Oil Market
Cumulative Production (1990–2012)
Average Spare Capacity (2012)
Reserves (2012)

SAUDI ARABIA
INTERNATIONAL MONETARY FUND 5
0
2
4
6
8
10
12
0
2
4
6
8
10
12
1962 1967 1972 1977 1982 1987 1992 1997 2002 2007 2012
Figure 1. Saudi Crude Oil Production, 1962–2012(Million barrels per day)
Source: Haver.
Arabia keeps large quantities of oil in storage facilities in the Mediterranean, northern Europe, and Asia to meet customer demand. 2. Over the past four decades, swings in Saudi Arabia’s oil production and changing export patterns have reflected evolving policy objectives as well as global demand and supply trends (Figure 1).
1970s: Tripling of oil production and changing ownership of the oil industry. Crude oil production in Saudi Arabia increased from 3.8 mbd in 1970 to close to 10 mbd in 1980. This sharp increase in production coincided with: (i) the return to public ownership of the oil industry; (ii) rising oil prices; and (iii) large investments to boost capacity. Consequently, Saudi Arabia’s share of the global oil market rose from less than 7 percent in 1970 to 16 percent in 1980.
1980s: Falling global oil demand and Saudi Arabia’s role as swing producer. As the United States and Europe entered into severe recessions in the early 1980s, global energy demand fell. Reduced demand for oil put downward pressure on prices and OPEC assigned production quotas to its members. However, the strategy was largely unsuccessful as several OPEC members continued to produce above their assigned quotas. Saudi Arabia, on the other hand, was committed to its role as swing producer and to OPEC’s official price system. As a result, the country bore the brunt of the cutback in production. Indeed, Saudi oil production fell by over 60 percent between 1981 and 1985. In September 1985, Saudi Arabia abandoned its role as a swing producer and raised output, contributing to a sharp fall in oil prices. Following the 1985–86 episode, Saudi Arabia also shifted to a policy focused on protecting and expanding its global market share, and abandoned the official pricing system of OPEC in favor of a more market-oriented pricing method.3
1990s and 2000s: Rising energy demand from developing Asia. From the mid 1990s, Saudi Arabia’s pattern of oil exports changed substantially along with rising energy demand from developing Asia. During the 1970s, Europe accounted for about 44 percent of Saudi oil exports, while Asia accounted for 30 percent. In the 2000s, however, Asia accounted for over 55 percent of Saudi Arabia’s oil exports while Europe’s share dropped to 15 percent.
3 In an interview in 1998 with SPA (Saudi Press Agency), Minister of Petroleum and Mineral Resources Al-Naimi stated that Saudi Arabia had abandoned the role of swing producer in the 1980s because it had resulted in the loss of both market share and large oil revenues.

SAUDI ARABIA
6 INTERNATIONAL MONETARY FUND
3. Short-term fluctuations in Saudi Arabia’s oil production have partially reflected attempts to stabilize the global oil market. Saudi Arabia has on several occasions used its systemic role to raise production to fill global demand gaps created by large supply disturbances.
The First Gulf War (1990–91): The First Gulf War, which started in August 1990, resulted in a significant disruption to global oil supply. The combined output of Iraq and Kuwait fell from 4.8 to 0.4 mbd between 1990:Q2 and 1991:Q1, corresponding to a loss of 6.5 percent of global oil supply (Figure 2). The resulting demand gap, which was also driven by rising oil demand, was largely filled by Saudi Arabia which gradually raised its production from 5.4 to 8.2 mbd over the same time period, replacing almost two thirds of the combined output loss of Kuwait and Iraq. Nevertheless, global oil supply fell by 2.5 mbd in 1990:Q3 (3.7 percent of global supply) and the average oil price had doubled by the end of the year.
Figure 2. The Global Oil Market and the First Gulf War, 1990–911
The Venezuelan Strike and the Second Gulf War (2002-2003): There were two consecutive oil
supply disturbances in 2003: (i) the Venezuelan general strike from December 2002 to February 2003, and (ii) the second Gulf War starting at the end of March 2003. The loss in Venezuelan production (from 2002:Q3 to 2003:1) amounted to about 1.2 mbd, accounting for about 1.6 percent of global oil supply (Figure 3). At the same time global demand rose significantly. As a result, oil prices rose by over 16 percent in the first quarter of 2003. The gap was partially filled by a 1.1 mbd increase in Saudi Arabian production, a draw down in inventories of 1.3 mbd, and higher production by other producers. Although, the impact of the Second Gulf War on global supply was more severe—a 1.8 mbd loss in Iraqi production or 2.3 percent of global supply—the loss in production was to a large extent offset by: (i) the recovery of Venezuelan production; (ii) continued high Saudi production; and (iii) a substantial drop in global demand. Perhaps not surprisingly, oil prices fell back close to levels seen before the Venezuelan strike.
Sources: IEA; and IMF staff calculations.1Excess demand is calculated as the gap between global demand and pre-shock supply less the output loss of Kuwait and Iraq in the current quarter.
-40
-20
0
20
40
60
80
100
120
-2
-1
0
1
2
3
4
5
6
1990Q2 1990Q3 1990Q4 1991Q1 1991Q2
Perc
ent c
hang
e
Mbp
d
Non-OPEC Inventory
Other OPEC Saudi Arabia
Excess demand Average oil price, RHS
Saudi Arabia's Contribution to Filling the Demand Gap
1990Q2 1990Q3 1990Q4 1991Q1 1991Q2
Global demand (mbd) 65.1 66.1 66.0 67.4 65.3
Inventories 2.4 -1.1 1.1 -0.2 0.7
Global Supply (mbd) 67.5 65.0 67.1 67.2 66.0Saudi Arabia 5.4 6.1 8.0 8.2 7.8Kuwait 1.7 0.6 0.1 0.0 0.0Iraq 3.1 1.5 0.4 0.4 0.4Other OPEC 15.4 15.6 16.7 16.4 16.4Non-OPEC 41.9 41.2 41.9 42.2 41.4
Oil Price ($/barrel) 15.8 25.7 31.0 19.9 18.3
Percent change (relative to 1990Q2) 0.0 62.2 96.0 25.5 15.9
Demand, Supply, and Oil price, 1990-91

SAUDI ARABIA
INTERNATIONAL MONETARY FUND 7
Figure 3. The Venezuelan General Strike and the Second Gulf War, 2002–03
The Libyan unrest (2011): By the third quarter of 2011, the unrest in Libya had resulted in a loss of
production of about 1.5 mbd (about 1.8 percent of global supply) (Figure 4). European refineries were particularly hard hit as a large share of Libyan oil was exported to Europe. To fill the consequent demand gap, Saudi Arabia responded not only by gradually raising production by over 1 mbd, but also by introducing a new oil blend tailored to European refineries. Other OPEC producer increased their production levels as well by an additional 1 mbd. Nevertheless, oil prices rose from $85/barrel to $110/barrel by the second quarter of 2011, an increase of 29 percent.
Figure 4. The Libyan Crisis, 2010–11
Sources: IEA; and IMF staff calculations.1Excess demand is calculated as the gap between global demand and pre-shock supply less the output loss of Kuwait and Iraq in the current quarter.
-40
-20
0
20
40
60
80
100
120
-2
-1
0
1
2
3
4
5
6
1990Q2 1990Q3 1990Q4 1991Q1 1991Q2Pe
rcen
t cha
nge
Mbp
d
Non-OPEC Inventory
Other OPEC Saudi Arabia
Excess demand Average oil price, RHS
Saudi Arabia's Contribution to Filling the Demand Gap
1990Q2 1990Q3 1990Q4 1991Q1 1991Q2
Global demand (mbd) 65.1 66.1 66.0 67.4 65.3
Inventories 2.4 -1.1 1.1 -0.2 0.7
Global Supply (mbd) 67.5 65.0 67.1 67.2 66.0Saudi Arabia 5.4 6.1 8.0 8.2 7.8Kuwait 1.7 0.6 0.1 0.0 0.0Iraq 3.1 1.5 0.4 0.4 0.4Other OPEC 15.4 15.6 16.7 16.4 16.4Non-OPEC 41.9 41.2 41.9 42.2 41.4
Oil Price ($/barrel) 15.8 25.7 31.0 19.9 18.3
Percent change (relative to 1990Q2) 0.0 62.2 96.0 25.5 15.9
Demand, Supply, and Oil price, 1990-91
0
5
10
15
20
25
30
35
0
1
2
3
4
5
6
2010Q4 2011Q1 2011Q2 2011Q3 2011Q4
Perc
ent c
hang
e
Mbp
d
Non-OPEC Inventory
Other OPEC Saudi Arabia
Excess demand Average oil price, RHS
Saudi Arabia's Contribution to Filling the Demand Gap
2010Q4 2011Q1 2011Q2 2011Q3 2011Q4
Global demand 89.8 88.4 87.7 89.6 89.6
Change in inventories -2.3 0.0 -0.2 -1.3 -0.2
Global supply 87.5 88.4 87.5 88.3 89.4
Saudi Arabia 8.3 8.6 8.9 9.3 9.4Libya 1.6 1.1 0.1 0.0 0.6Other OPEC 25.3 26.0 26.1 26.3 26.3Non-OPEC 52.3 52.7 52.4 52.6 53.2
Oil price ($/barrel) 85.4 99.7 110.1 103.1 103.2Percent change (relative to 2002Q3) 0.0 16.7 28.9 20.6 20.8
Demand, Supply and Oil Price, 2010–11
Sources: IEA; and IMF staff calculations.
SAUDI ARABIA
8 INTERNATIONAL MONETARY FUND
0.0
0.5
1.0
1.5
2.0
2.5
3.0
3.5
4.0
4.5
5.0
0.0
0.5
1.0
1.5
2.0
2.5
3.0
3.5
4.0
4.5
5.0
3-Ja
n
21-J
an
10-F
eb
2-M
ar
22-M
ar
11-A
pr
29-A
pr
19-M
a y
8-Ju
n
28-J
un
18-J
ul
5-A
ug
25-A
ug
14-S
ep
4-O
ct
24-O
ct
11-N
ov
1-D
ec
21-D
ec
Figure 5. Oil Price Volatility, 2011 (30-day standard deviation of detrended oil prices)
Sources: Bloomberg; JODI; and IMF staff calculations.
Saudi Arabia's exports rose by 0.95 mbd in Jan-Feb.
Saudi Arabia's exports rose by 0.54 mbd in June.
Saudi Arabia's exports rose by 0.83 mbd in Nov-Dec.
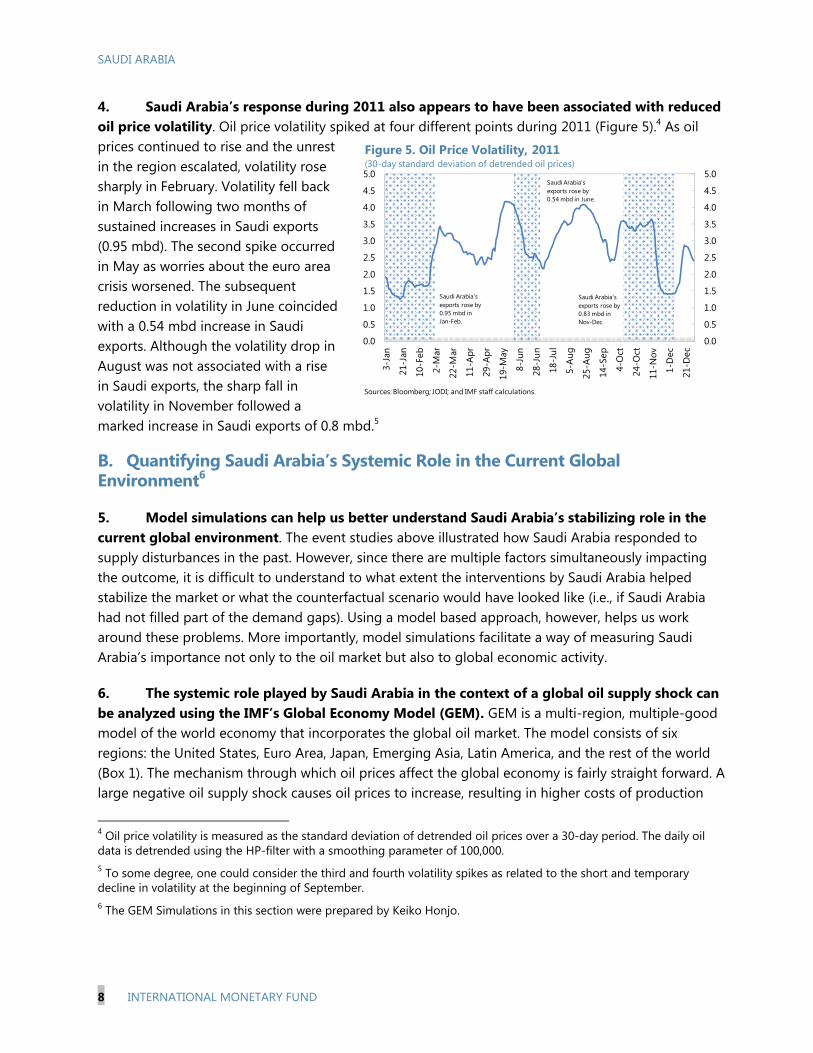
4. Saudi Arabia’s response during 2011 also appears to have been associated with reduced oil price volatility. Oil price volatility spiked at four different points during 2011 (Figure 5).4 As oil prices continued to rise and the unrest in the region escalated, volatility rose sharply in February. Volatility fell back in March following two months of sustained increases in Saudi exports (0.95 mbd). The second spike occurred in May as worries about the euro area crisis worsened. The subsequent reduction in volatility in June coincided with a 0.54 mbd increase in Saudi exports. Although the volatility drop in August was not associated with a rise in Saudi exports, the sharp fall in volatility in November followed a marked increase in Saudi exports of 0.8 mbd.5
B. Quantifying Saudi Arabia’s Systemic Role in the Current Global Environment6
5. Model simulations can help us better understand Saudi Arabia’s stabilizing role in the current global environment. The event studies above illustrated how Saudi Arabia responded to supply disturbances in the past. However, since there are multiple factors simultaneously impacting the outcome, it is difficult to understand to what extent the interventions by Saudi Arabia helped stabilize the market or what the counterfactual scenario would have looked like (i.e., if Saudi Arabia had not filled part of the demand gaps). Using a model based approach, however, helps us work around these problems. More importantly, model simulations facilitate a way of measuring Saudi Arabia’s importance not only to the oil market but also to global economic activity.
6. The systemic role played by Saudi Arabia in the context of a global oil supply shock can be analyzed using the IMF’s Global Economy Model (GEM). GEM is a multi-region, multiple-good model of the world economy that incorporates the global oil market. The model consists of six regions: the United States, Euro Area, Japan, Emerging Asia, Latin America, and the rest of the world (Box 1). The mechanism through which oil prices affect the global economy is fairly straight forward. A large negative oil supply shock causes oil prices to increase, resulting in higher costs of production
4 Oil price volatility is measured as the standard deviation of detrended oil prices over a 30-day period. The daily oil data is detrended using the HP-filter with a smoothing parameter of 100,000. 5 To some degree, one could consider the third and fourth volatility spikes as related to the short and temporary decline in volatility at the beginning of September. 6 The GEM Simulations in this section were prepared by Keiko Honjo.

SAUDI ARABIA
INTERNATIONAL MONETARY FUND 9
(particularly in sectors that are oil intensive) and thus translates into a negative shock to aggregate supply. The increase in the oil price also has a direct impact in consumer prices causing headline inflation to rise.
Box 1: The Global Economy Model
GEM is a multi-region, multiple-good model of the world economy that is derived from optimizing foundations.1 In each region there are households, firms, and a government. Households maximize utility derived from the consumption of goods and leisure. Firms combine capital and labor with either oil/commodities or land to maximize the net income from goods production. Governments consume goods financed through non-distorting taxes and adjust short-term nominal interest rates to provide nominal anchors.
Households Households are infinitely lived, consume goods, and are the monopolistic suppliers of differentiated labor inputs to all domestic firms. Households exhibit habit persistence in consumption contributing to real rigidities in economic adjustment. Monopoly power in labor supply implies that households’ wages contain a markup over the marginal rate of substitution between consumption and leisure. Because of adjustment costs in wage contracts, aggregate nominal rigidities arise through wage bargaining. Households own all domestic firms, the domestic capital stock, and the land, which they rent to domestic firms. The markets for capital and land are competitive. Capital accumulation is subject to adjustment costs that contribute to gradual economic adjustment. The supply of land is fixed.
Firms Firms produce three types of goods: a nontradable good; a tradable non-commodity good; and two tradable commodity (oil and non-oil) goods. Goods are assumed to be differentiated, leading to market power that enables firms to charge a markup over the marginal cost of production. Goods prices are subject to adjustment costs that, along with slowly adjusting wages, give rise to the gradual adjustment of prices to economic disturbances. The characteristics of the final bundle of goods consumed in each region reflect the preferences of households and firms over all goods and, consequently, international trade is driven by the interaction of preferences and relative prices.
Capital, labor, and commodities are combined to produce the tradable non-commodity good and the non-tradable good. The production process is given by:
),,,,,( CC MQLKAfY (1)
where Y denotes the output of the non-commodity tradable good and the non-tradable good, A denotes the level of productivity, K is the capital input, L is the labor input, QC is the domestically produced commodity inputs, and MC is the imported commodity inputs. The production technology, f, embodies constant elasticity of substitution. For this application, non-commodities goods production is calibrated to be Cobb Douglas. Producers have a very high elasticity of substitution between imported and domestically produced commodities capturing the notion of a single world market for commodities.

SAUDI ARABIA
10 INTERNATIONAL MONETARY FUND
Box 1: The Global Economy Model (concluded)
Commodities are produced combining capital, labor, and a fixed factor, land. The production technology is given by:
( , , , ),CQ f A K L Land (2)
where QC is domestically produced commodities, A denotes the level of productivity, K represents the capital input, L denotes the labor input, and Land is the fixed factor. The production technology, f, embodies constant elasticity of substitution. For this application, Land is calibrated to be the most important input into commodities production and the elasticity of substitution among land, labor, and capital is low.
Government Government spending falls exclusively on non-tradable goods. Government spending is financed through a non-distorting tax. The government controls the national short-term nominal interest rate with the objective of providing a nominal anchor for the economy. The inflation rate is the nominal anchor in all countries/regions, with the exception of emerging Asia. For emerging Asia, the nominal anchor is stability in the nominal exchange rate between the Asian currency and the U.S. dollar.
The exchange rate The key role for the exchange rate in GEM is to maintain external balance. In the short-run, differentials in real interest rates can move exchange rates away from the levels required to maintain current accounts and thus net foreign assets positions at their desired levels. However, ultimately real exchange rates will adjust to maintain external balance.
Parameterization Parameter values for GEM are derived through calibration. Specific parameter values are determined by balancing several factors: empirical estimates available in the literature, the desired steady-state characterization of the economies, and the model’s dynamic adjustment properties. Behavioral parameters that do not affect expenditure shares or trading relationships have been set identically in all countries/blocks. Nominal and real adjustment cost parameters are also identical although nominal and real dynamics will differ because of different proportions of liquidity constrained households and different markups in goods and labor markets. _______ 1 For a detailed description of GEM’s structure and dynamic adjustment properties see Laxton and Pesenti (2003), Hunt (2005), and Hunt and Rebucci (2005).
7. In the model, an oil supply shock is considered that broadly matches Saudi Arabia’s spare production capacity. This is done to ensure that Saudi Arabia can realistically increase its oil production to completely fill the residual excess demand. Hence, the magnitude of the supply shock is set to 2 percent of global oil supply. Notice that the size of this shock is also broadly consistent with two of the event studies considered above (i.e., the twin shocks of 2003 and the Libyan crisis in 2011).

SAUDI ARABIA
INTERNATIONAL MONETARY FUND 11
8. The simulation results illustrate the importance of Saudi Arabia to the global economy (see Table 2 and Figure 6). Three different scenarios are analyzed depending on how Saudi Arabia responds to the initial global oil supply shock in filling the residual excess demand: (1) Baseline—no response, i.e., Saudi Arabia does not increase production (black solid line); (2) Saudi Arabia fully replaces the lost output from the second quarter (blue line), this would be broadly consistent with the Venezuelan strike in 2002–03; and (3) Saudi Arabia gradually replaces the lost output over the length of a year (the Libyan crisis) (red dashed line).
Baseline case: The oil supply shock causes the oil price to rise and peak in the third quarter at about 46 percent above its the pre-shock level. Overall global economic activity falls by 1.5 percent compared to the pre-shock level after 10 quarters, with the greatest impact in Emerging Asia, which has the highest reliance on oil, where output falls by 1.7 percent. The impact is the smallest in Latin America, where output declines by 0.9 percent, given that the region has a combination of oil exporters and importers. The impact on GDP in the U.S. and the Euro Area is roughly, 1.2 and 1.4 percent, respectively.
Full replacement after one quarter: If Saudi Arabia intervenes and completely replaces the lost output in the second quarter, oil price dynamics will be significantly dampened. The oil price increases by 28 percent in the first quarter but then falls back sharply to only a 9 percent increase relative to the pre-shock level in the second quarter. The impact on global activity is also significantly mitigated as global GDP only declines by 0.2 percent. The decline in output in Emerging Asia is now 0.3 percent, while that of the U.S. and the Euro Area is 0.2 percent.
Full but gradual replacement: Not surprisingly, the gradual response constitutes an intermediate case of the preceding two simulations. The oil price first rises by 28 percent and then remains at the same level for the second quarter only to fall back over the next six months. Global GDP falls by 0.5 percent. Economic activity in Emerging Asia is 0.6 percent lower and GDP for the U.S. and the Euro Area declines by 0.4 percent.
Table 2: Impact of a 2 percent Oil Supply Disturbance, by Region
Saudi Response World Emerging Asia Japan U.S. Euro Area Latin America
No response (baseline) 1.5 1.7 1.5 1.2 1.4 0.9
Full replacement 0.2 0.3 0.3 0.2 0.2 0.1
Gradual replacement 0.5 0.6 0.5 0.4 0.4 0.3
Source: IMF staff calculations
(Maximum output loss relative to the pre-shock level in percentage points)

SAUDI ARABIA
12 INTERNATIONAL MONETARY FUND
Figure 6. Global Impact of a Permanent 2 Percent Oil Supply Shock (Percent difference relative to pre-shock level)
Source: IMF staff calculations.
-10
0
10
20
30
40
50
0 1 2 3 4 5 6 7 8 9 10Quarters
Oil Prices
-1.8
-1.6
-1.4
-1.2
-1.0
-0.8
-0.6
-0.4
-0.2
0.0
0.2
0 1 2 3 4 5 6 7 8 9 10Quarters
Full replacement
Gradual replacement
Baseline
U.S. Real GDP
-1.8
-1.6
-1.4
-1.2
-1.0
-0.8
-0.6
-0.4
-0.2
0.0
0.2
0 1 2 3 4 5 6 7 8 9 10Quarters
Euro Area Real GDP
-1.8
-1.6
-1.4
-1.2
-1.0
-0.8
-0.6
-0.4
-0.2
0.0
0.2
0 1 2 3 4 5 6 7 8 9 10Quarters
Japan Real GDP
-1.8
-1.6
-1.4
-1.2
-1.0
-0.8
-0.6
-0.4
-0.2
0.0
0.2
0 1 2 3 4 5 6 7 8 9 10Quarters
Emerging Asia Real GDP
-1.8
-1.6
-1.4
-1.2
-1.0
-0.8
-0.6
-0.4
-0.2
0.0
0.2
0 1 2 3 4 5 6 7 8 9 10Quarters
Latin America Real GDP
-1.8
-1.6
-1.4
-1.2
-1.0
-0.8
-0.6
-0.4
-0.2
0.0
0.2
0 1 2 3 4 5 6 7 8 9 10Quarters
World Real GDP
-2.5
-2.0
-1.5
-1.0
-0.5
0.0
0.5
0 1 2 3 4 5 6 7 8 9 10Quarters
Rest of the World's Real GDP

SAUDI ARABIA
INTERNATIONAL MONETARY FUND 13
C. Conclusion
9. Saudi Arabia is an important stabilizing force in the global economy. With control of over half of existing global spare production capacity, Saudi Arabia remains the only country in the world that can relatively quickly respond to supply disturbances. Event studies of the First Gulf War, the twin oil shocks in 2003, and the Libyan crisis suggest that Saudi Arabia has indeed used its spare capacity to mitigate supply shocks in other countries. Furthermore, simulations using the IMF’s Global Economy Model show that Saudi Arabia plays a systemically important role in the current global economy should there a significant oil supply disturbance.
10. Over the medium term, Saudi Arabia will retain a central position in the global oil market that will be shaped by both supply and demand factors. On the supply side, unconventional production technologies have resulted in a significant increase in projected oil and gas production in North America over the medium term, possibly leading to a decoupling of the western hemisphere from the rest of the global oil market. On the other hand, continued geopolitical uncertainties in the Middle East and North Africa represent downside risks to the global oil supply outlook. Uncertainties are also significant on the demand side. Although, the shale gas revolution in North America has primarily caused a shift away from consumption of coal, it could also reduce demand for oil products going forward. Furthermore, uncertainties in global demand growth and divergence in growth patterns (slow growth in Europe, moderate growth in the U.S., and stronger growth in emerging market economies) will shape the demand outlook. All these factors, in addition to strong domestic consumption growth, are likely to affect the position of Saudi Arabia in the global oil market.
References
Laxton, D., and P. Pesenti, 2003, “Monetary Policy Rules for Small, Open, Emerging Economies,” Journal of Monetary Economics, Vol. 50, pp 1109–46. Hunt, B., 2005, “Oil Price Shocks: Can they Account for the Stagflation in the 1970s?” IMF Working Paper, WP/05/215 (Washington: International Monetary Fund). Hunt, B., and A. Rebucci, 2005, “The U.S. Dollar and Trade Deficit: What Accounts for the Late 1990s?” International Finance, Vol. 8(3), pp 399–434.

SAUDI ARABIA
14 INTERNATIONAL MONETARY FUND
LABOR MARKET POLICIES FOR ADDRESSING SAUDI UNEMPLOYMENT1
A young and increasingly well-educated Saudi labor force provides a tremendous opportunity to boost growth and living standards. However, despite rapid economic growth in recent years, Saudi unemployment has remained high, especially among youth and women. Investments in education and labor market reforms are aimed at improving skills and raising private sector employment of Saudi workers. Improving the competitiveness of Saudi workers will require strengthening the quality of education and careful implementation of labor market policies. Additionally, efforts to expand employment opportunities for women can help raise the productive potential of the economy.
A. The Labor Market in Saudi Arabia
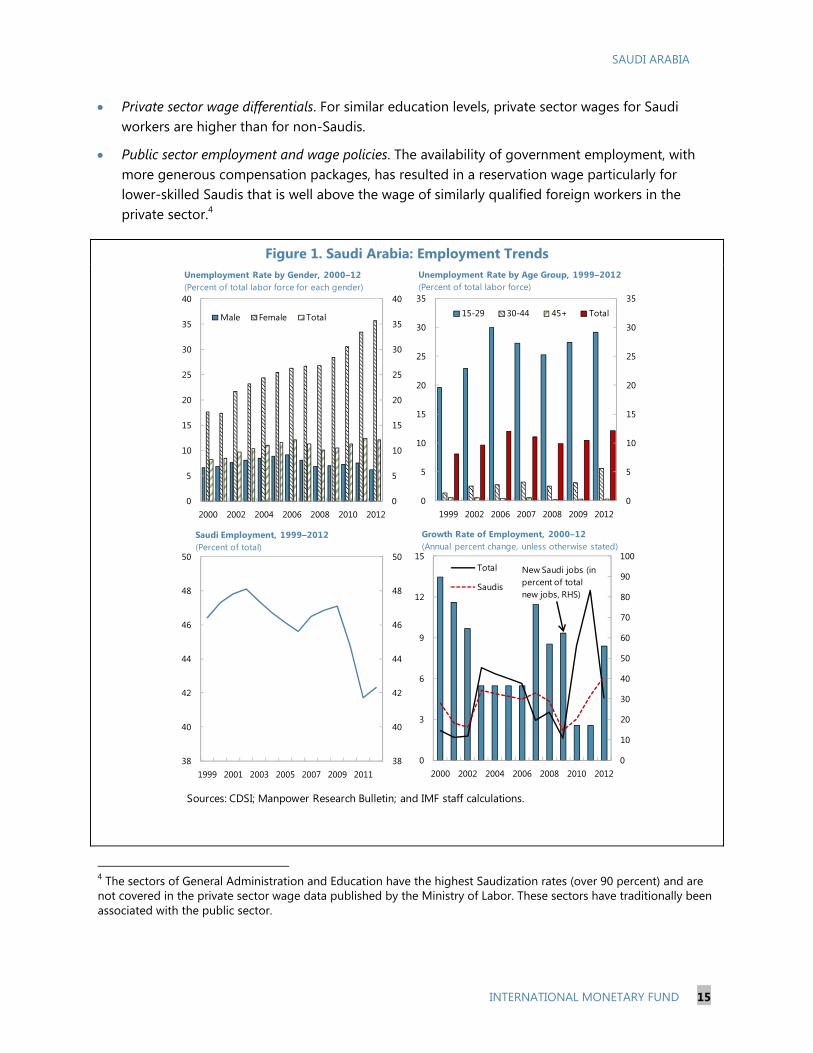
1. The Saudi economy— the largest in the MENA region— has been growing at a robust pace, and has been successful in generating jobs. However, most of the jobs go to foreign workers, resulting in high unemployment among the rapidly growing Saudi labor force. The overall unemployment rate is 5.8 percent and has remained broadly stable since end-2009. Among Saudis, unemployment rates have risen from 10.5 percent at end-2009 to 12.1 percent at end-2012, especially for youth and women (Figure 1). Despite total employment growth averaging near 8.5 percent, Saudi employment growth was only 4.6 percent in the years 2010–12. Saudi employment as a percent of total employment has declined since end-2009.
2. There are several key features of the labor market in Saudi Arabia. Saudi workers are better educated on average than non-Saudi workers, and are primarily employed (over 65 percent) in the public sector (Figure 2). Low-skilled non-Saudi workers dominate the private sector—Saudi workers constitute only 20 percent of private sector employment.2 Additionally, female labor force participation (FLFP) has risen from very low levels, but lags behind many other countries. There are four main reasons for the current structure of the labor market: 3
Strong growth in sectors that typically rely on foreign labor. In recent years, growth in Saudi Arabia has been above trend, driven by public spending on large infrastructure projects. Easy access to low-wage low-skilled foreign labor has meant that sectors such as wholesale and retail trade, personal services, transport, and construction have been the main engines of private sector growth. These sectors have not contributed to increased Saudi employment.
1 Prepared by Padamja Khandelwal. 2 We use labor force and employment data published by the Central Department of Statistics and Information, and wage data published by the Ministry of Labor and General Organization for Social Insurance. 3 Also see IMF Country Report 12/272.
SAUDI ARABIA
INTERNATIONAL MONETARY FUND 15
Private sector wage differentials. For similar education levels, private sector wages for Saudi workers are higher than for non-Saudis.
Public sector employment and wage policies. The availability of government employment, with more generous compensation packages, has resulted in a reservation wage particularly for lower-skilled Saudis that is well above the wage of similarly qualified foreign workers in the private sector.4
Figure 1. Saudi Arabia: Employment Trends
4 The sectors of General Administration and Education have the highest Saudization rates (over 90 percent) and are not covered in the private sector wage data published by the Ministry of Labor. These sectors have traditionally been associated with the public sector.
Sources: CDSI; Manpower Research Bulletin; and IMF staff calculations.
0
5
10
15
20
25
30
35
40
0
5
10
15
20
25
30
35
40
2000 2002 2004 2006 2008 2010 2012
Male Female Total
Unemployment Rate by Gender, 2000–12(Percent of total labor force for each gender)
0
5
10
15
20
25
30
35
0
5
10
15
20
25
30
35
1999 2002 2006 2007 2008 2009 2012
15-29 30-44 45+ Total
Unemployment Rate by Age Group, 1999–2012 (Percent of total labor force)
38
40
42
44
46
48
50
38
40
42
44
46
48
50
1999 2001 2003 2005 2007 2009 2011
Saudi Employment, 1999–2012 (Percent of total)
0
10
20
30
40
50
60
70
80
90
100
0
3
6
9
12
15
2000 2002 2004 2006 2008 2010 2012
Total
Saudis
Growth Rate of Employment, 2000–12 (Annual percent change, unless otherwise stated)
New Saudi jobs (in percent of total new jobs, RHS)

SAUDI ARABIA
16 INTERNATIONAL MONETARY FUND
Figure 2. Saudi Arabia: Labor Market Segmentation
Cultural factors that depress female labor force participation, notwithstanding falling fertility rates and
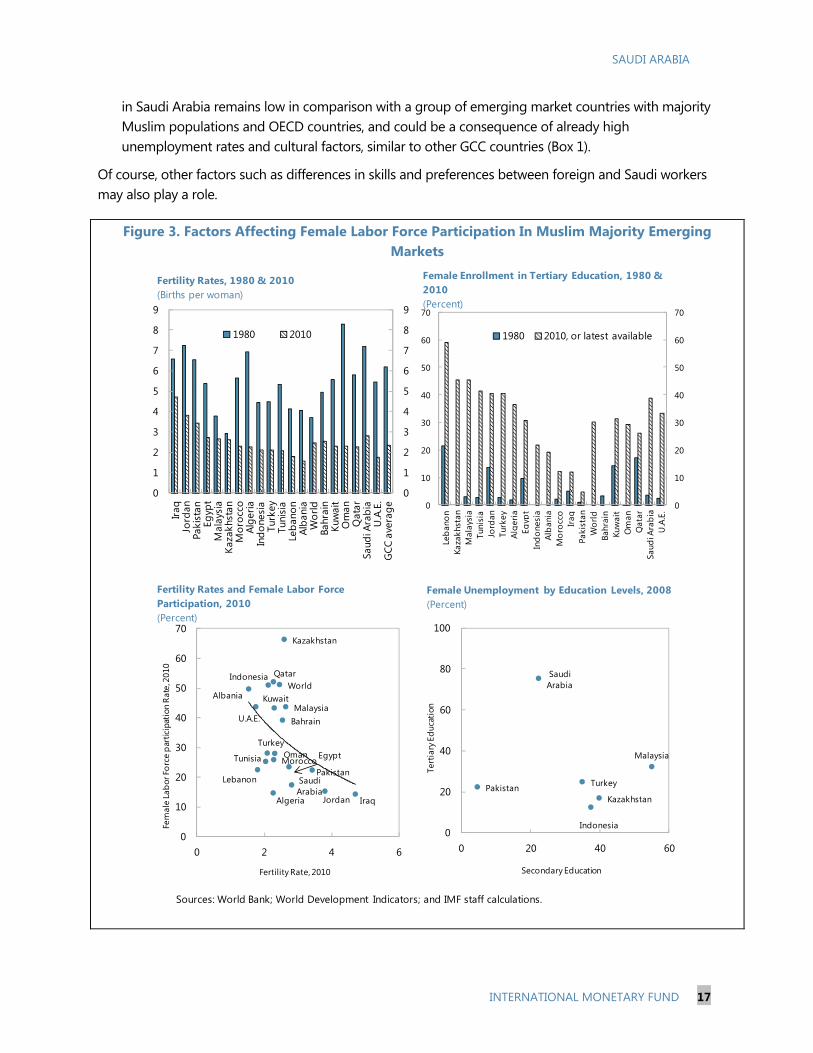
rising education levels. The recent rise in FLFP in Saudi Arabia—from 12 percent in 2006 to 16 percent in 2012—is likely a result of falling fertility rates and rising education levels among women (Figure 3), as well as the announcement of the jobseekers allowance (Hafiz) in 2011. Despite this increase, FLFP
Sources: Central Department of Statistics and Information; Manpower Research Bulletin (2012); Ministry of Labor; General Organization of Social Insurance; and IMF staff calculations.1/Assumes General administration and Education are government services, and Trade and Hospitality are growing at the same rates.
0.0
1.0
2.0
3.0
4.0
5.0
0.0
1.0
2.0
3.0
4.0
5.0
Read
& w
rite
Prim
ary s
choo
l
Juni
or h
igh
scho
ol
Seco
ndar
y sch
ool
Dip
lom
a
Bach
elor
's d
egre
e
Mas
ter's
deg
ree
PhD
Adva
nced
deg
ree
Fello
wsh
ips
Saudi to Non-Saudi Monthly Wages in the Private Sector by Education, 2009(Ratio)
Agriculture
Petroleum
Mfg.
Utilities
Constrn.
TradeHospitality
Transport
BankingReal estate
Social services
Other
Total
R² = 0.3716
0.0
1.0
2.0
3.0
4.0
5.0
6.0
7.0
0 20 40 60 80 100
Aver
age
nom
inal
wag
es fo
r Sau
di w
orke
rs, 2
009
(SAR
000
s)
Saudi Employment, 2009 (in percent of total)
Saudization and Average Wages in the Private Sector, 2009
-2
0
2
4
6
8
10
12
14
16
-2.00
0.00
2.00
4.00
6.00
8.00
10.00
12.00
14.00
16.00
Agric
ultu
re
Bank
ing
Real
est
ate
Petr
oleu
m
Soci
al se
rvic
es
Gen
eral
adm
in.
Educ
atio
n
Cons
trn.
Mfg
.
Trad
e
Hos
pita
lity
Tran
spor
t
Util
ities
Average Real GDP Growth 1/
Contribution to Saudi Employment Growth
GDP Growth and Contribution to Growth in Saudi Employment by Sector, 2009-12(Percent)
0
500
1,000
1,500
2,000
2,500
0
500
1,000
1,500
2,000
2,500Ph
.D.
Mas
ter's
Bach
elor
's
Dip
lom
a
Seco
ndar
y
Inte
rmed
iate
Prim
ary
Oth
er
Saudis Non-Saudis
Total Employment by Nationality and Education Status, 2012(Thousands)
SAUDI ARABIA
INTERNATIONAL MONETARY FUND 17
in Saudi Arabia remains low in comparison with a group of emerging market countries with majority Muslim populations and OECD countries, and could be a consequence of already high unemployment rates and cultural factors, similar to other GCC countries (Box 1).
Of course, other factors such as differences in skills and preferences between foreign and Saudi workers may also play a role.
Figure 3. Factors Affecting Female Labor Force Participation In Muslim Majority Emerging Markets
Sources: World Bank; World Development Indicators; and IMF staff calculations.
0
1
2
3
4
5
6
7
8
9
0
1
2
3
4
5
6
7
8
9
Iraq
Jord
anPa
kist
anEg
ypt
Mal
aysi
aKa
zakh
stan
Mor
occo
Alge
riaIn
done
sia
Turk
eyTu
nisi
aLe
bano
nAl
bani
aW
orld
Bahr
ain
Kuw
ait
Om
anQ
atar
Saud
i Ara
bia
U.A
.E.
GCC
ave
rage
1980 2010
Fertility Rates, 1980 & 2010(Births per woman)
0
10
20
30
40
50
60
70
0
10
20
30
40
50
60
70
Leba
non
Kaza
khst
anM
alay
sia
Tuni
sia
Jord
anTu
rkey
Alge
riaEg
ypt
Indo
nesi
aAl
bani
aM
oroc
coIra
qPa
kist
anW
orld
Bahr
ain
Kuw
ait
Om
anQ
atar
Saud
i Ara
bia
U.A
.E.
1980 2010, or latest available
Female Enrollment in Tertiary Education, 1980 & 2010(Percent)
Albania
Algeria
Egypt
Indonesia
IraqJordan
Kazakhstan
Lebanon
Malaysia
MoroccoPakistan
Tunisia
Turkey
World
Bahrain
Kuwait
Oman
Qatar
Saudi Arabia
U.A.E.
0
10
20
30
40
50
60
70
0 2 4 6
Fertility Rate, 2010
Fem
ale
Labo
r For
ce p
artic
ipat
ion
Rate
, 201
0
Fertility Rates and Female Labor Force Participation, 2010(Percent)
Indonesia
Kazakhstan
Malaysia
Pakistan Turkey
Saudi Arabia
0
20
40
60
80
100
0 20 40 60
Secondary Education
Tert
iary
Edu
catio
n
Female Unemployment by Education Levels, 2008(Percent)

SAUDI ARABIA
18 INTERNATIONAL MONETARY FUND
-20
-15
-10
-5
0
5
10
15
20
25
-20
-15
-10
-5
0
5
10
15
20
25
Bahrain Kuwait Oman Qatar Saudi Arabia
UAE GCC
ResidualSchoolingNumber of children per womanChange in female labor force participation (FLFP) rate
Explained Change in FLFP, 1990–2010(Ages 25-54, percentage points)
Sources: ILO; KILM database; and IMF staff estimates.
-60
-50
-40
-30
-20
-10
0
-60
-50
-40
-30
-20
-10
0
Bahrain Kuwait Oman Qatar Saudi Arabia
UAE GCC
ResidualSchoolingNumber of children per womanChange in female labor force participation rate
Explained Difference between GCC and OECD FLFP, 1990–2010(Ages 25-54, percentage points)
Sources: ILO; KILM database; and IMF staff estimates.
Box 1. What Explains Low Female Labor Force Participation in the GCC?1 Across the world, female labor force participation has increased as women have become more educated and have fewer children. This change can in part be explained as the result of labor supply decisions, where women choose how to allocate their time based on an evaluation of the relative costs and benefits, as in Becker’s (1965) time allocation framework. In this framework, women choose between leisure, supplying labor to home production (such as child rearing), and supplying labor to the market and earning a wage (i.e., being part of the labor force). The outcome will then depend on the return to market labor, which will tend to increase with education levels, and the costs and quantity of home production, which will tend to decrease with fewer children.
Observed drivers of female labor force participation (FLFP) in other countries are also at play in the GCC. Based on analysis of detailed data for OECD countries covering 1960–2008, Steinberg and Nakane (2012) estimate the impact on FLFP from a series of explanatory variables. Applying their coefficients to GCC data indicates that increased schooling and the declining number of children per woman explain the bulk of the increase in FLFP seen in the GCC since 1990. The fit of the model is generally fairly good, with comparatively small unexplained residuals for most GCC countries. For Saudi Arabia, however, the actual increase in FLFP has been considerably smaller than predicted.
The model also explains some—but not all—of the gap in FLFP between GCC countries and the OECD mean. This gap currently ranges between 19 percentage points in Qatar and 53 percentage points in Saudi Arabia. The part of the gap that is explained by differences in schooling and the number of children per woman ranges from 14 percentage points in the UAE to 24 percent in Saudi Arabia. In all countries, however, there remains an unexplained residual of the same sign. These results indicate that there are additional factors, such as different cultural norms, that stand behind the GCC’s low FLFP rates and that these factors have remained relevant over time.
_____________________
1 Prepared by Tobias Rasmussen.

SAUDI ARABIA
INTERNATIONAL MONETARY FUND 19
B. Labor Market Policies and Their Impact
Education
3. The authorities have made significant investments in higher education to enable productive private sector employment for new Saudi labor force entrants. Large investments in higher education and training (domestically and abroad) are targeted towards improving the human capital and productivity of Saudi labor market entrants. Domestic enrollments in university education have nearly quadrupled between 1995/96 and 2010/11 (Figure 4). Female enrollment in university education has grown as a share of the total, from 47 percent in 1995/96 to 54 percent in 2010/11. Enrollment in technical and vocational training has doubled over the same period, and the authorities are currently providing scholarships to over 100,000 students to study abroad. These initiatives are aimed at promoting a knowledge-based economy with high productivity and private sector wages. Despite these efforts, to-date the Saudi education system lags that of many other countries in terms of the scores students achieve on internationally standardized tests in mathematics and science (see TIMMS, 2011) and large numbers of less-educated Saudis continue to remain out of the labor force (Figure 5).5 In addition, significant numbers of college educated women have also opted out of the labor force, due to factors mentioned above.
Sources: SAMA; and Central Department of Statistics and Information.
Sources: SAMA; and Central Department of Statistics and Information.
5 Less-educated Saudis are considered as workers with less than secondary education. Highly-educated Saudis are considered as workers with more than secondary education.
0
100
200
300
400
500
600
700
800
900
1000
0
100
200
300
400
500
600
700
800
900
1000
1995/96 2010/11
Male Female
Figure 4. Domestic Enrollment in Tertiary Education by Gender, 1995/96 & 2010/11 (000s)
0
1000
2000
3000
4000
5000
6000
0
1000
2000
3000
4000
5000
6000
Male Female
Doctorate
Graduate (Higher Diploma, Master)Bachelor
Diploma
Secondary or equivalent
Figure 5. Saudi Population Out of the Labor Force by Education and Gender, 2012 (000s)

SAUDI ARABIA
20 INTERNATIONAL MONETARY FUND
0
50
100
150
200
250
300
350
400
450
500
0
50
100
150
200
250
300
350
400
450
500
Male Female
Doctorate Graduate (Higher Diploma, Master)
Bachelor Diploma
Secondary or equivalent Less than secondary
Figure 6. Saudi Unemployment by Education and Gender, 2012 (000s)
Source: Central Department of Statistics and Information.
4. Continuing to improve the quality of education and reducing barriers to female employment could help support a knowledge-based economy. In 2012, significant numbers of men and women with tertiary education were unemployed, pointing to a potential skills mismatch between the education system and the labor market (Figure 6). In particular, women with university degrees accounted for over 70 percent of female unemployment. Going forward, addressing weaknesses in the education system and barriers faced by women in accessing employment could help support a knowledge-based economy. Options that could help increase FLFP include improving access to transportation, better childcare services, and flexible work arrangements such as teleworking.
Active labor market policies
5. In 2011, labor market reforms were implemented to boost private sector employment of nationals, while providing a safety net for the unemployed. Key measures included:
The jobseekers allowance (Hafiz) program to provide young, unemployed Saudis with a monthly allowance of SAR 2000 for a maximum period of one year, conditional on their participation in job search and training activities. Job placement and training services have been expanded.
A revamped Saudization (Nitaqat) program with sector- and firm-size based employment quotas, to encourage firms to hire Saudis. Sanctions are imposed on non-compliant firms.
A minimum wage of SAR 3000 for Saudi workers in the public sector.
6. Since then, authorities have continued to develop labor market policies to improve the competitiveness of Saudi workers in the private sector. Recent additional measures that are in process are:
Fees imposed on companies with a majority of expatriate workers (SAR 200 per month per foreign worker) are being used to finance an expansion in the scope and duration of wage subsidies for Saudi workers in companies that are compliant with Nitaqat requirements.
A de facto minimum wage for Saudi workers is being required for firms to earn full Nitaqat credits.
Improvements to the internal mobility and bargaining power of expatriate workers. Expatriate workers in firms that do not meet their Nitaqat requirements are now allowed to change

SAUDI ARABIA
INTERNATIONAL MONETARY FUND 21
employers freely, while firms that are compliant are allowed to hire more expatriate workers. This is accompanied by stricter enforcement of work permits for foreign workers.
Increasing opportunities for female employment, with specific sectors (e.g. retail) being targeted.
An unemployment assistance scheme is under consideration to provide a broad social safety net, while also examining measures to improve the employment flexibility of Saudi workers.
7. Experience in other GCC countries with similar labor market policies indicates tradeoffs and a mixed record of success. Many GCC countries have implemented private sector employment quotas for nationals (see Table). While these quotas have helped boost employment of nationals, they have been implemented inconsistently over time, and may have contributed to ghost employment and higher bargaining power and salaries of nationals.6 In Bahrain and Oman, education and vocational training programs for nationals have been financed through levies on foreign workers and have helped strengthen private sector hiring of nationals. While these levies are likely to have helped reduce demand for expatriates, these are often inadequate to eliminate the wage differential on their own, and may result in an adverse impact on costs and potential output. On the other hand, wage subsidies that are unlimited in duration and differentiated by education and family status have been used successfully in Kuwait, although these require careful monitoring to ensure they are not captured by employers. Improvements in labor mobility and bargaining power of foreign workers appear to have contributed to narrowing the wage differential between nationals and foreign labor in Bahrain and Oman.
Employment Quota
Education and Training
Fees on foreign workers
Wage subsidy Internal mobility
Bahrain √ √ √ √ √ Kuwait √ √ √
Oman √ √ √ √
Qatar √ √
Saudi Arabia √ √ √ √ √
UAE. √ √ √
8. More generally, international experience indicates that a successful model for labor market policies is to “protect workers, not jobs” and to implement quotas gradually. Enhancing unemployment benefits can help protect workers, while reducing excessive employment protection can help efficient allocation of human resources, encourage greater hiring, and increase investment in human capital.7 Research also suggests a need for gradualism in the implementation of employment quotas, to preserve the incentives for qualified candidates to invest in skills (Fryer and Loury, 2005).
6 See Baldwin-Edwards (2011), and Gonzalez and others (2008). 7 See Blanchard, Jaumotte, and Loungani (2013).
SAUDI ARABIA
22 INTERNATIONAL MONETARY FUND
-10
-5
0
5
10
15
20
25
-150
-75
0
75
150
225
300
375
450
Doc
tora
te
Gra
duat
e
Bach
elor
Dip
lom
a
Seco
ndar
y
Inte
rmed
iate
Prim
ary
othe
r
Male (000s)
Female (000s)
Average wages, 2009 (SAR, 000s, RHS)
Unemploymentbenefit of SARs 2000 per month
Sources: Manpower Research Bulletin; Ministry of Labor; and IMF staff calculations.
Figure 7. Change in Saudi Employment by Gender, Education and Average Wages, Dec. 2009-Dec. 2012(000s)
-150
-50
50
150
250
350
450
-150
-50
50
150
250
350
450
Petr
oleu
m
Mfg
.
Util
ities
Bank
ing
Real
est
ate
Soci
al s
ervi
ces
Oth
er
Gen
eral
adm
in
Educ
atio
n
Agr
icul
ture
Cons
trn.
Trad
e
Hos
pita
lity
Tran
spor
t
Saudis Non-Saudis
Figure 8. Change in Employment by Sector and Nationality, Dec. 2011–Dec. 2012 (000s of workers)
Sources: Manpower Research Bulletin; Ministry of Labor; and IMF staff calculations.
Saudi wages > SAR 3000 per month in 2009
Saudi wages < SAR 3000 per month in
2009
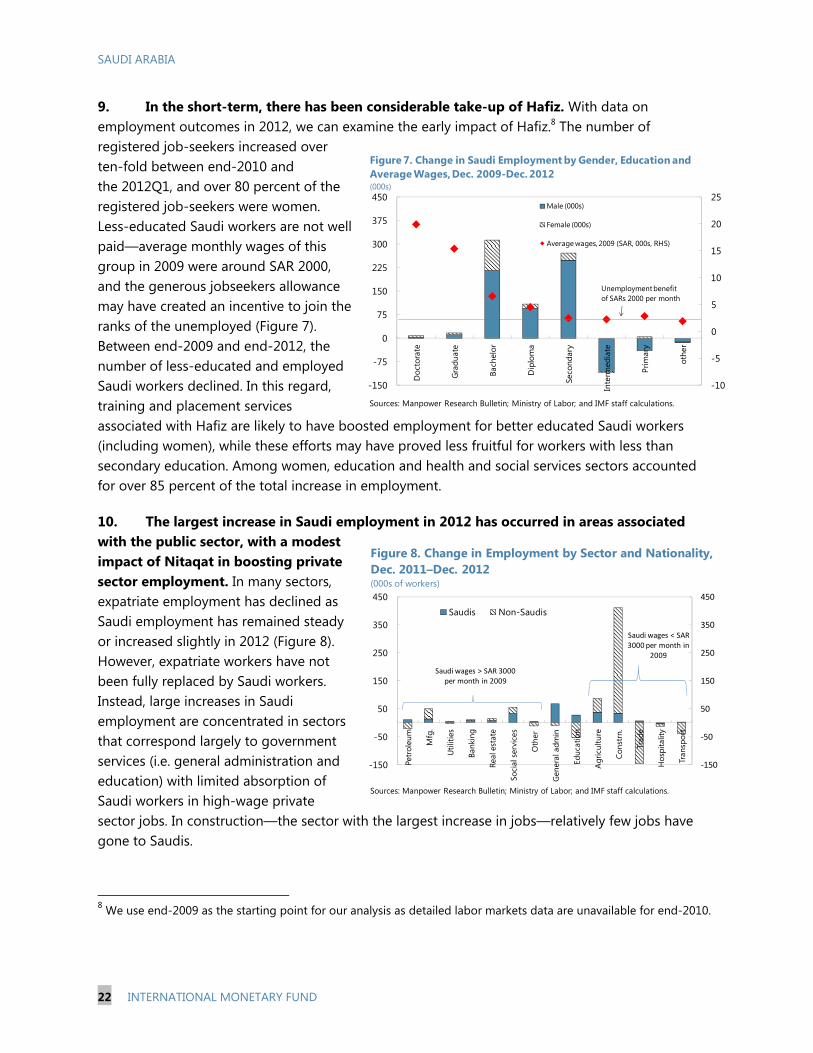
9. In the short-term, there has been considerable take-up of Hafiz. With data on employment outcomes in 2012, we can examine the early impact of Hafiz.8 The number of registered job-seekers increased over ten-fold between end-2010 and the 2012Q1, and over 80 percent of the registered job-seekers were women. Less-educated Saudi workers are not well paid—average monthly wages of this group in 2009 were around SAR 2000, and the generous jobseekers allowance may have created an incentive to join the ranks of the unemployed (Figure 7). Between end-2009 and end-2012, the number of less-educated and employed Saudi workers declined. In this regard, training and placement services associated with Hafiz are likely to have boosted employment for better educated Saudi workers (including women), while these efforts may have proved less fruitful for workers with less than secondary education. Among women, education and health and social services sectors accounted for over 85 percent of the total increase in employment.
10. The largest increase in Saudi employment in 2012 has occurred in areas associated with the public sector, with a modest impact of Nitaqat in boosting private sector employment. In many sectors, expatriate employment has declined as Saudi employment has remained steady or increased slightly in 2012 (Figure 8). However, expatriate workers have not been fully replaced by Saudi workers. Instead, large increases in Saudi employment are concentrated in sectors that correspond largely to government services (i.e. general administration and education) with limited absorption of Saudi workers in high-wage private sector jobs. In construction—the sector with the largest increase in jobs—relatively few jobs have gone to Saudis.
8 We use end-2009 as the starting point for our analysis as detailed labor markets data are unavailable for end-2010.

SAUDI ARABIA
INTERNATIONAL MONETARY FUND 23
11. The introduction of a minimum private sector wage for employers to earn full Nitaqat credits could further increase wage differentials between low-skilled Saudi and expatriate workers. Saudi workers already earn a much higher wage than non-Saudi workers (Figure 2). Employers are now required to pay a minimum wage of SAR 3000 a month to Saudi workers to earn a full Nitaqat credit.9 For private sector Saudi workers whose current wages are lower than the new Saudi minimum wage, this would further widen wage differentials and raise costs for employers that hire Saudi workers, although the increased costs could be offset by wage subsidies. Of course, in sectors where the minimum wage is not binding, (i.e. for more skilled Saudi workers) it will be less distortionary. In contrast, the fee of SAR 200 per expatriate worker would raise costs of foreign labor to employers, and would partially narrow the wage gap.
12. Easing labor market regulations could help boost employment. The Global Competitiveness Report 2012 has highlighted labor market efficiency as a key weakness of the generally favorable business environment in Saudi Arabia, especially due to high redundancy costs and inefficient use of talent. The high employment protection afforded to workers is likely an important contributing factor as it reduces incentives for human capital formation and hinders labor mobility. In this regard, the unemployment benefit that is currently under consideration, which should be set at an appropriate level to not adversely affect employment incentives, and could be combined with an easing in employment protection to improve labor market flexibility.
13. Increased Saudization has the potential to address Saudi unemployment, but may result in higher inflation. For instance, if Saudi employment in high-wage sectors (manufacturing, real estate, other) reached 50 percent (15 percent currently), this could potentially create over 750,000 Saudi jobs, more than enough to address Saudi unemployment in the near-term. An important constraint on this policy would be the availability of the requisite skills and work experience among the Saudi labor force. Additionally, as wages of Saudi employees are significantly higher than those of non-Saudis, this could raise wage costs and prices, although at this time the wage bill is relatively low share of overall business costs.
C. Conclusion
14. Demographic trends point to a continuing need to generate large numbers of jobs for potential labor market entrants. Based on the demographics of a rapidly expanding youth population, staff estimates of non-oil GDP growth, and past trends in employment, it is projected that Saudi unemployment could increase by up to 1.4 million over the course of the next decade. The government has introduced a number of measures to boost Saudi employment. Early evidence suggests considerable take up of Hafiz, but a mixed impact of Nitaqat.
9 Employers can count a Saudi employee as a “full employee” only if the wage is above the minimum wage. For employees earning less, they are considered only “half” a Saudi employee.

SAUDI ARABIA
24 INTERNATIONAL MONETARY FUND
15. Improving Saudi employment prospects will require careful implementation of policies. A broad social consultation on key aspects of the labor markets strategy and key policies will be crucial to manage the macroeconomic impact and assure their success. Reducing the reliance on public sector employment will be essential to set expectations. Improving the competitiveness of Saudi workers could be accomplished through imposing fees for expatriate labor and/or granting wage subsidies for private sector Saudi workers, but these need careful monitoring to minimize capture by employers. Improvements to the internal mobility of foreign workers can also enhance their bargaining power and gradually narrow the wage differential. Unemployment assistance benefits for Saudi workers should be set at a level and duration to not discourage employment, and ought to be combined with an easing of employment protection to improve labor market flexibility.
16. Supporting a knowledge-based economy will require improvements in the quality of education and expanding opportunities for women. Expanding education and training is appropriate, but the focus should be on quality with the careful tracking of educational achievement and private sector requirements. With rising education levels amongst women, it will be important to consider additional ways of further expanding employment opportunities to utilize their human capital. Unemployment of highly educated women in Saudi Arabia is high by international standards, and this reduces the productive potential of the economy.
References
Baldwin-Edwards, M., 2011, “Labor Immigration and Labor Markets in the GCC Countries: National Patterns and Trends”, Research Paper, Kuwait Program on Development, Governance and Globalization in the Gulf States (15).
Blanchard, O., F. Jaumotte, and P. Loungani, 2013, “Labor Market Policies and IMF Advice in Advanced Economies During the Great Recession,” IMF Staff Discussion Note SDN/13/02 (Washington: International Monetary Fund).
Fryer, R. G. Jr., and G. C. Loury, 2005, "Affirmative Action and Its Mythology," Journal of Economic Perspectives, American Economic Association, Vol. 19(3), pp. 147–162.
Gonzalez, G., L. A. Karoly, L. C. H. Salem, and C. A. Goldman, (2011), “Facing Human Capital Challenges of the 21st Century: Education and Labor Market Initiatives in Lebanon, Oman, Qatar, and the United Arab Emirates”, Rand Qatar Policy Institute.

SAUDI ARABIA
INTERNATIONAL MONETARY FUND 25
92%
8%
Figure 1. Central Government Revenues, 2012 (Percent)
Oil revenues
Non-oil revenues
Source: Country authorities.
ASSESSING FISCAL POLICY AND FISCAL RISKS IN SAUDI ARABIA1
Over the last ten years, Saudi Arabia has significantly reduced its vulnerability to fiscal risks. Saudi Arabia has built up considerable fiscal buffers, by smoothing short-term fluctuations in oil prices following a prudent and conservative budget formulation strategy. This has led to the reduction of the large debt stock accumulated during the 1980s–1990s, and the buildup of large external reserves. This paper reviews fiscal vulnerabilities arising from changes in oil prices, assesses the current risk management strategy, and evaluates the extent of fiscal risks based upon a monitoring framework outlined in Baldacci et al (2011). For most risk indicators, Saudi fiscal variables are found to be comfortably below the risk thresholds in this framework. Nevertheless, this risk mitigation approach also carries potential costs, particularly in terms of the absence of a medium term budgetary framework and more generally ensuring expenditure efficiency.
A. Fiscal Risks from Oil Prices
1. For several decades, Saudi Arabia has faced unique challenges managing fiscal risks. This is due to the dominance of the oil sector in the overall economy and the fiscal accounts. As a proportion of both GDP and total revenues, the oil sector provides the bulk of fiscal resources. For example, in 2012, oil revenues accounted for 92 percent of Saudi total revenues (Figure 1). At the same time, oil revenues exhibit high volatility and uncertainty compared to other tax revenues, and are exhaustible, raising important inter-temporal fiscal issues.
2. High oil prices and large fiscal surpluses in recent years have placed limitations on the extent of non-oil revenue diversification. The non-oil tax regime is comparatively light. There is no personal income tax applied to Saudi citizens, nor is there a VAT. At the same time, the Saudi authorities have made efforts to diversify the tax regime, particularly in the area of corporate taxation.2 A comprehensive state revenue law was introduced in 2005 and further amended in 2010.3
Nevertheless, it has proved difficult for the authorities to justify raising non-oil revenues at a time when the overall fiscal balances have been in surplus and oil prices have continued to rise.
1 Prepared by Cornelius Fleischhaker, Padamja Khandelwal, Malin Hu, and Jimmy McHugh. 2 Non-oil revenues had increased from 9.3 percent of non-oil GDP in 2003 to 16 percent in 2008. More recently, the ratio has fallen to 10.2 percent in 2012. 3 State Revenue Law, Royal Decree No. M/68, dated 18/11/1431H.

SAUDI ARABIA
26 INTERNATIONAL MONETARY FUND
-60
-40
-20
0
20
40
60
80
100
120
140
160
-60
-40
-20
0
20
40
60
80
100
120
140
160
1997 1999 2001 2003 2005 2007 2009 2011 2013
Prices HP trend Difference
Sources: Datastream; and IMF staff estimates.
Figure 2. Oil Spot Prices, 1997–2013(US$ per barrel)
Furthermore, raising non-oil tax revenues could in part undermine other policy objectives, notably diversifying the economy and increasing private sector employment.
B. Oil Revenue Volatility and Expenditure Management
3. Revenue volatility has posed considerable difficulties for the Saudi authorities. A short-lived drop in oil prices in 2009, which led to an overall deficit of 5.4 percent of GDP, highlighted the fiscal vulnerabilities associated with oil price shocks. Revenue volatility has also interacted with extended periods of depressed oil prices to complicate fiscal policy management. During the 1980s and 1990s, the oil price remained low for a sustained period of time, and government debt increased sharply.4
4. The ever-present short term fiscal challenge has been to shield Saudi public expenditures from excessive volatility of oil revenues (Figure 2). In particular, the authorities have tried to find mechanisms to reduce fiscal risks and avoid expenditure cycles driven by oil prices, whereby non-discretionary expenditures accelerate sharply during times when oil prices are high, creating structural fiscal difficulties if prices fall. 5. To partly address this difficulty, in recent years the Saudi budget has been based upon conservative assumptions for both the oil price and expenditures. As the fiscal year has unfolded and revenues have invariably over-performed relative to initial conservative assumptions, additional expenditures have been approved. As a consequence, the Saudi budget has been consistently lower than the actual out-turn by a considerable margin. Since 2006, actual expenditures have been, on average, some 26 percent higher than budgeted expenditures (Figure 3).
4 This experience, when oil revenues were subdued for an extended period, underscores the magnitude of fiscal buffers available to the authorities. Should lower oil revenues result in a depletion of the current stock of foreign exchange reserves, the authorities could in principle return to capital markets.
0
200
400
600
800
1000
0
200
400
600
800
1000
2006 2007 2008 2009 2010 2011 2012
Figure 3. Saudi Arabia Expenditures, 2006–12 (SAR billion)
Budget expenditures
non budget expenditures
Source: Country authorities.
Additional within-year

SAUDI ARABIA
INTERNATIONAL MONETARY FUND 27
6. This conservative budget formulation strategy has helped contain expenditure volatility. In terms of real expenditures, volatility has fallen significantly over the last twenty or so years. During the period 1998–2004, the variance of real expenditure growth was 1.8. During 2005–12, the variance had fallen to 0.4. However, additional within year budget expenditures continue to move pro-cyclically with respect to oil prices. A simple comparison between changes in oil prices and the additional within year expenditures suggests a strong positive relationship (Figure 4).
7. The current budget strategy provides an important bulwark for managing fiscal risks. In principle, it provides the ministry of finance with additional flexibility to contain expenditures should oil revenues fail to materialize. At the same time, an excessively large discretionary component to expenditures may impede the development of an effective medium term expenditure framework, since a significant proportion of expenditures are tied to within-year oil revenue developments. Moreover, the discretionary component of the budget may also raise expectations within line ministries that within year unanticipated expenditures can always be accommodated, thus reducing incentives for effective pre-budget assessment of future financial needs. Therefore, a smaller discretionary component of expenditures could enforce stronger expenditure management at the line ministries and provide the basis for developing a medium term expenditure framework.
8. There is some evidence that the flexibility of this buffer has weakened over time. In 2006, purchases of goods and services accounted for almost 80 percent of additional within year expenditures. This ratio declined to around 40 percent in 2012, while the proportion of additional within year expenditures allocated to capital items has increased to 40 percent, and compensation of employees accounted for 20 percent. Both capital and wage expenditures are budget items that involve multi-year commitments and should be included in the initial budget assessment.
C. The Fiscal Stance 2003–13
9. An examination of the Saudi fiscal stance over the last ten years highlights the strengths and weaknesses of the current risk management strategy. To provide an overall assessment of the recent fiscal stance it is important to rely on several fiscal indicators. In oil producing countries, the overall or primary balances are not a good guide for assessing the fiscal stance, as they do not adequately capture the impact of policy changes on aggregate demand or on adjustment efforts since exogenous changes in oil prices dominate any changes in fiscal policies.
Trend including 2009
Trend excluding 2009
6
10
14
-40 -30 -20 -10 0 10 20 30 40Non
-bud
get
expe
nditu
res
(per
cent
of n
on-o
il G
DP)
Oil price (annual percent change)
Figure 4. Oil Prices and Additional Within-year Expenditures(Percent)
Source: Country authorities.

SAUDI ARABIA
28 INTERNATIONAL MONETARY FUND
10. A structural balance rule provides governments with a fiscal anchor that smoothes oil price volatility while calibrating spending and saving decisions based on the long-term trend of oil revenues.5 Structural balances also help in the assessment of the fiscal stance corrected for the impact of the oil cycle on revenues. In the short-term, a cyclically neutral fiscal stance is when authorities target a particular structural balance. It follows that improvements (worsening) in the structural balance in years when oil prices are in a downswing (upswing) would be considered pro-cyclical; worsening (improvements) in the structural balance in years when oil prices are in a downswing (upswing) would be considered countercyclical.
11. In Figure 5, structural revenues are calculated by assuming that the long-term oil price is the average oil price from the past five years. Long-term oil output is computed as a three year moving average including the current year. Based on this rule, the authorities have achieved a slightly negative (-1.3 percent of non-oil GDP) structural balance on average since 2003, reflecting a significant structural deficit in the earlier years. A structural surplus has been achieved on average since 2006. In recent years, Saudi fiscal developments can be characterized as: Strong expenditure growth 2003–08. As oil prices rose rapidly, real expenditures increased as
well, but less than structural revenues. Structural balances improved and became positive in 2006–08 (Table).
Expenditure stabilization 2009. For a short period, oil prices fell dramatically, pushing the overall balance into deficit. Relying on fiscal buffers accumulated during the period of high oil prices, the authorities stabilized the expenditures as a percent of non-oil GDP. The structural balance deteriorated slightly, implying a countercyclical stance in light of low oil prices.
Fiscal expansion 2010–11. More recently, the fiscal stance was expansionary and pro-cyclical as events of the Arab Spring in 2011 spurred a large increase in expenditures and the structural balance turned negative.
5 This approach computes “structural oil revenues” on the basis of a “long-term oil price” and “long-term oil output”. Revenues that are in excess (below) the structural revenues are considered to be the cyclical or non-structural component of revenues. A structural balance of zero, which matches expenditures to structural revenues, builds up precautionary saving buffers in years when prices are above the long term price. For additional details, see “Macroeconomic Policy Frameworks for Resource-Rich Developing Countries”, IMF Policy Paper, 2012.
-25
-5
15
35
55
75
95
115
135
-25
-5
15
35
55
75
95
115
135
2003 2004 2005 2006 2007 2008 2009 2010 2011 2012 2013
Non-structural oil revenues structural oil revenues
Non-oil revenues
Actual spending Structural balance spending
Source: IMF staff estimates.1 Structural oil revenue is computed using the average oil price from the last 5 years and the 3-year average output (including current year).
Figure 5. Saudi Structural Revenue and SpendingDecomposition, 2003–131
(Percent of non-oil GDP)
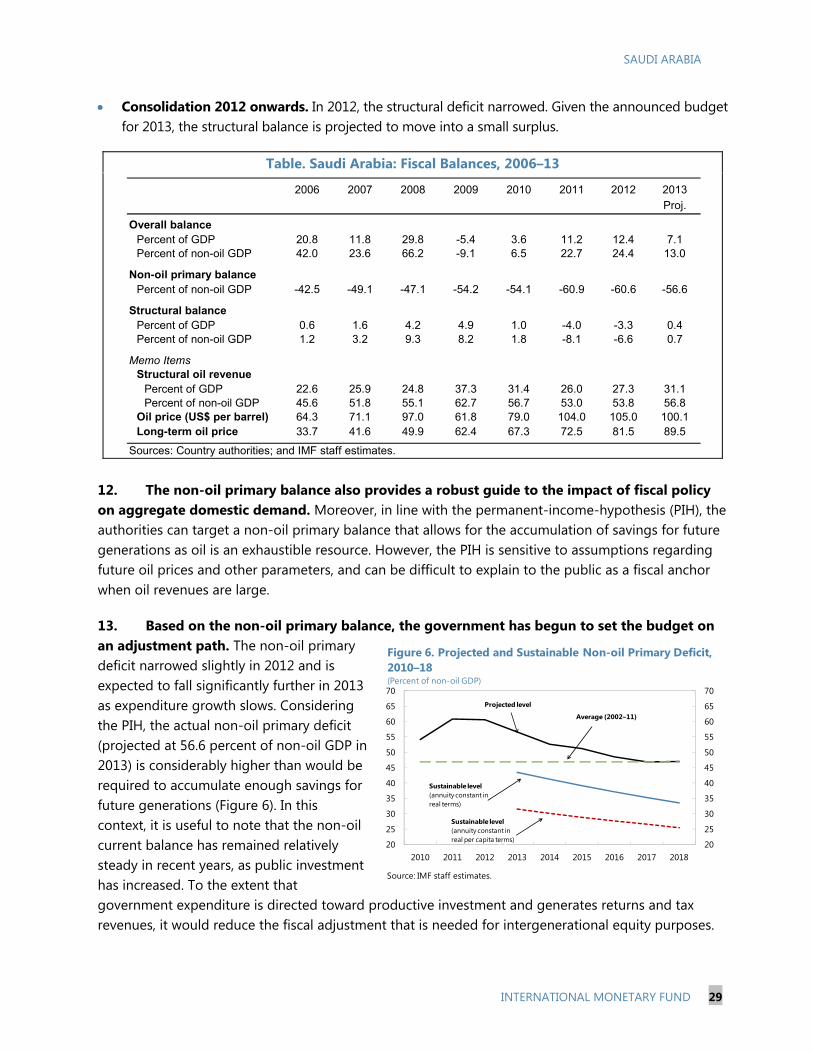
SAUDI ARABIA
INTERNATIONAL MONETARY FUND 29
Consolidation 2012 onwards. In 2012, the structural deficit narrowed. Given the announced budget for 2013, the structural balance is projected to move into a small surplus.
Table. Saudi Arabia: Fiscal Balances, 2006–13
12. The non-oil primary balance also provides a robust guide to the impact of fiscal policy on aggregate domestic demand. Moreover, in line with the permanent-income-hypothesis (PIH), the authorities can target a non-oil primary balance that allows for the accumulation of savings for future generations as oil is an exhaustible resource. However, the PIH is sensitive to assumptions regarding future oil prices and other parameters, and can be difficult to explain to the public as a fiscal anchor when oil revenues are large.
13. Based on the non-oil primary balance, the government has begun to set the budget on an adjustment path. The non-oil primary deficit narrowed slightly in 2012 and is expected to fall significantly further in 2013 as expenditure growth slows. Considering the PIH, the actual non-oil primary deficit (projected at 56.6 percent of non-oil GDP in 2013) is considerably higher than would be required to accumulate enough savings for future generations (Figure 6). In this context, it is useful to note that the non-oil current balance has remained relatively steady in recent years, as public investment has increased. To the extent that government expenditure is directed toward productive investment and generates returns and tax revenues, it would reduce the fiscal adjustment that is needed for intergenerational equity purposes.
2006 2007 2008 2009 2010 2011 2012
Proj.
Overall balancePercent of GDP 20.8 11.8 29.8 -5.4 3.6 11.2 12.4 7.1Percent of non-oil GDP 42.0 23.6 66.2 -9.1 6.5 22.7 24.4 13.0
Non-oil primary balance Percent of non-oil GDP -42.5 -49.1 -47.1 -54.2 -54.1 -60.9 -60.6 -56.6
Structural balancePercent of GDP 0.6 1.6 4.2 4.9 1.0 -4.0 -3.3 0.4Percent of non-oil GDP 1.2 3.2 9.3 8.2 1.8 -8.1 -6.6 0.7
Memo ItemsStructural oil revenue
Percent of GDP 22.6 25.9 24.8 37.3 31.4 26.0 27.3 31.1Percent of non-oil GDP 45.6 51.8 55.1 62.7 56.7 53.0 53.8 56.8
Oil price (US$ per barrel) 64.3 71.1 97.0 61.8 79.0 104.0 105.0 100.1Long-term oil price 33.7 41.6 49.9 62.4 67.3 72.5 81.5 89.5
Sources: Country authorities; and IMF staff estimates.
2013
20
25
30
35
40
45
50
55
60
65
70
20
25
30
35
40
45
50
55
60
65
70
2010 2011 2012 2013 2014 2015 2016 2017 2018
Source: IMF staff estimates.
Sustainable level (annuity constant in real terms)
Sustainable level (annuity constant in real per capita terms)
Projected level
Average (2002–11)
Figure 6. Projected and Sustainable Non-oil Primary Deficit, 2010–18 (Percent of non-oil GDP)

SAUDI ARABIA
30 INTERNATIONAL MONETARY FUND
D. Assessing Fiscal Risks
14. In order to look beyond the fiscal risks presented by changes in oil prices and the overall fiscal stance, a set of Saudi fiscal indicators is compared to a peer group of emerging market economies. The choice of indicators was based on a consistent conceptual framework developed by Baldacci et al (2011). These indicators are grouped into clusters which seek to answer three key questions regarding fiscal sustainability:
Basic fiscal variables: Are the debt dynamics and current policies consistent with fiscal solvency?
Asset and liability management: Does the composition of government’s assets and liabilities expose countries to large rollover needs?
Long-term fiscal trends: To what extent will demographic related challenges affect projected fiscal variables and impact solvency risks?
15. For each indicator, a crisis threshold is estimated on the basis of a univariate procedure that maximizes the likelihood of predicting a fiscal crisis. This threshold, when exceeded, indicates a higher degree of fiscal stress. In order to make the data comparable across indicators, the data is expressed as Z-scores, where the score for fiscal variable x at time t is defined as:
where and is, respectively, the standard deviation and mean of the fiscal indicator for peer group of emerging economies covering the period 2001–11.
Results
16. The assessment of the fiscal risks facing Saudi Arabia shows a relatively comfortable fiscal position. The distribution of out-turns for a peer group of emerging economies are plotted for each indicator, along with the out-turn for Saudi Arabia, as well as the risk threshold (Figure 7 and 8).
Long term fiscal risks—Reflecting the deep recent reductions in gross public debt, coupled with the large fiscal surpluses, Saudi Arabia is well below the risk threshold for gross public debt and the cyclically adjusted primary balance. In the case of the interest rate-growth differential, Saudi Arabia is slightly above the threshold. This reflects the forward looking nature of this indicator. The latest WEO projections point to a slight downward movement in oil prices over the medium term, which will result in the terms of trade falling and the growth rate of nominal GDP being subdued over the medium term and below that of real GDP. However, when government debt is low, as in the case of Saudi Arabia, the interest rate-growth dynamics are not important for fiscal sustainability.

SAUDI ARABIA
INTERNATIONAL MONETARY FUND 31
Public Sector Asset and Liability Management—The risk indicators in this cluster emphasize the strong fiscal buffers built up over the last 10 or so years. In terms of gross financing need, Saudi Arabia has minimal debt-rollover requirements while the large surpluses have meant that foreign exchange reserves have increased markedly. In recent years, Saudi Arabia has not issued any short term public debt thus eliminating an important vulnerability seen in many other countries.
Long-term fiscal risks—Saudi Arabia’s strong demographic trends indicate that long term fiscal risks are low. The fertility rate is well above the replacement ratio. Future projections of the retirement replacement ratio are also comfortable. Although the ratio is projected to decrease over the next two decades, the projected ratio of workers to retirees remains comparatively high. The indicator for pensions, which measures the projected change in expenditures over thirty years, is slightly above the risk threshold. Currently, Saudi pension expenditures are low at around 2 percent of GDP, reflecting a relatively young population. Pension expenditures are projected to increase to 4 percent of GDP within the next two decades. This increase is large relative to the peer group of countries. However, it should also be noted that the Saudi pensions system has considerable assets to mitigate the fiscal risks in this area. Furthermore, the favorable demographics will contribute to a further build up of assets that should in part offset the projected increase in pension expenditure. Finally, the indicator for future health expenditures is also below the risk threshold.

SAUDI ARABIA
32 INTERNATIONAL MONETARY FUND
Figure 7. Saudi Arabia: Fiscal Risk Indicators, 2012 (Z-scores)
Sources: WEO; and IMF staff estimates.Notes: Red line indicates the risk threshold. The blue line represents the 2012 out-turn for Saudi Arabia. Each chart represents the z-scores for each variable for a peer group of emerging economies covering the period 2001–2011.
0
10
20
30
40
50
60
70
80
90
0
10
20
30
40
50
60
70
80
90
-4 -3 -2 -1 0 1 2 3 4
Freq
uenc
y
Gross Public Debt
Higher risk
0
10
20
30
40
50
60
70
80
90
0
10
20
30
40
50
60
70
80
90
-4 -3 -2 -1 0 1 2 3 4
Cyclically Adjusted Primary Balance
Higher risk
0
10
20
30
40
50
60
70
80
90
0
10
20
30
40
50
60
70
80
90
-4 -3 -2 -1 0 1 2 3 4
Freq
uenc
y
Interest Rate/Growth Differential
Higher risk
0
10
20
30
40
50
60
70
80
90
0
10
20
30
40
50
60
70
80
90
-4 -3 -2 -1 0 1 2 3 4
Gross Financing Need
Higher risk

SAUDI ARABIA
INTERNATIONAL MONETARY FUND 33
Figure 8. Saudi Arabia: Fiscal Risk Indicators, 2012
Sources: WEO; and IMF staff estimates.Red line indicates the risk threshold. The blue line represents the 2012 out-turn for Saudi Arabia. Each chart represents the z-scores for each variable for a peer group of emerging economies covering the period 2001–2011.
0
10
20
30
40
50
60
70
80
90
0
10
20
30
40
50
60
70
80
90
-4 -3 -2 -1 0 1 2 3 4
Freq
uenc
y Fertility Rate
Higher risk
0
10
20
30
40
50
60
70
80
90
0
10
20
30
40
50
60
70
80
90
-4 -3 -2 -1 0 1 2 3 4
Change in Dependency Ratio
Higher risk
0
10
20
30
40
50
60
70
80
90
0
10
20
30
40
50
60
70
80
90
-4 -3 -2 -1 0 1 2 3 4
Freq
uenc
y
Long Term Pensions Expenditure
Higher risk
0
10
20
30
40
50
60
70
80
90
0
10
20
30
40
50
60
70
80
90
-4 -3 -2 -1 0 1 2 3 4
Long Term Health Expenditure
Higher risk

SAUDI ARABIA
34 INTERNATIONAL MONETARY FUND
E. Managing Future Fiscal Policy
17. If oil prices were to moderate over the medium-term, this would have implications for Saudi fiscal policy and could weigh on growth. In this scenario, the authorities would have to consider whether to slow real expenditure growth while continuing to smooth expenditures to account for ongoing revenue volatility. Over the forecast horizon (2013–18), assuming the authorities continue to spend in line with structural revenues, real expenditures would be broadly flat on average. This is in contrast to the annual growth in real expenditure of over 11 percent in recent years (Figure 9).
18. Slower expenditure growth will have implications for the broader economy. Estimated short-run fiscal multipliers of about 0.2 would indicate a downward drag on non-oil GDP growth of almost 1¾ percent in the near-term; a long-run multiplier of 0.5 indicates a downward drag of 4½ percent over three years (Espinoza and Senhadji, 2011).
19. Looking beyond smoothing oil price volatility, the authorities will need to consider issues of intergenerational equity. Fiscal buffers, while large, are consistent with what would be needed for precautionary reasons to smooth oil price volatility. Saving for future generations would likely require additional accumulation of assets, although this could be partly offset by returns from public investment.
F. Conclusion
20. Oil price volatility has long been the key risk factor for fiscal policy in Saudi Arabia. As recently as 2009, a sharp fall in prices pushed the overall balance into a deficit of just over 5 percent of GDP compared to a surplus of almost 30 percent of GDP recorded in the previous year. Notwithstanding the large revenue shock in 2009, Saudi Arabia has enjoyed a period of strong oil revenue growth. This has permitted a sizable increase in real public expenditures, the accumulation of public savings and international reserves, and the near elimination of the public debt that was built up during the 1980s and 1990s when the oil price was low. Government deposits in the banking system increased to approximately SAR 1.5 trillion at end-2012, equivalent to nearly 20 months of expenditure. As a consequence, the fiscal position has strengthened enormously and the authorities are in a position to smooth a temporary decline in oil prices.
0
25
50
75
100
125
150
0
25
50
75
100
125
150
2003 2005 2007 2009 2011 2013 2015 2017
Structural expenditures
Real expenditure out-turn (staff projections)
Source: IMF staff estimates.
Figure 9. Path of Real Government Spending, 2003–18(Index, 2010=100)

SAUDI ARABIA
INTERNATIONAL MONETARY FUND 35
21. An assessment of risks that extends beyond oil price volatility confirms Saudi Arabia’s strong fiscal position. The public sector debt-to-GDP ratio is low relative to a peer group of emerging economies; short term public debt has been retired, and long term demographics indicate very limited risk vulnerabilities. Nevertheless, the authorities’ strategy of using conservative oil price assumptions in the budget to contain fiscal risks has come at the expense of weaker medium expenditure planning.
22. In principle, oil price volatility could be managed within the budget planning process, by setting the expenditure envelope in line with an estimate of “structural” oil revenues. This would provide the basis of a more explicit medium term expenditure strategy which could enhance expenditure efficiency.
References
Baldacci, E., J. McHugh and I. Petrova, 2011, “Indicators of Fiscal Vulnerability and Fiscal Stress,” IMF Working Paper 11/94 (Washington, DC: International Monetary Fund).
Baldacci, E., Petrova, I., Belhocine, N., Dobrescu, G., and S. Mazraani, (2011) “Assessing Fiscal Stress,” (Washington: International Monetary Fund ).
Cottarelli, C. (2011) “The Risk Octagon: A Comprehensive Framework for Assessing Sovereign Risks” presented in University of Rome “La Sapienza,” January. Available via the Internet: www.imf.org/external/np/fad/news/2011/docs/Cottarelli1.pdf
Espinoza R.,, and A. Senhadji, 2011, “How Strong are Fiscal Multipliers in the GCC? An Empirical Investigation”, IMF Working Paper WP/11/61 (Washington: International Monetary Fund).

SAUDI ARABIA
36 INTERNATIONAL MONETARY FUND
PRODUCTIVITY GROWTH AND POTENTIAL OUPUT IN SAUDI ARABIA1
The Central Department of Statistics (CDSI) has recently released revised national accounts data that significantly changed the path of real GDP growth over the past decade. Average overall GDP and non-oil GDP growth from 2005–11 are now estimated at 6.4 percent and 8.4 percent per annum in real terms, respectively, compared to 3.9 percent and 5.3 percent previously. The improved coverage of the non-oil sector is the main reason for the revisions. In light of the substantial upward revision to the GDP data, this paper revisits the issue of productivity growth in Saudi Arabia, and reassesses estimates of medium term potential growth, especially for the non-oil sector. The paper has three main conclusions: (i) labor productivity and TFP growth in the non-oil economy over 2005–11 have been stronger than previously thought, at around 2.5 percent and 2.2 percent per annum; (ii) nevertheless, capital accumulation remains the principal driver of growth in the non-oil sector; and (iii) both time-series filters and a growth accounting methodology suggest that potential growth in the non-oil sector is around 5-6 percent.
A. Dynamics of Output and Factor Inputs
1. Non-oil sector growth accelerated significantly after 2000, averaging over 6.3 percent annually, compared to less than 2.7 percent in the 1990s.2 The private sector was the key driver behind the stronger non-oil sector growth, with an annual growth rate close to 7 percent after 2000, while growth in the public non-oil sector was about 4.7 percent on average during the same period. In contrast, oil sector growth was the most volatile series among the three, and averaged only 2.3 percent (Figure 1). As a result, the non-oil sector is playing an increasingly important role in driving economic growth in Saudi Arabia in recent years (Figure 2).
1 Prepared by Haonan Qu. 2 Throughout this note, we divide the Saudi economy into three broad sectors: oil sector, public sector (government services and public utilities), and private sector (all other economic activities). The public sector and private sector constitute the non-oil sector in this context. Import duties are excluded for the purpose of the analysis.
-15%
-10%
-5%
0%
5%
10%
15%
20%
25%
-15%
-10%
-5%
0%
5%
10%
15%
20%
25%
1990 1992 1994 1996 1998 2000 2002 2004 2006 2008 2010 2012
Figure 1. Real Output Growth, 1990–2012
oil private
public non oil
Source: CDSI.
0%10%20%30%40%50%60%70%80%90%100%
0%10%20%30%40%50%60%70%80%90%
100%
1990 1992 1994 1996 1998 2000 2002 2004 2006 2008 2010 2012
Figure 2. Sector Shares in Real GDP, 1990–2012
oil private public
Source: CDSI.

SAUDI ARABIA
INTERNATIONAL MONETARY FUND 37
0.00
0.02
0.04
0.06
0.08
0.10
0.12
0.00
0.02
0.04
0.06
0.08
0.10
0.12
2000 2001 2002 2003 2004 2005 2006 2007 2008 2009 2010 2011
Non-oil
Non-oil (old)
Source: CDSI.
Figure 3. Non-oil Growth Revision, 2000–11
2. The acceleration in growth in the private sector, however, could be partly due to the way the GDP data has been revised. The revised data is only available from 2004 onward. Prior to this, staff has used the growth rates of the old GDP series to splice together a continuous GDP series back to 1990. However, since the revision shows a substantial rise in the non-oil sector growth rate (Figure 3), this could suggest under-recording of non-oil GDP growth in the earlier years.
3. Factor inputs have been generally increasing to support growth, although at different rates. Not surprisingly, they had the most robust growth in the private sector (Figures 4 and 5). The increase in labor input in the private sector since 2000, growing 5.4 percent per annum on average, was mainly driven by the increasing number of expatriate workers. While public sector employment was stable throughout the 1990s, it started to pick up in 2000. Similarly, public investment was declining in real terms prior to 2000, but has grown quickly since. Indeed, real public investment increased more than six fold between 2000 and 2011. In the oil sector, investment had been relatively low, rose substantially in 2006–07, and has remained flat thereafter. Employment growth in the oil sector has been steady, although it is low relative to other sectors. It should be noted, however, that the official data may underestimate employment because of the presence of illegal immigrant workers in Saudi Arabia. This could affect the results of the analysis both in terms of the level and growth dynamics.
Figure 4. Employment, 1990–2012 Figure 5. Real Investment, 1990–2011
0.00
0.02
0.04
0.06
0.08
0.10
0.12
0.14
0
1
2
3
4
5
6
7
8
1990 1992 1994 1996 1998 2000 2002 2004 2006 2008 2010 2012
(Millions)
Private Public Oil (RHS)
Sources: CDSI; SAMA; and IMF staff estimates.
020406080100120140160180200
020406080
100120140160180200
1990 1992 1994 1996 1998 2000 2002 2004 2006 2008 2010
(Billions of 1999 SARs)
Sources: CDSI; SAMA and IMF staff estimates.
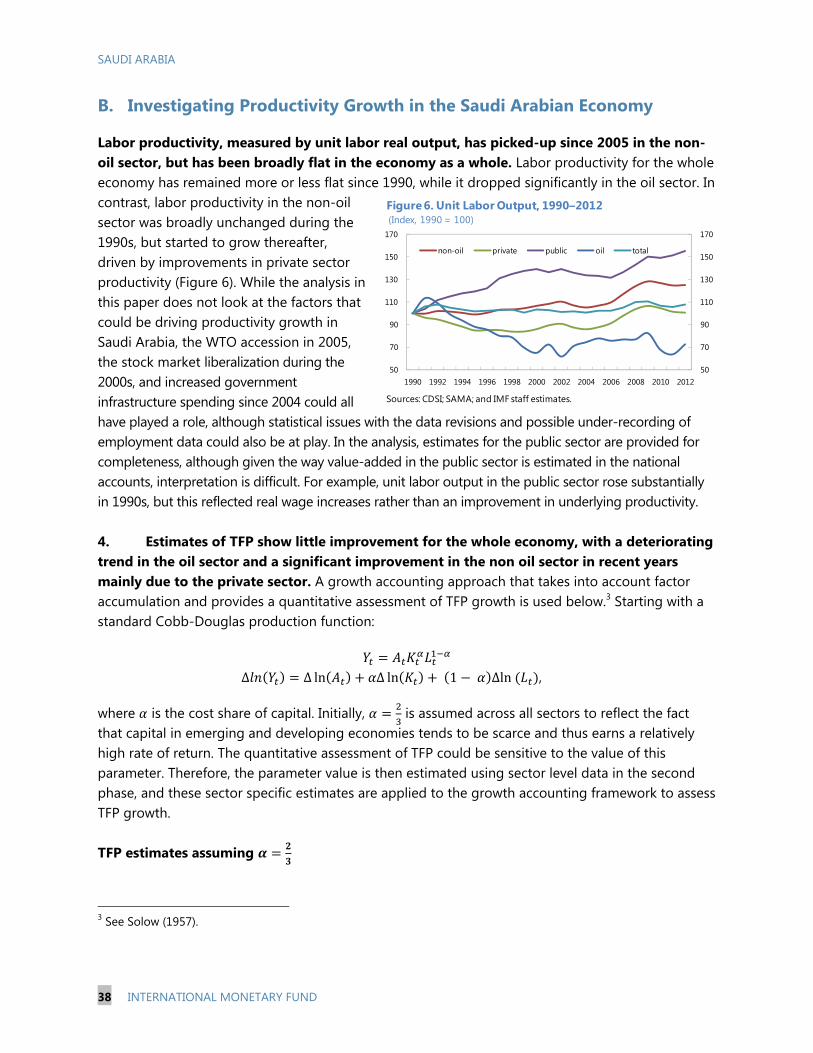
SAUDI ARABIA
38 INTERNATIONAL MONETARY FUND
B. Investigating Productivity Growth in the Saudi Arabian Economy
Labor productivity, measured by unit labor real output, has picked-up since 2005 in the non-oil sector, but has been broadly flat in the economy as a whole. Labor productivity for the whole economy has remained more or less flat since 1990, while it dropped significantly in the oil sector. In contrast, labor productivity in the non-oil sector was broadly unchanged during the 1990s, but started to grow thereafter, driven by improvements in private sector productivity (Figure 6). While the analysis in this paper does not look at the factors that could be driving productivity growth in Saudi Arabia, the WTO accession in 2005, the stock market liberalization during the 2000s, and increased government infrastructure spending since 2004 could all have played a role, although statistical issues with the data revisions and possible under-recording of employment data could also be at play. In the analysis, estimates for the public sector are provided for completeness, although given the way value-added in the public sector is estimated in the national accounts, interpretation is difficult. For example, unit labor output in the public sector rose substantially in 1990s, but this reflected real wage increases rather than an improvement in underlying productivity. 4. Estimates of TFP show little improvement for the whole economy, with a deteriorating trend in the oil sector and a significant improvement in the non oil sector in recent years mainly due to the private sector. A growth accounting approach that takes into account factor accumulation and provides a quantitative assessment of TFP growth is used below.3 Starting with a standard Cobb-Douglas production function:
Δ Δ ln Δ ln 1 Δln ,
where is the cost share of capital. Initially, is assumed across all sectors to reflect the fact that capital in emerging and developing economies tends to be scarce and thus earns a relatively high rate of return. The quantitative assessment of TFP could be sensitive to the value of this parameter. Therefore, the parameter value is then estimated using sector level data in the second phase, and these sector specific estimates are applied to the growth accounting framework to assess TFP growth. TFP estimates assuming
3 See Solow (1957).
50
70
90
110
130
150
170
50
70
90
110
130
150
170
1990 1992 1994 1996 1998 2000 2002 2004 2006 2008 2010 2012
Figure 6. Unit Labor Output, 1990–2012(Index, 1990 = 100)
non-oil private public oil total
Sources: CDSI; SAMA; and IMF staff estimates.

SAUDI ARABIA
INTERNATIONAL MONETARY FUND 39
5. For the economy as a whole, TFP growth averaged less than 0.6 percent per year over the period. TFP in the oil sector has been declining at a rate of 1.7 percent a year, and by even more in recent years (Figure 7). The estimates show a positive average TFP growth rate of 1.3 percent in the non-oil sector. Private sector TFP grew quickly in recent years, averaging 3.4 percent since 2005, although it averaged close to zero (-0.3 percent) over the whole period. For the public sector, the average growth rate of TFP was 2.4 percent. It mostly comes from the period of near zero employment growth and reduced capital stock due to the subdued investment in the public sector. Estimates of TFP growth vary with the value of the cost share of capital assumed, although the parameter value does not change the results qualitatively (Table 1).
Figure 7. Growth Decomposition with Assumed Cost Share of Capital
Source: IMF staff estimates.
-0.04
-0.02
0.00
0.02
0.04
0.06
0.08
0.10
-0.04
-0.02
0.00
0.02
0.04
0.06
0.08
0.10
1990 1992 1994 1996 1998 2000 2002 2004 2006 2008 2010
Total
TFP Capital Labor Output
-0.20
-0.15
-0.10
-0.05
0.00
0.05
0.10
0.15
0.20
0.25
0.30
-0.20
-0.15
-0.10
-0.05
0.00
0.05
0.10
0.15
0.20
0.25
0.30
1990 1992 1994 1996 1998 2000 2002 2004 2006 2008 2010
Oil
-0.02
0.00
0.02
0.04
0.06
0.08
0.10
0.12
-0.02
0.00
0.02
0.04
0.06
0.08
0.10
0.12
1990 1992 1994 1996 1998 2000 2002 2004 2006 2008 2010
Non-oil
-0.06
-0.04
-0.02
0.00
0.02
0.04
0.06
0.08
0.10
0.12
0.14
-0.06
-0.04
-0.02
0.00
0.02
0.04
0.06
0.08
0.10
0.12
0.14
1990 1992 1994 1996 1998 2000 2002 2004 2006 2008 2010
Private
Table 1. TFP Growth Estimates, 1990–2011
Alpha Total Oil Non-oil Private Public
0.90 0.6 -1.7 1.4 -0.4 2.50.67 0.6 -1.7 1.3 -0.3 2.40.50 0.5 -1.6 1.2 -0.3 2.30.30 0.5 -1.6 1.1 -0.3 2.2
0.90 -0.2 -9.0 2.9 3.7 -1.30.67 0.0 -7.2 2.8 3.4 -0.50.50 0.2 -6.0 2.7 3.1 0.10.30 0.4 -4.5 2.6 2.8 0.8
Source: IMF staff estimates.
(Percent)
1990–2011
2005–2011
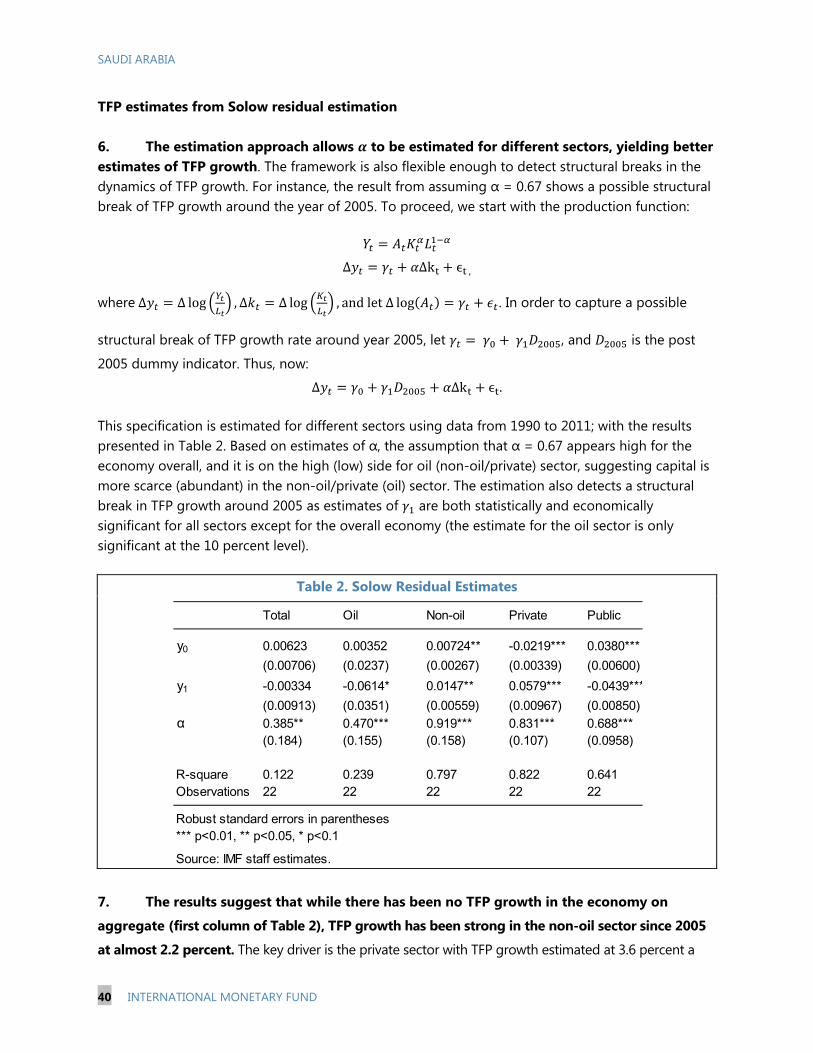
SAUDI ARABIA
40 INTERNATIONAL MONETARY FUND
TFP estimates from Solow residual estimation 6. The estimation approach allows to be estimated for different sectors, yielding better estimates of TFP growth. The framework is also flexible enough to detect structural breaks in the dynamics of TFP growth. For instance, the result from assuming α = 0.67 shows a possible structural break of TFP growth around the year of 2005. To proceed, we start with the production function:
Δ Δk ,
where Δ Δ log , Δ Δ log , and let Δ log . In order to capture a possible
structural break of TFP growth rate around year 2005, let , and is the post
2005 dummy indicator. Thus, now:
Δ Δk .
This specification is estimated for different sectors using data from 1990 to 2011; with the results presented in Table 2. Based on estimates of α, the assumption that α = 0.67 appears high for the economy overall, and it is on the high (low) side for oil (non-oil/private) sector, suggesting capital is more scarce (abundant) in the non-oil/private (oil) sector. The estimation also detects a structural break in TFP growth around 2005 as estimates of are both statistically and economically significant for all sectors except for the overall economy (the estimate for the oil sector is only significant at the 10 percent level).
Table 2. Solow Residual Estimates
7. The results suggest that while there has been no TFP growth in the economy on
aggregate (first column of Table 2), TFP growth has been strong in the non-oil sector since 2005
at almost 2.2 percent. The key driver is the private sector with TFP growth estimated at 3.6 percent a
Total Oil Non-oil Private Public
y0 0.00623 0.00352 0.00724** -0.0219*** 0.0380***
(0.00706) (0.0237) (0.00267) (0.00339) (0.00600)
y1 -0.00334 -0.0614* 0.0147** 0.0579*** -0.0439***
(0.00913) (0.0351) (0.00559) (0.00967) (0.00850)α 0.385** 0.470*** 0.919*** 0.831*** 0.688***
(0.184) (0.155) (0.158) (0.107) (0.0958)
R-square 0.122 0.239 0.797 0.822 0.641Observations 22 22 22 22 22
Robust standard errors in parentheses*** p<0.01, ** p<0.05, * p<0.1
Source: IMF staff estimates.

SAUDI ARABIA
INTERNATIONAL MONETARY FUND 41
year after 2005. Figure 8 shows the sectoral contributions to growth using the respective estimates of α
from Table 2. Again, however, how much of the break in 2005 is due to economic versus statistical issues
is not clear.
Figure 8. Growth Decomposition with Estimated Cost Share of Capital
8. Capital accumulation is the key driver of non-oil sector growth. The estimates of the cost share of capital are much higher for the non-oil sector than the oil sector, which reflects capital scarcity in the non oil sector and at the same time makes capital accumulation more effective at generating growth in the sector. Table 3 presents the average factor contribution to growth over the period 2000–11 using these estimates. The TFP contribution estimates for the oil sector are negative on average in both estimation methods. This could reflect the increasing difficulty of oil extraction as oil fields mature,4 or it could reflect the decision of Saudi Arabia to increase investment so as to have enough spare production capacity to ensure the global oil market remains well supplied in the event of unexpected demand or supply developments.
4 See Tazimas et al. (2005).
Source: IMF staff estimates.
-0.04
-0.02
0.00
0.02
0.04
0.06
0.08
0.10
-0.04
-0.02
0.00
0.02
0.04
0.06
0.08
0.10
1990 1992 1994 1996 1998 2000 2002 2004 2006 2008 2010
Total
TFP Capital Labor Output
-0.20
-0.15
-0.10
-0.05
0.00
0.05
0.10
0.15
0.20
0.25
-0.20
-0.15
-0.10
-0.05
0.00
0.05
0.10
0.15
0.20
0.25
1990 1992 1994 1996 1998 2000 2002 2004 2006 2008 2010
Oil
-0.02
0.00
0.02
0.04
0.06
0.08
0.10
0.12
-0.02
0.00
0.02
0.04
0.06
0.08
0.10
0.12
1990 1992 1994 1996 1998 2000 2002 2004 2006 2008 2010
Non-oil
-0.06
-0.04
-0.02
0.00
0.02
0.04
0.06
0.08
0.10
0.12
0.14
-0.06
-0.04
-0.02
0.00
0.02
0.04
0.06
0.08
0.10
0.12
0.14
1990 1992 1994 1996 1998 2000 2002 2004 2006 2008 2010
Private

SAUDI ARABIA
42 INTERNATIONAL MONETARY FUND
Table 3. Average Contribution to Real Output Growth, 2000–11
C. Estimates of Potential Output in Saudi Arabia
9. Robust growth of output in the non-oil sector is likely to continue going forward. Time series techniques are used to assess trend growth over the medium term of different sectors. These include filtering approaches that isolate high-frequency from low frequency components (Hodrick-Prescott, Baxter and King, and Christiano and Fitzgerald filters), and the Beveridge and Nelson decomposition. Estimates of growth rates from different methods are presented in Table 4. The average of these estimates is used to calculate trend growth. The private sector is expected to continue to be a key driver of non-oil growth with the highest growth rate of 6 percent over the projection period. Figure 9 shows the trend output growth dynamics over the medium term.
Table 4. Average Estimated Output Growth, 2012–18
Total Oil Non-oil Private Public
Real output growth 5.2 2.0 6.3 7.0 4.6
Alpha = 0.67Labor 1.6 0.9 1.6 1.8 1.3Capital 3.4 5.2 2.7 3.5 2.4TFP 0.2 -4.1 1.9 1.7 0.9
Solow residual estimationLabor 2.9 1.5 0.4 0.9 1.2Capital 1.9 3.7 3.8 4.4 2.5TFP 0.3 -3.1 2.1 1.7 0.9
Source: IMF staff estimates.
(Percent)
Oil Non-oil Private Public
HP 1.4 5.9 6.4 4.2
BK 1.5 5.4 6.0 3.8
CF 1.5 5.6 6.1 3.9
BN 1.6 4.7 5.4 3.2
Source: IMF staff estimates.
(Percent)
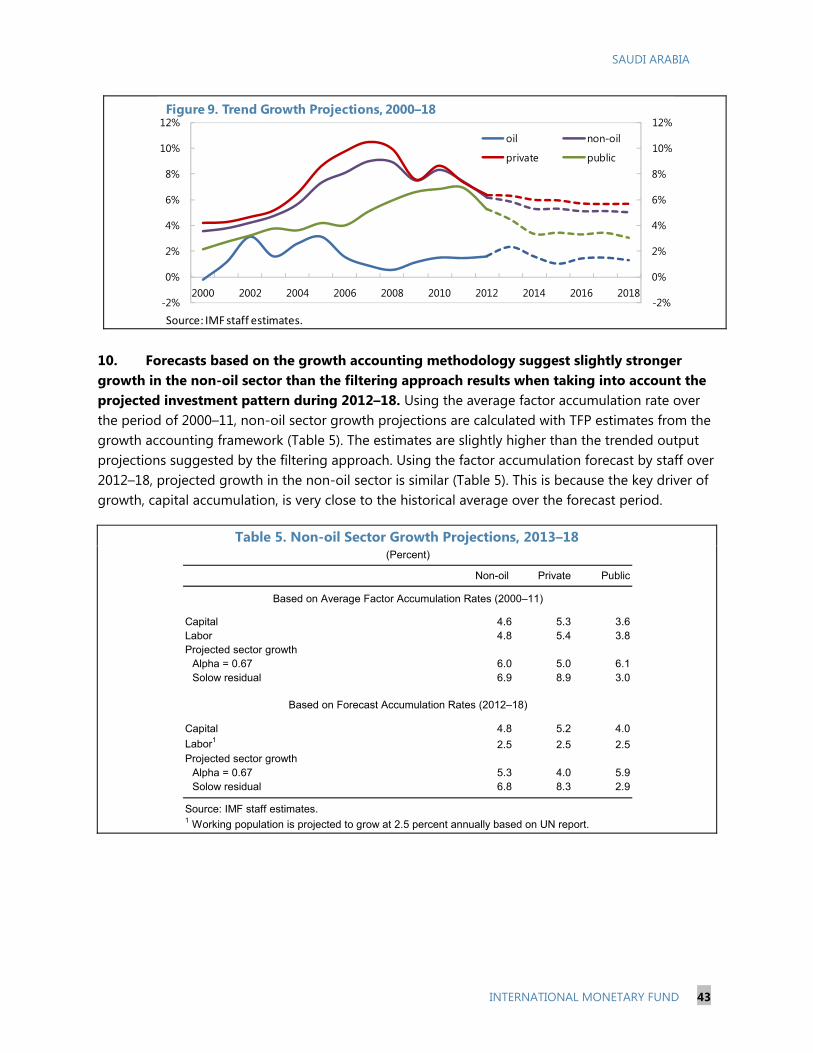
SAUDI ARABIA
INTERNATIONAL MONETARY FUND 43
10. Forecasts based on the growth accounting methodology suggest slightly stronger growth in the non-oil sector than the filtering approach results when taking into account the projected investment pattern during 2012–18. Using the average factor accumulation rate over the period of 2000–11, non-oil sector growth projections are calculated with TFP estimates from the growth accounting framework (Table 5). The estimates are slightly higher than the trended output projections suggested by the filtering approach. Using the factor accumulation forecast by staff over 2012–18, projected growth in the non-oil sector is similar (Table 5). This is because the key driver of growth, capital accumulation, is very close to the historical average over the forecast period.
Table 5. Non-oil Sector Growth Projections, 2013–18
-2%
0%
2%
4%
6%
8%
10%
12%
-2%
0%
2%
4%
6%
8%
10%
12%
2000 2002 2004 2006 2008 2010 2012 2014 2016 2018
Figure 9. Trend Growth Projections, 2000–18
oil non-oil
private public
Source: IMF staff estimates.
Non-oil Private Public
Capital 4.6 5.3 3.6Labor 4.8 5.4 3.8Projected sector growth
Alpha = 0.67 6.0 5.0 6.1Solow residual 6.9 8.9 3.0
Capital 4.8 5.2 4.0
Labor12.5 2.5 2.5
Projected sector growthAlpha = 0.67 5.3 4.0 5.9Solow residual 6.8 8.3 2.9
Source: IMF staff estimates.1 Working population is projected to grow at 2.5 percent annually based on UN report.
Based on Average Factor Accumulation Rates (2000–11)
Based on Forecast Accumulation Rates (2012–18)
(Percent)

SAUDI ARABIA
44 INTERNATIONAL MONETARY FUND
11. The non-oil sector growth, which has surpassed potential in recent years driven by the expansionary fiscal policy, is likely to cool down and converge to potential over the medium term. The potential non-oil sector growth path between 2000 and 2011 is constructed using the long term factor accumulation rates and smoothed TFP growth rates under the growth accounting framework. As shown in Figure 10, actual non-oil growth exceeded its long run over the period of 2004–08, and resulted in a significant pick-up in inflation in 2008. After falling below potential in 2009, non-oil growth exceeded potential in 2010–11. This path, to a large extent, was driven by the growth in real fiscal expenditures since 2004. As fiscal spending moderates over the medium term, as expected by staff, non-oil growth will likely remain around its potential rate over the projected period. D. Conclusion
12. The recently revised GDP data show that productivity in the non-oil sector has been on the rise since 2005, largely driven by the private sector. Nevertheless, the drag from the oil and public sectors means there has been little productivity growth for the overall economy.
13. The analysis suggests that the strong growth of the non-oil sector is likely to continue over the medium term. One caveat to this is that a slowing in the pace of government spending could result in slower factor accumulation going forward.
14. Policies that aim at promoting potential output should target the private non-oil sector where resources appear to be allocated more efficiently. In addition, maintaining the growth momentum in the non-oil sector will be important for the authorities to raise Saudi employment in the economy.
0%
2%
4%
6%
8%
10%
12%
0%
2%
4%
6%
8%
10%
12%
2000 2002 2004 2006 2008 2010 2012 2014 2016 2018
Figure 10. Non Oil Sector Growth, 2000–18
Baseline
Filter Approach
Growth Accounting
Source: IMF staff estimates.

SAUDI ARABIA
INTERNATIONAL MONETARY FUND 45
References
Solow, R. M., 1957, “Technical Change and Aggregate Production Function”, Review of Economics and Statistics, Vol. 39 (3), pp. 312-20 Tzimas, E., A. Georgakaki, C. Garcia Cortes, and S.D. Peteves, 2005, “Enhanced Oil Recovery Using Carbon Dioxide in the European Energy System” European Commission Joint Research Center, Report EUR 21895 EN (Brussels: European Commission Joint Research Center). Hodrick, R, J., and E. Prescott, 1981. "Post-War U.S. Business Cycles: An Empirical Investigation," Discussion Papers 451, Northwestern University, Center for Mathematical Studies in Economics and Management Science (Evanston, IL). Baxter, M., and R. G. King, 1999. "Measuring Business Cycles: Approximate Band-Pass Filters For Economic Time Series," Review of Economics and Statistics, Vol. 81(4), pp. 575-593. Christiano, L. and T.J. Fitzgerald, 2003, “The band pass filter,” International Economic Review, Vol. 44(2), pp. 435-65. Beveridge, S., and C. R. Nelson, 1981, “A new approach to decomposition of economic time series into permanent and transitory components with particular attention to measurement of the ‘business cycle,’” Journal of Monetary Economics, Vol. 7, pp. 151–174