imf country report no. 14/292 saudi arabia · 2014-09-23 · imf country report no. 14/292 saudi...
TRANSCRIPT
©2014 International Monetary Fund
IMF Country Report No. 14/292
SAUDI ARABIA 2014 ARTICLE IV CONSULTATION—STAFF REPORT; PRESS RELEASE
Under Article IV of the IMF’s Articles of Agreement, the IMF holds bilateral discussions with members, usually every year. In the context of the 2014 Article IV consultation with Saudi Arabia, the following documents have been released and are included in this package: The Staff Report prepared by a staff team of the IMF for the Executive Board’s
consideration on July 11, 2014, following discussions that ended on May 15, 2014, with the officials of Saudi Arabia on economic developments and policies. Based on information available at the time of these discussions, the staff report was completed on June 25, 2014.
An Informational Annex prepared by the IMF.
A Press Release (PR) summarizing the views of the Executive Board as expressed during its July 11, 2014 discussion of the staff report that concluded the Article IV consultation with Saudi Arabia.
The policy of publication of staff reports and other documents allows for the deletion of market-sensitive information.
Copies of this report are available to the public from
International Monetary Fund Publication Services 700 19th Street, N.W. Washington, D.C. 20431
Telephone: (202) 623-7430 Telefax: (202) 623-7201 E-mail: [email protected] Internet: http://www.imf.org
Price: $18.00 a copy
International Monetary Fund
Washington, D.C.
September 2014
SAUDI ARABIA
STAFF REPORT FOR THE 2014 ARTICLE IV CONSULTATION
KEY ISSUES
Context. Saudi Arabia’s economy has grown very strongly in recent years, benefitting
from high oil prices and output, strong private sector activity, and government spending.
It has played a systemic and stabilizing role in the global oil market. The economy has
not been affected by the recent global financial market volatility. The Saudi population is
young, growing, and increasingly well educated.
Outlook and risks. The near term economic outlook is positive. Oil production is
expected to be little changed from 2013, while non-oil growth will be underpinned by
strong private sector activity and government spending on large projects in
transportation infrastructure and housing. Inflation is expected to remain subdued. The
main source of risk is the global oil market.
Macroeconomic policies. Fiscal buffers are strong at present, providing macroeconomic
policies with scope to respond to shocks. The current path of fiscal policy would,
however, lead to a substantial erosion of these buffers over the medium-term. Fiscal
adjustment needs to start to preserve these buffers and increase saving for
intergenerational equity purposes. Monetary and macro-prudential policy settings are
appropriate at present. Reforms to the macroeconomic policy framework can help
strengthen macroeconomic management and create an environment conducive to
private investment and job creation.
Managing demographic pressures. A multi-pronged labor market reform program is
increasing the employment of nationals in the private sector and improving the
functioning of the labor market. An ambitious program to boost the supply of housing is
also underway. Energy consumption is high, and price increases are needed to support
efforts to increase energy efficiency and develop public transportation networks.
Economic diversification. Creating a more diversified economy is a challenge given
Saudi Arabia’s vast oil resources. The government is making considerable efforts to lay
the groundwork for further diversification by upgrading infrastructure, strengthening
education and skills, boosting access to finance for SMEs, and improving the business
environment. However, more needs to be done to realign incentives to encourage firms
to export and workers to seek jobs in the private sector.
June 25, 2014
SAUDI ARABIA
2 INTERNATIONAL MONETARY FUND
Approved By Alfred Kammer and
Bob Traa
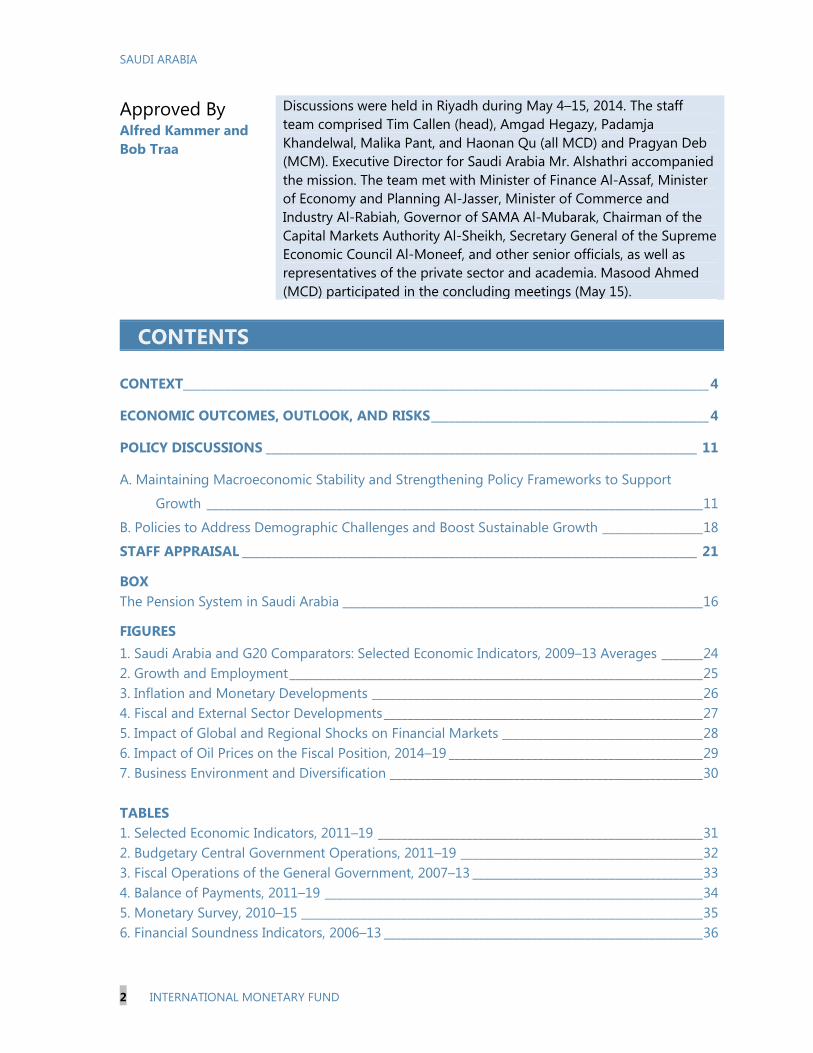
Discussions were held in Riyadh during May 4–15, 2014. The staff
team comprised Tim Callen (head), Amgad Hegazy, Padamja
Khandelwal, Malika Pant, and Haonan Qu (all MCD) and Pragyan Deb
(MCM). Executive Director for Saudi Arabia Mr. Alshathri accompanied
the mission. The team met with Minister of Finance Al-Assaf, Minister
of Economy and Planning Al-Jasser, Minister of Commerce and
Industry Al-Rabiah, Governor of SAMA Al-Mubarak, Chairman of the
Capital Markets Authority Al-Sheikh, Secretary General of the Supreme
Economic Council Al-Moneef, and other senior officials, as well as
representatives of the private sector and academia. Masood Ahmed
(MCD) participated in the concluding meetings (May 15).
CONTENTS
CONTEXT_________________________________________________________________________________________ 4
ECONOMIC OUTCOMES, OUTLOOK, AND RISKS _______________________________________________ 4
POLICY DISCUSSIONS _________________________________________________________________________ 11
A. Maintaining Macroeconomic Stability and Strengthening Policy Frameworks to Support
Growth ____________________________________________________________________________________ 11
B. Policies to Address Demographic Challenges and Boost Sustainable Growth _________________ 18
STAFF APPRAISAL _____________________________________________________________________________ 21
BOX
The Pension System in Saudi Arabia _____________________________________________________________ 16
FIGURES
1. Saudi Arabia and G20 Comparators: Selected Economic Indicators, 2009–13 Averages _______ 24
2. Growth and Employment ______________________________________________________________________ 25
3. Inflation and Monetary Developments ________________________________________________________ 26
4. Fiscal and External Sector Developments ______________________________________________________ 27
5. Impact of Global and Regional Shocks on Financial Markets __________________________________ 28
6. Impact of Oil Prices on the Fiscal Position, 2014–19 ___________________________________________ 29
7. Business Environment and Diversification _____________________________________________________ 30
TABLES
1. Selected Economic Indicators, 2011–19 _______________________________________________________ 31
2. Budgetary Central Government Operations, 2011–19 _________________________________________ 32
3. Fiscal Operations of the General Government, 2007–13 _______________________________________ 33
4. Balance of Payments, 2011–19 ________________________________________________________________ 34
5. Monetary Survey, 2010–15 ____________________________________________________________________ 35
6. Financial Soundness Indicators, 2006–13 ______________________________________________________ 36
SAUDI ARABIA
INTERNATIONAL MONETARY FUND 3
APPENDICES
I. Debt Sustainability Exercise ____________________________________________________________________ 37
II. External Sustainability and Exchange Rate Assessment ________________________________________ 39
III. Key Recommendations of 2011 FSAP Update _________________________________________________ 43
SAUDI ARABIA
4 INTERNATIONAL MONETARY FUND
CONTEXT
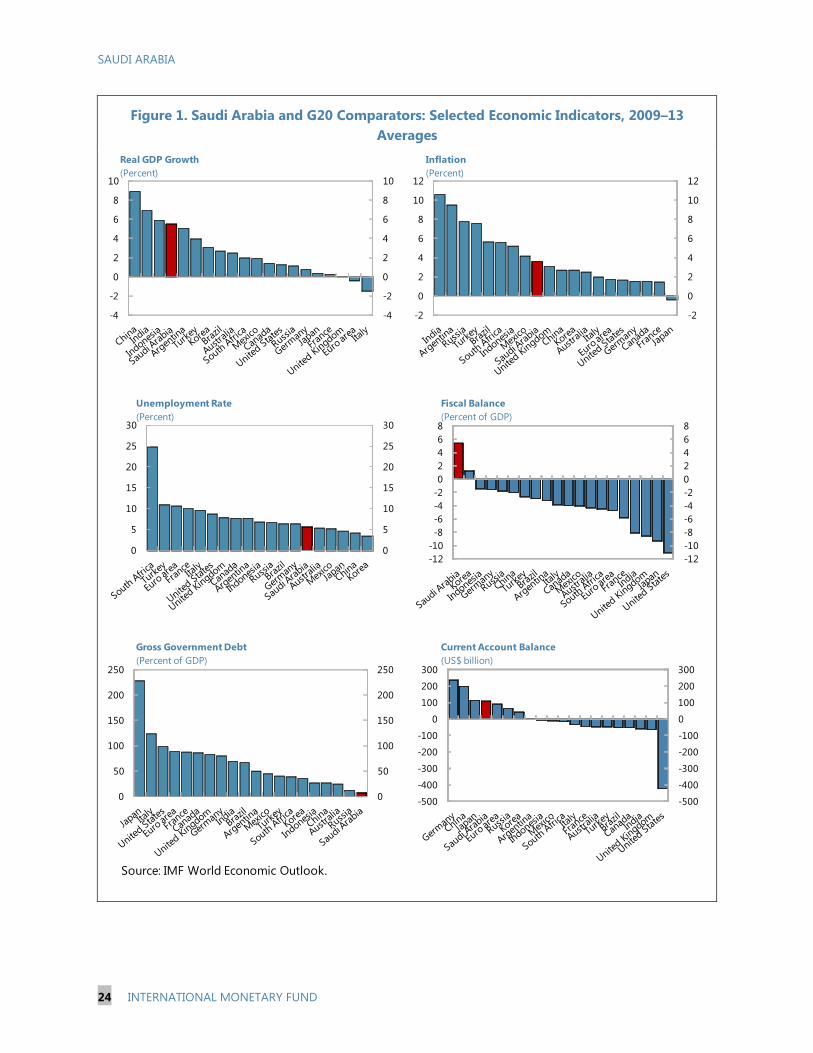
1. Saudi Arabia’s economy has grown very strongly in recent years, and has been one of
the best performing in the G-20 (Figure 1). It has benefitted from high oil prices and output,
strong private sector activity, and government spending. Rising oil prices and production have
resulted in large external and fiscal surpluses, while government debt has declined to 2.7 percent of
GDP. Fitch recently upgraded Saudi Arabia’s sovereign credit rating to AA. Inflation has been
moderate, and human and social development indicators have improved significantly.
2. As the second largest crude oil exporter and the only producer with significant spare
capacity, Saudi Arabia plays a systemic and stabilizing role in the global oil market. Saudi
Arabia has proven oil reserves of 266 billion barrels and a current estimated spare production
capacity of 2.7 million barrels a day. With uncertainties about the global oil market outlook
stemming from the strength of the global recovery, the path of U.S. oil production, and the extent of
supply outages in other countries, the importance of this role will continue.
3. Domestically, key policy priorities are addressing the jobs and housing needs of the
young and rapidly growing population. Within the labor market, Saudis are primarily employed in
the public sector, non-Saudis dominate employment in the private sector, and female labor force
participation, while rising, is low. The Saudi labor force has grown by nearly 4¾ percent a year over
the past decade and is expected to continue growing rapidly in the coming years. Labor market
reforms are being implemented to boost private sector job creation for nationals. In addition, high
house prices are making it difficult for younger or less well-off people to enter the housing market,
and the government is making large investments to increase the supply of housing, particularly for
the less well-off.
4. Another priority is economic diversification. Investments in transportation infrastructure,
improvements to the business environment, SME financing, the development of industrial clusters
around oil and mining, and joint ventures in refining, mining, and banking are all part of this effort.
ECONOMIC OUTCOMES, OUTLOOK, AND RISKS
Recent economic developments
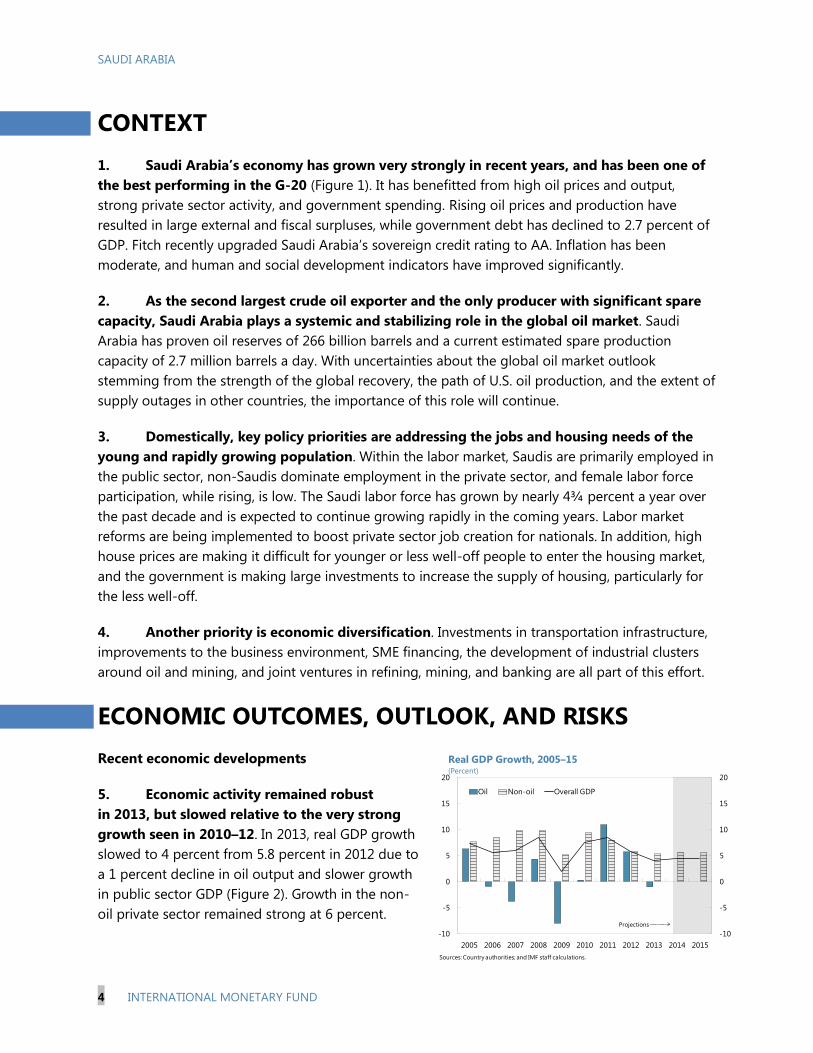
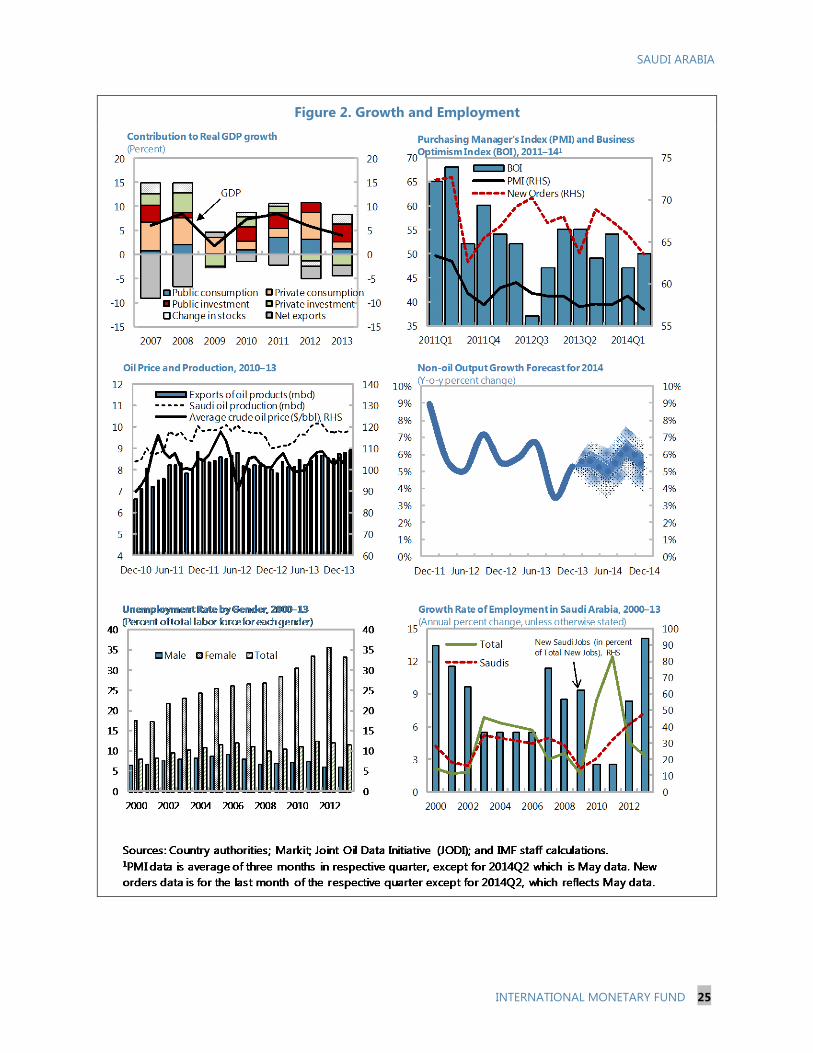
5. Economic activity remained robust
in 2013, but slowed relative to the very strong
growth seen in 2010–12. In 2013, real GDP growth
slowed to 4 percent from 5.8 percent in 2012 due to
a 1 percent decline in oil output and slower growth
in public sector GDP (Figure 2). Growth in the non-
oil private sector remained strong at 6 percent.
-10
-5
0
5
10
15
20
-10
-5
0
5
10
15
20
2005 2006 2007 2008 2009 2010 2011 2012 2013 2014 2015
Oil Non-oil Overall GDP
Real GDP Growth, 2005–15(Percent)
Sources: Country authorities; and IMF staff calculations.
Projections
SAUDI ARABIA
INTERNATIONAL MONETARY FUND 5
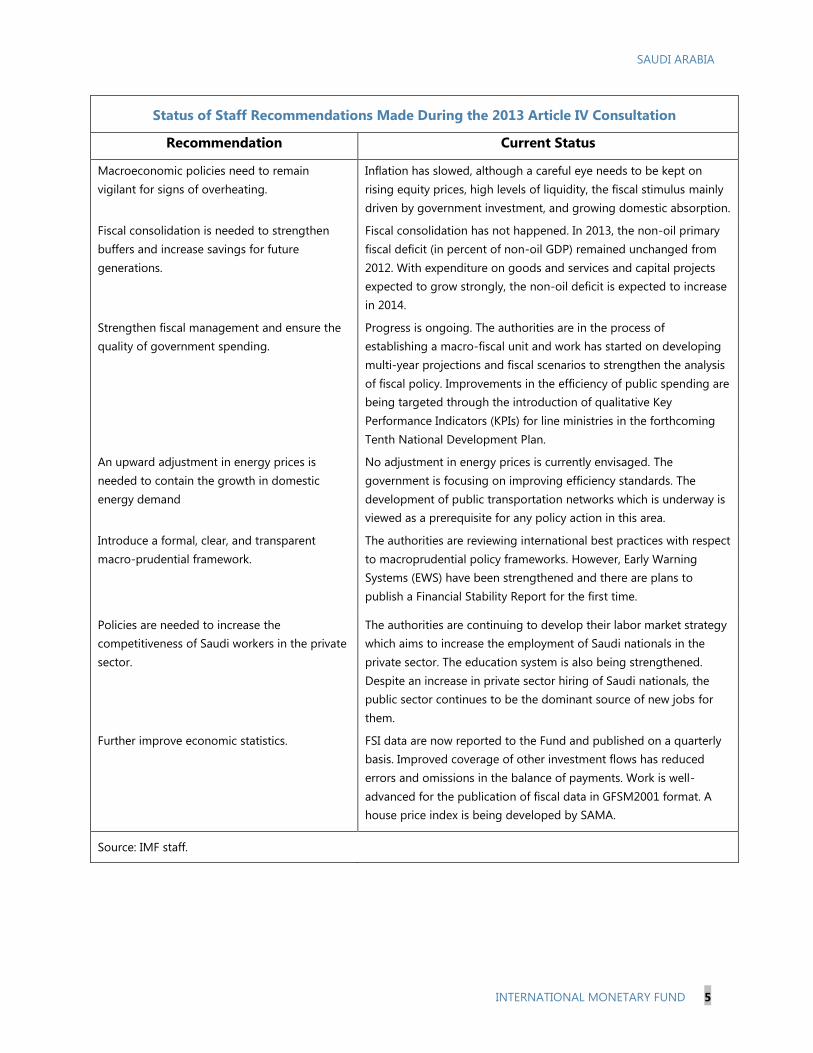
Status of Staff Recommendations Made During the 2013 Article IV Consultation
Recommendation Current Status
Macroeconomic policies need to remain
vigilant for signs of overheating.
Inflation has slowed, although a careful eye needs to be kept on
rising equity prices, high levels of liquidity, the fiscal stimulus mainly
driven by government investment, and growing domestic absorption.
Fiscal consolidation is needed to strengthen
buffers and increase savings for future
generations.
Fiscal consolidation has not happened. In 2013, the non-oil primary
fiscal deficit (in percent of non-oil GDP) remained unchanged from
2012. With expenditure on goods and services and capital projects
expected to grow strongly, the non-oil deficit is expected to increase
in 2014.
Strengthen fiscal management and ensure the
quality of government spending.
Progress is ongoing. The authorities are in the process of
establishing a macro-fiscal unit and work has started on developing
multi-year projections and fiscal scenarios to strengthen the analysis
of fiscal policy. Improvements in the efficiency of public spending are
being targeted through the introduction of qualitative Key
Performance Indicators (KPIs) for line ministries in the forthcoming
Tenth National Development Plan.
An upward adjustment in energy prices is
needed to contain the growth in domestic
energy demand
No adjustment in energy prices is currently envisaged. The
government is focusing on improving efficiency standards. The
development of public transportation networks which is underway is
viewed as a prerequisite for any policy action in this area.
Introduce a formal, clear, and transparent
macro-prudential framework.
The authorities are reviewing international best practices with respect
to macroprudential policy frameworks. However, Early Warning
Systems (EWS) have been strengthened and there are plans to
publish a Financial Stability Report for the first time.
Policies are needed to increase the
competitiveness of Saudi workers in the private
sector.
The authorities are continuing to develop their labor market strategy
which aims to increase the employment of Saudi nationals in the
private sector. The education system is also being strengthened.
Despite an increase in private sector hiring of Saudi nationals, the
public sector continues to be the dominant source of new jobs for
them.
Further improve economic statistics. FSI data are now reported to the Fund and published on a quarterly
basis. Improved coverage of other investment flows has reduced
errors and omissions in the balance of payments. Work is well-
advanced for the publication of fiscal data in GFSM2001 format. A
house price index is being developed by SAMA.
Source: IMF staff.
SAUDI ARABIA
6 INTERNATIONAL MONETARY FUND
6. The unemployment rate of nationals has fallen over the past year. While the overall
unemployment rate was broadly unchanged at 5.5 percent at end-2013, the unemployment rate of
Saudi nationals fell from 12 percent to 11.5 percent during the year. This was due to a decline in the
female unemployment rate from 35.7 percent to 32.1 percent, with the male unemployment rate
holding steady at about 6 percent. Although at low levels, female labor force participation rates
have risen in recent years, from 12.6 percent at end-2006, to 16.4 percent at end-June 2013.
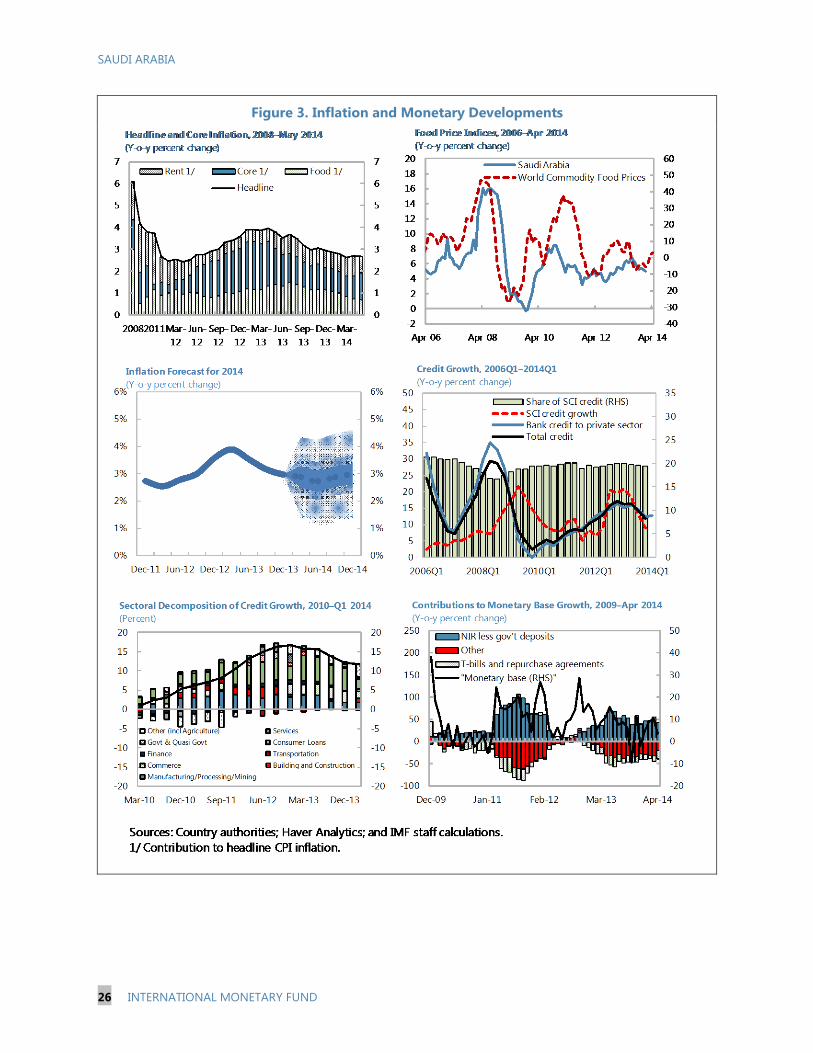
7. Inflation has eased over the past year. From a high of 4 percent in April 2013, inflation fell
to 2.7 percent in May 2014, largely due to lower food price inflation in line with international trends
(Figure 3).
8. The growth of bank credit to the private sector has slowed. After reaching a peak of
16.4 percent in May 2013, bank credit growth weakened to 11.8 percent in April 2014. A broader
measure of private credit which includes lending by the Specialized Credit Institutions (SCIs) shows a
similar trend through end-2013 (latest available data). Real estate lending by banks has grown by
around 30 percent over the past year, albeit from a low base, as banks have moved into the
mortgage market following the passage of the mortgage law in July 2012.
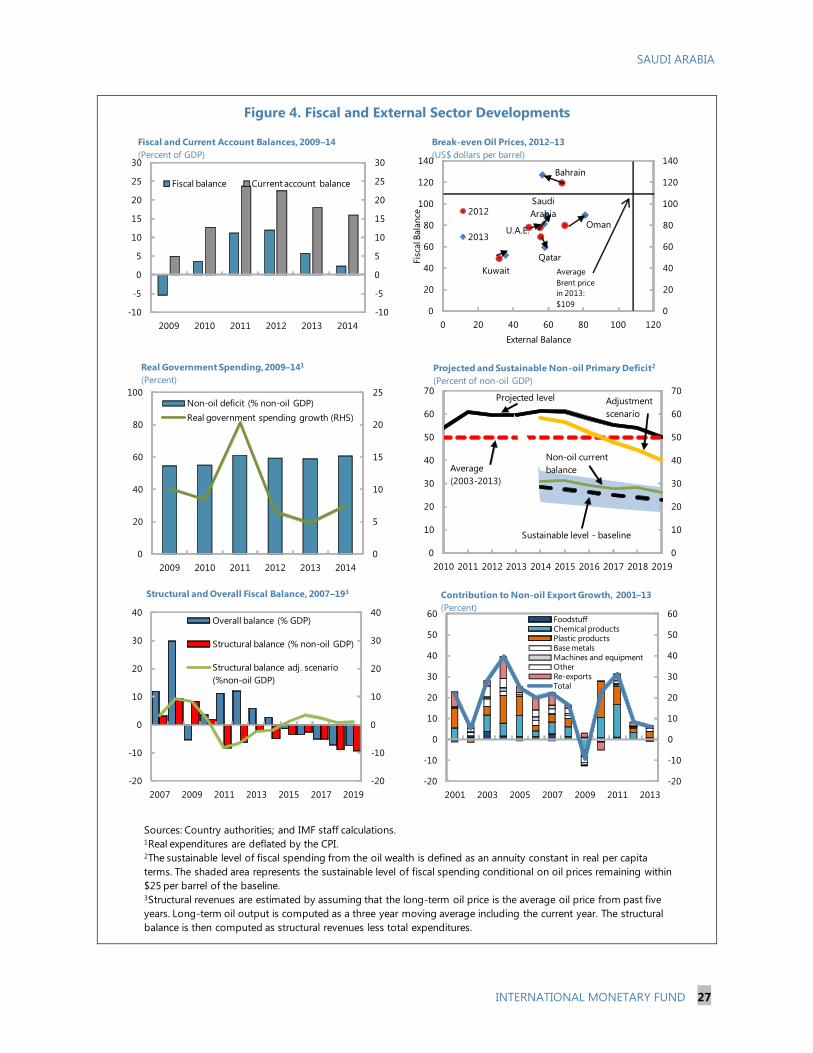
9. The fiscal surplus declined in 2013 and the fiscal breakeven oil price increased. The
overall fiscal surplus fell to 5.8 percent of GDP from 12 percent of GDP in 2012, while the non-oil
primary fiscal deficit (as a share of non-oil GDP) remained unchanged at 59.5 percent (Figure 4).
Expenditure increased by 8.5 percent in 2013, with a strong pickup in the fourth quarter due to
capital spending on the Mecca and Medina expansion projects.1 Spending on wages and salaries
remained flat, although this partly reflected the absence of the thirteenth month wage payment that
was made in 2012.2 Strong expenditure growth has continued in the first quarter of 2014. Assuming
that Saudi Arabia’s oil export quantities are not affected if oil prices fall, the breakeven oil price—the
oil price required to balance the budget—has risen to $89 a barrel in 2013 from $78 a barrel in 2012.
10. The current account surplus declined in 2013, but remained large at around 18 percent
of GDP. Oil export receipts decreased slightly as the average oil price fell, while non-oil export
growth slowed due to weaker demand for petrochemical products. Remittance outflows increased
significantly, by 19 percent, as stronger enforcement of domestic laws resulted in a large number of
expatriate workers who were working illegally in the country returning home.
1 The authorities are in the process of undertaking a significant expansion in the facilities at the two holy cities of
Mecca and Medina. This will enable the accommodation of a larger number of pilgrims when completed.
2 The thirteenth month wage payment results from the difference between the Gregorian and Hijri calendars and
occurs every three years.
SAUDI ARABIA
INTERNATIONAL MONETARY FUND 7
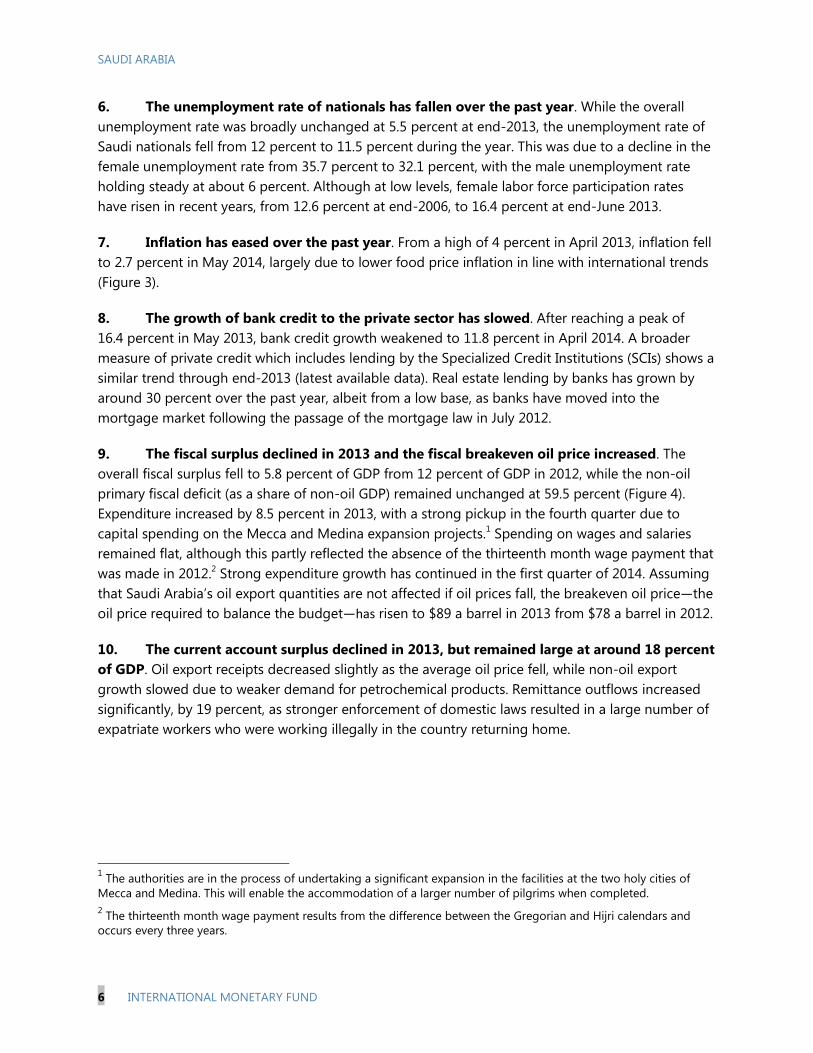
11. The economy has not been affected by the recent global financial market volatility and
equity prices have risen. Financial linkages
with the global economy are limited and
equity prices have risen by around
30 percent since the middle of last year
(Figure 5). The price-earnings ratio has risen
from around 15.5 in mid-2013 to 19 at
present. While this increase in equity prices
could partly be due to catch-up—Saudi
Arabia and other GCC equity markets initially
underperformed the rest of the emerging
markets after the global financial crisis—it
may also be a result of an increase in the
flow of capital into a relatively shallow equity market.
Outlook
12. The near-term outlook is positive, with growth projected to pick up to 4½ percent in
2014 and 2015. Oil production is expected to be little changed from 2013 as continued strong
growth in North American production is sufficient to meet increased global demand. High-
frequency indicators such as the HSBC/Markit PMI and the NCB Business Optimism Index (BOI)
suggest continued strong growth in the non-oil private sector as large scale infrastructure projects
continue to underpin aggregate demand. Non-oil growth is projected at 5½ percent, with private
sector growth unchanged from 2013 at 6 percent. Inflation is expected to remain subdued given
slowing food price inflation, although strong government spending may put upward pressure on
prices of construction materials.
13. Over the medium term, growth is expected to remain robust driven by government
spending. Government spending on transportation infrastructure, housing projects, and the Mecca
and Medina expansion is expected to support strong non-oil private sector growth of 5¾ percent,
broadly in line with staff estimates of potential.3 While short-term interest rates will rise as the Fed
eventually raises its policy rate (given the pegged exchange rate), high levels of banking system
liquidity are likely to slow the pass-through to deposit and lending rates, mitigating the impact on
the real economy. Inflation is expected to edge up to 3.6 percent by 2017 as food price inflation
stabilizes, government spending continues to put pressure on prices, but rents ease as new housing
supply comes on the market.
14. The fiscal surplus is expected to decline further this year and the budget is projected
to move into deficit in 2015. With expenditure on goods and services and capital projects
3 See “Productivity Growth and Potential Output in Saudi Arabia,” IMF Country Report 13/230.
-80
-60
-40
-20
0
20
40
60
0
2,000
4,000
6,000
8,000
10,000
12,000
Jan-07 Jan-08 Jan-09 Jan-10 Jan-11 Jan-12 Jan-13 Jan-14
Saudi Arabia: Equity Market, 2007–14
Y-o-y percent change (RHS)
Tadawul All-Share Index
Source: Haver Analytics.
SAUDI ARABIA
8 INTERNATIONAL MONETARY FUND
expected to continue to grow strongly, the fiscal surplus is expected to decline to only 2.5 percent of
GDP in 2014, and the non-oil fiscal deficit is likely to increase and exceed the level reached during
the large fiscal expansion in 2011. In 2015 and beyond, lower projected oil prices and a slight
decline in oil exports are expected to lead to a fall in oil revenues. Public investment is projected to
initially rise as a share of GDP until 2016 as the metro, housing, and Mecca and Medina expansion
projects pick up pace, and then ease slightly thereafter, but remain at high levels. The wage bill is
forecast to grow in line with inflation, and spending on goods and services in line with non-oil GDP.
This expenditure path and lower oil revenues lead to an overall fiscal deficit in 2015, which is
expected to deteriorate further to almost 7½ percent of GDP by 2019. The non-oil primary fiscal
deficit (as a percent of non-oil GDP) declines to 50 percent by 2019.
15. The current account surplus is projected to decline over the medium-term as oil
revenues fall and import growth remains robust. From close to 18 percent of GDP in 2013, the
current account surplus is projected to narrow to 7 percent of GDP in 2019, while the non-oil current
account is in a large deficit. Oil revenues are expected to decline given the assumed fall in oil prices,
while government spending is expected to underpin import growth. With large construction projects
reliant on expatriate workers, remittance outflows would continue to rise. SAMA’s gross foreign
assets are projected to decline to 25 months of import coverage by the end of the projection period.
Risks and spillovers
16. Risks to the growth outlook are broadly balanced. On the upside, higher oil prices or
production, stronger than expected government spending, or wealth effects from further increases
in equity prices could further strengthen growth, while a weaker global oil market or an eventual
drop in equity prices if a bubble develops and then bursts are downside risks to the growth outlook.
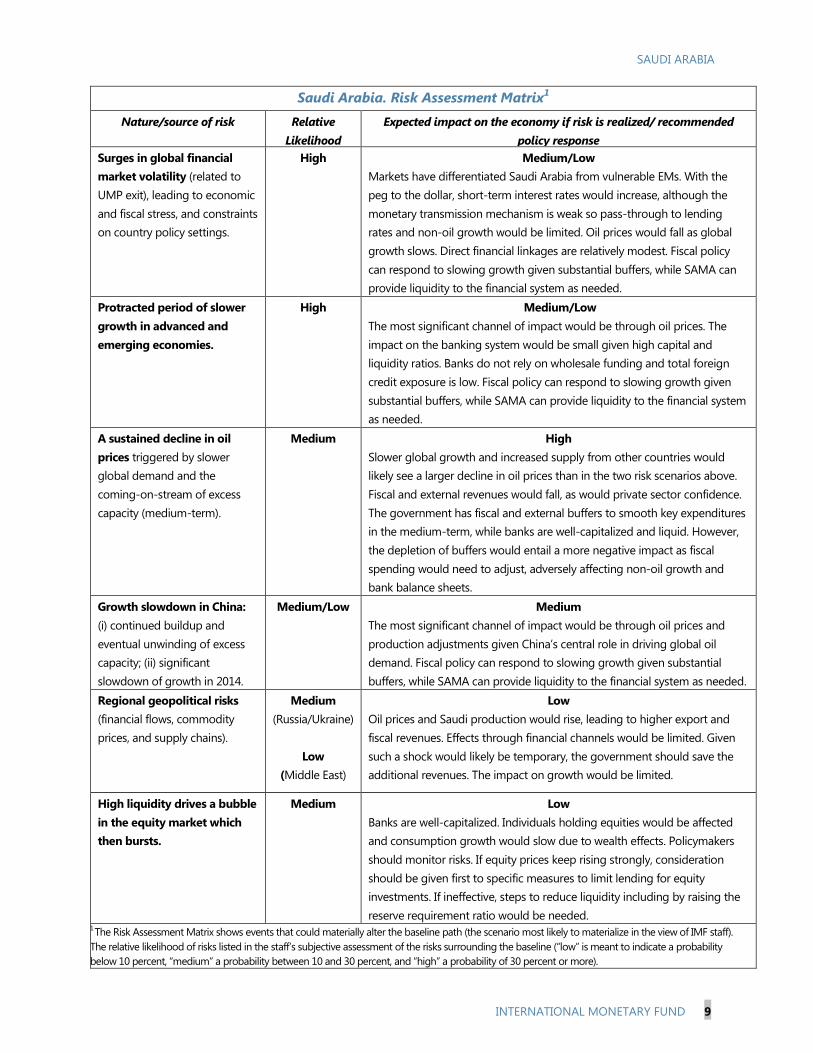
17. The main channel for the inward and outward transmission of spillovers to/from Saudi
Arabia is through the oil market (see the Risk Assessment Matrix). As the only country with
substantial spare production capacity, Saudi Arabia has continued to act to balance demand and
supply in the global oil market, so it is affected not only through movements in prices, but also
export quantities. Financial markets currently indicate a broadly symmetric distribution of risks
around a downward trend in the oil price over the next 5 years. If Fed tapering results in heightened
financial market volatility and slower global growth, the slowdown in emerging markets deepens
relative to the baseline, or major financial disruptions take place in China, demand for oil would fall.
A faster-than-expected increase in U.S. oil output or increased output from other countries would
likewise put downward pressure on Saudi production and/or oil prices. On the other hand,
uncertainties about the situation surrounding Ukraine and unrest in key oil exporting countries
including Iraq and Libya mean that negative supply shocks, which would likely see oil prices and
Saudi oil production rise, are also possible.
SAUDI ARABIA
INTERNATIONAL MONETARY FUND 9
Saudi Arabia. Risk Assessment Matrix1
Nature/source of risk Relative
Likelihood
Expected impact on the economy if risk is realized/ recommended
policy response
Surges in global financial
market volatility (related to
UMP exit), leading to economic
and fiscal stress, and constraints
on country policy settings.
High
Medium/Low
Markets have differentiated Saudi Arabia from vulnerable EMs. With the
peg to the dollar, short-term interest rates would increase, although the
monetary transmission mechanism is weak so pass-through to lending
rates and non-oil growth would be limited. Oil prices would fall as global
growth slows. Direct financial linkages are relatively modest. Fiscal policy
can respond to slowing growth given substantial buffers, while SAMA can
provide liquidity to the financial system as needed.
Protracted period of slower
growth in advanced and
emerging economies.
High
Medium/Low
The most significant channel of impact would be through oil prices. The
impact on the banking system would be small given high capital and
liquidity ratios. Banks do not rely on wholesale funding and total foreign
credit exposure is low. Fiscal policy can respond to slowing growth given
substantial buffers, while SAMA can provide liquidity to the financial system
as needed.
A sustained decline in oil
prices triggered by slower
global demand and the
coming-on-stream of excess
capacity (medium-term).
Medium High
Slower global growth and increased supply from other countries would
likely see a larger decline in oil prices than in the two risk scenarios above.
Fiscal and external revenues would fall, as would private sector confidence.
The government has fiscal and external buffers to smooth key expenditures
in the medium-term, while banks are well-capitalized and liquid. However,
the depletion of buffers would entail a more negative impact as fiscal
spending would need to adjust, adversely affecting non-oil growth and
bank balance sheets.
Growth slowdown in China:
(i) continued buildup and
eventual unwinding of excess
capacity; (ii) significant
slowdown of growth in 2014.
Medium/Low
Medium
The most significant channel of impact would be through oil prices and
production adjustments given China’s central role in driving global oil
demand. Fiscal policy can respond to slowing growth given substantial
buffers, while SAMA can provide liquidity to the financial system as needed.
Regional geopolitical risks
(financial flows, commodity
prices, and supply chains).
Medium
(Russia/Ukraine)
Low
(Middle East)
Low
Oil prices and Saudi production would rise, leading to higher export and
fiscal revenues. Effects through financial channels would be limited. Given
such a shock would likely be temporary, the government should save the
additional revenues. The impact on growth would be limited.
High liquidity drives a bubble
in the equity market which
then bursts.
Medium Low
Banks are well-capitalized. Individuals holding equities would be affected
and consumption growth would slow due to wealth effects. Policymakers
should monitor risks. If equity prices keep rising strongly, consideration
should be given first to specific measures to limit lending for equity
investments. If ineffective, steps to reduce liquidity including by raising the
reserve requirement ratio would be needed. 1 The Risk Assessment Matrix shows events that could materially alter the baseline path (the scenario most likely to materialize in the view of IMF staff).
The relative likelihood of risks listed in the staff’s subjective assessment of the risks surrounding the baseline (“low” is meant to indicate a probability
below 10 percent, “medium” a probability between 10 and 30 percent, and “high” a probability of 30 percent or more).
SAUDI ARABIA
10 INTERNATIONAL MONETARY FUND
18. Inward spillovers from global financial markets are limited. The Saudi Arabian stock
market and the domestic interbank and SAMA bill market were unaffected by tapering discussions
and their implementation since 2013. Likewise, January’s emerging market turmoil had almost no
impact on Saudi financial markets. Spillovers from regional developments seem somewhat larger.
This was most clearly seen during the Syrian standoff in late August 2013 when the stock market in
Saudi Arabia temporarily fell. Stress tests from the 2011 FSAP update suggest that the direct impact
of Fed tapering on the banking system are likely to be small. Indeed, given the structure of their
balance sheets, banks will likely benefit from a modest rise in interest rates that does not have a
significant impact on non-performing loans (NPLs). While NPLs would rise if growth slowed, the
banking system should be able to absorb these losses given the strong capital and liquidity buffers.
A larger rise in interest rates may affect banks’ balance sheets in the medium term by slowing or
even reversing the growth in non-interest bearing deposits.
19. The equity market has risen strongly over the past year, and may continue to rise in
the period ahead given the still abundant liquidity in the domestic economy. While this would
positively impact growth in the near-term, the risks of a later correction would increase. Even current
equity valuations appear somewhat on the rich side relative to global and regional markets.
20. At present, macroeconomic policies are in a strong position to respond to these risks
because of the substantial buffers that have been established in the government and banking
sectors. In particular, if the downside risks discussed above were to emerge, the government would
be able to use its financial assets to smooth the path of government spending and provide
temporary support to the economy if needed. On the financial side, high bank capital ratios would
be able to absorb a rise in NPLs, while the Saudi Arabian Monetary Agency (SAMA) would be able to
provide liquidity to the banking sector as needed.
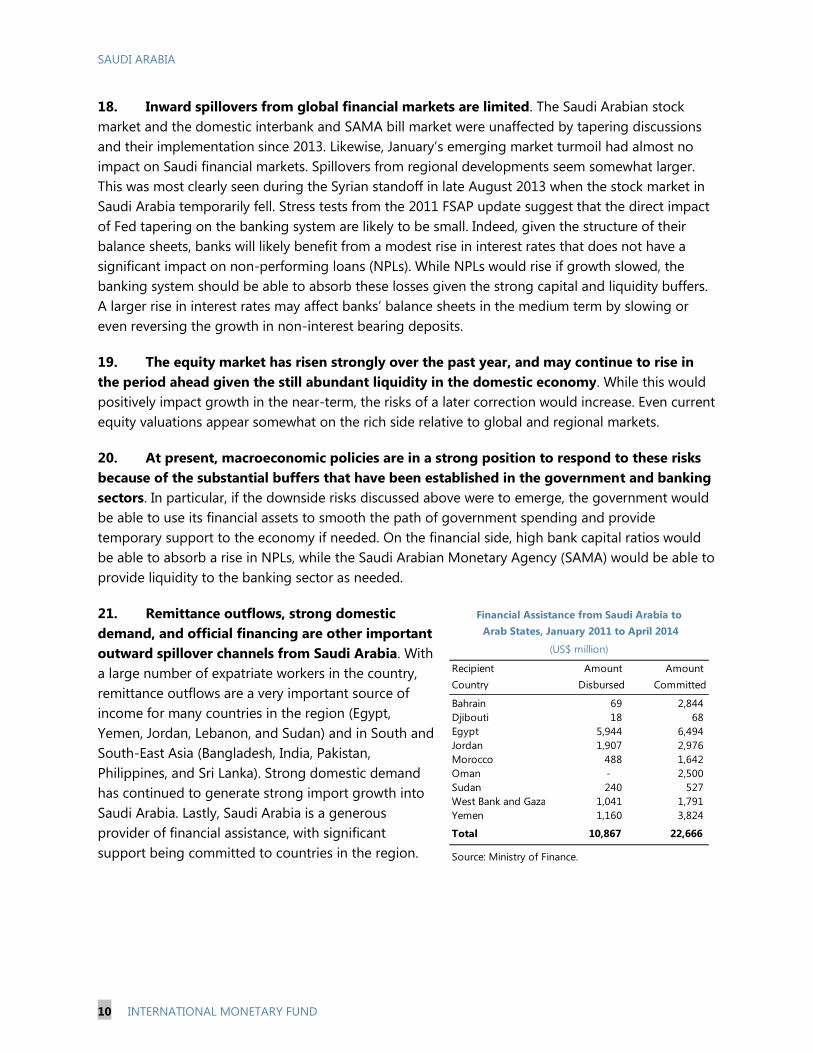
21. Remittance outflows, strong domestic
demand, and official financing are other important
outward spillover channels from Saudi Arabia. With
a large number of expatriate workers in the country,
remittance outflows are a very important source of
income for many countries in the region (Egypt,
Yemen, Jordan, Lebanon, and Sudan) and in South and
South-East Asia (Bangladesh, India, Pakistan,
Philippines, and Sri Lanka). Strong domestic demand
has continued to generate strong import growth into
Saudi Arabia. Lastly, Saudi Arabia is a generous
provider of financial assistance, with significant
support being committed to countries in the region.
Recipient
Country
Amount
Disbursed
Amount
Committed
Bahrain 69 2,844
Djibouti 18 68
Egypt 5,944 6,494
Jordan 1,907 2,976
Morocco 488 1,642
Oman - 2,500
Sudan 240 527
West Bank and Gaza 1,041 1,791
Yemen 1,160 3,824
Total 10,867 22,666
Source: Ministry of Finance.
Financial Assistance from Saudi Arabia to
Arab States, January 2011 to April 2014
(US$ million)

SAUDI ARABIA
INTERNATIONAL MONETARY FUND 11
POLICY DISCUSSIONS
Meeting the jobs and housing needs of a rapidly growing and young population and managing the
demands of these demographic trends on the natural resources of the economy are key challenges for
policy makers. These challenges are being addressed through large public investments in infrastructure
and housing, and reforms to increase private sector employment of nationals. At the same time, efforts
are being made to raise productivity, diversify the economy, and strengthen growth prospects. Against
this background, discussions focused on two main themes; (i) maintaining macroeconomic stability
and strengthening macroeconomic and financial policy frameworks to support growth, and (ii) policies
to address demographic pressures and reforms to boost sustainable economic growth.
A. Maintaining Macroeconomic Stability and Strengthening Policy
Frameworks to Support Growth
22. The macroeconomic outlook is favorable and substantial policy buffers are in place,
but the current path of fiscal policy risks substantially eroding these buffers over the next few
years. A slowing in the pace of fiscal spending can help strike a balance between meeting
development goals and maintaining the ability to manage risks. Reforms to strengthen the
macroeconomic policy framework can help better manage the impact of oil price volatility and other
external and domestic shocks, and create an environment conducive to private sector investment
and job creation.
Fiscal policy
23. The fiscal position in Saudi Arabia is currently very strong. Fiscal outcomes have been
favorable in recent years and government deposits at SAMA have increased to around 60 percent of
GDP, sufficient to cover 20 months of spending, while government debt has declined to only
2¾ percent of GDP (see Appendix I). In addition, the government has considerable assets in the
form of ownership stakes in many companies.
24. The government’s ambitious
spending program, however, could
significantly erode the buffers that have
been built up and increase vulnerability to
a drop in oil prices. Owing to the metro and
Mecca and Medina expansion projects,
capital expenditures are projected to
increase during 2014–18 to over 16 percent
of GDP from 11 percent in 2012. In addition,
housing loan disbursements are estimated to
reach up to SAR 25 billion a year. As a result,
government deposits at SAMA are projected
-1,000
-500
0
500
1,000
1,500
2,000
-1,000
-500
0
500
1,000
1,500
2,000
2013 2014 2015 2016 2017 2018 2019
Baseline scenario
Adjustment scenario
Low oil price under baseline scenario
Low oil price under adjustment scenario
Impact of Fiscal Spending on Government Deposits Under Various Scenarios, 2013–191
(SAR billion)
Source: IMF staff calculations.1Baseline scenario projects government deposits under current policies. The adjustment scenario projection assumes a
reduction in the non-oil fiscal deficit of 3 percent of non-oil GDP each year relative to the 2013 fiscal outcome. The low oil
price scenarios assume oil prices to be $25 below the baseline between 2015-19.

SAUDI ARABIA
12 INTERNATIONAL MONETARY FUND
to drop by about 55 percent between 2013 and 2019 (and in 2019 would be sufficient to cover
6½ months of spending).4 With the decline in fiscal buffers, the economy would become more
vulnerable to a drop in oil prices and have less space to operate a countercyclical fiscal policy. For
example, if oil prices were to drop by $25 below the baseline in 2015 and remain lower until 2019,
the fiscal deficit would be much larger and government deposits at SAMA would be exhausted by
2018, if spending did not adjust (Figure 6).
25. Staff emphasized the need for fiscal consolidation to help protect existing fiscal
buffers. The fiscal consolidation that staff had expected to take place in 2013 did not materialize,
and it is important that the government now moves ahead and implements fiscal adjustment. An
adjustment that reduces the non-oil fiscal deficit by about 3 percent of non-oil GDP a year
during 2014–19 relative to the 2013 budget outcome would ensure that government deposits
remain sufficient to manage a large drop in oil prices.5 This adjustment would help narrow the gap
with the sustainable non-oil primary balance that is consistent with an inter-generationally fair
distribution of oil wealth, and the structural budget balance would be in surplus from 2015–19.6
26. Staff suggested that the fiscal adjustment could be achieved through a combination of
expenditure and revenue measures. On the expenditure side, a civil service review could be
undertaken to identify those positions that
are not essential and that could be
eliminated as they become vacant. This
would help reduce the size of the
government wage bill, which is high by
international standards, and would support
ongoing reforms in the labor market. In
addition, with capital spending projects
making up a large part of fiscal spending, a
careful prioritization of these projects would
help identify any that could be delayed or
cancelled, and a review of project processes
could yield cost savings. On the revenue
side, steps to increase non-oil revenues would help strengthen the budget position. Consideration
should be given to a tax on higher-end property or vacant land, increasing fees/charges for
4 Housing loans do not add to the projected deficit but contribute to the drawdown in government deposits at
SAMA.
5 Assuming a medium-term fiscal multiplier of 0.5, this fiscal consolidation could lead to slower non-oil GDP growth
of up to 1 percent a year by the end of the projection period.
6 The structural balance is calculated using a 5-year backward oil price rule and a 3-year backward average of oil
exports.
0
5
10
15
20
25
30
0
5
10
15
20
25
30
Source: IMF, World Economic Outlook.
Government Wage Bill in Selected Oil Exporters, 2013
(Percent of GDP)

SAUDI ARABIA
INTERNATIONAL MONETARY FUND 13
government services, and an increase in energy prices (preferably coordinated at the GCC level).
Forgone revenues from low domestic energy prices are estimated to be around 10 percent of GDP.7
27. If the budget were put on such a consolidation path, the fiscal buffers that have been
built up would remain in place and could be used to smooth spending in the event of a
temporary decline in oil prices. In this regard, the concept of the structural budget balance is a
useful anchor to manage the volatility of oil revenues over the medium-term. If oil revenues
temporarily decline by more than expected, fiscal buffers can be used to maintain the path of
government spending, while if growth in the non-oil sector were to slow sharply, there is scope for
temporarily increasing government spending. A longer-lasting and more pronounced decline in oil
revenues would require a more substantial adjustment in government spending. Targeting a positive
structural balance over time would allow the accumulation of savings for future generations. If oil
revenues were temporarily higher than expected, these additional revenues should be saved to build
additional buffers.
28. The authorities broadly agreed with the staff’s fiscal projections, but saw limited scope
for fiscal consolidation at present. The Mecca and Medina expansion projects are national
priorities, and the government is committed to housing and transportation projects to address
pressing social needs, alleviate urban congestion pressures, and support ongoing diversification
efforts. The authorities also saw little scope to raise additional revenues at present, although over
the medium term when alternate modes of transportation become available, increases in energy
prices could be considered.
29. While the efficiency of public investment in Saudi Arabia appears to be broadly in line
with the global average, there is scope for improvement. Greater investment efficiency would
provide better resource allocation and greater value-for-money, especially given the size of the
public investment program in Saudi Arabia. The example of Norway illustrates the potential benefits
of a strengthened public investment management process in terms of cost savings on projects. In
this regard, the authorities explained that improvements in the efficiency of public spending are
being targeted through the introduction of qualitative Key Performance Indicators(KPIs) for line
ministries as part of the forthcoming Tenth National Development Plan.
30. Staff suggested that reforms to the fiscal framework would support policy
implementation, help manage the impact of oil price volatility, and strengthen spending
efficiency. Specifically, the fiscal framework could be strengthened by:
Ensuring the budget provides a full account of the government’s planned expenditures during the
year. Currently, actual expenditures regularly exceed budgeted expenditures by a substantial
margin (19 percent in 2013). This is due to the government setting a low expenditure envelope
7 2011 estimates. See “Energy Subsidy Reform: Lessons and Implications”, IMF, 2013.

SAUDI ARABIA
14 INTERNATIONAL MONETARY FUND
in the budget in line with conservative oil revenue assumptions, and the exclusion of
expenditures made from the budget surplus fund (e.g. for the metro and housing projects).
Budget projections should include planned spending from the budget surplus fund and the full
costing of all spending commitments for the year.
Developing a medium-term budgetary framework that delinks expenditure decisions from revenue
volatility and clearly establishes the goals of fiscal policy. Such a medium-term framework should
be based on expenditure plans that are consistent with projections of structural oil revenues, the
development plans for the country, a target for the structural budget balance, and a robust set
of macroeconomic forecasts. To help enhance the predictability of spending decisions and assist
the planning process, the 5-year development plan would need to be updated regularly and
linked to the annual budgets on a rolling basis. The introduction of the planned Government
Financial Management Information System (GFMIS) would support this framework and
strengthen controls on line ministries.
31. The authorities considered the main elements of a strong fiscal framework to already
be in place, and further reforms are ongoing. The annual budgets were viewed as largely realistic
representations of expenditure plans, with variations relative to budget stemming mostly from the
speed of implementation of capital projects and some within-year special expenditures authorized
by royal decree. More recently, high land acquisition costs in Mecca and Medina had contributed to
expenditure overruns. Work has already started on developing multi-year projections and fiscal
scenarios to improve fiscal analysis and increasing the medium-term orientation of the budget, and
consideration is being given to using the concept of the structural balance in budget preparation.
32. Staff underscored the benefits of establishing a well-staffed macro-fiscal unit and
publishing fiscal data in GFSM2001 format as soon as possible. The authorities said they were in
the process of establishing a macro-fiscal unit, and agreed this would help strengthen the analysis of
fiscal policy, develop projections of the fiscal accounts under different economic and policy
scenarios, and assess short-and long-term fiscal risks, including from pension expenditures (see
Box 1). In this context, the Shura Council is considering a proposal to raise the retirement age for
government employees from 60 to 62 (as per the Hijri calendar). With regard to publishing fiscal
data in GFSM2001 format, preparations and staff training are well-advanced and publication is
expected in early 2015.
Monetary, macroprudential, and exchange rate policies
33. Staff viewed monetary and macroprudential policy settings as appropriate at present,
but emphasized the need for vigilance on rising equity prices. Monetary and macroprudential
policy settings have not been changed over the past year as inflationary pressures have eased and
financial conditions remained stable. Risks from higher U.S. rates appear limited. Equity market
developments should be carefully monitored. If equity prices keep rising strongly, consideration should
be given first to specific measures to limit lending for equity investments. If ineffective, steps to reduce
liquidity including by raising the reserve requirement ratio would be needed. The authorities argued
that given strengthened prudential regulation of financial market participants in recent years, there

SAUDI ARABIA
INTERNATIONAL MONETARY FUND 15
was little likelihood of an equity market bubble developing. Close policy coordination between the
Ministry of Finance, the Capital Market Authority (CMA), and SAMA also meant that policy makers
could respond to any potential systemic financial sector risks in a timely manner.
34. More generally, staff suggested that the use of the macroprudential toolkit be more
clearly linked to overall macroeconomic and financial developments. SAMA has encouraged
banks to provision in a countercyclical way and provisioning levels have increased to over
150 percent of gross non-performing loans at end-2013. However, the bank-by-bank approach has
made this more a micro- than macroprudential policy tool in the staff’s view. SAMA’s other
macroprudential tools include the loan-to-deposit ratio, loan-to-income ratio, debt-service-to-
income ratio, and limits on concentrated exposures, although these are adjusted infrequently. Staff
suggested that consideration could be given to using these tools in a countercyclical way by linking
them explicitly to macroeconomic and financial developments to signal SAMA’s assessment of risks
to the market. A formal, clear, and transparent macro-prudential framework, as is being developed
in other countries, could give SAMA the mandate for ensuring financial stability and to more
explicitly codify coordination across regulators. SAMA believes that their macroprudential policies
have worked well and have served to smooth credit in the economy. They also noted that their Early
Warning Systems (EWS) analysis has been strengthened, and that they plan to publish a financial
stability report for the first time. Staff welcomed these efforts and encouraged SAMA to also publish
its EWS indicators, including the house price index that is currently under development.
35. Staff recommended the introduction of a formal liquidity forecasting framework
together with a review of liquidity management tools to better manage banking system
liquidity. SAMA actively used its reserve requirement ratio to manage liquidity during the global
financial crisis in 2008, but has not changed this ratio since. On a regular basis, SAMA issues short-
term securities (SAMA bills) on its own account to absorb excess banking system liquidity, although
banks also hold large excess deposits. There is a ceiling on the weekly issuance of SAMA bills that is
revised infrequently (the last revision was in February 2010), and the interest rates are set at
80 percent of the reported interest rates in the inter-bank deposit market. With both the quantity
and price of SAMA bills set centrally, banking system liquidity has been volatile. Developing a formal
liquidity forecasting framework would allow SAMA to more proactively manage liquidity by varying
the amount and maturity of SAMA bills it offers. In this way, strengthening the transmission of
monetary policy signals would enhance SAMA’s ability to influence the availability of bank credit
and economic activity. SAMA considered its liquidity management operations and toolkit to be
effective and based on market fundamentals, noting that the size of SAMA bill issuance has
increased over time and that weekly issuances are not systematically oversubscribed. Indeed, the
size of issuance is calibrated to provide space for banks to expand private sector credit while
ensuring that credit growth is not too rapid.
SAUDI ARABIA
16 INTERNATIONAL MONETARY FUND
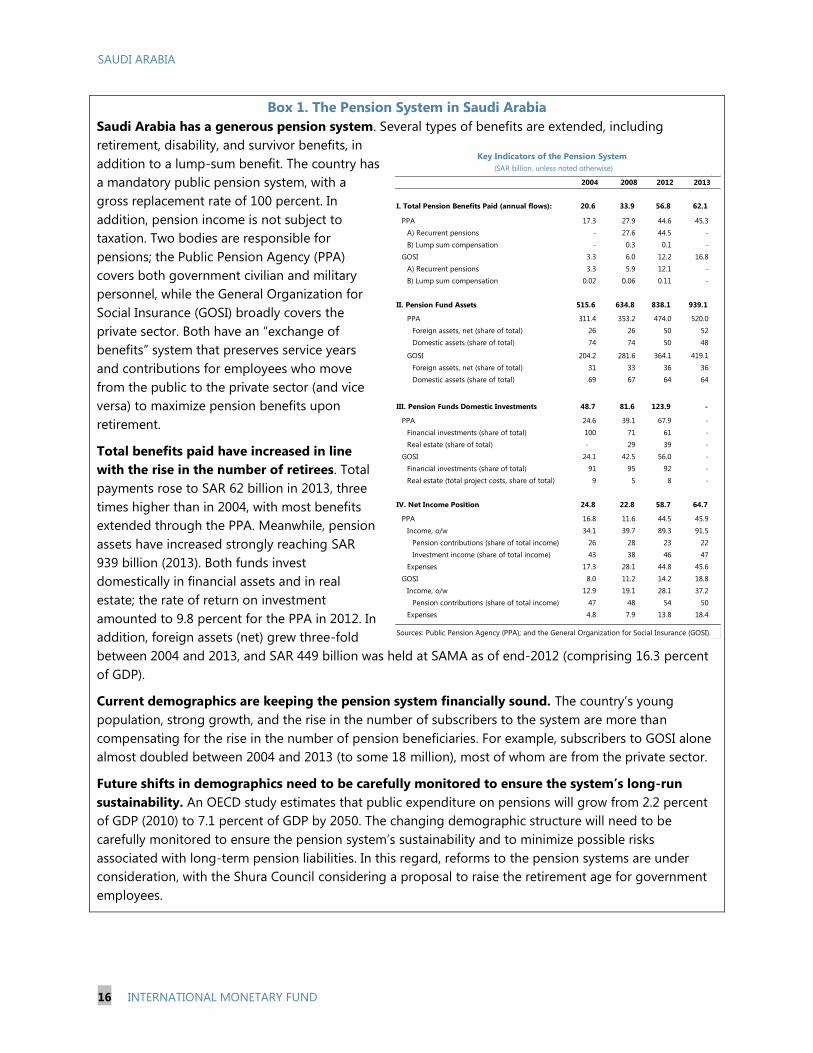
Box 1. The Pension System in Saudi Arabia
Saudi Arabia has a generous pension system. Several types of benefits are extended, including
retirement, disability, and survivor benefits, in
addition to a lump-sum benefit. The country has
a mandatory public pension system, with a
gross replacement rate of 100 percent. In
addition, pension income is not subject to
taxation. Two bodies are responsible for
pensions; the Public Pension Agency (PPA)
covers both government civilian and military
personnel, while the General Organization for
Social Insurance (GOSI) broadly covers the
private sector. Both have an “exchange of
benefits” system that preserves service years
and contributions for employees who move
from the public to the private sector (and vice
versa) to maximize pension benefits upon
retirement.
Total benefits paid have increased in line
with the rise in the number of retirees. Total
payments rose to SAR 62 billion in 2013, three
times higher than in 2004, with most benefits
extended through the PPA. Meanwhile, pension
assets have increased strongly reaching SAR
939 billion (2013). Both funds invest
domestically in financial assets and in real
estate; the rate of return on investment
amounted to 9.8 percent for the PPA in 2012. In
addition, foreign assets (net) grew three-fold
between 2004 and 2013, and SAR 449 billion was held at SAMA as of end-2012 (comprising 16.3 percent
of GDP).
Current demographics are keeping the pension system financially sound. The country’s young
population, strong growth, and the rise in the number of subscribers to the system are more than
compensating for the rise in the number of pension beneficiaries. For example, subscribers to GOSI alone
almost doubled between 2004 and 2013 (to some 18 million), most of whom are from the private sector.
Future shifts in demographics need to be carefully monitored to ensure the system’s long-run
sustainability. An OECD study estimates that public expenditure on pensions will grow from 2.2 percent
of GDP (2010) to 7.1 percent of GDP by 2050. The changing demographic structure will need to be
carefully monitored to ensure the pension system’s sustainability and to minimize possible risks
associated with long-term pension liabilities. In this regard, reforms to the pension systems are under
consideration, with the Shura Council considering a proposal to raise the retirement age for government
employees.
2004 2008 2012 2013
I. Total Pension Benefits Paid (annual flows): 20.6 33.9 56.8 62.1
PPA 17.3 27.9 44.6 45.3
A) Recurrent pensions - 27.6 44.5 -
B) Lump sum compensation - 0.3 0.1 -
GOSI 3.3 6.0 12.2 16.8
A) Recurrent pensions 3.3 5.9 12.1 -
B) Lump sum compensation 0.02 0.06 0.11 -
II. Pension Fund Assets 515.6 634.8 838.1 939.1
PPA 311.4 353.2 474.0 520.0
Foreign assets, net (share of total) 26 26 50 52
Domestic assets (share of total) 74 74 50 48
GOSI 204.2 281.6 364.1 419.1
Foreign assets, net (share of total) 31 33 36 36
Domestic assets (share of total) 69 67 64 64
III. Pension Funds Domestic Investments 48.7 81.6 123.9 -
PPA 24.6 39.1 67.9 -
Financial investments (share of total) 100 71 61 -
Real estate (share of total) - 29 39 -
GOSI 24.1 42.5 56.0 -
Financial investments (share of total) 91 95 92 -
Real estate (total project costs, share of total) 9 5 8 -
IV. Net Income Position 24.8 22.8 58.7 64.7
PPA 16.8 11.6 44.5 45.9
Income, o/w 34.1 39.7 89.3 91.5
Pension contributions (share of total income) 26 28 23 22
Investment income (share of total income) 43 38 46 47
Expenses 17.3 28.1 44.8 45.6
GOSI 8.0 11.2 14.2 18.8
Income, o/w 12.9 19.1 28.1 37.2
Pension contributions (share of total income) 47 48 54 50
Expenses 4.8 7.9 13.8 18.4
Sources: Public Pension Agency (PPA); and the General Organization for Social Insurance (GOSI).
Key Indicators of the Pension System
(SAR billion, unless noted otherwise)

SAUDI ARABIA
INTERNATIONAL MONETARY FUND 17
36. There was broad agreement that the exchange rate peg to the U.S. dollar remains
appropriate for the Saudi economy. The peg provides credibility to monetary policy and stability
to trade, income flows, and financial assets. While the drivers of the oil market, and hence the Saudi
business cycle, are changing with the emergence of China, this has not yet caused tensions for
monetary policy settings. Inflation and
inflation volatility, for example, compare
favorably to other oil exporting countries,
with the flexible labor market playing a key
role in supporting the peg. Empirical
estimates, which are sensitive to the
parameters assumed, do not yield clear
conclusions as to whether the current
account is at an appropriate level (see
Appendix II). The macroeconomic balance
approach suggests that the current account balance is within the range of medium-term norms
estimated from several different specifications, while the external sustainability approach suggests
that the current account surplus in the medium-term may be too low. Further, the real exchange
rate is in line with its long run relationship with real oil prices. Staff noted, however, that as the
structure of the economy continues to evolve in the coming years—particularly the structure of the
export base and the domestic labor market—the appropriateness of the peg should be periodically
reviewed in coordination with other GCC countries.
Financial sector supervision and development
37. The banking system is profitable, liquid, and well-capitalized. At 17.9 percent at end-
2013, risk-weighted bank capital ratios in Saudi Arabia are high which is appropriate given the high
sector concentration of lending and the general exposure of the economy to swings in oil prices.
NPLs have continued to decline to 1.3 percent of loans in 2013, while bank profitability remains
high, with the average pre-tax return on assets at 2 percent. Foreign currency loans and deposits
make up a small share of total loans and deposits. Banks are well positioned to absorb the effects of
higher interest rates (as the U.S. tightens) and any downside risks that result in slower non-oil
growth.
38. Staff welcomed SAMA’s efforts to strengthen financial sector supervision and boost
financial inclusion. Saudi Arabia was among the first countries to implement the Basel III risk-based
capital standards in January 2013, it has implemented the Basel III liquidity standards in July 2013,
and the leverage ratio has been monitored at a minimum of 3 percent since January 2011. The draft
framework for systemically important banks (D-SIB) is currently being finalized. Initiatives have been
launched to provide the large population of foreign workers with better access to banking services,
and increase consumer protection.
39. Progress is continuing in implementing the recommendations of the 2011 FSAP
update (see Appendix III). Over the past year, SAMA has issued licenses to twelve banks and eight
non-banks to conduct real estate financing and financial leasing business, and the non-banks
Projected current account 7.0
MB current account norm1
6.4
ES current account norm2
19.9
Deviation from ERER, overvaluation (-) (percent)3
1.1
1 Follows specification II of Beidas-Strom and Cashin (2011).
3As of April 2014.
2 Follows a constant real per capita allocation rule similar to Bems and Carvalho Filho (2009).
External Position Assessment
(Percent of GDP in 2019, unless otherwise indicated)
Source: IMF staff estimates and projections.
SAUDI ARABIA
18 INTERNATIONAL MONETARY FUND
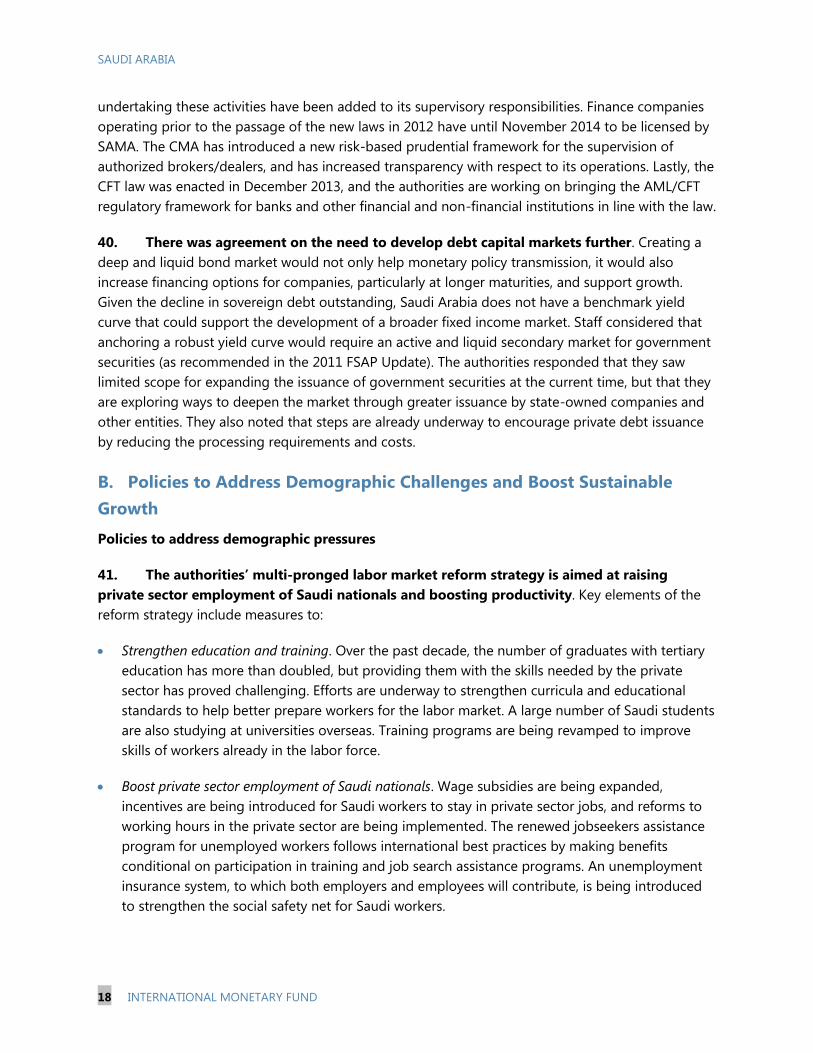
undertaking these activities have been added to its supervisory responsibilities. Finance companies
operating prior to the passage of the new laws in 2012 have until November 2014 to be licensed by
SAMA. The CMA has introduced a new risk-based prudential framework for the supervision of
authorized brokers/dealers, and has increased transparency with respect to its operations. Lastly, the
CFT law was enacted in December 2013, and the authorities are working on bringing the AML/CFT
regulatory framework for banks and other financial and non-financial institutions in line with the law.
40. There was agreement on the need to develop debt capital markets further. Creating a
deep and liquid bond market would not only help monetary policy transmission, it would also
increase financing options for companies, particularly at longer maturities, and support growth.
Given the decline in sovereign debt outstanding, Saudi Arabia does not have a benchmark yield
curve that could support the development of a broader fixed income market. Staff considered that
anchoring a robust yield curve would require an active and liquid secondary market for government
securities (as recommended in the 2011 FSAP Update). The authorities responded that they saw
limited scope for expanding the issuance of government securities at the current time, but that they
are exploring ways to deepen the market through greater issuance by state-owned companies and
other entities. They also noted that steps are already underway to encourage private debt issuance
by reducing the processing requirements and costs.
B. Policies to Address Demographic Challenges and Boost Sustainable
Growth
Policies to address demographic pressures
41. The authorities’ multi-pronged labor market reform strategy is aimed at raising
private sector employment of Saudi nationals and boosting productivity. Key elements of the
reform strategy include measures to:
Strengthen education and training. Over the past decade, the number of graduates with tertiary
education has more than doubled, but providing them with the skills needed by the private
sector has proved challenging. Efforts are underway to strengthen curricula and educational
standards to help better prepare workers for the labor market. A large number of Saudi students
are also studying at universities overseas. Training programs are being revamped to improve
skills of workers already in the labor force.
Boost private sector employment of Saudi nationals. Wage subsidies are being expanded,
incentives are being introduced for Saudi workers to stay in private sector jobs, and reforms to
working hours in the private sector are being implemented. The renewed jobseekers assistance
program for unemployed workers follows international best practices by making benefits
conditional on participation in training and job search assistance programs. An unemployment
insurance system, to which both employers and employees will contribute, is being introduced
to strengthen the social safety net for Saudi workers.

SAUDI ARABIA
INTERNATIONAL MONETARY FUND 19
Enhance mobility and improve recruitment of foreign labor. Greater mobility for foreign workers
employed by firms that are not compliant with Nitaqat (the employment quota program for
Saudi nationals) is in place and could over time help narrow wage differentials by increasing the
wages of foreign workers. To strengthen the regulation of foreign labor, licenses are being
issued to mega-companies to allow them to manage the overseas recruitment process. A
scheme to provide retirement benefits to foreign workers is also being considered and could
help attract more-skilled foreign workers.
42. There was agreement that ongoing labor market reforms have resulted in an increase
in private sector hiring of Saudi workers. Based on data available through June-2013, private
sector employment of Saudi workers has risen significantly since the implementation of the new
labor market policies. However, the public sector continues to be the dominant source of new jobs.
In this regard, staff welcomed the ongoing labor market reforms and progress so far, yet stressed
the need for firm control of public sector jobs and wages to reset expectations, measures to ease
employment regulations for nationals where appropriate, and further steps to increase the mobility
of foreign workers to narrow wage differentials. The implementation of measures to refocus hiring
on skilled rather than unskilled foreign labor would also help.
43. The government is implementing an ambitious program to increase the supply of
housing. Excluding the large proportion of the population who live in low-quality housing,
homeownership among Saudi nationals is only about 36 percent. A SAR 250 billion housing
program was announced in 2011. It was originally envisaged that the government would directly
build 500,000 new housing units, but the authorities explained that the current plan is for greater
private sector involvement, with the government playing a facilitating role by providing free public
land and needed infrastructure for development, together with interest-free loans for buyers (up to
SAR 500,000). The support to buyers will be allocated according to a points system that will favor
those with the greatest need.
44. The targeting of the housing program on those people most in need is welcome, but
staff noted that disbursements will consume a substantial part of the accumulated financial
assets of the government (see paragraph 24). Efficient use of these resources will require ensuring
that borrowers have both the ability and the incentive to repay the loans, that the criteria for
eligibility are strictly focused on those most in need, and that financing is provided for new housing
rather than the purchase of existing dwellings. Staff emphasized that it will be important to ensure
that the program does not undermine the private real estate market or the development of the
mortgage market.
45. Domestic energy consumption is likely to continue to rise. Saudi Arabia has one of the
highest levels of energy consumption per capita in the world and one of the lowest prices. The
current energy pricing structure provides incentives for investment in energy-intensive industries,
and domestic energy consumption has grown rapidly in recent years. To curb the rapid growth in
energy consumption, the authorities are strengthening building and appliance energy efficiency
standards, including in industry. Tighter vehicle emission standards and public transportation networks

SAUDI ARABIA
20 INTERNATIONAL MONETARY FUND
are planned over the medium-term. The authorities considered that these efforts will slow the
growth of energy consumption over time.
46. Staff recommended an upward adjustment of energy prices over the medium-term.
This would help curb the rapid growth in domestic consumption, reduce existing incentives in the
growth model towards energy intensive industries, and strengthen the fiscal position. In line with
international experience, such a policy adjustment would need to be well-planned, phased over
time, and clearly explained and communicated to the population and businesses. Although low
energy prices primarily benefit the better-off, an increase in energy prices would likely have an
adverse impact on poor and vulnerable groups and compensatory measures would need to be put
in place. Energy intensive industries would need time to adjust their production and cost structures
to remain competitive. The potential inflationary impact would also need to be carefully managed.
The authorities expressed concern about the macroeconomic and social implications of an
adjustment to energy prices, and noted that the completion of public transportation projects would
be a precondition for reforms.
Reforms to diversify the economy and boost sustainable growth
47. Economic diversification is a considerable challenge in Saudi Arabia where the oil
production horizon is long. A large number of structural reforms have been implemented over the
past two decades, including significant investments in human capital and physical infrastructure,
improvements to the business environment, and increased access to finance for SMEs, including
through the establishment of dedicated SME units in banks, the Kafalah loan-guarantee program,
and better access to credit information through SIMAH, the national credit bureau. The share of
non-oil real GDP has increased over the past two decades, but non-oil exports remain limited, the
level of export sophistication is low, and productivity growth has remained weak. The experience of
Saudi Arabia in this regard is similar to that of other oil exporting countries, where incentives for
diversification are limited when they have a long oil production horizon.
48. The authorities have continued their efforts to improve the business environment and
boost trade and investment. Saudi Arabia scores well in terms of business climate indicators
although enforcing contracts and resolving insolvencies remain areas of concern (Figure 7). In this
regard, work has started on a new insolvency law and contract enforcement is being strengthened.
Privatization of state-owned enterprises is underway as a means to boost economic efficiency and
increase private investment. Industrial clusters around oil and mining, and joint ventures in refining,
mining, and banking are being developed. The recent establishment of the Saudi Export
Development Authority and the implementation of the GCC customs union from January 1, 2015
could provide a boost to intra-regional trade. Other specific measures could be considered to
encourage firms to export, including providing financing and insurance support.
SAUDI ARABIA
INTERNATIONAL MONETARY FUND 21
49. Despite these reforms, the incentives for diversification are not yet fully developed.
National accounts data suggests that for the economy as a whole and for the non-oil private sector
about 75 percent of GDP goes to capital (gross operating surplus)—a high level by international
standards—and only 25 percent to labor (compensation of employees). This suggests a business
model where firms are able to extract large rents given their reliance on low cost foreign labor, and
have no incentive to develop export markets given the higher risks and costs these entail. On the
labor side, the incentives and opportunities for Saudis to participate in the private sector remain low
given the higher wages and benefits available in the public sector, particularly for the less skilled,
and the cultural limitations on the employment of women (although these are slowly changing).
Moving toward a more diversified economy will likely require a change in these incentive structures.
In this regard, the authorities considered that ongoing labor market reforms were likely to narrow
wage differentials over time, boost overall labor costs, and increase productivity, thereby realigning
incentives for firms and Saudi workers.
Statistical issues
50. Improvements are continuing in the area of statistics, but gaps remain. FSI data is now
reported to the Fund and published on a quarterly basis. SAMA has improved the coverage of other
investment flows in the balance of payments and reduced the errors and omissions. Work is
ongoing to improve FDI data. Publication of fiscal data in GFSM2001 format would be a significant
step forward. Data on wages, house prices, and other indicators of the real estate market would
strengthen economic analysis, while a more definitive statistical release calendar would help users.
Subscription to SDDS should be a short-term goal, while close collaboration with GCCStat could
help improve statistics in Saudi Arabia and the region.
STAFF APPRAISAL
51. The economy is growing strongly, and risks are broadly balanced. In 2014, oil
production is expected to be little changed from 2013, while government spending on large scale
infrastructure and housing projects is expected to underpin non-oil private sector growth. Inflation
has eased since mid-2013, driven largely by food prices, and unemployment has fallen. Global
financial market volatility has had a limited impact on Saudi Arabia. Risks to the growth outlook are
balanced and mainly center on the oil market.
52. Saudi Arabia plays a systemic and stabilizing role in the global oil market. In line with
this role, Saudi Arabia increased oil production in 2013 to help prevent supply disturbances in other
countries from having a negative impact on global growth. Within the Middle East region, Saudi
Arabia is a generous provider of financial assistance, and large remittance flows from expatriates
working in the country provide important income flows to countries in the region and in Asia.
53. Fiscal adjustment is needed to preserve buffers and increase saving for
intergenerational equity purposes. The fiscal consolidation envisaged at the time of the 2013
Article IV has not materialized as spending growth has remained strong. While the desire to

SAUDI ARABIA
22 INTERNATIONAL MONETARY FUND
continue to develop the economic and social infrastructure of the country is understandable, the
government’s ambitious spending program would significantly erode the large fiscal buffers that
have been built over the past decade and increase vulnerability to a drop in oil prices. A slowing in
the pace of government spending together with measures to increase non-oil revenues would help
strike a better balance between achieving development goals, maintaining the ability to manage
risks, and saving for future generations. If the budget were put on a consolidation path and fiscal
buffers were maintained, these buffers could be used to smooth spending in the event of a
temporary decline in oil prices. Ensuring the efficiency of public investment spending is also
important.
54. Reforms to the fiscal policy framework are needed to support policy implementation
and allow policymakers to fully evaluate the sustainability of the budget. These reforms should
start with the annual budget to ensure it provides a realistic representation of the government’s
planned expenditures during the year. This will improve the budget as a signaling device of the
government’s fiscal policy intentions, as well as help ensure the efficiency of public spending.
The budget estimates should include planned spending from the budget surplus fund and the
full costing of all expected spending commitments. The annual budget should be set within a
medium-term framework that is anchored around an estimate of structural revenues that delinks
spending decisions from oil revenue volatility and that fully integrates the expenditure priorities in
the five-year national development plan within the budget. Establishing a macro-fiscal unit and
publishing data in GFSM2001 format will support these changes.
55. Monetary and macroprudential policy settings are appropriate at present, but the
policy frameworks could be strengthened. The introduction of a liquidity forecasting framework
could help enable better liquidity management and strengthen the monetary policy transmission
mechanism. Developing a formal macroprudential framework would give SAMA a clear mandate for
ensuring financial stability and would more explicitly codify coordination across regulators. Within
this framework, consideration should be given to linking the use of macroprudential tools with
macroeconomic and financial developments in a countercyclical way. These tools would help SAMA
manage the potential effects of asset price cycles and other developments on financial stability. In
this context, if equity prices continue to rise strongly, consideration should be given to tightening
prudential norms for lending for equity investment.
56. Reforms to strengthen financial sector regulation and supervision should go hand-in-
hand with measures to promote financial development and inclusion. Saudi Arabia was among
the first countries to implement Basle III capital, liquidity, and leverage standards for the banking
system, which remains well-capitalized, liquid, and profitable. Measures are also underway to
improve access to mortgage finance, streamline the process for debt issuance, and increase financial
inclusion. The D-SIB framework should be finalized, and the AML/CFT regulatory and reporting
framework brought into line with the new CFT law and implemented. Developing a benchmark yield
curve could help develop a local debt market, thereby increasing financing and investment options
in the economy.

SAUDI ARABIA
INTERNATIONAL MONETARY FUND 23
57. Initiatives to address demographic pressures need to be implemented in coordination
with other policies. Labor market programs are aimed at increasing the skills and competitiveness
of Saudi nationals and have contributed to increasing their employment in the private sector. These
programs need to be complemented with a reduced reliance on public sector jobs. The
government’s housing programs need to be carefully targeted to the less well-off, and work in
tandem with the private sector to ensure that policies to develop private mortgage finance are given
space to work. Curbing the growth in domestic energy consumption will require a well
communicated upward adjustment of energy prices, with compensation provided to vulnerable
sections of society. Efforts to improve energy efficiency and develop public transportation networks
will be more effective if implemented in tandem with higher energy prices.
58. Economic diversification in a country such as Saudi Arabia which has vast oil resources
is a significant challenge. The government is making considerable efforts to lay the ground for
further diversification by upgrading infrastructure, strengthening education and skills, boosting
access to finance for SMEs, and improving the business environment. However, the incentives for
diversification are not yet fully developed, and further efforts are needed to encourage firms to
export and Saudi workers to participate in the private sector.
59. Considerable progress has been made in improving the quality and availability of key
economic statistics. Further progress is needed, however, particularly in the areas of government
finance, national accounts, labor, and real estate market statistics. Subscription to SDDS should be a
short-term goal, while close collaboration with GCCStat could help improve statistics in Saudi Arabia
and the region.
60. It is recommended that the next Article IV consultation take place on the standard 12-
month cycle.
SAUDI ARABIA
24 INTERNATIONAL MONETARY FUND
Figure 1. Saudi Arabia and G20 Comparators: Selected Economic Indicators, 2009–13
Averages
Source: IMF World Economic Outlook.
-4
-2
0
2
4
6
8
10
-4
-2
0
2
4
6
8
10
Real GDP Growth
(Percent)
-2
0
2
4
6
8
10
12
-2
0
2
4
6
8
10
12
Inflation
(Percent)
0
5
10
15
20
25
30
0
5
10
15
20
25
30
Unemployment Rate
(Percent)
-12
-10
-8
-6
-4
-2
0
2
4
6
8
-12
-10
-8
-6
-4
-2
0
2
4
6
8
Fiscal Balance
(Percent of GDP)
0
50
100
150
200
250
0
50
100
150
200
250
Gross Government Debt
(Percent of GDP)
-500
-400
-300
-200
-100
0
100
200
300
-500
-400
-300
-200
-100
0
100
200
300
Current Account Balance
(US$ billion)
SAUDI ARABIA
INTERNATIONAL MONETARY FUND 25
Figure 2. Growth and Employment
SAUDI ARABIA
26 INTERNATIONAL MONETARY FUND
Figure 3. Inflation and Monetary Developments
SAUDI ARABIA
INTERNATIONAL MONETARY FUND 27
Figure 4. Fiscal and External Sector Developments
Sources: Country authorities; and IMF staff calculations.1Real expenditures are deflated by the CPI. 2The sustainable level of fiscal spending from the oil wealth is defined as an annuity constant in real per capita
terms. The shaded area represents the sustainable level of fiscal spending conditional on oil prices remaining within
$25 per barrel of the baseline.3Structural revenues are estimated by assuming that the long-term oil price is the average oil price from past five
years. Long-term oil output is computed as a three year moving average including the current year. The structural
balance is then computed as structural revenues less total expenditures.
-10
-5
0
5
10
15
20
25
30
-10
-5
0
5
10
15
20
25
30
2009 2010 2011 2012 2013 2014
Fiscal balance Current account balance
Fiscal and Current Account Balances, 2009–14
(Percent of GDP)
Bahrain
Kuwait
Oman
Qatar
Saudi
Arabia
U.A.E.
0
20
40
60
80
100
120
140
0
20
40
60
80
100
120
140
0 20 40 60 80 100 120
Fis
cal B
ala
nce
External Balance
2012
2013
Break-even Oil Prices, 2012–13
(US$ dollars per barrel)
Average
Brent price
in 2013:
$109
0
5
10
15
20
25
0
20
40
60
80
100
2009 2010 2011 2012 2013 2014
Non-oil deficit (% non-oil GDP)
Real government spending growth (RHS)
Real Government Spending,2009–141
(Percent)
-20
-10
0
10
20
30
40
-20
-10
0
10
20
30
40
2007 2009 2011 2013 2015 2017 2019
Overall balance (% GDP)
Structural balance (% non-oil GDP)
Structural balance adj. scenario
(%non-oil GDP)
Structural and Overall Fiscal Balance, 2007–193
0
10
20
30
40
50
60
70
0
10
20
30
40
50
60
70
2010 2011 2012 2013 2014 2015 2016 2017 2018 2019
Projected and Sustainable Non-oil Primary Deficit2
(Percent of non-oil GDP)
Sustainable level - baseline
Projected level
Average
(2003-2013)
Adjustment
scenario
Non-oil current
balance
-20
-10
0
10
20
30
40
50
60
-20
-10
0
10
20
30
40
50
60
2001 2003 2005 2007 2009 2011 2013
FoodstuffChemical productsPlastic productsBase metals Machines and equipmentOtherRe-exportsTotal
Contribution to Non-oil Export Growth, 2001–13
(Percent)
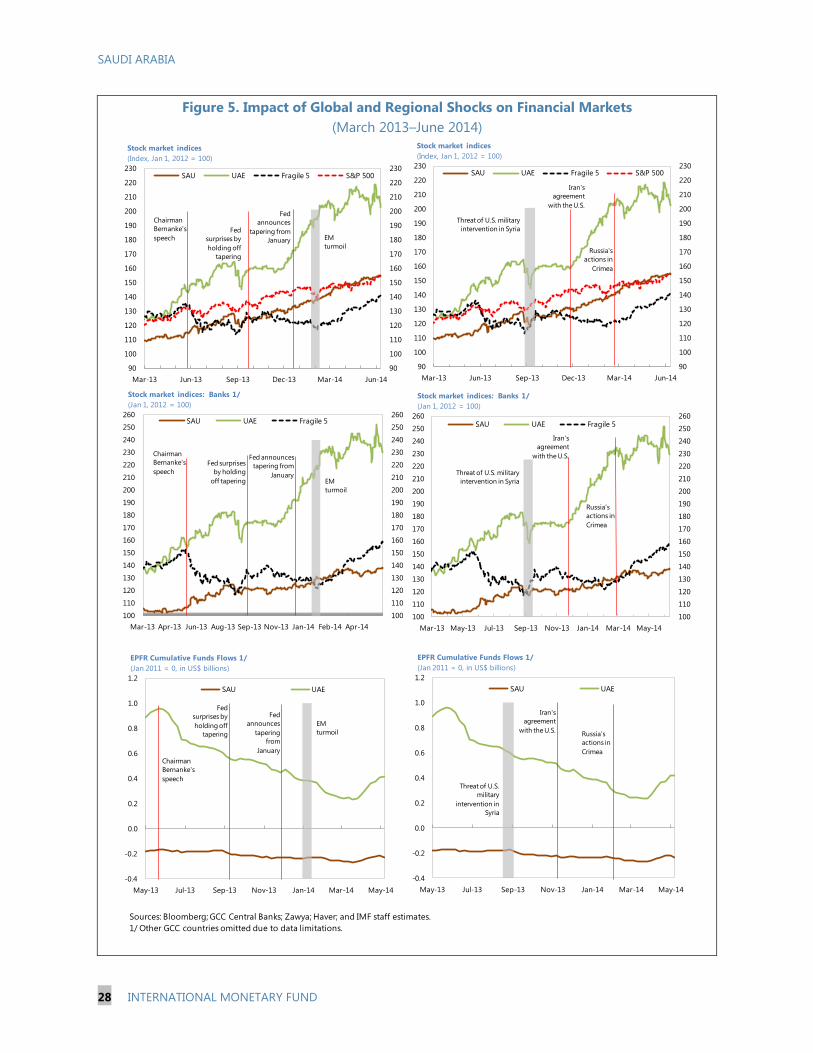
SAUDI ARABIA
28 INTERNATIONAL MONETARY FUND
Figure 5. Impact of Global and Regional Shocks on Financial Markets
(March 2013–June 2014)
-0.4
-0.2
0.0
0.2
0.4
0.6
0.8
1.0
1.2
May-13 Jul-13 Sep-13 Nov-13 Jan-14 Mar-14 May-14
SAU UAE
EPFR Cumulative Funds Flows 1/
(Jan 2011 = 0, in US$ billions)
Russia's
actions in
Crimea
Iran's
agreement
with the U.S.
Threat of U.S.
military
intervention in
Syria
90
100
110
120
130
140
150
160
170
180
190
200
210
220
230
90
100
110
120
130
140
150
160
170
180
190
200
210
220
230
Mar-13 Jun-13 Sep-13 Dec-13 Mar-14 Jun-14
SAU UAE Fragile 5 S&P 500
Stock market indices
(Index, Jan 1, 2012 = 100)
Russia's
actions in
Crimea
Iran's
agreement
with the U.S.
Threat of U.S. military
intervention in Syria
100
110
120
130
140
150
160
170
180
190
200
210
220
230
240
250
260
100
110
120
130
140
150
160
170
180
190
200
210
220
230
240
250
260
Mar-13 May-13 Jul-13 Sep-13 Nov-13 Jan-14 Mar-14 May-14
SAU UAE Fragile 5
Stock market indices: Banks 1/
(Jan 1, 2012 = 100)
Russia's
actions in
Crimea
Iran's
agreement
with the U.S.
Threat of U.S. military
intervention in Syria
90
100
110
120
130
140
150
160
170
180
190
200
210
220
230
90
100
110
120
130
140
150
160
170
180
190
200
210
220
230
Mar-13 Jun-13 Sep-13 Dec-13 Mar-14 Jun-14
SAU UAE Fragile 5 S&P 500
Stock market indices
(Index, Jan 1, 2012 = 100)
Chairman
Bernanke's
speechFed
surprises by
holding off
tapering
Fed
announces
tapering from
January EM
turmoil
100
110
120
130
140
150
160
170
180
190
200
210
220
230
240
250
260
100
110
120
130
140
150
160
170
180
190
200
210
220
230
240
250
260
Mar-13 Apr-13 Jun-13 Aug-13 Sep-13 Nov-13 Jan-14 Feb-14 Apr-14
SAU UAE Fragile 5
Stock market indices: Banks 1/
(Jan 1, 2012 = 100)
Chairman
Bernanke's
speech
Fed surprises
by holding
off tapering
Fed announces
tapering from
January EM
turmoil
-0.4
-0.2
0.0
0.2
0.4
0.6
0.8
1.0
1.2
May-13 Jul-13 Sep-13 Nov-13 Jan-14 Mar-14 May-14
SAU UAE
EPFR Cumulative Funds Flows 1/
(Jan 2011 = 0, in US$ billions)
Chairman
Bernanke's
speech
Fed
surprises by
holding off
tapering
Fed
announces
tapering
from
January
EM
turmoil
Sources: Bloomberg; GCC Central Banks; Zawya; Haver; and IMF staff estimates.
1/ Other GCC countries omitted due to data limitations.

SAUDI ARABIA
INTERNATIONAL MONETARY FUND 29
Figure 6. Impact of Oil Prices on the Fiscal Position, 2014–191
(Percent of GDP unless otherwise specified)
Sources: Country authorities; and IMF staff calculations.1Assumes no fiscal policy action. Differences in expenditure and non-oil balance ratios are driven by the impact
of lower oil prices on nominal GDP.
0
20
40
60
80
100
120
140
0
20
40
60
80
100
120
140
2014 2015 2016 2017 2018 2019
$25 per barrel above baseline
Baseline scenario
$25 per barrel below baseline
Oil Prices
(US$ per barrel)
0
5
10
15
20
25
30
35
40
0
5
10
15
20
25
30
35
40
2014 2015 2016 2017 2018 2019
Oil Revenues
20
25
30
35
40
45
50
20
25
30
35
40
45
50
2014 2015 2016 2017 2018 2019
Total Expenditure and Net Lending
-50
-45
-40
-35
-30
-25
-20
-50
-45
-40
-35
-30
-25
-20
2014 2015 2016 2017 2018 2019
Non-oil Primary Balance
-25
-20
-15
-10
-5
0
5
10
-20
-15
-10
-5
0
5
10
2014 2015 2016 2017 2018 2019
Overall Balance
-30
-20
-10
0
10
20
30
40
50
60
70
-20
-10
0
10
20
30
40
50
60
70
2014 2015 2016 2017 2018 2019
Central Government Deposits at SAMA
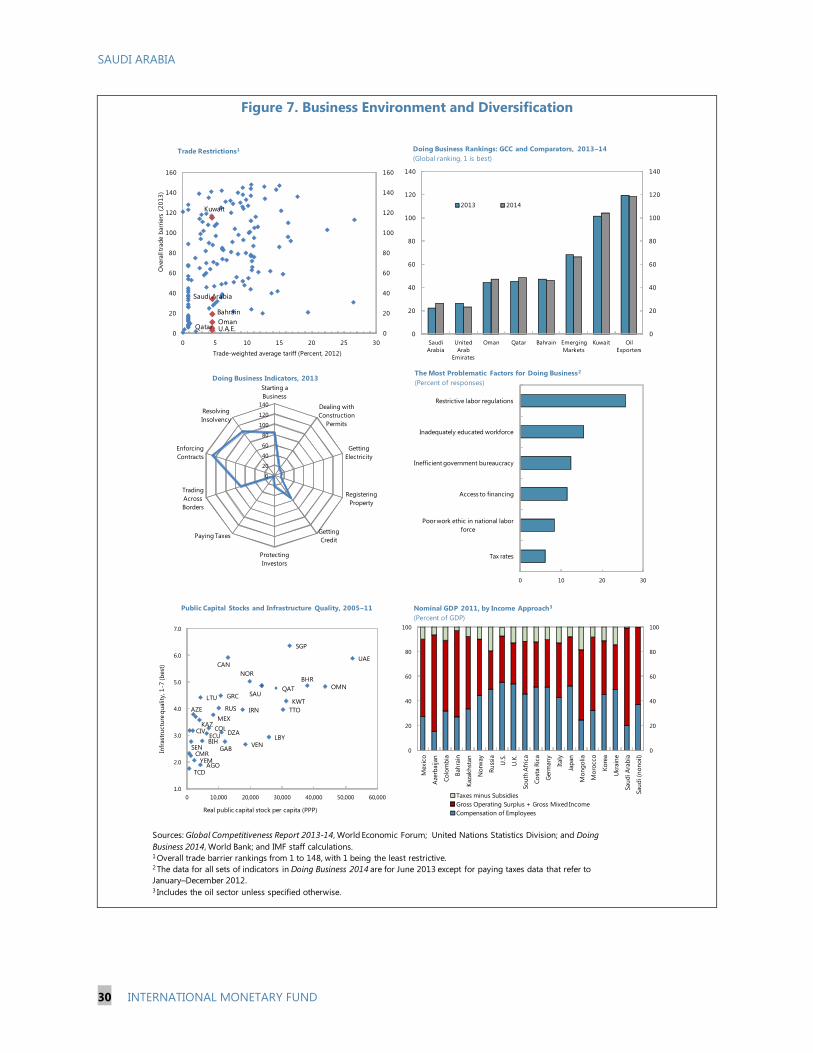
SAUDI ARABIA
30 INTERNATIONAL MONETARY FUND
Figure 7. Business Environment and Diversification
Sources: Global Competitiveness Report 2013-14, World Economic Forum; United Nations Statistics Division; and Doing
Business 2014, World Bank; and IMF staff calculations.1 Overall trade barrier rankings from 1 to 148, with 1 being the least restrictive.2 The data for all sets of indicators in Doing Business 2014 are for June 2013 except for paying taxes data that refer to
January–December 2012.3 Includes the oil sector unless specified otherwise.
Bahrain
Kuwait
Oman
Saudi Arabia
Qatar U.A.E.0
20
40
60
80
100
120
140
160
0
20
40
60
80
100
120
140
160
0 5 10 15 20 25 30
Overa
ll tra
de b
arr
iers
(2
01
3)
Trade-weighted average tariff (Percent, 2012)
Trade Restrictions1
0
20
40
60
80
100
120
140
0
20
40
60
80
100
120
140
Saudi
Arabia
United
Arab
Emirates
Oman Qatar Bahrain Emerging
Markets
Kuwait Oil
Exporters
2013 2014
Doing Business Rankings: GCC and Comparators, 2013–14
(Global ranking, 1 is best)
0
20
40
60
80
100
120
140
Starting a
Business
Dealing with
Construction
Permits
Getting
Electricity
Registering
Property
Getting
Credit
Protecting
Investors
Paying Taxes
Trading
Across
Borders
Enforcing
Contracts
Resolving
Insolvency
Doing Business Indicators, 2013
0 10 20 30
Tax rates
Poor work ethic in national labor
force
Access to financing
Inefficient government bureaucracy
Inadequately educated workforce
Restrictive labor regulations
The Most Problematic Factors for Doing Business2
(Percent of responses)
0
20
40
60
80
100
0
20
40
60
80
100
Mexic
o
Aze
rbaijan
Co
lom
bia
Bah
rain
Kaza
kh
stan
No
rway
Ru
ssia
U.S
.
U.K
.
So
uth
Afr
ica
Co
sta R
ica
Germ
an
y
Italy
Jap
an
Mo
ng
olia
Mo
rocco
Ko
rea
Ukra
ine
Sau
di A
rab
ia
Sau
di (n
on
oil)
Nominal GDP 2011, by Income Approach3
(Percent of GDP)
Taxes minus Subsidies
Gross Operating Surplus + Gross Mixed Income
Compensation of Employees
AZE
UAE
KAZ
SAU
BHR
QAT OMN
KWT
IRN
DZA
YEM
LBYCIV
CMRSEN
TCD
GAB
AGO
SGP
LTU
NOR
GRC
RUS
BIH
CAN
MEX
COLECU
TTO
VEN
1.0
2.0
3.0
4.0
5.0
6.0
7.0
0 10,000 20,000 30,000 40,000 50,000 60,000
Infr
ast
ructu
re q
uality
, 1
-7 (b
est
)
Real public capital stock per capita (PPP)
Public Capital Stocks and Infrastructure Quality, 2005–11

SAUDI ARABIA
INTERNATIONAL MONETARY FUND 31
Table 1. Saudi Arabia: Selected Economic Indicators, 2011–19
Prel.
2011 2012 2013 2014 2015 2016 2017 2018 2019
National income and prices
Crude oil production (million of barrels per day) 1
9.3 9.8 9.6 9.7 9.7 9.8 9.9 10.0 10.1
Average oil export price (U.S. dollars per barrel) 2
107.1 109.5 105.8 105.0 101.6 97.7 95.2 93.4 91.8
Nominal GDP (SAR billions) 2,511 2,752 2,807 2,923 3,011 3,114 3,250 3,406 3,573
Nominal GDP (US$ billions) 670 734 748 779 803 830 867 908 953
Nominal non-oil GDP (SAR billions) 1,234 1,376 1,486 1,605 1,735 1,877 2,033 2,201 2,379
Nominal GDP per capita (US$) 23,594 25,139 24,953 25,452 25,706 26,064 26,668 27,400 28,183
Real GDP 8.6 5.8 4.0 4.6 4.5 4.4 4.4 4.4 4.4
Oil 11.0 5.7 -1.0 0.6 0.0 0.9 0.9 0.9 0.9
Non-oil 7.9 5.8 5.3 5.6 5.5 5.2 5.2 5.2 5.1
Real GDP—public sector 8.7 5.5 3.7 4.6 4.3 3.9 4.0 4.1 3.5
Real GDP—private sector 7.7 6.0 6.0 6.0 6.0 5.7 5.7 5.6 5.6
Consumer price index (avg) 3.7 2.9 3.5 2.9 3.2 3.4 3.6 3.4 3.3
External sector
Exports f.o.b. 45.2 6.5 -2.9 0.2 -2.3 -1.7 -0.3 0.3 0.6
Oil 47.6 6.2 -4.3 -0.8 -4.1 -3.7 -2.4 -1.8 -1.7
Non-oil 31.3 8.0 6.0 6.5 7.8 8.4 8.9 8.7 8.6
Imports f.o.b. 23.1 18.2 7.7 6.9 7.3 7.6 7.0 6.0 4.9
Current account balance (percent of GDP) 23.7 22.4 17.9 15.4 12.5 10.4 9.0 7.5 7.0
Export volume 5.6 4.6 0.5 1.2 1.7 2.9 2.9 2.8 2.8
Import volume 12.6 18.6 10.1 9.0 8.6 7.5 6.5 5.4 4.3
Terms of trade 17.4 2.4 1.3 2.0 -2.7 -4.0 -2.9 -2.1 -1.7
Money and credit
Net foreign assets 22.3 19.7 10.2 6.9 3.2 … … … …
Credit to government (net) 24.5 32.2 5.9 2.2 -6.1 … … … …
Credit to private sector 10.6 16.4 12.5 13.1 12.9 … … … …
Credit to state enterprises -1.4 24.4 11.5 8.0 8.2 … … … …
Money and quasi-money (M3) 13.3 13.9 10.9 11.0 11.0 … … … …
3-month Interbank rate (percent p.a.) 3
0.69 0.92 0.95 0.94 … … … … …
Central government finances
Revenue 44.5 45.3 41.2 40.2 37.9 35.8 34.0 32.3 30.7
Of which: oil 41.2 41.6 36.9 35.8 33.3 31.0 29.0 27.1 25.4
Expenditure 33.4 33.3 35.4 37.6 39.4 39.3 39.2 39.6 38.1
Expense 21.9 22.2 21.2 21.5 22.7 22.4 22.4 23.4 22.7
Net acquisition of non-financial assets 11.4 11.1 14.3 16.2 16.7 16.9 16.7 16.2 15.4
Net lending (+)/borrowing (-) 11.2 12.0 5.8 2.5 -1.4 -3.5 -5.2 -7.3 -7.4
Excluding oil revenue -30.0 -29.6 -31.1 -33.2 -34.7 -34.5 -34.1 -34.4 -32.8
Non-oil primary balance/non-oil GDP -60.9 -59.5 -59.5 -61.3 -61.1 -58.0 -55.4 -54.0 -50.1
Central government's gross domestic debt 5.4 3.6 2.7 2.6 2.5 2.4 2.3 2.2 2.1
Memorandum items:
SAMA's total net foreign assets (US$ billions) 535.2 647.6 716.7 768.5 793.9 798.3 784.9 751.6 704.7
In months of imports of goods and services 4
29.8 33.9 35.2 35.4 34.0 32.0 29.5 26.9 24.9
Imports goods & services/GDP 29.6 29.3 30.6 31.3 32.4 33.7 34.6 35.1 35.1
Real effective exchange rate (2000=100)3
96.5 99.1 101.1 99.7 … … … … …
Average exchange rate Saudi riyal/U.S. dollar5
3.75 3.75 3.75 3.75 … … … … …
Population (millions) 28.4 29.2 30.0 30.6 31.2 31.9 32.5 33.1 33.8
Unemployment rate (nationals, in percent of total) 12.4 12.0 11.5 … … … … … …
All-Shares Price Index (TASI)5
6418 6801 8536 9581 … … … … …
Sources: Saudi Arabian authorities; and IMF staff estimates and projections.1
Includes production from the Neutral Zone.2
Includes refined products. 3
Latest 2014 data is for end-April.4 Next 12 months.
5 Latest data is for June 25, 2014.
Proj.
(Percent of GDP)
(Percent change; unless otherwise indicated)
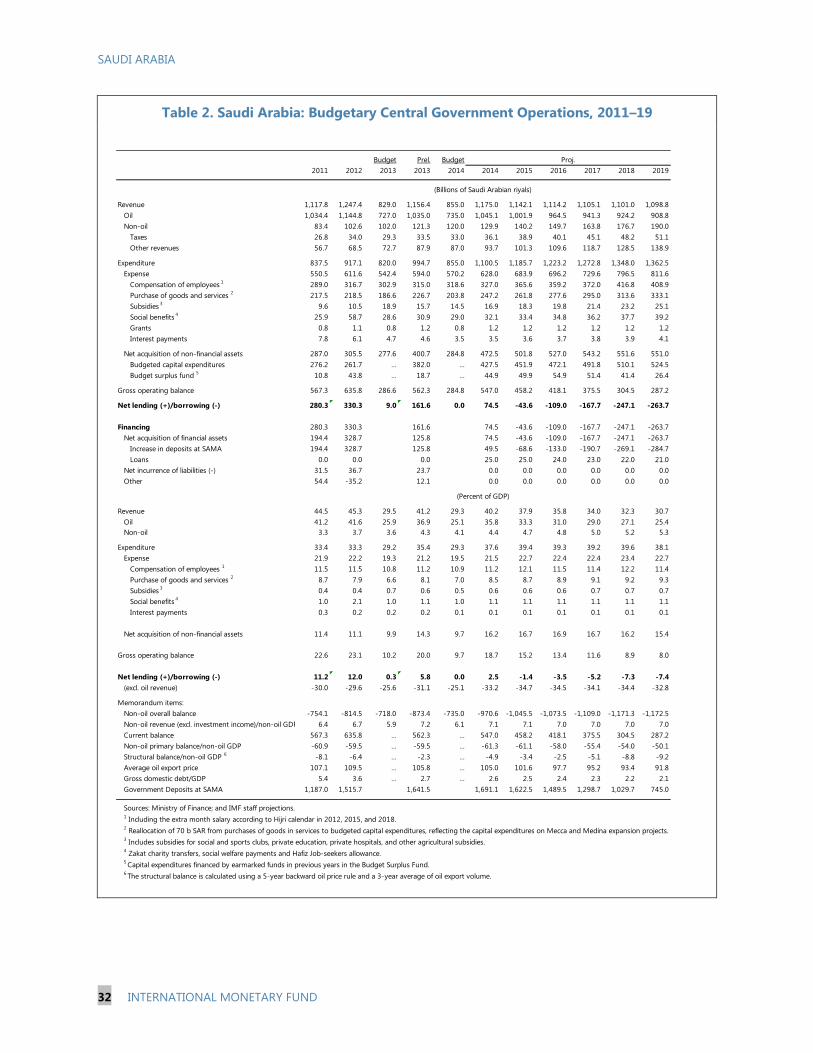
SAUDI ARABIA
32 INTERNATIONAL MONETARY FUND
Table 2. Saudi Arabia: Budgetary Central Government Operations, 2011–19
Budget Prel. Budget
2011 2012 2013 2013 2014 2014 2015 2016 2017 2018 2019
Revenue 1,117.8 1,247.4 829.0 1,156.4 855.0 1,175.0 1,142.1 1,114.2 1,105.1 1,101.0 1,098.8
Oil 1,034.4 1,144.8 727.0 1,035.0 735.0 1,045.1 1,001.9 964.5 941.3 924.2 908.8
Non-oil 83.4 102.6 102.0 121.3 120.0 129.9 140.2 149.7 163.8 176.7 190.0
Taxes 26.8 34.0 29.3 33.5 33.0 36.1 38.9 40.1 45.1 48.2 51.1
Other revenues 56.7 68.5 72.7 87.9 87.0 93.7 101.3 109.6 118.7 128.5 138.9
Expenditure 837.5 917.1 820.0 994.7 855.0 1,100.5 1,185.7 1,223.2 1,272.8 1,348.0 1,362.5
Expense 550.5 611.6 542.4 594.0 570.2 628.0 683.9 696.2 729.6 796.5 811.6
Compensation of employees 1
289.0 316.7 302.9 315.0 318.6 327.0 365.6 359.2 372.0 416.8 408.9
Purchase of goods and services 2
217.5 218.5 186.6 226.7 203.8 247.2 261.8 277.6 295.0 313.6 333.1
Subsidies 3
9.6 10.5 18.9 15.7 14.5 16.9 18.3 19.8 21.4 23.2 25.1
Social benefits 4
25.9 58.7 28.6 30.9 29.0 32.1 33.4 34.8 36.2 37.7 39.2
Grants 0.8 1.1 0.8 1.2 0.8 1.2 1.2 1.2 1.2 1.2 1.2
Interest payments 7.8 6.1 4.7 4.6 3.5 3.5 3.6 3.7 3.8 3.9 4.1
Net acquisition of non-financial assets 287.0 305.5 277.6 400.7 284.8 472.5 501.8 527.0 543.2 551.6 551.0
Budgeted capital expenditures 276.2 261.7 … 382.0 … 427.5 451.9 472.1 491.8 510.1 524.5
Budget surplus fund 5
10.8 43.8 … 18.7 … 44.9 49.9 54.9 51.4 41.4 26.4
Gross operating balance 567.3 635.8 286.6 562.3 284.8 547.0 458.2 418.1 375.5 304.5 287.2
Net lending (+)/borrowing (-) 280.3 330.3 9.0 161.6 0.0 74.5 -43.6 -109.0 -167.7 -247.1 -263.7
Financing 280.3 330.3 161.6 74.5 -43.6 -109.0 -167.7 -247.1 -263.7
Net acquisition of financial assets 194.4 328.7 125.8 74.5 -43.6 -109.0 -167.7 -247.1 -263.7
Increase in deposits at SAMA 194.4 328.7 125.8 49.5 -68.6 -133.0 -190.7 -269.1 -284.7
Loans 0.0 0.0 0.0 25.0 25.0 24.0 23.0 22.0 21.0
Net incurrence of liabilities (-) 31.5 36.7 23.7 0.0 0.0 0.0 0.0 0.0 0.0
Other 54.4 -35.2 12.1 0.0 0.0 0.0 0.0 0.0 0.0
Revenue 44.5 45.3 29.5 41.2 29.3 40.2 37.9 35.8 34.0 32.3 30.7
Oil 41.2 41.6 25.9 36.9 25.1 35.8 33.3 31.0 29.0 27.1 25.4
Non-oil 3.3 3.7 3.6 4.3 4.1 4.4 4.7 4.8 5.0 5.2 5.3
Expenditure 33.4 33.3 29.2 35.4 29.3 37.6 39.4 39.3 39.2 39.6 38.1
Expense 21.9 22.2 19.3 21.2 19.5 21.5 22.7 22.4 22.4 23.4 22.7
Compensation of employees 1
11.5 11.5 10.8 11.2 10.9 11.2 12.1 11.5 11.4 12.2 11.4
Purchase of goods and services 2
8.7 7.9 6.6 8.1 7.0 8.5 8.7 8.9 9.1 9.2 9.3
Subsidies 3
0.4 0.4 0.7 0.6 0.5 0.6 0.6 0.6 0.7 0.7 0.7
Social benefits 4
1.0 2.1 1.0 1.1 1.0 1.1 1.1 1.1 1.1 1.1 1.1
Interest payments 0.3 0.2 0.2 0.2 0.1 0.1 0.1 0.1 0.1 0.1 0.1
Net acquisition of non-financial assets 11.4 11.1 9.9 14.3 9.7 16.2 16.7 16.9 16.7 16.2 15.4
Gross operating balance 22.6 23.1 10.2 20.0 9.7 18.7 15.2 13.4 11.6 8.9 8.0
Net lending (+)/borrowing (-) 11.2 12.0 0.3 5.8 0.0 2.5 -1.4 -3.5 -5.2 -7.3 -7.4
(excl. oil revenue) -30.0 -29.6 -25.6 -31.1 -25.1 -33.2 -34.7 -34.5 -34.1 -34.4 -32.8
Memorandum items:
Non-oil overall balance -754.1 -814.5 -718.0 -873.4 -735.0 -970.6 -1,045.5 -1,073.5 -1,109.0 -1,171.3 -1,172.5
Non-oil revenue (excl. investment income)/non-oil GDP 6.4 6.7 5.9 7.2 6.1 7.1 7.1 7.0 7.0 7.0 7.0
Current balance 567.3 635.8 … 562.3 … 547.0 458.2 418.1 375.5 304.5 287.2
Non-oil primary balance/non-oil GDP -60.9 -59.5 … -59.5 … -61.3 -61.1 -58.0 -55.4 -54.0 -50.1
Structural balance/non-oil GDP 6
-8.1 -6.4 … -2.3 … -4.9 -3.4 -2.5 -5.1 -8.8 -9.2
Average oil export price 107.1 109.5 … 105.8 … 105.0 101.6 97.7 95.2 93.4 91.8
Gross domestic debt/GDP 5.4 3.6 … 2.7 … 2.6 2.5 2.4 2.3 2.2 2.1
Government Deposits at SAMA 1,187.0 1,515.7 1,641.5 1,691.1 1,622.5 1,489.5 1,298.7 1,029.7 745.0
Sources: Ministry of Finance; and IMF staff projections.1 Including the extra month salary according to Hijri calendar in 2012, 2015, and 2018.
2 Reallocation of 70 b SAR from purchases of goods in services to budgeted capital expenditures, reflecting the capital expenditures on Mecca and Medina expansion projects.
3 Includes subsidies for social and sports clubs, private education, private hospitals, and other agricultural subsidies.
4 Zakat charity transfers, social welfare payments and Hafiz Job-seekers allowance.
5 Capital expenditures financed by earmarked funds in previous years in the Budget Surplus Fund.
6 The structural balance is calculated using a 5-year backward oil price rule and a 3-year average of oil export volume.
Proj.
(Billions of Saudi Arabian riyals)
(Percent of GDP)
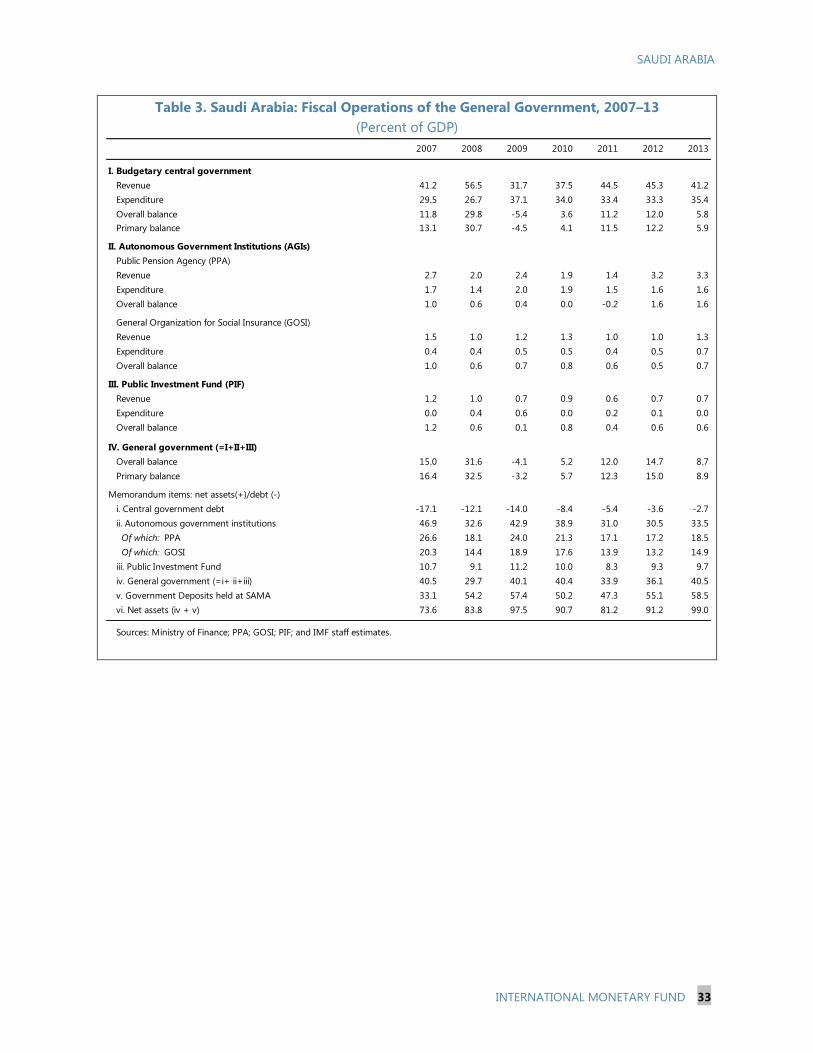
SAUDI ARABIA
INTERNATIONAL MONETARY FUND 33
Table 3. Saudi Arabia: Fiscal Operations of the General Government, 2007–13
(Percent of GDP)
2007 2008 2009 2010 2011 2012 2013
I. Budgetary central government
Revenue 41.2 56.5 31.7 37.5 44.5 45.3 41.2
Expenditure 29.5 26.7 37.1 34.0 33.4 33.3 35.4
Overall balance 11.8 29.8 -5.4 3.6 11.2 12.0 5.8
Primary balance 13.1 30.7 -4.5 4.1 11.5 12.2 5.9
II. Autonomous Government Institutions (AGIs)
Public Pension Agency (PPA)
Revenue 2.7 2.0 2.4 1.9 1.4 3.2 3.3
Expenditure 1.7 1.4 2.0 1.9 1.5 1.6 1.6
Overall balance 1.0 0.6 0.4 0.0 -0.2 1.6 1.6
General Organization for Social Insurance (GOSI)
Revenue 1.5 1.0 1.2 1.3 1.0 1.0 1.3
Expenditure 0.4 0.4 0.5 0.5 0.4 0.5 0.7
Overall balance 1.0 0.6 0.7 0.8 0.6 0.5 0.7
III. Public Investment Fund (PIF)
Revenue 1.2 1.0 0.7 0.9 0.6 0.7 0.7
Expenditure 0.0 0.4 0.6 0.0 0.2 0.1 0.0
Overall balance 1.2 0.6 0.1 0.8 0.4 0.6 0.6
IV. General government (=I+II+III)
Overall balance 15.0 31.6 -4.1 5.2 12.0 14.7 8.7
Primary balance 16.4 32.5 -3.2 5.7 12.3 15.0 8.9
Memorandum items: net assets(+)/debt (-)
i. Central government debt -17.1 -12.1 -14.0 -8.4 -5.4 -3.6 -2.7
ii. Autonomous government institutions 46.9 32.6 42.9 38.9 31.0 30.5 33.5
Of which: PPA 26.6 18.1 24.0 21.3 17.1 17.2 18.5
Of which: GOSI 20.3 14.4 18.9 17.6 13.9 13.2 14.9
iii. Public Investment Fund 10.7 9.1 11.2 10.0 8.3 9.3 9.7
iv. General government (=i+ ii+iii) 40.5 29.7 40.1 40.4 33.9 36.1 40.5
v. Government Deposits held at SAMA 33.1 54.2 57.4 50.2 47.3 55.1 58.5
vi. Net assets (iv + v) 73.6 83.8 97.5 90.7 81.2 91.2 99.0
Sources: Ministry of Finance; PPA; GOSI; PIF; and IMF staff estimates.

SAUDI ARABIA
34 INTERNATIONAL MONETARY FUND
Table 4. Saudi Arabia: Balance of Payments, 2011–19
(US$ billion)
Prel.
2011 2012 2013 2014 2015 2016 2017 2018 2019
Current account 158.6 164.8 134.3 120.2 100.1 86.5 77.7 68.4 66.7
(Percent of GDP) 23.7 22.4 17.9 15.4 12.5 10.4 9.0 7.5 7.0
Trade balance 244.8 246.6 224.3 214.6 193.9 174.4 160.0 149.1 140.8
Exports 364.7 388.4 377.0 377.8 369.1 362.8 361.7 362.8 364.9
Oil exports 317.6 337.5 323.1 320.3 307.1 295.6 288.5 283.3 278.6
Other exports 47.1 50.9 54.0 57.5 62.0 67.2 73.1 79.5 86.4
Imports (f.o.b.) -120.0 -141.8 -152.7 -163.3 -175.2 -188.4 -201.6 -213.8 -224.1
Services -66.5 -62.4 -64.9 -68.8 -72.9 -78.6 -84.6 -91.1 -95.8
Transportation -13.4 -15.6 -16.7 -17.7 -18.7 -20.1 -21.7 -23.3 -24.5
Travel -8.8 -9.6 -10.0 -10.7 -11.5 -12.6 -13.8 -15.0 -15.9
Other private services -44.3 -37.2 -38.2 -40.4 -42.7 -45.8 -49.2 -52.8 -55.4
Income 9.7 11.0 10.8 13.2 20.8 35.5 50.8 62.8 78.1
Of which: Investment income1
10.3 11.6 11.4 13.8 21.4 36.2 51.4 63.4 78.8
Current transfers -29.4 -30.4 -35.9 -38.7 -41.7 -44.9 -48.5 -52.3 -56.4
Of which : Workers' remittances -27.6 -28.6 -34.1 -36.8 -39.8 -43.0 -46.6 -50.4 -54.5
Capital Account 0.0 -0.3 -0.3 0.0 0.0 0.0 0.0 0.0 0.0
Financial account -14.4 -6.4 -61.0 -68.5 -74.8 -82.0 -91.1 -101.7 -113.6
Direct Investment 12.9 7.8 4.4 4.3 4.1 4.0 3.9 3.7 3.5
Abroad -3.4 -4.4 -4.9 -5.4 -5.8 -6.3 -6.9 -7.6 -8.3
In Saudi economy 16.3 12.2 9.3 9.7 10.0 10.3 10.8 11.3 11.8
Portfolio investments -16.0 -3.2 -9.4 -11.7 -14.3 -17.4 -21.1 -25.5 -30.6
Assets -15.4 -4.1 -11.2 -13.9 -17.0 -20.7 -25.1 -30.3 -36.3
Liabilities -0.6 0.9 1.8 2.2 2.7 3.3 4.0 4.8 5.8
Other investments -11.2 -11.0 -55.9 -61.0 -64.6 -68.7 -73.9 -79.9 -86.6
Assets -7.2 -10.3 -52.3 -57.1 -60.5 -64.3 -69.2 -74.8 -81.0
Liabilities -4.0 -0.7 -3.6 -3.9 -4.1 -4.4 -4.7 -5.1 -5.5
Net errors and omissions -48.2 -42.3 -3.8 0.0 0.0 0.0 0.0 0.0 0.0
Overall balance 96.0 115.8 69.2 51.8 25.4 4.5 -13.4 -33.3 -46.9
Financing -96.0 -115.8 -69.2 -51.8 -25.4 -4.5 13.4 33.3 46.9
Change in SAMA's NFA (- increase) -93.1 -112.5 -69.7 -51.8 -25.4 -4.5 13.4 33.3 46.9
Memorandum items:
SAMA's gross foreign assets 536.2 648.7 718.4 770.2 795.6 800.0 786.6 753.3 706.4
(In months of imports) 2
29.9 34.0 35.3 35.5 34.1 32.0 29.6 27.0 25.0
Non-oil current account/GDP -23.8 -23.5 -25.2 -25.7 -25.8 -25.2 -24.3 -23.7 -22.2
WEO oil price (US$/barrel) 104.0 105.0 104.1 104.1 99.6 95.1 92.3 90.6 89.4
Average Saudi oil price (US$/barrel)3
107.1 109.5 105.8 105.0 101.6 97.7 95.2 93.4 91.8
Oil production (mbd) 9.3 9.8 9.6 9.7 9.7 9.8 9.9 10.0 10.1
Oil exports (mbd) 8.1 8.4 8.4 8.4 8.3 8.3 8.3 8.3 8.3
Oil exports/total exports 87.1 86.9 85.7 84.8 83.2 81.5 79.8 78.1 76.3
Imports of goods/GDP 17.9 19.3 20.4 20.9 21.8 22.7 23.3 23.5 23.5
GDP (US$ billion) 669.5 734.0 748.4 779.4 803.0 830.4 866.7 908.3 952.9
Sources: Saudi Arabian Monetary Agency; and IMF staff estimates and projections.1 Represents the return on NFA of SAMA, AGIs, and private sector.
2 Imports of goods and services over the next 12 months excluding imports for transit trade.
3 The average price of all oil exports, including refined products.
Proj.

SAUDI ARABIA
INTERNATIONAL MONETARY FUND 35
Table 5. Saudi Arabia: Monetary Survey, 2010–15
2010 2011 2012 2013 2014 2015
Foreign assets (net) 1,749.9 2,140.4 2,562.0 2,824.1 3,019.6 3,116.1
SAMA 1,651.5 2,007.1 2,428.6 2,687.8 2,881.9 2,977.0
Commercial banks 98.4 133.3 133.4 136.3 137.6 139.0
Domestic credit (net) -2.5 -119.0 -295.9 -245.0 -125.7 130.6
Net claims on government -810.5 -1,009.2 -1,334.6 -1,412.8 -1,444.0 -1,355.2
Claims on government 182.0 177.8 181.2 228.7 247.1 267.3
Government deposits at SAMA -992.6 -1,187.0 -1,515.7 -1,641.5 -1,691.1 -1,622.5
Claims on state enterprises 32.3 31.8 39.6 44.1 47.7 51.6
Claims on private sector 775.8 858.4 999.1 1,123.6 1,270.6 1,434.3
Money and quasi-money (M3) 1,080.4 1,223.6 1,393.8 1,545.1 1,715.2 1,903.0
Money supply (M2) 2/
Money (M1) 625.6 761.0 887.1 1,000.4 1,091.7 1,211.2
Currency outside banks 95.5 119.9 133.1 143.2 185.0 205.3
Demand deposits 530.1 641.1 754.0 857.3 906.7 1,006.0
Quasi-money 454.8 462.6 506.6 544.7 623.5 691.8
Time and savings deposits 298.3 305.4 324.4 345.0 394.9 438.2
Other quasi-money deposits 156.5 157.1 182.2 199.7 228.5 253.6
Other items (net liabilities) 667.1 797.8 872.4 1,033.9 1,178.7 1,343.7
Foreign assets (net) 11.5 36.1 34.5 18.8 12.7 5.6
Domestic credit (net) 0.4 -10.8 -14.5 3.6 7.7 14.9
Net claims on government -4.0 -18.4 -26.6 -5.6 -2.0 5.2
Claims on government 2.7 -0.4 0.3 3.4 1.2 1.2
Government deposits (increase -) -6.7 -18.0 -26.9 -9.0 -3.2 4.0
Claims on state enterprises 0.4 0.0 0.6 0.3 0.2 0.2
Claims on private sector 4.0 7.6 11.5 8.9 9.5 9.5
Money and quasi-money 5.0 13.3 13.9 10.9 11.0 11.0
Other items (net liabilities) 6.9 12.1 6.1 11.6 9.4 9.6
Foreign assets (net) 7.3 22.3 19.7 10.2 6.9 3.2
Domestic credit (net) -62.3 4717.7 148.6 -17.2 -48.7 -203.9
Net claims on government 5.4 24.5 32.2 5.9 2.2 -6.1
Claims on government 18.1 -2.3 1.9 26.3 8.0 8.2
Government deposits at SAMA (increase -) -7.5 -19.6 -27.7 -8.3 -3.0 4.1
Claims on state enterprises 14.7 -1.4 24.4 11.5 8.0 8.2
Claims on private sector 5.7 10.6 16.4 12.5 13.1 12.9
Money and quasi-money 5.0 13.3 13.9 10.9 11.0 11.0
Other items (net liabilities) 12.0 19.6 9.3 18.5 14.0 14.0
Memorandum items:
Specialized Credit Institutions credit (SAR billions) 192.2 208.4 249.3 271.6 … …
Ratio of M3-to-GDP 54.7 48.7 50.6 55.1 58.7 63.2
Ratio of Claims on private sector-to-non-oil GDP 71.9 70.5 73.8 76.7 80.3 83.8
Sources: Saudi Arabian Monetary Agency (SAMA); and IMF staff estimates.
(Percent; unless otherwise indicated)
(Billions of Saudi Arabian riyals)
(Changes in percent of beginning broad money stock)
(Percent changes, unless otherwise indicated)
Proj.
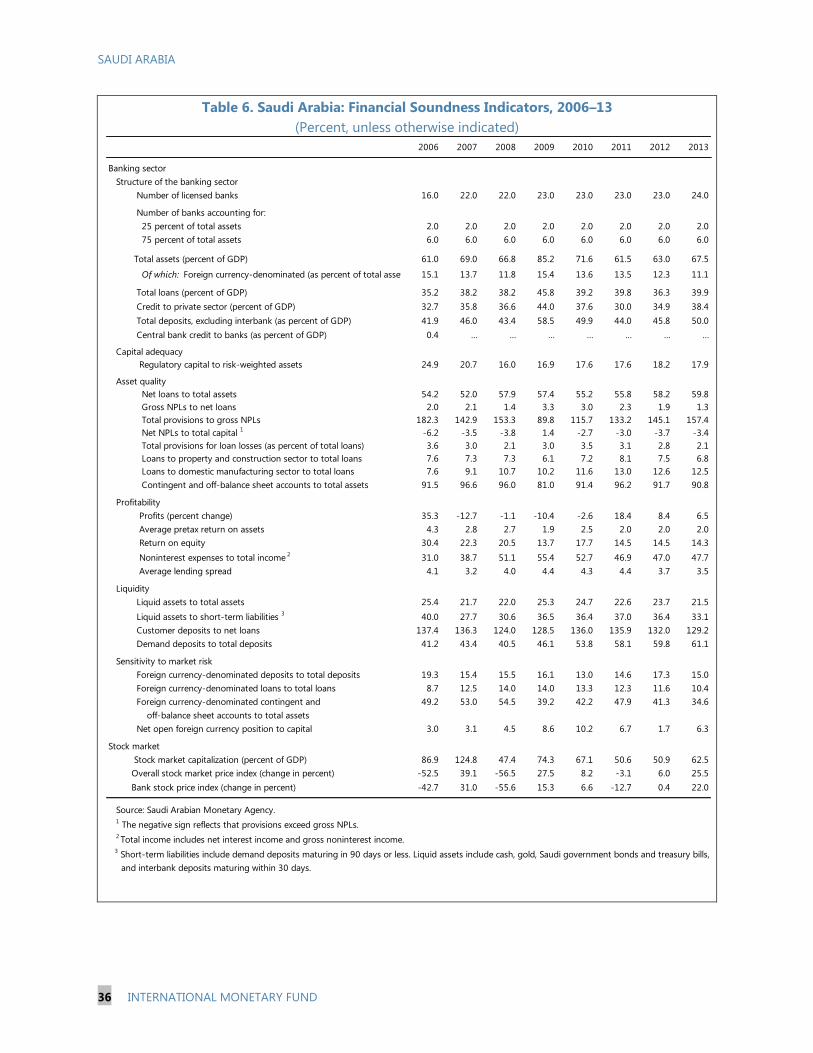
SAUDI ARABIA
36 INTERNATIONAL MONETARY FUND
Table 6. Saudi Arabia: Financial Soundness Indicators, 2006–13
(Percent, unless otherwise indicated)
2006 2007 2008 2009 2010 2011 2012 2013
Banking sector
Structure of the banking sector
Number of licensed banks 16.0 22.0 22.0 23.0 23.0 23.0 23.0 24.0
Number of banks accounting for:
25 percent of total assets 2.0 2.0 2.0 2.0 2.0 2.0 2.0 2.0
75 percent of total assets 6.0 6.0 6.0 6.0 6.0 6.0 6.0 6.0
Total assets (percent of GDP) 61.0 69.0 66.8 85.2 71.6 61.5 63.0 67.5
Of which: Foreign currency-denominated (as percent of total assets) 15.1 13.7 11.8 15.4 13.6 13.5 12.3 11.1
Total loans (percent of GDP) 35.2 38.2 38.2 45.8 39.2 39.8 36.3 39.9
Credit to private sector (percent of GDP) 32.7 35.8 36.6 44.0 37.6 30.0 34.9 38.4
Total deposits, excluding interbank (as percent of GDP) 41.9 46.0 43.4 58.5 49.9 44.0 45.8 50.0
Central bank credit to banks (as percent of GDP) 0.4 … … … … … … …
Capital adequacy
Regulatory capital to risk-weighted assets 24.9 20.7 16.0 16.9 17.6 17.6 18.2 17.9
Asset quality
Net loans to total assets 54.2 52.0 57.9 57.4 55.2 55.8 58.2 59.8
Gross NPLs to net loans 2.0 2.1 1.4 3.3 3.0 2.3 1.9 1.3
Total provisions to gross NPLs 182.3 142.9 153.3 89.8 115.7 133.2 145.1 157.4
Net NPLs to total capital 1
-6.2 -3.5 -3.8 1.4 -2.7 -3.0 -3.7 -3.4
Total provisions for loan losses (as percent of total loans) 3.6 3.0 2.1 3.0 3.5 3.1 2.8 2.1
Loans to property and construction sector to total loans 7.6 7.3 7.3 6.1 7.2 8.1 7.5 6.8
Loans to domestic manufacturing sector to total loans 7.6 9.1 10.7 10.2 11.6 13.0 12.6 12.5
Contingent and off-balance sheet accounts to total assets 91.5 96.6 96.0 81.0 91.4 96.2 91.7 90.8
Profitability
Profits (percent change) 35.3 -12.7 -1.1 -10.4 -2.6 18.4 8.4 6.5
Average pretax return on assets 4.3 2.8 2.7 1.9 2.5 2.0 2.0 2.0
Return on equity 30.4 22.3 20.5 13.7 17.7 14.5 14.5 14.3
Noninterest expenses to total income 2
31.0 38.7 51.1 55.4 52.7 46.9 47.0 47.7
Average lending spread 4.1 3.2 4.0 4.4 4.3 4.4 3.7 3.5
Liquidity
Liquid assets to total assets 25.4 21.7 22.0 25.3 24.7 22.6 23.7 21.5
Liquid assets to short-term liabilities 3
40.0 27.7 30.6 36.5 36.4 37.0 36.4 33.1
Customer deposits to net loans 137.4 136.3 124.0 128.5 136.0 135.9 132.0 129.2
Demand deposits to total deposits 41.2 43.4 40.5 46.1 53.8 58.1 59.8 61.1
Sensitivity to market risk
Foreign currency-denominated deposits to total deposits 19.3 15.4 15.5 16.1 13.0 14.6 17.3 15.0
Foreign currency-denominated loans to total loans 8.7 12.5 14.0 14.0 13.3 12.3 11.6 10.4
Foreign currency-denominated contingent and 49.2 53.0 54.5 39.2 42.2 47.9 41.3 34.6
off-balance sheet accounts to total assets
Net open foreign currency position to capital 3.0 3.1 4.5 8.6 10.2 6.7 1.7 6.3
Stock market
Stock market capitalization (percent of GDP) 86.9 124.8 47.4 74.3 67.1 50.6 50.9 62.5
Overall stock market price index (change in percent) -52.5 39.1 -56.5 27.5 8.2 -3.1 6.0 25.5
Bank stock price index (change in percent) -42.7 31.0 -55.6 15.3 6.6 -12.7 0.4 22.0
Source: Saudi Arabian Monetary Agency.
1 The negative sign reflects that provisions exceed gross NPLs.
2 Total income includes net interest income and gross noninterest income.
3 Short-term liabilities include demand deposits maturing in 90 days or less. Liquid assets include cash, gold, Saudi government bonds and treasury bills,
and interbank deposits maturing within 30 days.
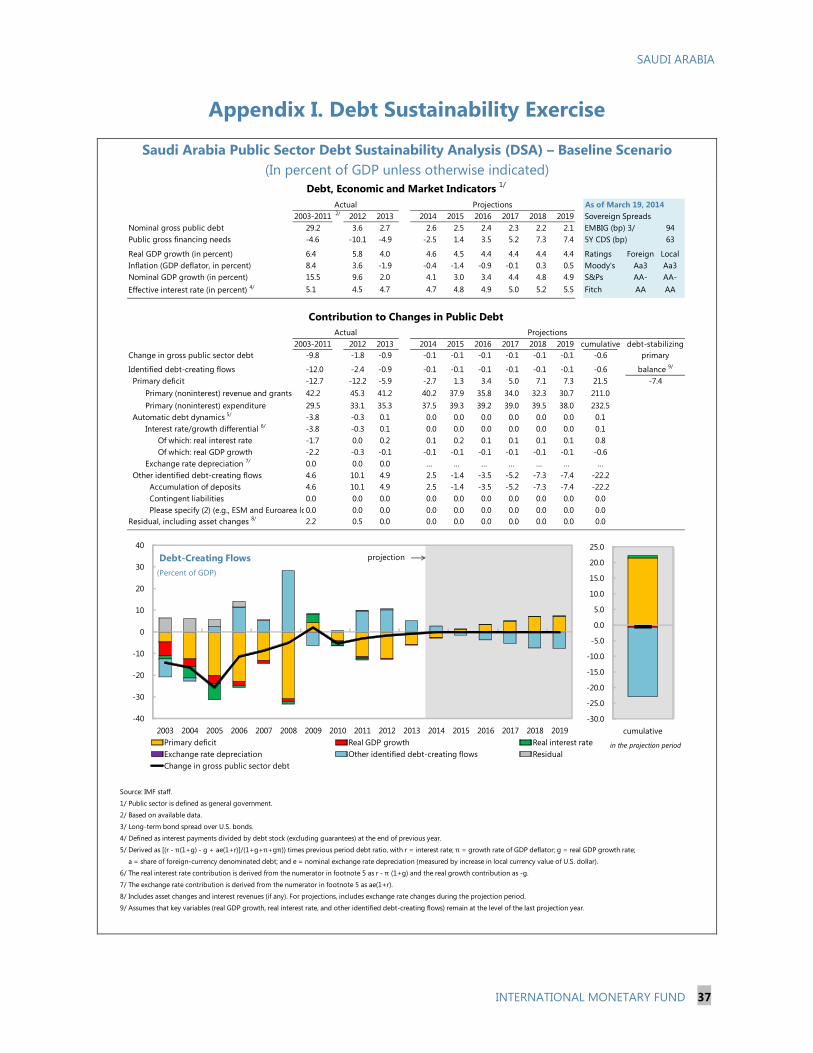
SAUDI ARABIA
INTERNATIONAL MONETARY FUND 37
Appendix I. Debt Sustainability Exercise
Saudi Arabia Public Sector Debt Sustainability Analysis (DSA) – Baseline Scenario
(In percent of GDP unless otherwise indicated)
As of March 19, 20142/
2012 2013 2014 2015 2016 2017 2018 2019 Sovereign Spreads
Nominal gross public debt 29.2 3.6 2.7 2.6 2.5 2.4 2.3 2.2 2.1 EMBIG (bp) 3/ 94
Public gross financing needs -4.6 -10.1 -4.9 -2.5 1.4 3.5 5.2 7.3 7.4 5Y CDS (bp) 63
Real GDP growth (in percent) 6.4 5.8 4.0 4.6 4.5 4.4 4.4 4.4 4.4 Ratings Foreign Local
Inflation (GDP deflator, in percent) 8.4 3.6 -1.9 -0.4 -1.4 -0.9 -0.1 0.3 0.5 Moody's Aa3 Aa3
Nominal GDP growth (in percent) 15.5 9.6 2.0 4.1 3.0 3.4 4.4 4.8 4.9 S&Ps AA- AA-
Effective interest rate (in percent) 4/ 5.1 4.5 4.7 4.7 4.8 4.9 5.0 5.2 5.5 Fitch AA AA
2012 2013 2014 2015 2016 2017 2018 2019 cumulative
Change in gross public sector debt -9.8 -1.8 -0.9 -0.1 -0.1 -0.1 -0.1 -0.1 -0.1 -0.6
Identified debt-creating flows -12.0 -2.4 -0.9 -0.1 -0.1 -0.1 -0.1 -0.1 -0.1 -0.6
Primary deficit -12.7 -12.2 -5.9 -2.7 1.3 3.4 5.0 7.1 7.3 21.5
Primary (noninterest) revenue and grants 42.2 45.3 41.2 40.2 37.9 35.8 34.0 32.3 30.7 211.0
Primary (noninterest) expenditure 29.5 33.1 35.3 37.5 39.3 39.2 39.0 39.5 38.0 232.5
Automatic debt dynamics 5/
-3.8 -0.3 0.1 0.0 0.0 0.0 0.0 0.0 0.0 0.1
Interest rate/growth differential 6/
-3.8 -0.3 0.1 0.0 0.0 0.0 0.0 0.0 0.0 0.1
Of which: real interest rate -1.7 0.0 0.2 0.1 0.2 0.1 0.1 0.1 0.1 0.8
Of which: real GDP growth -2.2 -0.3 -0.1 -0.1 -0.1 -0.1 -0.1 -0.1 -0.1 -0.6
Exchange rate depreciation 7/
0.0 0.0 0.0 … … … … … … …
Other identified debt-creating flows 4.6 10.1 4.9 2.5 -1.4 -3.5 -5.2 -7.3 -7.4 -22.2
Accumulation of deposits 4.6 10.1 4.9 2.5 -1.4 -3.5 -5.2 -7.3 -7.4 -22.2
Contingent liabilities 0.0 0.0 0.0 0.0 0.0 0.0 0.0 0.0 0.0 0.0
Please specify (2) (e.g., ESM and Euroarea loans)0.0 0.0 0.0 0.0 0.0 0.0 0.0 0.0 0.0 0.0
Residual, including asset changes 8/
2.2 0.5 0.0 0.0 0.0 0.0 0.0 0.0 0.0 0.0
in the projection period
Source: IMF staff.
1/ Public sector is defined as general government.
2/ Based on available data.
3/ Long-term bond spread over U.S. bonds.
4/ Defined as interest payments divided by debt stock (excluding guarantees) at the end of previous year.
5/ Derived as [(r - π(1+g) - g + ae(1+r)]/(1+g+π+gπ)) times previous period debt ratio, with r = interest rate; π = growth rate of GDP deflator; g = real GDP growth rate;
a = share of foreign-currency denominated debt; and e = nominal exchange rate depreciation (measured by increase in local currency value of U.S. dollar).
6/ The real interest rate contribution is derived from the numerator in footnote 5 as r - π (1+g) and the real growth contribution as -g.
7/ The exchange rate contribution is derived from the numerator in footnote 5 as ae(1+r).
8/ Includes asset changes and interest revenues (if any). For projections, includes exchange rate changes during the projection period.
9/ Assumes that key variables (real GDP growth, real interest rate, and other identified debt-creating flows) remain at the level of the last projection year.
-7.4
balance 9/
primary
Debt, Economic and Market Indicators 1/
2003-2011
Actual
Projections
Contribution to Changes in Public Debt
Projections
2003-2011
Actual
debt-stabilizing
-40
-30
-20
-10
0
10
20
30
40
2003 2004 2005 2006 2007 2008 2009 2010 2011 2012 2013 2014 2015 2016 2017 2018 2019
Debt-Creating Flows
Primary deficit Real GDP growth Real interest rate
Exchange rate depreciation Other identified debt-creating flows Residual
Change in gross public sector debt
projection
(Percent of GDP)
-30.0
-25.0
-20.0
-15.0
-10.0
-5.0
0.0
5.0
10.0
15.0
20.0
25.0
cumulative
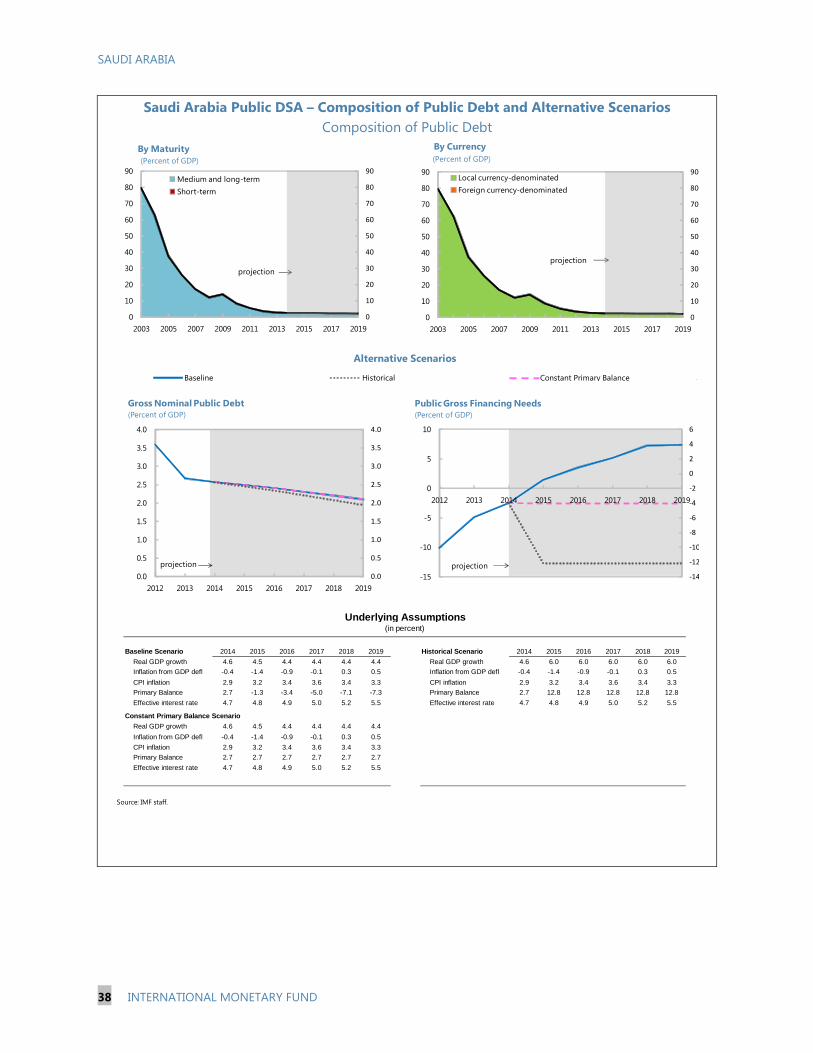
SAUDI ARABIA
38 INTERNATIONAL MONETARY FUND
Saudi Arabia Public DSA – Composition of Public Debt and Alternative Scenarios
Composition of Public Debt
0
Baseline Scenario 2014 2015 2016 2017 2018 2019 Historical Scenario 2014 2015 2016 2017 2018 2019
Real GDP growth 4.6 4.5 4.4 4.4 4.4 4.4 Real GDP growth 4.6 6.0 6.0 6.0 6.0 6.0
Inflation from GDP defl -0.4 -1.4 -0.9 -0.1 0.3 0.5 Inflation from GDP defl -0.4 -1.4 -0.9 -0.1 0.3 0.5
CPI inflation 2.9 3.2 3.4 3.6 3.4 3.3 CPI inflation 2.9 3.2 3.4 3.6 3.4 3.3
Primary Balance 2.7 -1.3 -3.4 -5.0 -7.1 -7.3 Primary Balance 2.7 12.8 12.8 12.8 12.8 12.8
Effective interest rate 4.7 4.8 4.9 5.0 5.2 5.5 Effective interest rate 4.7 4.8 4.9 5.0 5.2 5.5
Constant Primary Balance Scenario
Real GDP growth 4.6 4.5 4.4 4.4 4.4 4.4
Inflation from GDP defl -0.4 -1.4 -0.9 -0.1 0.3 0.5
CPI inflation 2.9 3.2 3.4 3.6 3.4 3.3
Primary Balance 2.7 2.7 2.7 2.7 2.7 2.7
Effective interest rate 4.7 4.8 4.9 5.0 5.2 5.5
Source: IMF staff.
Underlying Assumptions(in percent)
Alternative Scenarios
Baseline Historical Constant Primary Balance
0.0
0.5
1.0
1.5
2.0
2.5
3.0
3.5
4.0
0.0
0.5
1.0
1.5
2.0
2.5
3.0
3.5
4.0
2012 2013 2014 2015 2016 2017 2018 2019
Gross Nominal Public Debt
(Percent of GDP)
projection
-14
-12
-10
-8
-6
-4
-2
0
2
4
6
-15
-10
-5
0
5
10
2012 2013 2014 2015 2016 2017 2018 2019
Public Gross Financing Needs
(Percent of GDP)
projection
0
10
20
30
40
50
60
70
80
90
0
10
20
30
40
50
60
70
80
90
2003 2005 2007 2009 2011 2013 2015 2017 2019
By Maturity
Medium and long-term
Short-term
projection
(Percent of GDP)
0
10
20
30
40
50
60
70
80
90
0
10
20
30
40
50
60
70
80
90
2003 2005 2007 2009 2011 2013 2015 2017 2019
By Currency
Local currency-denominated
Foreign currency-denominated
projection
(Percent of GDP)
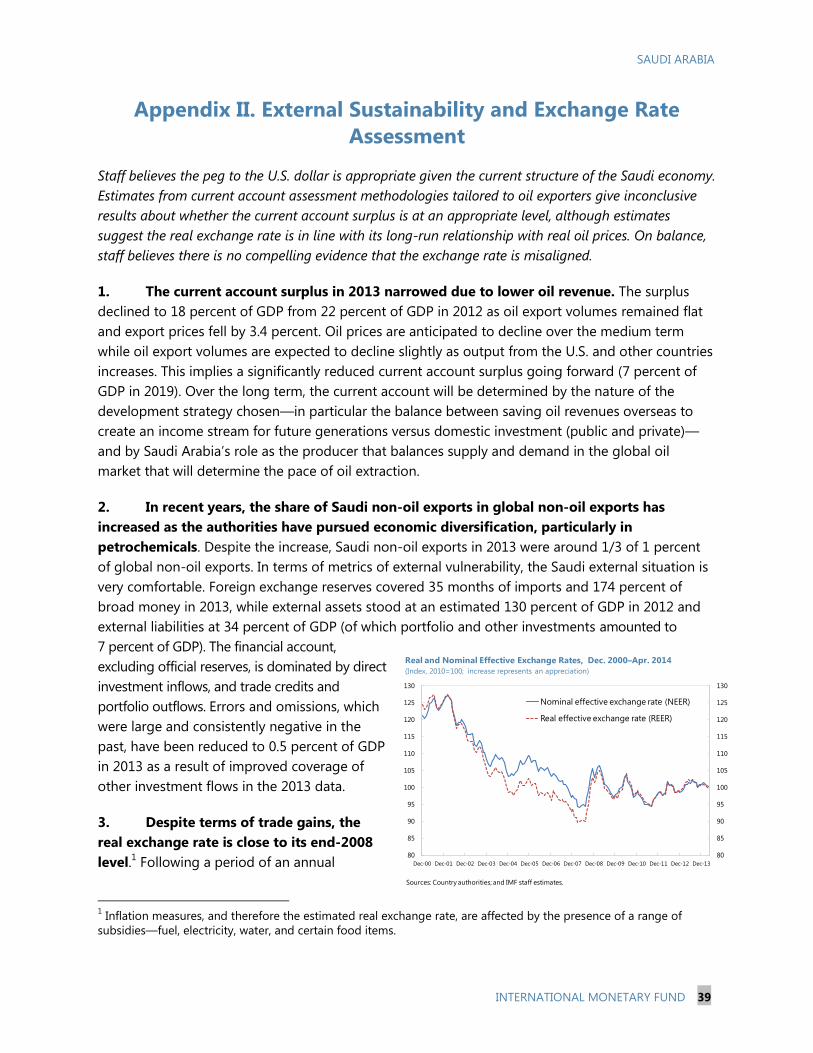
SAUDI ARABIA
INTERNATIONAL MONETARY FUND 39
Appendix II. External Sustainability and Exchange Rate
Assessment
Staff believes the peg to the U.S. dollar is appropriate given the current structure of the Saudi economy.
Estimates from current account assessment methodologies tailored to oil exporters give inconclusive
results about whether the current account surplus is at an appropriate level, although estimates
suggest the real exchange rate is in line with its long-run relationship with real oil prices. On balance,
staff believes there is no compelling evidence that the exchange rate is misaligned.
1. The current account surplus in 2013 narrowed due to lower oil revenue. The surplus
declined to 18 percent of GDP from 22 percent of GDP in 2012 as oil export volumes remained flat
and export prices fell by 3.4 percent. Oil prices are anticipated to decline over the medium term
while oil export volumes are expected to decline slightly as output from the U.S. and other countries
increases. This implies a significantly reduced current account surplus going forward (7 percent of
GDP in 2019). Over the long term, the current account will be determined by the nature of the
development strategy chosen—in particular the balance between saving oil revenues overseas to
create an income stream for future generations versus domestic investment (public and private)—
and by Saudi Arabia’s role as the producer that balances supply and demand in the global oil
market that will determine the pace of oil extraction.
2. In recent years, the share of Saudi non-oil exports in global non-oil exports has
increased as the authorities have pursued economic diversification, particularly in
petrochemicals. Despite the increase, Saudi non-oil exports in 2013 were around 1/3 of 1 percent
of global non-oil exports. In terms of metrics of external vulnerability, the Saudi external situation is
very comfortable. Foreign exchange reserves covered 35 months of imports and 174 percent of
broad money in 2013, while external assets stood at an estimated 130 percent of GDP in 2012 and
external liabilities at 34 percent of GDP (of which portfolio and other investments amounted to
7 percent of GDP). The financial account,
excluding official reserves, is dominated by direct
investment inflows, and trade credits and
portfolio outflows. Errors and omissions, which
were large and consistently negative in the
past, have been reduced to 0.5 percent of GDP
in 2013 as a result of improved coverage of
other investment flows in the 2013 data.
3. Despite terms of trade gains, the
real exchange rate is close to its end-2008
level.1 Following a period of an annual
1 Inflation measures, and therefore the estimated real exchange rate, are affected by the presence of a range of
subsidies—fuel, electricity, water, and certain food items.
80
85
90
95
100
105
110
115
120
125
130
80
85
90
95
100
105
110
115
120
125
130
Dec-00 Dec-01 Dec-02 Dec-03 Dec-04 Dec-05 Dec-06 Dec-07 Dec-08 Dec-09 Dec-10 Dec-11 Dec-12 Dec-13
Nominal effective exchange rate (NEER)
Real effective exchange rate (REER)
Real and Nominal Effective Exchange Rates, Dec. 2000–Apr. 2014
(Index, 2010=100; increase represents an appreciation)
Sources: Country authorities; and IMF staff estimates.

SAUDI ARABIA
40 INTERNATIONAL MONETARY FUND
average depreciation of 5 percent between 2002 and 2007, the trade-weighted real effective
exchange rate (REER) index appreciated by 8 percent in 2008, but has remained broadly unchanged
since. The nominal effective exchange rate closely followed the REER trend.
4. The macroeconomic balance approach suggests the current account is within the
range of medium term norms estimated from several different specifications. The
macroeconomic balance approach estimates four main specifications of the equilibrium current
account (norm) from a set of fundamentals (non-oil and gas fiscal balance, oil and gas reserves, old-
age dependency ratio, population growth rate, initial net foreign assets (NFA) net of external debt,
oil trade balance, growth rate of real per capita GDP, relative income, and lagged dependent current
account) employing a generalized method of moments (GMM) technique (see Beidas-Strom and
Cashin, 2011). As shown (in the table below), the estimation yields a range of current account norms
for Saudi Arabia from a surplus of about 3 to 13 percent of GDP in 2019, with specification II,
yielding a norm of 6.4 percent, being the preferred one given the absence of a lagged dependent
variable and the inclusion of NFA data. The projected current account position in 2019 is a surplus of
7 percent of GDP, which lies within the estimated range of current account norms, but above that
derived from specification II.
GMM
Coefficients
Contribution
to CA Norm1
GMM
Coefficients
Contribution
to CA norm1
GMM
Coefficients
Contribution
to CA Norm1
GMM
Coefficients
Contribution
to CA Norm1
Core CGER regressors
Constant 0.039 3.9% 0..35 3.5% 0.043 4.3% 0.044 4.4%
Lagged dependent 0.330 6.3% 0.383 7.3%
Fiscal balance/Non-oil fiscal balance GDP 0.851 -6.3% 0.385 -12.6% 0.363 -11.9% 0.391 -12.8%
Oil trade balance/GDP 0.454 13.3% 0.469 13.7% 0.459 13.4%
Old age dependency -0.053 -0.2% -0.059 -0.3% -0.034 -0.2% -0.034 -0.2%
Population growth -0.693 -1.4% -0.930 -1.9% -0.632 -1.3% -0.589 -1.2%
NFA/GDP 0.023 1.6% 0.022 1.6%
Relative income -0.017 -1.0% 0.044 2.6% 0.071 4.3% 0.073 4.4%
Economic growth -0.053 -0.2% -0.069 -0.3% -0.064 -0.3% -0.056 -0.2%
Net oil-exporter specific regressors 0.0% 0.000 0.0% 0.0% 0.0%
Oil wealth 0.000 0.5% 0.001 1.5% 0.000 -1.0%
Degree of maturity in oil production 0.160 2.8% -0.170 -3.0%
Additional regressors 0.0% 0.0%
REER 0.073 0.8%
Terms of trade 4.269 -0.7%
Estimated current account norm (2019) 2.8% 6.4% 13.0% 11.1%
Underlying current account
Hansen's J test of over identifying restrictions 0.46 0.61 0.64 0.62
Arellano-Bond test for AR(1) 0.07 0.09 0.07 0.08
Arellano-Bond test for AR(2) 0.67 0.71 0.7 0.69
Number of instruments 6 5 5 6
Number of countries 24 24 24 24
Observations 82 82 82 82
Source: Beidas-Strom and Cashin, "Are Middle Eastern Current Account Imbalances Excessive?," IMF Working Paper 11/195, 2011.
1Contribution to CA norm=coefficient*medium-term projection/steady state value (in percent).
Current Account-GMM Estimation and Implied Norm for Net-Oil Exporters: Saudi Arabia
(Dependent variable: current account balance, as a share of GDP)
Specification I Specification II Specification III Specification IV
7.0%
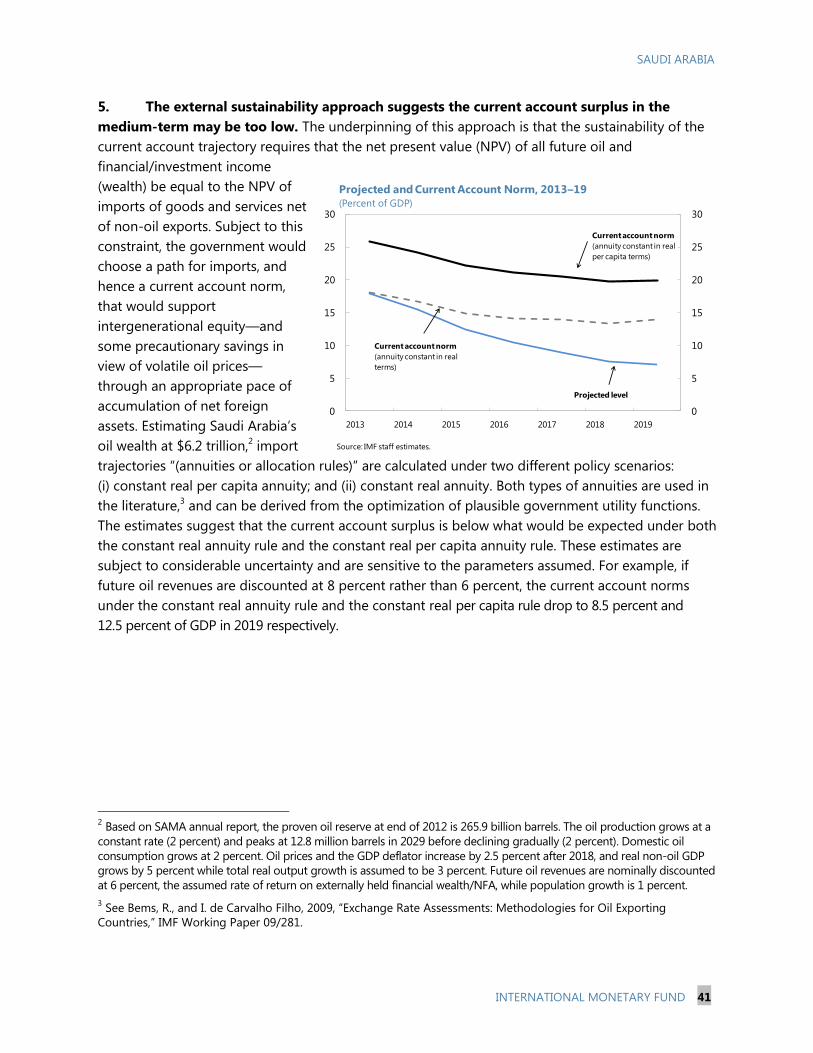
SAUDI ARABIA
INTERNATIONAL MONETARY FUND 41
5. The external sustainability approach suggests the current account surplus in the
medium-term may be too low. The underpinning of this approach is that the sustainability of the
current account trajectory requires that the net present value (NPV) of all future oil and
financial/investment income
(wealth) be equal to the NPV of
imports of goods and services net
of non-oil exports. Subject to this
constraint, the government would
choose a path for imports, and
hence a current account norm,
that would support
intergenerational equity—and
some precautionary savings in
view of volatile oil prices—
through an appropriate pace of
accumulation of net foreign
assets. Estimating Saudi Arabia’s
oil wealth at $6.2 trillion,2 import
trajectories “(annuities or allocation rules)” are calculated under two different policy scenarios:
(i) constant real per capita annuity; and (ii) constant real annuity. Both types of annuities are used in
the literature,3 and can be derived from the optimization of plausible government utility functions.
The estimates suggest that the current account surplus is below what would be expected under both
the constant real annuity rule and the constant real per capita annuity rule. These estimates are
subject to considerable uncertainty and are sensitive to the parameters assumed. For example, if
future oil revenues are discounted at 8 percent rather than 6 percent, the current account norms
under the constant real annuity rule and the constant real per capita rule drop to 8.5 percent and
12.5 percent of GDP in 2019 respectively.
2 Based on SAMA annual report, the proven oil reserve at end of 2012 is 265.9 billion barrels. The oil production grows at a
constant rate (2 percent) and peaks at 12.8 million barrels in 2029 before declining gradually (2 percent). Domestic oil
consumption grows at 2 percent. Oil prices and the GDP deflator increase by 2.5 percent after 2018, and real non-oil GDP
grows by 5 percent while total real output growth is assumed to be 3 percent. Future oil revenues are nominally discounted
at 6 percent, the assumed rate of return on externally held financial wealth/NFA, while population growth is 1 percent.
3 See Bems, R., and I. de Carvalho Filho, 2009, “Exchange Rate Assessments: Methodologies for Oil Exporting
Countries,” IMF Working Paper 09/281.
0
5
10
15
20
25
30
0
5
10
15
20
25
30
2013 2014 2015 2016 2017 2018 2019
Projected and Current Account Norm, 2013–19
(Percent of GDP)
Source: IMF staff estimates.
Current account norm
(annuity constant in real
terms)
Current account norm
(annuity constant in real
per capita terms)
Projected level
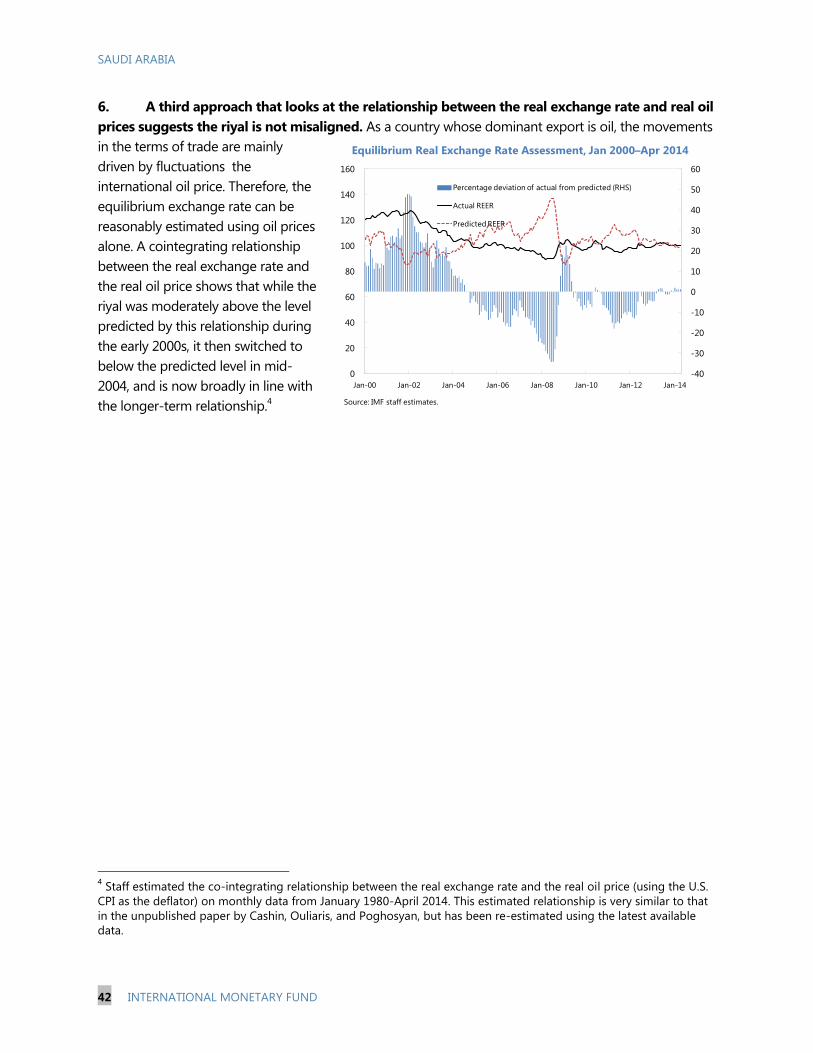
SAUDI ARABIA
42 INTERNATIONAL MONETARY FUND
6. A third approach that looks at the relationship between the real exchange rate and real oil
prices suggests the riyal is not misaligned. As a country whose dominant export is oil, the movements
in the terms of trade are mainly
driven by fluctuations the
international oil price. Therefore, the
equilibrium exchange rate can be
reasonably estimated using oil prices
alone. A cointegrating relationship
between the real exchange rate and
the real oil price shows that while the
riyal was moderately above the level
predicted by this relationship during
the early 2000s, it then switched to
below the predicted level in mid-
2004, and is now broadly in line with
the longer-term relationship.4
4 Staff estimated the co-integrating relationship between the real exchange rate and the real oil price (using the U.S.
CPI as the deflator) on monthly data from January 1980-April 2014. This estimated relationship is very similar to that
in the unpublished paper by Cashin, Ouliaris, and Poghosyan, but has been re-estimated using the latest available
data.
-40
-30
-20
-10
0
10
20
30
40
50
60
0
20
40
60
80
100
120
140
160
Jan-00 Jan-02 Jan-04 Jan-06 Jan-08 Jan-10 Jan-12 Jan-14
Percentage deviation of actual from predicted (RHS)
Actual REER
Predicted REER
Equilibrium Real Exchange Rate Assessment, Jan 2000–Apr 2014
Source: IMF staff estimates.

SAUDI ARABIA
INTERNATIONAL MONETARY FUND 43
Appendix III. Key Recommendations of 2011 FSAP Update
Recommendation Progress
Update the BCL and remove need for ministerial approval of
certain SAMA decisions.
SAMA’s assessment is that the existing BCL has provided a strong
basis for effective supervision. Ministerial approval is only
required in times of extreme stress and is viewed by SAMA as a
means of ensuring communication with Cabinet.
No longer allow large exposure up to 50 percent of bank’s
own capital.
There have been no changes in the legislation. However, SAMA
expects banks to ensure that their single exposure limit should
not exceed 15 percent of capital and reserves. Furthermore,
SAMA has prepared revised rules on large exposures base on
BCBS new large exposures framework, which are under
discussion and will be finalized shortly.
Strengthen the CMA’s regulatory transparency by fully
disclosing all enforcement actions, interpretation, and funding
rules.
The CMA has established an internal committee to discuss
relevant FSAP recommendations, including disclosure policies.
Introduce a formal liquidity forecasting framework. SAMA is currently working on a formal liquidity forecasting model.
Enhance data on cross-border financial activities of banks
and corporate.
SAMA published the International Investment position in 2012
(annual basis), and submitted ten core FSI indicators to the IMF
beginning in March 2013. It is planning to submit locational and
consolidated bank data to the BIS.
Maintain a stable stock of government securities and
regular issues to help anchor a robust yield curve
There are no plans to increase and maintain a stable stock of
government securities. However, public sector entities have
recently increased sukuk issuance, and eventually this could help
in establishing a proxy government benchmark.
Introduce a payment system law. The authorities believe that the current legal framework is
adequate and serving the purpose well.
Conduct stress tests with a wider range of shocks,
including liquidity shocks, on regular basis and incorporate
lessons into supervision.
Detailed rules on stress testing were issued in November 2011,
making stress testing mandatory. SAMA has also developed a
system-wide stress test, covering credit, market, operational and
liquidity risks.
Establish a formal early warning system (EWS) for the
banking sector.
SAMA considers that its current off-site surveillance system is
adequate as a EWS. SAMA established a dedicated Financial
Stability Division in 2013 which is developing an internal
macroprudential dashboard.
Develop a more formal and transparent macroprudential
policy framework, drawing on work in international fora.
SAMA is actively participating in the international fora on macro-
prudential frameworks and has carried out a detailed study,
identifying key requirements and international developments in
peer and other countries. The overall framework is yet to be
decided, but will involve cooperation and coordination between
SAMA, the Capital Markets Authority (CMA) and MoF.
Strengthen the legal framework for bank resolution The authorities will assess the need for any further steps required
to strengthen the existing bank resolution framework.
Bank and Securities Regulation
Systemic Stability

SAUDI ARABIA
44 INTERNATIONAL MONETARY FUND
Key Recommendations of 2011 FSAP Update (concluded)
As housing finance expands in the future, ensure loan
soundness through strong prudential measures, notably
lowering permissible loan-to-value and debt service ratios.
Although housing loans continue to grow, SAMA believes that
the current prudential measures that are in place will ensure that
banks are managing the associated risks prudently. LTV ratios
have been capped at 70 percent under the new mortgage law
that will come into force in November 2014. Housing finance
companies that may enter the market will be licensed and
supervised by SAMA.
Contract banks to manage both the existing and new Real
Estate Development Fund (REDF) portfolio.
As of now there are no plans to allow banks to manage the
portfolio of REDF.
Complement mortgage reform by establishing a housing
market observatory, developing consumer guidance options,
and strengthening the developer industry.
A separate Ministry of Housing has been established, which will
look into these and any other related issues.
Prepare long-term funding solution for mortgage finance,
starting with a refinance facility.
REDF is no longer accepting fresh applications, which are being
handled by the Ministry of Housing. For existing approved loans,
REDF is considering several options to enhance its integration
with the banking sector, including long-term funding facility. The
Ministry of Housing is developing detailed plans to utilize the
SAR 250bn fund for housing sector development. A mortgage
refinancing company will be established under the Public
Investment Fund (PIF).
Create a modern, electronic and unified registry for
movable collateral.
The authorities will assess the need to further study the proposal.
Enact and implement the draft Enforcement law that
introduces specialized enforcement courts operating with
strict time-bound procedures.
The Mortgage Law, which includes the Enforcement Law, has
already been enacted.
Closely supervise the quality of SME units in the banks,
including the robustness or their internal rating systems and
automated procedures.
All banks have been required to set up their own separate SME
units in order to more effectively deal with SME financing.
Finalize and issue the outstanding functional regulations
for insurance
SAMA has expedited all outstanding regulations, except
corporate governance regulations which are in draft phase. Two
regulations; actuarial and audit committee are in the final stage
for publication.
Improve enforcement of mandatory motor third party
liability insurance
SAMA and the joint working group are meeting regularly and are
in the final stage of improving the implementation of motor TPL
enforcement. Legislation requiring full insurance of government
(non-military) vehicles would be enacted soon.
Disclose the investment policies, portfolio, and portfolio
performance of the Public Pension Agency (PPA) and General
Organization for Social Insurance (GOSI).
There have been no changes in the disclosure policies of PPA
and GOSI. GOSI have established a committee to discuss
disclosure issues.
Further outsource the management of portfolio of the
PPA and GOSI.
PPA and GOSI have no plans to outsource part of their domestic
portfolio. The foreign portfolios are outsourced to a large degree.
Permit foreign international investors to invest directly in
Tadawul.
CMA and the Supreme Economic Council are considering
allowing foreign institutional investors to invest directly.
Expanding Access to Finance and Preserving Financial Stability
Insurance, Institutional Investors, and Capital Markets
INTERNATIONAL MONETARY FUND
SAUDI ARABIA
STAFF REPORT FOR THE 2014 ARTICLE IV
CONSULTATION—INFORMATIONAL ANNEX
Prepared By
Middle East and Central Asia Department
(In consultation with other departments)
FUND RELATIONS _______________________________________________________________________ 2
RELATIONS WITH THE WORLD BANK GROUP _________________________________________ 4
STATISTICAL ISSUES ____________________________________________________________________ 5
CONTENTS
June 25, 2014
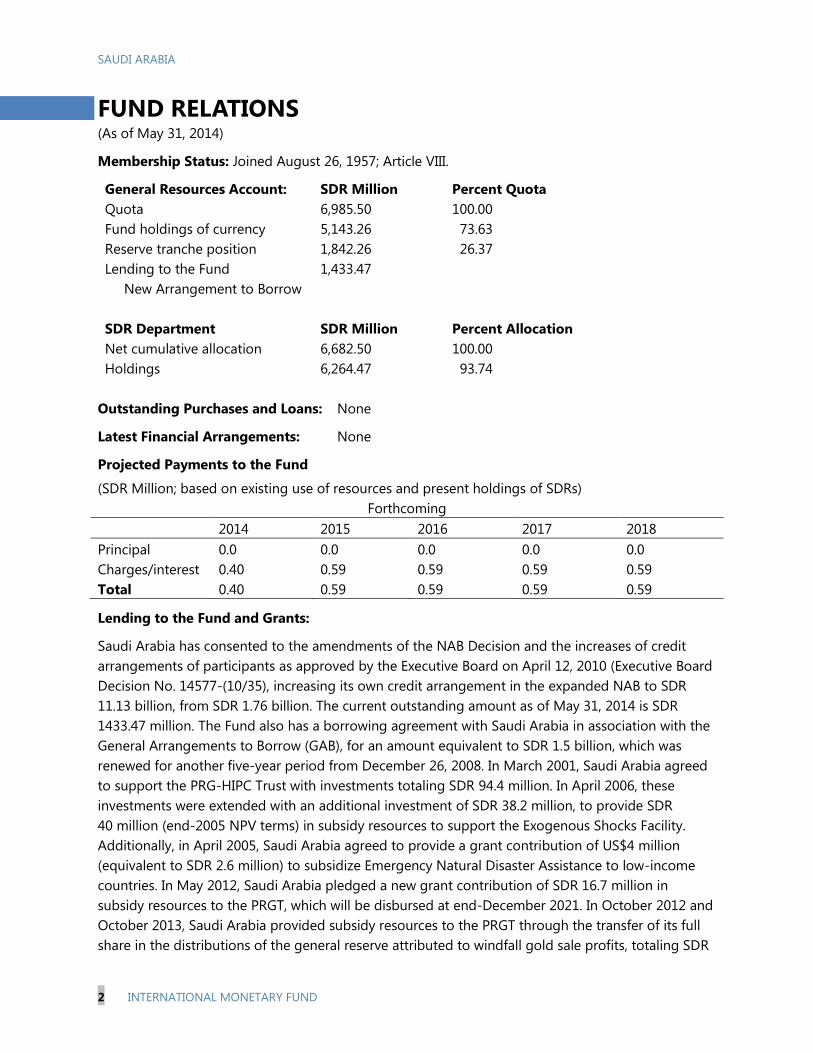
SAUDI ARABIA
2 INTERNATIONAL MONETARY FUND
FUND RELATIONS (As of May 31, 2014)
Membership Status: Joined August 26, 1957; Article VIII.
General Resources Account: SDR Million Percent Quota
Quota 6,985.50 100.00
Fund holdings of currency 5,143.26 73.63
Reserve tranche position
Lending to the Fund
New Arrangement to Borrow
1,842.26
1,433.47
26.37
SDR Department SDR Million Percent Allocation
Net cumulative allocation 6,682.50 100.00
Holdings 6,264.47 93.74
Outstanding Purchases and Loans: None
Latest Financial Arrangements: None
Projected Payments to the Fund
(SDR Million; based on existing use of resources and present holdings of SDRs)
Forthcoming
2014 2015 2016 2017 2018
Principal 0.0 0.0 0.0 0.0 0.0
Charges/interest 0.40 0.59 0.59 0.59 0.59
Total 0.40 0.59 0.59 0.59 0.59
Lending to the Fund and Grants:
Saudi Arabia has consented to the amendments of the NAB Decision and the increases of credit
arrangements of participants as approved by the Executive Board on April 12, 2010 (Executive Board
Decision No. 14577-(10/35), increasing its own credit arrangement in the expanded NAB to SDR
11.13 billion, from SDR 1.76 billion. The current outstanding amount as of May 31, 2014 is SDR
1433.47 million. The Fund also has a borrowing agreement with Saudi Arabia in association with the
General Arrangements to Borrow (GAB), for an amount equivalent to SDR 1.5 billion, which was
renewed for another five-year period from December 26, 2008. In March 2001, Saudi Arabia agreed
to support the PRG-HIPC Trust with investments totaling SDR 94.4 million. In April 2006, these
investments were extended with an additional investment of SDR 38.2 million, to provide SDR
40 million (end-2005 NPV terms) in subsidy resources to support the Exogenous Shocks Facility.
Additionally, in April 2005, Saudi Arabia agreed to provide a grant contribution of US$4 million
(equivalent to SDR 2.6 million) to subsidize Emergency Natural Disaster Assistance to low-income
countries. In May 2012, Saudi Arabia pledged a new grant contribution of SDR 16.7 million in
subsidy resources to the PRGT, which will be disbursed at end-December 2021. In October 2012 and
October 2013, Saudi Arabia provided subsidy resources to the PRGT through the transfer of its full
share in the distributions of the general reserve attributed to windfall gold sale profits, totaling SDR

SAUDI ARABIA
INTERNATIONAL MONETARY FUND 3
71.88 million. As regards loan resources, the Fund as Trustee of the Poverty Reduction and Growth
Trust (PRGT) entered into a borrowing agreement with the Saudi Arabian Monetary Agency in May
2011, by which Saudi Arabia would provide new loan resources of up to SDR 500 million.
Exchange Rate Arrangement
Saudi Arabia maintains an exchange rate system free of restrictions on the making of payments and
transfers for current international transactions. The Saudi Arabian riyal was formally pegged to the
U.S. dollar, effective January 2003 and the exchange arrangement is classified as a conventional peg.
Prior to that, it was officially pegged to the SDR at the rate of SAR 4.28255=SDR 1, with margins of
7.25 percent even though in practice it has been pegged to the U.S. dollar since 1986, with a middle
rate of SAR 3.7450=$1. Saudi Arabia maintains security-related exchange restrictions pursuant to UN
Security Council resolutions 1267 and 1373.
Last Article IV Consultation
Saudi Arabia is on the standard 12-month consultation cycle. The last Article IV consultation was
held during May 5–18, 2013 in Riyadh. The staff report was considered by the Executive Board on
July 8, 2013 and published on July 24, 2013
(http://www.imf.org/external/pubs/cat/longres.aspx?sk=40817.0)
Technical Assistance:
STA GDDS Meta Data Development January 26–February 6, 2008.
G20 Data Gap Initiative, January 22–23, 2011.
Balance of Payment Statistics, March 12–23, 2011.
National Accounts Statistics, April 8–18, 2012.
Balance of Payment Statistics, November 11–22, 2012.
SDDS Assessment, March 9–19, 2013.
G20 Data Gap Initiative, May 27–28, 2014.
MCM Stress testing, January 9–21, 2010.
FAD Options for Indirect Taxation, February 25–March 11, 2006.
Public Financial Management and Statistics, jointly with STA, September 16–30, 2006.
Tax Administration, November 6–19, 2006.
Enhancing Budget Process Reforms January 22–February 2, 2008.
Budget Institutions and GFSM2001 (with participation of STA), June 2–5, 2012.
GFSM2001 Training Course, April 2013.
Training workshop on structural fiscal balance rules as a guide for policy, February 2014.
FSAP The main FSAP mission took place in January 2004.
The FSSA was published on June 5, 2006. The FSSA-update was published on April 18,
2012. (http://www.imf.org/external/pubs/ft/scr/2006/cr06199.pdf)
FSAP-update, April 16–30, 2011. Detailed Assessment of Observance was published on
July 19, 2013. (http://www.imf.org/external/pubs/cat/longres.aspx?sk=40793.0)
(http://www.imf.org/external/pubs/cat/longres.aspx?sk=40794.0)
Resident Representative
No resident representative is stationed in Saudi Arabia.
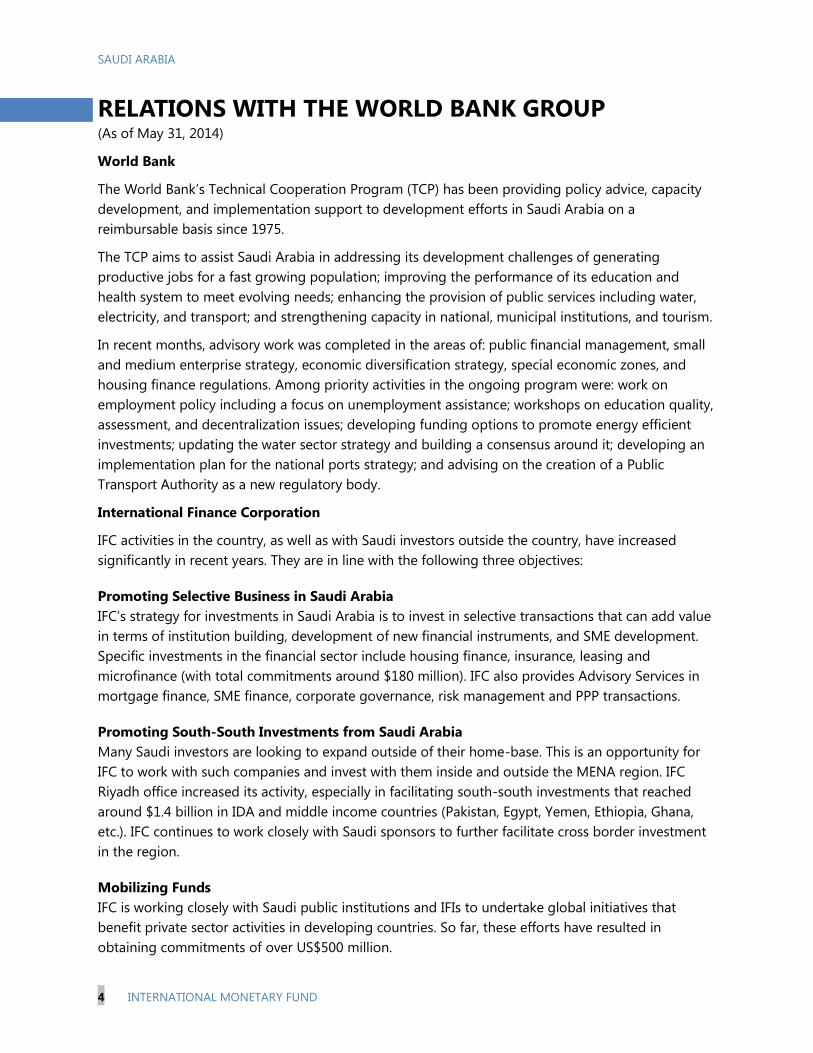
SAUDI ARABIA
4 INTERNATIONAL MONETARY FUND
RELATIONS WITH THE WORLD BANK GROUP (As of May 31, 2014)
World Bank
The World Bank’s Technical Cooperation Program (TCP) has been providing policy advice, capacity
development, and implementation support to development efforts in Saudi Arabia on a
reimbursable basis since 1975.
The TCP aims to assist Saudi Arabia in addressing its development challenges of generating
productive jobs for a fast growing population; improving the performance of its education and
health system to meet evolving needs; enhancing the provision of public services including water,
electricity, and transport; and strengthening capacity in national, municipal institutions, and tourism.
In recent months, advisory work was completed in the areas of: public financial management, small
and medium enterprise strategy, economic diversification strategy, special economic zones, and
housing finance regulations. Among priority activities in the ongoing program were: work on
employment policy including a focus on unemployment assistance; workshops on education quality,
assessment, and decentralization issues; developing funding options to promote energy efficient
investments; updating the water sector strategy and building a consensus around it; developing an
implementation plan for the national ports strategy; and advising on the creation of a Public
Transport Authority as a new regulatory body.
International Finance Corporation
IFC activities in the country, as well as with Saudi investors outside the country, have increased
significantly in recent years. They are in line with the following three objectives:
Promoting Selective Business in Saudi Arabia
IFC’s strategy for investments in Saudi Arabia is to invest in selective transactions that can add value
in terms of institution building, development of new financial instruments, and SME development.
Specific investments in the financial sector include housing finance, insurance, leasing and
microfinance (with total commitments around $180 million). IFC also provides Advisory Services in
mortgage finance, SME finance, corporate governance, risk management and PPP transactions.
Promoting South-South Investments from Saudi Arabia
Many Saudi investors are looking to expand outside of their home-base. This is an opportunity for
IFC to work with such companies and invest with them inside and outside the MENA region. IFC
Riyadh office increased its activity, especially in facilitating south-south investments that reached
around $1.4 billion in IDA and middle income countries (Pakistan, Egypt, Yemen, Ethiopia, Ghana,
etc.). IFC continues to work closely with Saudi sponsors to further facilitate cross border investment
in the region.
Mobilizing Funds
IFC is working closely with Saudi public institutions and IFIs to undertake global initiatives that
benefit private sector activities in developing countries. So far, these efforts have resulted in
obtaining commitments of over US$500 million.

SAUDI ARABIA
INTERNATIONAL MONETARY FUND 5
STATISTICAL ISSUES (As of May 31, 2014)
Assessment of Data Adequacy for Surveillance
General: Data provision has some shortcomings, but is broadly adequate for surveillance. Most
affected areas are: national accounts, labor markets, government finance statistics, and external
sector statistics.
National accounts: Annual estimates of GDP have been revised for the period since 2004. CDSI
is currently in the process of rebasing the GDP volume estimates (GDP at constant prices) to
2012. The base year is currently 1999 and the structure of the economy, and hence the structure
of relative prices, could have changed significantly since 1999, which can result in inaccurate
measures of volume changes.
Government finance statistics: The authorities are in the process of reclassifying the budget in
line with GFSM 2001. Most chapters have been completed and the Ministry of Finance is planning
on using the GFSM 2001 framework to report fiscal data and publish it by early 2015.
Monetary and financial statistics: The quality of monetary data has improved during the last
year and additional information is made available in the Central Bank Monthly Bulletin. However,
the authorities report monetary data using the old report forms and not the Standardized Report
Forms (SRFs) based on the current international methodology as reflected in the Monetary and
Financial Statistics (MFS) Manual and the accompanying MFS Compilation Guide.
Financial sector surveillance: The authorities report 10 out of 12 core financial soundness
indicators (FSIs) to the IMF.
External sector statistics: The authorities are now publishing an annual IIP. However, the
coverage in the capital and financial accounts, particularly for the private sector, needs to be
improved. The errors and omissions in 2013 BOP data have been reduced substantially due to an
improved coverage of trade credits. The authorities are working on strengthening financial
account statistics.
Data Standards and Quality
Participant in the General Data Dissemination
System (GDDS) since 2008.
No data ROSC is available.
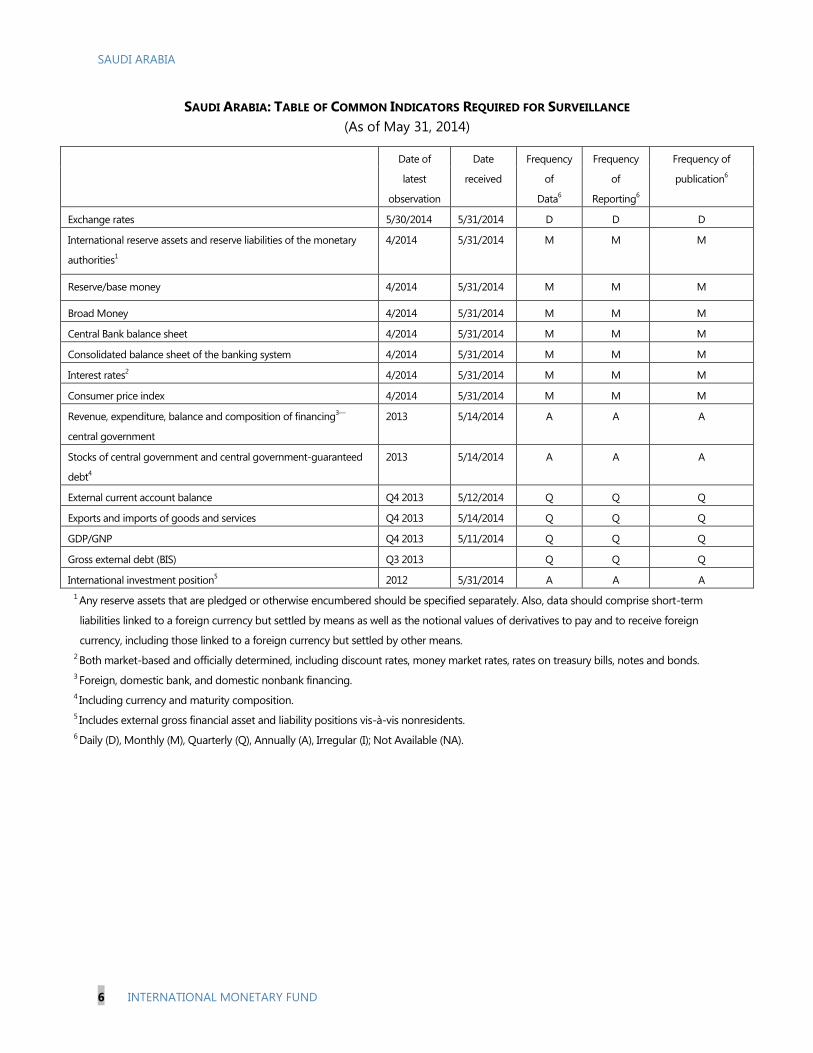
SAUDI ARABIA
6 INTERNATIONAL MONETARY FUND
SAUDI ARABIA: TABLE OF COMMON INDICATORS REQUIRED FOR SURVEILLANCE
(As of May 31, 2014)
Date of
latest
observation
Date
received
Frequency
of
Data6
Frequency
of
Reporting6
Frequency of
publication6
Exchange rates 5/30/2014 5/31/2014 D D D
International reserve assets and reserve liabilities of the monetary
authorities1
4/2014 5/31/2014 M M M
Reserve/base money 4/2014 5/31/2014 M M M
Broad Money 4/2014 5/31/2014 M M M
Central Bank balance sheet 4/2014 5/31/2014 M M M
Consolidated balance sheet of the banking system 4/2014 5/31/2014 M M M
Interest rates2
4/2014 5/31/2014 M M M
Consumer price index 4/2014 5/31/2014 M M M
Revenue, expenditure, balance and composition of financing3—
central government
2013 5/14/2014 A A A
Stocks of central government and central government-guaranteed
debt4
2013 5/14/2014 A A A
External current account balance Q4 2013 5/12/2014 Q Q Q
Exports and imports of goods and services Q4 2013 5/14/2014 Q Q Q
GDP/GNP Q4 2013 5/11/2014 Q Q Q
Gross external debt (BIS)
Q3 2013 Q Q Q
International investment position5 2012 5/31/2014 A A A
1 Any reserve assets that are pledged or otherwise encumbered should be specified separately. Also, data should comprise short-term
liabilities linked to a foreign currency but settled by means as well as the notional values of derivatives to pay and to receive foreign
currency, including those linked to a foreign currency but settled by other means.
2 Both market-based and officially determined, including discount rates, money market rates, rates on treasury bills, notes and bonds.
3 Foreign, domestic bank, and domestic nonbank financing.
4 Including currency and maturity composition.
5 Includes external gross financial asset and liability positions vis-à-vis nonresidents.
6 Daily (D), Monthly (M), Quarterly (Q), Annually (A), Irregular (I); Not Available (NA).
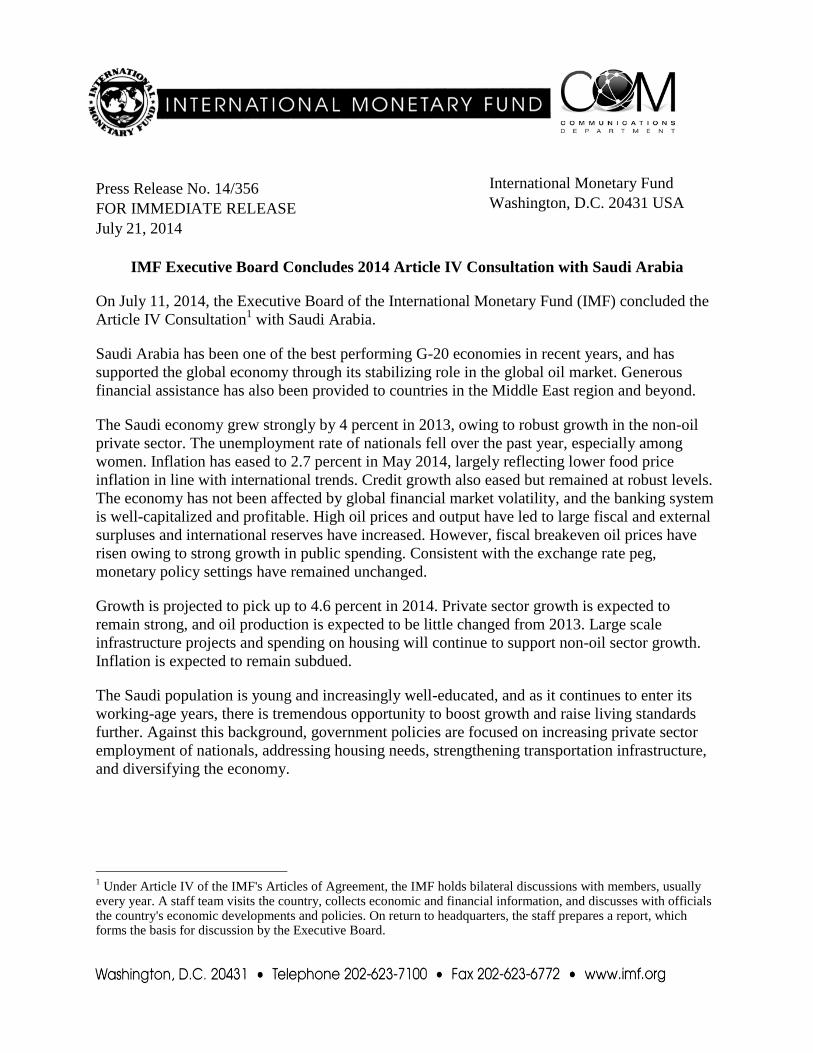
Press Release No. 14/356
FOR IMMEDIATE RELEASE
July 21, 2014
IMF Executive Board Concludes 2014 Article IV Consultation with Saudi Arabia
On July 11, 2014, the Executive Board of the International Monetary Fund (IMF) concluded the
Article IV Consultation1 with Saudi Arabia.
Saudi Arabia has been one of the best performing G-20 economies in recent years, and has
supported the global economy through its stabilizing role in the global oil market. Generous
financial assistance has also been provided to countries in the Middle East region and beyond.
The Saudi economy grew strongly by 4 percent in 2013, owing to robust growth in the non-oil
private sector. The unemployment rate of nationals fell over the past year, especially among
women. Inflation has eased to 2.7 percent in May 2014, largely reflecting lower food price
inflation in line with international trends. Credit growth also eased but remained at robust levels.
The economy has not been affected by global financial market volatility, and the banking system
is well-capitalized and profitable. High oil prices and output have led to large fiscal and external
surpluses and international reserves have increased. However, fiscal breakeven oil prices have
risen owing to strong growth in public spending. Consistent with the exchange rate peg,
monetary policy settings have remained unchanged.
Growth is projected to pick up to 4.6 percent in 2014. Private sector growth is expected to
remain strong, and oil production is expected to be little changed from 2013. Large scale
infrastructure projects and spending on housing will continue to support non-oil sector growth.
Inflation is expected to remain subdued.
The Saudi population is young and increasingly well-educated, and as it continues to enter its
working-age years, there is tremendous opportunity to boost growth and raise living standards
further. Against this background, government policies are focused on increasing private sector
employment of nationals, addressing housing needs, strengthening transportation infrastructure,
and diversifying the economy.
1 Under Article IV of the IMF's Articles of Agreement, the IMF holds bilateral discussions with members, usually
every year. A staff team visits the country, collects economic and financial information, and discusses with officials the country's economic developments and policies. On return to headquarters, the staff prepares a report, which forms the basis for discussion by the Executive Board.
International Monetary Fund
Washington, D.C. 20431 USA
2
Executive Board Assessment2
Executive Directors welcomed Saudi Arabia’s robust economic performance underpinned by
strong fundamentals. The growth outlook remains positive and risks are balanced, centered
mainly on the global oil market. Directors commended Saudi Arabia’s systemic and stabilizing
role in the global oil market, and its generous financial assistance to countries in the region and
beyond.
Directors noted that Saudi Arabia’s fiscal position is strong, with one of the lowest debt-to-GDP
ratios and largest fiscal surpluses in the world. They generally saw merit in slowing, over time,
the pace of government spending and increasing non-oil revenues so as to preserve fiscal buffers,
while striking a balance between achieving current development goals and ensuring
intergenerational equity. Directors encouraged the authorities to set the budget within a medium
term fiscal framework that is anchored around estimates of structural oil revenues and that fully
integrates the expenditure priorities from the national development plan. They welcomed efforts
to strengthen public spending efficiency and the plan to establish a macro-fiscal unit.
Directors underscored that an upward adjustment in energy prices would support a strong fiscal
position and the efficient use of energy. The price adjustment should be well-planned and
communicated, while ensuring that vulnerable groups are not adversely affected.
Directors agreed that the current monetary and macroprudential policy stance are appropriate,
but called for careful monitoring of rising equity prices and the rapid increase in mortgage
lending. They saw merit in the introduction of a formal macroprudential framework to help
ensure economic and financial stability, codify coordination across regulators, and better enable
the use of macroprudential tools in a countercyclical way. They also saw scope for refining
liquidity management. Directors agreed that the exchange rate peg to the U.S. dollar remains
appropriate for the Saudi economy.
Directors noted that the banking system is well-capitalized, profitable, and liquid. They
encouraged the authorities to take further action to deepen capital markets, including the
development of a benchmark yield curve, and promote financial inclusion. Directors supported
the ongoing work to finalize the framework for systemically important banks and bring the
AML/CFT framework in line with the CFT law.
Directors noted that labor market programs have contributed to increased employment in the
private sector, but saw a need for further action to reduce the reliance on public sector jobs.
Continued efforts to upgrade skills of workers through education and training will be important
in this regard. Directors welcomed the steps to target the government’s housing program on the
less well-off, and encouraged the authorities to ensure that the program does not impede the
development of private real estate and mortgage markets. Directors supported continued efforts
to diversify the economy by improving the business environment, investing in infrastructure, and
increasing finance for SMEs. They noted that additional incentives for firms to export and for
Saudi workers to participate in the private sector would also boost diversification.
2 At the conclusion of the discussion, the Managing Director, as Chairman of the Board, summarizes the views of
Executive Directors, and this summary is transmitted to the country's authorities. An explanation of any qualifiers used in summings up can be found here: http://www.imf.org/external/np/sec/misc/qualifiers.htm.
3
Saudi Arabia: Selected Economic Indicators, 2010–14
Proj.
2010 2011 2012 2013 2014
Production and prices (Annual percent change; unless otherwise stated)
Real GDP 7.4 8.6 5.8 4.0 4.6
Real oil GDP 0.3 11.0 5.7 -1.0 0.6
Real non-oil GDP 9.5 7.9 5.8 5.3 5.6
Nominal GDP (billions of U.S. dollars) 527 670 734 748 779
Consumer price index (avg) 3.8 3.7 2.9 3.5 2.9
Fiscal and Financial variables (Percent of GDP; unless otherwise stated)
Central Government revenue 37.5 44.5 45.3 41.2 40.2
Of which: oil revenue 33.9 41.2 41.6 36.9 35.8
Central Government expenditure 34.0 33.4 33.3 35.4 37.6
Fiscal balance (deficit -) 3.6 11.2 12.0 5.8 2.5
Non-oil primary balance (percent of non-oil GDP) -54.1 -60.9 -59.5 -59.5 -61.3
Broad money (annual percent change) 5.0 13.3 13.9 10.9 11.0
External sector (US$ billions; unless otherwise stated)
Exports 251.1 364.7 388.4 377.0 377.8
Of which: Oil and refined products 215.2 317.6 337.5 323.1 320.3
Imports -97.4 -120.0 -141.8 -152.7 -163.3
Current account 66.8 158.6 164.8 134.3 120.2
Current account (percent of GDP) 12.7 23.7 22.4 17.9 15.4
SAMA’s net foreign assets 440.4 535.2 647.6 716.7 768.5
SAMA's net foreign assets (in months of imports 26.7 29.8 33.9 35.2 35.4
of goods and services)
Real effective exchange rate (percent change)1 -0.2 -3.5 2.7 2.0 -1.4
Sources: Country authorities; and IMF staff estimates and projections.
1 Latest 2014 data is for end-April.