2013 results presentation - pearson · 2013 results presentation friday 28 february 2014 ....
TRANSCRIPT

2013 results presentation Friday 28 February 2014

Financial summary £m 2013 2012 Headline
growth CER
growth Underlying growth
Sales* 5,177 5,059 2% 2% 1%
Operating profit before restructuring 871 932 (7)% (6)% (9)%
Operating profit 736 932 (21)% (21)% (23)%
Adjusted EPS 70.1p 82.6p (15)%
Operating cash flow 588 788 (25)%
Net debt (1,379) (918) (50)%
Dividend 48p 45p 7%
Total business unless otherwise stated * Includes Mergermarket, excludes Penguin
2

27.5
34.1
43.1 46.7
57.7
65.4
77.5
86.5 82.6
70.1
2004 2005 2006 2007 2008 2009 2010 2011 2012 2013 60
70
80
90
100
110
120
130
140
Long term context Adjusted earnings per share (p)
Cumulative sales growth, 2004=100
3

Cyclical forces (% change YOY)
* 2013 tax receipts LTM to 30th June 2013 Sources: US Census Bureau, National Center of Education Statistics, National Student Clearinghouse
Total US college Fall enrolments Total US State tax receipts* 2-year public (community) college and 4-year for-profit college Fall enrolments
-6
-4
-2
0
2
4
6
8
10
12
1999 2000 2001 2002 2003 2004 2005 2006 2007 2008 2009 2010 2011 2012 2013
4

Policy change (UK school BTEC enrolments, 2007=100)
100
137
189
252 238
225 217
2007 2008 2009 2010 2011 2012 2013
5
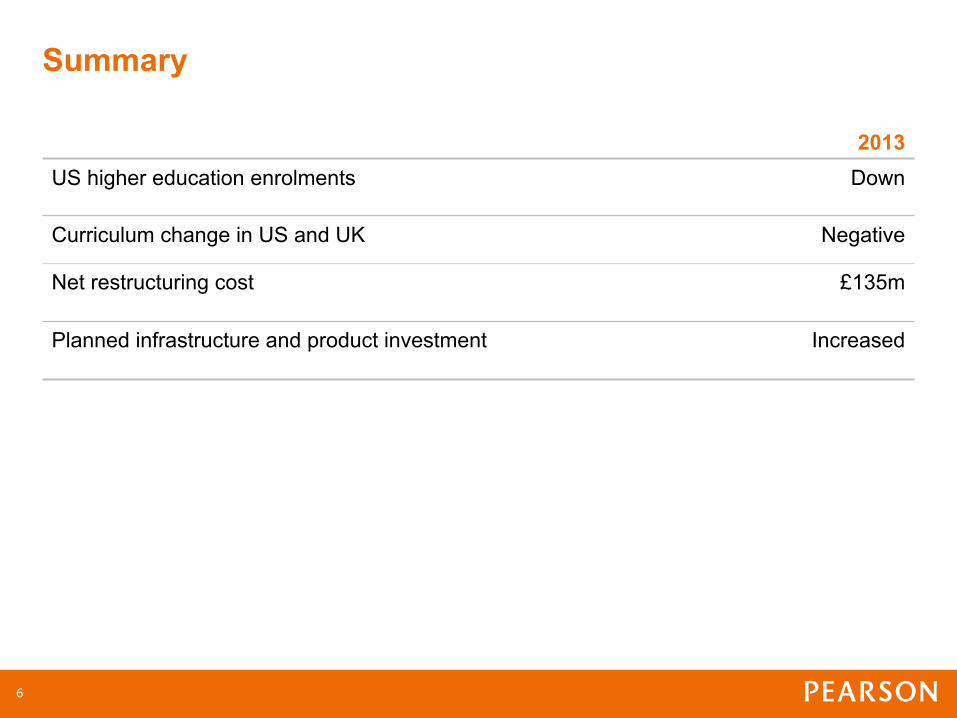
Summary
2013 US higher education enrolments Down
Curriculum change in US and UK Negative
Net restructuring cost £135m
Planned infrastructure and product investment Increased
6

Progress on our strategic goals
• Global education strategy and organisation design
• Strong growth in digital, services and emerging markets
• Restructuring programme on track
• Disposal of Mergermarket, acquisition of Grupo Multi
• Completion of Penguin Random House transaction
7

Financial review
8

Sales
£m 2013 2012 CER
growth Underlying
growth
North American Education 2,779 2,658 3% 0%
International Education 1,539 1,568 0% 1%
Professional 410 390 4% 8%
Education FT Group
4,728
449
4,616
443
2%
0%
1%
0%
Sub-total before Penguin 5,177 5,059 2% 1%
Penguin 513 1,053 n/a 6%
Total 5,690 6,112 n/a 1%
Total business
9

Sales movements, £m
2012 2013
5,059
F/X
19 29
5,177
Acquisitions/ disposals
70
2,416
Organic growth
Excludes Penguin
10

2006 2007 2008 2009 2010 2011 2012 2013
Deferred revenue* ($m)
% of Sales
460 490 549
699
814
7.9 8.4 8.7
11.0 11.6
978
12.9 13.8
1,084
*Excludes Penguin and Mergermarket
1,142
14.4
1,044
98 FT
Education
11

Operating profit – post restructuring
£m 2013* 2012 CER
growth Underlying
growth
North American Education 406 536 (25)% (30)%
International Education 140 214 (29)% (30)%
Professional 57 37 51% (7)%
Education FT Group
603
55
787
47
(23)%
17%
(28)%
17%
Total (ex Penguin / PRH) 658 834 (20)% (26)%
Penguin / PRH 78 98 (22)% (2)%
Total 736 932 (21)% (23)%
*Includes £135m net restructuring charges as follows: North American Education, £49m; International Education, £69m; Professional Education, £6m, FT Group, £11m.
12

Profit movements, £m
2012 2013
932
F/X
30 (4)
(135)
Organic Acquisitions /disposals*
736
(87)
Restructuring (Net)
Total business
* Includes impact of Penguin Random House Associate tax accounting of £23m
13

North American Education profit, £m
2012 2013
536
F/X
26 4
(49)
Investment
Acquisitions /disposals
406
(60) Restructuring
(Net) (36) (15)
Trading Incentive comp
14

Adjusted EPS
£m 2013 2012 Headline
growth
Operating profit 736 932 (21)%
Interest (72) (65) (11)%
Taxation (97) (200) (52)%
Tax rate 14.6% 23.1%
Profit after tax 567 667 (15)%
Minorities (1) (3) 67%
Adjusted earnings 566 664 (15)%
Shares in issue 807.8 804.3
Adjusted EPS 70.1p 82.6p (15)%
Total business
15

Statutory P&L £m 2013 2012
Headline growth
Operating profit 458 487 (6)%
Interest (72) (65) (11)%
Finance costs – IAS39 / IAS21 (4) (31) 87%
Profit before tax 382 391 (2)%
Taxation (87) (138) 37%
Profit after tax 295 253 17%
Discontinued operations* 244 61 300%
Profit for the year 539 314 72%
Basic EPS (total) 66.6p 38.7p 72%
*2013 includes profit on sale of Penguin
16

Operating cash flow
£m 2013 2012 var
Operating profit 736 932 (196)
Working capital (37) (100) 63 - of which pre-publication expenditure (77) (54) (23)
- of which other working capital 40 (46) 86
Net capital expenditure (169) (156) (13)
Depreciation 141 134 7
Share of operating results of associates (84) (19) (65)
Dividends from associates and JVs 64 27 37
Exchange (40) (21) (19)
Other movements (23) (9) (14)
Operating cash flow 588 788 (200)
Cash conversion % 80% 85%
Total business
17

Free cash flow
£m 2013 2012 var
Operating cash flow 588 788 (200)
Operating tax paid (191) (65) (126)
Net interest paid (73) (66) (7)
Operating free cash flow 324 657 (333)
Non operating tax paid (55) - (55)
Free cash flow 269 657 (388)
Free cash flow / share 33.3p 81.7p
Total business
18

Balance sheet £m 2013 2012 var Goodwill / intangible assets 5,959 6,622 (663)
Tangible fixed assets 344 367 (23)
Associates & JVs 1,092 39 1,053
Pre-publication 717 682 35
Deferred revenue (751) (733) (18)
Traditional working capital 397 741 (344)
Other net liabilities (61) (361) 300
Net trading assets 7,697 7,357 340
Shareholders’ funds 5,700 5,686 14
Deferred tax 363 354 9
Pensions 56 198 (142)
Other provisions 193 177 16
Minorities 6 24 (18)
Net debt 1,379 918 461
Capital employed 7,697 7,357 340
Year end $/£ 1.66 1.63 Total business
19

Credit rating
• Net debt/ EBITDA: 1.6x
• Interest cover: 10.2x
• Committed to BBB+/Baa1 over long term
• BBB/Baa2 possible during current 2013/4 restructuring and investment phase
20

Return on invested capital
£m 2013 2012 Operating profit 736 932 Less actual cash tax (operating) (191) (65) Cash tax rate 26% 7% Return 545 867 Average: goodwill - gross 6,828 6,720
other intangibles - gross 2,075 1,830
Pre-publication investments 736 662 Tangible fixed and working capital 491 366 Average total invested capital 10,130 9,578 ROIC 5.4% 9.1%
Total business
21

Working capital / sales
Total business
2008 2009 2010 2011 2012 2013
14.2%
20.4% 20.0%
16.2%
13.8% 13.4%
Traditional working capital
Pre-publication investment
22

Growing dividend Pence per share
17.4 18.8
20.1 21.4 22.3 23.4 24.2 25.4
27.0 29.3
31.6 33.8
35.5 38.7
42.0 45.0
48.0
1997 1998 1999 2000 2001 2002 2003 2004 2005 2006 2007 2008 2009 2010 2011 2012 2013
23

Disclosure Estimate of revenues by Line of Business and Geography
2013 as reported* 2013 by Geography 2013 by Line of Business
North America 55%
International 30%
Professional 8% FT Group 7%
North America 61%
Growth 15%
Core 24%
School 44%
Higher Education
34%
Professional 22%
*Continuing revenues of £5,069m
24

2013 vs. 2014 base
• Portfolio changes - Mergermarket: (£28m) - Grupo Multi: completed on 11 February; integration; currency - Penguin Random House associate tax accounting: (£10m)
• Currency - £/US$ @ 1.67: (£30m)
- Emerging markets (Rand, Renminbi, Real): (£20m)
• Restructuring charges/benefits; reinvestment - Absence of 2013 restructuring: £176m - Incremental savings from 2013 restructuring: £60m - 2014 restructuring: (£50m) - 2014 reinvestment: (£50m)
• Tax on PBT including PRH: 19%-21% in 2014 vs. 15% in 2013
25
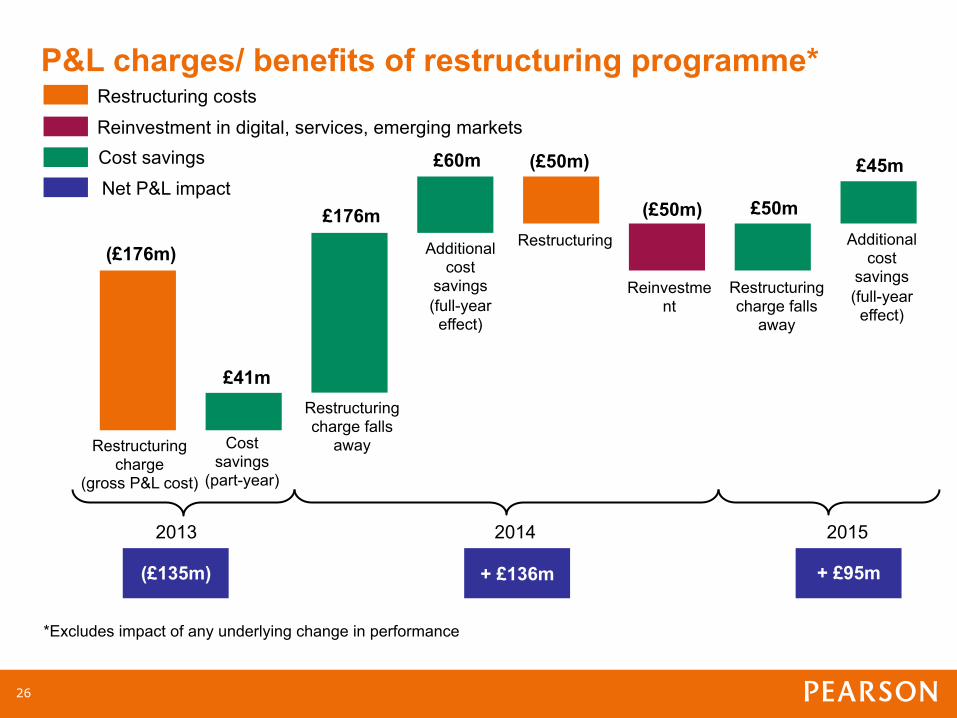
Cost savings Net P&L impact
(£50m)
P&L charges/ benefits of restructuring programme*
*Excludes impact of any underlying change in performance
(£176m)
£41m
£60m
£50m
Restructuring charge
(gross P&L cost)
Additional cost
savings (full-year
effect)
Restructuring
2013 2014 2015
Reinvestment
Restructuring charge falls
away
£176m
(£135m) + £136m + £95m
Restructuring costs
Reinvestment in digital, services, emerging markets
(£50m)
£45m
Cost savings
(part-year)
Restructuring charge falls
away
Additional cost
savings (full-year
effect)
26

2014 outlook (organic)
North American Education K12 Learning Services
better year for curriculum; another good year for Connections
significant revenue deferral; increased plate amortisation
Assessment & Information
disruption during transition to Common Core College
good growth in digital & services
lower college enrolments, notably career and community colleges
Growth
- good growth in China, Brazil - slower year in South Africa after significant curriculum change in 2012
Core
ongoing disruption from curriculum change to resources and assessment in UK
Australia still challenging; curriculum change in Italy
27

2013 results presentation Friday 28 February 2014
28

Summary
2013
2014
2015 US higher education enrolments Ø Down Ø Down Ø Stabilise
Curriculum change in US and UK Ø Negative Ø Negative Ø Neutral/positive
Restructuring cost £176m £50m Normalised
Restructuring benefit £41m £60m £45m
Planned infrastructure and product investment
Increased Increased Stable
29

Agenda
Restructuring
Investment
Transformation
Opportunity
30

Restructuring
Print => Digital & Services
Mature markets => Emerging markets
Learning inputs => Learning outcomes
31

Restructuring
Warehouses
Exit from local textbook publishing
Disposals
Analogue content/sales Analogue testing
FT print sites
32

Restructuring: physical infrastructure (warehouse capacity, millions of sq ft)
2009 2010 2011 2012 2013 2014E
7.5 7.3 7.0 6.4
4.3
3.1
33

Investment
• Growth markets
• Digital infrastructure
• Next generation products and services
• Learning outcomes
34

Investment: principles
• Based on world class R&D in the science of teaching and learning
• Adaptable, engaging, easy to use
• Digital, globally available and device neutral
• Assignable tasks, feedback and assessment
• Generating data and learning analytics to improve quality learning outcomes
• Connected to services, training, and adapted for the “last mile” for customers
• Evidence of learning outcomes
• Scalable and replicable for a global market of customers and learners
35
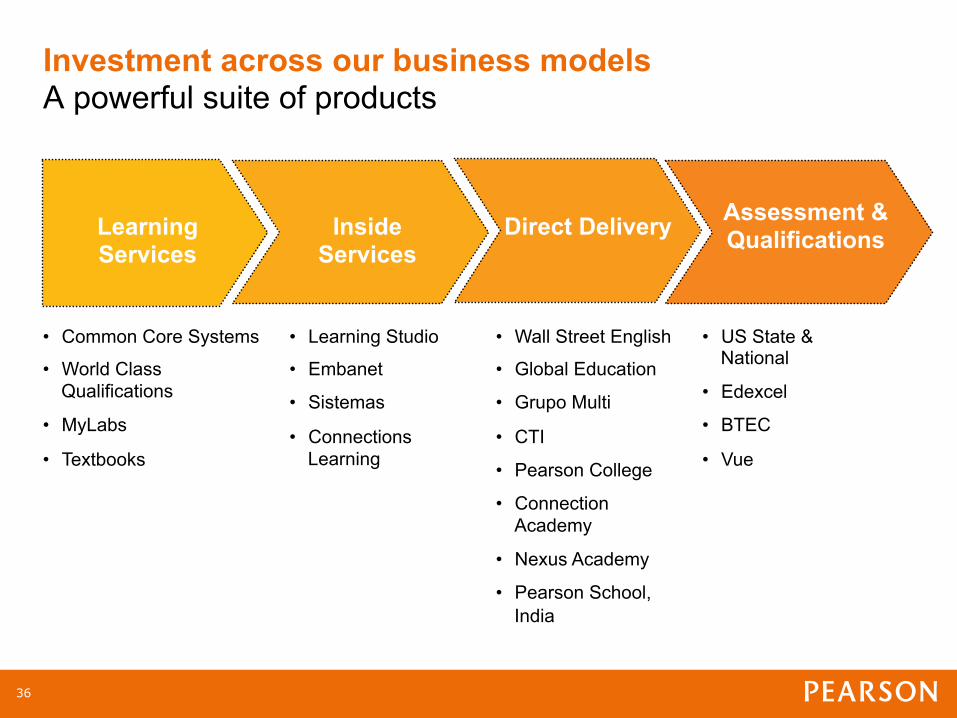
Investment across our business models A powerful suite of products
Learning Services
Inside Services
Direct Delivery Assessment & Qualifications
• Common Core Systems
• World Class Qualifications
• MyLabs
• Textbooks
• Learning Studio
• Embanet
• Sistemas
• Connections Learning
• Wall Street English
• Global Education
• Grupo Multi
• CTI
• Pearson College
• Connection Academy
• Nexus Academy
• Pearson School, India
• US State & National
• Edexcel
• BTEC
• Vue
36
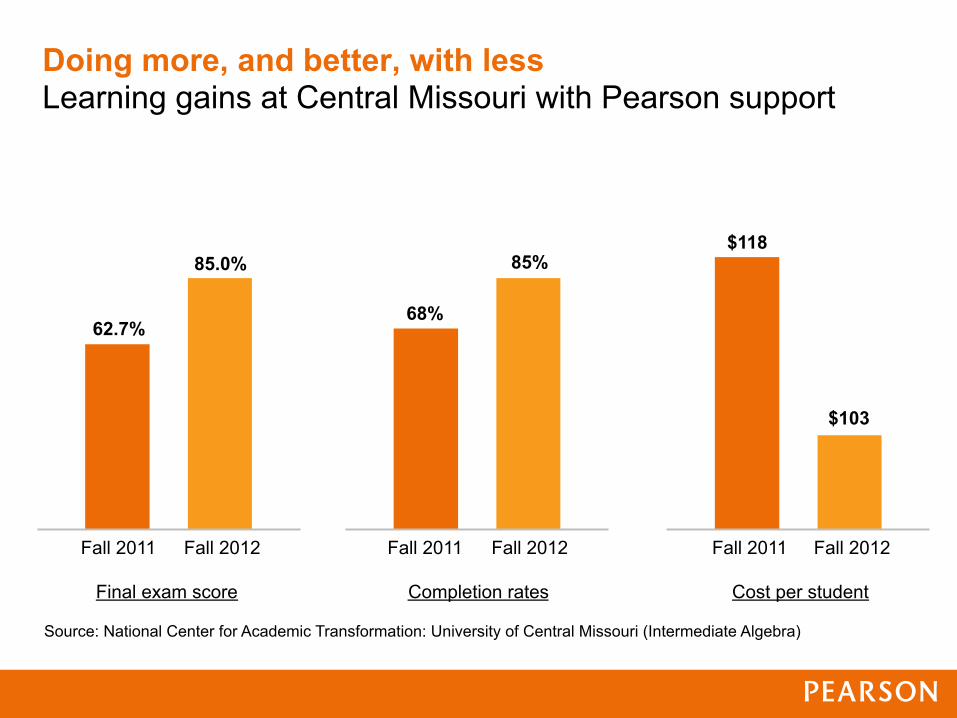
Doing more, and better, with less Learning gains at Central Missouri with Pearson support
Fall 2011 Fall 2012 Fall 2011 Fall 2012 Fall 2011 Fall 2012
62.7%
85.0%
68%
85% $118
$103
Final exam score Completion rates Cost per student
Source: National Center for Academic Transformation: University of Central Missouri (Intermediate Algebra)

From textbooks to courseware US Higher Education shifting from print to digital
US higher education print volumes
Revenue adjusted
enrolments
US MyLab registrations
100
92
2012 2013
100
109
2012 2013
100
97
2012 2013
100 101
2012 2013
Revenue per enrolment
2012=100
38

Expanded market opportunity Average Estimated Full-Time Undergraduate Budgets 2013-14
Source: the College Board, Annual Survey of Colleges
Tuition and Fees
Room and Board
Books and Supplies
Transportation
Other Expenses
1253
1207
1207
1270
30094
22203
8893
3264
10823
9498
9498
7466
990
1123
1123
1708
1590
2105
2105
2225
$0 $5,000 $10,000 $15,000 $20,000 $25,000 $30,000 $35,000 $40,000 $45,000 $50,000
Public Two-Year Commuter
Public Four-Year In-State
on-Campus
Public Four-Year Out-of-
State On-Campus
Private Nonprofit Four-
Year On-Campus
39

Higher Education, a large and growing global market
2000 2013 2030 2040
84
180
300
500
Global tertiary enrolments, million
40

Cumulative New Partner Expense
Investment profile of our new service businesses
$0
$1,000
$2,000
$3,000
$4,000
$5,000
$6,000
PreQ1 PreQ2 PreQ3 Q1 Q2 Q3 Q4 Q5 Q6 Q7 Q8 Q9 Q10 Q11 Q12
($ in
tho
usan
ds)
Cumulative New Partner Revenue
41
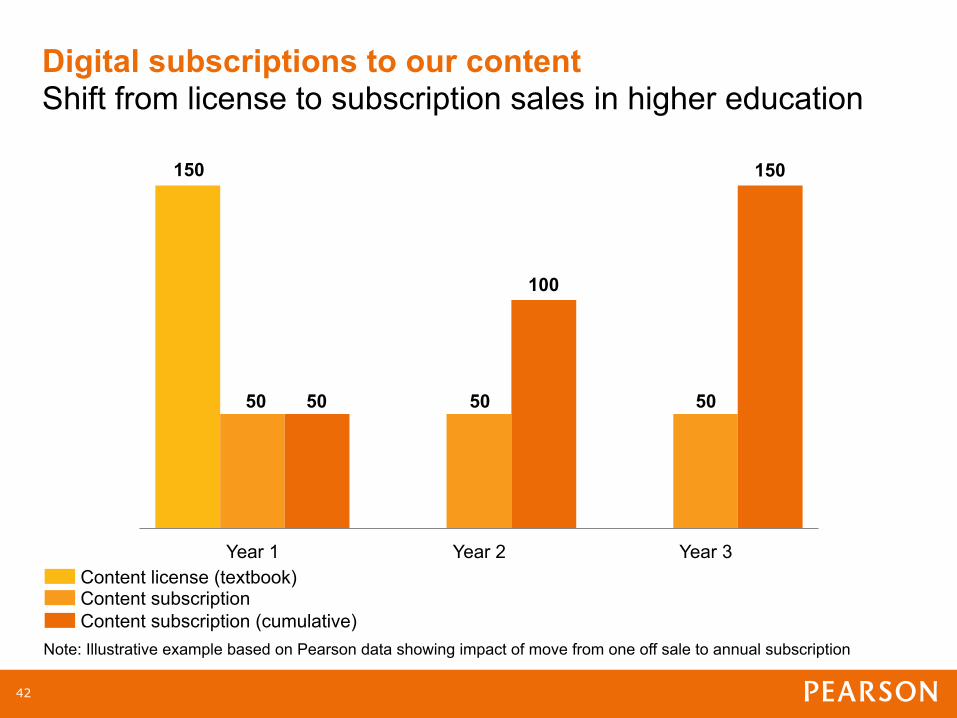
Year 1 Year 2 Year 3
Digital subscriptions to our content Shift from license to subscription sales in higher education
Content license (textbook) Content subscription Content subscription (cumulative)
150
50
100
Note: Illustrative example based on Pearson data showing impact of move from one off sale to annual subscription
50 50 50
150
42

Higher Education New business models create much bigger revenue opportunities
College textbook (US)*
Inside service, mature campus
(US)*
Direct delivery, mature campus
(Emerging market)*
ARPU 100 1,400 900
Margin, % 100 115 95
Cash conversion, %
100 95 95
* Rebased to textbook = 100
43

Doing more, and better, with less How Common Core opens up bigger opportunities
Reading Math
*NCLB test **Common Core Test
2011* 2012**
2013**
Average assessment score for grades 3-8, Kentucky
Average expenditure per pupil, constant $
8,000
9,000
10,000
11,000
12,000
13,000
14,000
15,000
1988
-89
1989
-90
1990
-91
1991
-92
1992
-93
1993
-94
1994
-95
1995
-96
1996
-97
1997
-98
1998
-99
1999
-00
2000
-01
2001
-02
2002
-03
2003
-04
2004
-05
2005
-06
2006
-07
2007
-08
2008
-09
2009
-10
2010
-11
44

Investment: School inside services and direct delivery
Learning Services
Inside Services
Direct Delivery Assessment & Qualifications
• Common Core Systems
• World Class Qualifications
• Textbooks
• Connections Learning
• Sistemas
• Connections Academy
• Nexus Academy
• Pearson School, India
• Longman Schools
• US State & National
• Edexcel
• BTEC
45
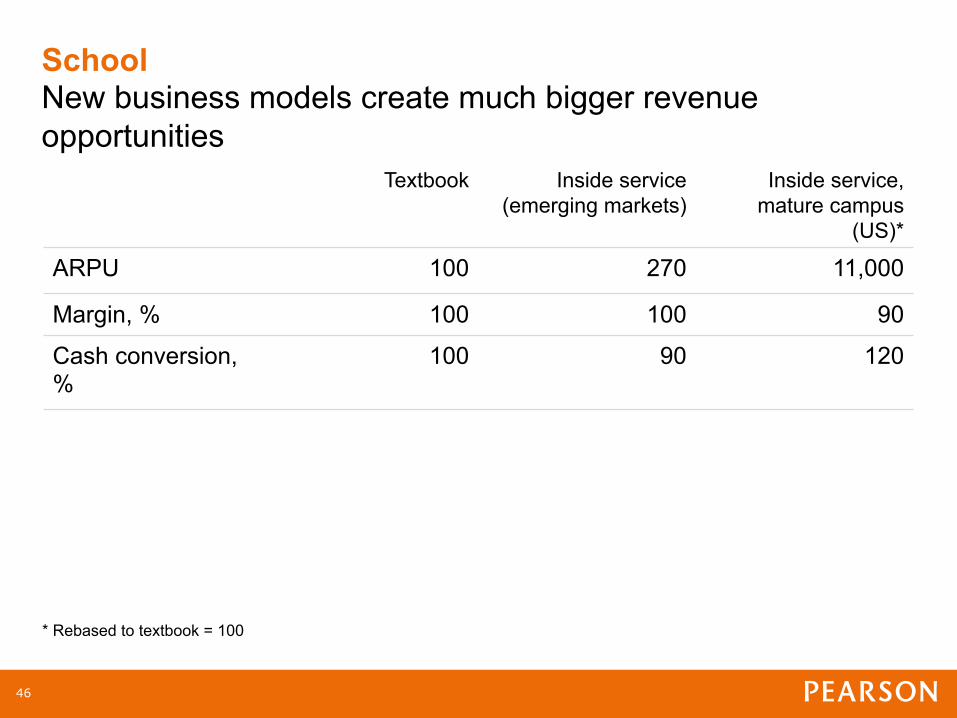
School New business models create much bigger revenue opportunities
Textbook Inside service (emerging markets)
Inside service, mature campus
(US)*
ARPU 100 270 11,000
Margin, % 100 100 90
Cash conversion, %
100 90 120
* Rebased to textbook = 100
46

English: the global language of communication
350.6
39.4
59.7
59.8
65.4
75.2
82.5
99.1
153.3
444.9
536.6
All the rest
Korean
Russia
French
Arabic
German
Portugese
Japanese
Spanish
Chinese
English
Top Ten Languages on the Internet 2010 – in millions of users
Source: Internet World Stats
47
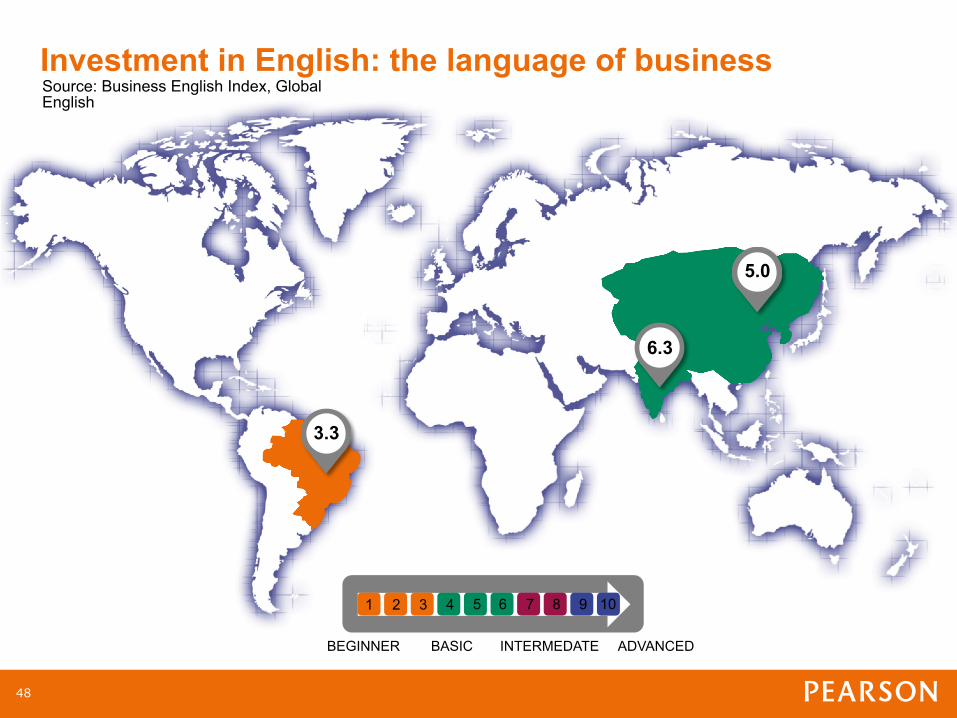
1
3.3
6.3
5.0
2 3 4 5 6 7 8 9 10
BEGINNER BASIC INTERMEDATE ADVANCED
Investment in English: the language of business Source: Business English Index, Global English
48

English New business models create much bigger revenue opportunities Textbook Inside service, mature
campus (emerging market)
Direct delivery, mature campus (emerging market)*
ARPU 100 410 6,200
Margin, % 100 265 130 Cash conversion, %
100 115 100
* Rebased to textbook = 100
49

Transformation: revenues Pearson’s digital & services revenues, % of sales
37% 38% 41%
44% 47%
51% 55%
Excludes Penguin and Mergermarket
2012 2011 2010 2009 2008 2007 2006
60%
2013
FT Group
Professional Education
International Education
North America Education
50

Transformation: geographic presence Pearson emerging markets revenues, $m
Middle East Central / Latin America Africa India China / Hong Kong
834
348 471 513
648
1,036
1,241
6% 7% 7% 9% 11% 13% 15%
2006 2007 2008 2009 2010 2011 2012
1,302
2013
16%
% of Pearson revenues
51

Combining digital, new pedagogies and scale The opportunity to improve learning outcomes
Leading to deep gains in learning
Technology and big
data
New pedagogie
s
Drive change at scale
“As we continue to develop our understanding of technology’s proof, potential and promise, we have an unprecedented opportunity to improve learning experiences in
the classroom and beyond.”
The Proof, Promise and Potential of Digital Education, NESTA
52

2002 2003 2004 2005 2006 2007 2008 2009 2010 2011 2012
Opportunity: online learning Number of US college students taking at least one online course (m)/% of total enrolments
1.6m
6.1m
2.0m 2.3m
3.2m 3.3m
3.9m
4.6m
5.6m
Source: Babson annual online learning survey
6.7m
9.6% 11.7%
13.5%
18.2%
19.6%
21.6%
24.1%
27.3%
29.2%
32.0%
33.5%
7.1m
53

Opportunity: emerging middle classes
Source: The Brookings Institution
2009 2020 2009 2020
Numbers of middle class people Middle class consumption (2005$)
Middle East & North Africa Sub-Saharan Africa Asia Pacific Central & South America Europe North America
1.8bn
3.2bn
$21,278bn
$35,045bn
54

Opportunity: 21st Century Skills for young and working adults 47% of US jobs are “at risk” of being automated in the next 20 years
55

Opportunity: the value of education is increasing
$45,000
$30,000
$28,000
3.8
8.1
12.2
Annual earnings
Unemployment rate
Bachelor’s degree or more
Bachelor’s degree or more
2yr degree/ some
college
2yr degree/ some
college
High school graduate
High school graduate
86
73
57
Bachelor’s degree or more
2yr degree/ some
college High school
graduate
…they have a career/career-track job
Education and Views about work Disparity among ages 25-32 by education level
36
37
Bachelor’s degree or more
2yr degree/ some
college High school
graduate
…they are ‘very satisfied’ with current job
53
56

Opportunity: technology partnerships
57

Opportunity: inputs to outcomes
Finland South Korea
Hong Kong
Japan
Singapore
United Kingdom
Netherlands
New Zealand
Switzerland
Canada
Ireland
Denmark
Australia
Poland
Germany
Belgium
United States
Hungary
Slovakia
Russia
Index of cognitive skills and educational attainment 1.26
1.23 0.9
0.89 0.84
0.6 0.59
0.56 0.55 0.54 0.53
0.5 0.46
0.43 0.41
0.35 0.35
0.33 0.32
0.26
Source: Pearson/The Economist Intelligence Unit: The Learning Curve
58

The global education company
Scale in high growth economies = larger market opportunity
Strength in digital + services = larger part of value chain
Lower capital intensity = higher returns, investment capacity
Focus on efficacy = greater impact on learning outcomes
59

Appendices
60

Key Performance Indicators Registrations and assessments volume growth DIRECT DELIVERY 2012 2013 Connections Education 41,600 50,900 CTI/MGI 10,200 11,700 Global Education 1,100,000 1,306,000 Global English 426,600 428,400 India Schools 22,000 27,000 TutorVista 28,800 21,900 UTEL (Mexico) 2,400 6,000 Wall Street English (network total) 191,300 191,800
Total 1,800,000 2,000,000
INSIDE SERVICES 2012 2013 Embanet 25,000 27,000 Pearson sistemas 533,000 497,000 TQ 19,300 28,600
Total 577,300 552,600
LEARNER SERVICES/ RESOURCES 2012 2013 AIMSWEB 4,200,000 4,300,000 Bug Club 420,000 734,000 Fronter 7,700,000 8,000,000 FT.com 315,900 415,300 LearningStudio 1,500,000 1,500,000 MyLabs/Mastering 11,000,000 12,100,000 PowerSchool 12,300,000 12,900,000 PSN/PSN+ 7,200,000 11,100,000 Schoolnet 8,700,000 9,300,000 SmartThinking 230,400 228,600 SuccessNet 7,900,000 10,400,000
Total 61,500,000 70,000,000
ASSESSMENT 2012 2013 Accuplacer 6,700,000 7,000,000 BTEC onscreen 20,100 142,500 BTEC paper 1,700,000 1,500,000 Central Board of Secondary Education -- 2,500,000 Edexcel GCSE/A-level onscreen 5,700,000 5,900,000 Edexcel GCSE/A-level paper 633,000 431,000 State & National assessments online 8,000,000 11,900,000 State & National assessments paper 35,800,000 38,000,000 Versant & Pearson Test of English 23,300,000 32,500,000 Vue 9,300,000 11,600,000
Total 76,600,000 111,500,000
61

Reconciliation: statutory to adjusted earnings 2013
£m Statutory Discontinue
d operations Acquisitio
n costs
Other net gains and
losses Intangible
charges
Other net finance
costs
Tax amortisation
benefit Adjusted earnings
Operating profit 458 54 12 16 196 - - 736
Net finance costs (76) - - - - 4 - (72)
Profit before tax 382 54 12 16 196 4 - 664
Income tax (87) (18) (2) 32 (51) (1) 30 (97)
Profit after tax 295 36 10 48 145 3 30 567
Discontinued operations 244 (36) - (209) 2 (1) - -
Profit for the period 539 - 10 (161) 147 2 30 567
Minority interest (1) - - - - - - (1)
Earnings 538 - 10 (161) 147 2 30 566
62

Reconciliation: statutory to adjusted earnings 2012
£m Statutory Discontinue
d operations Acquisitio
n costs
Other net gains and
losses Intangible
charges
Other net finance
costs
Tax amortisation
benefit Adjusted earnings
Operating profit 487 123 20 123 179 - - 932
Net finance costs (96) - - - - 31 - (65)
Profit before tax 391 123 20 123 179 31 - 867
Income tax (138) (38) (5) - (54) (1) 36 (200)
Profit after tax 253 85 15 123 125 30 36 667
Discontinued operations 61 (85) 1 20 3 - - -
Profit for the period 314 - 16 143 128 30 36 667
Minority interest (3) - - - - - - (3)
Earnings 311 - 16 143 128 30 36 664
63

Reconciliation: pre-publication costs
£m 2013 2012
Opening balance 682 650
Exchange - (19)
New spend capitalised 381 364
Acquisitions/Disposals (net) (26) 3
Amortisation (320) (316)
Closing balance 717 682
Total education sales 4,728 4,616
Amortisation as a % of sales 6.8% 6.8%
Total business
64

Reconciliation: year end net debt
£m 2013 2012 Non current assets
Derivative financial instruments 111 174 Current assets
Derivative financial instruments 13 4 Marketable securities 6 6
Cash and cash equivalents 729 1,062 Non current liabilities
Borrowings (1,693) (2,010) Derivative financial instruments (48) -
Current liabilities Borrowings (533) (262) Derivative financial instruments -
Net debt – continuing operations (1,415) (1,026)
Net cash classified as held for sale 36 108
Total net debt (1,379) (918)
65

Retirement benefit obligations
£m 2013 2012 Restated
Income statement Operating charge
Defined benefit schemes 29 30 Defined contribution schemes 72 78 Post retirement medical benefit schemes - 4
101 112 Interest 3 2 Total 104 114 Balance sheet UK pension scheme asset /(liability) 86 (19) Other pension scheme liabilities (35) (55) Post retirement medical benefit liability (77) (89) Other pension accruals (30) (35) Total (56) (198)
Total business
66