(2013) techno-economic prospects for co2 capture from distributed energy systems
DESCRIPTION
economic CO2TRANSCRIPT

Renewable and Sustainable Energy Reviews 19 (2013) 328–347
Contents lists available at SciVerse ScienceDirect
Renewable and Sustainable Energy Reviews
1364-03
http://d
n Corr
E-m
takeshi.
journal homepage: www.elsevier.com/locate/rser
Techno-economic prospects for CO2 capture from distributed energy systems
Takeshi Kuramochi a,n, Andrea Ramırez b, Wim Turkenburg b, Andre Faaij b
a Climate Change Group, Institute for Global Environmental Strategies (IGES), 2108-11 Kamiyamaguchi, Hayama, Miura-gun, Kanagawa 240-0115, Japanb Copernicus Institute of Sustainable Development, Department of Innovation, Environmental and Energy Sciences, Faculty of Geosciences, Utrecht University, Budapestlaan 6,
Utrecht 3584CD, The Netherlands
a r t i c l e i n f o
Article history:
Received 27 May 2011
Received in revised form
25 October 2012
Accepted 27 October 2012
Keywords:
CO2 capture
Techno-economic analysis
Distributed generation
CHP
Economies of scale
District heating
21/$ - see front matter & 2012 Published by
x.doi.org/10.1016/j.rser.2012.10.051
esponding author. Tel.: þ81 46 826 9613; fa
ail addresses: [email protected],
[email protected] (T. Kuramochi).
a b s t r a c t
CO2 emissions from distributed energy systems are expected to become increasingly significant,
accounting for about 20% for current global energy-related CO2 emissions in 2030. This article reviews,
assesses and compares the techno-economic performance of CO2 capture from distributed energy
systems taking into account differences in timeframe, fuel type and energy plant type. The analysis
includes the energy plant, CO2 capture and compression, and distributed transport between the capture
site and a trunk pipeline. Key parameters, e.g., capacity factor, energy prices and interest rate, were
normalized for the performance comparison.
The findings of this study indicate that in the short-mid term (around 2020–2025), the energy
penalty for CO2 capture ranges between 23% and 30% for coal-fired plants and 10–28% for natural
gas-fired plants. Costs are between 30 and 140 h/tCO2 avoided for plant scales larger than 100 MWLHV
(fuel input) and 50–150 h/tCO2 avoided for 10–100 MWLHV. In the long-term (2030 and beyond), the
energy penalty for CO2 capture might reduce to between 4% and 9% and the costs to around 10–90 h/tCO2
avoided for plant scales larger than 100 MWLHV, 25–100 h/tCO2 avoided for 10–100 MWLHV and
35–150 h/tCO2 avoided for 10 MWLHV or smaller.
CO2 compression and distributed transport costs are significant. For a distance of 30 km, 10 h/tCO2
transported was calculated for scales below 500 tCO2/day and more than 50 h/tCO2 transported for scales
below 5 tCO2/day (equivalent to 1 MWLHV natural gas). CO2 compression is responsible for the largest
share of these costs.
CO2 capture from distributed energy systems is not prohibitively expensive and has a significant
cost reduction potential in the long term. Distributed CO2 emission sources should also be considered for
CCS, adding to the economies of scale of CO2 transport and storage, and optimizing the deployment
of CCS.
& 2012 Published by Elsevier Ltd.
1. Introduction
CO2 capture and storage (CCS) is considered to become animportant technology to mitigate anthropogenic global warming.It is currently expected that CCS will be deployed mainly in thepower sector and the industry, in which many large scale pointsources are found [44]. Smaller scale energy systems, however,may account for a considerable fraction of total energy-relatedCO2 emissions in the future. Distributed generation (DG) isexpected to become increasingly important in the future energysupply infrastructure, particularly in future electric utilities in theeconomies where deregulation takes place [84]. DG stations aregenerally smaller than 100–150 MWe [1] and combined heat and
Elsevier Ltd.
x: þ81 46 855 3809.
power generation (CHP) is one of the major applications of DGdue to its high overall energy efficiency. A study made by theInternational Energy Agency (IEA) estimates that in a scenario tohalve the global GHG emissions in 2050, compared to 2007 level(BLUE Map scenario), 30% of global electricity generation fromfossil fuels would come from gas-fired CHP plants [46]. Moreover,The BLUE Map scenario also estimates that more than a quarter ofgas-fired CHP electricity generation, or 8% of global electricalgeneration from fossil fuels, will be equipped with CO2 capturein 2050.
Distributed energy systems are generally not considered forCCS due to the relatively high costs at such scales [22,59].However, there are a number of differences between DG plantsand centralized power plants that may challenge this claim. First,the operating conditions of DG plants are different from thosefor centralized power plants that the economies of scale maynot necessarily apply. For example, CHP plants may be ableto achieve a high degree of heat integration with CO2 capture

1 G8þ5 countries include G8 nations (Canada, France, Germany, Italy, Japan,
Russia, the United Kingdom and the United States) plus Brazil, China, India,
Mexico and South Africa.2 The CHP potentials reported in the IEA [45] are based on the global
electricity generation figures of the Alternative Policy Scenario (APS) in the World
Energy Outlook 2007 [43]. APS assumes 12% reduction in global electricity
generation in 2030 compared to the reference scenario, which estimates
29,737 TW h/yr. Therefore, global electricity generation in 2030 under APS is
94 EJe/yr. Hence, 94�24%¼22.6 EJe/yr.3 All CHP plants around the world were assumed to be natural gas-fired with
an electrical efficiency of 40%.4 A 100 MWth coal-fired plant operating for 7500 h/yr would produce about
250,000 t/yr of CO2 and a natural gas-fired plant would produce about 150,000 t/yr,
assuming an emission factor of 95 kg/GJLHV and 56 kg/GJLHV, respectively [53].5 Note that the increased penetration of CHP would affect global boiler
capacity. For example, CO2 emissions from Chinese coal boilers may reduce
drastically in the future because the Chinese government is closing down coal-fired
power plants with capacities smaller than 100 MWe to reduce coal consumption and
CO2 emissions [112].
T. Kuramochi et al. / Renewable and Sustainable Energy Reviews 19 (2013) 328–347 329
process that centralized power plant cannot, such as the recoveryof low-temperature heat. Moreover, the literature indicates thatCO2 capture from distributed energy systems would becomeeconomical in the longer term. A study by the IEA GreenhouseGas R&D Programme (IEA GHG), which performed a screening oftechnologies for ‘‘medium scale’’ (1–100 MWth) distributed energysystems and an order-of-magnitude analysis for the economicperformance of five selected technologies [55], identifies solidoxide fuels (SOFC) and oxyfuel coal boilers using oxygen conductingmembranes (OCM) to be potentially promising. Damen et al. [21]shows that CO2 capture from a 20 MWe SOFC system may enableCO2 avoidance cost as low as those for large-scale systems(600 MWe) in the long term. Therefore, it is important to quantifythe performance development potential for CO2 capture in distributedenergy systems.
Second, no study to date has assessed and compared theperformance of CO2 capture in distributed energy systems takinginto account the diversity in type of generator technologies used,applications, plant scales, operational patterns and applicable CO2
capture technologies. There are a considerable number of CO2
capture technologies proposed in the literature. A broad assessmentis therefore desired to obtain better insights into the techno-economic possibilities for distributed CO2 capture.
Third, there are few studies that provide insights into theminimum scale of CO2 emission sources to which CO2 capture canbe applied economically. Several studies on CCS use a 100 ktCO2/yras the scale limit e.g., [20,54,59,105]. The IPCC Special Report onCCS excludes emissions from sources smaller than 100 ktCO2/yrwith the argument that their emissions represent only a smallfraction of the total CO2 emissions [59]. The 100 ktCO2/yr limit,therefore, seems to be a practical limitation and not a technical oreconomic limitation.
In this context, the objectives of this study are two-fold:(1) to provide an overview of techno-economic performance ofCO2 capture from distributed energy systems in the short-midterm (ST/MT) and the long-term future (LT), which explicitlyaccounts for differences in timeframe, fuel type and energy planttype, and (2) to assess the relative cost of CO2 capture fromdistributed generation compared to large-scale centralizedpower plants, taking into account the differences in plant scale,operational conditions, and the combination of CO2 compressionand distributed transport. This study focuses on CO2 capturefrom fossil fuel-fed distributed energy systems. While there areother potentially promising distributed CO2 capture optionssuch as CO2 capture from atmosphere using a solid sorbent forsustainable hydrocarbon fuel production [36], they are notconsidered in this study.
This paper is structured as follows. Section 2 provides anoverview of distributed CO2 emission sources and the type oftechnologies used for decentralized energy conversion systems.This is followed by a description of the key methodologicalaspects used in this study (Section 3). Sections 4 and 5 assessthe techno-economic performance CO2 capture technologies fordecentralized emission sources for the ST/MT and the LT, respec-tively. For the ST/MT, the number of commercially feasible CO2
capture technologies is limited. We investigated how the energypenalty for a particular ST/MT CO2 capture technology woulddiffer by the type and application of energy systems. In the LT, incontrast, there is a variety of advanced technologies and conceptsproposed in the literature. We therefore put emphasis on theassessment of the technology itself. Section 6 combines theresults from Sections 4 and 5 to assess the technological andeconomic performance improvement potential from ST/MT to LT.Section 7 assesses the effect of CO2 capture scale on compressionand distributed transport costs. Section 8 discusses the limitationsof the study while conclusions are drawn in Section 9.
2. CO2 emissions from distributed energy systems
In this research, three main types of distributed energy systemsare considered: CHP plants, boilers and distributed hydrogen plants.This section briefly describes the technology, applications, andglobal CO2 emissions of each type. Note that while this study willinclude the three technologies as far as the availability of data allowsit, the focus will be on CHP plants.
2.1. CHP plants
The main advantage of CHP is the high overall energy effi-ciency due to the simultaneous production of useful thermal andelectrical energy [26]. The type of installed energy systemsdepends on the heat demand and the quality of heat productrequired. Table 1 presents an overview of heat demands by sectorand the applicability of various combined heat and power (CHP)generator types.
While CHP enables large energy savings and CO2 emissionsreduction, its CO2 emissions are still significant. CHP accounts formore than 6 EJe/yr, or more than 10% of global electricity genera-tion today [42], and is expected to increase considerably in thecoming decades. An IEA study suggests that in G8þ5 countries,1
which account for more than two-thirds of global primary energyconsumption, the share of CHP in electricity generation mayincrease from 11% in 2005 to 24% in 2030 in a scenario with apro-CHP policy regime [45]. Assuming the same share worldwide,CHP would account for about 23 EJe/yr2 and over 3 GtCO2 emis-sions per year using conventional technology and conservativeassumptions.3
2.2. Boilers
The IEA GHG [55] estimates that boilers with a fuel input of1–100 MWth, 4 which corresponds to the typical scale of districtheating (DH), industrial and large commercial installations,account for about 9% of global energy-related emissions (morethan 2 GtCO2/yr). The majority of emissions is attributable to coalboilers in China [55].
Assuming that global CO2 emissions from boilers remainconstant, distributed energy systems (CHP plants and boilerscombined) in 2030 could account for about 20% of current globalenergy-related CO2 emissions5 .
2.3. Distributed hydrogen plants
Hydrogen may gradually take over the function of natural gasin the residential sector in the longer term [22]. Barreto et al. [6]

Ta
ble
1O
ve
rvie
wo
fco
mb
ine
dh
ea
ta
nd
po
we
r(C
HP
)p
lan
tte
chn
olo
gie
s.
Sou
rce:
EP
A[2
6],
IEA
[45
],IE
AG
HG
[55
]a
nd
IPC
C[5
9].
CH
Psy
ste
mT
yp
ica
lca
pa
city
Po
we
re
ffici
en
cy
(LH
V)
(%)a
)
Ov
era
lle
ffici
en
cy
(LH
V)
(%)a
Ty
pic
al
he
at
to
po
we
rra
tio
Inst
all
ed
cost
O&
Mco
sts
Fue
lty
pe
sU
ses
for
the
rma
l
ou
tpu
t
Ex
ha
ust
ga
sC
O2
con
cen
tra
tio
n
[v/v
,d
ry]
[MW
e]
[h2
00
7/k
We]
[h2
00
7/k
Wh
e]
Ga
stu
rbin
e0
.5–
40
(NG
CC
:�
25
0)
24
–4
07
7–
83
0.5
–2
71
0–
95
0
(5–
40
MW
e)
0.0
03
–0
.01
NG
,bio
ga
s,p
rop
an
e,o
ilH
ea
t,h
ot
wa
ter,
LP–
HP
ste
am
3–
4%
(NG
)
Re
cip
roca
tin
g
en
gin
e
0.0
1–
52
4–
44
77
–8
81
–2
80
0–
16
00
0.0
07
–0
.02
NG
,b
iog
as,
pro
pa
ne
,
lan
dfi
llg
as
Ho
tw
ate
r,LP
ste
am
3–
4%
(NG
)b
Ste
am
turb
ine
0.5
–2
50
16
–4
28
4–
88
3–
10
31
0–
80
0o
0.0
04
All
typ
es
LP–
HP
ste
am
12
–1
4%
(co
al)
Fue
lce
lls
0.0
05
–2
33
–6
67
2–
88
0.5
–1
37
0–
48
00
0.0
2–
0.0
3H
2,
NG
,p
rop
an
e,
me
tha
no
l
Ho
tw
ate
r,LP
–H
P
ste
am
Te
chn
olo
gy
de
pe
nd
en
tc
aE
ffici
en
cyv
alu
es
rep
ort
ed
inh
igh
he
ati
ng
va
lue
(HH
V)
are
con
ve
rte
dto
low
he
ati
ng
va
lue
(LH
V)
term
su
sin
ga
mu
ltip
lica
tio
nfa
cto
ro
f1
.05
for
coa
la
nd
1.1
for
oth
er
fue
ls.
bIE
AG
HG
[55
]p
rese
nts
ah
igh
er
ran
ge
(9–
14
%),
bu
tw
eco
nsi
de
rth
era
ng
ea
no
ve
rest
ima
tio
n.
Ga
se
ng
ine
ex
ha
ust
ga
sty
pic
all
yco
nta
ins
11
–1
6%
O2
[61
],le
ad
ing
to3
–5
vo
l%(d
ry)
CO
2.
cA
no
de
off
-ga
so
fh
igh
tem
pe
ratu
refu
el
cell
s(e
.g.,
soli
do
xid
efu
el
cell
s(S
OFC
)a
nd
mo
lte
nca
rbo
na
tefu
el
cell
s(M
CFC
))is
CO
2-r
ich
wh
en
fue
lsri
chin
hy
dro
carb
on
so
rca
rbo
nm
on
ox
ide
are
use
d.H
ow
ev
er,
the
an
od
eo
ff-g
as
con
tain
sso
me
un
ox
idiz
ed
fue
lth
at
itca
nn
ot
be
com
pre
sse
da
nd
tra
nsp
ort
ed
for
un
de
rgro
un
dst
ora
ge
.In
con
ve
nti
on
al
SO
FCa
nd
MC
FCsy
ste
ms,
an
od
eo
ff-g
ase
sa
refu
lly
ox
idiz
ed
wit
ha
ir.T
he
refo
re,C
O2
con
cen
tra
tio
ns
of
pla
nt
ex
ha
ust
ga
ses
are
low
;o
nly
2–
3v
ol%
(dry
)fo
rS
OFC
[8,6
9]
an
da
rou
nd
7v
ol%
(dry
)fo
rM
CFC
[10
].IE
AG
HG
[55
]p
rese
nts
som
ew
ha
th
igh
er
va
lue
s(8
–1
0%
),b
ut
the
rep
ort
do
es
no
tp
rov
ide
refe
ren
ces.
T. Kuramochi et al. / Renewable and Sustainable Energy Reviews 19 (2013) 328–347330
present an future energy scenario in which CHP in industrial andresidential stationary fuel cell applications and electricity gen-eration from mobile hydrogen-based fuel cells in the transporta-tion sector together account for nearly 40% of the globalelectricity generation in 2100. Some fuel cell technologies maybecome economical for CHP on a house/building (block) level fornewly build projects [22].
In addition, a significant development of hydrogen marketsmight be seen if society takes a path for hydrogen-poweredvehicles, e.g., fuel cell vehicles. In this case, large-scale hydrogenplants using fossil feedstock are considered the most economical,but the cost of building a distribution infrastructure and the needfor sufficient demand could be major barriers. Therefore, distributedhydrogen generation at refueling stations using the existing naturalgas infrastructure may be considered [95].
3. Research methods
3.1. Data collection, system boundaries and reference system
selection
We reviewed literature that investigated the techno-economicperformance of CO2 capture from energy systems of scales up toabout 150 MWth fuel input for electricity and heat supply systemsand up to 2–3 MWth output for hydrogen plants. This scale limitcovers ‘‘medium scale’’ DG systems, which is defined to be of5–50 MWe scale by Ackermann et al. [1]. For hydrogen plants, theaforementioned plant scale is representative of future hydrogenrefueling stations for hydrogen vehicles [95].6 Regarding theeconomic performance data available in the literature, we onlyconsidered those from studies published after year 2000 to takeinto account the latest developments in CO2 capture R&D and toavoid economic data which are outdated. In this study, inprinciple only newly built plants were considered. Nevertheless,performance data for retrofit cases reported in the literature werealso used when they prove to be useful for this study.
The system boundaries defined in this study included thefollowing components: energy conversion plant, CO2 capture andcompression, and distributed CO2 transport between the CO2
capture site and trunk CO2 pipeline. All plants were assumed tobe newly-built and trunk CO2 pipelines were assumed to bealready available. The CO2 capture technologies assessed in thisstudy were categorized into ST/MT technologies (10–15 years)and LT (20 years or more) technologies. ST/MT technologies aredefined as those that are either in pilot, demonstration orcommercialization phase today [86]. The technologies are cate-gorized as ST/MT also when all required components are com-mercially available today, even if the process as a whole has notbeen tested or demonstrated. All other technologies, either inmodeling or laboratory phase today, are considered to be LToptions.
The selection of the reference system has a large impact on theassessment of the CO2 capture performance. Throughout thisstudy, we applied the common approach comparing identicalenergy conversion plants with and without CO2 capture [21]. Thisapproach enables to obtain a clear insight into which technologiesmay enable inherent cost-effective CO2 capture [21].
6 Note that for 50 MW H2 scale plants, Meerman et al. [78] investigated
cost-effective CO2 capture from natural gas-fed steam methane reformers using
existing technologies.

T. Kuramochi et al. / Renewable and Sustainable Energy Reviews 19 (2013) 328–347 331
3.2. Technical performance indicator
We used the efficiency penalty of an energy plant type i
(condensing power plant, CHP, H2, boiler, furnace) due to CO2
capture (DZpen: dimensionless) as an indicator of technicalperformance of CO2 capture, which is expressed as:
DZpen ¼ 1�ZCC
ZRef
ð1Þ
where Z is the net energy conversion efficiency of the plant.Subscripts CC stands for the plant with CO2 capture and Ref forthe reference plant, respectively. For CHP plants, Z is calculated onexergy terms:
Z¼ Eel,outþEth,out � f
EPEð2Þ
where Eel,out is the net electrical output (MWe), Eth,out is the netheat product output (MWth), f is the exergy factor for heat, and EPE
is the primary energy input (MWLHV).The exergy content method provides a thermodynamically
acceptable allocation base between steam and electricity byacknowledging the higher usefulness of electricity [99]. Theexergy-based allocation is also suggested to be the most meaningfuland accurate among various methods for allocating CO2 emissionsfor cogeneration processes [91].
In this study, the energy performance of DH CHP plants wascalculated using the data for condensing plants, taking intoaccount various opportunities for heat recovery. Fig. 1 shows asimplified diagram of a district heating CHP plant with CO2
Fuel
Vented CO2
CO2 capture
CO2for trunk pipe
CO2
CO2compression
CHP
Heat re
Transport:Capture site – Trunk pipe
CO2 capture
CO2
CO2compression
CHP
Heat re
Transport:Capture site – Trunk pipe
Fig. 1. District heating CHP plant with CO2 capture and compressio
Table 2Exergy factors for various heat products and centralized
Parameter
Exergy factor for heat (f: Jex/Jth) a
District heating (steam or hot water)
CO2 capture solvent regeneration heat (low temp
Industrial process heat (medium–high temperatu
Centralized electricity generation efficiency
a DH, CO2 capture solvent regeneration heat and i
110 1C, 140 1C, and 240 1C, respectively. The exergy f
Undrum [7].
capture and compression, and possible heat recovery opportunities.The energy performance of DH CHP plants with and without CO2
capture were compared on leveled heat and power outputs. Eel,out
and Eth,out were calculated as follows:
Eel, out ¼ Eel,cond�Eel,comp�Eel,CC�Eth,CC � f CC�Eth,DH � f DH ð3Þ
Eth,out ¼ Eth,DHþEth,CC � rthþ Eel,CCþEel,comp
� �� rel ð4Þ
where Eel,cond is the net power output at condensing mode(power-only mode) (MWe), Eel,comp is the power consumptionfor CO2 compression (MWe), Eel,CC is the power consumption forCO2 capture (MWe), Eth,CC is the heat extracted for CO2 capture(MWth), fCC is the exergy factor for CO2 capture heat (dimension-less), Eth,DH is the heat extracted for DH (MWth), rth is the fractionof CO2 capture heat recovered for DH, and rel is the fraction ofCO2 capture and compression power consumption recovered asheat for DH.
For boilers, Z is calculated as:
Z¼Eth, out
EPEþ Eel, in=Zgrid
� � ð5Þ
where Eel,in is the net electricity consumption (MWe), and Zgrid isthe centralized electricity generation efficiency. For hydrogenplants, Z is calculated based on primary energy terms as proposedin Damen et al. [21]:
Z¼EH2þ Eel, out=Zgrid
� �þ Eth, out=Zboiler
� �EPEþ Eel, in=Zgrid
� �þ Eth, in=Zboiler
� � ð6Þ
Steam/hot water for district heating (Eth,out)
Electricity (Eel,out)
line transport
covery
line
Steam/hot water for district heating (Eth,out)
Electricity (Eel,out)
covery
line
n. The figure also shows possible heat recovery opportunities.
electricity generation efficiency.
Symbol Value
fDH 0.17
erature steam) fCC 0.22
re steam) fInd 0.35
Zgrid 0.5
ndustrial steam were assumed to be extracted at
actors were taken from a figure in Bolland and

T. Kuramochi et al. / Renewable and Sustainable Energy Reviews 19 (2013) 328–347332
where Eth,in is the net steam consumption (MWth), Zboiler is theboiler efficiency (90%).
Table 2 presents exergy factors for various heat qualities,including centralized electricity generation efficiency (Zgrid). Theexergy factors for heat product, f, are differentiated by thetemperature of the heat product.
3.3. Economic performance indicator
In this study, we used CO2 avoidance cost (CCO2: h/tonne) as
the main economic performance indicator. CO2 avoidance costwas calculated based on the production cost of an energy carrier(COE: h/GJ):
CCO2¼
COECC�COERef
EmRef�EmCCð7Þ
where Em is the specific CO2 emission intensity of an energycarrier (tCO2/GJ). For CHP plants, the COE largely depends on howcosts are allocated to the electricity and heat that are produced. Inthis study, we used the exergy factor of final energy carriers toallocate costs. COEs are calculated by dividing the sum of annualizedcapital cost, O&M costs and fuel costs by the annual production ofthe energy carrier.
3.4. Normalization of parameters
All cost figures were converted to h2007. Inflation and materialprice increases for the energy systems and CO2 capture processplants were accounted for by applying the CERA European PowerCapital Cost Index (EPCCI) [57]. Costs that are reported in US$were first converted to Euro of the original year using the
Table 3Parameters normalized for technical and economic performance calculations in this st
Parameters and variables Unit
Real interest rate %
Economic lifetime of plantsa
Coal-fired installations yr
Gas-fired installations (conventional technologies) yr
Membrane-based technologies yr
Annual operation time
Industrial installations h/yr
Centralized power plants h/yr
Other installationsb h/yr
Total capital requirement c %—total plan
Total plant costc %—process p
Energy prices
Coald h/GJLHV
Natural gasd h/GJLHV
Electricity e h/MW h
CO2 emission factors
Natural gas f g/MJLHV
Coal f g/MJLHV
Grid electricity (EmSp,Elec)g g/MJe
a Lifetime for membrane-based technologies, e.g., fuel cells and membrane reactorb ‘‘Other installations’’ include district heating, institutional and commercial instalc Process plant cost (PPC) comprises equipment cost and installation costs. Total pl
requirement (TCR) comprises TPC, owner costs and interests during construction. Thed Nominal value is from IEA [47]. The high and low values assumed here agree wit
and 2030 [47].e Electricity price for large industries differs significantly by country, from 0.028 h
study is similar to that in the USA (0.048 h/kWh in 2007), South Korea (0.052 h/kWh if From [60].g The changes in electrical consumption due to CO2 capture are likely to affect base l
in the industrialized world where CCS is also deployed for industrial processes, aroun
Assuming an average 75% CO2 avoidance rate by CO2 capture, we estimated that the CO
due to CO2 capture. The nominal value assumes that natural gas- and coal-fired power p
ratio of 80:20 between natural gas power plants and coal power plants, and the high
exchange rate data (year average) from OANDA [83], thenupdated to h2007. The Chemical Engineering Plant Cost IndexCEPCI; [16] was used for distributed CO2 transport components.Other cost figures were corrected for inflation by using GDPdeflators [58]. Note that for advanced CO2 capture technologies,technical performance figures are forecasts and cost projectionsare uncertain [21].
With regard to capital investment, we considered total capitalrequirement (TCR), which includes the following components:
�
udy
t co
lant
s, ar
latio
ant
valu
h th
/kW
n 20
oad
d 4
2 em
lant
end
Process plant cost (costs for the equipment pieces and theirinstallation) plus engineering fees and contingencies;
� Owner costs (royalties, preproduction costs, inventorycapital, land costs and site preparation) and interests duringconstruction.
3.4.1. Key parameters
Table 3 presents the parameters that are normalized fortechnical and economic performance calculations throughoutthe study. High and low parameter values were used to assessthe sensitivity of the results (see Section 3.5).
3.4.2. Normalization of CO2 compression, distributed transport and
CO2 purity
Literature indicates that the use of trucks maybe more suitablethan pipelines for small-scale and short-distance CO2 transport[40,109]. We therefore considered both branch pipeline and truckas options for distributed CO2 transport between the CO2 capturesite and a trunk pipeline (see Fig. 2). In each case, the cheapest
.
Nominal Low High
10 7.5 12.5
35 30 40
25 20 30
20 15 25
7500 6000 8500
7000 6000 8000
5000 3500 6500
st 110 105 130
cost 130 120 150
2.6 2 3.2
8 5 11
55 40 70
56 – –
95 – –
111 89 133
e based on [30,75].
ns.
cost (TPC) comprises PPC and engineering fees and contingencies. Total capital
es are within the ranges observed for power plant construction [106].
ose forecasted by the IEA for the EU, the US and Japan for years between 2020
h in Russia (in 2006) to 0.177 h/kWh in Italy (in 2007). The price used in this
07) and Poland (0.061 h/kWh in 2007) [103].
power generation by base-load fossil fuel-fired power plants. We assumed that
0% of base-load fossil fuel-fired power plants are equipped with CO2 capture.
issions from base-load fossil fuel-fired power plants would be reduced by 30%
s share the electricity generation 50% each. The low end value corresponds to a
value corresponds to a ratio of 20:80.
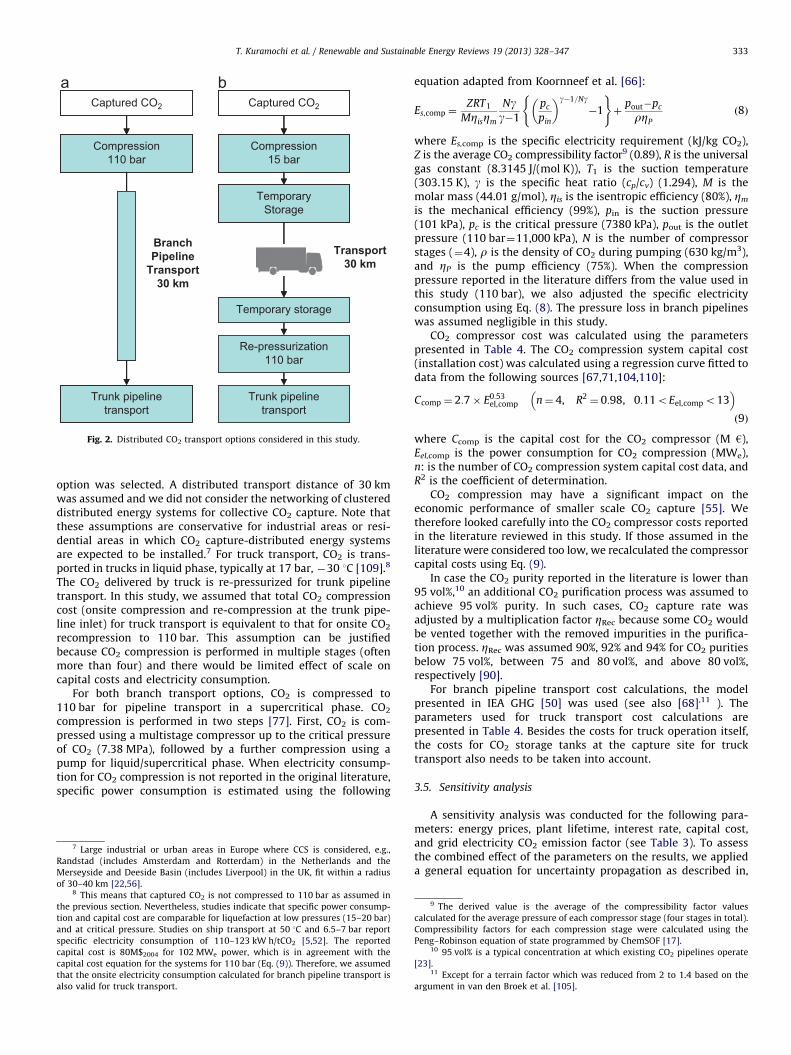
Temporary storage
Transport30 km
Re -pressurization110 bar
Trunk pipeline transport
Captured CO2
Compression15 bar
Temporary storage
TemporaryStorage
Re-pressurization110 bar
Trunk pipelinetransport
Captured CO2
Compression110 bar
Trunk pipelinetransport
BranchPipeline
Transport30 km
Fig. 2. Distributed CO2 transport options considered in this study.
T. Kuramochi et al. / Renewable and Sustainable Energy Reviews 19 (2013) 328–347 333
option was selected. A distributed transport distance of 30 kmwas assumed and we did not consider the networking of clustereddistributed energy systems for collective CO2 capture. Note thatthese assumptions are conservative for industrial areas or resi-dential areas in which CO2 capture-distributed energy systemsare expected to be installed.7 For truck transport, CO2 is trans-ported in trucks in liquid phase, typically at 17 bar, �30 1C [109].8
The CO2 delivered by truck is re-pressurized for trunk pipelinetransport. In this study, we assumed that total CO2 compressioncost (onsite compression and re-compression at the trunk pipe-line inlet) for truck transport is equivalent to that for onsite CO2
recompression to 110 bar. This assumption can be justifiedbecause CO2 compression is performed in multiple stages (oftenmore than four) and there would be limited effect of scale oncapital costs and electricity consumption.
For both branch transport options, CO2 is compressed to110 bar for pipeline transport in a supercritical phase. CO2
compression is performed in two steps [77]. First, CO2 is com-pressed using a multistage compressor up to the critical pressureof CO2 (7.38 MPa), followed by a further compression using apump for liquid/supercritical phase. When electricity consump-tion for CO2 compression is not reported in the original literature,specific power consumption is estimated using the following
7 Large industrial or urban areas in Europe where CCS is considered, e.g.,
Randstad (includes Amsterdam and Rotterdam) in the Netherlands and the
Merseyside and Deeside Basin (includes Liverpool) in the UK, fit within a radius
of 30–40 km [22,56].8 This means that captured CO2 is not compressed to 110 bar as assumed in
the previous section. Nevertheless, studies indicate that specific power consump-
tion and capital cost are comparable for liquefaction at low pressures (15–20 bar)
and at critical pressure. Studies on ship transport at 50 1C and 6.5–7 bar report
specific electricity consumption of 110–123 kW h/tCO2 [5,52]. The reported
capital cost is 80M$2004 for 102 MWe power, which is in agreement with the
capital cost equation for the systems for 110 bar (Eq. (9)). Therefore, we assumed
that the onsite electricity consumption calculated for branch pipeline transport is
also valid for truck transport.
equation adapted from Koornneef et al. [66]:
Es,comp ¼ZRT1
MZisZm
Ngg�1
pc
pin
� �g�1=Ng�1
( )þ
pout�pc
rZP
ð8Þ
where Es,comp is the specific electricity requirement (kJ/kg CO2),Z is the average CO2 compressibility factor9 (0.89), R is the universalgas constant (8.3145 J/(mol K)), T1 is the suction temperature(303.15 K), g is the specific heat ratio (cp/cv) (1.294), M is themolar mass (44.01 g/mol), Zis is the isentropic efficiency (80%), Zm
is the mechanical efficiency (99%), pin is the suction pressure(101 kPa), pc is the critical pressure (7380 kPa), pout is the outletpressure (110 bar¼11,000 kPa), N is the number of compressorstages (¼4), r is the density of CO2 during pumping (630 kg/m3),and ZP is the pump efficiency (75%). When the compressionpressure reported in the literature differs from the value used inthis study (110 bar), we also adjusted the specific electricityconsumption using Eq. (8). The pressure loss in branch pipelineswas assumed negligible in this study.
CO2 compressor cost was calculated using the parameterspresented in Table 4. The CO2 compression system capital cost(installation cost) was calculated using a regression curve fitted todata from the following sources [67,71,104,110]:
Ccomp ¼ 2:7� E0:53el,comp n¼ 4, R2
¼ 0:98, 0:11oEel,compo13� �
ð9Þ
where Ccomp is the capital cost for the CO2 compressor (M h),Eel,comp is the power consumption for CO2 compression (MWe),n: is the number of CO2 compression system capital cost data, andR2 is the coefficient of determination.
CO2 compression may have a significant impact on theeconomic performance of smaller scale CO2 capture [55]. Wetherefore looked carefully into the CO2 compressor costs reportedin the literature reviewed in this study. If those assumed in theliterature were considered too low, we recalculated the compressorcapital costs using Eq. (9).
In case the CO2 purity reported in the literature is lower than95 vol%,10 an additional CO2 purification process was assumed toachieve 95 vol% purity. In such cases, CO2 capture rate wasadjusted by a multiplication factor ZRec because some CO2 wouldbe vented together with the removed impurities in the purifica-tion process. ZRec was assumed 90%, 92% and 94% for CO2 puritiesbelow 75 vol%, between 75 and 80 vol%, and above 80 vol%,respectively [90].
For branch pipeline transport cost calculations, the modelpresented in IEA GHG [50] was used (see also [68],11 ). Theparameters used for truck transport cost calculations arepresented in Table 4. Besides the costs for truck operation itself,the costs for CO2 storage tanks at the capture site for trucktransport also needs to be taken into account.
3.5. Sensitivity analysis
A sensitivity analysis was conducted for the following para-meters: energy prices, plant lifetime, interest rate, capital cost,and grid electricity CO2 emission factor (see Table 3). To assessthe combined effect of the parameters on the results, we applieda general equation for uncertainty propagation as described in,
9 The derived value is the average of the compressibility factor values
calculated for the average pressure of each compressor stage (four stages in total).
Compressibility factors for each compression stage were calculated using the
Peng–Robinson equation of state programmed by ChemSOF [17].10 95 vol% is a typical concentration at which existing CO2 pipelines operate
[23].11 Except for a terrain factor which was reduced from 2 to 1.4 based on the
argument in van den Broek et al. [105].

Table 4Parameters for CO2 compression and distributed CO2 transport cost calculations.
Parameter Unit Value
Truck transport cost a h2007/(t km) 0.22
CO2 re-pressurization system capital costb Mh2007 1.2� compression power (MWe)þ0.07
CO2 storage tank cost (200 tCO2 capacity)c kh2007 150
O&M cost: pipeline and CO2 storage tankb %—capital cost 2
Because of the assumed transport distance, CO2 boil-off during transport and CO2 emissions from transport trucks were assumed to be negligible.
The CO2 boil-off rate can be as high as 10% depending on the length of time the CO2 is kept in the truck [109]. For ocean tankers, a boil-off rate of 1%
per day is suggested [39].a From van Bergen et al. [104]. The values reported in the literature range between 0.04 h/(t km) [79] and 0.32 h/(t km) [64]. Although it is not
explicit in the literature, the low estimate seems to take into account only the truck operation cost (driver and fuel), and the high estimate seems to
include CO2 liquefaction. Values that lie within the range are reported in Wong [109], Herzog and Golomb [40] and MGSC [79].b From McCollum and Ogden [77]. The minimum storage capacity was assumed to be 20 t, which is equivalent to a typical capacity of CO2
transport trucks.c From Wong [109]. The scaling factor was assumed to be 0.6. The minimum tank capacity was assumed to be 20 t CO2, equivalent to the truck
transport capacity.
T. Kuramochi et al. / Renewable and Sustainable Energy Reviews 19 (2013) 328–347334
e.g., [82,101]. In this approach, for a given indicator C, which is afunction of variables X1, X2,y,Xn, the standard deviation of C (sC)is calculated as follows:
sC ¼
ffiffiffiffiffiffiffiffiffiffiffiffiffiffiffiffiffiffiffiffiffiffiffiffiffiffiffiffiffiffiffiffiffiffiffiffiffiffiffiffiffiffiffiffiffiffiffiffiffiffiffiffiffiffiffiffiffiffiffiffiffiffiffiffiffiffiffiffiffiffiffiffiffiffiffiffiffiffiffiffiffiffiffiffiffiffiffiffiffiffiffiffiffiffiffiffiXn
i ¼ 1
@C
@Xi
� �2
sXi2þ2
Xn�1
i ¼ 1
Xn
j ¼ iþ1
@C
@Xi
@C
@XjsXisXjrij
vuut ð10Þ
where sXi is the standard deviation of variable Xi, rij is thecorrelation coefficient between two variables Xi and Xj. Becausethere is no detailed information on the distribution of theparameter values, we assumed a uniform distribution. In thiscase, sXi is calculated as [82]:
sXi ¼Xi,High�Xi,Lowffiffiffiffiffiffi
12p ð11Þ
The correlation coefficients among variables were not consideredin this study.
12 55 MWth can be recovered for a plant with 854 MWth fuel input and 90%
CO2 capture. Assuming a CO2 emission factor of 56 g/MJ, specific heat recovery is
calculated to be 1.28 GJ/tCO2 captured. The IEA GHG study assumes specific heat
consumption of 4.22 GJ/tCO2 captured, thus 1.28/4.22¼0.303.13 The figure from the Knuutila study also includes heat recovery from CO2
compression, but we considered this fraction in total heat recovered to be small.
107 MW of hot water can be generated at 108 kgCO2/s capture rate and a specific
heat consumption of 3.22 GJ/tCO2 captured. The heat recovery rate is calculated to
be 30.7%. Bode and Hagberg [34] report that the electrical efficiency reduces by
11.4%-points while DH efficiency increases by 8.9%-points. Using the exergy factor
presented in Table 2 (fCC¼0.22) and assuming that CO2 compression accounts for
4. Assessment of short-mid term CO2 capture technologies
As noted earlier, we investigated how the energy penalty for aparticular ST/MT CO2 capture technology would differ by the typeand application of energy systems. Then we looked at a number ofpromising CO2 capture options for distributed energy systemsthat have not yet been covered in earlier studies.
4.1. Literature review and selection of short-term technologies
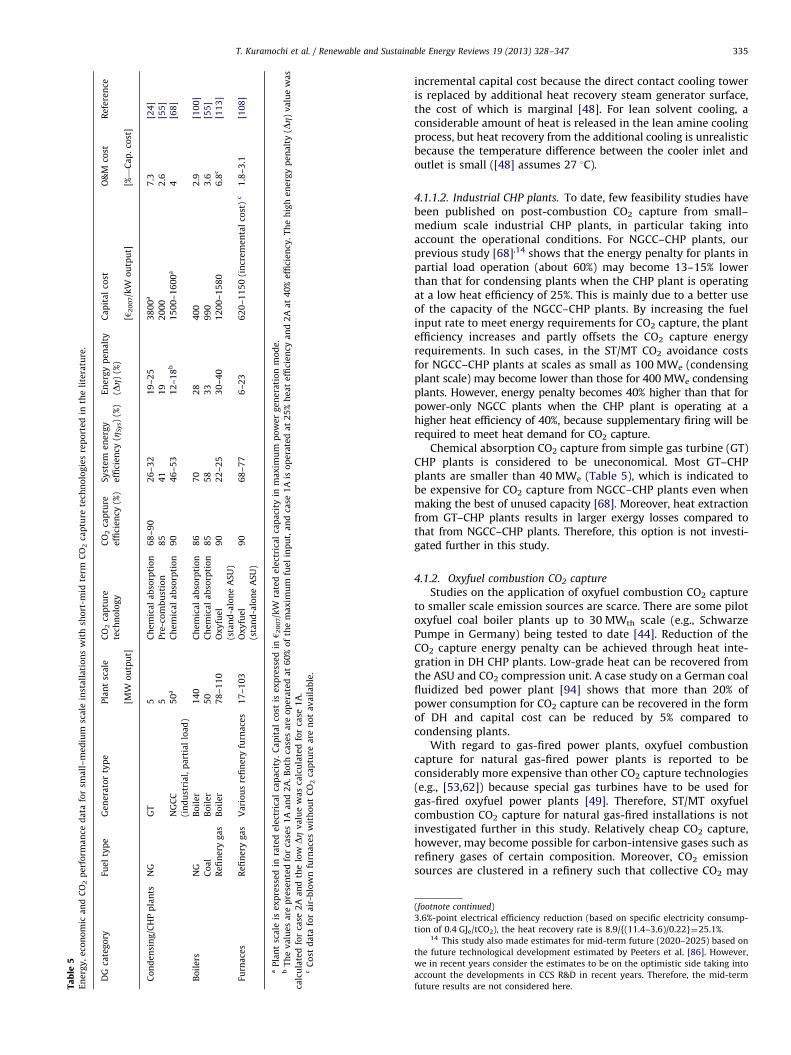
Table 5 shows the key performance parameters for ST/MT CO2
capture from small–medium scale emission sources reported inthe literature. Most of the data are for industrial applications.
4.1.1. Post-combustion capture
Post-combustion capture in the ST/MT would most likelyapply chemical absorption process. Chemical absorption is morefavorable for power plants with steam turbines than for boilersand simple gas turbine power plants because steam turbines canminimize the exergy losses caused by the extraction of steam forCO2 capture. General description of chemical absorption processcan be found in, e.g., [59]. Flue gas is first cooled down from about110 1C to about 50 1C before it enters the CO2 scrubber. CO2 isthen bound by the chemical solvent in the scrubber at tempera-tures between 40 and 60 1C. After the CO2 absorption process,the CO2-rich solvent flows through the stripper at temperaturesaround 100–140 1C, where the chemical bounded CO2 and isremoved and the solvent is regenerated. CO2 is released atthe top of the stripper with considerable amount of steam. In
condensing power plants, the steam is condensed and separatedfrom CO2 in a water cooler. The hot CO2-lean solvent is pumpedback to the stripper via lean-rich heat exchanger and a cooler tobring the temperature down to 40–60 1C.
In case of capture from natural gas combustion flue gas,MEA-based process consumes around 20–30% of total thermalenergy input for solvent regeneration. For boilers, this directlyleads to DZpen of 20–30% (Table 5). For NGCC plants, however,DZpen is much smaller (e.g., IEA GHG [51] reports 7.5%) becausethe MEA process requires low-temperature steam, which haslow exergy content.
4.1.1.1. District heating CHP plants. To the authors’ knowledge, thestudy by Desideri and Corbelli [24] on a 5 MWe steam-injectiongas turbine plant is one of the few in the public literature thatassesses the techno-economic feasibility of retrofitting CO2
capture to smaller scale DH CHP plants. The results show thatthe energy penalty differs significantly by the operational modeof the CHP plant [24]. There are a number of studies that investi-gate the integration between large scale DH CHP plants andCO2 capture e.g., [48,65]. These studies suggest that chemicalabsorption CO2 capture may be energetically more economical forDH CHP plants than for condensing power plants because ofbetter heat integration possibilities.
In the chemical absorption CO2 capture process, low-gradeheat can be recovered from mainly three sections: flue gascooling, CO2 regenerator condenser, and lean solvent cooling.Regarding flue gas cooling, heat is not recovered in condensingpower plants because the temperature is too low for the low-pressure evaporator [72], but it is sufficiently high to generate hotwater [24]. For the CO2 regenerator condenser, the IEA GHG [48]has shown that in case of NGCC plants, about 30% of the thermalenergy extracted from the steam turbines for CO2 capture can berecovered at the CO2 regenerator condenser in the form of hotwater12 when the DH water returns at 40 1C. Knuutila et al. [65]and Gode and Hagberg [34] report similar recovery rates.13 It issuggested that this heat recovery may be done with negative
Ta
ble
5E
ne
rgy
,e
con
om
ica
nd
CO
2p
erf
orm
an
ced
ata
for
sma
ll–
me
diu
msc
ale
inst
all
ati
on
sw
ith
sho
rt-m
idte
rmC
O2
cap
ture
tech
no
log
ies
rep
ort
ed
inth
eli
tera
ture
.
DG
cate
go
ryFu
el
typ
eG
en
era
tor
typ
eP
lan
tsc
ale
CO
2ca
ptu
re
tech
no
log
y
CO
2ca
ptu
re
effi
cie
ncy
(%)
Sy
ste
me
ne
rgy
effi
cie
ncy
( ZSy
s)(%
)
En
erg
yp
en
alt
y
(DZ)
(%)
Ca
pit
al
cost
O&
Mco
stR
efe
ren
ce
[MW
ou
tpu
t][h
20
07/k
Wo
utp
ut]
[%—
Ca
p.
cost
]
Co
nd
en
sin
g/C
HP
pla
nts
NG
GT
5C
he
mic
al
ab
sorp
tio
n6
8–
90
26
–3
21
9–
25
38
00
a7
.3[2
4]
5P
re-c
om
bu
stio
n8
54
11
92
00
02
.6[5
5]
NG
CC
(in
du
stri
al,
pa
rtia
llo
ad
)
50
aC
he
mic
al
ab
sorp
tio
n9
04
6–
53
12
–1
8b
15
00
–1
60
0a
4[6
8]
Bo
ile
rsN
GB
oil
er
14
0C
he
mic
al
ab
sorp
tio
n8
67
02
84
00
2.9
[10
0]
Co
al
Bo
ile
r5
0C
he
mic
al
ab
sorp
tio
n8
55
83
39
90
3.6
[55
]
Re
fin
ery
ga
sB
oil
er
78
–1
10
Ox
yfu
el
(sta
nd
-alo
ne
AS
U)
90
22
–2
53
0–
40
12
00
–1
58
06
.8c
[11
3]
Furn
ace
sR
efi
ne
ryg
as
Va
rio
us
refi
ne
ryfu
rna
ces
17
–1
03
Ox
yfu
el
(sta
nd
-alo
ne
AS
U)
90
68
–7
76
–2
36
20
–1
15
0(i
ncr
em
en
tal
cost
)c
1.8
–3
.1[1
08
]
aP
lan
tsc
ale
ise
xp
ress
ed
inra
ted
ele
ctri
cal
cap
aci
ty.
Ca
pit
al
cost
ise
xp
ress
ed
inh
20
07/k
Wra
ted
ele
ctri
cal
cap
aci
tyin
ma
xim
um
po
we
rg
en
era
tio
nm
od
e.
bT
he
va
lue
sa
rep
rese
nte
dfo
rca
ses
1A
an
d2
A.
Bo
thca
ses
are
op
era
ted
at
60
%o
fth
em
ax
imu
mfu
el
inp
ut,
an
dca
se1
Ais
op
era
ted
at
25
%h
ea
te
ffici
en
cya
nd
2A
at
40
%e
ffici
en
cy.
Th
eh
igh
en
erg
yp
en
alt
y(DZ)
va
lue
wa
s
calc
ula
ted
for
case
2A
an
dth
elo
wDZ
va
lue
wa
sca
lcu
late
dfo
rca
se1
A.
cC
ost
da
tafo
ra
ir-b
low
nfu
rna
ces
wit
ho
ut
CO
2ca
ptu
rea
ren
ot
av
ail
ab
le.
T. Kuramochi et al. / Renewable and Sustainable Energy Reviews 19 (2013) 328–347 335
incremental capital cost because the direct contact cooling toweris replaced by additional heat recovery steam generator surface,the cost of which is marginal [48]. For lean solvent cooling, aconsiderable amount of heat is released in the lean amine coolingprocess, but heat recovery from the additional cooling is unrealisticbecause the temperature difference between the cooler inlet andoutlet is small ([48] assumes 27 1C).
4.1.1.2. Industrial CHP plants. To date, few feasibility studies havebeen published on post-combustion CO2 capture from small–medium scale industrial CHP plants, in particular taking intoaccount the operational conditions. For NGCC–CHP plants, ourprevious study [68],14 shows that the energy penalty for plants inpartial load operation (about 60%) may become 13–15% lowerthan that for condensing plants when the CHP plant is operatingat a low heat efficiency of 25%. This is mainly due to a better useof the capacity of the NGCC–CHP plants. By increasing the fuelinput rate to meet energy requirements for CO2 capture, the plantefficiency increases and partly offsets the CO2 capture energyrequirements. In such cases, in the ST/MT CO2 avoidance costsfor NGCC–CHP plants at scales as small as 100 MWe (condensingplant scale) may become lower than those for 400 MWe condensingplants. However, energy penalty becomes 40% higher than that forpower-only NGCC plants when the CHP plant is operating at ahigher heat efficiency of 40%, because supplementary firing will berequired to meet heat demand for CO2 capture.
Chemical absorption CO2 capture from simple gas turbine (GT)CHP plants is considered to be uneconomical. Most GT–CHPplants are smaller than 40 MWe (Table 5), which is indicated tobe expensive for CO2 capture from NGCC–CHP plants even whenmaking the best of unused capacity [68]. Moreover, heat extractionfrom GT–CHP plants results in larger exergy losses compared tothat from NGCC–CHP plants. Therefore, this option is not investi-gated further in this study.
4.1.2. Oxyfuel combustion CO2 capture
Studies on the application of oxyfuel combustion CO2 captureto smaller scale emission sources are scarce. There are some pilotoxyfuel coal boiler plants up to 30 MWth scale (e.g., SchwarzePumpe in Germany) being tested to date [44]. Reduction of theCO2 capture energy penalty can be achieved through heat inte-gration in DH CHP plants. Low-grade heat can be recovered fromthe ASU and CO2 compression unit. A case study on a German coalfluidized bed power plant [94] shows that more than 20% ofpower consumption for CO2 capture can be recovered in the formof DH and capital cost can be reduced by 5% compared tocondensing plants.
With regard to gas-fired power plants, oxyfuel combustioncapture for natural gas-fired power plants is reported to beconsiderably more expensive than other CO2 capture technologies(e.g., [53,62]) because special gas turbines have to be used forgas-fired oxyfuel power plants [49]. Therefore, ST/MT oxyfuelcombustion CO2 capture for natural gas-fired installations is notinvestigated further in this study. Relatively cheap CO2 capture,however, may become possible for carbon-intensive gases such asrefinery gases of certain composition. Moreover, CO2 emissionsources are clustered in a refinery such that collective CO2 may
(footnote continued)
3.6%-point electrical efficiency reduction (based on specific electricity consump-
tion of 0.4 GJe/tCO2), the heat recovery rate is 8.9/{(11.4–3.6)/0.22}¼25.1%.14 This study also made estimates for mid-term future (2020–2025) based on
the future technological development estimated by Peeters et al. [86]. However,
we in recent years consider the estimates to be on the optimistic side taking into
account the developments in CCS R&D in recent years. Therefore, the mid-term
future results are not considered here.
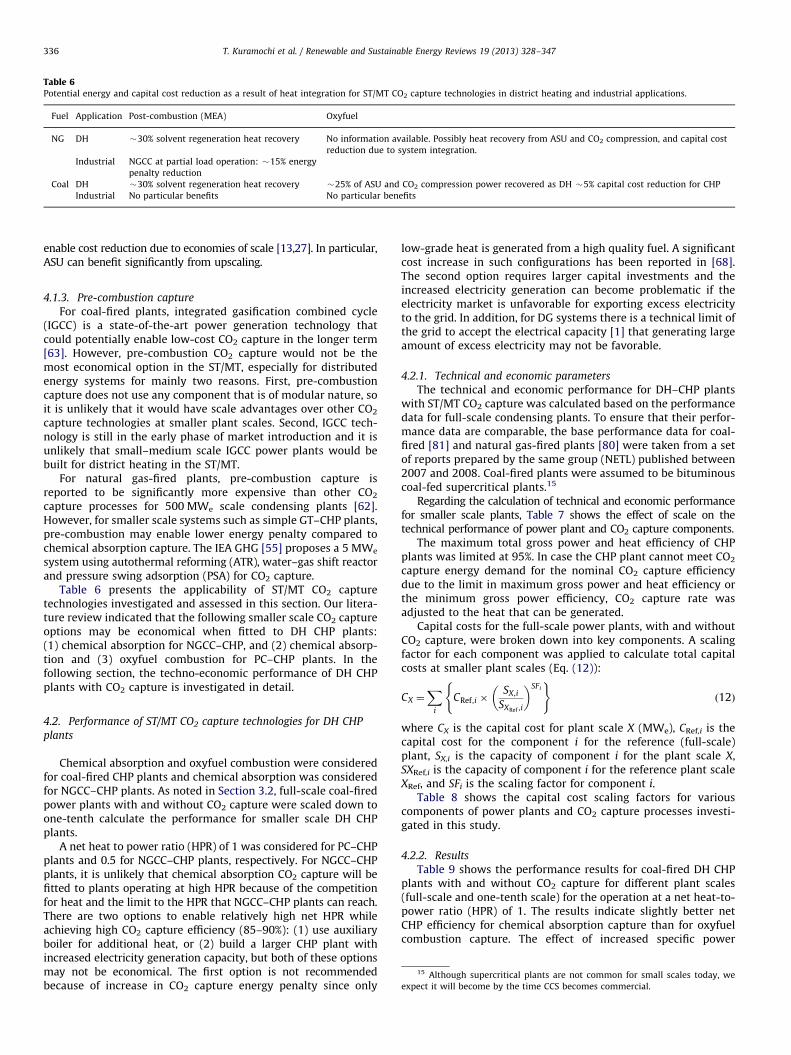
Table 6Potential energy and capital cost reduction as a result of heat integration for ST/MT CO2 capture technologies in district heating and industrial applications.
Fuel Application Post-combustion (MEA) Oxyfuel
NG DH �30% solvent regeneration heat recovery No information available. Possibly heat recovery from ASU and CO2 compression, and capital cost
reduction due to system integration.
Industrial NGCC at partial load operation: �15% energy
penalty reduction
Coal DH �30% solvent regeneration heat recovery �25% of ASU and CO2 compression power recovered as DH �5% capital cost reduction for CHP
Industrial No particular benefits No particular benefits
T. Kuramochi et al. / Renewable and Sustainable Energy Reviews 19 (2013) 328–347336
enable cost reduction due to economies of scale [13,27]. In particular,ASU can benefit significantly from upscaling.
15 Although supercritical plants are not common for small scales today, we
expect it will become by the time CCS becomes commercial.
4.1.3. Pre-combustion capture
For coal-fired plants, integrated gasification combined cycle(IGCC) is a state-of-the-art power generation technology thatcould potentially enable low-cost CO2 capture in the longer term[63]. However, pre-combustion CO2 capture would not be themost economical option in the ST/MT, especially for distributedenergy systems for mainly two reasons. First, pre-combustioncapture does not use any component that is of modular nature, soit is unlikely that it would have scale advantages over other CO2
capture technologies at smaller plant scales. Second, IGCC tech-nology is still in the early phase of market introduction and it isunlikely that small–medium scale IGCC power plants would bebuilt for district heating in the ST/MT.
For natural gas-fired plants, pre-combustion capture isreported to be significantly more expensive than other CO2
capture processes for 500 MWe scale condensing plants [62].However, for smaller scale systems such as simple GT–CHP plants,pre-combustion may enable lower energy penalty compared tochemical absorption capture. The IEA GHG [55] proposes a 5 MWe
system using autothermal reforming (ATR), water–gas shift reactorand pressure swing adsorption (PSA) for CO2 capture.
Table 6 presents the applicability of ST/MT CO2 capturetechnologies investigated and assessed in this section. Our litera-ture review indicated that the following smaller scale CO2 captureoptions may be economical when fitted to DH CHP plants:(1) chemical absorption for NGCC–CHP, and (2) chemical absorp-tion and (3) oxyfuel combustion for PC–CHP plants. In thefollowing section, the techno-economic performance of DH CHPplants with CO2 capture is investigated in detail.
4.2. Performance of ST/MT CO2 capture technologies for DH CHP
plants
Chemical absorption and oxyfuel combustion were consideredfor coal-fired CHP plants and chemical absorption was consideredfor NGCC–CHP plants. As noted in Section 3.2, full-scale coal-firedpower plants with and without CO2 capture were scaled down toone-tenth calculate the performance for smaller scale DH CHPplants.
A net heat to power ratio (HPR) of 1 was considered for PC–CHPplants and 0.5 for NGCC–CHP plants, respectively. For NGCC–CHPplants, it is unlikely that chemical absorption CO2 capture will befitted to plants operating at high HPR because of the competitionfor heat and the limit to the HPR that NGCC–CHP plants can reach.There are two options to enable relatively high net HPR whileachieving high CO2 capture efficiency (85–90%): (1) use auxiliaryboiler for additional heat, or (2) build a larger CHP plant withincreased electricity generation capacity, but both of these optionsmay not be economical. The first option is not recommendedbecause of increase in CO2 capture energy penalty since only
low-grade heat is generated from a high quality fuel. A significantcost increase in such configurations has been reported in [68].The second option requires larger capital investments and theincreased electricity generation can become problematic if theelectricity market is unfavorable for exporting excess electricityto the grid. In addition, for DG systems there is a technical limit ofthe grid to accept the electrical capacity [1] that generating largeamount of excess electricity may not be favorable.
4.2.1. Technical and economic parameters
The technical and economic performance for DH–CHP plantswith ST/MT CO2 capture was calculated based on the performancedata for full-scale condensing plants. To ensure that their perfor-mance data are comparable, the base performance data for coal-fired [81] and natural gas-fired plants [80] were taken from a setof reports prepared by the same group (NETL) published between2007 and 2008. Coal-fired plants were assumed to be bituminouscoal-fed supercritical plants.15
Regarding the calculation of technical and economic performancefor smaller scale plants, Table 7 shows the effect of scale on thetechnical performance of power plant and CO2 capture components.
The maximum total gross power and heat efficiency of CHPplants was limited at 95%. In case the CHP plant cannot meet CO2
capture energy demand for the nominal CO2 capture efficiencydue to the limit in maximum gross power and heat efficiency orthe minimum gross power efficiency, CO2 capture rate wasadjusted to the heat that can be generated.
Capital costs for the full-scale power plants, with and withoutCO2 capture, were broken down into key components. A scalingfactor for each component was applied to calculate total capitalcosts at smaller plant scales (Eq. (12)):
CX ¼X
i
CRef ,i �SX,i
SXRef ,i
� �SFi
( )ð12Þ
where CX is the capital cost for plant scale X (MWe), CRef,i is thecapital cost for the component i for the reference (full-scale)plant, SX,i is the capacity of component i for the plant scale X,SXRef,i is the capacity of component i for the reference plant scaleXRef, and SFi is the scaling factor for component i.
Table 8 shows the capital cost scaling factors for variouscomponents of power plants and CO2 capture processes investi-gated in this study.
4.2.2. Results
Table 9 shows the performance results for coal-fired DH CHPplants with and without CO2 capture for different plant scales(full-scale and one-tenth scale) for the operation at a net heat-to-power ratio (HPR) of 1. The results indicate slightly better netCHP efficiency for chemical absorption capture than for oxyfuelcombustion capture. The effect of increased specific power
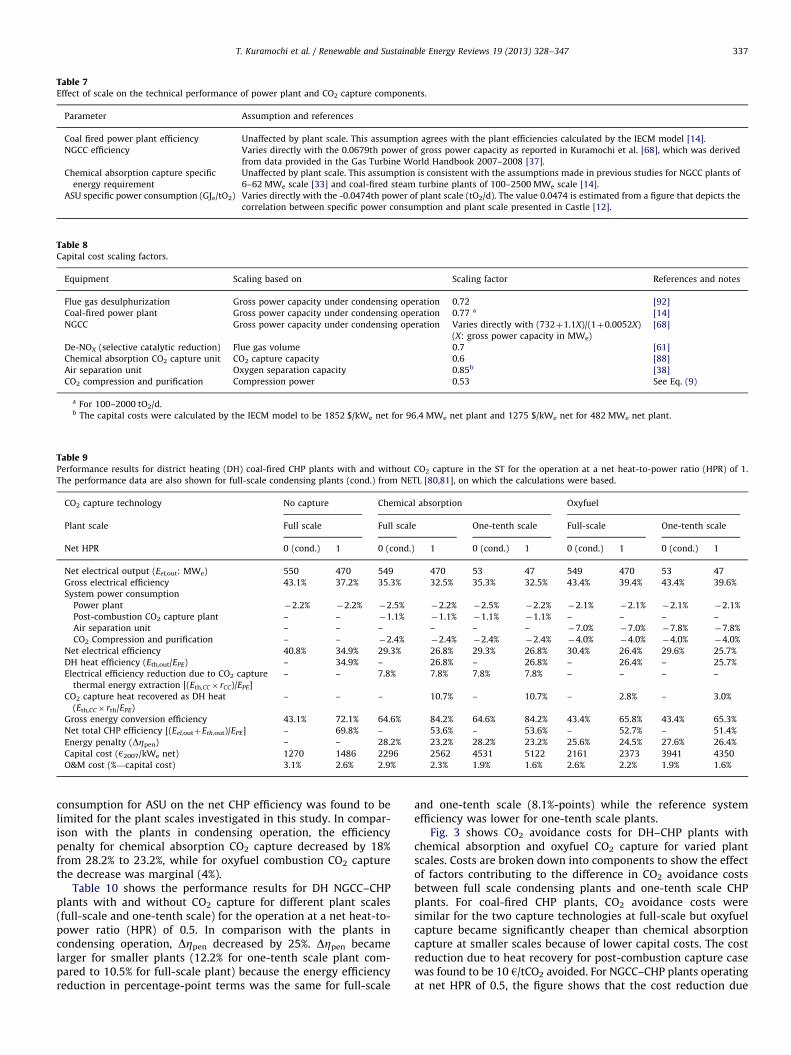
Table 7Effect of scale on the technical performance of power plant and CO2 capture components.
Parameter Assumption and references
Coal fired power plant efficiency Unaffected by plant scale. This assumption agrees with the plant efficiencies calculated by the IECM model [14].
NGCC efficiency Varies directly with the 0.0679th power of gross power capacity as reported in Kuramochi et al. [68], which was derived
from data provided in the Gas Turbine World Handbook 2007–2008 [37].
Chemical absorption capture specific
energy requirement
Unaffected by plant scale. This assumption is consistent with the assumptions made in previous studies for NGCC plants of
6–62 MWe scale [33] and coal-fired steam turbine plants of 100–2500 MWe scale [14].
ASU specific power consumption (GJe/tO2) Varies directly with the -0.0474th power of plant scale (tO2/d). The value 0.0474 is estimated from a figure that depicts the
correlation between specific power consumption and plant scale presented in Castle [12].
Table 8Capital cost scaling factors.
Equipment Scaling based on Scaling factor References and notes
Flue gas desulphurization Gross power capacity under condensing operation 0.72 [92]
Coal-fired power plant Gross power capacity under condensing operation 0.77 a [14]
NGCC Gross power capacity under condensing operation Varies directly with (732þ1.1X)/(1þ0.0052X)
(X: gross power capacity in MWe)
[68]
De-NOX (selective catalytic reduction) Flue gas volume 0.7 [61]
Chemical absorption CO2 capture unit CO2 capture capacity 0.6 [88]
Air separation unit Oxygen separation capacity 0.85b [38]
CO2 compression and purification Compression power 0.53 See Eq. (9)
a For 100–2000 tO2/d.b The capital costs were calculated by the IECM model to be 1852 $/kWe net for 96.4 MWe net plant and 1275 $/kWe net for 482 MWe net plant.
Table 9Performance results for district heating (DH) coal-fired CHP plants with and without CO2 capture in the ST for the operation at a net heat-to-power ratio (HPR) of 1.
The performance data are also shown for full-scale condensing plants (cond.) from NETL [80,81], on which the calculations were based.
CO2 capture technology No capture Chemical absorption Oxyfuel
Plant scale Full scale Full scale One-tenth scale Full-scale One-tenth scale
Net HPR 0 (cond.) 1 0 (cond.) 1 0 (cond.) 1 0 (cond.) 1 0 (cond.) 1
Net electrical output (Eel,out: MWe) 550 470 549 470 53 47 549 470 53 47
Gross electrical efficiency 43.1% 37.2% 35.3% 32.5% 35.3% 32.5% 43.4% 39.4% 43.4% 39.6%
System power consumption
Power plant �2.2% �2.2% �2.5% �2.2% �2.5% �2.2% �2.1% �2.1% �2.1% �2.1%
Post-combustion CO2 capture plant – – �1.1% �1.1% �1.1% �1.1% – – – –
Air separation unit – – – – – – �7.0% �7.0% �7.8% �7.8%
CO2 Compression and purification – – �2.4% �2.4% �2.4% �2.4% �4.0% �4.0% �4.0% �4.0%
Net electrical efficiency 40.8% 34.9% 29.3% 26.8% 29.3% 26.8% 30.4% 26.4% 29.6% 25.7%
DH heat efficiency (Eth,out/EPE) – 34.9% – 26.8% – 26.8% – 26.4% – 25.7%
Electrical efficiency reduction due to CO2 capture
thermal energy extraction [(Eth,CC� rCC)/EPE]
– – 7.8% 7.8% 7.8% 7.8% – – – –
CO2 capture heat recovered as DH heat
(Eth,CC� rth/EPE)
– – – 10.7% – 10.7% – 2.8% – 3.0%
Gross energy conversion efficiency 43.1% 72.1% 64.6% 84.2% 64.6% 84.2% 43.4% 65.8% 43.4% 65.3%
Net total CHP efficiency [(Eel,outþEth,out)/EPE] – 69.8% – 53.6% – 53.6% – 52.7% – 51.4%
Energy penalty (DZpen) – – 28.2% 23.2% 28.2% 23.2% 25.6% 24.5% 27.6% 26.4%
Capital cost (h2007/kWe net) 1270 1486 2296 2562 4531 5122 2161 2373 3941 4350
O&M cost (%—capital cost) 3.1% 2.6% 2.9% 2.3% 1.9% 1.6% 2.6% 2.2% 1.9% 1.6%
T. Kuramochi et al. / Renewable and Sustainable Energy Reviews 19 (2013) 328–347 337
consumption for ASU on the net CHP efficiency was found to belimited for the plant scales investigated in this study. In compar-ison with the plants in condensing operation, the efficiencypenalty for chemical absorption CO2 capture decreased by 18%from 28.2% to 23.2%, while for oxyfuel combustion CO2 capturethe decrease was marginal (4%).
Table 10 shows the performance results for DH NGCC–CHPplants with and without CO2 capture for different plant scales(full-scale and one-tenth scale) for the operation at a net heat-to-power ratio (HPR) of 0.5. In comparison with the plants incondensing operation, DZpen decreased by 25%. DZpen becamelarger for smaller plants (12.2% for one-tenth scale plant com-pared to 10.5% for full-scale plant) because the energy efficiencyreduction in percentage-point terms was the same for full-scale
and one-tenth scale (8.1%-points) while the reference systemefficiency was lower for one-tenth scale plants.
Fig. 3 shows CO2 avoidance costs for DH–CHP plants withchemical absorption and oxyfuel CO2 capture for varied plantscales. Costs are broken down into components to show the effectof factors contributing to the difference in CO2 avoidance costsbetween full scale condensing plants and one-tenth scale CHPplants. For coal-fired CHP plants, CO2 avoidance costs weresimilar for the two capture technologies at full-scale but oxyfuelcapture became significantly cheaper than chemical absorptioncapture at smaller scales because of lower capital costs. The costreduction due to heat recovery for post-combustion capture casewas found to be 10 h/tCO2 avoided. For NGCC–CHP plants operatingat net HPR of 0.5, the figure shows that the cost reduction due

Table 10Technical performance results for district heating (DH) NGCC CHP plants with and without CO2 capture for different plant scales for the operation at a net heat-to-power
ratio (HPR) of 0.5. The performance data are also shown for full-scale condensing plants (cond.) from NETL [80,81], on which the calculations were based.
CO2 capture technology No capture Chemical absorption capture
Plant scale Full scale One-tenth scale Full scale One-tenth scale
Net HPR 0 (cond.) 0.5 0.5 0 (cond.) 0.5 0.5
Net electrical output (Eel,out: MWe) 560 516 52 482 516 52
Gross electrical efficiency 57.4% 53.0% 45.3% 52.4% 50.1% 42.4%
System power consumption: Total �1.0% �1.0% �0.8% �3.9% �3.5% �3.4%
Power plant �1.0% �1.0% �0.8% �1.4% �1.0% �0.9%
Post-combustion CO2 capture plant – – – �1.0% �1.0% �1.0%
Air separation unit – – – – – –
CO2 compression and purification – – – �1.5% �1.5% �1.5%
Net electrical efficiency (Eel,out/EPE) 56.4% 52.0% 44.5% 48.5% 46.6% 39.0%
DH heat efficiency (Eth,out/EPE) – 26.0% 22.2% – 23.3% 19.5%
Electrical efficiency reduction due to CO2
capture thermal energy extraction [(Eth,CC� rCC)/EPE]
– – – 5.0% 5.0% 5.0%
CO2 capture heat recovered as DH heat (Eth,CC� rth/EPE) – – – – 6.9% 6.9%
Gross energy conversion efficiency a 57.4% 79.0% 67.6% – 89.4% 78.0%
Net total CHP efficiency [(Eel,outþEth,out)/EPE] – 78.0% 66.7% – 69.9% 58.6%
Energy penalty (DZpen) – – – 14.0% 10.5% 12.2%
Capital cost (h2007/kWe net) 445 483 864 942 1017 1520
O&M cost (%—capital cost) 2.8% 2.4% 2.0% 2.4% 2.4% 1.5%
a Gross energy conversion efficiency is defined as the sum of gross electricity output and gross thermal product ouput divided by the total primary energy input.
54
97
123115
39
70
9282
33
55
71 6862
0
20
40
60
80
100
120
140
160
Full
scal
e
10%
sca
le
Cap
acity
fact
or
Hea
tre
cove
ry
Tota
l
Full
scal
e
10%
sca
le
Cap
acity
fact
or
Hea
tre
cove
ry
Tota
l
Full
scal
e
10%
sca
le
Cap
acity
fact
or
Hea
tre
cove
ry
Cap
. cos
tre
duct
ion
Tota
l
Condensing CHP Condensing CHP Condensing CHP
NGCC: MEA PC: MEA PC: Oxyfuel
CO
2 avo
idan
ce c
ost (
€/to
nne)
Fig. 3. Difference in CO2 avoidance costs between full scale condensing plants (PC: 550 MWe, NGCC: 560 MWe) and 10% scale CHP plants caused by plant scale, capacity
factor, heat recovery, and capital cost reduction. The error bars represent sensitivity of the results due to varied energy prices, interest rate, economic plant lifetime and
capital costs.
T. Kuramochi et al. / Renewable and Sustainable Energy Reviews 19 (2013) 328–347338
to heat recovery is less than 10 h/tCO2 avoided. The figure alsoshows that the lower capacity factor of CHP plants comparedto centralized power plants increases the cost by more than25 h/tCO2 avoided.
4.3. Section summary
4.3.1. Energy penalty due to CO2 capture in the ST
The energy penalty due to CO2 capture (DZpen) was found tovary significantly by fuel type, energy system type and itsapplication (Table 5). For natural gas-fired systems, DZpen was
found to range between 28% for boilers down to 11% for NGCC-CHPplants operated in low net HPR by having a good heat integrationof the system. DZpen was found to be larger for smaller plantsbecause the efficiency reduction is similar for large and small scaleplants in percentage point terms while the reference systemefficiency of small scale plants is lower.
For coal-fired plants, DZpen of 33% was observed for coalboilers without steam turbine and around 23–28% for PC powerplants. The effect of scale on DZpen is smaller than with naturalgas-fired plants because the power plant electrical efficiency doesnot reduce as much as in gas-fired plants.

0
40
80
120
160
200
0001001011Fuel input scale (MWLHV)
CO
2 avo
idan
ce c
ost (
€/to
nne) Ind. NG boiler
Ind. PC boiler
Refinery gas furnace/boiler
Oxyfuel DH PC-CHP with heat recovery(results obtained in this study)DH NGCC-CHP with heat recovery (resultsobtained in this study)Ind. GT-CHP: Pre-combustion (ATR)
Ind.NGCC-CHP (60% load, low HPR)
50-150 €/tonne
30-140 €/tonne
Range: full-scale (550 MWe) condensing PC plant with MEA/oxyfuel
Fig. 4. CO2 avoidance costs reported in the literature (after normalization) or calculated in this study as a function of fuel input scale (logarithmic scale) for short-term
technologies.
T. Kuramochi et al. / Renewable and Sustainable Energy Reviews 19 (2013) 328–347 339
4.3.2. CO2 avoidance cost
Fig. 4 shows CO2 avoidance costs reported in the literature(after normalization) and calculated in this study as a function offuel input scale. The figure also shows the cost range for full-scalecondensing power plants (29–45 h/tonne). It can be concludedthat in the ST/MT, CO2 avoidance costs range between 30 and140 h/tonne for plant scales larger than 100 MWLHV (fuel input)and 50–150 h/tonne for 10–100 MWLHV. The CO2 avoidance costsfor DH–CHP plants calculated in this study are in line with therange of costs calculated for technologies presented in Table 5.From the results it is concluded that the more promising optionsare: (1) industrial NGCC–CHP plants with chemical absorptioncapture in low net HPR and low load operations, (2) oxyfuelcombustion capture from PC–CHP plants, and (3) some refinerygas-fired plants with oxyfuel combustion capture.
Fig. 4 indicates a clear effect of scale on CO2 avoidance costs,with the exception of oxyfuel combustion CO2 capture for refinerygases. The differences observed are caused by two key reasons.First, the degree of furnace/boiler efficiency improvement byconverting to oxyfuel combustion differs by furnace/boiler type.Second, the amount of oxygen required depends on the composi-tion of the refinery gas.
The uncertainty on costs becomes significantly larger forsmaller scale CO2 capture than for large-scale capture mainlybecause of the higher specific capital costs. However, small scaleCO2 capture may still become competitive to large-scale captureunder specific circumstances, e.g., low interest rate combinedwith low energy prices.
16 The MCFC plant CO2 production is ultimately contained in the cathode
outlet flow where CO2-rich gas is diluted by air [9].17 These values are much higher than the limit for chemical absorption
capture using MEA, which is reported to be 10 ppm [15].18 In the literature, the following concerns have been named: (1) molten
carbonate is a corrosive material operating at high temperatures, making it
difficult to handle; (2) high temperatures necessary for cell operation are
5. Assessment of long-term CO2 capture technologies
Table 11 shows the technical and economic performance datafor small–medium scale installations with CO2 capture technolo-gies that may become available in the LT. As noted in theintroduction, this section focuses on the CO2 capture technologyitself, rather than on the combination of CO2 capture technologiesand energy system types for different applications. In many of theproposed systems, CO2 capture process is comprised entirely or
partially of membranes. As it was done in the previous section, wealso assessed the applicability of large scale technologies forsmaller scale emission sources.
5.1. Post-combustion capture
There are several studies in the literature that investigated thetechno-economic performance of various membrane-based CO2
capture technologies. A brief description of different types ofmembranes under investigation follows.
5.1.1. Ceramic membranes: Molten carbonate fuel cell as a CO2
separator
Molten carbonate fuel cell (MCFC) may become not only apower generation technology of the future but also a cost-effective CO2 concentrator. In an MCFC stack, CO2 is used ascathode fuel to generate electricity and it transports to anode sideof the cell in the form of carbonate ions (CO3
2�). As a result, anodeoff-gas has a high concentration of CO2. A large fraction of this gasis recycled back to the cathode inlet to supply CO2 in conventionalMCFC systems.16 However, the CO2-rich anode off-gas can also besent to a purification and compression process if there is anexternal source of CO2 that can be fed to the cathode, e.g., flue gasof combustion plants.
Several studies modeled and experimented systems to captureCO2 from conventional combustion plant flue gas using MCFC[2,9,19,73,97,102]. A pilot plant demonstrated a stable operationof CO2 separation from the flue gas of a coal fired power plantwith a SO2 concentration of 20–70 ppm17 for 2000 h with littlefuel cell voltage degradation, indicating a possible continuousoperation of 40,000–50,000 h [102]. Although a number of concerns18

Table 11Energy, economic and CO2 performance data for small–medium scale installations with long term CO2 capture technologies reported in the literature.
Scale Fuel
type
Energy plant type Plant
scale
CO2 capture
technology
CO2 capture
efficiency (%)
Conversion
efficiency
(Z) (%)
Energy penalty
(DZpen)
Capital cost O&M cost Reference
[MW output] [h/kW
output] (%)
[%-capital
cost]
Condensing/CHP
plants
Medium
(5–50 MWe)
Natural
gas
SOFC-CHP (industrial) 5 Oxyfuel (stand-alone
ASU)
94 a 53 5 2100 b 6 [69]
SOFC-GT-ST 20 Oxyfuel (integrated
OCM)
100 59 –c 2400 3 [71]
AZEP (condensing) 50 Oxyfuel (membrane-
based)
85–100 49–50 5–9 1900–2100 4 [74]
Small (0.005–
o5 MWe)
Natural
gas
SOFC-CHP (DH) 0.5 OCM 100 52 5 2500 4 [55]
SOFC-GT Oxyfuel (stand-alone
ASU)
100 58 4 d 1600 4 [32]
Boilers Medium
(5–50 MWe)
Natural
gas
Boiler (industrial and DH) 170 Oxyfuel (OCM) 92 93 4 130–360 5 [100,55]
Coal Boiler (industrial) 50 Oxyfuel (OCM) 86–98 81 6–8 560–680 4 [55]
H2 plants Small (0.005–
5 MWe)
Natural
gas
WGSMR (refueling, DH) 1.7 Pre-combustion 57 69 4 770 b 15 [95]
Natural
gas
WGSMR (refueling, DH):
current technology level
0.9 Pre-combustion 50 67 9 2800 N.A. [70]
Others Various Various MCFC using external CO2 as
cathode fuel
4 MCFC
(electro-chemical)
100–200 26–31 21–36 2700–2900 16 Own estimate based
on [31] e
a The reported CO2 purity is 84%. Therefore, the CO2 capture efficiency was recalculated as described in Section 3.4.b Compressor costs are recalculated using Eq. (9).c The reference literature compares the technical performance with a conventional NGCC of identical scale with an electrical conversion efficiency of 40% [71]. We considered the comparison to be unfair because the state-of-
the-art NGCC of similar scale (L20A-1, 25 MWe net) already shows 48.6% efficiency (LHV) [37].d The referenced study does not discuss the lifetime of fuel cell stacks and the costs for cell stack replacement. Therefore, it is not clear how these costs are taken into account. The referenced study also does not provide
separate cost figures for variable O&M costs (chemicals, water, etc.). These costs, however, are reported to be of limited influence on total costs [89].e Frangini [31] estimates that the electrical efficiency of MCFC decreases by 10% when using coal combustion flue gas and by 30% when using natural gas combustion flue gas compared to the conventional operation of
recycling the anode off-gas as cathode fuel. While the Frangini study uses the current cost for the MCFC system, we assumed that the capital cost decreases to one-tenth of the current level in the LT. This is equivalent to around
1200 h/kWe without CO2 capture, which is roughly in line with the predictions presented in Araki and Keppo [4]. The electrical efficiency is assumed unchanged in the LT.
T.
Ku
ram
och
iet
al.
/R
enew
ab
lea
nd
Susta
ina
ble
En
ergy
Rev
iews
19
(20
13
)3
28
–3
47
34
0

0%
10%
20%
30%
40%
50%
60%
70%
80%
90%
100%
SMCTSMSSMSSMCTSMSSMS
Feedcompression
deeFetaemrep muucaVcompression
Vacuum permeate
stsoc gnitarepOstsoc latipaC
Energy
CO2 compressor
Feed gas compressors
Coolers
Membrane
FGD
Drying
General
Fig. 5. Breakdown of capital costs and operating costs for CO2 separating polymeric membranes operating under vacuum permeate and feed compression conditions.
SMS: single stage membrane system, TCMS: two stage cascade membrane system. Source: Adapted from Ho et al. [41].
T. Kuramochi et al. / Renewable and Sustainable Energy Reviews 19 (2013) 328–347 341
over the practicality of CO2 capture from flue gas using MCFC hasbeen expressed [87], this unique combination of power generationand ‘‘active’’ CO2 concentration (as opposed to ‘‘passive’’ CO2 con-centration, which consumes large amount of energy) could become aviable solution in the future [11].
5.1.2. Polymer-based membranes
CO2 capture using commercially available polymeric mem-branes have resulted in higher energy penalties compared tochemical absorption processes [59], but significant performanceimprovement is expected in the future. Polymeric membrane CO2
separation is driven by the partial CO2 pressure differencebetween the feed and permeate gases by either using a compres-sor on the feed side or a vacuum-pump on the permeate side.
Polymeric membrane separation may become economicallyattractive for smaller scale emission sources although there is nofeasibility study for smaller scale applications available. This ispartly because many studies on polymeric membrane-based CO2
separation focus on coal combustion due to the high CO2
concentration in the flue gas. Literature suggests that the use ofvacuum pumps to increase the partial pressure difference reducesenergy consumption considerably19 [28,41,114] and possibly totalcapital costs [41]. The fraction of membranes in the total capitalcosts (39–47%) is considerably larger (5%) for vacuum pump-driven systems than for compressor-driven systems (see Fig. 5).This is favorable for smaller scale CO2 capture because the capitalcost increase resulting from the scale-down of the plant may belimited.
5.1.3. Facilitated transport membranes
Matsumiya et al. [76] report that facilitated transport mem-branes show better energy and economic performance than
(footnote continued)
extremely difficult for integration into a post-combustion application; (3) only
small voltage is allowable to avoid decomposition of the molten carbonate,
leading to a huge stack requirement; (4) sensitivity to the contaminants such as
SO2.19 The required membrane area becomes much larger for vacuum pump-
driven systems due to the lower pressure ratio, but the consequent cost increase
could be offset by the omission of expensive feed gas compressor.
polymer membranes. The essential element of facilitated transportmembranes is the specific chemical interaction of a gas componentwith a compound present in the membrane, the so-called carrier[59]. Carbonates, amines and molten salt hydrates have beensuggested as carriers for CO2 separation. The separation processis driven by the difference in partial pressure of the component tobe transported [59].
5.1.4. Membrane-gas hybrid processes
Membrane gas absorption (MGA) combines the advantagesof absorption (high selectivity) and membrane technologies(modularity and small size) [29]. A porous, water repellent,polymeric membrane separates the gas phase (feed gas) fromthe liquid phase (absorbent). CO2 in the flue gas diffuses throughthe membrane and gets absorbed into the liquid absorbent. TheCO2-rich absorbent is regenerated by heating it in a stripper, justas in a conventional chemical absorption process. It is suggestedthat the MGA process may enable lower CO2 capture costcompared to conventional chemical absorption process at smallerplant scales due to its modular nature [55]. There are, however,studies that suggest otherwise; capital costs are dominated bycomponents other than the membrane module such as the CO2
stripper tower [35,111].20
The membrane flash process investigated by RITE e.g., [76,85]may become suitable for small-scale applications. In this process,the feed gas and carrier solution are both supplied to the high-pressure feed side of the hollow fiber membrane module. Drivenby the vacuum pump at the permeate side, the CO2-rich solutionpermeates the membrane and liberates the dissolved CO2 at thepermeate side of the membrane. The system proposed by Matsumiyaet al. [76] uses neither absorber nor desorber towers. Therefore,the membrane module is reported to account for about 60% oftotal capital costs (excluding FGD, including CO2 purification andliquefaction) [76].
20 Grønvold et al. [35] shows that the fraction of membrane contactor in total
capital cost (excluding FGD and including CO2 compression unit) is only 14%. The
cost estimates from Yan et al. [111] shows that also for a smaller plant scale of
2.9 kg CO2/s captured, the fraction of membrane contactor in total capital cost
(excluding both FGD and CO2 compression units) is less than 30%.

21 The referenced study defines the timeframe ‘‘up to 2025’’. However, taking
into account the recent developments for commercialization of SOFC, it is more
likely that CO2-capture SOFC systems will be introduced to the market after 2030.
T. Kuramochi et al. / Renewable and Sustainable Energy Reviews 19 (2013) 328–347342
5.2. Oxyfuel combustion capture
Oxygen conducting membranes (OCM) is a promisingadvanced air separation technology. OCM is a ceramic membranemade of perovskites, which have both electronic and oxygen ionicconductivity when operated at high temperatures around 700 1Cto 900 1C [3]. Oxygen ions are transferred under a gradient ofoxygen partial pressure on the opposite side of the membrane.OCM can produce oxygen of very high purity, above 99% [96].A high level of system integration can be achieved for gas-firedboilers. In a gas-fired boiler system proposed by Switzer et al.[100], the gradient of oxygen partial pressure is generated byplacing a fuel combustor at the permeate side of the membrane.
Another oxyfuel combustion-based technology that may becomeeconomically competitive for smaller scale gas-fired power genera-tion is the advanced zero emission power (AZEP) concept. A generaldescription of the AZEP technology can be found in, e.g., [21,74,98].The key component is a mixed conducting membrane (MCM)reactor. Compressed air flows through the MCM reactor, whereoxygen is separated and directed to the combustion chamber. Thecombustion heat is transferred to O2-depleted compressed air viathe MCM reactor. Electricity is generated from an expansion of thehot O2-depleted compressed air in a gas turbine and an expansion ofsteam generated from the gas turbine exhaust gas, just like in aconventional NGCC plant. A modeling study indicates that the AZEPplant may perform better at smaller scales (about 50 MWe) than atlarge scales (around 400 MWe) because of the smaller difference incombustor outlet temperature between the reference NGCC andAZEP plant resulting in smaller energy penalty [74]. Although thereare still technical challenges in the MCM development [21], it maybecome an attractive option for medium-size DG.
5.3. Pre-combustion CO2 capture: Hydrogen plants
Small-scale H2 production plants may serve as refuelingstations for future hydrogen vehicles as well as for district andresidential fuel cell systems. Water gas shift membrane reactor(WGSMR) technology suits well for these applications because ofits modular nature. In addition, WGSMR technology is expected toenable cheap CO2 capture [95]. Tokyo Gas has been running120 kW scale demonstration units since 2004 [70]. CO2 avoidancecost estimates for 2020 are reported to be well above 100 h/tonne[70], but the long-term durability of the membranes still remainsa challenge [93]. We therefore did not consider the cost figuresreported by [70] to be representative of commercial small-scaleH2 generation technologies either in the ST/MT or the LT. Never-theless, the cost estimates reported in Sjardin et al. [95] shown inTable 11 should be achievable in the longer term.
5.4. Fuel cell systems: Solid oxide fuel cells (SOFC)
Solid oxide fuel cell (SOFC) consists of electrolytes made of asolid, non-porous metal oxide (Y2O3-stabilized ZrO2), and it oper-ates at 600–1000 1C where ionic conduction by oxygen ions takeplace [25]. SOFC is seen as a promising future energy conversiontechnology for DG systems [107] for two reasons. First, SOFCenables high electrical conversion efficiency for both large andsmall scale systems. In particular, SOFC hybrid systems, whichintegrate SOFC with GT or steam turbine, may achieve electricalconversion efficiency as high as 70% (an overview of literature canbe found in, e.g., [107]). Second, SOFC has a potential to enablecheap CO2 capture. In a SOFC system, oxygen is transportedthrough the electrolyte from the cathode side to the anode side,where the fuel is oxidized. Therefore, for natural gas-fed SOFCsystems, CO2 contained in the anode off-gas as a result of reformingis not diluted by nitrogen and is potentially easy to capture.
An overview of capture technologies applicable for SOFCsystems can be found in, e.g., Kuramochi et al. [69] 21 and Damenet al. [21]. A review study by Wee [107] suggests that the SOFChybrid systems of 1–100 MWe scale may achieve electrical con-version efficiency higher than 60% even when equipped with CO2
capture. Moreover, recent literature [18] indicates that an11 MWe
coal-powered CO2 capture SOFC system comprised of chemicallooping hydrogen generation process and SOFC/gas turbine cyclecan achieve a high net electrical efficiency of more than 43%.
Although SOFC is currently considered to be too expensive forcommercialization, the potential for cheap CO2 capture fromadvanced fuel cell technologies such as SOFC may facilitate themarket introduction of these fuel cells in a carbon-constrainedsociety [68]. To date, however, there are only a few studies thatexplored the techno-economic performance of CO2 capture fromSOFC systems ([32,55,69,71], see Table 11).
5.5. Results
As seen in Table 11, the energy penalty for advanced small–medium scale energy conversion technologies due to CO2 capturecompared with the identical plant without CO2 capture (DZpen)reported in the literature ranged between 4% and 9% for CO2
capture efficiency of 85–100%. These values are significantlysmaller than those reported for ST/MT technologies because theadvanced systems are designed to capture CO2.
Fig. 6 shows CO2 avoidance costs for distributed energysystems based on advanced technologies as a function of fuelinput scale. Note that the performance of SOFC–GT–ST hybridsystem [71] was compared with that of the reference NGCC plant(50 MWe) used for the AZEP power technology because theperformance of an identical SOFC–GT–ST plant without CO2
capture is not reported in the referenced study [71]. The calcula-tions were performed for different capacity factors: 7500 h/yr and5000 h/yr. Note that these cost estimates assume that the tech-nologies are mature. CO2 avoidance costs range around 10–90h/tonne for plant scales larger than 100 MWLHV, 25–100 h/tonnefor 10–100 MWLHV and 35–150 h/tonne for 10 MWLHV or smaller.
The impact of capacity factor assumption on cost performanceis significant (10–30 h/tonne increase in CO2 avoidance cost) forsome capital-intensive technologies that competes economicallywith conventional technologies by demonstrating a considerablyhigher energy efficiency, e.g., SOFC systems and H2 membranereactors. For boilers, the impact is limited because of limitedadditional capital costs. The economies of scale is not clear fromFig. 6; there are a number of possible explanations for this result.First, some technologies reported for smaller scale systems maybe more advanced than those reported for larger scale systems.Second, there is more uncertainty in the performance data of LTtechnologies because they are studied in less detail compared toST/MT CO2 capture technologies, for which case-specific feasibilitystudies are available.
6. Combined results
Fig. 7 combines the short- and long-term CO2 avoidance costresults presented in Figs. 4 and 6. The two colored bands roughlyshow the range of CO2 avoidance costs for short-term and long-termtechnologies, respectively. In the ST/MT, CO2 avoidance costs wouldrange between 40 and 160 h/tonne for plant scales larger than100 MWLHV, 60–200 h/tonne for 10–100 MWLHV and 80–200 h/tonne

Fig. 6. CO2 avoidance costs reported in the literature as a function of fuel input scale (logarithmic scale) for long-term technologies. It is shown that the reduced load leads
to considerably higher costs.
0
20
40
60
80
100
120
140
160
0001001011Fuel input scale (MWLHV)
CO
2 avo
idan
ce c
ost (
€/to
nne)
LT technologies: □
ST technologies: ■
Fig. 7. CO2 avoidance costs reported as a function of fuel input scale (logarithmic scale) for short-term and long-term technologies. The clusters and its borders are only for
illustrative purposes.
T. Kuramochi et al. / Renewable and Sustainable Energy Reviews 19 (2013) 328–347 343
or more for 10 MWLHV or smaller. For the LT, it was estimated thatthe CO2 avoidance costs may range between 10 and 40 h/tonnefor plant scales larger than 100 MWLHV, 10–80 h/tonne for 10–100MWLHV and 10–120 h/tonne for 10 MWLHV or smaller.
7. CO2 compression and distributed transport costs
In this section, the costs of CO2 compression and distributedtransport between the CO2 capture site and trunk pipeline using
branch pipeline and truck are evaluated. The schemes of twotransport options compared were presented in Fig. 2 and theparameters used for the calculations were presented in Table 4.Note that the assumptions on the transport distance (30 km) andthe lack of network for distributed CO2 collection is conservative.Many distributed emission sources would be located within adistance far less than 30 km from the nearest trunk pipeline oncea large-scale CO2 transport infrastructure is developed.
Fig. 8 shows the CO2 compression and distributed transportcosts calculated for the two options while Fig. 9 shows the

T. Kuramochi et al. / Renewable and Sustainable Energy Reviews 19 (2013) 328–347344
breakdown of the costs by component for different transportscales. Truck transport became cheaper than pipeline transportfor emission sources smaller than around 200 tCO2/d (equivalentto combustion plants of 20–30 MWLHV natural gas input) becauseof lower investment costs. As shown in Fig. 9, the costs weredominated by CO2 compression (65% at the lowest) and the costfor transport itself is small (35% at the highest) for all scales. Forlarger scales when branch pipeline transport is the cheapest, thebranch pipeline cost was about 5 h/tonne (see 500 t/d in Fig. 9).For smaller scales, when truck transport is the cheapest, the costwas about 6 h/tonne and is unaffected by the scale (see 5 and
0
10
20
30
40
50
60
70
80
90
100
0 100 200 300 400 500Volume of transported CO2 (tonne/day)
CO
2 com
pres
sion
and
inte
rmed
iate
tran
spor
t cos
t (€ 2
007/t
onne
tran
spor
ted)
0 20 40 60 80 100Plant scale (MWLHV natural gas)
Truck: 30 km
Pipeline: 30 km
Minimum of the two options
Fig. 8. Small scale CO2 transport costs as a function of transported CO2 volume
per day.
0
20
40
60
80
100
Truck Pipeline Truck Pipeline Truck
5 t/d 100 t/d 200
Com
pres
sion
and
inte
rmed
iate
tran
spor
t cos
t(€
/tCO
2 tr
ansp
orte
d)
>300 €/tonne
Fig. 9. Breakdown of CO2 compressio
100 t/d in Fig. 9). Fig. 9 also shows that the CO2 recompressioncost for the truck transport option is negligible.
Our results were in line with those from IEA GHG study [56],which reports a marginal cost of 34 $/tCO2 transported (about25 h2007/tCO2) for collecting 0.7 MtCO2/yr from 49 sources (average14 ktCO2/yr per source). This referenced study assumed a branchtransport network using high density polyethylene (HDPE) pipeswith the CO2 transport driven by vacuum pumps.
8. Discussion
The results obtained in this study and their main uncertaintiesand sensitivities have been discussed in their respective sections.In this section, we mainly discuss the limitations of this study andthe implications of the obtained results in relation to the expectedfuture CO2 price.
A number of limitations of this study are identified. First, theliterature survey showed that there are only a few studiesavailable on the techno-economic feasibility of CO2 capture fromdistributed energy systems. For many energy conversion techno-logies with CO2 capture, there was only one techno-economicstudy available. Therefore, it was difficult to assess whether thereported values are reliable. Moreover, some of the reportedeconomic performance data may be outdated. Furthermore, manystudies do not have clear definition of ‘‘capital cost’’ because thesestudies are of an order-or-magnitude analysis nature.
Second, the results obtained in this study may be sensitive tothe reference technologies selected for comparison. In this study,we compared identical energy conversion plants with and with-out CO2 capture. However, since DG systems will always becompared with centralized generation systems, the economiccompetitiveness of CO2 capture-fitted DG systems will likelydepend largely on the local energy market circumstances of theCO2 capture site. Moreover, advanced energy conversion systemsinvestigated in this study are designed to capture CO2 and it maynot make economical sense to apply the technology without CO2
capture. In such a case, the competitor of an advanced energy
Pipeline Truck Pipeline
t/d 500 t/d
Transport
Temporary storage
Recompression: capitaland O&M
Recompression: electricity
Onsite compression:electricity
Onsite compression: capitaland O&M
n and distributed transport costs.

T. Kuramochi et al. / Renewable and Sustainable Energy Reviews 19 (2013) 328–347 345
system with CO2 capture would be conventional energy conver-sion systems and therefore, the CO2 mitigation performanceresults may differ significantly from those reported in this study.
The third limitation relates to the nature of distributed energysystems. In this study, the uncertainty of CO2 avoidance costs wasfound to be considerably larger than that for large-scale centra-lized power plants. This is logical because decentralized energyconversion systems show a much larger diversity in their opera-tional conditions (e.g., load factor and heat-to-power ratio)compared to centralized power plants.
9. Conclusions
CO2 emissions from distributed energy systems may becomesignificant; accounting in 2030 for about 20% of the current globalenergy-related CO2 emissions. This study assessed and comparedthe technical and economic performance of CO2 capture techno-logies for distributed energy systems. We took into account thediversity in type of generator technologies used, applications,plant scales, operational patterns and timeframe in which thetechnologies may become commercial. We also investigated thecompression and distributed transport of captured CO2 betweenthe capture site and trunk pipeline. The study covered CHP plants,boilers and distributed hydrogen plants. The following conclu-sions are drawn:
In the ST/MT, the energy penalty due to CO2 capture (DZpen)varies significantly by fuel type, energy system type and itsapplication. For natural gas-fired installations, DZpen was foundto range between 28% for boilers down to 11% for NGCC-CHPplants. For coal-fired installations, DZpen of 33% was found for coalboilers and around 23–28% for PC power plants. It can beconcluded that in the short-term (around 2020–2025), CO2
avoidance costs range between 30 and 140 h/tonne for plantscales larger than 100 MWLHV (fuel input) and 50–150 h/tonnefor 10–100 MWLHV. The most promising smaller-scale optionsidentified are: (1) industrial NGCC–CHP plants with chemicalabsorption capture in low net HPR and low load operations,(2) oxyfuel combustion capture from PC–CHP plants, and (3) oxy-fuel combustion capture from some refinery gas-fired plants.
We also investigated the heat integration potentials between apower plant and a CO2 capture process. For chemical absorptioncapture, it was suggested that up to 30% of the solvent regenera-tion heat can be recovered in the form of hot water for DHwithout additional capital cost. For oxyfuel combustion capturefrom coal-fired plants, it was suggested that 30% of the energyconsumption for ASU and CO2 compression can be recovered andabout 5% reduction of capital cost can be achieved by heatintegration. The resulting reduction of CO2 avoidance costs,however, was found to be up to 10 h/tCO2 for post-combustioncapture and around 3 h/tCO2 for coal-fired oxyfuel capture.
In the long-term future, a number of advanced CO2 capturetechnologies using oxygen separation membranes have beenfound for both coal and natural gas-fired systems. Membrane-based oxyfuel combustion processes increases the furnace/boilerefficiency without significant electricity consumption. Other pro-mising technologies include solid oxide fuel cells (SOFC) forpower and CHP applications, and water–gas shift membranereactor (WGSMR) for hydrogen production. For coal-fired powerplants, there are also a number of advanced post-combustioncapture technologies that may enable low-cost CO2 capture atsmall scales, including modified molten carbonate fuel cells(MCFC) and polymer-based membranes.
The energy penalty due to CO2 capture (DZpen) was found torange around 4–9%. Regarding the economic performance, it wasconcluded that in the LT, CO2 avoidance costs would be around
10–90 h/tonne for plant scales larger than 100 MWLHV, 25–100h/tonne for 10–100 MWLHV and 35–150 h/tonne for 10 MWLHV
or smaller. The influence of the capacity factor is significant forsome technologies that demonstrate considerably higher energyefficiency than the conventional technologies but are also morecapital cost-intensive. The economies of scale on CO2 avoidancecosts was not clear due to lack of data points and the possibilitythat some smaller scale technologies are more advanced than thelarger scale technologies reported.
Our results also show that CO2 compression and distributedtransport costs could be significant. For the distance of 30 km,10 h/tonne was calculated for scales below 500 tCO2/day andmore than 50 h/tonne for scales below 5 tCO2/day (equivalent to1 MWLHV natural gas). CO2 compression accounted for the vastmajority of these costs. Transport distance was found to havelimited influence. The results indicate that the reduction of CO2
compression cost, which is closely linked to the CO2 transportmode, may become a key to economical CO2 capture for smallerscale energy systems.
The results of this article highlight the possibilities for cost-effective CO2 capture in distributed energy systems in case CO2
transport and storage infrastructure has been developed. Thecosts of CO2 capture are not prohibitively expensive even in theST/MT and have a significant cost reduction potential in the LT.CCS from distributed emission sources would also contribute tothe economies of scale of CO2 transport and storage. However,further research is required to have better understanding on thepotential of CO2 capture in distributed energy systems. Examplesare: (1) analysis on the minimization of CO2 compression anddistributed transport costs by comparing various system config-urations, and (2) exploring the possibilities to extend annualoperation time for DH CHP plants to enable more cost-effectiveCO2 capture.
Acknowledgements
This research is part of the CAPTECH programme. CAPTECH issupported financially by the Dutch Ministry of Economic Affairsunder the EOS programme. More information can be found at www.co2-captech.nl.
References
[1] Ackermann T, Andersson G, Soder L. Distributed generation: a definition.Electric Power Systems Research 2001;57:195–204.
[2] Amorelli A, Wilkinson MB, Bedont P, Capobianco P, Marcenaro B, Parodi F,et al. An experimental investigation into the use of molten carbonate fuelcells to capture CO2 from gas turbine exhaust gases. Energy 2004;29:1279–84.
[3] Anheden M, Yan J, De Smedt G. Denitrogenation (or oxyfuel concepts).Oil and Gas Science and Technology 2005;60:485–95.
[4] Araki T, Keppo I. Influence of technological learning of advanced energyconversion technologies on future energy perspectives. Laxemburg, Austria:IIASA; 2005.
[5] Aspelund A, Sandvik TE, Krogstad H, De Koeijer G. Liquefaction of capturedCO2 for ship-based transport. In: Wilson M, Morris T, Gale J, ThambimuthuK, editors. Seventh international conference on greenhouse gas controltechnologies. Vancouver, Canada: Elsevier Ltd.; 2004. p. 2545–50.
[6] Barreto L, Makihira A, Riahi K. The hydrogen economy in the 21st century: asustainable development scenario. International Journal of HydrogenEnergy 2003;28:267–84.
[7] Bolland O, Undrum H. A novel methodology for comparing CO2 captureoptions for natural gas-fired combined cycle plants. Advances in Environ-mental Research 2003;7:901–11.
[8] Campanari S. Thermodynamic model and parametric analysis of a tubularSOFC module. Journal of Power Sources 2001;92:26–34.
[9] Campanari S. Carbon dioxide separation from high temperature fuel cellpower plants. Journal of Power Sources 2002;112:273–89.
[10] Campanari S. Carbon dioxide separation from high temperature fuel cellpower plants. Journal of Power Sources 2002;112:273–89.

T. Kuramochi et al. / Renewable and Sustainable Energy Reviews 19 (2013) 328–347346
[11] Caprile L, Passalacqua B, Torazza A. Carbon capture: energy wastingtechnologies or the MCFCs challenge? International Journal of HydrogenEnergy 2011;36:10269–77.
[12] Castle WF. Air separation and liquefaction: recent developments andprospects for the beginning of the new millennium. International Journalof Refrigeration 2002;25:158–72.
[13] CCP. Carbon dioxide capture for storage in deep geologic formations—
results from the CO2 capture project. Vol. 1: capture and separation ofcarbon dioxide from combustion sources. UK: Elsevier, Oxford; 2005.
[14] CEEM CMU. Integrated environmental control model version 6.2.4. PA, USA:Department of Engineering & Public Policy, Carnegie Mellon University,Pittsburgh; 2010.
[15] DG Chapel, CL Mariz, J Ernest. Recovery of CO2 from flue gases: commercialtrends. Canadian Society of Chemical Engineers annual meeting. Saskatoon,Saskatchewan, Canada; 1999.
[16] Chemical Engineering. Chemical Engineering Plant Cost Index. AccessIntelligence, LLC, Rockville, MD, USA, 2010.
[17] ChemSOF. 2011. EOS property calculation spreadsheet. Retrieved on 8 April./http://www.chemsof.com/S.
[18] Chen S, Xue Z, Wang D, Xiang W. An integrated system combining chemicallooping hydrogen generation process and solid oxide fuel cell/gas turbinecycle for power production with CO2 capture. Journal of Power Sources2012;215:89–98.
[19] Chiesa P, Campanari S, Manzolini G. CO2 cryogenic separation fromcombined cycles integrated with molten carbonate fuel cells. InternationalJournal of Hydrogen Energy 2011;36:10355–65.
[20] Damen K, Faaij A, Turkenburg W. Pathways towards large-scale implemen-tation of CO2 capture and storage: a case study for the Netherlands.International Journal of Greenhouse Gas Control 2009;3:217–36.
[21] Damen K, van Troost M, Faaij A, Turkenburg W. A comparison of electricityand hydrogen production systems with CO2 capture and storage. Part A:Review and selection of promising conversion and capture technologies.Progress in Energy and Combustion Science 2006;32:215–46.
[22] Damen K, van Troost M, Faaij A, Turkenburg W. A comparison of electricityand hydrogen production systems with CO2 capture and storage. Part B:Chain analysis of promising CCS options. Progress in Energy and CombustionScience 2007;33:576–605.
[23] de Visser E, Hendriks C, Barrio M, Molnvik MJ, de Koeijer G, et al. DynamisCO2 quality recommendations. International Journal of Greenhouse GasControl 2008;2:478–84.
[24] Desideri U, Corbelli R. CO2 capture in small size cogeneration plants:technical and economical considerations. Energy Conversion and Manage-ment 1998;39:857–67.
[25] EG&G Technical Services Inc. Fuel cell handbook (seventh ed.). US Depart-ment of Energy, National Energy Technology Laboratory, 2004.
[26] EPA. Catalogue of CHP technologies. U.S. Washington DC, USA: Environ-mental Protection Agency; 2008.
[27] Farla JCM, Hendriks CA, Blok K. Carbon dioxide recovery from industrialprocesses. Climatic Change 1995;29:439–61.
[28] Favre E. Carbon dioxide recovery from post-combustion processes: can gaspermeation membranes compete with absorption? Journal of MembraneScience 2007;294:50–9.
[29] Feron PHM, Jansen AE. CO2 separation with polyolefin membrane contac-tors and dedicated absorption liquids: performances and prospects. Separa-tion and Purification Technology 2002;27:231–42.
[30] Fontell E, Kivisaari T, Christiansen N, Hansen J-B, Palsson B. Conceptualstudy of a 250 kW planar SOFC system for CHP application. Journal of PowerSources 2004;131:49–56.
[31] Frangini S, Celle a Combustibile a Carbonati Fusi per la cattura di CO2 da gascombusti: prospettive e limiti di applicazione in settori industriali soggettialla Direttiva EU-ETS (Molten carbonate fuel cells for CO2 capture from fluegases: prospects and limits of application in industrial sectors subject toEU-ETS Directive). Agenzia Nazionale per le Nuove Technologie, l’Energia elo Sviluppo Economico Sostenibile (ENEA), 2010.
[32] Franzoni A, Magistri L, Traverso A, Massardo AF. Thermoeconomic analysisof pressurized hybrid SOFC systems with CO2 separation. Energy 2008;33:311–20.
[33] Gelowitz D, Kritpiphat W, Tontiwachwuthikul P. Cogeneration concepts forCO2 separation from power plants for enhanced oil recovery applications.Energy Conversion and Management 1995;36:563–6.
[34] Gode J, Hagberg L. Systemanalys av CCS vid kraftvarme (System analysis ofCCS at CHP). B1870, IVL Svenska Miljoinstitutet, Stockholm, Sweden, 2008.
[35] Grønvold MS, Falk-Petersen O, Imai N, Ishida K., KPS menbrane contactormodule combined with Kansai/MHI advanced solvent KS-1 for CO2 separa-tion from combustion flue gases. 2005.
[36] Graves C, Ebbesen SD, Mogensen M, Lackner KS. Sustainable hydrocarbonfuels by recycling CO2 and H2O with renewable or nuclear energy. Renew-able and Sustainable Energy Reviews 2011;15:1–23.
[37] Gas turbine GTW. World handbook, 2007–2008. Fairfield, CT, USA: PequotPublishing, Inc; 2007.
[38] Hamelinck CN, Faaij APC. Future prospects for production of methanol andhydrogen from biomass. Journal of Power Sources 2002;111:1–22.
[39] Heddle G, Herzog H, Klett M. The economics of CO2 storage. Cambridge:MIT Laboratory for Energy and the Environment; 2003.
[40] Herzog H, Golomb D. Carbon capture and storage from fossil fuel use.Elsevier; 2004 Encyclopedia of Energy.
[41] Ho MT, Allinson GW, Wiley DE. Reducing the cost of CO2 capture from fluegases using membrane technology. Industrial and Engineering ChemistryResearch 2008;47:1562–8.
[42] Tracking IEA. Industrial energy efficiency and CO2 emissions. Paris, France:International Energy Agency; 2007.
[43] IEA. World energy outlook 2007. Paris, France: International EnergyAgency; 2007.
[44] IEA. CO2 capture and storage: a key carbon abatement option. Paris, France:International Energy Agency; 2008.
[45] IEA. Combined heat and power. Evaluating the benefits of greater globalinvestment. Paris, France: International Energy Agency; 2008.
[46] IEA. Energy technology perspectives 2010. Scenarios & strategies to 2050.Paris, France: International Energy Agency; 2010.
[47] IEA, World energy outlook 2010. International Energy Agency, Paris, France,2010.
[48] IEA. GHG, multiple products with CO2 capture: power & thermal energy.Cheltenham, UK: PH3/6, IEA Greenhouse Gas R&D Programme; 1999.
[49] IEA. GHG, key components for CO2 abatement: gas turbines. Cheltenham,UK: PH3/12, IEA Greenhouse Gas R&D Programme; 2000.
[50] IEA. GHG, transmission of CO2 and energy. Cheltenham: PH4/6, Interna-tional Energy Agency Greenhouse Gas R&D Programme; 2002.
[51] IEA. GHG, improvement in power generation with post-combustion captureof CO2. Cheltenham, UK: PH4/33, IEA Greenhouse Gas R&D Programme;2004.
[52] IEA. GHG, ship transport of CO2. Cheltenham, UK: PH4/30, IEA GreenhouseGas R&D Programme; 2004.
[53] IEA. GHG, oxy combustion processes for CO2 capture from power plant.Paris, France: 2005/9, International Energy Agency; 2005.
[54] IEA GHG, IEA GHG CO2 emissions database v.2006. IEA greenhouse gas R&Dprogramme, 2006.
[55] IEA. GHG, CO2 capture from medium scale combustion installations 2007/7.Cheltenham, UK: International Energy Agency Greenhouse Gas R&DProgramme; 2007.
[56] IEA. GHG, distributed collection of CO2. Cheltenham, UK: 2007/12, IEAGreenhouse Gas R&D Programme; 2007.
[57] IHS CERA, 2011. IHS CERA European power capital cost index. Retrieved on16 February. /www.ihsindexes.comS.
[58] IMF. World economic outlook. Washington DC, USA: International MonetaryFund; 2009.
[59] IPCC. Special report on carbon dioxide capture and storage. Cambridge,United Kingdom and New York, NY, USA: Cambridge University Press; 2005.
[60] IPCC. IPCC guidelines for national greenhouse gas inventories. Hayama,Japan: Institute for Global Environmental Strategies; 2006 2006.
[61] IPPC, Draft reference document on best available techniques for largecombustion plants. European Integrated Pollution Prevention and ControlBureau, Sevilla, Spain, 2006.
[62] Kanniche M, Gros-Bonnivard R, Jaud P, Valle-Marcos J, Amann J-M, et al.Pre-combustion, post-combustion and oxy-combustion in thermal powerplant for CO2 capture. Applied Thermal Engineering 2010;30:53–62.
[63] Klara JM, Plunkett JE. The potential of advanced technologies to reducecarbon capture costs in future IGCC power plants. International Journal ofGreenhouse Gas Control 2010;4:112–8.
[64] Klein A, Zhang H, Themelis NJ. Analysis of a waste-to-energy power plantwith CO2 sequestration. In: North American waste to energy conference(NAWTEC 11)11 proceedings. Tampa, FL, USA, ASME International, 2003,pp. 263–270.
[65] Knuutila H, Svendsen HF, Anttila M. CO2 capture from coal-fired powerplants based on sodium carbonate slurry; a systems feasibility andsensitivity study. International Journal of Greenhouse Gas Control2009;3:143–51.
[66] Koornneef J, van Keulen T, Faaij A, Turkenburg W. Life cycle assessment ofa pulverized coal power plant with post-combustion capture, transportand storage of CO2. International Journal of Greenhouse Gas Control2008;2:448–67.
[67] Kreutz T, Williams R, Consonni S, Chiesa P. Co-production of hydrogen,electricity and CO2 from coal with commercially ready technology. Part B:Economic analysis. International Journal of Hydrogen Energy 2005;30:769–84.
[68] Kuramochi T, Faaij A, Ramırez A, Turkenburg W. Prospects for cost-effectivepost-combustion CO2 capture from industrial CHPs. International Journal ofGreenhouse Gas Control 2010;4:511–24.
[69] Kuramochi T, Turkenburg W, Faaij A. Competitiveness of CO2 capture froman industrial solid oxide fuel cell combined heat and power system in theearly stage of market introduction. Fuel 2011;90:958–73.
[70] Kurokawa H, Shirasaki Y, Kameyama H, Yasuda I. Techno-economic analysisfor hydrogen production from natural gas by membrane reformers. Inter-national Gas Research Conference Proceedings 2008:2695–705.
[71] Lokurlu A, Riensche E, Blum L, Bakke K, Li K, et al. CO2 sequestration fromsolid oxide fuel cells: technical options and costs. In: The seventh interna-tional conference on greenhouse gas control technologies. Vancouver,Canada; 2004.
[72] Lucquiaud M, Patel P, Chalmers H, Gibbins J. Retrofitting CO2 capture readyfossil plants with post-combustion capture. Part 2: Requirements fornatural gas combined cycle plants using solvent-based flue gas scrubbing.Proceedings of the Institution of Mechanical Engineers, Part A: Journal ofPower and Energy 2009;223:227–38.
T. Kuramochi et al. / Renewable and Sustainable Energy Reviews 19 (2013) 328–347 347
[73] Lusardi M, Bosio B, Arato E. An example of innovative application in fuel cellsystem development: CO2 segregation using molten carbonate fuel cells.Journal of Power Sources 2004;131:351–60.
[74] Moller BF, Torisson T, Assadi M, Sundqvist SG, Sjodin M, et al. Combinedcycle power plants—thermo-economic analysis. International Journal ofThermodynamics 2006;9:21–8.
[75] Ma Y, Karady GG, Winston Iii A, Gilbert P, Hess R, et al. Economic feasibilityprediction of the commercial fuel cells. Energy Conversion and Management2009;50:422–30.
[76] Matsumiya N, Mano H, Haraya K, Matsuyama H, Teramoto M. Feasibilitystudy of the application of facilitated transport membrane for separation forCO2 from flue gases. Kagaku Kogaku Ronbunshu 2004;30:752–7.
[77] McCollum DL, Ogden JM. Techno-economic models for carbon dioxidecompression, transport and storage & correlations for estimating carbondioxide density and viscosity. UCD-ITS-RR-06-14, Institute of Transporta-tion Studies. Davis, California, USA: University of California; 2006.
[78] Meerman JC, Hamborg ES, van Keulen T, Ramırez A, Turkenburg WC, et al.Techno-economic assessment of CO2 capture at steam methane reformingfacilities using commercially available technology. International Journal ofGreenhouse Gas Control 2012;9:160–71.
[79] Midwest Geological Sequestration Consortium, Carbon dioxide capture andtransportation options in the Illinois Basin. Midwest Geological Sequestra-tion Consortium, 2003.
[80] NETL. Cost and performance baseline for fossil energy plants. Vol. 1:Bituminous coal and natural gas to electricity. Revision 1. National EnergyTechnology Laboratory, 2007.
[81] NETL. Pulverized coal oxycombustion power plants. Vol. 1: Bituminous coalto electricity. Revision 1. National Energy Technology Laboratory, 2008.
[82] NIST/SEMATECH, 2011. e-handbook of statistical methods. Chapter 2:Measurement process characterization. Gaithersburg, MD, USA. Retrievedon 17 January. /http://www.itl.nist.gov/div898/handbook/S.
[83] OANDA, 2008. FXHistory. Retrieved on March 15, 2008. /www.oanda.comS.[84] Ogden JM. Hydrogen: the fuel of the future? Physics Today 2002;55:69–75.[85] Okabe K, Mano H, Fujioka Y. Preliminary estimations of energy and cost for
CO2 recovery by a membrane flash process utilizing waste thermal energy.International Journal of Greenhouse Gas Control 2010;4:597–602.
[86] Peeters ANM, Faaij APC, Turkenburg WC. Techno-economic analysis ofnatural gas combined cycles with post-combustion CO2 absorption, includ-ing a detailed evaluation of the development potential. InternationalJournal of Greenhouse Gas Control 2007;1:396–417.
[87] Pennline HW, Granite EJ, Luebke DR, Kitchin JR, Landon J, et al. Separationof CO2 from flue gas using electrochemical cells. Fuel 2009;89:1307–14.
[88] Rao M, Rubin ES, Berkenpas MB, An integrated modeling framework forcarbon management technologies. Vol. 1—Technical documentation:amine-based CO2 capture and storage systems for fossil fuel power plant.Carnegie Mellon University, Pittsburgh, PA, USA, 2004.
[89] Riensche E, Stimming U, Unverzagt G. Optimization of a 200 kW SOFCcogeneration power plant Part I: Variation of process parameters. Journal ofPower Sources 1998;73:251–6.
[90] Ritter R, Kutzschbach A, Stoffregen T, Energetic evaluation of a CO2
purification and compression plant for the oxyfuel process. IEA GHG firstoxyfuel combustion conference. Cottbus, Germany, 2009.
[91] Rosen MA. Allocating carbon dioxide emissions from cogeneration systems:descriptions of selected output-based methods. Journal of Cleaner Production2008;16:171–7.
[92] Sargent & Lundy, IPM Model—revisions to cost and performance for APCtechnologies. SDA FGD cost development methodology. Final., 2010.
[93] Shirasaki Y, Tsuneki T, Ota Y, Yasuda I, Tachibana S, et al. Development ofmembrane reformer system for highly efficient hydrogen production fromnatural gas. International Journal of Hydrogen Energy 2009;34:4482–7.
[94] Simonsson N, Eriksson T, Shah M, Circulating fluidized bed boiler technology.A competitive option for CO2 capture through oxyfuel combustion? IEA GHGfirst oxyfuel combustion conference. Cottbus, Germany, 2009.
[95] Sjardin M, Damen KJ, Faaij APC. Techno-economic prospects of small-scalemembrane reactors in a future hydrogen-fuelled transportation sector. Energy2006;31:2187–219.
[96] Smith AR, Klosek J. A review of air separation technologies and theirintegration with energy conversion processes. Fuel Processing Technology2001;70:115–34.
[97] Sugiura K, Takei K, Tanimoto K, Miyazaki Y. The carbon dioxide concen-trator by using MCFC. Journal of Power Sources 2003;5223:1–10.
[98] Sundqvist SG, Griffin T, Thorshaug NP, AZEP-development of an integratedair separation membrane-gas turbine. Second Nordic minisymposium oncarbon dioxide capture and storage. Goteborg, Sweden; 2001.
[99] Svending O. Industrial management of environmental data. Suggestedprocedures for internal allocation based on stakeholder needs. Environ-mental System Analysis. Goteborg, Sweden: Chalmers University ofTechnology; 2003.
[100] Switzer L, Rosen L, Thompson D, Sirman J, Howard H, et al. Cost andfeasibility study on the Praxair advanced boiler for the CO2 capture project’srefinery scenario. In: Carbon dioxide capture for storage in deep geologicformations, 1. Elsevier Ltd; 2005 pp. 561–579.
[101] Taylor JR. An introduction to error analysis. The study of uncertainties inphysical measurements. 2nd ed. Sausalito, CA, USA: University ScienceBooks; 1997.
[102] Toyota M, Kagawa K, Dairaku M, Watanabe M, Sasaki Y, et al. Developmentof CO2 capture system with MCFC. Phoenix, Arizona: 2008 Fuel cell seminar& exposition; 2008.
[103] US DOE, 2010. Electricity prices for industry. Washington, DC, USA.Retrieved on 3 May, 2010. /http://www.eia.doe.gov/emeu/international/elecprii.htmlS.
[104] van Bergen F, Pagnier HJM, Damen KJ, Faaij APC, Ribberink JS, Feasibilitystudy on CO2 sequestration and enhanced CBM production in Zuid–Limburg.November, 2003.
[105] van den Broek M, Brederode E, Ramırez A, Kramers L, van der Kuip M, et al.Designing a cost-effective CO2 storage infrastructure using a GIS basedlinear optimization energy model. Environmental Modelling and Software2010;25:1754–68.
[106] van Horssen A, Kuramochi T, Jozwicka M, Koornneef J, van Harmelen T, et al.The impacts of CO2 capture technologies in power generation and industryon greenhouse gases emissions and air pollutants in the Netherlands. TNOBuilt Environment and Geosciences, Utrecht, the Netherlands; 2009.
[107] Wee JH. Contribution of fuel cell systems to CO2 emission reduction in theirapplication fields. Renewable and Sustainable Energy Reviews 2010;14:735–44.
[108] Wilkinson MB, Boden JC, Gilmartin T, Ward C, Cross DA, Allam RJ, et al. CO2
capture from oil refinery process heaters through oxyfuel combustion. sixthinternational conference on greenhouse gas control technologies. Kyoto,Japan, 2003.
[109] Wong S. CO2 compression and transportation to storage reservoir. Buildingcapacity for CO2 capture and storage in the APEC region. A training manualfor policy makers and practitioners. Singapore: APEC; 2005.
[110] Wong S, Gunter WD, Gale J. Site ranking for CO2-enhanced coalbed methanedemonstration pilots. In: Williams D, Durie B, McMullan P, Paulson C, Smith A,editors. Fifth international conference on greenhouse gas control technologies.Cairns, Australia: CSIRO: Collingwood; 2001. p. 531–6.
[111] Yan S, Fang M, Zhang W, Zhong W, Luo Z, et al. Comparative analysis of CO2
separation from flue gas by membrane gas absorption technology andchemical absorption technology in China. Energy Conversion and Management2008;49:3188–97.
[112] Yu F, Chen J, Sun F, Zeng S, Wang C. Trend of technology innovation inChina’s coal-fired electricity industry under resource and environmentalconstraints. Energy Policy, 2011;39:1586–1599.
[113] Zanganeh K, Shafeen A, Thambimuthu K. A comparative study of refineryfuel gas oxy-fuel combustion options for CO2 capture using simulated data.In: Wilson M, Morris T, Gale J, Thambimuthu K, editors. The seventhinternational conference on greenhouse gas control technologies. Canada:Vancouver; 2004.
[114] Zhao L, Riensche E, Menzer R, Blum L, Stolten D. A parametric study ofCO2/N2 gas separation membrane processes for post-combustion capture.Journal of Membrane Science 2008;325:284–94.