2014 annual report system approval no.: 685 02 00services/mmr-00000685-2014.pdf · 2014 annual...
TRANSCRIPT
2014 Annual Report
Fort MacKay Waterworks System
Approval No.: 685‐02‐00
Submitted to:
Alberta Environment and
Sustainable Resource Development
Submitted on:
February 28, 2015
February 28, 2014
Alberta ESRD Twin Atria111 – 4999 98th Avenue Edmonton, Alberta T6B 2X3
RE: 2014 Annual Report for the Fort MacKay Waterworks System
Dear Sir/Madam:
The Environmental Services (ES) Department is pleased to submit the 2014 Annual Report for the Fort MacKay
Waterworks System.
Should you have any questions or concerns regarding the information contained within this report, please contact
the undersigned.
Sincerely,
Robert Rondeau Supervisor, Water Treatment Branch Regional Municipality of Wood Buffalo

Table of Contents
Environmental Services .................................................................................................................................. 3
Water Treatment ............................................................................................................................................ 3
Underground Services ................................................................................................................................... 4
Fort MacKay Waterworks System .................................................................................................................. 4
Personnel ........................................................................................................................................................ 5
Water Treatment ........................................................................................................................................... 5
Underground Services ................................................................................................................................... 5
Operator Certification .................................................................................................................................... 6
Incidents ......................................................................................................................................................... 8
UGS Work Orders ........................................................................................................................................... 8
Water Quality ................................................................................................................................................. 9
Raw Water ..................................................................................................................................................... 9
Treated Water ............................................................................................................................................... 9
Equipment Calibration .................................................................................................................................. 12
Improvements .............................................................................................................................................. 12
Summary ...................................................................................................................................................... 12
Appendix 1: Additional Information ............................................................................................................. 13
Appendix 2: Additional Monitoring Results .................................................................................................. 14

2014 Fort MacKay Waterworks System Annual Report
3
ENVIRONMENTAL SERVICES
Solid waste, water, and wastewater services, including the associated collection and distribution systems,
are provided in the Regional Municipality of Wood Buffalo (RMWB) by the Environmental Services (ES)
Department. The mandate of the Department is to be an industry leader in providing diligent, reliable and
efficient environmental services and protection while sustaining a workplace that is enjoyable, innovative
and respected by its peers.
At the end of 2014, the Department began a restructuring process and in order to best portray the
Department as it was in 2014, staffing is reported as it was prior to the restructuring. Branches within the
Department included: Water Treatment (WT), Wastewater Treatment (WWT), Underground Services
(UGS), Solid Waste & Recycling, and Sustainability. Braches that support the Fort MacKay Waterworks
System are discussed in more detail in the following subsections.
WATER TREATMENT
The WT Branch provide sufficient, reliable, safe supply of potable water to municipal customers by
operating and maintaining all municipal potable water treatment facilities to surpass regulatory
standards. The WT Branch is responsible for the operation maintenance, and repairs of the
A Class IV Water Treatment Plant in Fort McMurray,
Four Class II Water Treatment Plants in Fort Chipewyan, Fort MacKay, Janvier and Conklin,
Four rural commercial and residential fill reservoirs,
One urban commercial fill reservoir ,
Nine pump stations located throughout the Region in both rural and urban communities, and
Nine reservoirs located throughout the Region in both rural and urban communities.
2014 Fort MacKay Waterworks System Annual Report
4
UNDERGROUND SERVICES
The UGS Branch ensures potable water is delivered to the customer in a sufficient, reliable and safe
manner by operating and maintaining all municipal potable water distribution systems and surpasses
regulatory standards. The UGS Branch also protects the environment by operating and maintaining all
municipal wastewater collection systems to surpass regulatory standards. The UGS Branch is responsible
for the operation, maintenance, and repairs to the following infrastructure:
Class IV Wastewater Collection and Class IV Water Distribution systems in Fort McMurray,
Rural water distribution and wastewater collection systems in Fort Chipewyan and Anzac,
Water transmission lines leading from Fort McMurray to Anzac, and
Bulk water delivery in Anzac, Conklin, Janvier, Draper, and Gregoire Lake Estates.
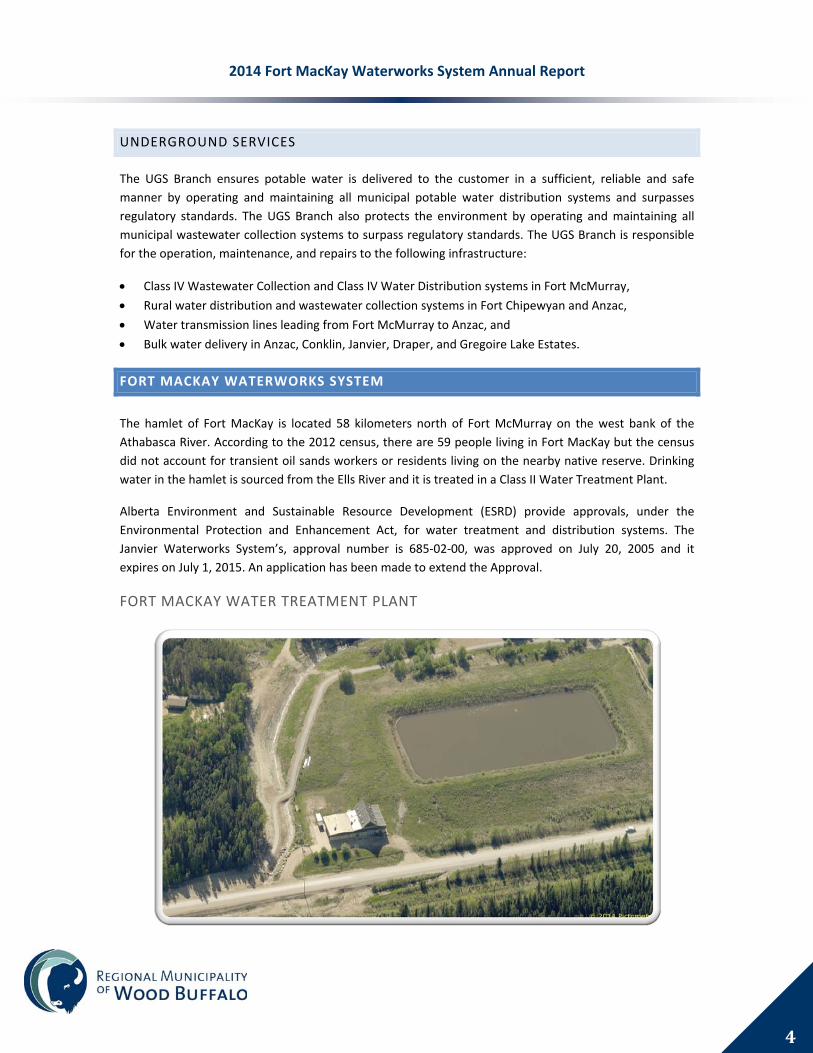
FORT MACKAY WATERWORKS SYSTEM
The hamlet of Fort MacKay is located 58 kilometers north of Fort McMurray on the west bank of the
Athabasca River. According to the 2012 census, there are 59 people living in Fort MacKay but the census
did not account for transient oil sands workers or residents living on the nearby native reserve. Drinking
water in the hamlet is sourced from the Ells River and it is treated in a Class II Water Treatment Plant.
Alberta Environment and Sustainable Resource Development (ESRD) provide approvals, under the
Environmental Protection and Enhancement Act, for water treatment and distribution systems. The
Janvier Waterworks System’s, approval number is 685‐02‐00, was approved on July 20, 2005 and it
expires on July 1, 2015. An application has been made to extend the Approval.
FORT MACKAY WATER TREATMENT PLANT

2014 Fort MacKay Waterworks System Annual Report
5
PERSONNEL
WATER TREATMENT
Certified WT operators ensure a clean, safe, and uninterrupted supply of potable water. All operations
staff are fully involved with operating the RMWB water facilities. As of December 2014, the WT Branch
had a total 48 positions with 45 full‐time staff, three vacancies, and one temporary position. The Water
Treatment staff related to certification consists of a Manager, a Supervisor, and an Urban Foreman and a
Rural Foreman. The urban supervisor, responsible primarily for the Fort McMurray Waterworks System,
has eight Utility Treatment Technicians and two Laboratory Technicians. The rural supervisor, responsible
primarily for the rural waterworks systems, has six Utility Treatment Technicians, a Rural Utility Treatment
Technician, and a Labourer.
WATER TREATMENT ORGANIZATIONAL CHART
UNDERGROUND SERVICES
RMWB’s UGS staff operates and maintains all of the municipal potable water distribution systems in the Municipality. As of December 2014, the UGS Branch had a total of 48 full‐time positions including four temporary positions and two vacancies. The UGS staff consists of the manager, two supervisors, three
2014 Fort MacKay Waterworks System Annual Report
6
foremen, seven utility operators, two utility technicians, Six equipment operators, Six laborers, two planners (one utility and one metering) and two schedulers (one utility and one metering), ten meter technicians, Three clerks and One Temp(metering) . The operations staff, other than those working in the metering section, are fully involved with operating the water distribution and waste water collections systems listed above. A year‐end organizational chart is provided below.
UNDERGROUND SERVICES ORGANIZATIONAL CHART
OPERATOR CERTIFICATION
The operators that are responsible for the Fort MacKay Waterworks system are supported by the
Municipality to achieve the highest level of certification possible. Provided in the following tables are lists
of the operators and their certifications.
URBAN WATER TREATMENT OPERATORS Position Certification
Foreman WTIII
Operator WTIV
Operator WTIV
Operator WTIV

2014 Fort MacKay Waterworks System Annual Report
7
Operator WTIV
Operator WTIII,WWTII, WDII, WWCII
Operator WTIII
Operator WTII
Operator WTII
Operator WWTIV, WTI, WCIII, WDII
Operator WT2, WWT3, WD2, WC2
Operator WTIV
RURAL WATER TREATMENT OPERATORS
Position Certification
Foreman WTII
Operator WDSI
Operator WTIII
Operator WTII, WWTII
Operator WTII, WDI
Operator WT IV, WD III, WWT III, WCII
Operator WTII
UGS OPERATORS Position Certification
Supervisor WDIII, WWCIII
Foreman WI, WWCII
Foreman WDI, WWCI
Foreman WDII
Operator None
Operator None
Operator WDII, WWC II
Operator None
Operator None
Operator None
Operator WDI
Operator WDII, WWCII, WTII
Operator None
Operator None
Operator None
Operator None
Operator WWC II
Operator None

2014 Fort MacKay Waterworks System Annual Report
8
Operator None
Operator WDII, WWCII, WTII
Operator None
Operator WDII
Operator WDI
Operator WDIII, WWCIII
Operator WDII, WWCII
Operator None
Operator WDI, WWCI
Operator WDII, WWCII
Operator None
Operator WDII, WWCII
Operator None
Operator None
Operator None
Operator None
Operator WDI, WWCI
Operator None
Operator None
Operator None
Operator None
Operator WDI, WWCI
Operator WDII, WCII
Operator WDI
INCIDENTS
There were no incidents relating to the Fort MacKay Waterworks System in 2014.
UGS WORK ORDERS
A separate report submitted to ESRD provides a complete list of all UGS work orders in the Municipality.
In Fort MacKay, there was a total of 170 UGS work orders for maintenance.
2014 Fort MacKay Waterworks System Annual Report
9
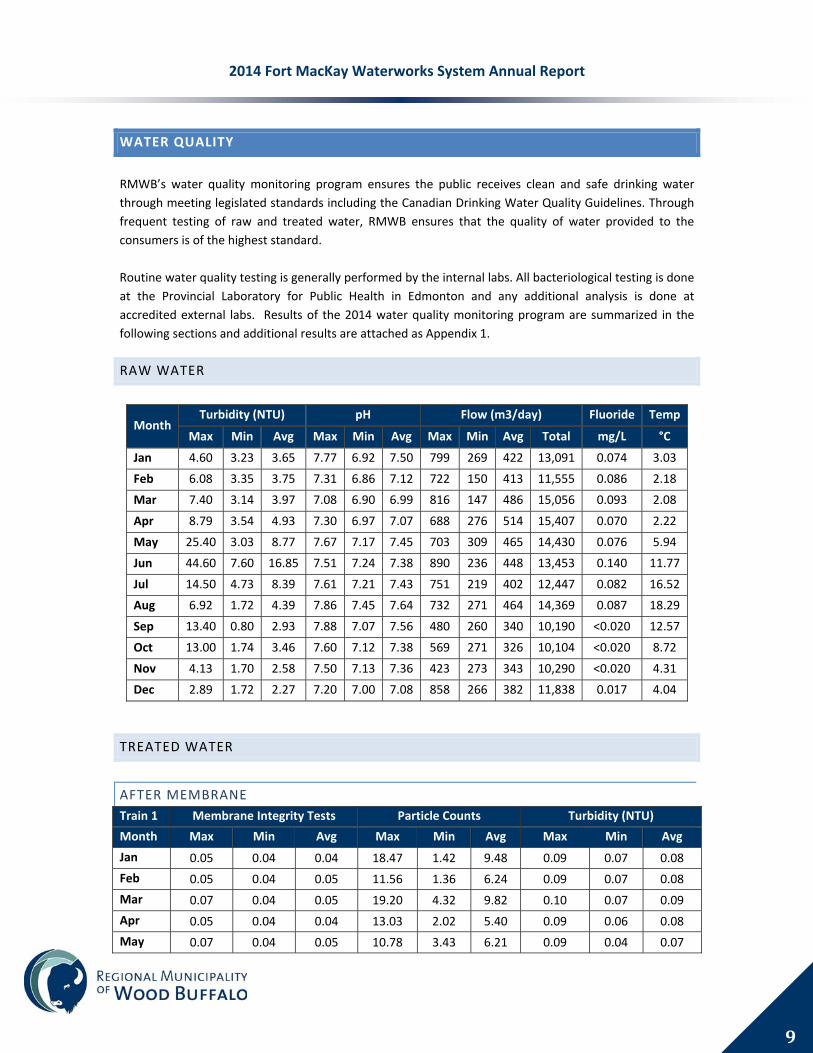
WATER QUALITY
RMWB’s water quality monitoring program ensures the public receives clean and safe drinking water
through meeting legislated standards including the Canadian Drinking Water Quality Guidelines. Through
frequent testing of raw and treated water, RMWB ensures that the quality of water provided to the
consumers is of the highest standard.
Routine water quality testing is generally performed by the internal labs. All bacteriological testing is done
at the Provincial Laboratory for Public Health in Edmonton and any additional analysis is done at
accredited external labs. Results of the 2014 water quality monitoring program are summarized in the
following sections and additional results are attached as Appendix 1.
RAW WATER
Month Turbidity (NTU) pH Flow (m3/day) Fluoride Temp
Max Min Avg Max Min Avg Max Min Avg Total mg/L °C
Jan 4.60 3.23 3.65 7.77 6.92 7.50 799 269 422 13,091 0.074 3.03
Feb 6.08 3.35 3.75 7.31 6.86 7.12 722 150 413 11,555 0.086 2.18
Mar 7.40 3.14 3.97 7.08 6.90 6.99 816 147 486 15,056 0.093 2.08
Apr 8.79 3.54 4.93 7.30 6.97 7.07 688 276 514 15,407 0.070 2.22
May 25.40 3.03 8.77 7.67 7.17 7.45 703 309 465 14,430 0.076 5.94
Jun 44.60 7.60 16.85 7.51 7.24 7.38 890 236 448 13,453 0.140 11.77
Jul 14.50 4.73 8.39 7.61 7.21 7.43 751 219 402 12,447 0.082 16.52
Aug 6.92 1.72 4.39 7.86 7.45 7.64 732 271 464 14,369 0.087 18.29
Sep 13.40 0.80 2.93 7.88 7.07 7.56 480 260 340 10,190 <0.020 12.57
Oct 13.00 1.74 3.46 7.60 7.12 7.38 569 271 326 10,104 <0.020 8.72
Nov 4.13 1.70 2.58 7.50 7.13 7.36 423 273 343 10,290 <0.020 4.31
Dec 2.89 1.72 2.27 7.20 7.00 7.08 858 266 382 11,838 0.017 4.04
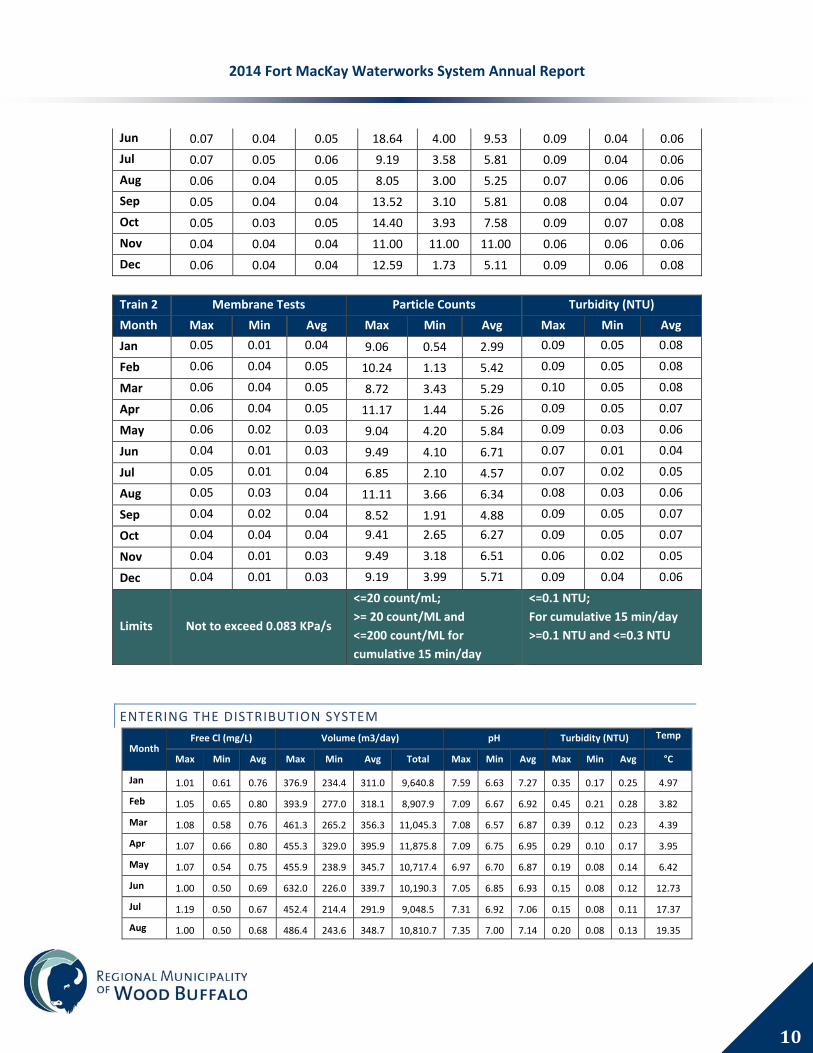
TREATED WATER
AFTER MEMBRANE
Train 1 Membrane Integrity Tests Particle Counts Turbidity (NTU)
Month Max Min Avg Max Min Avg Max Min Avg
Jan 0.05 0.04 0.04 18.47 1.42 9.48 0.09 0.07 0.08
Feb 0.05 0.04 0.05 11.56 1.36 6.24 0.09 0.07 0.08
Mar 0.07 0.04 0.05 19.20 4.32 9.82 0.10 0.07 0.09
Apr 0.05 0.04 0.04 13.03 2.02 5.40 0.09 0.06 0.08
May 0.07 0.04 0.05 10.78 3.43 6.21 0.09 0.04 0.07
2014 Fort MacKay Waterworks System Annual Report
10
Jun 0.07 0.04 0.05 18.64 4.00 9.53 0.09 0.04 0.06
Jul 0.07 0.05 0.06 9.19 3.58 5.81 0.09 0.04 0.06
Aug 0.06 0.04 0.05 8.05 3.00 5.25 0.07 0.06 0.06
Sep 0.05 0.04 0.04 13.52 3.10 5.81 0.08 0.04 0.07
Oct 0.05 0.03 0.05 14.40 3.93 7.58 0.09 0.07 0.08
Nov 0.04 0.04 0.04 11.00 11.00 11.00 0.06 0.06 0.06
Dec 0.06 0.04 0.04 12.59 1.73 5.11 0.09 0.06 0.08
Train 2 Membrane Tests Particle Counts Turbidity (NTU)
Month Max Min Avg Max Min Avg Max Min Avg
Jan 0.05 0.01 0.04 9.06 0.54 2.99 0.09 0.05 0.08
Feb 0.06 0.04 0.05 10.24 1.13 5.42 0.09 0.05 0.08
Mar 0.06 0.04 0.05 8.72 3.43 5.29 0.10 0.05 0.08
Apr 0.06 0.04 0.05 11.17 1.44 5.26 0.09 0.05 0.07
May 0.06 0.02 0.03 9.04 4.20 5.84 0.09 0.03 0.06
Jun 0.04 0.01 0.03 9.49 4.10 6.71 0.07 0.01 0.04
Jul 0.05 0.01 0.04 6.85 2.10 4.57 0.07 0.02 0.05
Aug 0.05 0.03 0.04 11.11 3.66 6.34 0.08 0.03 0.06
Sep 0.04 0.02 0.04 8.52 1.91 4.88 0.09 0.05 0.07
Oct 0.04 0.04 0.04 9.41 2.65 6.27 0.09 0.05 0.07
Nov 0.04 0.01 0.03 9.49 3.18 6.51 0.06 0.02 0.05
Dec 0.04 0.01 0.03 9.19 3.99 5.71 0.09 0.04 0.06
Limits Not to exceed 0.083 KPa/s
<=20 count/mL;
>= 20 count/ML and
<=200 count/ML for
cumulative 15 min/day
<=0.1 NTU;
For cumulative 15 min/day
>=0.1 NTU and <=0.3 NTU
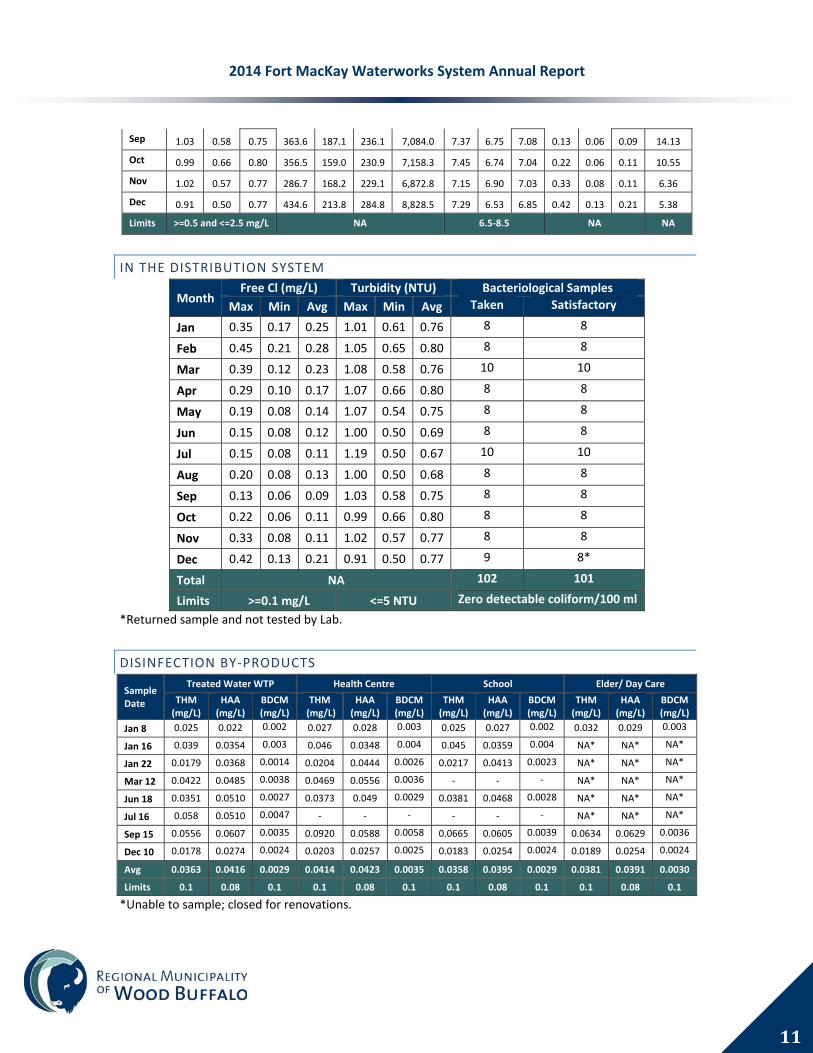
ENTERING THE DISTRIBUTION SYSTEM
Month Free Cl (mg/L) Volume (m3/day) pH Turbidity (NTU) Temp
Max Min Avg Max Min Avg Total Max Min Avg Max Min Avg °C
Jan 1.01 0.61 0.76 376.9 234.4 311.0 9,640.8 7.59 6.63 7.27 0.35 0.17 0.25 4.97
Feb 1.05 0.65 0.80 393.9 277.0 318.1 8,907.9 7.09 6.67 6.92 0.45 0.21 0.28 3.82
Mar 1.08 0.58 0.76 461.3 265.2 356.3 11,045.3 7.08 6.57 6.87 0.39 0.12 0.23 4.39
Apr 1.07 0.66 0.80 455.3 329.0 395.9 11,875.8 7.09 6.75 6.95 0.29 0.10 0.17 3.95
May 1.07 0.54 0.75 455.9 238.9 345.7 10,717.4 6.97 6.70 6.87 0.19 0.08 0.14 6.42
Jun 1.00 0.50 0.69 632.0 226.0 339.7 10,190.3 7.05 6.85 6.93 0.15 0.08 0.12 12.73
Jul 1.19 0.50 0.67 452.4 214.4 291.9 9,048.5 7.31 6.92 7.06 0.15 0.08 0.11 17.37
Aug 1.00 0.50 0.68 486.4 243.6 348.7 10,810.7 7.35 7.00 7.14 0.20 0.08 0.13 19.35
2014 Fort MacKay Waterworks System Annual Report
11
Sep 1.03 0.58 0.75 363.6 187.1 236.1 7,084.0 7.37 6.75 7.08 0.13 0.06 0.09 14.13
Oct 0.99 0.66 0.80 356.5 159.0 230.9 7,158.3 7.45 6.74 7.04 0.22 0.06 0.11 10.55
Nov 1.02 0.57 0.77 286.7 168.2 229.1 6,872.8 7.15 6.90 7.03 0.33 0.08 0.11 6.36
Dec 0.91 0.50 0.77 434.6 213.8 284.8 8,828.5 7.29 6.53 6.85 0.42 0.13 0.21 5.38
Limits >=0.5 and <=2.5 mg/L NA 6.5‐8.5 NA NA
IN THE DISTRIBUTION SYSTEM
Month Free Cl (mg/L) Turbidity (NTU) Bacteriological Samples
Max Min Avg Max Min Avg Taken Satisfactory
Jan 0.35 0.17 0.25 1.01 0.61 0.76 8 8
Feb 0.45 0.21 0.28 1.05 0.65 0.80 8 8
Mar 0.39 0.12 0.23 1.08 0.58 0.76 10 10
Apr 0.29 0.10 0.17 1.07 0.66 0.80 8 8
May 0.19 0.08 0.14 1.07 0.54 0.75 8 8
Jun 0.15 0.08 0.12 1.00 0.50 0.69 8 8
Jul 0.15 0.08 0.11 1.19 0.50 0.67 10 10
Aug 0.20 0.08 0.13 1.00 0.50 0.68 8 8
Sep 0.13 0.06 0.09 1.03 0.58 0.75 8 8
Oct 0.22 0.06 0.11 0.99 0.66 0.80 8 8
Nov 0.33 0.08 0.11 1.02 0.57 0.77 8 8
Dec 0.42 0.13 0.21 0.91 0.50 0.77 9 8*
Total NA 102 101
Limits >=0.1 mg/L <=5 NTU Zero detectable coliform/100 ml
*Returned sample and not tested by Lab.
DISINFECTION BY‐PRODUCTS
Sample Date
Treated Water WTP Health Centre School Elder/ Day Care
THM (mg/L)
HAA (mg/L)
BDCM (mg/L)
THM (mg/L)
HAA (mg/L)
BDCM(mg/L)
THM (mg/L)
HAA(mg/L)
BDCM(mg/L)
THM (mg/L)
HAA (mg/L)
BDCM(mg/L)
Jan 8 0.025 0.022 0.002 0.027 0.028 0.003 0.025 0.027 0.002 0.032 0.029 0.003
Jan 16 0.039 0.0354 0.003 0.046 0.0348 0.004 0.045 0.0359 0.004 NA* NA* NA*
Jan 22 0.0179 0.0368 0.0014 0.0204 0.0444 0.0026 0.0217 0.0413 0.0023 NA* NA* NA*
Mar 12 0.0422 0.0485 0.0038 0.0469 0.0556 0.0036 ‐ ‐ ‐ NA* NA* NA*
Jun 18 0.0351 0.0510 0.0027 0.0373 0.049 0.0029 0.0381 0.0468 0.0028 NA* NA* NA*
Jul 16 0.058 0.0510 0.0047 ‐ ‐ ‐ ‐ ‐ ‐ NA* NA* NA*
Sep 15 0.0556 0.0607 0.0035 0.0920 0.0588 0.0058 0.0665 0.0605 0.0039 0.0634 0.0629 0.0036
Dec 10 0.0178 0.0274 0.0024 0.0203 0.0257 0.0025 0.0183 0.0254 0.0024 0.0189 0.0254 0.0024
Avg 0.0363 0.0416 0.0029 0.0414 0.0423 0.0035 0.0358 0.0395 0.0029 0.0381 0.0391 0.0030
Limits 0.1 0.08 0.1 0.1 0.08 0.1 0.1 0.08 0.1 0.1 0.08 0.1
*Unable to sample; closed for renovations.

2014 Fort MacKay Waterworks System Annual Report
12
ADDITIONAL MONITORING
Monitoring results for all parameters indicated in Section 6.1.7 of the Approval are attached as an
appendix.
EQUIPMENT CALIBRATION
Hach Canada was again contracted to calibrate and certify all sampling equipment for the RMWB. The
certificates of calibration and accuracy are available upon request.
IMPROVEMENTS
Repairs were made to both of the original membrane cartridges, new cartridges were ordered for
replacement. The cartridges were received and installed in 2015. The new cartridges increased plant’s
capacity by approximately 33%.
SUMMARY
The Municipality remains committed to continuing provided high‐quality wastewater services. Through
continued investment by the Municipality, in staff, capital projects, and improved procedures the
Municipality aims to achieve its goal of full legislative compliance.

2014 Fort MacKay Waterworks System Annual Report
13
APPENDIX 1: ADDITIONAL INFORMATION
TREATMENT CHEMICALS
A summary of the chemicals used in the water treatment process are summarized in the following tables.
MANUFACTURER
Chemical Supplier Manufacturer
Sodium Hypochlorite (NaOCl) Univar Univar
PACl (Isopac) Klearwater Hydrotech
KmNO4 Cleartech Brenntag
PAC (Carbon) Norit Norit
QUANTITY USED
Month NaOCl PACl KmNO4 PAC
Annual (kg)
Dosage (mg/L)
Annual(kg)
Dosage(mg/L)
Annual(kg)
Dosage(mg/L)
Annual (kg)
Dosage(mg/L)
Jan 169.4 17.6 1,630.3 169.10 2.4 0.2 2,108 165.63
Feb 189.1 21.2 3,592.1 403.25 0.0 0.0 1,904 169.86
Mar 245.9 22.3 2,649.6 239.88 0.0 0.0 2,108 153.19
Apr 295.8 24.9 2,600.3 218.96 0.0 0.0 1,080 72.3
May 208.8 19.5 2,334.5 217.82 0.0 0.0 1,346 95.41
Jun 207.6 20.4 2,194.7 215.37 0.3 0.0 1,362 105.45
Jul 248.2 27.4 2,233.1 246.79 0.9 0.1 1,395 121.93
Aug 295.8 27.4 2,389.3 221.01 0.0 0.0 1,407 89.96
Sep 236.6 33.4 1,876.9 264.95 0.0 0.0 1,344 136.10
Oct 205.3 28.7 1,748.1 244.21 0.0 0.0 9,575 141.44
Nov 200.7 29.2 1,882.4 273.89 0.0 0.0 1,350 131.44
Dec 276.1 31.3 2,346.1 265.74 2.4 0.3 1,333 117.20
Avg 231.61 25.28 2,289.78 248.41 0.50 0.05 2,192.67 124.99
Total 2,779.30 ‐ 27,477.40 ‐ 6.00 ‐ 26,312.00 ‐
2014 Fort MacKay Waterworks System Annual Report
14
APPENDIX 2: ADDITIONAL MONITORING RESULTS

WATER ANALYSIS SUMMARY OF FORT McKAY WATER TREATMENT PLANT- 2014
MONTH pH TURBIDITY COLOR ALKALINITY TOTAL CALCIUM MAGNESIUM TDS IRON MANGANESE ALUMINUM TOTAL
Sample NTU TCU mg/L HARDNESS HARDNESS HARDNESS mg/L mg/L mg/L mg/L ORGANIC UV254 Fluoride Lab Tech6.5-8.5 <3 <15 mg/L mg/L mg/L <500 <0.3 <.08 CARBON mg/L Initials
8-Jan-14Raw 7.44 5.32 18 92 100 66 34 151 0.31 0.139 0.017 16.3 0.431 AP
Treated 7.33 0.33 0 42 104 70 34 200 0.02 0.080 0.077 4.5 0.08226-Feb-14
Raw 7.33 3.82 16 100 102 72 30 158 0.35 0.075 0.006 8.8 0.413 GLTreated 7.22 0.74 0 42 104 72 32 201 0.02 0.051 0.088 3.5 0.036
12-Mar-14Raw 7.36 3.24 15 104 110 72 38 199 0.31 0.054 0 3.2 0.465 AP
Treated 7.3 0.25 0 56 112 72 40 168 0.02 0.033 0.059 1.8 0.03216-Apr-14
Raw 7.48 4.64 16 102 104 70 34 165 0.39 0.04 0.014 16.1 0.395 GLTreated 7.35 0.14 0 60 106 72 34 198 0.02 0.027 0.049 4.3 0.055
13-May-14Raw 7.85 3.74 17 80 84 58 26 131 0.39 0.044 0.008 12.3 0.36 GL
Treated 7.25 0.13 0 36 84 58 26 164 0.02 0.023 0.043 1.4 0.02110-Jun-14
Raw 7.78 14.6 23 74 78 60 18 125 0.36 0.035 0.008 13.1 0.432 SC/GMTreated 7.4 0.174 1 34 78 64 14 157 0.02 0.027 0.027 3.0 0.034
27-Jul-14Raw 7.69 2.58 25 76 82 34 48 121 0.31 0.106 0.00 17.1 0.545 AP
Treated 7.20 0.15 1 30 78 36 42 158 0.01 0.024 0.013 2.2 0.04925-Aug-14
Raw 7.91 1.4 19 84 84 58 26 131 0.17 0.056 0.00 14.9 0.502 APTreated 7.29 0.066 0 36 84 54 30 172 0.02 0.021 0.02 1.1 0.061
15-Sep-14Raw 8.02 1.39 18 86 92 63 29 138 0.16 0.051 0.002 11 0.464 GL
Treated 7.52 0.05 0 42 90 60 30 173 0.03 0.015 0.04 3.7 0.0399-Oct-14
Raw 7.92 16.4 17 96 100 66 34 149 1.28 0.812 0.004 10.4 0.433 APTreated 7.51 0.07 1 48 94 62 32 184 0.00 0.015 0.031 2.7 0.05
18-Nov-14Raw 7.83 2.45 19 106 102 82 20 171 0.23 0.035 0.002 17.4 0.469 GL
Treated 7.52 0.18 0 52 104 72 32 203 0.03 0.019 0.023 0.6 0.04710-Dec-14
Raw 7.65 2.04 18 112 112 72 40 179 0.30 0.160 0.00 17.7 0.476 APTreated 6.9 0.21 0 28 114 74 40 237 0.00 0.114 0.01 2.9 0.037