2014 brief on american outsourcing, in 8 economic charts
TRANSCRIPT

"Outsourcingisanevilthathastobestopped…[it]hasleadtothedrainageofjobsthatbelongtotheAmericanmiddleclass[and]shouldbestoppedatanycost."
“Therearepeoplelookingforworkbecausejobshavegoneoverseas,andweneedto
actinthiscountry.”

American Outsourcing
8 in
Charts
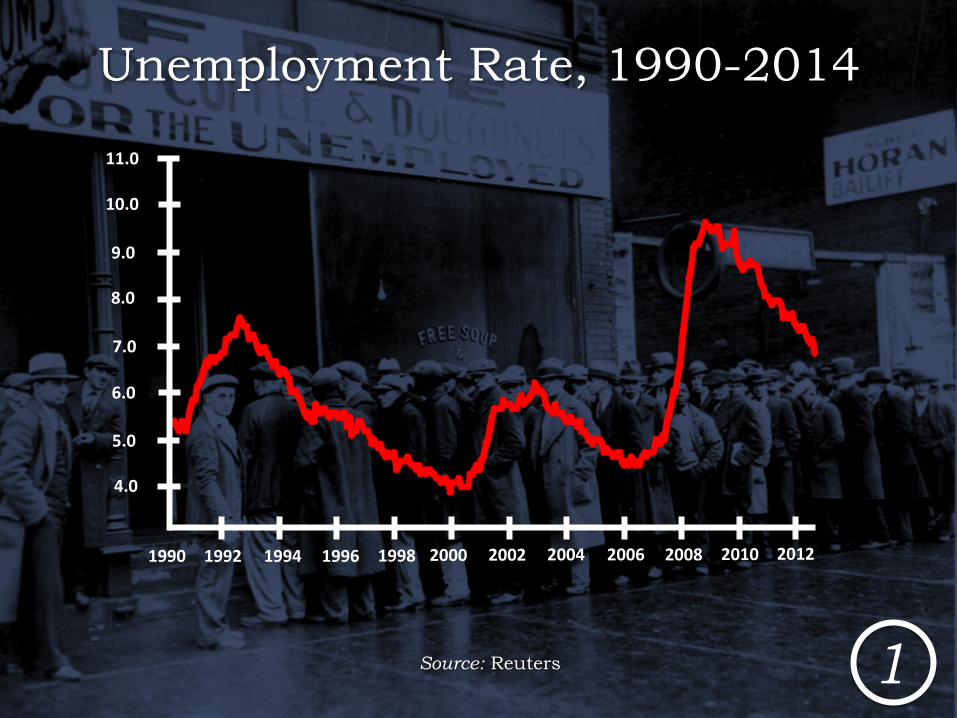
Unemployment Rate, 1990-2014
1990 1994 200019961992 1998
Source: Reuters
4.0
5.0
6.0
7.0
8.0
9.0
10.0
11.0
2002 2006 20082004 2010 2012
1

Total Number and Percentage of U.S. Jobs Moving Offshore, 2003-2015
Source: Bureau of Labor Statistics and Forrester Research, Inc.
MillionsofJobs
2004 20052003 2006 2007 2008 2010 2015
1.75
3.5 3.5(6.0%)
1.7(3.1%)
0.3(0.6%) 1.0(1.7%)
2

Total Wages Associated with U.S. Jobs Moving Offshore, 2003-2015
Source: Bureau of Labor Statistics and Forrester Research, Inc.
US$Billions
2004 20052003 2006 2007 2008 2010 2015
50
$151.2
$75.4$19.7 $42.2
100
150
3

Do you believe outsourcing helps or hurts the economy?
69%
17%
10%
4%HurtstheEconomy
HelpstheEconomy
HasnoEffect
NotSure
4Source: AP


Average Annual Growth of Employment, Output, and Labor in U.S. Manufacturing since 1960
5 Source: Edwards and Lawrence (2013) using data from US BEA and World KLEMS
database; data for 2000 onward from Moran and Oldenski (2014) using data from US Bureau of Labor Statistics, via Peter G. Peterson Institute for International Economics
-2
-1
0
1
2
3
4
5
-3
1960-79 1980-89 1990-99 2000-09 2010-13
Outputperperson
Output
Employment
-1.0
3.64.0
3.53.9

6Source: Hufbauer, Moran, and Oldenski (2013) based on regressions using firm-level data for 1990-2009 from the US Bureau of Economic Analysis, via the Peter G. Peterson
Institute for International Economics
Increases in Employment and Sales Abroad by U.S. Multinationals, Accompanied by Increases in Domestic Activity
2 40 6 2 40 6 8
ExportsfromtheU.S.
CapitalExp.IntheU.S.
R&DSpendinginU.S.
U.S.Employment
U.S.Sales
Impactof10%increaseinjobsatforeignaffiliates
Impactof10%increaseinsalesbyforeignaffiliates
3
3
7
2
3
4
4
5
4
4
percentincrease percentincrease

7
History of Patented U.S. Inventions per capita, 1790-2011 by Year Granted
1800 1840 190018601820 1880
50
100
150
200
250
300
350
400
1920 1960 19801940 2000 2010
10-yearmovingaverageofpatentspermillionpopulaGon
Source: Bureau of Labor Statistics


8
Unemployment Rate, 1990-2012
1994 200019961992 1998
4.0
5.0
6.0
7.0
8.0
9.0
10.0
11.0
2002 2006 20082004 2010 2012
-6
-4
0
Unemployment
CyclicalUnemployment
Source: Financial Times

FIN