2014 data summary report: 2013 indoor activity bases
TRANSCRIPT

-FINAL-
Data Summary Report: 2013 Indoor Activity-Based Sampling
Libby Asbestos Superfund Site, Operable Unit 4 Libby, Montana
April 2014
Prepared for:
U.S. ENVIRONMENTAL PROTECTION AGENCY Region 8
Prepared by:
CDM Federal Programs Corporation 555 17th Street, Suite 1100 Denver, Colorado 80202
Contract No. W9128F-11-D-0023
Task Order No. 0002

Data Summary Report: 2013 OU4 Indoor ABS April 2014
Page 2 of 40
This page intentionally left blank to facilitate double-sided printing.


Data Summary Report: 2013 OU4 Indoor ABS April 2014
Page 4 of 40
This page intentionally left blank to facilitate double-sided printing.
Data Summary Report: 2013 OU4 Indoor ABS April 2014
Page 5 of 40
Table of Contents
1 INTRODUCTION ...................................................................................11 1.1 Site Background ............................................................................................... 11 1.2 Document Purpose .......................................................................................... 11 1.3 Document Organization ................................................................................. 12
2 DATA MANAGEMENT ........................................................................13 2.1 Sample Collection, Documentation, Handling, and Custody ................. 13
2.1.1 Collection Methods .......................................................................................... 13 2.1.2 Documentation, Handling, and Custody Methods ...................................... 13
2.2 Analytical Results Recording ........................................................................ 14 2.3 Hard Copy Data Management ....................................................................... 14 2.4 Electronic Data Management ........................................................................ 14 2.5 Personal Data Security .................................................................................... 15
3 SAMPLE PREPARATION AND ANALYSIS METHODS .............17 3.1 LA in Air ............................................................................................................ 17
3.1.1 ABS Sample Analysis Hierarchy .................................................................... 17 3.1.2 Analysis Method and Counting Rules ........................................................... 17 3.1.3 Stopping Rules .................................................................................................. 18 3.1.4 Calculation of Air Concentration .................................................................. 18
4 SCENARIO 1: Curb-to-Curb Properties .............................................21 4.1 Study Design .................................................................................................... 21
4.1.1 Sampling Locations .......................................................................................... 21 4.1.2 Disturbance Scenarios ..................................................................................... 21 4.1.3 Sampling Times ................................................................................................. 22
4.2 Results and Interpretation ............................................................................. 22 4.2.1 Comparison of ABS Air Concentrations by ABS Script.............................. 22 4.2.2 Comparison of ABS Air Concentrations by Season .................................... 23 4.2.3 Relation of ABS Air Concentrations to Potential Indoor Sources of LA . 23
5 SCENARIO 2: 2007/2008 Properties .....................................................25 5.1 Study Design .................................................................................................... 25
5.1.1 Sampling Locations .......................................................................................... 25 5.1.2 Disturbance Scenerios ...................................................................................... 25 5.1.3 Sampling Times ................................................................................................. 26
5.2 Results and Interpretation ............................................................................. 26 5.2.1 Comparison of ABS Air Concentrations by ABS Script.............................. 26 5.2.2 Comparison of ABS Air Concentrations by Year ......................................... 26
6 DATA QUALITY ASSESSMENT ........................................................29 6.1 Field and Laboratory Oversight .................................................................... 29
6.1.1 Field .................................................................................................................... 29 6.1.2 Laboratory ......................................................................................................... 30
6.2 Field and Laboratory Modifications ............................................................ 30
Data Summary Report: 2013 OU4 Indoor ABS April 2014
Page 6 of 40
6.3 Data Review, Verification, and Validation ................................................. 30 6.3.1 Data Review and Verification ........................................................................ 30 6.3.2 Data Validation ................................................................................................ 32
6.4 Field Quality Control ...................................................................................... 32 6.4.1 Lot Blanks ......................................................................................................... 32 6.4.2 Field Blanks ....................................................................................................... 33
6.5 Laboratory Quality Control ........................................................................... 33 6.6 Data Adequacy ................................................................................................. 33
6.6.1 Spatial and Temporal Representativeness ................................................... 33 6.6.2 Sample Completeness ....................................................................................... 34 6.6.3 Confirmation of TEM Analysis Stopping Rules .......................................... 35 6.6.4 ABS Air Filter Loading .................................................................................... 35 6.6.5 Indirect Preparation of ABS Filters ............................................................... 36
6.7 Data Quality Conclusions .............................................................................. 36
7 REFERENCES ...........................................................................................37

Data Summary Report: 2013 OU4 Indoor ABS April 2014
Page 7 of 40
List of Figures
Figure 4-1 Scenario 1: Curb-to-Curb Property Locations Figure 4-2 Comparison of Curb-to-Curb Properties Results Figure 5-1 Scenario 2: 2007/2008 Repeat Property Locations Figure 5-2 Comparison of 2013 Active Versus Passive Results for 2007/2008 Repeat
Properties Figure 5-3 Comparison of 2007/2008 (Summer Only) and 2013 Indoor ABS Air Results
List of Tables
Table 4-1 Scenario 1: Curb-to-Curb Properties Results Table 5-1 Scenario 2: 2007/08 Indoor ABS and 2013 Results Table 6-1 Evaluation of Field Blanks by TEM Table 6-2 Target and Actual Number of Samples Collected and Analyzed Table 6-3 Evaluation of Filter Loading Evenness
List of Appendices [provided electronically with the exception of Appendix D] Appendix A Field Documentation Appendix B Analytical Laboratory Documentation Appendix C Project Database (download date 03/31/2014) Appendix D Detailed Data Summary Tables Appendix E Field and Laboratory Modification Forms Appendix F Data Verification Reports

Data Summary Report: 2013 OU4 Indoor ABS April 2014
Page 8 of 40
This page intentionally left blank to facilitate double-sided printing.

Data Summary Report: 2013 OU4 Indoor ABS April 2014
Page 9 of 40
List of Acronyms and Abbreviations ABS activity-based sampling Ago Area of a grid opening Cair air concentration cc cubic centimeter CB&I CB&I Federal Services CDM Smith CDM Federal Programs Corporation CHISQ Chi-square DQA data quality assessment DQO data quality objective EDD electronic data deliverable EDS energy dispersive spectroscopy EFA Effective area of the filter EPA U.S. Environmental Protection Agency ESAT Environmental Services Assistance Team F Fraction of primary filter deposited on secondary filter FSDS field sample data sheet GOx Number of grid openings examined HV high volume ID identification LA Libby amphibole L/min liters per minute LV low volume MCE mixed cellulose ester mm millimeter mm2 square millimeters N number of PCME LA structures observed NAM non-asbestos material NFG National Functional Guidelines OA other amphibole OU Operable Unit PCME phase contrast microscopy-equivalent PLM polarized light microscopy QA quality assurance QAPP quality assurance project plan QATS Quality Assurance Technical Support QC quality control ROM record of modification S Sensitivity SAED selected area electron diffraction SAP sampling and analysis plan s/cc as structures per cubic centimeter

Data Summary Report: 2013 OU4 Indoor ABS April 2014
Page 10 of 40
Shaw E&I Shaw Environmental & Infrastructure Group Site Libby Asbestos Superfund Site SOP standard operating procedure TAS target analytical sensitivity TEM transmission electron microscopy μm micrometers V Volume VCS vermiculite-containing soil % percent

Data Summary Report: 2013 OU4 Indoor ABS April 2014
Page 11 of 40
1 INTRODUCTION 1.1 Site Background Libby is a community in northwestern Montana located 7 miles southwest of a vermiculite mine that operated from the 1920s until 1990. The mine began limited operations in the 1920s and was operated on a larger scale by the W.R. Grace and Company from approximately 1963 to 1990. Studies revealed that the vermiculite from the mine contains amphibole-type asbestos, referred to as Libby amphibole (LA). Epidemiological studies revealed that workers at the mine had an increased risk of developing asbestos-related lung disease (McDonald et al. 1986, 2004; Amandus and Wheeler 1987; Amandus et al. 1987; Whitehouse 2004; Sullivan 2007). Additionally, radiographic abnormalities were observed in 17.8 percent (%) of the general population of Libby including former workers, family members of workers, and individuals with no specific pathway of exposure (Peipins et al. 2003; Whitehouse et al. 2008; Antao et al. 2012; Larson et al. 2010, 2012a, 2012b). Although the mine has ceased operations, historic or continuing releases of LA from mine-related materials could be serving as a source of ongoing exposure and risk to current and future residents and workers in the area. The Libby Asbestos Superfund Site (Site) was listed on the U.S. Environmental Protection Agency (EPA) National Priorities List in October 2002. 1.2 Document Purpose As determined by previous investigations conducted at the Site, LA is present in multiple environmental media in Libby. However, asbestos fibers in source materials are typically not inherently hazardous, unless the asbestos is released from the source material into air where it can be inhaled (EPA 2008a). If inhaled, asbestos fibers can increase the risk of developing lung cancer, mesothelioma, pleural fibrosis, and asbestosis. Thus, the evaluation of risks to humans from exposure to asbestos is most reliably achieved by the collection of data on the level of asbestos in breathing zone air during disturbance of asbestos source materials, referred to as “activity-based sampling” (ABS) (EPA 2008a). In 2013, the EPA conducted an indoor ABS investigation in Operable Unit 4 (OU4) to evaluate potential exposures to LA released from source materials at properties in Libby. Based on a review of previous indoor ABS data from studies conducted at the Site, the EPA identified two data gaps that required additional investigation at properties. These residential ABS investigations consisted of two different indoor sampling scenarios. The specific objectives and study designs of each sampling scenario are described in the governing sampling and analysis plan/quality assurance project plan (SAP/QAPP), 2013 Indoor Activity-Based Sampling SAP/QAPP (CDM Smith 2013a). Two sampling scenarios were performed to evaluate potential LA exposures to residents:

Data Summary Report: 2013 OU4 Indoor ABS April 2014
Page 12 of 40
Scenario 1: This scenario evaluated indoor ABS LA air concentrations at curb-to-curb properties.
Scenario 2: This scenario was a re-evaluation of indoor ABS air concentrations at properties that were previously sampled during the 2007/2008 indoor ABS study (EPA 2010).
The study design of these sampling scenarios is described in greater detail in Sections 4 and 5. This document will summarize the results of each sampling scenario and provide an interpretation of the collected data. 1.3 Document Organization In addition to this introduction, this report is organized into the following sections: Section 2 This section summarizes data management procedures, including sample
collection, documentation, handling, custody, and data management. Section 3 This section summarizes the analytical methods used for estimating the level of
LA in indoor air and the data reduction methods utilized in this report. Section 4 This section summarizes the data that were collected for Scenario 1 and includes
an overview of the study design, presents the analytical results, and provides an interpretation of the collected data.
Section 5 This section summarizes the data that were collected for Scenario 2 and includes
an overview of the study design, presents the analytical results, and provides an interpretation of the collected data.
Section 6 This section presents the results of the data quality assessment, including a
summary of program audits, modifications, data verification and validation efforts, an evaluation of quality control (QC) samples, and a data adequacy assessment.
Section 7 This section provides full citations for all analytical methods, site-related
documents, and scientific publications referenced in this document. All referenced tables and figures are provided at the end of this document. All referenced appendices are provided electronically unless otherwise specified.

Data Summary Report: 2013 OU4 Indoor ABS April 2014
Page 13 of 40
2 DATA MANAGEMENT 2.1 Sample Collection, Documentation, Handling, and Custody All samples generated as part of the ABS investigations were collected, documented, and handled in accordance with Libby-specific standard operating procedures (SOPs), as specified in the governing SAP/QAPP (CDM Smith 2013a). 2.1.1 Collection Methods ABS Air All ABS activities were performed by an EPA field contractor, CDM Federal Programs Corporation (CDM Smith), in accordance with the ABS scenario scripts provided in the SAP/QAPP. Personal ABS air samples were collected in accordance with SOP EPA-LIBBY-2012-10. In brief, the ABS actor wore two sampling pumps with an air monitoring cassette attached to the pump via a plastic tube. The cassette was affixed to the actor such that the cassette was located within the breathing zone. All air samples were collected using cassettes containing a 25-millimeter (mm) diameter mixed cellulose ester (MCE) filter with a pore size of 0.8-micrometers (μm). The primary air sample was collected using a sampling pump operating at a high flow rate (approximately 5.5 liters per minute [L/min]), and is referred to as the “high volume” (HV) sample. A backup air sample was collected using a sampling pump operating at a low flow rate (approximately 2 L/min), and is referred to as the “low volume” (LV) sample. The HV and LV samples are filter replicates (i.e., each filter represents the same sample collection duration, but different total sample air volumes). The LV sample was analyzed in cases where the HV sample was damaged or overloaded (see Section 3.1.1 for additional information). At the start of each sampling day, each air sampling pump was calibrated using a rotameter that had been calibrated to the primary calibration standard (i.e., a Bios DryCal® DC-Lite). During the ABS activities, pump flow rates were verified every 30 minutes and re-calibrated as appropriate. 2.1.2 Documentation, Handling, and Custody Methods All ABS air samples collected were identified with sample identification (ID) numbers that included a program-specific prefix of “IN-1” (e.g., IN-10001). Data on the sample type, location, collection method, and collection date of all samples were recorded both in a field logbook maintained by the field sampling team and on an field sample data sheet (FSDS) form designed to facilitate data entry into the Libby site database (see Section 2.4). All samples collected in the
Data Summary Report: 2013 OU4 Indoor ABS April 2014
Page 14 of 40
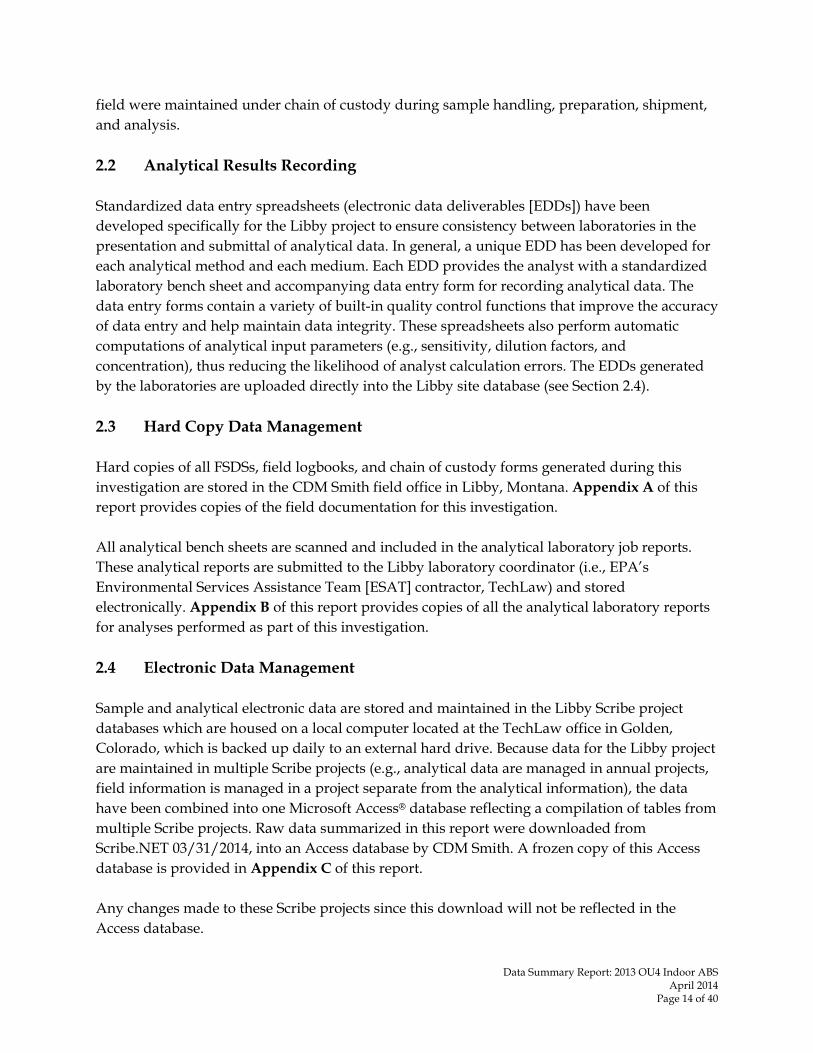
field were maintained under chain of custody during sample handling, preparation, shipment, and analysis. 2.2 Analytical Results Recording Standardized data entry spreadsheets (electronic data deliverables [EDDs]) have been developed specifically for the Libby project to ensure consistency between laboratories in the presentation and submittal of analytical data. In general, a unique EDD has been developed for each analytical method and each medium. Each EDD provides the analyst with a standardized laboratory bench sheet and accompanying data entry form for recording analytical data. The data entry forms contain a variety of built-in quality control functions that improve the accuracy of data entry and help maintain data integrity. These spreadsheets also perform automatic computations of analytical input parameters (e.g., sensitivity, dilution factors, and concentration), thus reducing the likelihood of analyst calculation errors. The EDDs generated by the laboratories are uploaded directly into the Libby site database (see Section 2.4). 2.3 Hard Copy Data Management Hard copies of all FSDSs, field logbooks, and chain of custody forms generated during this investigation are stored in the CDM Smith field office in Libby, Montana. Appendix A of this report provides copies of the field documentation for this investigation. All analytical bench sheets are scanned and included in the analytical laboratory job reports. These analytical reports are submitted to the Libby laboratory coordinator (i.e., EPA’s Environmental Services Assistance Team [ESAT] contractor, TechLaw) and stored electronically. Appendix B of this report provides copies of all the analytical laboratory reports for analyses performed as part of this investigation. 2.4 Electronic Data Management Sample and analytical electronic data are stored and maintained in the Libby Scribe project databases which are housed on a local computer located at the TechLaw office in Golden, Colorado, which is backed up daily to an external hard drive. Because data for the Libby project are maintained in multiple Scribe projects (e.g., analytical data are managed in annual projects, field information is managed in a project separate from the analytical information), the data have been combined into one Microsoft Access® database reflecting a compilation of tables from multiple Scribe projects. Raw data summarized in this report were downloaded from Scribe.NET 03/31/2014, into an Access database by CDM Smith. A frozen copy of this Access database is provided in Appendix C of this report. Any changes made to these Scribe projects since this download will not be reflected in the Access database.

Data Summary Report: 2013 OU4 Indoor ABS April 2014
Page 15 of 40
2.5 Personal Data Security To ensure the personal data security of the home and business owners whose properties were sampled through the course of this study, information on residential/commercial property addresses is “masked” in this data summary report. Actual street addresses (e.g., 123 Main Street) are not shown; instead, properties have been assigned unique property identification numbers (e.g., AD-000123) and these identifiers are used to reference specific properties. Cross-referencing the property identification numbers to the actual street addresses is only possible through use of the Scribe project databases described in Section 2.4. These databases are only available to Scribe subscribers upon approval by the EPA.

Data Summary Report: 2013 OU4 Indoor ABS April 2014
Page 16 of 40
This page intentionally left blank to facilitate double-sided printing.

Data Summary Report: 2013 OU4 Indoor ABS April 2014
Page 17 of 40
3 SAMPLE PREPARATION AND ANALYSIS METHODS 3.1 LA in Air 3.1.1 ABS Sample Analysis Hierarchy As noted previously, for most scenarios, each sampling event resulted in two ABS air samples – one HV sample and one LV sample. These samples are field replicates in that they were collected over the same sampling duration, but using different sampling pump flow rates (resulting in different total air sample volumes). The HV sample was analyzed in preference to the LV sample. If the HV sample was deemed to be overloaded (i.e., more than 25% particulate loading on the filter), the LV sample was analyzed in preference to performing an indirect preparation on the HV sample. If the LV sample was also deemed to be overloaded, an indirect preparation (with ashing) of the HV sample was performed in accordance with SOP EPA-LIBBY-08. 3.1.2 Analysis Method and Counting Rules Air filters collected as part of this effort were prepared and analyzed for asbestos using transmission electron microscopy (TEM) in basic accordance with ISO 10312:1995(E) (ISO 1995), with all applicable Libby-specific laboratory modifications1, including LB-000016, LB-000019, LB-000029, LB-000066, LB-000067, and LB-000085. When a sample is analyzed by TEM, the analyst records the size (length, width) and mineral type of each individual asbestos structure that is observed. Mineral type is determined by selected area electron diffraction (SAED) and energy dispersive spectroscopy (EDS), and each structure is assigned to one of the following four categories:
LA Libby-class amphibole. Structures having an amphibole SAED pattern and an elemental composition similar to the range of fiber types observed in ores from the Libby mine (Meeker et al. 2003). This is a solid solution series of minerals including winchite and richterite, with lower amounts of tremolite, magnesio-arfvedsonite, magnesio-riebeckite, and edenite/ferro-edenite. Depending on the valence state of iron, some minerals may also be classified as actinolite.
OA Other amphibole (OA)-type asbestos fibers. Structures having an amphibole SAED pattern and an elemental composition that is not similar to fiber types from the Libby mine. Examples include crocidolite, amosite, and anthophyllite. There is presently no evidence that these fibers are associated with the Libby mine.
1 Copies of all Libby laboratory modifications are maintained on the Libby Lab eRoom.
Data Summary Report: 2013 OU4 Indoor ABS April 2014
Page 18 of 40
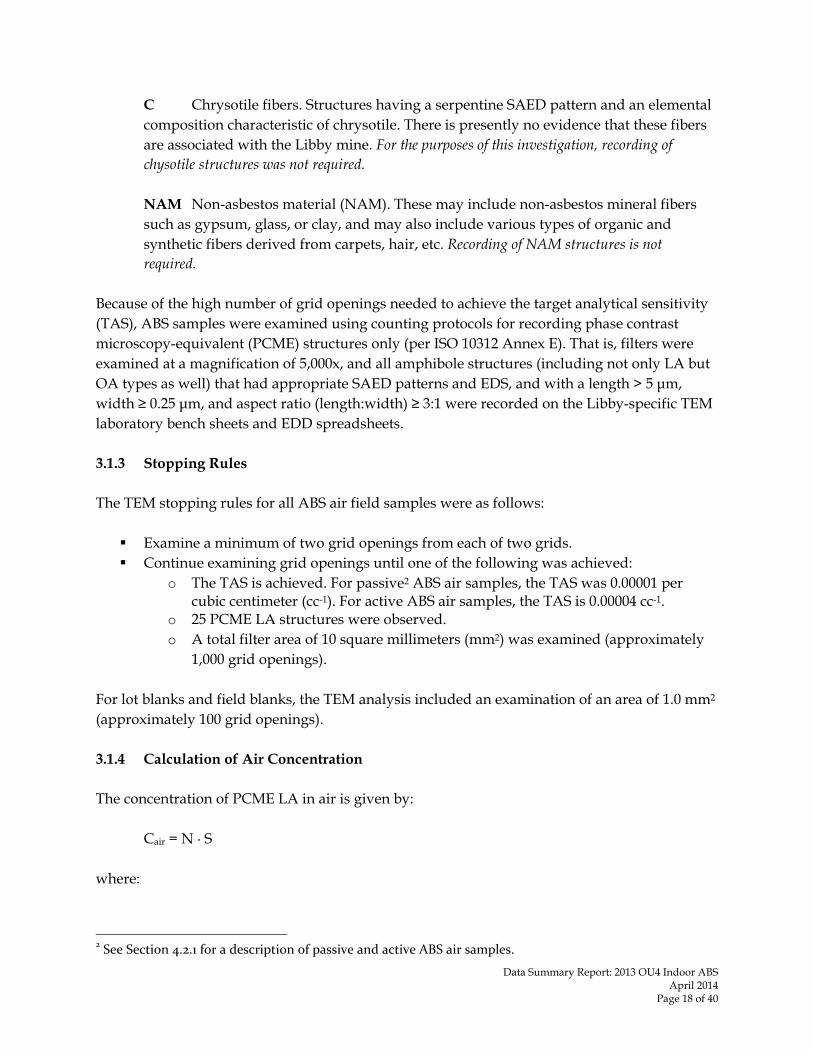
C Chrysotile fibers. Structures having a serpentine SAED pattern and an elemental composition characteristic of chrysotile. There is presently no evidence that these fibers are associated with the Libby mine. For the purposes of this investigation, recording of chysotile structures was not required.
NAM Non-asbestos material (NAM). These may include non-asbestos mineral fibers such as gypsum, glass, or clay, and may also include various types of organic and synthetic fibers derived from carpets, hair, etc. Recording of NAM structures is not required.
Because of the high number of grid openings needed to achieve the target analytical sensitivity (TAS), ABS samples were examined using counting protocols for recording phase contrast microscopy-equivalent (PCME) structures only (per ISO 10312 Annex E). That is, filters were examined at a magnification of 5,000x, and all amphibole structures (including not only LA but OA types as well) that had appropriate SAED patterns and EDS, and with a length > 5 μm, width ≥ 0.25 μm, and aspect ratio (length:width) ≥ 3:1 were recorded on the Libby-specific TEM laboratory bench sheets and EDD spreadsheets. 3.1.3 Stopping Rules The TEM stopping rules for all ABS air field samples were as follows: Examine a minimum of two grid openings from each of two grids. Continue examining grid openings until one of the following was achieved:
o The TAS is achieved. For passive2 ABS air samples, the TAS was 0.00001 per cubic centimeter (cc-1). For active ABS air samples, the TAS is 0.00004 cc-1.
o 25 PCME LA structures were observed. o A total filter area of 10 square millimeters (mm2) was examined (approximately
1,000 grid openings). For lot blanks and field blanks, the TEM analysis included an examination of an area of 1.0 mm2 (approximately 100 grid openings). 3.1.4 Calculation of Air Concentration The concentration of PCME LA in air is given by:
Cair = N · S where:
2 See Section 4.2.1 for a description of passive and active ABS air samples.

Data Summary Report: 2013 OU4 Indoor ABS April 2014
Page 19 of 40
Cair = Air concentration, expressed as structures per cubic centimeter of air (s/cc) N = Number of PCME LA structures observed
S = Analytical sensitivity (cc-1) For air, the analytical sensitivity is calculated as: S = EFA / (GOx · Ago · V · 1000 · F) where: S = Analytical sensitivity (cc-1) EFA = Effective area of the filter (mm2) GOx = Number of grid openings examined Ago = Area of a grid opening (mm2) V = Volume of air passed through the filter (L) 1000 = Conversion factor (cc/L) F = Fraction of primary filter deposited on secondary filter (indirect preparation only) Note that air samples with a count of zero (and hence a concentration of zero) are reported as zero. When computing the best estimate of the mean, samples with a count of zero are evaluated as zero, not at ½ the analytical sensitivity (EPA 2008b). This approach yields an unbiased estimate of the true mean that does not depend on the analytical sensitivity of the samples included in the data set.

Data Summary Report: 2013 OU4 Indoor ABS April 2014
Page 20 of 40
This page intentionally left blank to facilitate double-sided printing.
Data Summary Report: 2013 OU4 Indoor ABS April 2014
Page 21 of 40
4 SCENARIO 1: Curb-to-Curb Properties 4.1 Study Design Detailed information on the study design and program-specific data quality objectives (DQOs) for Scenario 1 are provided in the governing SAP/QAPP (CDM Smith 2013a). In brief, the purpose of the study was to collect data to determine if residential risks from indoor air at properties where soils had been completely removed from the yard (i.e., a “curb-to-curb” yard soil removal had been completed) are within acceptable limits. 4.1.1 Sampling Locations Sampling locations evaluated during Scenario 1 were selected from the list of properties that had undergone a “curb-to-curb” yard removal between the years of 2008 to 2011. After soliciting cooperation from area residents, a total of 10 indoor ABS “curb-to-curb” properties were selected for participation in the study. These properties were selected to provide a reasonable spatial representation in OU4 (i.e., north, central, and south Libby). Figure 4-1 shows the locations of the properties that were sampled as part of the Scenario 1 indoor ABS program. 4.1.2 Disturbance Scenarios Conceptually, indoor air samples could be collected under a wide range of differing activity patterns. For the purposes of this effort, indoor ABS samples were collected under two representative conditions: Active behaviors – This category includes indoor activities in which a person is moving
about the building and potentially disturbing indoor sources. For example, walking from room to room, sitting down on upholstered chairs, sweeping, and vacuuming would all be included.
Passive behaviors – This category includes activities such as sitting and reading a book,
watching television, and working at a desk. The key attribute is that the person is engaging in minimally energetic actions that will have low tendency to disturb any indoor source materials.
During each sampling event, indoor disturbance activities were performed over an 8-hour time interval divided into two sub-periods of four hours each (one for each disturbance scenario)3. All active and passive disturbance activities were performed by EPA contractor personnel.
3 Depending on what was most convenient for the resident, sampling either occurred over one 8‐hour time interval or was divided into two 4‐hour samples on two sequential days.

Data Summary Report: 2013 OU4 Indoor ABS April 2014
Page 22 of 40
Residents did not participate in the disturbance activities and were required to leave the house during the time period of indoor sample collection.
4.1.3 Sampling Times Human health risk from exposure to LA in indoor air is related to the long-term average concentration in indoor air. Indoor ABS air data from the 2007/2008 study showed that concentrations were seasonally dependent because of various factors (e.g., indoor activity patterns, humidity, building ventilation rate), with the highest concentrations observed in the summer and the lowest concentrations observed in the winter. Therefore, indoor ABS was performed two times at intervals that provided seasonal representativeness, as follows:
Event 1 (Winter): February to March of 2013
Event 2 (Summer): July of 2013
The same properties were evaluated in each event.
4.2 Results and Interpretation Table 4-1 summarizes the measured ABS PCME LA air concentrations for each Scenario 1 sampling event. Detailed analytical results are provided in the project database (see Appendix C) and in detailed data summary tables provided in Appendix D. Interpretation of potential exposures and risks associated with these data is beyond the scope of this document and will be evaluated as part of the Site-wide human health risk assessment. In this effort, the level of PCME LA was measured in indoor air at 10 different post-cleanup “curb-to-curb” properties at two different times of year (winter, summer). In each sampling event at each property, two air samples were collected that represented “passive” indoor activities, and another air sample was collected during “active” behaviors. This resulted in a total of 80 indoor ABS air samples collected. Of the 80 ABS air samples collected, either the HV or LV sample was analyzed for each activity. In total, 40 ABS air samples (20 passive, 20 active) were analyzed for PCME LA using TEM. PCME LA was detected in 19 of 40 samples. The concentration of PCME LA observed in the indoor ABS air samples ranged from non-detect to about 0.00083 s/cc. 4.2.1 Comparison of ABS Air Concentrations by ABS Script Figure 4-2 presents a comparison of the ABS air concentration from samples collected during the “active” ABS script (y-axis) to the measured ABS air concentration in the sample collected during the “passive” ABS script (x-axis) at each property for each sampling event (winter/summer). These results show that there is a tendency for ABS air samples collected using an “active” ABS script to have higher PCME LA air concentrations than samples collected

Data Summary Report: 2013 OU4 Indoor ABS April 2014
Page 23 of 40
using a “passive” ABS script. This supports the concept that disturbance of an indoor source, such as contaminated indoor dust, is one contributing factor to indoor air levels of LA. 4.2.2 Comparison of ABS Air Concentrations by Season On average, indoor air levels of PCME LA tended to be lowest during the summer and highest during the winter for both active and passive behaviors. This pattern differs from what was observed in the 2007/2008 indoor ABS investigation (EPA 2010). A plausible explanation for this is that, due to the curb-to-curb removal, track-in of LA-containing soils from the yard during the summer months is no longer occurring. Therefore, outdoor soil is not likely a contributing factor to LA levels indoors, thus only indoor sources are contributing to LA levels observed in indoor ABS air. In contrast, for properties sampled during the 2007/2008 indoor ABS investigation, because properties did have LA-containing soils, soil track-in from the yard during the summer months was a contributing factor to LA in indoor air. This would provide possible explanation for the higher LA levels in indoor ABS air in the summer (when the possibility for track-in of outdoor soil is greater) versus the winter. 4.2.3 Relation of ABS Air Concentrations to Potential Indoor Sources of LA None of the properties investigated for this scenario had known exposed vermiculite in the house. Half of the properties have never had vermiculite insulation in the house, while the other half of the properties formerly had vermiculite insulation or the known sources of vermiculite are not accessible (e.g., vermiculite remains in the soil floor of the crawlspace beneath polysheeting). Because of this, a comparison of ABS air concentrations for properties with sources of vermiculite versus properties without sources of vermiculite has not been performed. In addition, information regarding current or former exposure at the property (e.g. former miners being present, close relatives of miners, or any highly exposed persons living at or visiting the property) was unable to be used to determine a possible trend in the data. Half of the properties had information indicating current or former exposure of people being present on the property with no discernable trend in either direction to indicate whether or not historical exposure of people at the residence was a contributing factor to indoor ABS air concentrations.

Data Summary Report: 2013 OU4 Indoor ABS April 2014
Page 24 of 40
This page intentionally left blank to facilitate double-sided printing.

Data Summary Report: 2013 OU4 Indoor ABS April 2014
Page 25 of 40
5 SCENARIO 2: 2007/2008 Properties 5.1 Study Design Detailed information on the study design and program-specific DQOs for Scenario 2 is provided in the governing SAP/QAPP (CDM Smith 2013a). In brief, the purpose of the study was to collect data to provide information on potential changes in indoor ABS concentrations over time at properties that were originally evaluated in 2007/2008.
5.1.1 Sampling Locations
Sampling locations evaluated during Scenario 2 were selected from properties which had been studied during the 2007/2008 ABS study. Scenario 2 utilized the same four property classification categories defined in the 2007/2008 study. These categories were based on whether or not previous outdoor soil cleanup actions had taken place and at what levels vermiculite and/or LA remained in soil post-cleanup as seen by polarized light microscopy (PLM), as follows:
Category Did outdoor soil
cleanup take place?
Post-cleanup Surface Soil
VCS PLM
1 No
- and - 2 + or + 3
Yes - and -
4 + and + VCS: vermiculite-containing soil is present (+) or absent (-) PLM: LA result is detect (+) or non-detect (-) After soliciting cooperation from area residents, a total of 10 indoor ABS properties were selected for participation in the study. These properties were selected to provide a reasonable spatial representation in OU4 (i.e., north, central, and south Libby). Figure 5-1 shows the locations of the properties that were sampled as part of the Indoor ABS program.
5.1.2 Disturbance Scenerios
The same disturbance scenarios and sampling methodologies that were utilized in Scenario 1 (see Section 4.1.2) were used for Scenario 2. In brief, indoor ABS air samples were collected under two representative behavior conditions, active and passive.

Data Summary Report: 2013 OU4 Indoor ABS April 2014
Page 26 of 40
5.1.3 Sampling Times
Scenario 2 was conducted to provide information on potential changes in indoor ABS concentrations from previously collected data in 2007/2008. The levels of LA in indoor air may depend on factors that vary seasonally. The indoor ABS results from 2007/2008 showed that concentrations were highest in the summer and lowest in the winter (EPA 2010). Therefore, to maximize the likelihood for detecting LA and allow for a more meaningful comparison to the 2007/2008 results, for the 2013 study, ABS activities were performed during the months of July, August, and September.
5.2 Results and Interpretation Table 5-1 summarizes the measured indoor ABS PCME LA air concentrations for the Scenario 2 event conducted in 2013, as well as the indoor ABS results for these properties from the 2007/2008 study. Detailed analytical results are provided in the project database (see Appendix C) and in detailed data summary tables provided in Appendix D. As noted above, interpretation of potential exposures and risks is beyond the scope of this document and will be evaluated as part of the Site-wide human health risk assessment. In this effort, the level of LA was measured in indoor air at 10 different properties which had been evaluated in 2007/2008. At each property, two air samples were collected, one that represented “passive” indoor activities, and one that represented “active” behaviors. This resulted in a total of 40 indoor ABS air samples collected. Of the 40 air samples collected, either the HV or LV sample was analyzed for each activity. In total, 20 air samples (10 passive, 10 active) were analyzed for PCME LA using TEM. PCME LA was detected in 8 of 20 samples collected in 2013. The concentration of PCME LA observed in the indoor ABS air samples ranged from non-detect to about 0.00056 s/cc. 5.2.1 Comparison of ABS Air Concentrations by ABS Script Figure 5-2 presents a comparison of the ABS air concentration from samples collected during the “active” ABS script (y-axis) to the measured ABS air concentration in the sample collected during the “passive” ABS script (x-axis) at each property sampled in 2013. These results show that there is a tendency for ABS air samples collected using an “active” ABS script to have higher PCME LA air concentrations than samples collected using a “passive” ABS script.
5.2.2 Comparison of ABS Air Concentrations by Year
Because properties selected for evaluation in the 2013 ABS study were also evaluated in the 2007/2008 ABS study, it is also possible to evaluate the potential differences in measured ABS air concentrations at a given property as a function of sampling year. Figure 5-3 presents a

Data Summary Report: 2013 OU4 Indoor ABS April 2014
Page 27 of 40
comparison for each property of the measured PCME LA air concentration for ABS samples collected during the summer of 2007 (y-axis) to the PCME LA air concentration for ABS samples collected in the summer of 2013 (x-axis) for both active and passive behaviors. In general, the passive and/or the active ABS air concentrations were higher in 2007 than in 2013 for more than half of all properties sampled. On average (see Table 5-1), ABS air concentrations measured in the summer of 2007 were higher than those measured in the summer of 2013. Because the same property was evaluated in both years using the same ABS script, the most likely explanation for these differences is that they demonstrate the inherent variability in ABS air results and the likelihood that indoor air concentrations have decreased over time. This decrease over time could be due to continual cleaning by residents after interior removals and cleanings have taken place, thereby reducing residual levels of LA over time.

Data Summary Report: 2013 OU4 Indoor ABS April 2014
Page 28 of 40
This page intentionally left blank to facilitate double-sided printing.
Data Summary Report: 2013 OU4 Indoor ABS April 2014
Page 29 of 40
6 DATA QUALITY ASSESSMENT Data quality assessment (DQA) is the process of reviewing existing data to establish the quality of the data and to determine how any data quality limitations may influence data interpretation (EPA 2006). 6.1 Field and Laboratory Oversight 6.1.1 Field Field surveillances consist of periodic observations made to evaluate adherence to investigation-specific governing documents. Field audits are broader in scope than field surveillances and are evaluations conducted by qualified technical or quality assurance (QA) staff that are independent of the activities audited. A field audit was conducted for the 2013 Indoor ABS program on February 28, 2013 (CDM Smith 2013b). This audit reviewed passive and active ABS activities performed under the governing SAP/QAPP (CDM Smith 2013a), including air sample collection, field quality control (QC) sample collection, equipment calibration and decontamination procedures, and personal protective equipment. In addition, a review of field documentation, including field logbook entries, FSDS forms, property background forms, and ABS area sketches was performed. The following overall conclusions were noted:
All teams had field access to the latest version of the governing SAP/QAPP. No deficiencies were noted regarding the collection of the ABS personal air samples;
sampling requirements specified in the SAP/QAPP were met by field personnel for ABS air sampling activities.
No deficiencies were noted regarding general field processes; the general process requirements specified in the SAP/QAPP were met by field personnel.
The field QC sample types and collection frequencies specified in the SAP were met by field personnel.
Field documentation reviewed was remarkably consistent, legible, and had few errors or omissions; field documentation requirements specified in the SAP/QAPP were met by field personnel.
In summary, no significant deficiencies were observed the day of the audit. The auditor noted that the sampling team members worked well together and that the documentation met the required procedures.

Data Summary Report: 2013 OU4 Indoor ABS April 2014
Page 30 of 40
6.1.2 Laboratory Laboratory audits are conducted to evaluate laboratory personnel to ensure that samples are handled and analyzed in accordance with the program-specific documents and analytical method requirements (or approved Libby laboratory modification forms) to make certain that analytical results reported are correct and consistent. All aspects of sample handling, preparation, and analysis are evaluated. If any issues are identified, laboratory personnel are notified and retrained as appropriate. A series of laboratory audits was performed in 2013 to evaluate all of the Libby laboratories. Detailed audit findings for each laboratory are anticipated to be reported in separate laboratory-specific audit reports by CB&I Federal Services, LLC [CB&I], formerly Shaw Environmental & Infrastructure Group [Shaw E&I]. Impacts to data quality for TEM analyses will be determined upon receipt of the audit reports.
6.2 Field and Laboratory Modifications During a large-scale sampling program, such as this ABS investigation, deviations from the original SAP/QAPP or SOPs may occur and/or it may be necessary to modify procedures as originally specified to optimize sample collection. Any field or laboratory deviations or modifications from the SAP/QAPP and/or SOPs have been recorded on a Libby-specific Record of Modification (ROM) form. The ROM forms have been used to document all permanent and temporary changes to procedures contained in guidance documents governing this investigation that have the potential to impact data quality or usability. Any minor deviations (i.e., those that will not impact data quality or usability) have been documented in the field logbooks. Appendix E provides copies of all applicable modifications associated with this investigation. One Libby field ROM (LFO-000183) was instituted for the 2013 Indoor ABS investigation. In brief, the flow rate for the sample pumps was 5.0 L/min instead of 5.5 L/min to improve flow rate consistency during the sampling event. As a result, the total air volume collected was lower for the specified sampling duration, which required additional grid openings to be examined to achieve the TAS. In addition, sampling events extended into the month of September due to schedule conflicts with property owners. The deviations identified in this field ROM are not expected to negatively impact data quality or usability. 6.3 Data Review, Verification, and Validation 6.3.1 Data Review and Verification The Libby Scribe project databases have a number of built-in quality control checks to identify unexpected or unallowable data values during upload into the database. Any issues identified

Data Summary Report: 2013 OU4 Indoor ABS April 2014
Page 31 of 40
by these automatic upload checks were resolved by consultation with the field teams and/or analytical laboratory before entry of the data into the database. After entry of the data into the database, several additional data verification steps were taken to ensure the data were recorded and entered correctly. In order to ensure that the database accurately reflects the original hard copy documentation, all data downloaded from the database were examined to identify data omissions, unexpected values, or apparent inconsistencies. In addition, because these results will be provided to the property owners, 100% of all samples and analytical results for this ABS investigation underwent a detailed verification. In brief, verification involves comparing the data for a sample in the database to information on the original hard copy FSDS form and on the original hard copy analytical bench sheets for that sample. Any omissions or apparent errors identified during the verification were submitted to the field teams and/or analytical laboratories for resolution in the database and in the hard copy documentation. Appendix F presents the detailed findings of the data verification effort for this ABS investigation. These findings are summarized below.
FSDS Review. Hard copy FSDS forms were reviewed for a total of 60 ABS samples as part of the data verification effort in accordance with Libby-specific SOP EPA-LIBBY-11, FSDS Data Review and Data Entry Verification. The critical error4 rate based on a review of the FSDS forms was about 2%. In brief, the issues identified were important for the purposes of sample tracking (e.g., location ID, property ID and personnel task), but would not have influenced the quantitative analytical results reported for the sample. TEM Review. A total of 60 TEM analyses for ABS air were reviewed as part of the data verification effort in accordance with Libby-specific SOP EPA-LIBBY-09, TEM Data Review and Data Entry Verification. Errors in critical data fields were identified in about 5% of analyses during the verification process, however, the issues identified were non-critical in nature from a data interpretation perspective. The majority of the issues were related to data entry errors in the grid opening name, instrument ID, preparer name, prepared by, etc. fields in the EDD.
All issues identified during the data verification effort were submitted to the field teams and/or analytical laboratories for resolution and rectification. All tables, figures, and appendices (including all hard copy documentation and the database [provided in Appendix A and Appendix B, respectively]) generated for this report reflect corrected data.
4 A critical error is defined as an issue that could influence the reported sample concentration or location information

Data Summary Report: 2013 OU4 Indoor ABS April 2014
Page 32 of 40
6.3.2 Data Validation Unlike data verification, where the goal is to identify and correct data reporting errors, the goal of data validation is to evaluate overall data quality and to assign data qualifiers, as appropriate, to alert data users to any potential data quality issues. Data validation is performed by the EPA Quality Assurance Technical Support (QATS), CB&I, with support from technical support staff that are familiar with investigation-specific data reporting, analytical methods, and investigation requirements. For the Libby project, data validation of TEM and PLM results is performed in accordance with Libby-specific validation SOP that were developed based on the draft National Functional Guidelines (NFG) for Asbestos Data Review (EPA 2011). The EPA QATS contractor prepares an annual summary of the program-wide assessment of quality assurance (QA)/ QC. This annual addendum provides detailed information on the validation procedures performed and provides a narrative on the quality assessment for each type of analysis (e.g., TEM, PLM), including the data qualifiers assigned and the reason(s) for these qualifiers to denote when results do not meet acceptance criteria. This annual summary details any deficiencies, required corrective actions, and makes recommendations for changes to the QA/QC program to address any data quality issues. A copy of the annual program-wide QA/QC summary report covering samples collected and analyzed in 2013 is currently pending. When this report is finalized, it will be located on the Libby Lab eRoom. Interpretation of the data quality is subject to change upon completion of this report. 6.4 Field Quality Control Field-based QC samples are those samples which are prepared in the field and submitted to the laboratory in a blind fashion. That is, the laboratory is not aware the sample is a QC sample, and treats the sample in the same way as a field sample. Two types of field QC samples were collected as part of ABS air sampling for this investigation – lot blanks and field blanks. 6.4.1 Lot Blanks A lot blank is a randomly selected filter cassette from a manufactured lot. Lot blanks are collected to ensure air samples for asbestos analysis are collected on asbestos-free filters. Lot blank sampling is performed at a frequency of one lot blank per every 500 cassettes. Only cassette lots where no asbestos is detected in the lot blank are placed into circulation for use in

Data Summary Report: 2013 OU4 Indoor ABS April 2014
Page 33 of 40
air sample collection, which ensures that the air cassette filters used in this study were free of asbestos fibers prior to sampling activities. 6.4.2 Field Blanks Field blanks are collected to evaluate potential contamination introduced during sample collection, shipping and handling, or analysis. As specified in the SAP/QAPP (CDM Smith 2013a), field blanks were to be collected at a rate of one per sampling team per day, which would have resulted in a total of 33 field blank samples. Of these, six were to be analyzed (two from the winter and four from the summer). A total of 29 field blank samples were collected during this ABS investigation. The target collection frequency for field blanks was not achieved during four out of 33 sampling events (i.e., field blanks were not collected by every team on every day when field sampling occurred). Six field blank samples were chosen, as specified in the SAP/QAPP, to be analyzed for asbestos by TEM (1.0 mm2 of filter was examined for each field blank). Table 6-1 presents the results of all analyzed field blanks for this investigation. No asbestos structures were reported in any of the analyzed field blanks. These results demonstrate that asbestos was not introduced into the air samples as a consequence of sample collection, shipping and handling, or analysis. Because of this, the four field blanks that were not collected are not considered to be a critical issue. 6.5 Laboratory Quality Control Preparation and analytical laboratory QC analyses are evaluated by the EPA QATS contractor on a program-wide basis rather than on an investigation-specific basis. The rationale for this is that the number of laboratory QC samples directly related to this investigation is too limited to draw meaningful conclusions regarding overall data quality. Refer to the pending program-wide QA/QC summary report covering samples collected and analyzed in 2013 for information regarding program-wide data quality of the laboratories. As noted previously, interpretation of the data quality is subject to change upon completion of this report. 6.6 Data Adequacy A comparison of the data collected with the DQOs specified in the governing SAP/QAPP (CDM Smith 2013a) is presented below. 6.6.1 Spatial and Temporal Representativeness Spatial As specified in the DQOs, the spatial bounds of this study were to be restricted to properties located within OU4 of the Libby Asbestos Superfund Site. This OU includes most current residential and commercial properties in the Libby community. All of the samples collected as

Data Summary Report: 2013 OU4 Indoor ABS April 2014
Page 34 of 40
part of this study were collected from properties selected to be spatial representation in OU4 (i.e., north, central, and south Libby). Thus, the collected data meet the spatial objectives specified in the in the governing SAP/QAPP. Temporal As specified in the DQOs, the exact dates of ABS sampling were not important and selected at random, within the following constraints: For Scenario 1 (curb-to curb properties), because it was not possible to conduct ABS in
all four seasons, preference was to be given to sampling in the summer (July-September) and winter (December-March), since previous indoor ABS sampling (EPA 2010) showed these two seasons represented the lowest (winter) and highest (summer) exposure conditions, to ensure that results span the full range of expected concentrations.
For Scenario 2 (2007/2008 repeat), since the goal was to compare indoor ABS conditions in 2007/2008 to conditions in 2013, focus placed on sampling in the summer (July-September), since that is the season when indoor ABS concentrations were shown to be highest (EPA 2010), to maximize the ability to make comparisons between the datasets.
With exception of the few deviations noted in LFO-000183 (see Section 6.2), all samples were collected within the constraints specified above. Thus, it is concluded that, the collected data meet the temporal objectives specified in the in the governing SAP/QAPP. 6.6.2 Sample Completeness The completeness of the dataset is described as a ratio of the amount of data expected from the field program versus the amount of valid data received from the laboratory. For the purposes of this investigation, valid data are considered to be those that have not been rejected during the validation process and have been verified in accordance with the Libby-specific data verification SOPs. Completeness can be expressed by the following equation:
(total number of valid results) Completeness = x 100
(total number of requested results)
Based on the data verification (Section 6.3.1) and data validation (Section 6.3.2) findings discussed above, the completeness of each sample set collected as part of this ABS investigation is shown in Table 6-2. As shown, the actual number of samples collected and analyses performed met or exceeded the target for all scenarios (i.e., 100% completeness).

Data Summary Report: 2013 OU4 Indoor ABS April 2014
Page 35 of 40
6.6.3 Confirmation of TEM Analysis Stopping Rules Specific requirements for the TEM analysis of ABS air samples were detailed in the SAP/QAPP (CDM Smith 2013a). The analysis stopping rules were summarized in Section 3.1.4 of this report. In brief, analysis continued until either the TAS (passive ABS samples of 0.00001 cc-1, active ABS samples of 0.00004 cc-1) was achieved, 25 PCME LA structures were observed, or a total filter area of 10 mm2 was examined (approximately 1,000 grid openings). Of the 60 ABS air samples analyzed, 16 samples (27%) achieved the TAS (or lower) and none of the samples observed 25 or more PCME LA structures. For 44 ABS air samples (73%), the analysis continued until 10 mm2 of filter had been examined (i.e., the maximum filter area examined achieved the stopping rule). The air concentration estimates for these samples have somewhat higher uncertainty than if the samples had been analyzed until the TAS was achieved. Out of the 44 samples that did not reach the TAS, 21 (52%) were non-detect. The achieved sensitivities for these samples ranged from about 0.00003 cc-1 to 0.00008 cc-1 for active ABS samples, and 0.00007 cc-1 to 0.0002 cc-1 for passive ABS samples. Thus, any interpretation on non-detect results needs to consider the achieved analytical sensitivity. For those samples that did have structures detected and did not reach the TAS, the level of uncertainty is reduced. 6.6.4 ABS Air Filter Loading The TEM analysis of ABS air filters examines only a portion of the total filter. For the purposes of computing air concentration for the sample, it is assumed that the filter is evenly loaded. The assessment of filter loading evenness is evaluated using a Chi-square (CHISQ) test, as described in ISO 10312 Annex F2. If a filter fails the CHISQ test for evenness, the reported result may not be representative of the true concentration in the sample, and the results should be given low confidence. An evaluation of filter loading for the 60 filters analyzed by TEM showed that, with the exception of one analysis (IN-10150), all filters passed the CHISQ test (i.e., p-value ≥ 0.001) (see Table 6-3). According to ISO 10312, if a filter fails the CHISQ test, additional grid openings may be examined or the sample may be prepared by an indirect method. Although the sample that did not pass the CHISQ test was prepared directly, over 1,000 grid openings were examined. Upon review of the raw structure data, grid openings in which structures were observed contained one or two structures; thus, the uneven loading present on this filter may simply be a consequence of random variability. Because this filter may have had uneven loading, results for this sample have a higher level of uncertainty. The frequency of CHISQ failure was about 2% for this study, which indicates that uneven filter loading is not of significant concern for the ABS air samples analyzed in this study.

Data Summary Report: 2013 OU4 Indoor ABS April 2014
Page 36 of 40
6.6.5 Indirect Preparation of ABS Filters During TEM analysis, the analytical laboratories noted that the HV filter for 23 ABS air samples was overloaded with particulates (i.e., particulate loading was greater than 25%). For 21 of these ABS air samples, the corresponding LV filter was able to be prepared directly. Because the LV filter represents the same sampling duration but a lower total air sample volume, the only consequence of preparing the LV filter instead of the HV filter is that more grid openings needed to be examined to achieve the analytic requirements. For two of these ABS air samples, the corresponding LV filter was also determined to be overloaded, thus the HV filter was analyzed using an indirect preparation method (each filter was prepared by ashing the primary filter). For chrysotile asbestos, indirect preparation often tends to increase structure counts due to dispersion of bundles and clusters (Hwang and Wang 1983; HEI-AR 1991; Breysse 1991). For amphibole asbestos, the effects of indirect preparation are generally much smaller (Bishop et al., 1978; Sahle and Laszlo, 1996; Harris 2009). Recently, the EPA has conducted two Libby-specific studies to evaluate the potential effect of indirect preparation on reported LA air concentrations. These studies show that indirect preparation may increase PCME LA air concentrations by a factor of about 2-3 relative to direct preparation (Berry et al. 2013). The insensitivity of PCME LA air concentration estimates to preparation method is likely due to the fact that a majority of the LA structures observed for Libby air samples tend to be “free” fibers (i.e., fibers not associated with bundles, matrices, or clusters) that are not subject to dispersal during an indirect preparation (Berry et al. 2013). Based on these considerations, it is concluded that preparation of samples using an indirect preparation method is a relatively minor source of uncertainty for LA. 6.7 Data Quality Conclusions Taken together, these results indicate that data collected as part of the 2013 indoor ABS investigation are of acceptable quality and are considered to be reliable and appropriate for their intended use.

Data Summary Report: 2013 OU4 Indoor ABS April 2014
Page 37 of 40
7 REFERENCES Amandus, H.E., and Wheeler, R. 1987. The Morbidity and Mortality of Vermiculite Miners and Millers Exposed to Tremolite-Actinolite: Part II Mortality. American Journal of Industrial Medicine 11:15-26. Amandus, H.E., Wheeler, P.E., Jankovic, J., and Tucker, J. 1987. The Morbidity and Mortality of Vermiculite Miners and Millers Exposed to Tremolite-Actinolite: Part I Exposure Estimates. American Journal of Industrial Medicine. 11:1-14. Antao, V.C.,Larson, T.C., Horton, D.K. 2012. Libby vermiculite exposure and risk of developing asbestos-related lung and pleural diseases. Current Opinion in Pulmonary Medicine 18(2):161-167.
Berry, D, Brattin W, Formanek E, and Woodbury L. 2013. Comparison of Amphibole Air Concentrations Resulting from Direct and Indirect Filter Preparation Methods. J. Occ. Environ. Hyg. [manuscript in preparation] Bishop K, Ring S, Suchanek R, Gray D. 1978. Preparation Losses and Size Alterations for Fibrous Mineral Samples. Scanning Electron Microsc. I:207. Breysse, PN. 1991. Electron Microscopic Analysis of Airborne Asbestos Fibers. Crit. Rev. Analyt. Chem. 22:201-227.
CDM Smith. 2012. Phase V Sampling and Analysis Plan/Quality Assurance Project Plan for Operable Unit 3 Libby Asbestos Superfund Site Part A: Kootenai River Surface Water, Sediment, and Activity-based Sampling. Prepared for U.S. Environmental Protection Agency. Prepared by CDM Federal Programs Corporation. March 2012. CDM Smith. 2013a. Sampling and Analysis Plan/Quality Assurance Project Plan: 2013 Indoor Activity-Based Sampling, Libby Asbestos Superfund Site, Libby Asbestos Superfund Site, Operable Unit 4. Revision 0, February.
CDM Smith 2013b. Memorandum. Quality Assurance Field Audit Report – Libby Asbestos Project – 2013 Indoor Activity-Based Sampling Audit Report.
EPA. 2006. Guidance on Systematic Planning Using the Data Quality Objectives Process – EPA QA/G4. U.S. Environmental Protection Agency, Office of Environmental Information. EPA/240/B-06/001. February. http://www.epa.gov/quality/qs-docs/g4-final.pdf EPA. 2008a. Performance Evaluation of Laboratory Methods for the Analysis of Asbestos in Soil at the Libby, Montana Superfund Site. Produced by Syracuse Research Corporation for EPA, Region 8. Draft – October 7, 2008. EPA. 2008b. Characteristic EDS Spectra for Libby-Type Amphiboles. Produced by Syracuse Research Corporation for EPA, Region 8. Final – March 18, 2008.

Data Summary Report: 2013 OU4 Indoor ABS April 2014
Page 38 of 40
EPA. 2010. Activity-Based Sampling Summary Report, Operable Unit 4, Libby, Montana, Superfund Site. U.S. Environmental Protection Agency, Region 8. June. EPA. 2011. National Functional Guidelines for Asbestos Data Review. U.S. Environmental Protection Agency, Office of Superfund Remediation and Technology Innovation. Draft – August. Harris, J. 2009. TEM Observations of Amphiboles from El Dorado Hills Study. Geological Society of America Abstracts with Programs, October 21, 2009. Vol. 41, No. 7, p. 703.
Hwang, CY, and Wang, ZM. 1983. Comparison of Methods of Assessing Asbestos Fibre Concentrations. Arch Environ Health 38:5-10.
Larson, T.C., Meyer, C.A., Kapil, V., Gurney, J.W., Tarver, R.D., Black, C.B., and Lockey, J.E. 2010. Workers with Libby Amphibole Exposure: Retrospective Identification and Progression of Radiographic Changes. Radiology 255(3):924-933.
Larson, T.C., Lewin, M., Gottschall, E.B., Antao, V.C., Kapil, V., Rose, C.S. 2012a. Associations between radiographic findings and spirometry in a community exposed to Libby amphibole. Occup. Environ Med. 69(5):361-6.
Larson, T.C., Antao, A.C., Bove, F.J., Cusack, C. 2012b. Association Between Cumulative Fiber Exposure and Respiratory Outcomes Among Libby Vermiculite Workers. J. Occup. Environ. Med. 54(1): 56-63.
McDonald JC, Harris J, Armstrong B. 2004. Mortality in a cohort of vermiculite miners exposed to fibrous Amphibole in Libby, Montana. Occup. Environ. Med. 61:363-366. McDonald, J.C., McDonald, A.D., Armstrong, B., and Sebastien, P. 1986. Cohort Study of Mortality of Vermiculite Miners Exposed to Tremolite. British Journal of Industrial Medicine 43:436-444. Meeker GP, Bern AM, Brownfield IK, Lowers HA, Sutley SJ, Hoeffen TM, Vance JS. 2003. The Composition and Morphology of Amphiboles from the Rainy Creek Complex, Near Libby, Montana. American Mineralogist 88:1955-1969.
Peipins, L.A., Lewin, M., Campolucci, S., Lybarger, J.A., Kapil, V., Middleton, D., Miller, A., Weis, C., Spence, M., and Black, B., 2003. Radiographic Abnormalities and Exposure to Asbestos-Contaminated Vermiculite in the Community of Libby, Montana, USA. Environmental Health Perspectives 111:1753-1759. Sahle W and Laszlo I. 1996. Airborne Inorganic Fibre Monitoring by Transmission Electron Microscope (TEM): Comparison of Direct and Indirect Sample Transfer Methods. Ann. Occup. Hyg. 40:29-44.

Data Summary Report: 2013 OU4 Indoor ABS April 2014
Page 39 of 40
Sullivan, P.A. 2007. Vermiculite, Respiratory Disease and Asbestos Exposure in Libby, Montana: Update of a Cohort Mortality Study. Environmental Health Perspectives 115(4):579-585. Whitehouse AC, Black CB, Heppe MS, Ruckdeschel J, Levin SM. 2008. Environmental exposure to Libby asbestos and mesotheliomas. Am. J. Ind. Med. 51:877-880.

Data Summary Report: 2013 OU4 Indoor ABS April 2014
Page 40 of 40
This page intentionally left blank to facilitate double-sided printing.
Data Summary Report: 2013 Indoor Activity-Based Sampling
Libby Asbestos Superfund Site, Operable Unit 4
TABLES

This page intentionally left blank to facilitate double-sided printing.

Table 4-1. Scenario 1: Curb-to-Curb Properties Results
Passive Active Passive Active
AD-002052 0 0 0 0.00059
AD-003193 0.000057 0.00054 0 0.000080
AD-003238 0 0 0 0.000040
AD-005109 0.000077 0 0.000032 0.000040
AD-001712 0.00015 0 0 0
AD-001733 0.000079 0.00024 0.000096 0.00083
AD-001807 0.000079 0.000074 0 0
AD-002223 0.00024 0.000070 0 0
AD-002368 0 0.00023 0 0
AD-004749 0 0 0.000095 0
0.000068 0.00012 0.000022 0.00016
Notes:
s/cc - structures per cubic centimeter
PCME - phase contrast microscopy equivalent
LA - Libby amphibole
ABS - activity-based sampling
Commercial
Residential
Average
Summer 2013
PCME LA ABS Air Conconcentration Results (s/cc)
Property ID Winter 2013Property Type

Table 5‐1. Scenario 2: 2007/08 Indoor ABS and 2013 Results
Passive Active Passive Active Passive Active Passive Active Passive Active
AD‐001888 0.00020 0 0 0 0 0 0 0 0.000032 0
AD‐003814 0 0.00020 0 0 0 0 0 0 0 0
AD‐001857 0 0 0 0 0 0 0 0 0 0
AD‐003679 0 0.00081 0.00020 0.00020 0 0 0 0 0 0.000040
AD‐000258 0 0 0.00020 0.00040 0 0 0 0.00020 0.000088 0.00056
AD‐001623 0 0.00020 0 0 0 0 0 0.00024 0.000030 0
AD‐004460 0 0.00020 0 0 0 0 0 0.00020 0 0
AD‐000293 0.00040 0 0 0 0 0 0 0.00020 0 0.00015
AD‐000079 0 0 0 0 0 0 0 0.00024 0 0
AD‐001007 0 0 0 0.0016 0 0 0 0 0.000032 0.000075
Average 0.000059 0.00014 0.000040 0.00022 0 0 0 0.00011 0.000018 0.000082
Notes:
s/cc ‐ structures per cubic centimeter
PCME ‐ phase contrast microscopy equivalent
LA ‐ Libby amphibole
ABS ‐ activity‐based sampling
Summer
PCME LA ABS Air Conconcentration Results (s/cc)
2007/2008 ABS Investiagtion 2013 InvestigationProperty ID
Summer Fall Winter Spring

Table 6‐1. Evaluation of Field Blanks by TEM
LA OA CH
IN‐10003 2/18/2013 0 0 0
IN‐10014 2/28/2013 0 0 0
IN‐10057 7/10/2013 0 0 0
IN‐10071 7/15/2013 0 0 0
IN‐10107 7/24/2013 0 0 0
IN‐10112 7/27/2013 0 0 0
Notes:
TEM ‐ transmission electron microscopy
LA ‐ Libby amphibole
OA ‐ other amphibole
CH ‐ chrysotile
Sample IDSample
Date
Structure Count

Table 6‐2. Target and Actual Number of Samples Collected and Analyzed
Target Actual Target Actual
1 (curb‐to‐curb, winter) 10 x 1 x 4 = 40[a] 40 20
[b] 20 100%
1 (curb‐to‐curb, summer) 10 x 1 x 4 = 40 [a] 40 20
[b] 20 100%
2 (2007/2008) 10 x 1 x 4 = 40 [a] 40 20 [b] 20 100%
Total 120 120 60 60 100%
Notes:
HV ‐ high volume
LV ‐ low volume
ABS ‐ activity‐based sampling
[b]Either the HV or the LV ABS sample was analyzed
[a]10 properties x 1 sampling event x 4 HV/LV air sample combined per sampling event
ScenarioAir Samples Collected Air Samples Analyzed
Completeness

Table 6‐3. Evaluation of Filter Loading Evenness
Sample ID
Filter Preparation
Method
Chi‐Square Test
p‐value
Chi‐Square Test
Conclusion*
IN‐10056 Direct 5.1E‐01 pass
IN‐10058 Direct 1.0E+00 pass
IN‐10063 Direct 1.0E+00 pass
IN‐10065 Indirect ‐ Ashed 5.1E‐01 pass
IN‐10067 Direct 5.1E‐01 pass
IN‐10069 Direct 5.9E‐01 pass
IN‐10096 Direct 1.0E+00 pass
IN‐10099 Direct 4.9E‐01 pass
IN‐10102 Direct 1.0E+00 pass
IN‐10105 Direct 5.0E‐01 pass
IN‐10108 Direct 1.0E+00 pass
IN‐10110 Direct 1.0E+00 pass
IN‐10033 Direct 4.9E‐01 pass
IN‐10039 Direct 5.1E‐01 pass
IN‐10044 Direct 5.5E‐01 pass
IN‐10049 Direct 5.1E‐01 pass
IN‐10053 Direct 5.0E‐01 pass
IN‐10148 Direct 5.1E‐01 pass
IN‐10150 Direct 1.6E‐05 fail
IN‐10154 Direct 1.0E+00 pass
IN‐10155 Direct 5.0E‐01 pass
IN‐10005 Direct 1.0E+00 pass
IN‐10009 Direct 1.0E+00 pass
IN‐10015 Direct 1.0E+00 pass
IN‐10022 Direct 1.0E+00 pass
IN‐10028 Direct 1.0E+00 pass
IN‐10072 Direct 1.0E+00 pass
IN‐10074 Direct 1.0E+00 pass
IN‐10077 Direct 1.0E+00 pass
IN‐10079 Direct 1.0E+00 pass
IN‐10082 Direct 1.0E+00 pass
IN‐10084 Direct 1.0E+00 pass
IN‐10087 Direct 1.0E+00 pass
IN‐10089 Direct 1.0E+00 pass
IN‐10092 Direct 1.0E+00 pass
IN‐10095 Direct 1.0E+00 pass
IN‐10001 Direct 4.9E‐01 pass
IN‐10006 Direct 1.0E+00 pass
IN‐10012 Direct 1.0E+00 pass
IN‐10020 Direct 1.0E+00 pass
IN‐10025 Direct 5.0E‐01 pass
IN‐10030 Direct 4.9E‐01 pass
Page 1 of 2

Table 6‐3. Evaluation of Filter Loading Evenness
Sample ID
Filter Preparation
Method
Chi‐Square Test
p‐value
Chi‐Square Test
Conclusion*
IN‐10036 Direct 4.9E‐01 pass
IN‐10040 Direct 5.0E‐01 pass
IN‐10045 Direct 1.0E+00 pass
IN‐10051 Direct 5.1E‐01 pass
IN‐10113 Direct 4.9E‐01 pass
IN‐10115 Direct 4.9E‐01 pass
IN‐10119 Direct 1.0E+00 pass
IN‐10120 Indirect ‐ Ashed 1.0E+00 pass
IN‐10123 Direct 4.9E‐01 pass
IN‐10126 Direct 1.0E+00 pass
IN‐10128 Direct 1.0E+00 pass
IN‐10130 Direct 1.0E+00 pass
IN‐10133 Direct 4.9E‐01 pass
IN‐10136 Direct 4.9E‐01 pass
IN‐10138 Direct 1.0E+00 pass
IN‐10140 Direct 4.9E‐01 pass
IN‐10143 Direct 4.9E‐01 pass
IN‐10146 Direct 1.0E+00 pass
* pass: p‐value ≥ 0.001
Page 2 of 2

Data Summary Report: 2013 Indoor Activity-Based Sampling
Libby Asbestos Superfund Site, Operable Unit 4
FIGURES

This page intentionally left blank to facilitate double-sided printing.

!(
!(
!(
!(
!(
!(
!(!(
!(!(
Ko
o t e n a i R i v e r
Woodland Heights Rd
Califo
rnia A
ve
Flowe
rLa
keRd
Parmenter CreekRd
McKays St
Parmenter Dr
4729E
Wards Rd
W 6th St
Thre
e Cor
ner R
d
E Spruce St
99 452E
4813
Owerline Rd
9945
8B
Bowen Hill Rd
Flo rence Rd
Indian
Hea
d Rd
5220B
Dawson St
Airfield Rd
Mine
ral Av
e
Shau
gnes
syRd
Rawlings Rd
Utah
Ave
Edu c
ati o
nW a
y
Dako
ta Av
e
Parmenter Creek Tra il head
Northwood Ave
Louis
iana A
ve
Sheldon Flats Rd
Main
Ave
4729D
5thSt
Exd
Hemphill Rd
Jennin
gs Hau
l Rd
99458
5288
FarmTo
Market Rd
9945
2
NF-128
SnowshoeRd
Kootenai Dr
Manor Dr
NF-533
5099
99452C
U pp erF l
ower
Cree
kRd
Swed
eGu
l ch
Dr
Dome Mountain Ave
County Shop Rd
Pion
eer R
dCo
nifer
Rd
Spencer Rd
CabinetHeights
Rd
8649
Edge
water
Dr
Libby Ranger Sta Rd B
8617
FlowerCr eekRd
2nd St W Exd
Shalom Dr
Gran
iteAv
e
510 2
Vanderwood Rd
5289
Taylo
r Rd
8846
5100
Granite Cr eek Rd
5220
4729
Pipe Creek Hil l Rd
GraniteLake Rd
")508
UV567
UV260
UV37
£¤2
£¤2
AD-001712
AD-001733
AD-001807
AD-002052
AD-002223
AD-002368
AD-003193
AD-003238
AD-004749AD-005109
!( Curb-to-Curb Property
Highway
Local Road
Parcel Boundary
´0 2,500 5,0001,250
Feet
Figure 4-1. Scenario 1: Curb-to-Curb Property Locations
12/19/2013
Libby Asbestos ProjectLibby, Montana

s/cc ‐ structures per cubic centimeter
PCME ‐ phase contrast microscopy equivalent
LA ‐ Libby amphibole
ABS ‐ activity‐based sampling
Figure 4‐2. Comparison of Curb‐to‐Curb Properties Results
0
0.0001
0.0002
0.0003
0.0004
0.0005
0.0006
0.0007
0.0008
0.0009
0 0.0001 0.0002 0.0003 0.0004 0.0005 0.0006 0.0007 0.0008 0.0009
Active ABS Air Concentration (PCME LA
s/cc)
Passive ABS Air Concentration (PCME LA s/cc)
Summer
Winter
line of identity

!(
!(
!(
!(!(
!(
!(
!(
!(
!(
Ko
o t e n a i R i v e r
Mahoney Rd
Woodland Heights Rd
Califo
rnia A
ve
E 5th St
Flowe
rLa
keRd
Parmenter CreekRd
McKays St
Parmenter Dr
4729E
Wards Rd
W 6th St
Thre
e Cor
ner R
d
99 452E
4813
Owerline Rd
9945
8B
Bowen Hill Rd
Flo rence Rd
Indian
Hea
d Rd
5220B
Dawson St
Airfield Rd
Mine
ral Av
e
Shau
gnes
syRd
Rawlings Rd
Utah
Ave
Dako
taAv
e
Parmenter Creek Tra il head
Northwood Ave
Louis
iana A
ve
Sheldon Flats Rd
Main
Ave
4729D
5thSt
Exd
Hemphill Rd
Jennin
gs Hau
l Rd
99458
5288
FarmTo
Market Rd
9945
2
NF-128
SnowshoeRd
Kootenai Dr
Manor Dr
NF-533
5099
99452C
U pp erF l
ower
Cree
kRd
Swed
eGu
l ch
Dr
Dome Mountain Ave
County Shop Rd
Pion
eer R
dCo
nifer
Rd
Spencer Rd
CabinetHeights
Rd
8649
Edge
water
Dr
Libby Ranger Sta Rd B
8617
FlowerCr eekRd
Shalom Dr
Gran
iteAv
e
510 2
Idaho
Ave
Vanderwood Rd
5289
Taylo
r Rd
8846
5100
Granite Cr eek Rd
5220
4729
Pipe Creek Hil l Rd
GraniteLake Rd
")508
UV567
UV260
UV37
£¤2
£¤2
AD-001888
AD-003814
AD-001857
AD-003679
AD-001623 AD-004460
AD-000293
AD-000079
AD-001007
AD-000258
!( 2007/2008 Property
Highway
Local Road
Parcel Boundary
´0 2,500 5,0001,250
Feet
Figure 5-1. Scenario 2: 2007/2008 Repeat Property Locations
12/19/2013
Libby Asbestos ProjectLibby, Montana

s/cc ‐ structures per cubic centimeter
PCME ‐ phase contrast microscopy equivalent
LA ‐ Libby amphibole
ABS ‐ activity‐based sampling
Figure 5‐2. Comparison of 2013 Active Versus Passive Results for 2007/2008 Repeat Properties
0
0.0001
0.0002
0.0003
0.0004
0.0005
0.0006
0 0.0001 0.0002 0.0003 0.0004 0.0005 0.0006
Active ABS Air Concentration (PCME LA
s/cc)
Passive ABS Air Concentration (PCME LA s/cc)
line of identity

s/cc ‐ structures per cubic centimeter
PCME ‐ phase contrast microscopy equivalent
LA ‐ Libby amphibole
ABS ‐ activity‐based sampling
Figure 5‐3. Comparison of 2007/2008 (Summer Only) and 2013 Indoor ABS Air Results
0
0.0001
0.0002
0.0003
0.0004
0.0005
0.0006
0.0007
0.0008
0.0009
0 0.0001 0.0002 0.0003 0.0004 0.0005 0.0006 0.0007 0.0008 0.0009
2007/2008 ABS Air Concentration (PCME LA
s/cc)
2013 ABS Air Concentration (PCME LA s/cc)
Active
Passive
line of identity

This page intentionally left blank to facilitate double-sided printing.
Data Summary Report: 2013 Indoor Activity-Based Sampling
Libby Asbestos Superfund Site, Operable Unit 4
Appendix A
Field Documentation
[provided electronically]

Data Summary Report: 2013 Indoor Activity-Based Sampling
Libby Asbestos Superfund Site, Operable Unit 4
Appendix B
Analytical Laboratory Documentation
[provided electronically]

Data Summary Report: 2013 Indoor Activity-Based Sampling
Libby Asbestos Superfund Site, Operable Unit 4
Appendix C
Project Database (download date 03/31/2014)
[provided electronically]

This page intentionally left blank to facilitate double-sided printing.
Data Summary Report: 2013 Indoor Activity-Based Sampling
Libby Asbestos Superfund Site, Operable Unit 4
Appendix D
Detailed Data Summary Tables

This page intentionally left blank to facilitate double-sided printing.

Appendix D. Detailed Results of 2013 Indoor Activity‐Based SamplingLibby Asbestos Superfund Site, Libby, Montana
Property ID Sample No.
Sample
Date Scenario[a] Event
Disturbance
Activity
Laboratory
Name
Laboratory
QC Type
Analysis
Date
Analysis
Method
Preparation
Method
EFA
(mm2)
GO Size
(mm2)
GOs
Counted F‐factor
Sample
Volume (L)
Sensitivity
(1/cc) N PCME LA
PCME LA
Conc.
(s/cc)
AD‐000079 IN‐10130 7/31/13 2 Summer 2013 Active Hygeia NOT QC 8/22/13 TEM‐ISO Direct 385 0.01 799 1 1,205 4.0E‐05 0 0AD‐000079 IN‐10128 7/31/13 2 Summer 2013 Passive Hygeia NOT QC 8/16/13 TEM‐ISO Direct 385 0.01 1000 1 1,208 3.2E‐05 0 0AD‐000258 IN‐10150 8/29/13 2 Summer 2013 Active RESI NOT QC 9/18/13 TEM‐ISO Direct 385 0.01 1037 1 1,255 3.0E‐05 19 0.00056AD‐000258 IN‐10148 8/29/13 2 Summer 2013 Passive RESI NOT QC 9/16/13 TEM‐ISO Direct 385 0.01 1030 1 1,276 2.9E‐05 3 0.000088AD‐000293 IN‐10155 9/3/13 2 Summer 2013 Active RESI NOT QC 9/22/13 TEM‐ISO Direct 385 0.01 1028 1 514 7.3E‐05 2 0.00015AD‐000293 IN‐10154 9/3/13 2 Summer 2013 Passive RESI NOT QC 9/20/13 TEM‐ISO Direct 385 0.01 1028 1 1,264 3.0E‐05 0 0AD‐001007 IN‐10136 8/1/13 2 Summer 2013 Active Hygeia NOT QC 9/6/13 TEM‐ISO Direct 385 0.01 1000 1 514 7.5E‐05 1 0.000075AD‐001007 IN‐10133 8/1/13 2 Summer 2013 Passive Hygeia NOT QC 9/7/13 TEM‐ISO Direct 385 0.01 1000 1 1,208 3.2E‐05 1 0.000032AD‐001623 IN‐10146 8/6/13 2 Summer 2013 Active Hygeia NOT QC 9/9/13 TEM‐ISO Direct 385 0.01 1000 1 514 7.5E‐05 0 0AD‐001623 IN‐10143 8/6/13 2 Summer 2013 Passive Hygeia NOT QC 9/8/13 TEM‐ISO Direct 385 0.01 1000 1 1,264 3.0E‐05 1 0.000030AD‐001712 IN‐10028 3/5/13 1 Winter 2013 Active EMSL27 NOT QC 5/4/13 TEM‐ISO Direct 385 0.013 820 1 502 7.2E‐05 0 0AD‐001712 IN‐10025 3/5/13 1 Winter 2013 Passive Hygeia NOT QC 4/22/13 TEM‐ISO Direct 385 0.01 1000 1 502 7.7E‐05 2 0.00015AD‐001712 IN‐10095 7/19/13 1 Summer 2013 Active EMSL27 NOT QC 8/20/13 TEM‐ISO Direct 385 0.013 775 1 514 7.4E‐05 0 0AD‐001712 IN‐10092 7/19/13 1 Summer 2013 Passive EMSL27 NOT QC 8/19/13 TEM‐ISO Direct 385 0.013 775 1 1,208 3.2E‐05 0 0AD‐001733 IN‐10039 3/8/13 1 Winter 2013 Active RESI NOT QC 5/2/13 TEM‐ISO Direct 385 0.01 1012 1 485 7.8E‐05 3 0.00024AD‐001733 IN‐10036 3/8/13 1 Winter 2013 Passive Hygeia NOT QC 4/25/13 TEM‐ISO Direct 385 0.01 1000 1 485 7.9E‐05 1 0.000079AD‐001733 IN‐10069 7/12/13 1 Summer 2013 Active EMSL03 NOT QC 7/29/13 TEM‐ISO Direct 385 0.013 770 1 512 7.5E‐05 11 0.00083AD‐001733 IN‐10067 7/12/13 1 Summer 2013 Passive EMSL03 NOT QC 7/28/13 TEM‐ISO Direct 385 0.013 770 1 1,208 3.2E‐05 3 0.000096AD‐001807 IN‐10030 3/6/13 1 Winter 2013 Passive Hygeia NOT QC 4/22/13 TEM‐ISO Direct 385 0.01 1000 1 485 7.9E‐05 1 0.000079AD‐001807 IN‐10033 3/7/13 1 Winter 2013 Active RESI NOT QC 4/28/13 TEM‐ISO Direct 385 0.01 1027 1 509 7.4E‐05 1 0.000074AD‐001807 IN‐10084 7/17/13 1 Summer 2013 Active EMSL27 NOT QC 8/14/13 TEM‐ISO Direct 385 0.013 625 1 1,205 3.9E‐05 0 0AD‐001807 IN‐10082 7/17/13 1 Summer 2013 Passive EMSL27 NOT QC 8/13/13 TEM‐ISO Direct 385 0.013 775 1 1,208 3.2E‐05 0 0AD‐001857 IN‐10120 7/29/13 2 Summer 2013 Active Hygeia NOT QC 8/16/13 TEM‐ISO Indirect ‐ Ashed 346 0.01 1000 0.25 1,205 1.1E‐04 0 0AD‐001857 IN‐10119 7/29/13 2 Summer 2013 Passive Hygeia NOT QC 8/12/13 TEM‐ISO Direct 385 0.01 1000 1 514 7.5E‐05 0 0AD‐001888 IN‐10126 7/30/13 2 Summer 2013 Active Hygeia NOT QC 8/15/13 TEM‐ISO Direct 385 0.01 1000 1 514 7.5E‐05 0 0AD‐001888 IN‐10123 7/30/13 2 Summer 2013 Passive Hygeia NOT QC 8/13/13 TEM‐ISO Direct 385 0.01 1000 1 1,208 3.2E‐05 1 0.000032AD‐002052 IN‐10015 2/28/13 1 Winter 2013 Active EMSL27 NOT QC 5/1/13 TEM‐ISO Direct 385 0.013 580 1 1,295 3.9E‐05 0 0AD‐002052 IN‐10012 2/28/13 1 Winter 2013 Passive Hygeia NOT QC 4/17/13 TEM‐ISO Direct 385 0.01 1000 1 485 7.9E‐05 0 0AD‐002052 IN‐10065 7/11/13 1 Summer 2013 Active EMSL03 NOT QC 7/30/13 TEM‐ISO Indirect ‐ Ashed 354.66 0.013 770 0.15 1,205 2.0E‐04 3 0.00059AD‐002052 IN‐10063 7/11/13 1 Summer 2013 Passive EMSL03 NOT QC 7/26/13 TEM‐ISO Direct 385 0.013 770 1 1,205 3.2E‐05 0 0AD‐002223 IN‐10053 3/13/13 1 Winter 2013 Active RESI NOT QC 4/27/13 TEM‐ISO Direct 385 0.01 818 1 1,342 3.5E‐05 2 0.000070AD‐002223 IN‐10051 3/13/13 1 Winter 2013 Passive Hygeia NOT QC 5/1/13 TEM‐ISO Direct 385 0.01 1000 1 485 7.9E‐05 3 0.00024AD‐002223 IN‐10074 7/15/13 1 Summer 2013 Active EMSL27 NOT QC 8/16/13 TEM‐ISO Direct 385 0.013 625 1 1,205 3.9E‐05 0 0AD‐002223 IN‐10072 7/15/13 1 Summer 2013 Passive EMSL27 NOT QC 8/8/13 TEM‐ISO Direct 385 0.013 775 1 1,221 3.1E‐05 0 0AD‐002368 IN‐10049 3/12/13 1 Winter 2013 Active RESI NOT QC 5/4/13 TEM‐ISO Direct 385 0.01 1027 1 485 7.7E‐05 3 0.00023AD‐002368 IN‐10045 3/12/13 1 Winter 2013 Passive Hygeia NOT QC 5/3/13 TEM‐ISO Direct 385 0.01 1000 1 1,342 2.9E‐05 0 0AD‐002368 IN‐10079 7/16/13 1 Summer 2013 Active EMSL27 NOT QC 8/13/13 TEM‐ISO Direct 385 0.013 625 1 1,205 3.9E‐05 0 0AD‐002368 IN‐10077 7/16/13 1 Summer 2013 Passive EMSL27 NOT QC 8/19/13 TEM‐ISO Direct 385 0.013 790 1 1,214 3.1E‐05 0 0AD‐003193 IN‐10044 3/10/13 1 Winter 2013 Active RESI NOT QC 5/3/13 TEM‐ISO Direct 385 0.01 1020 1 485 7.8E‐05 7 0.00054AD‐003193 IN‐10040 3/10/13 1 Winter 2013 Passive Hygeia NOT QC 4/25/13 TEM‐ISO Direct 385 0.01 1000 1 1,342 2.9E‐05 2 0.000057AD‐003193 IN‐10105 7/21/13 1 Summer 2013 Active EMSL22 NOT QC 8/9/13 TEM‐ISO Direct 385 0.0133 601 1 1,205 4.0E‐05 2 0.000080AD‐003193 IN‐10102 7/21/13 1 Summer 2013 Passive EMSL22 NOT QC 8/9/13 TEM‐ISO Direct 385 0.0133 752 1 1,205 3.2E‐05 0 0AD‐003238 IN‐10022 3/3/13 1 Winter 2013 Active EMSL27 NOT QC 5/2/13 TEM‐ISO Direct 385 0.013 565 1 1,342 3.9E‐05 0 0AD‐003238 IN‐10020 3/3/13 1 Winter 2013 Passive Hygeia NOT QC 4/19/13 TEM‐ISO Direct 385 0.01 1000 1 485 7.9E‐05 0 0AD‐003238 IN‐10099 7/21/13 1 Summer 2013 Active EMSL22 NOT QC 8/8/13 TEM‐ISO Direct 385 0.0133 598 1 1,212 4.0E‐05 1 0.000040AD‐003238 IN‐10096 7/21/13 1 Summer 2013 Passive EMSL22 NOT QC 8/7/13 TEM‐ISO Direct 385 0.0133 752 1 1,221 3.2E‐05 0 0AD‐003679 IN‐10140 8/5/13 2 Summer 2013 Active Hygeia NOT QC 9/8/13 TEM‐ISO Direct 385 0.01 767 1 1,255 4.0E‐05 1 0.000040AD‐003679 IN‐10138 8/5/13 2 Summer 2013 Passive Hygeia NOT QC 9/8/13 TEM‐ISO Direct 385 0.01 1000 1 1,208 3.2E‐05 0 0AD‐003814 IN‐10089 7/18/13 2 Summer 2013 Active EMSL27 NOT QC 8/19/13 TEM‐ISO Direct 385 0.013 625 1 1,205 3.9E‐05 0 0AD‐003814 IN‐10087 7/18/13 2 Summer 2013 Passive EMSL27 NOT QC 8/16/13 TEM‐ISO Direct 385 0.013 775 1 1,214 3.1E‐05 0 0AD‐004460 IN‐10110 7/24/13 2 Summer 2013 Active EMSL22 NOT QC 8/12/13 TEM‐ISO Direct 385 0.0133 601 1 1,205 4.0E‐05 0 0AD‐004460 IN‐10108 7/24/13 2 Summer 2013 Passive EMSL22 NOT QC 8/11/13 TEM‐ISO Direct 385 0.0133 752 1 1,208 3.2E‐05 0 0AD‐004749 IN‐10009 2/25/13 1 Winter 2013 Active EMSL27 NOT QC 5/2/13 TEM‐ISO Direct 385 0.013 805 1 485 7.6E‐05 0 0AD‐004749 IN‐10006 2/25/13 1 Winter 2013 Passive Hygeia NOT QC 4/17/13 TEM‐ISO Direct 385 0.01 1000 1 485 7.9E‐05 0 0AD‐004749 IN‐10058 7/10/13 1 Summer 2013 Active EMSL03 NOT QC 7/26/13 TEM‐ISO Direct 385 0.013 770 1 1,205 3.2E‐05 0 0AD‐004749 IN‐10056 7/10/13 1 Summer 2013 Passive EMSL03 NOT QC 7/22/13 TEM‐ISO Direct 385 0.013 775 1 1,205 3.2E‐05 3 0.000095AD‐005109 IN‐10005 2/18/13 1 Winter 2013 Active EMSL27 NOT QC 4/30/13 TEM‐ISO Direct 385 0.013 565 1 1,329 3.9E‐05 0 0AD‐005109 IN‐10001 2/18/13 1 Winter 2013 Passive Hygeia NOT QC 4/14/13 TEM‐ISO Direct 385 0.01 1000 1 500 7.7E‐05 1 0.000077AD‐005109 IN‐10115 7/27/13 1 Summer 2013 Active Hygeia NOT QC 8/8/13 TEM‐ISO Direct 385 0.01 799 1 1,205 4.0E‐05 1 0.000040AD‐005109 IN‐10113 7/27/13 1 Summer 2013 Passive Hygeia NOT QC 8/7/13 TEM‐ISO Direct 385 0.01 1000 1 1,208 3.2E‐05 1 0.000032
Notes:[a]Scenario 1: Curb‐to‐Curb Properties; Scenario 2: 2007/2009 PropertiesQC ‐ quality control cc ‐ cubic centimeterTEM ‐ transmission electron microscopy N ‐ number of asbestos structuresISO ‐ International Organization for Standardization LA ‐ Libby amphiboleEFA ‐ effective filter area PCME ‐ phase contrast microscopy‐equivalentmm ‐ millimeter Conc. ‐ concentrationGO ‐ grid opening s/cc ‐ structures per cubic centimeter
L ‐ liter

Appendix D. Detailed Results of 2013 Indoor Activity‐Based Sampling Field BlanksLibby Asbestos Superfund Site, Libby, Montana
Sample ID
Sample
Date
Sample
Type
Laboratory
Name
Laboratory
QC Type
Analysis
Date
Analysis
Method
Preparation
Method
EFA
(mm2)
GO Size
(mm2)
GOs
Counted F‐factor N PCME LA
IN‐10057 7/10/13 Field Blank EMSL03 NOT QC 7/24/13 TEM‐ISO Direct 385 0.013 77 1 0IN‐10107 7/24/13 Field Blank EMSL22 NOT QC 8/9/13 TEM‐ISO Direct 385 0.0133 77 1 0IN‐10014 2/28/13 Field Blank EMSL27 NOT QC 5/2/13 TEM‐ISO Direct 385 0.013 85 1 0IN‐10071 7/15/13 Field Blank EMSL27 NOT QC 8/8/13 TEM‐ISO Direct 385 0.013 85 1 0IN‐10003 2/18/13 Field Blank Hygeia NOT QC 4/17/13 TEM‐ISO Direct 385 0.01 100 1 0IN‐10112 7/27/13 Field Blank Hygeia NOT QC 8/6/13 TEM‐ISO Direct 385 0.01 100 1 0
Notes:QC ‐ quality controlTEM ‐ transmission electron microscopyISO ‐ international organization for standardizationEFA ‐ effective filter areamm ‐ millimeterGO ‐ grid openingN ‐ number of asbestos structures
LA ‐ Libby amphibole
PCME ‐ phase contrast microscopy‐equivalent

Data Summary Report: 2013 Indoor Activity-Based Sampling
Libby Asbestos Superfund Site, Operable Unit 4
Appendix E
Field and Laboratory Modification Forms
[provided electronically]
Data Summary Report: 2013 Indoor Activity-Based Sampling
Libby Asbestos Superfund Site, Operable Unit 4
Appendix F
Data Verification Reports
[provided electronically]