2014 ecpqim4 book dm ki ra all
TRANSCRIPT
RIKI Reports: Differential Monitoring (ECPQIM4©) RIKI
R e s e a r c h I n s t i t u t e f o r K e y I n d i c a t o r s
Dr Fiene
RIKI Reports (2013-2014)
Differential Monitoring: A Fourth Generational
Early Childhood Program Quality Indicator
(ECPQIM4©) Model
Richard Fiene, Ph.D.
November 2014
RIKI Reports: Differential Monitoring (ECPQIM4©) RIKI
R e s e a r c h I n s t i t u t e f o r K e y I n d i c a t o r s
Dr Fiene
This RIKI Book of Readings/Presentations contains the details of the Differential Monitoring
Logic Model and Algorithm (DMLMA©), an Early Childhood Program Quality Indicator Model
in its fourth edition (ECPQIM4©), through the Research Institute for Key Indicators (RIKI)
Series of Reports. These reports and presentations will demonstrate the use of the following
methodologies: key indicators, risk assessment, differential monitoring, and validation with
licensing, quality rating and improvement systems, professional development, early learning
standards, Head Start standards, and child development outcomes.
Copyright© Research Institute for Key Indicators LLC (RIKI), 2014
Printed in the United States of America
This book of readings/presentations is in copyright. All rights reserved.
Without limiting the rights under copyright reserved above, no part of this publication may be
reproduced, stored in or introduced into a retrieval system, or transmitted, in any form, or by any
means (electronic, mechanical, photocopying, recording, or otherwise), without the prior written
permission of the Research Institute for Key Indicators LLC (RIKI).
R e s e a r c h I n s t i t u t e f o r K e y I n d i c a t o r s ( R I K I )
Page 1
Stepping Stones 3rd Edition Key Indicators 2013
Stepping Stones (3rd Edition) Key Indicators
Richard Fiene, Ph.D.
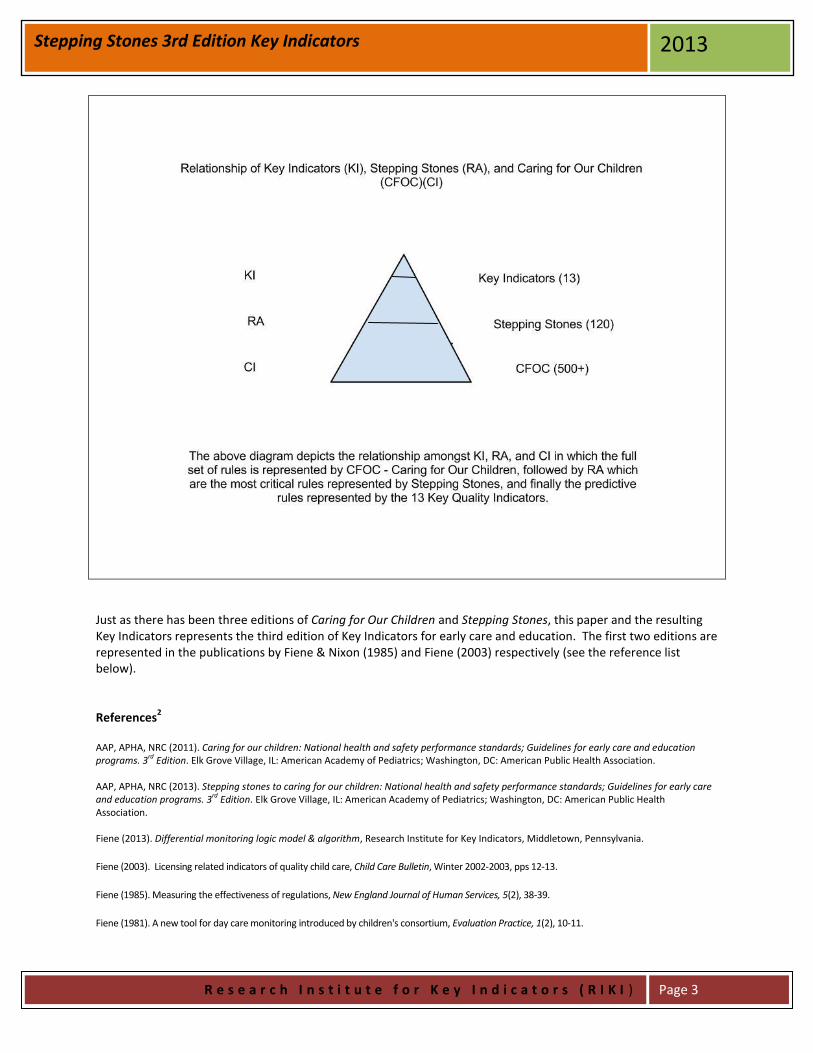
April 2013 This short paper will present the Key Indicators as they appear in Stepping Stones (3rd edition). It provides the statistically predictive standards (Key Indicators) that could determine overall compliance with Stepping Stones (AAP, APHA, NRC, 2013) and Caring for Our Children (AAP, APHA, NRC, 2011) based upon the statistical methodology (Fiene & Nixon, 1985). But before delineating the Key Indicators a few definitions need to be provided to put these key indicators in perspective. Definitions: Risk Assessment (RA) - a differential monitoring approach that employs using only those rules, standards, or regulations that place children at greatest risk of mortality or morbidity if violations/citations occur with the specific rule, standard, or regulation. Stepping Stones (3rd edition) is an example of a risk assessment approach. Key Indicators (KI) - a differential monitoring approach that employs using only those rules, standards, or regulations that statistically predict overall compliance with all the rules, standards, or regulations. In other words, if a program is 100% in compliance with the Key Indicators the program will also be in substantial to full compliance with all rules, standards, or regulations. The reverse is also true in that if a program is not 100% in compliance with the Key Indicators the program will also have other areas of non-compliance with all the rules, standards, or regulations. The key indicators put forth in this paper are an example of the approach. Differential Monitoring (DM) - this is a relatively new approach to determining the number of visits made to programs and what rules, standards, or regulations are reviewed during these visits. There are two measurement tools that drive differential monitoring, one is Weighted Risk Assessment tools and the other is Key Indicator checklists. Weighted Risk Assessments determine how often a program will be visited while Key Indicator checklists determine what rules, standards, or regulations will be reviewed in the program. Differential monitoring is a very powerful approach when Risk Assessment is combined with Key Indicators because a program is reviewed by the most critical rules, standards, or regulations and the most predictive rules, standards, or regulations. See Fiene’s Logic Model & Algorithm for Differential Monitoring (DMLMA©)(Fiene, 2013). Early Childhood Program Quality Indicator Model (ECPQIM)(Fiene, 2013; Fiene & Kroh, 2000; Griffin & Fiene, 1995; Fiene & Nixon, 1985) – this definition is provided to place the results of this paper into the larger program monitoring systems perspective. ECPQIM are models that employ a key indicator or dashboard approach to program monitoring. Major program monitoring systems in early care and education are integrated conceptually so that the overall early care and education system can be assessed and validated. With these models, it is possible to compare results obtained from licensing systems, quality rating and improvement systems (QRIS), risk assessment systems, key indicator systems, technical assistance, and child development/early learning outcome systems. The various approaches to validation (Zellman & Fiene, 2012) are interposed within this model and the specific
R e s e a r c h I n s t i t u t e f o r K e y I n d i c a t o r s ( R I K I )
Page 2
Stepping Stones 3rd Edition Key Indicators 2013
expected correlational thresholds that should be observed amongst the key elements of the model are suggested. Key Elements of the model are the following: CI = Comprehensive Instrument - state or federal standards, usually rules or regulations that measure health and safety - Caring for Our Children or Head Start Performance Standards will be applicable here. Quality Rating and Improvement Systems (QRIS) standards at the state level; ERS (ECERS, ITERS, FDCRS), CLASS, or CDPES (Fiene & Nixon, 1985). RA = Risk assessment tools/systems in which only the most critical rules/standards are measured. Stepping Stones is an example of this approach. KI = Key indicators in which only predictor rules/standards are measured. The Thirteen Indicators of Quality Child Care (Fiene, 2003) is an example of this approach. DM = Differential monitoring decision making in which it is determined if a program is in compliance or not and the number of visits/the number of rules/standards are ascertained from a scoring protocol. Technical assistance/training and/or professional development system which provides targeted assistance to the program based upon the Differential Monitoring results. And finally, child outcomes which assesses how well the children are developing which is the ultimate goal of the system.
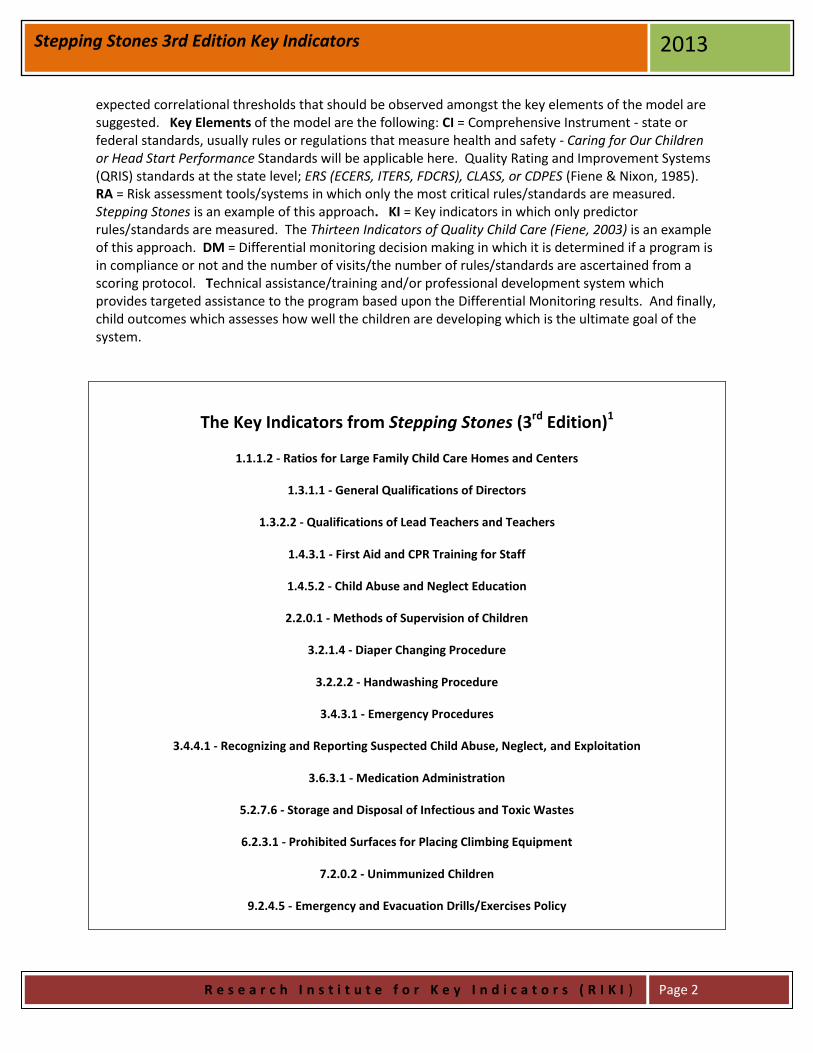
The Key Indicators from Stepping Stones (3rd Edition)1
1.1.1.2 - Ratios for Large Family Child Care Homes and Centers
1.3.1.1 - General Qualifications of Directors
1.3.2.2 - Qualifications of Lead Teachers and Teachers
1.4.3.1 - First Aid and CPR Training for Staff
1.4.5.2 - Child Abuse and Neglect Education
2.2.0.1 - Methods of Supervision of Children
3.2.1.4 - Diaper Changing Procedure
3.2.2.2 - Handwashing Procedure
3.4.3.1 - Emergency Procedures
3.4.4.1 - Recognizing and Reporting Suspected Child Abuse, Neglect, and Exploitation
3.6.3.1 - Medication Administration
5.2.7.6 - Storage and Disposal of Infectious and Toxic Wastes
6.2.3.1 - Prohibited Surfaces for Placing Climbing Equipment
7.2.0.2 - Unimmunized Children
9.2.4.5 - Emergency and Evacuation Drills/Exercises Policy
R e s e a r c h I n s t i t u t e f o r K e y I n d i c a t o r s ( R I K I )
Page 3
Stepping Stones 3rd Edition Key Indicators 2013
Just as there has been three editions of Caring for Our Children and Stepping Stones, this paper and the resulting Key Indicators represents the third edition of Key Indicators for early care and education. The first two editions are represented in the publications by Fiene & Nixon (1985) and Fiene (2003) respectively (see the reference list below). References
2
AAP, APHA, NRC (2011). Caring for our children: National health and safety performance standards; Guidelines for early care and education programs. 3rd Edition. Elk Grove Village, IL: American Academy of Pediatrics; Washington, DC: American Public Health Association. AAP, APHA, NRC (2013). Stepping stones to caring for our children: National health and safety performance standards; Guidelines for early care and education programs. 3rd Edition. Elk Grove Village, IL: American Academy of Pediatrics; Washington, DC: American Public Health Association. Fiene (2013). Differential monitoring logic model & algorithm, Research Institute for Key Indicators, Middletown, Pennsylvania.
Fiene (2003). Licensing related indicators of quality child care, Child Care Bulletin, Winter 2002-2003, pps 12-13.
Fiene (1985). Measuring the effectiveness of regulations, New England Journal of Human Services, 5(2), 38-39.
Fiene (1981). A new tool for day care monitoring introduced by children's consortium, Evaluation Practice, 1(2), 10-11.

R e s e a r c h I n s t i t u t e f o r K e y I n d i c a t o r s ( R I K I )
Page 4
Stepping Stones 3rd Edition Key Indicators 2013
Fiene & Kroh (2000). Licensing Measurement and Systems, NARA Licensing Curriculum. Washington, D.C.: National Association for Regulatory Administration. Fiene & Nixon (1985). Instrument based program monitoring and the indicator checklist for child care, Child Care Quarterly, 14(3), 198-214. Griffin & Fiene (1995). A systematic approach to policy planning and quality improvement for child care: A technical manual for state administrators. Washington, D.C.: National Center for Clinical Infant Programs-Zero to Three.
Zellman & Fiene (2012). Validation of quality rating and improvement systems for early care and education and School-age care, Washington, D.C.: OPRE and Child Trends.
Notes:
1 Please see Stepping Stones (3rd edition) and Caring for Our Children (3rd edition) for the details of each Key Indicator.
2 For the reader who is interested in learning more about the DMLMA/ECPQIM model, please refer to these publications which are available through the following website: http://RIKInstitute.wikispaces.com
For additional information, please contact: Richard Fiene, Ph.D., Director Research Institute for Key Indicators 41 Grandview Drive Middletown, PA. 17057 [email protected] [email protected] 717-944-5868 Phone and Fax http://RIKInstitute.wikispaces.com http://pennstate.academia.edu/RickFiene
R e s e a r c h I n s t i t u t e f o r K e y I n d i c a t o r s
Page 1
OHS KEY INDICATOR PROJECT REPORT 2013
OFFICE OF HEAD START KEY INDICATOR PROJECT REPORT
Richard Fiene, Ph.D.
The purpose of this report is to present to the Office of Head Start (OHS) Key Indicators of their Head Start Performance Standards (HSPS) that have the ability to statistically predict substantial compliance with all Compliance Measures and ultimately the majority of HSPS’s. The analytical and methodological basis of this approach is based upon a Differential Monitoring Logic Model and Algorithm (DMLMA©) (Fiene, 2012) (see Appendix 3). The DMLMA© is the 4th generation of an Early Childhood Program Quality Indicator Model (ECPQIM)(Fiene & Nixon, 1985; Griffin & Fiene, 1995; Fiene & Kroh, 2000). Only a portion of the DMLMA© model was utilized in this report which focused on key indicators, risk assessment, and program quality. Definitions: Risk Assessment (RA) - a differential monitoring approach that employs using only those rules, standards, or regulations that place children at greatest risk of mortality or morbidity if violations/citations occur with the specific rule, standard, or regulation. Key Indicators (KI) - a differential monitoring approach that employs using only those rules, standards, or regulations that statistically predict overall compliance with all the rules, standards, or regulations. In other words, if a program is 100% in compliance with the Key Indicators the program will also be in substantial to full compliance with all rules, standards, or regulations. The reverse is also true in that if a program is not 100% in compliance with the Key Indicators the program will also have other areas of non-compliance with all the rules, standards, or regulations. Differential Monitoring (DM) - this is a relatively new approach to determining the number of visits made to programs and what rules, standards, or regulations are reviewed during these visits. There are two measurement tools that drive differential monitoring, one is Weighted Risk Assessment tools and the other is Key Indicator checklists. Weighted Risk Assessments determine how often a program will be visited while Key Indicator checklists determine what rules, standards, or regulations will be reviewed in the program. Differential monitoring is a very powerful approach when Risk Assessment is combined with Key Indicators because a program is reviewed by the most critical rules, standards, or regulations and the most predictive rules, standards, or regulations. See Appendix 3 which presents a Logic Model & Algorithm for Differential Monitoring (DMLMA©)(Fiene, 2012). Program Quality (PQ) - for the purposes of this study this was measured via the CLASS – Classroom Assessment Scoring System. The CLASS has three sub-scales (ES = Emotional Support, CO = Classroom Organization, and IS = Instructional Support). The CLASS is a tool that is identified in the research literature as measuring classroom quality similar to the ERS tools.

R e s e a r c h I n s t i t u t e f o r K e y I n d i c a t o r s
Page 2
OHS KEY INDICATOR PROJECT REPORT 2013
Early Childhood Program Quality Indicator Model (ECPQIM) – these are models that employ a key indicator or dashboard approach to program monitoring. Major program monitoring systems in early care and education are integrated conceptually so that the overall early care and education system can be assessed and validated. With these models, it is possible to compare results obtained from licensing systems, quality rating and improvement systems (QRIS), risk assessment systems, key indicator systems, technical assistance, and child development/early learning outcome systems. The various approaches to validation are interposed within this model and the specific expected correlational thresholds that should be observed amongst the key elements of the model are suggested. Key Elements of the model are the following (see Appendix 3 for details): CI = state or federal standards, usually rules or regulations that measure health and safety - Caring for Our Children or Head Start Performance Standards will be applicable here. PQ = Quality Rating and Improvement Systems (QRIS) standards at the state level; ERS (ECERS, ITERS, FDCRS), CLASS, or CDPES (Fiene & Nixon, 1985). RA = risk assessment tools/systems in which only the most critical rules/standards are measured. Stepping Stones is an example of this approach. KI = key indicators in which only predictor rules/standards are measured. The Thirteen Indicators of Quality Child Care is an example of this approach. DM = differential monitoring decision making in which it is determined if a program is in compliance or not and the number of visits/the number of rules/standards are ascertained from a scoring protocol. PD = technical assistance/training and/or professional development system which provides targeted assistance to the program based upon the DM results. CO = child outcomes which assesses how well the children are developing which is the ultimate goal of the system. The organization of this report is as follows:
1) The first section will provide an overall analysis the Head Start (HS), Early Head Start (EHS), and
Head Start/Early Head Start (HS/EHS) programs1,4 ;
2) The second section will provide analyses of the various content areas (CA) within the HSPS4;
3) The third section will provide analyses of the relationship between the HSPS as measured by
compliance with the Compliance Measures (CM) and the program quality scores (CLASS scores)3;
4) The fourth and final section will provide the analyses that produced the key indicators (KI) and
recommendations in how it could be used.2
The source of data for this report is all the Tri-Annual On-Site Monitoring visits for 2012 which consisted
of 422 reviews of programs across the country. There were 191 Head Start (HS) only programs, 33 Early
Head Start (EHS) only programs, and 198 Head Start/Early Head Start (HS/EHS) programs reviewed. This
is a representative sample of Head Start and Early Head Start programs nationally representing
approximately 25% of the total number of Head Start programs.
Before proceeding with the results of this study, a few clarifying and definitional terms need to be
highlighted. In the 2012 edition of OHS On-Site Review Protocol and the 2013 OHS Monitoring Protocol,
Compliance Indicators (CI) and Key Indicators (KI) are respectively mentioned. In the licensing literature,
when the term “Indicators” is used it refers to standards/rules that are predictive of overall compliance
with all rules/standards. However, as defined by OHS, indicators (CI/KI) are used within the context of
risk assessment which means that these indicators are the standards which are most important/critical

R e s e a r c h I n s t i t u t e f o r K e y I n d i c a t o r s
Page 3
OHS KEY INDICATOR PROJECT REPORT 2013
to the OHS in their monitoring reviews. These indicators therefore are not predictive in essence. That is
the focus of this report/study which is to determine which of these indicators are predictive of overall
compliance with all the compliance/key indicators. This is a common misconception in the human
service regulatory field where risk assessment tools and key indicator tools purposes are confused. As
we move forward please keep the definitions in mind related to the distinctions and functionality of risk
assessment and key indicators.
For the purposes of this study, 131 Compliance Measures (CM), organized into seven (7) Content Areas
(CA), were reviewed and analyzed. The seven content areas are the following: Program Governance;
Management Systems; Fiscal Integrity; Eligibility, Recruitment, Selection, Enrollment, and Attendance;
Child Health and Safety; Family and Community Engagement; Child Development and Education. Ten
CM’s were from Program Governance (GOV), 10 were from Management Systems (SYS), 22 were from
Fiscal Integrity (FIS), 11 were from Eligibility, Recruitment, Selection, Enrollment, and Attendance
(ERSEA), 34 were from Child Health and Safety (CHS), 16 were from Family and Community Engagement
(FCE), and 28 were from Child Development and Education (CDE)4.
Section 1 - Head Start (HS), Early Head Start (EHS), and Head Start/Early Head Start (HS/EHS) programs
In order to determine if analyses needed to be performed separately on Head Start (HS), Early Head
Start (EHS), and Head Start/Early Head Start (HS/EHS) combined programs, the first series of analyses
were performed to determine if any statistically significant differences existed amongst these three
groups. This is a very important first analysis because it will help to determine the stability of the
sample selected and of the overall system. In other words, is there a good deal of consistency across all
service types: HS, EHS, and HS/EHS.
Based upon Table 1, no statistically significant differences were determined amongst the three groups
(HS, EHS, HS/EHS) with Compliance Measures (CM) or CLASS (ES, CO, IS) Scores indicating that using the
full 422 sample and not having to do separate analyses for the three groups was the correct analytical
framework. However, where it is appropriate, any statistically significant differences amongst the
various program types will be highlighted.
Table 1 – Head Start, Early Head Start, & Head Start/Early Head Start With CM and CLASS/ES, CO, IS
Program Type CM(N) CLASS/ES(N) CLASS/CO(N) CLASS/IS(N) Head Start (HS) 3.72(191) 5.88(186) 5.43(186) 2.97(186) Early Head Start (EHS) 2.67(33) -----* -----* -----* Head Start (HS/EHS) 3.07(198) 5.91(198) 5.47(198) 3.00(198) Totals 3.33(422) 5.89(384) 5.45(384) 2.98(384) Statistical Significance NS NS NS NS CM = Compliance Measures (Average Number of Violations) *CLASS data were not collected in EHS. CLASS/ES = CLASS Emotional Support Average Score CLASS/CO = CLASS Classroom Organization Average Score CLASS/IS = CLASS Instructional Support Average Score NS = Not Significant N = Number of Programs
R e s e a r c h I n s t i t u t e f o r K e y I n d i c a t o r s
Page 4
OHS KEY INDICATOR PROJECT REPORT 2013
The average number of violations with the Compliance Measures for Head Start (3.72), Early Head Start
(2.67) and Head Start/EHS (3.07) was not significant in utilizing a One-Way ANOVA. There were 191
Head Start (HS) programs, 33 Early Head Start (EHS) programs, and 198 Head Start (HS/EHS) programs.
Comparisons were also made with Head Start and Head Start/EHS on the various CLASS sub-scales (ES =
Emotional Support, CO = Classroom Organization, and IS = Instructional Support) and no significant
differences were found between these two groups. The EHS (n = 33) was not used because CLASS data
were not collected in these programs.
The practical implication of the above results is that the same monitoring tools and the resulting Head
Start Key Indicator (HSKI) to be developed as a result of this study can be used in the three main types of
programs: Head Start, Early Head Start, and Head Start/EHS. There is no need to have separate tools.
Section 2 - Content Areas
The second series of analyses was to look more closely at the 7 content areas (CA) to measure
demographically any differences amongst the various areas. In order to do this a weighted average had
to be determined in order to compare the various areas because of the differences in the number of
Compliance Measures (CM) used in each content area. Table 2 provides the results of these analyses.
For the total sample of 422 sites, Management Systems (SYS) Content Area (CA) had the highest number
of violations with the Compliance Measures (CM) with 359. The SYS/CA also had the highest average
number of violations with 35.90 because there were only 10 CM. For the total sample of 422 sites, the
lowest number of violations was in the Family and Community Engagement (FCE) Content Area (CA)
with 48 violations with CM. It also had the lowest average number of violations with 3.00.
For the Head Start only sites (n = 191), a similar distribution as with the total sample (n = 422) is
depicted in which Management Systems (SYS) Content Area (CA) had the highest number of violations
with the Compliance Measures (CM) with 192. The SYS/CA also had the highest average number of
violations with 19.20 because again there were only 10 CM. The lowest number of violations was in the
Family and Community Engagement (FCE) Content Area (CA) with 20 violations with CM. It also had the
lowest average number of violations with 1.25.
For the Early Head Start only (n = 33) and the Head Start/Early Head Start (n = 198) sites, the ranking of
the various Content Areas changed somewhat with the total number of violations and the average
number of violations from the Total Sample (n = 422) and the Head Start only (n = 191) sites but not
dramatically. For example, the Family and Community Engagement (FCE); Child Development and
Education (CDE); and the Eligibility, Recruitment, Selection, Enrollment, and Attendance (ERSEA)
Content Areas switched rankings in which it had the fewest total violations and the average number of
violations (see Table 2).

R e s e a r c h I n s t i t u t e f o r K e y I n d i c a t o r s
Page 5
OHS KEY INDICATOR PROJECT REPORT 2013
Table 2 – Comparing Content Areas and Program Types
Total Violations /(Rank) Average # of Violations/(Rank) CM Content Areas TOT HS EHS HS/EHS TOT HS EHS HS/EHS # FCE 48(1) 20(1) 2(1) 26(2) 3.00(1) 1.25(1) 0.125(1) 1.63(2) 16 ERSEA 62(2) 37(2) 6(3) 19(1) 5.64(3) 3.36(3) 0.545(3) 1.73(3) 11 CDE 91(3) 43(3) 5(2) 43(3) 3.25(2) 1.54(2) 0.179(2) 1.54(1) 28 GOV 150(4) 94(4) 6(3) 50(4) 15.00(6) 9.40(6) 0.600(4) 5.00(5) 10 FIS 255(5) 114(5) 23(7) 118(5) 11.59(5) 5.18(5) 1.045(6) 5.36(6) 22 CHS 333(6) 151(6) 22(6) 160(7) 9.79(4) 4.44(4) 0.647(5) 4.71(4) 34 SYS 359(7) 192(7) 20(5) 147(6) 35.90(7) 19.20(7) 2.000(7) 14.70(7) 10 CONTENT AREAS (CA): FCE = FAMILY and COMMUNITY ENGAGEMENT ERSEA = ELIGIBILITY, RECRUITMENT, SELECTION, ENROLLMENT, and ATTENDANCE CDE = CHILD DEVELOPMENT AND EDUCATION GOV = PROGRAM GOVERNANCE FIS = FISCAL INTEGRITY CHS =CHILD HEALTH AND SAFETY SYS = MANAGEMENT SYSTEMS TOT = TOTAL NUMBER OF SITES, FULL SAMPLE OF 422 SITES HS = HEAD START ONLY PROGRAMS EHS = EARLY HEAD START ONLY PROGRAM HS/EHS = HEAD START AND EARLY HEAD START COMBINED PROGRAMS CM = NUMBER OF COMPLIANCE MEASURES TOTAL VIOLATIONS = ALL THE VIOLATIONS FOR A SPECIFIC CONTENT AREA. AVERAGE # OF VIOLATIONS = THE TOTAL VIOLATIONS FOR A SPECIFIC CA DIVIDED BY THE NUMBER OF COMPLIANCE MEASURES FOR THAT SPECIFIC CONTENT AREA. RANK = HOW EACH CONTENT AREA COMPARES TO THE OTHER CONTENT AREAS FOR THE RESPECTIVE PROGRAM TYPE.
For the total sample (n = 422), other CA’s had different configurations between the total number of
violations and the average number of violations as demonstrated by CHS – Child Health and Safety in
which there was a total of 333 violations but the average number of violations was 9.79 because there
were 34 Compliance Measures (CM). Program Governance (GOV) had 150 total violations and a
weighted-average of 15 violations with 10 CM. Child Development and Education (CDE) had 91 total
violations and a weighted-average of 3.25 violations. Fiscal Integrity (FIS) had 255 total violations and a
weighted-average of 11.59 violations. And lastly, Eligibility, Recruitment, Selection, Enrollment, and
Attendance (ERSEA) had 62 total violations and a weighted-average of 5.64 violations.
The Head Start only (HS = 191), Early Head Start only (EHS = 33), and the Head Start/Early Head Start
(HS/EHS = 198) programs followed a similar pattern as with the total sample (n = 422). This indicates a
great deal of consistency in the sample drawn. See Appendix 4 for violation data for all 131 Compliance
Measures.
The practical implication of the above findings is that certain Content Areas (SYS, GOV, FIS) may need
additional exploration by OHS because of their high rates of non-compliance with the Compliance
Measures.

R e s e a r c h I n s t i t u t e f o r K e y I n d i c a t o r s
Page 6
OHS KEY INDICATOR PROJECT REPORT 2013
Section 3 – Program Quality
This section provides comparisons between the Compliance Measures (CM) data and the CLASS (ES, CO,
IS) data. This is a very important section because there is always the concern that compliance with the
HSPS has no relationship to program quality as measured by the CLASS. In Table 3, correlations were
run between the CM data and the CLASS scores for Emotional Support (ES), Classroom Organization
(CO), and Instruction Support (IS) for the Head Start only and the Head Start/Early Head Start programs.
The EHS only programs were not included because CLASS data are not collected on these programs. The
results are very positive and statistically significant in most cases. It is also important to note the very
positive correlation between the Head Start Key Indicators (HSKI2) and CLASS. This result supports using
the HSKI in monitoring Head Start.
Table 3 – Relationship Between Compliance Measures (CM), KI, and CLASS (ES, CO, IS) Scores
Compliance Measures Content Areas Key Indicators CLASS CM FCE ERSEA CDE GOV FIS CHS SYS KI CLASS/ES .22** .13* .15** .15** .11* .05 .23** .17** .27** CLASS/CO .19** .13* .11* .16** .04 .06 .21** .15** .25** CLASS/IS .20** .10 .12* .12* .13* .06 .18** .11* .17** CM Violations = Total Compliance Measure Violations CONTENT AREAS (CA): FCE = FAMILY and COMMUNITY ENGAGEMENT ERSEA = ELIGIBILITY, RECRUITMENT, SELECTION, ENROLLMENT, and ATTENDANCE CDE = CHILD DEVELOPMENT AND EDUCATION GOV = PROGRAM GOVERNANCE FIS = FISCAL INTEGRITY CHS =CHILD HEALTH AND SAFETY SYS = MANAGEMENT SYSTEMS CLASS/IS = Average CLASS IS (Instructional Support) Score CLASS/ES = Average CLASS ES (Emotional Support) Score CLASS/CO = Average CLASS CO (Classroom Organization) Score KI = Key Indicators Total Score ** p < .01 * p < .05 See Appendix 6 & 6A for the inter-correlations amongst all the Content Areas, HSKI, and Total Compliance with Compliance Measures.
These results are very important but it is equally important to look more specifically at the distribution
of the Compliance Measures (CM) scores and their relationship to the CLASS data (see Appendix 5 for
detailed graphic distributions and Appendix 6 & 6A for the inter-correlations amongst all the CA). When
this is done a very interesting trend appears (see Table 3a) in which a definite plateau occurs as the
scores move from more violations or lower compliance with the Compliance Measures (25-20 to 3-8 CM
Violations) to fewer violations or substantial compliance with the Compliance Measures (1-2 CM
Violations) and full compliance with the Compliance Measures (Zero (0) CM Violations).
R e s e a r c h I n s t i t u t e f o r K e y I n d i c a t o r s
Page 7
OHS KEY INDICATOR PROJECT REPORT 2013
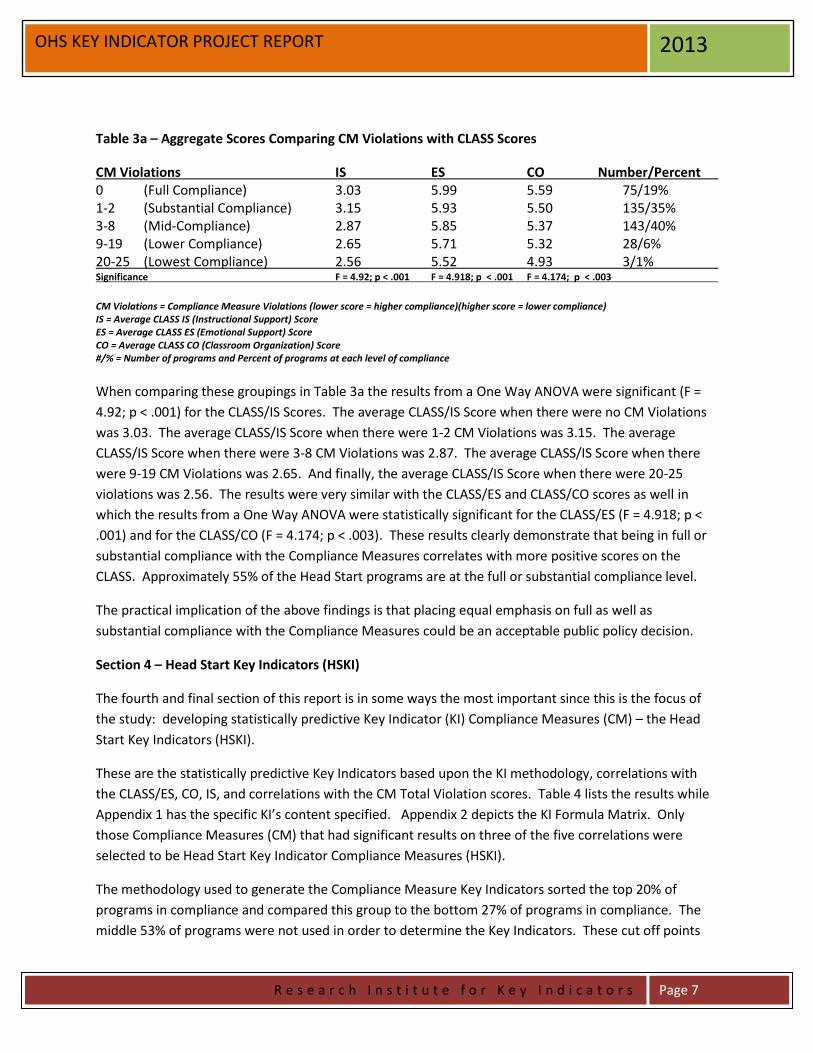
Table 3a – Aggregate Scores Comparing CM Violations with CLASS Scores
CM Violations IS ES CO Number/Percent 0 (Full Compliance) 3.03 5.99 5.59 75/19% 1-2 (Substantial Compliance) 3.15 5.93 5.50 135/35% 3-8 (Mid-Compliance) 2.87 5.85 5.37 143/40% 9-19 (Lower Compliance) 2.65 5.71 5.32 28/6% 20-25 (Lowest Compliance) 2.56 5.52 4.93 3/1% Significance F = 4.92; p < .001 F = 4.918; p < .001 F = 4.174; p < .003
CM Violations = Compliance Measure Violations (lower score = higher compliance)(higher score = lower compliance) IS = Average CLASS IS (Instructional Support) Score ES = Average CLASS ES (Emotional Support) Score CO = Average CLASS CO (Classroom Organization) Score #/% = Number of programs and Percent of programs at each level of compliance
When comparing these groupings in Table 3a the results from a One Way ANOVA were significant (F =
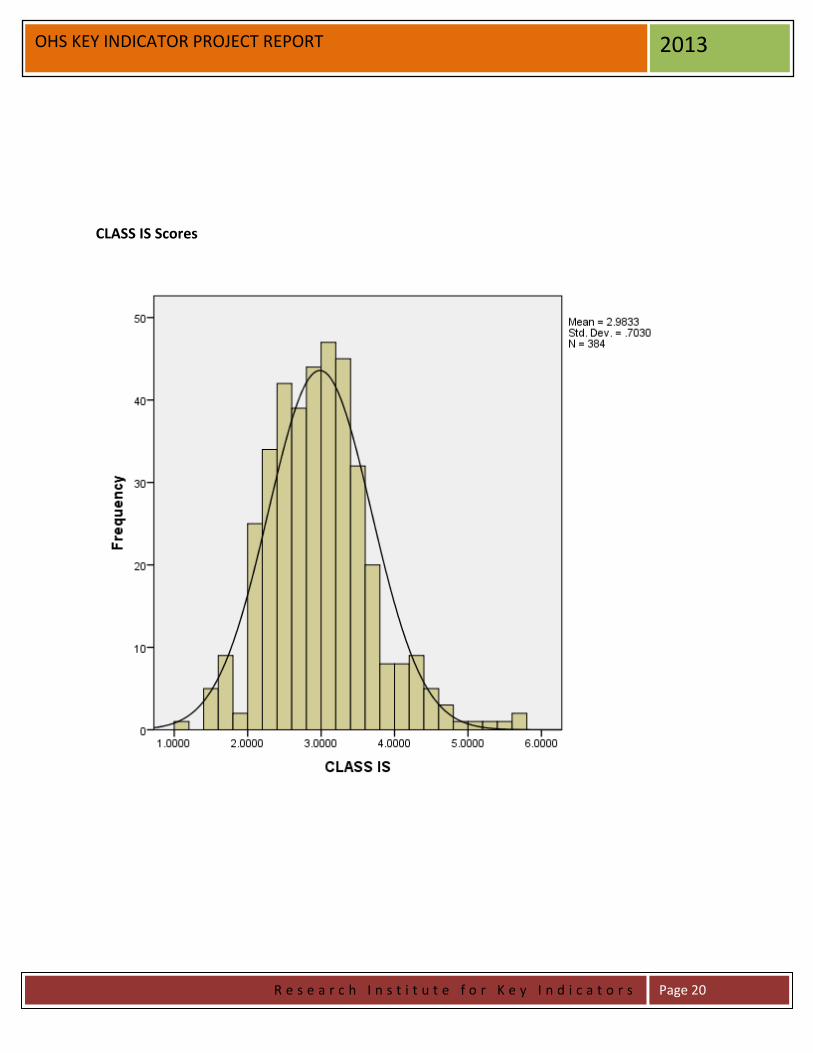
4.92; p < .001) for the CLASS/IS Scores. The average CLASS/IS Score when there were no CM Violations
was 3.03. The average CLASS/IS Score when there were 1-2 CM Violations was 3.15. The average
CLASS/IS Score when there were 3-8 CM Violations was 2.87. The average CLASS/IS Score when there
were 9-19 CM Violations was 2.65. And finally, the average CLASS/IS Score when there were 20-25
violations was 2.56. The results were very similar with the CLASS/ES and CLASS/CO scores as well in
which the results from a One Way ANOVA were statistically significant for the CLASS/ES (F = 4.918; p <
.001) and for the CLASS/CO (F = 4.174; p < .003). These results clearly demonstrate that being in full or
substantial compliance with the Compliance Measures correlates with more positive scores on the
CLASS. Approximately 55% of the Head Start programs are at the full or substantial compliance level.
The practical implication of the above findings is that placing equal emphasis on full as well as
substantial compliance with the Compliance Measures could be an acceptable public policy decision.
Section 4 – Head Start Key Indicators (HSKI)
The fourth and final section of this report is in some ways the most important since this is the focus of
the study: developing statistically predictive Key Indicator (KI) Compliance Measures (CM) – the Head
Start Key Indicators (HSKI).
These are the statistically predictive Key Indicators based upon the KI methodology, correlations with
the CLASS/ES, CO, IS, and correlations with the CM Total Violation scores. Table 4 lists the results while
Appendix 1 has the specific KI’s content specified. Appendix 2 depicts the KI Formula Matrix. Only
those Compliance Measures (CM) that had significant results on three of the five correlations were
selected to be Head Start Key Indicator Compliance Measures (HSKI).
The methodology used to generate the Compliance Measure Key Indicators sorted the top 20% of
programs in compliance and compared this group to the bottom 27% of programs in compliance. The
middle 53% of programs were not used in order to determine the Key Indicators. These cut off points

R e s e a r c h I n s t i t u t e f o r K e y I n d i c a t o r s
Page 8
OHS KEY INDICATOR PROJECT REPORT 2013
were determined by the compliance distribution in which 20% of the programs were in 100%
compliance while 27% of the programs had compliance scores of 95% or less.
Table 4 – Head Start Key Indicator (HSKI) Compliance Measures (CM) and CLASS and Total Violations
HSKI/CM (2013) Phi CLASS/ES CLASS/CO CLASS/IS Total Violations CDE4.1 .28*** .10* ns ns .30*** CHS1.1 .39*** .15** .16** ns .39*** CHS1.2 .33*** .18** .15** .10* .36*** CHS2.1 .49*** .18** .15** ns .54*** CHS3.10 .39*** .11* .11* ns .24*** GOV2.1 .31*** .11* ns ns .46*** SYS2.1 .47*** .15** .16** .14** .55*** SYS3.4 .58*** .13* .10* ns .36*** Phi = the phi coefficient which statistically predicts compliance with the full set of CM’s. CLASS/ES = correlations between the specific CM and this specific scale of the CLASS. CLASS/CO = correlations between the specific CM and this specific scale of the CLASS. CLASS/IS = correlations between the specific CM and this specific scale of the CLASS. Total Violations = correlations between the specific CM and the total number of CM violations for each program. * p < .05 ** p < .01 *** p < .001 ns = not significant
Separate Key Indicators were run for just Head Start only and Head Start/Early Head Start programs but
the key indicators were only a subset of the above list, albeit a shorter list in each case. Based upon
those phi coefficients, it was determined that using the above list for all Head Start only, Early Head
Start, and Head Start/Early Head Start was a more efficient and effective way to monitor all the
programs with one list of indicators rather than having separate key indicators for program types. The
separate phi coefficients run for Head Start only and Head Start/Early Head Start programs did not show
any significant differences because they were sub-samples of the overall sample drawn.
Section 4A – Suggested Use of the HSKI for Head Start Program Monitoring
Now that Key Indicators have been generated, the next question is how to use HSKI in the program
monitoring of Head Start. A possible way in which the HSKI could be used would be the following (see
Figure 1) in which a differential monitoring approach could be used:
All programs would be administered the HSKI. If there is full (100%) compliance with the Head Start Key
Indicators (HSKI) then the next scheduled review of the program would be an Abbreviated Monitoring
Visit (AMV). If there is not 100% compliance with the Head Start Key Indicators (HSKI) then the next
scheduled review of the program would be a Full Monitoring Visit (FMV) in which all Compliance
Measures are reviewed. Based upon the results of the FMV a determination could be made regarding a
compliance or non-compliance decision (see Figure 1) and how often the program will be visited.

R e s e a r c h I n s t i t u t e f o r K e y I n d i c a t o r s
Page 9
OHS KEY INDICATOR PROJECT REPORT 2013
Figure 1 – Head Start Key Indicator (HSKI) Compliance Measures Differential Monitoring Model
Compliance Decisions:
Head Start Key Indicators (HSKI) – this becomes a screening tool to determine if a program receives an AMV OR FMV visit.
HSKI (100%) = For the next visit, an Abbreviated Monitoring Visit (AMV) is conducted. Every 3-4 yrs a full Monitoring is conducted.
HSKI (not 100%) = For the next visit, a Full Monitoring Visit (FMV) is conducted and all CMs are reviewed.
Compliance = 98%+ with all CMs which indicates substantial to full compliance and 100% with HSKI. For the next visit, an Abbreviated
Monitoring Visit (AMV) is conducted.
Non-compliance = less than 98% with all CMs which indicates low compliance. For the next visit a Full Monitoring Visit (FMV) is conducted.
Moving to a differential monitoring system could provide a cost effective and efficient model for Head
Start program monitoring. This revision to the Head Start program monitoring system would combine a
risk assessment and key indicator approach (see Appendix 3) in determining what compliance measures
to review, how often, and how comprehensive a review should be utilized. It would continue to focus
on the most critical compliance measures that statistically predict overall compliance with the full
complement of compliance measures.
See Appendix 7 – Figure 2 for how the above differential monitoring system could impact the present
Head Start Tri-Annual Review Monitoring System. In this appendix, a cost neutral monitoring system is
proposed based upon the above DMLMA/Key Indicator Model.
Key Indicators
Screener =
(HSKI)
Abbreviated
Visit (AMV)
Full Visit
(FMV)
Abbreviated
Visit (AMV)
Abbreviated
Visit (AMV)
Full Visit (FMV)
Full Visit (FMV)
R e s e a r c h I n s t i t u t e f o r K e y I n d i c a t o r s
Page 10
OHS KEY INDICATOR PROJECT REPORT 2013
References
Fiene (2013). Differential monitoring logic model & algorithm, Research Institute for Key Indicators, Middletown, Pennsylvania.
Fiene (2003). Licensing related indicators of quality child care, Child Care Bulletin, Winter 2002-2003, pps 12-13.
Fiene (1985). Measuring the effectiveness of regulations, New England Journal of Human Services, 5(2), 38-39.
Fiene (1981). A new tool for day care monitoring introduced by children's consortium, Evaluation Practice, 1(2), 10-11.
Fiene & Kroh (2000). Licensing Measurement and Systems, NARA Licensing Curriculum. Washington, D.C.: National Association for Regulatory Administration. Fiene & Nixon (1985). Instrument based program monitoring and the indicator checklist for child care, Child Care Quarterly, 14(3), 198-214. Griffin & Fiene (1995). A systematic approach to policy planning and quality improvement for child care: A technical manual for state administrators. Washington, D.C.: National Center for Clinical Infant Programs-Zero to Three.
Footnotes
1) PIR Dashboard Key Indicators could not be generated because the PIR data demonstrated little statistical predictive ability to be
useful for discriminating between high and low compliant programs or program quality with the exception of staff having CDA’s.
2) The correlation between Compliance Measures (CM) and the statistically predictive Key Indicators (HSKI) was .77 which exceeds the
expected correlation threshold.
3) The correlations between the CLASS/ES, CO, IS and Key Indicators were the following: .27, .25, .17 respectively. The correlations
between KI and ES and CO were higher than the correlations between CM and ES, CO as reported earlier in this report. The
correlation between IS and CM was higher .20 than KI and IS (.17).
4) Because this study spans the 2012 Review Protocol and 2013 Monitoring Protocol, Compliance Indicators and Compliance Measures
are used interchangeably with a preference given to using Compliance Measures (CM) in this report. There are 139 Compliance
Indicators; 115 Compliance Measures, but for the purposes of this study 131 Compliance Measures were available in the 2012 Head
Start data base drawn for this study.
For additional information regarding this report, please contact: Richard Fiene, Ph.D., Director Research Institute for Key Indicators 41 Grandview Drive Middletown, PA. 17057 [email protected] [email protected] 717-944-5868 Phone and Fax http://RIKInstitute.wikispaces.com http://pennstate.academia.edu/RickFiene
February 2013 (revised March, April 2013)
R e s e a r c h I n s t i t u t e f o r K e y I n d i c a t o r s
Page 11
OHS KEY INDICATOR PROJECT REPORT 2013
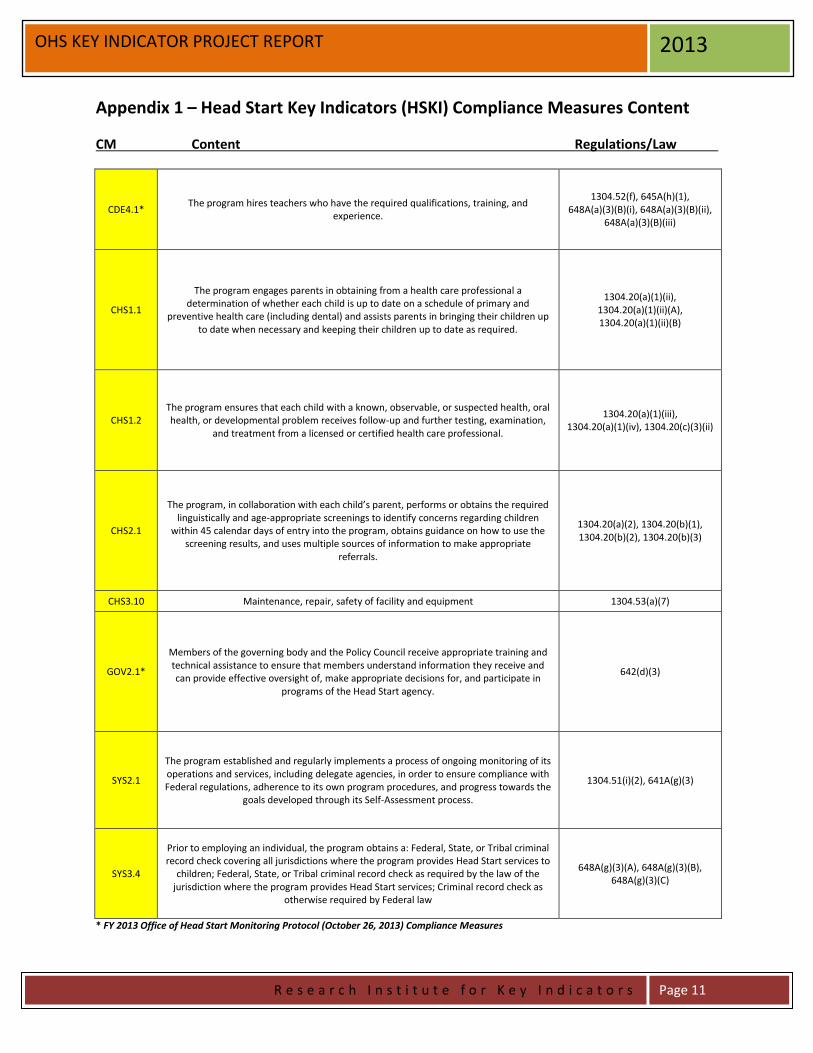
Appendix 1 – Head Start Key Indicators (HSKI) Compliance Measures Content
CM Content Regulations/Law
CDE4.1* The program hires teachers who have the required qualifications, training, and
experience.
1304.52(f), 645A(h)(1), 648A(a)(3)(B)(i), 648A(a)(3)(B)(ii),
648A(a)(3)(B)(iii)
CHS1.1
The program engages parents in obtaining from a health care professional a determination of whether each child is up to date on a schedule of primary and
preventive health care (including dental) and assists parents in bringing their children up to date when necessary and keeping their children up to date as required.
1304.20(a)(1)(ii), 1304.20(a)(1)(ii)(A), 1304.20(a)(1)(ii)(B)
CHS1.2 The program ensures that each child with a known, observable, or suspected health, oral health, or developmental problem receives follow-up and further testing, examination,
and treatment from a licensed or certified health care professional.
1304.20(a)(1)(iii), 1304.20(a)(1)(iv), 1304.20(c)(3)(ii)
CHS2.1
The program, in collaboration with each child’s parent, performs or obtains the required linguistically and age-appropriate screenings to identify concerns regarding children
within 45 calendar days of entry into the program, obtains guidance on how to use the screening results, and uses multiple sources of information to make appropriate
referrals.
1304.20(a)(2), 1304.20(b)(1), 1304.20(b)(2), 1304.20(b)(3)
CHS3.10 Maintenance, repair, safety of facility and equipment 1304.53(a)(7)
GOV2.1*
Members of the governing body and the Policy Council receive appropriate training and technical assistance to ensure that members understand information they receive and can provide effective oversight of, make appropriate decisions for, and participate in
programs of the Head Start agency.
642(d)(3)
SYS2.1
The program established and regularly implements a process of ongoing monitoring of its operations and services, including delegate agencies, in order to ensure compliance with Federal regulations, adherence to its own program procedures, and progress towards the
goals developed through its Self-Assessment process.
1304.51(i)(2), 641A(g)(3)
SYS3.4
Prior to employing an individual, the program obtains a: Federal, State, or Tribal criminal record check covering all jurisdictions where the program provides Head Start services to
children; Federal, State, or Tribal criminal record check as required by the law of the jurisdiction where the program provides Head Start services; Criminal record check as
otherwise required by Federal law
648A(g)(3)(A), 648A(g)(3)(B), 648A(g)(3)(C)
* FY 2013 Office of Head Start Monitoring Protocol (October 26, 2013) Compliance Measures

R e s e a r c h I n s t i t u t e f o r K e y I n d i c a t o r s
Page 12
OHS KEY INDICATOR PROJECT REPORT 2013
Appendix 2: Key Indicator Formula Matrix for HSKI – Head Start Key Indicators
Key Indicator Statistical Methodology (Calculating the Phi Coefficient):
________________________________________________________________ A = High Group + Programs in Compliance on Specific Compliance Measure. B = High Group + Programs out of Compliance on Specific Compliance Measure. C = Low Group + Programs in Compliance on Specific Compliance Measure. D = Low Group + Programs out of Compliance on Specific Compliance Measure. W = Total Number of Programs in Compliance on Specific Compliance Measure. X = Total Number of Programs out of Compliance on Specific Compliance Measure. Y = Total Number of Programs in High Group. Z = Total Number of Programs in Low Group.
______________________________________________________________________ High Group = Top 20% of Programs in Compliance with all Compliance Measures. Low Group = Bottom 27% of Programs in Compliance with all Compliance Measures.
Phi Coefficient Range Characteristic of Indicator Decision
(+1.00) – (+.26) Good Predictor Include on HSKI (+.25) – (0) Too Easy Do not Include (0) – (-.25) Too Difficult Do not Include (-.26) – (-1.00) Terrible Predictor Do not Include
Providers In Compliance
Programs Out Of Compliance
Row Total
High Group A B Y
Low Group C D Z
Column Total W X Grand Total
R e s e a r c h I n s t i t u t e f o r K e y I n d i c a t o r s
Page 13
OHS KEY INDICATOR PROJECT REPORT 2013
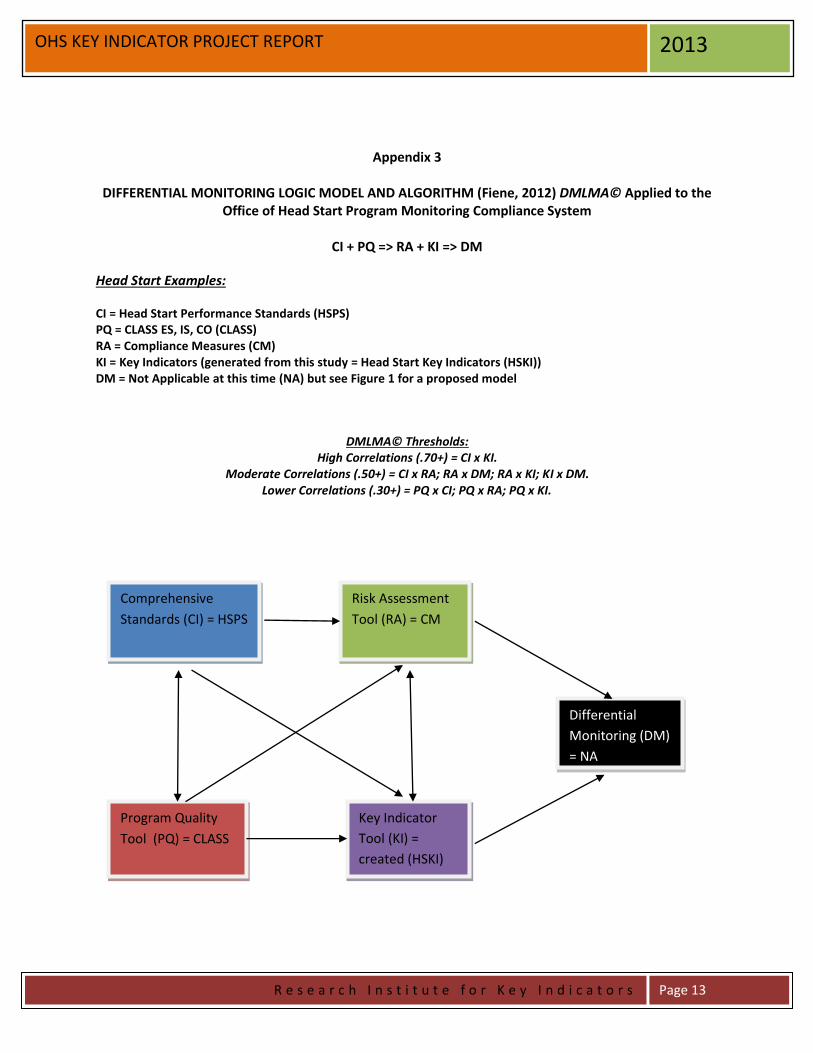
Appendix 3
DIFFERENTIAL MONITORING LOGIC MODEL AND ALGORITHM (Fiene, 2012) DMLMA© Applied to the Office of Head Start Program Monitoring Compliance System
CI + PQ => RA + KI => DM
Head Start Examples:
CI = Head Start Performance Standards (HSPS) PQ = CLASS ES, IS, CO (CLASS) RA = Compliance Measures (CM) KI = Key Indicators (generated from this study = Head Start Key Indicators (HSKI)) DM = Not Applicable at this time (NA) but see Figure 1 for a proposed model
DMLMA© Thresholds:
High Correlations (.70+) = CI x KI. Moderate Correlations (.50+) = CI x RA; RA x DM; RA x KI; KI x DM.
Lower Correlations (.30+) = PQ x CI; PQ x RA; PQ x KI.
Comprehensive
Standards (CI) = HSPS
Program Quality
Tool (PQ) = CLASS
Risk Assessment
Tool (RA) = CM
Key Indicator
Tool (KI) =
created (HSKI)
Differential
Monitoring (DM)
= NA

R e s e a r c h I n s t i t u t e f o r K e y I n d i c a t o r s
Page 14
OHS KEY INDICATOR PROJECT REPORT 2013
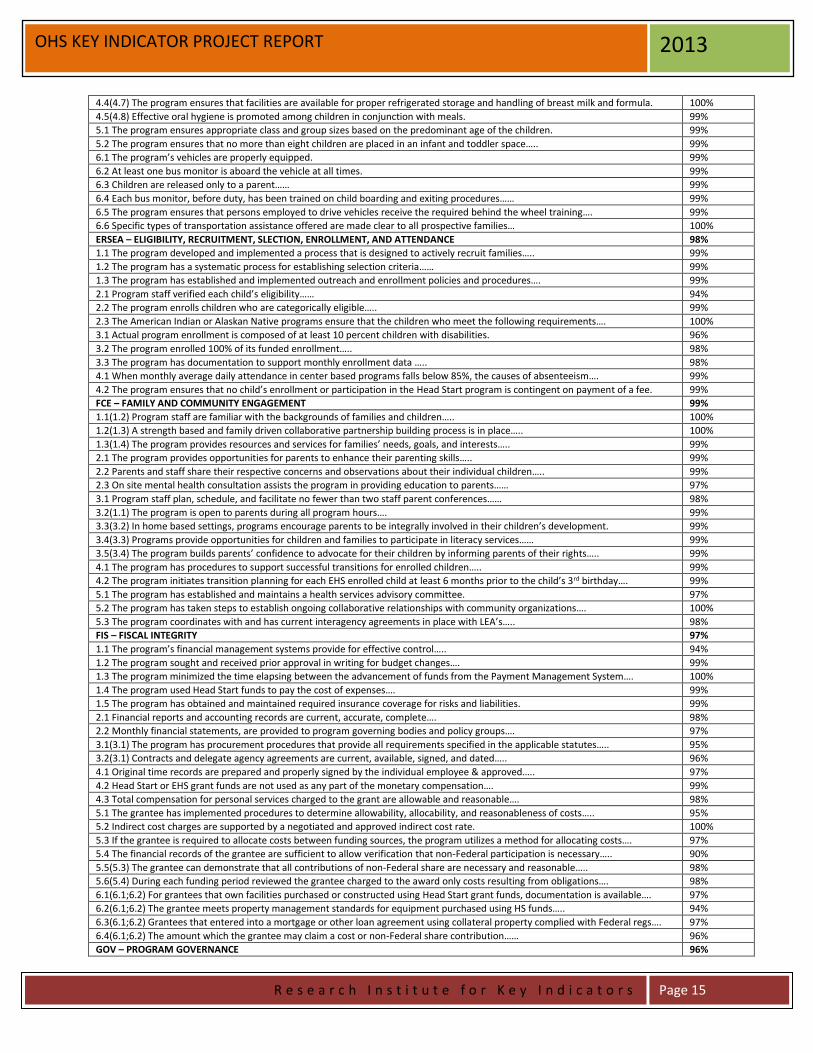
Appendix 4: Content Areas and Compliance Measures
Content Areas and Compliance Measures FY 2012 OHS On-Site Review Protocol (FY 2013 OHS Monitoring Protocol)
Percent (%) Compliance
CDE - CHILD DEVELOPMENT AND EDUCATION 99%
1.1(2.2) The program implements a curriculum that is aligned with the Head Start Child Development and Early Learning Framework... 99%
1.2 The program implements a curriculum that is evidence-based… 99%
1.3(2.1) The curriculum is comprehensive…. 99%
2.1 The program implements an infant toddler curriculum…. 99%
2.2 The program develops secure relationships in out of home care settings for infants and toddlers… 100%
2.3 The program implements an infant/toddler curriculum that encourages trust…. 100%
2.4 The program encourages the development of self-awareness, autonomy….. 100%
2.5 The program fosters independence. 100%
2.6 The program enhances each child’s strengths by encouraging self control…. 99%
2.7 The program plans for routines and transitions….. 99%
2.9 The program encourages respect for others feelings and rights. 99%
2.10 The program provides opportunities for children to engage in child-initiated….. 100%
2.11 Nutrition services contribute to children’s development and socialization….. 100%
3.1 The program uses information from screenings, ongoing observations….. 99%
3.3 The programs’ nutrition program is designed and implemented to meet the nutritional needs…. 98%
3.4(CHS4.5) Meal and snack periods are appropriately scheduled…. 99%
3.5(3.2) Services provided to children with identified disabilities are designed to support….. 100%
3.6(3.3) The program designates a staff member or consultant to coordinate services for children w/disabilities… 100%
3.7(3.4) The program has secured the services of a mental health professional….. 97%
3.8(3.5) The program’s approach to CDE is developmentally and linguistically appropriate…. 99%
4.1 The program establishes goals for improving school readiness….. 98%
4.2 The program uses self assessment information on school readiness goals….. 99%
4.3 The program demonstrates that children who are dual language learners….. 100%
5.1(4.1) The program hires teachers who have the required qualifications, training, & experience. 92%
5.2 The program ensures that family child care providers have the required qualifications…. 100%
5.3 The program ensures that all full time Head Start employees who provide direct education…. 96%
5.4 The program ensures that home visitors have the required qualifications, training…. 99%
5.5 When the majority of children speak the same language….. 99%
CHS - CHILD HEALTH AND SAFETY 97%
1.1 The program engages parents in obtaining from a health care professional a determination of whether each child…. 89%
1.2 The program ensures that each child with a known, observable, or suspected health, oral health….. 92%
1.3 The program involves parents, consulting with them immediately when child health or developmental problems….. 100%
1.4 The program informs parents and obtains authorization prior to all health procedures…. 98%
1.5 The program has established procedures for tracking the provision of health services. 97%
1.6 The EHS program helps pregnant women, immediately after enrollment in the program, access through referrals….. 100%
1.7 Program health staff conduct a home visit or ensure that a health staff member visits each newborn within 2 weeks of birth…. 97%
2.1 The program, in collaboration with each child’s parent, performs or obtains the required screenings…. 84%
2.2 A coordinated screening, assessment, and referral process for all children…. 98%
2.3 The program, in partnership with the LEA or Part C Agency, works to inform and engage parents in all plans for screenings…. 99%
3.1 Facilities used for center based program options comply with state and local licensing…. 100%
3.2 The program ensures that sufficient equipment, toys, materials, and furniture are provided…. 97%
3.3 Precautions are taken to ensure the safety of children. 99%
3.4 The program ensures that medication is properly stored and is not accessible to children. 98%
3.5 The program ensures that no hazards are present around children. 89%
3.6 The program ensures that sleeping arrangements for infants do not use soft bedding materials. 99%
3.7 All infant and toddler toys are made of non-toxic materials and sanitized regularly. 99%
3.8 The program has adequate usable indoor and outdoor space. 99%
3.9 Outdoor play areas are arranged to prevent children from getting into unsafe or unsupervised areas….. 100%
3.10 The program provides for maintenance, repair, safety, and security of all Head Start facilities and equipment. 85%
3.11 The program’s facilities provide adequately for children with disabilities….. 100%
4.1 Staff, volunteers, and children wash their hands with soap and running water. 98%
4.2 Spilled bodily fluids are cleaned up and disinfected immediately…. 100%
4.3 The program adopts sanitation and hygiene practices for diapering…… 99%
R e s e a r c h I n s t i t u t e f o r K e y I n d i c a t o r s
Page 15
OHS KEY INDICATOR PROJECT REPORT 2013
4.4(4.7) The program ensures that facilities are available for proper refrigerated storage and handling of breast milk and formula. 100%
4.5(4.8) Effective oral hygiene is promoted among children in conjunction with meals. 99%
5.1 The program ensures appropriate class and group sizes based on the predominant age of the children. 99%
5.2 The program ensures that no more than eight children are placed in an infant and toddler space….. 99%
6.1 The program’s vehicles are properly equipped. 99%
6.2 At least one bus monitor is aboard the vehicle at all times. 99%
6.3 Children are released only to a parent…… 99%
6.4 Each bus monitor, before duty, has been trained on child boarding and exiting procedures…… 99%
6.5 The program ensures that persons employed to drive vehicles receive the required behind the wheel training…. 99%
6.6 Specific types of transportation assistance offered are made clear to all prospective families… 100%
ERSEA – ELIGIBILITY, RECRUITMENT, SLECTION, ENROLLMENT, AND ATTENDANCE 98%
1.1 The program developed and implemented a process that is designed to actively recruit families….. 99%
1.2 The program has a systematic process for establishing selection criteria…… 99%
1.3 The program has established and implemented outreach and enrollment policies and procedures…. 99%
2.1 Program staff verified each child’s eligibility…… 94%
2.2 The program enrolls children who are categorically eligible….. 99%
2.3 The American Indian or Alaskan Native programs ensure that the children who meet the following requirements…. 100%
3.1 Actual program enrollment is composed of at least 10 percent children with disabilities. 96%
3.2 The program enrolled 100% of its funded enrollment….. 98%
3.3 The program has documentation to support monthly enrollment data ….. 98%
4.1 When monthly average daily attendance in center based programs falls below 85%, the causes of absenteeism…. 99%
4.2 The program ensures that no child’s enrollment or participation in the Head Start program is contingent on payment of a fee. 99%
FCE – FAMILY AND COMMUNITY ENGAGEMENT 99%
1.1(1.2) Program staff are familiar with the backgrounds of families and children….. 100%
1.2(1.3) A strength based and family driven collaborative partnership building process is in place….. 100%
1.3(1.4) The program provides resources and services for families’ needs, goals, and interests….. 99%
2.1 The program provides opportunities for parents to enhance their parenting skills….. 99%
2.2 Parents and staff share their respective concerns and observations about their individual children….. 99%
2.3 On site mental health consultation assists the program in providing education to parents…… 97%
3.1 Program staff plan, schedule, and facilitate no fewer than two staff parent conferences…… 98%
3.2(1.1) The program is open to parents during all program hours…. 99%
3.3(3.2) In home based settings, programs encourage parents to be integrally involved in their children’s development. 99%
3.4(3.3) Programs provide opportunities for children and families to participate in literacy services…… 99%
3.5(3.4) The program builds parents’ confidence to advocate for their children by informing parents of their rights….. 99%
4.1 The program has procedures to support successful transitions for enrolled children….. 99%
4.2 The program initiates transition planning for each EHS enrolled child at least 6 months prior to the child’s 3rd birthday…. 99%
5.1 The program has established and maintains a health services advisory committee. 97%
5.2 The program has taken steps to establish ongoing collaborative relationships with community organizations…. 100%
5.3 The program coordinates with and has current interagency agreements in place with LEA’s….. 98%
FIS – FISCAL INTEGRITY 97%
1.1 The program’s financial management systems provide for effective control….. 94%
1.2 The program sought and received prior approval in writing for budget changes…. 99%
1.3 The program minimized the time elapsing between the advancement of funds from the Payment Management System…. 100%
1.4 The program used Head Start funds to pay the cost of expenses…. 99%
1.5 The program has obtained and maintained required insurance coverage for risks and liabilities. 99%
2.1 Financial reports and accounting records are current, accurate, complete…. 98%
2.2 Monthly financial statements, are provided to program governing bodies and policy groups…. 97%
3.1(3.1) The program has procurement procedures that provide all requirements specified in the applicable statutes….. 95%
3.2(3.1) Contracts and delegate agency agreements are current, available, signed, and dated….. 96%
4.1 Original time records are prepared and properly signed by the individual employee & approved….. 97%
4.2 Head Start or EHS grant funds are not used as any part of the monetary compensation…. 99%
4.3 Total compensation for personal services charged to the grant are allowable and reasonable…. 98%
5.1 The grantee has implemented procedures to determine allowability, allocability, and reasonableness of costs….. 95%
5.2 Indirect cost charges are supported by a negotiated and approved indirect cost rate. 100%
5.3 If the grantee is required to allocate costs between funding sources, the program utilizes a method for allocating costs…. 97%
5.4 The financial records of the grantee are sufficient to allow verification that non-Federal participation is necessary….. 90%
5.5(5.3) The grantee can demonstrate that all contributions of non-Federal share are necessary and reasonable….. 98%
5.6(5.4) During each funding period reviewed the grantee charged to the award only costs resulting from obligations…. 98%
6.1(6.1;6.2) For grantees that own facilities purchased or constructed using Head Start grant funds, documentation is available…. 97%
6.2(6.1;6.2) The grantee meets property management standards for equipment purchased using HS funds….. 94%
6.3(6.1;6.2) Grantees that entered into a mortgage or other loan agreement using collateral property complied with Federal regs…. 97%
6.4(6.1;6.2) The amount which the grantee may claim a cost or non-Federal share contribution…… 96%
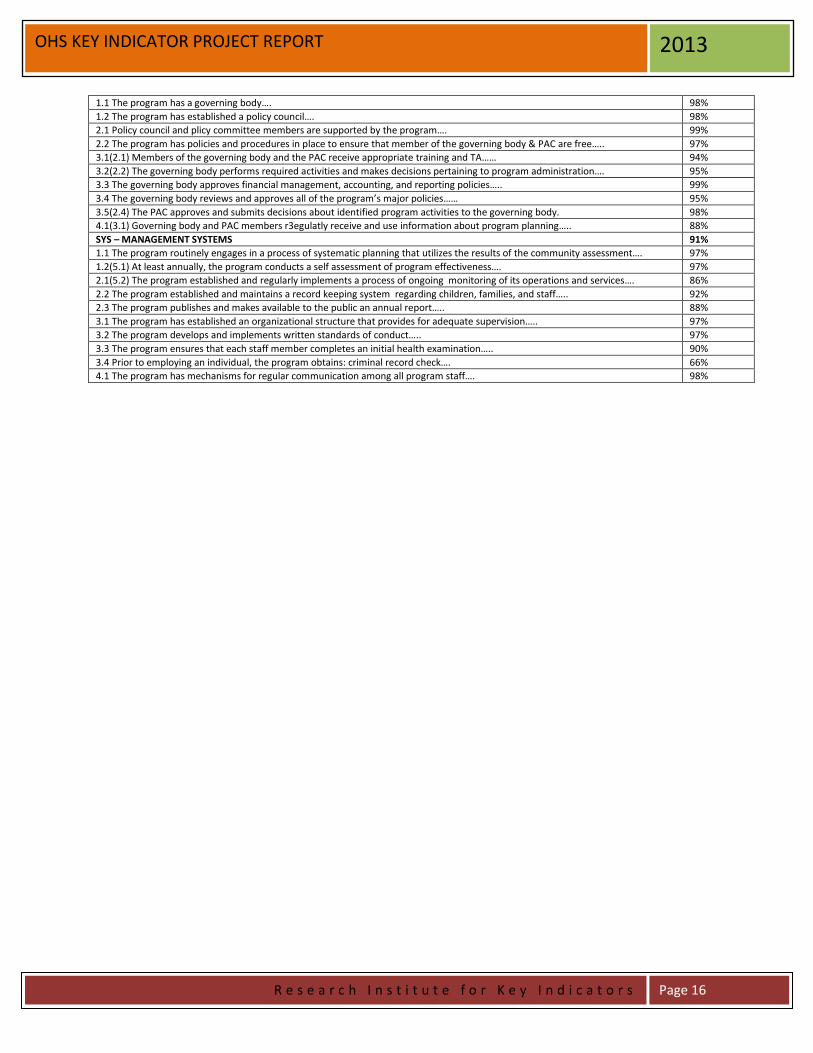
GOV – PROGRAM GOVERNANCE 96%
R e s e a r c h I n s t i t u t e f o r K e y I n d i c a t o r s
Page 16
OHS KEY INDICATOR PROJECT REPORT 2013
1.1 The program has a governing body…. 98%
1.2 The program has established a policy council…. 98%
2.1 Policy council and plicy committee members are supported by the program…. 99%
2.2 The program has policies and procedures in place to ensure that member of the governing body & PAC are free….. 97%
3.1(2.1) Members of the governing body and the PAC receive appropriate training and TA…… 94%
3.2(2.2) The governing body performs required activities and makes decisions pertaining to program administration…. 95%
3.3 The governing body approves financial management, accounting, and reporting policies….. 99%
3.4 The governing body reviews and approves all of the program’s major policies…… 95%
3.5(2.4) The PAC approves and submits decisions about identified program activities to the governing body. 98%
4.1(3.1) Governing body and PAC members r3egulatly receive and use information about program planning….. 88%
SYS – MANAGEMENT SYSTEMS 91%
1.1 The program routinely engages in a process of systematic planning that utilizes the results of the community assessment…. 97%
1.2(5.1) At least annually, the program conducts a self assessment of program effectiveness…. 97%
2.1(5.2) The program established and regularly implements a process of ongoing monitoring of its operations and services…. 86%
2.2 The program established and maintains a record keeping system regarding children, families, and staff….. 92%
2.3 The program publishes and makes available to the public an annual report….. 88%
3.1 The program has established an organizational structure that provides for adequate supervision….. 97%
3.2 The program develops and implements written standards of conduct….. 97%
3.3 The program ensures that each staff member completes an initial health examination….. 90%
3.4 Prior to employing an individual, the program obtains: criminal record check…. 66%
4.1 The program has mechanisms for regular communication among all program staff…. 98%

R e s e a r c h I n s t i t u t e f o r K e y I n d i c a t o r s
Page 17
OHS KEY INDICATOR PROJECT REPORT 2013
Appendix 5 – Histograms of Total Compliance Measure Violations, CLASS (IS, ES,
CO) Scores and Head Start Key Indicator (HSKI) Scores
Total Compliance Measure Violations

R e s e a r c h I n s t i t u t e f o r K e y I n d i c a t o r s
Page 18
OHS KEY INDICATOR PROJECT REPORT 2013
CLASS ES Scores

R e s e a r c h I n s t i t u t e f o r K e y I n d i c a t o r s
Page 19
OHS KEY INDICATOR PROJECT REPORT 2013
CLASS CO Scores
R e s e a r c h I n s t i t u t e f o r K e y I n d i c a t o r s
Page 20
OHS KEY INDICATOR PROJECT REPORT 2013
CLASS IS Scores

R e s e a r c h I n s t i t u t e f o r K e y I n d i c a t o r s
Page 21
OHS KEY INDICATOR PROJECT REPORT 2013
Head Start Key Indicators (HSKI) Scores

R e s e a r c h I n s t i t u t e f o r K e y I n d i c a t o r s
Page 22
OHS KEY INDICATOR PROJECT REPORT 2013
Appendix 6 - CONTENT AREA (CA) CORRELATIONS
CHS ERSEA FCE FIS GOV SYS
CDE
.33** .26** .06 .14** .13* .33** CHS
.29** .18** .09 .25** .51**
ERSEA
.15** .10* .27** .38** FCE
.01 .17** .23**
FIS
.13* .23** GOV
.38**
* P < .05 ** P < .01
CONTENT AREAS (CA): FCE = FAMILY and COMMUNITY ENGAGEMENT ERSEA = ELIGIBILITY, RECRUITMENT, SELECTION, ENROLLMENT, and ATTENDANCE CDE = CHILD DEVELOPMENT AND EDUCATION GOV = PROGRAM GOVERNANCE FIS = FISCAL INTEGRITY CHS =CHILD HEALTH AND SAFETY SYS = MANAGEMENT SYSTEMS
Appendix 6A – Total Compliance with Compliance Measures, HSKI,
and Content Area Correlations
TOT HSKI
CDE .51** .42** CHS .70** .81** ERSEA .49** .33** FCE .30** .22** FIS .50** .14** GOV .57** .37** SYS .78** .72**
TOT = Total Compliance with all Compliance Measures. HSKI = Total Compliance with the Head Start Key Indicators.
R e s e a r c h I n s t i t u t e f o r K e y I n d i c a t o r s
Page 23
OHS KEY INDICATOR PROJECT REPORT 2013
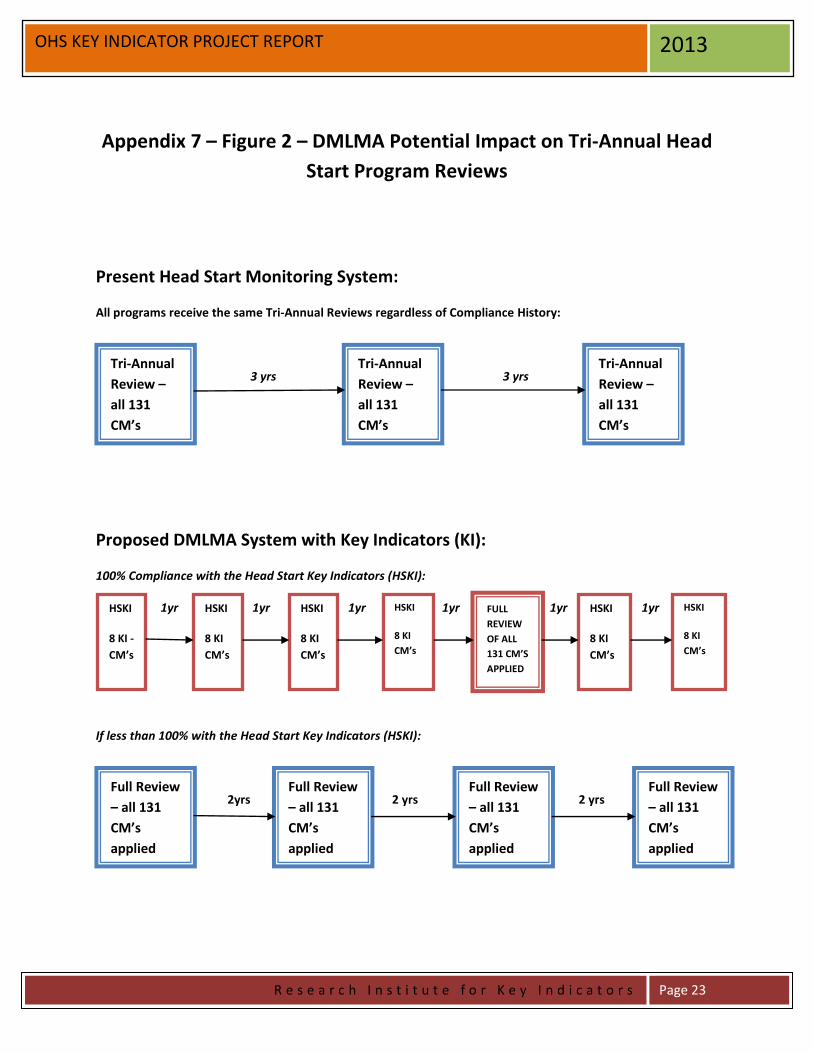
Appendix 7 – Figure 2 – DMLMA Potential Impact on Tri-Annual Head
Start Program Reviews
Present Head Start Monitoring System:
All programs receive the same Tri-Annual Reviews regardless of Compliance History:
3 yrs 3 yrs
Proposed DMLMA System with Key Indicators (KI):
100% Compliance with the Head Start Key Indicators (HSKI):
1yr 1yr 1yr 1yr 1yr 1yr
If less than 100% with the Head Start Key Indicators (HSKI):
2yrs 2 yrs 2 yrs
Tri-Annual
Review –
all 131
CM’s
applied
Tri-Annual
Review –
all 131
CM’s
applied
Tri-Annual
Review –
all 131
CM’s
applied
HSKI
8 KI -
CM’s
HSKI
8 KI
CM’s
HSKI
8 KI
CM’s
HSKI
8 KI
CM’s
FULL
REVIEW
OF ALL
131 CM’S
APPLIED
Full Review
– all 131
CM’s
applied
Full Review
– all 131
CM’s
applied
Full Review
– all 131
CM’s
applied
HSKI
8 KI
CM’s
HSKI
8 KI
CM’s
Full Review
– all 131
CM’s
applied
R e s e a r c h I n s t i t u t e f o r K e y I n d i c a t o r s
Page 24
OHS KEY INDICATOR PROJECT REPORT 2013
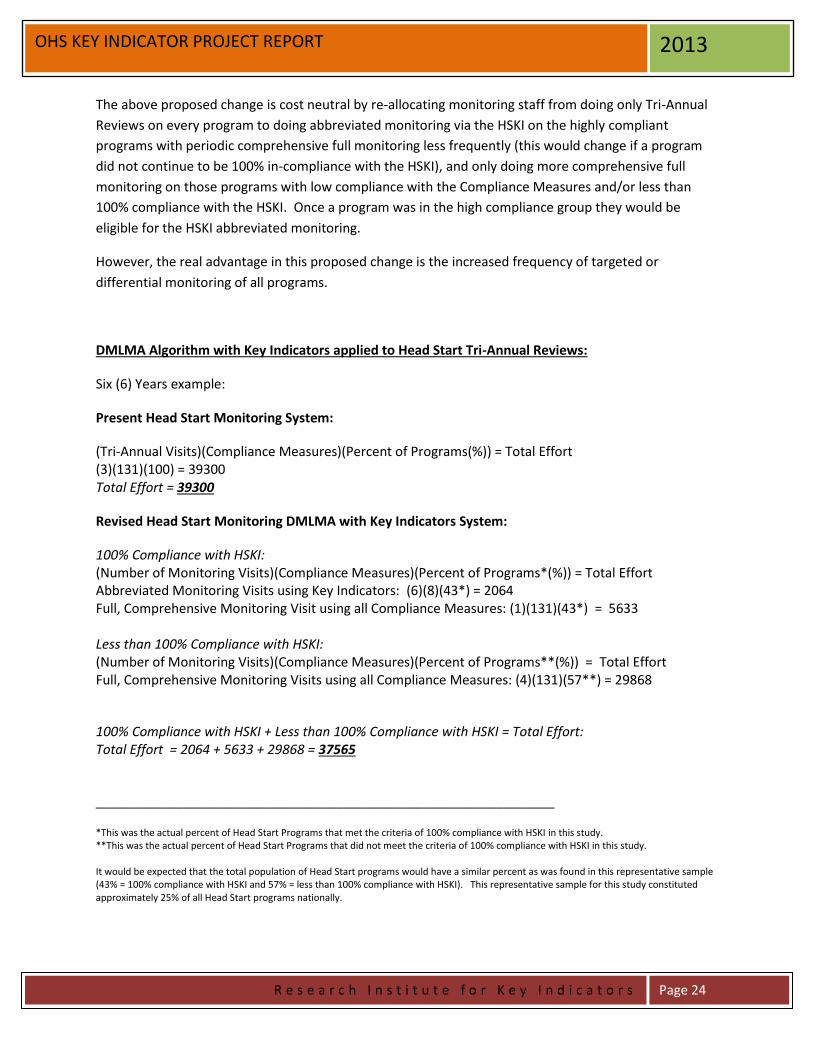
The above proposed change is cost neutral by re-allocating monitoring staff from doing only Tri-Annual
Reviews on every program to doing abbreviated monitoring via the HSKI on the highly compliant
programs with periodic comprehensive full monitoring less frequently (this would change if a program
did not continue to be 100% in-compliance with the HSKI), and only doing more comprehensive full
monitoring on those programs with low compliance with the Compliance Measures and/or less than
100% compliance with the HSKI. Once a program was in the high compliance group they would be
eligible for the HSKI abbreviated monitoring.
However, the real advantage in this proposed change is the increased frequency of targeted or
differential monitoring of all programs.
DMLMA Algorithm with Key Indicators applied to Head Start Tri-Annual Reviews:
Six (6) Years example:
Present Head Start Monitoring System:
(Tri-Annual Visits)(Compliance Measures)(Percent of Programs(%)) = Total Effort (3)(131)(100) = 39300 Total Effort = 39300
Revised Head Start Monitoring DMLMA with Key Indicators System:
100% Compliance with HSKI: (Number of Monitoring Visits)(Compliance Measures)(Percent of Programs*(%)) = Total Effort Abbreviated Monitoring Visits using Key Indicators: (6)(8)(43*) = 2064 Full, Comprehensive Monitoring Visit using all Compliance Measures: (1)(131)(43*) = 5633 Less than 100% Compliance with HSKI: (Number of Monitoring Visits)(Compliance Measures)(Percent of Programs**(%)) = Total Effort Full, Comprehensive Monitoring Visits using all Compliance Measures: (4)(131)(57**) = 29868
100% Compliance with HSKI + Less than 100% Compliance with HSKI = Total Effort: Total Effort = 2064 + 5633 + 29868 = 37565
_______________________________________________________________
*This was the actual percent of Head Start Programs that met the criteria of 100% compliance with HSKI in this study. **This was the actual percent of Head Start Programs that did not meet the criteria of 100% compliance with HSKI in this study. It would be expected that the total population of Head Start programs would have a similar percent as was found in this representative sample (43% = 100% compliance with HSKI and 57% = less than 100% compliance with HSKI). This representative sample for this study constituted approximately 25% of all Head Start programs nationally.
Licensing, Pre-K, QRIS, Accreditation, and Professional Development 2013
R e s e a r c h I n s t i t u t e f o r K e y I n d i c a t o r s
Page 1
The Relationship of Licensing, Head Start, Pre-K, QRIS, Accreditation, and
Professional Development and their Potential Impact on Child Outcomes
Richard Fiene, Ph.D.
October 11, 2013
ABSTRACT
This short paper will provide some thoughts about the various public policy initiatives/systems to
improve early care and education, such as licensing, Head Start, Pre-K, QRIS, accreditation, and
professional development and their potential impact on child outcomes. Early care and education is at a
major crossroads as a profession in attempting to determine which quality initiatives have the greatest
impact on children. Results are starting to come in from early studies which may provide some guidance
as policy makers begin making decisions about where to focus their limited funding resources.
Improving early care and education programs has a long public policy history as we attempt to
find the most cost effective and efficient means for attaining this lofty goal. There have been
many ups and downs over the years where funding was adequate and when it was not, but our
desire to accomplish this goal has always been front and center. Now, as a profession, we are at
somewhat of a cross-roads in determining which of the many quality initiatives appear to have
the greatest impact on children’s development. When I refer to children’s development, I am
looking at the whole child from the perspective of a child’s developmental status as well as the
child’s health and safety.
Presently we have many quality initiatives to look at which is a very good thing since at times in
the past we did not always have so many choices. Probably the one constant throughout the
history of early care and education in the past century has been licensing or regulations/rule
formulation. Some many argue that licensing is not a quality initiative but I would suggest that
licensing has many of the structural aspects of quality that have been identified in the research
literature. The other quality initiatives I will discuss have really started and been implemented in
the very later part of the 20th century so we are talking about a relatively new science when we
think about having its intended impact on children. Also, I am talking about large public policy
initiatives rather than highly structured, single focused research studies involving small samples
of children.
Licensing, Pre-K, QRIS, Accreditation, and Professional Development 2013
R e s e a r c h I n s t i t u t e f o r K e y I n d i c a t o r s
Page 2
Let’s start with licensing since this system has been present for the longest period of time. The
purpose of licensing is to act as the gatekeeper to the early care and education field in which only
those providers who meet specific standards, generally called rules or regulations are permitted
to operate and care for children. The rules are dominated by health and safety concerns with less
emphasis on curriculum planning and staff-child interactions. The rules measure more structural
aspects of quality than the process aspects of quality; dealing with what attorney’s call the “hard
data” rather than the “soft data”.
Since licensing rules allow entry into the early care and education field to provide services
usually the rules are not overally stringent with the majority of providers being in high
compliance if not full compliance with all the rules. This would be expected since these are
basic health and safety standards. And in fact when one looks at compliance data, it is extremely
skewed with the majority of providers having very high compliance scores with relatively few
violations of the rules. However, this does introduce a certain difficulty in using these data for
decision making purposes at an aggregate level because so many providers score at a high level it
becomes increasingly difficult to distinguish between the really excellent providers and the
somewhat mediocre providers. Another way of looking at this skewing of the data is to term it
as a plateau effect in which there is very little variance at the upper ends of the compliance
spectrum. This is a major issue with skewed data and basic standards which is an important
consideration with licensing but will also be an important consideration when one looks at the
other quality initiatives to be addressed shortly.
Because of this plateau effect with licensing data, it may explain much of the lack of
relationships found between compliance with rules and any types of outcomes related to
children’s outcomes and provider’s overall quality. However, with licensing data and making
comparisons to children’s outcomes we should be looking at general health data such as
immunization status and safety data such as the number of injuries at programs with varying
levels of compliance with health and safety rules.
A significant development over the past two decades has been the development of national health
and safety standards with the publication of Caring for Our Children (CFOC3) and Stepping
Stones (SS3). Although these standards are not required but are only recommended practice that
provides guidance to states as they revise their rules, these two documents have been embraced
by the licensing/regulatory administration field. Although unlikely, if not impossible, to comply
with all the CFOC3 standards, it would be interesting to compare states on this set of standards
which may add a good deal of variance to the basic health and safety data that has been missing
with licensing rules.
The next system to look at is the national Head Start program. Out of the major programs that
are national in scope, Head Start has a long history of providing services to low income children
and their families. Head Start Performance Standards are definitely more stringent than licensing
rules but not as stringent as accreditation standards. Based upon Head Start’s more stringent

Licensing, Pre-K, QRIS, Accreditation, and Professional Development 2013
R e s e a r c h I n s t i t u t e f o r K e y I n d i c a t o r s
Page 3
standards and the additional supports that are part of its program, Head Start generally scores
higher on program quality tools (e.g., CLASS or ERS) than licensed child care in states.
With Head Start programs, we at times find skewing or plateauing of data when we compare
compliance with the Head Start Performance Standards (HSPS) and program quality tools such
as the CLASS. However, this is dependent upon the various subscales within the CLASS in
which the plateauing of data does not occur all of the time. I think that has a lot to do with the
HSPS being fairly stringent standards as compared to state licensing rules in general.
A program that has gotten a good deal of support at the state level are Pre-K programs. These
programs come with stricter standards than licensed child care with an emphasis on the
professional development of staff. There is more concern about the process aspects of quality
which focus more on teacher-child interactions. This emphasis on teacher-child interaction has
paid off in which these programs generally are high performers when you compare Pre-K funded
classrooms to licensed child care classrooms. In fact, Pre-K funding appears to have a positive
impact on licensed child care in raising overall quality scores on the ECERS-R for all classrooms
in programs that receive Pre-K funding even if some of the classrooms are not the direct
beneficiaries of the funding. This is a very significant finding because we knew that Pre-K
funding increased the quality of care in classrooms receiving those funds, but now, it appears
that there is a spillover effect to all classrooms co-located with Pre-K funded classrooms. I must
admit that I was initially skeptical when Pre-K funding was first proposed because I thought it
would take funding and the focus away from improving licensed child care at the state level; but
it appears that the advocates for Pre-K were right in their assertion that Pre-K would increase the
quality of all early care and education which includes licensed child care.
A more recent entry into the state funding scene are QRIS (Quality Rating and Improvement
Systems) which build upon licensing systems, are voluntary, and have substantial financial
incentives for participating in this quality improvement system. It is too early to really determine
if QRIS is having the intended impact because the program is so new (50% of states have a
QRIS), and the penetration rate is usually below 50% in any given state (remember the system is
voluntary). However, in the few studies done, the results are mixed. It does appear that
programs which move up the various star levels do increase the quality of care they provide; but
in a most recent study looking at child outcomes, no relationship was found between increasing
levels of compliance with QRIS standards and how well children did in those programs with the
exception of CLASS scores in which teacher-child interactions were measured and emphasized –
here there were significant relationships between higher scores on the CLASS and child
outcomes.
Accreditation systems come in many varieties but there are only three that I know of in which
empirical studies have been done to validate their systems: NAEYC, NECPA for centers and
NAFDC for homes. Also reliability testing has been done in each of these systems.
Accreditation is a rigorous self-study that really improves programs through the self-study

Licensing, Pre-K, QRIS, Accreditation, and Professional Development 2013
R e s e a r c h I n s t i t u t e f o r K e y I n d i c a t o r s
Page 4
process. This should come as no surprise because we have known for some time that program
monitoring all by itself leads to program improvements. Now when you couple that with
technical assistance you see even more improvement. Accreditation is usually the other pillar of
a QRIS system with licensing being the first pillar. The QRIS standards fill the gap from
licensing to accreditation. Accreditation is a voluntary system just as in most cases with QRIS.
However, in accreditation we are reaching less than 10% of the programs with the majority of
these attaining NAEYC accreditation. NECPA and NAFDC have much smaller market shares.
The last system to be addressed is the professional development systems that have been
established in all states. This is one quality improvement initiative that has 100% penetration in
all states. It is usually tied to QRIS through technical assistance and mentoring (coaching).
When it focuses on mentoring rather than workshops, it has demonstrated its effectiveness in
changing teachers behaviors in how they interact with children in their care in a very positive
fashion. This is very important because the research literature is clear about the importance of
the teacher-child interaction when it comes to child outcomes. Professional development runs
the gamut from pre-service (University based programs) to in-service (training, technical
assistance, mentoring, coaching) programming for teachers and directors.
So where does this leave us when policy makers begin to try to determine which quality
improvement initiatives should be invested in to start with, which to increase in funding, and
maybe even which ones should be defunded. I think there are some trends we need to begin to
look at, such as the following:
1) Having stringent and rigorous standards is very important. The more that we do not, the
more opportunities for mediocre programs to score artificially higher on whatever scale
that is used. This is evident with licensing data where the data are significantly skewed
with a major plateau effect at the upper end of compliance rules/regulations.
2) Emphasis on teacher-child interaction needs to be paramount in our quality improvement
initiatives. Working with teachers through mentoring/coaching appears to be most
effective in changing teachers’ behaviors in interacting more positively with children.
3) Making sure we are measuring the right outcomes. Match health and safety standards
with health and safety outcomes for children. Match developmental outcomes for
children with standards that emphasize positive teacher-child interactions.
4) Building upon #1 above, find what the key indicators are with all the data that we collect.
We are spending too much time in looking at too many things which in many cases are
simply just not the right things to look at. As states’ data systems become more
sophisticated, and they are, this will be easier to do. Let’s begin to utilize the data we
have already collected.

Qualistar Rating Key Indicator Study - Fiene RIKI
R e s e a r c h I n s t i t u t e f o r K e y I n d i c a t o r s
Page 1
Qualistar Rating Key Indicator Study
Richard Fiene, Ph.D.
June 17, 2014
ABSTRACT
This report provides an analysis of Colorado’s quality rating system, the Qualistar Rating, for generating
key indicators. Key indicators have been used a great deal in the licensing literature but this is a first time
analysis in utilizing this methodology in a QRS (Quality Rating System) or a QRIS (Quality Rating and
Improvement System). The key indicator methodology is described in detail applying it to QRS/QRIS.
The results clearly indicate that the strongest key indicators are within the Family Partnerships component
of the Qualistar Rating; however there are some major limitations to utilizing this methodology with
QRS/QRIS.
INTRODUCTION
The Qualistar Rating, administered by Qualistar Colorado, is one of the longest continuously
running QRS in the United States. Presently over 50% of states have QRS/QRIS and the
research on these program quality rating & improvement systems has increased over the years.
One area of research that has been gaining momentum most recently is ascertaining the most
effective and efficient delivery system for a QRS/QRIS as the number of early care and
education programs participating in QRS/QRIS continues to increase. This report provides an
overview to the topic and introduces an option that has been used in the human services/child
care licensing field in identifying key indicators of overall compliance with standards. The
purpose of the key indicator methodology is to focus monitoring visits on those standards that
have the ability to predict overall compliance with the full set of QRS/QRIS standards. The key
indicator methodology is part of a program monitoring approach called Differential Program
Monitoring which was developed to help streamline the program monitoring of early care and
education programs (please see the Appendix for two graphics which help to depict this
relationship (Figures 8/9). It was first applied in child care licensing (Fiene & Nixon, 1985) but
has been used in many other service types, such as: Head Start Performance Standards (Fiene,
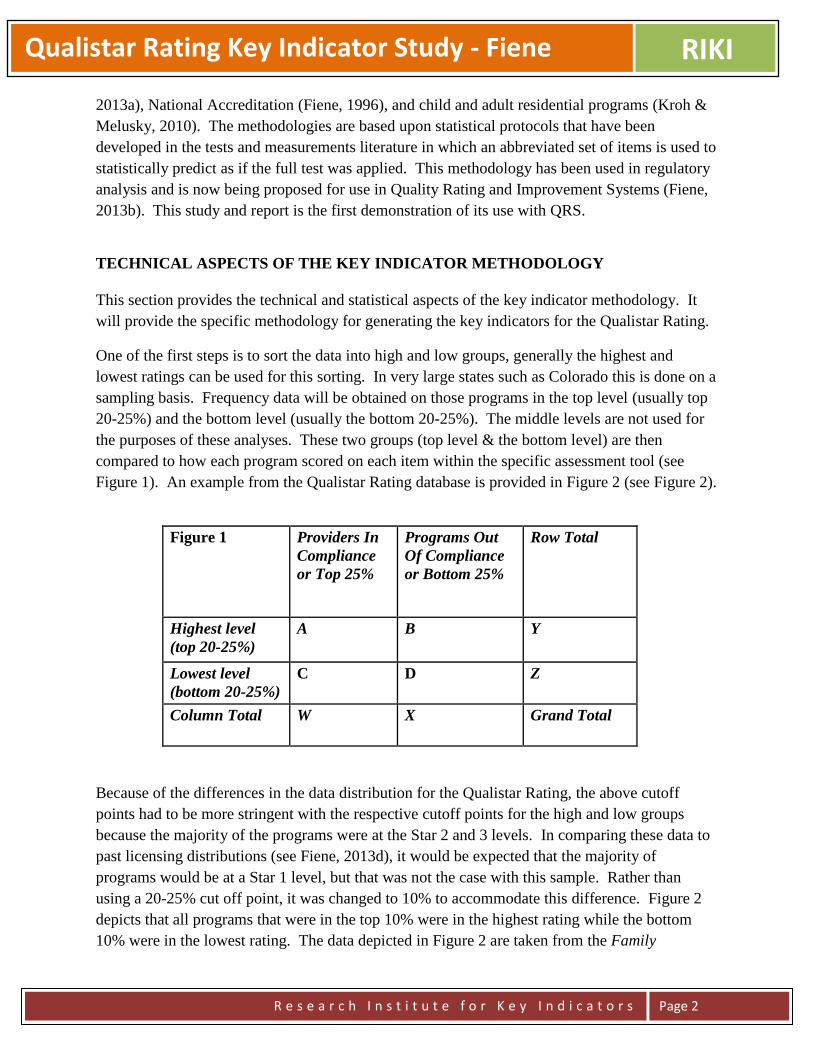
Qualistar Rating Key Indicator Study - Fiene RIKI
R e s e a r c h I n s t i t u t e f o r K e y I n d i c a t o r s
Page 2
2013a), National Accreditation (Fiene, 1996), and child and adult residential programs (Kroh &
Melusky, 2010). The methodologies are based upon statistical protocols that have been
developed in the tests and measurements literature in which an abbreviated set of items is used to
statistically predict as if the full test was applied. This methodology has been used in regulatory
analysis and is now being proposed for use in Quality Rating and Improvement Systems (Fiene,
2013b). This study and report is the first demonstration of its use with QRS.
TECHNICAL ASPECTS OF THE KEY INDICATOR METHODOLOGY
This section provides the technical and statistical aspects of the key indicator methodology. It
will provide the specific methodology for generating the key indicators for the Qualistar Rating.
One of the first steps is to sort the data into high and low groups, generally the highest and
lowest ratings can be used for this sorting. In very large states such as Colorado this is done on a
sampling basis. Frequency data will be obtained on those programs in the top level (usually top
20-25%) and the bottom level (usually the bottom 20-25%). The middle levels are not used for
the purposes of these analyses. These two groups (top level & the bottom level) are then
compared to how each program scored on each item within the specific assessment tool (see
Figure 1). An example from the Qualistar Rating database is provided in Figure 2 (see Figure 2).
Figure 1 Providers In
Compliance
or Top 25%
Programs Out
Of Compliance
or Bottom 25%
Row Total
Highest level
(top 20-25%)
A B Y
Lowest level
(bottom 20-25%)
C D Z
Column Total W X Grand Total
Because of the differences in the data distribution for the Qualistar Rating, the above cutoff
points had to be more stringent with the respective cutoff points for the high and low groups
because the majority of the programs were at the Star 2 and 3 levels. In comparing these data to
past licensing distributions (see Fiene, 2013d), it would be expected that the majority of
programs would be at a Star 1 level, but that was not the case with this sample. Rather than
using a 20-25% cut off point, it was changed to 10% to accommodate this difference. Figure 2
depicts that all programs that were in the top 10% were in the highest rating while the bottom
10% were in the lowest rating. The data depicted in Figure 2 are taken from the Family

Qualistar Rating Key Indicator Study - Fiene RIKI
R e s e a r c h I n s t i t u t e f o r K e y I n d i c a t o r s
Page 3
Engagement Standard 5 – The program provides opportunities for staff and families to get to
know one another. The reason for selecting this particular standard is that it demonstrates a
perfect Phi Coefficient in discriminating between the highest level and the lowest level1.
Figure 2:
Criterion 5
Family
Partnerships
Providers In
Compliance
or Top 10%1
Programs Out
Of Compliance
or Bottom 10%
Row Total
Highest Star
level
11 0 11
Lowest Star
level
0 10 10
Column Total 11 10 21
Once the data are sorted in the above matrix, the following formula (Figure 3) is used to
determine if the standard is a key indicator or not by calculating its respective Phi Coefficient.
Please refer back to Figure 1 for the actual placement within the cells and Figure 2 for the data
within the cells. The legend (Figure 4) below the formula shows how the cells are defined.
Figure 3 – Formula for Phi Coefficient
Figure 4 – Legend for the Cells within the Phi Coefficient
Once the data are run through the formula in Figure 3, the following chart (Figure 5) can be used
to make the final determination of including or not including the item as a key indicator. Based
A = High Group + Programs in Compliance on Specific Compliance Measure. B = High Group + Programs out of Compliance on Specific Compliance Measure. C = Low Group + Programs in Compliance on Specific Compliance Measure. D = Low Group + Programs out of Compliance on Specific Compliance Measure. W = Total Number of Programs in Compliance on Specific Compliance Measure. X = Total Number of Programs out of Compliance on Specific Compliance Measure. Y = Total Number of Programs in High Group. Z = Total Number of Programs in Low Group.
Qualistar Rating Key Indicator Study - Fiene RIKI
R e s e a r c h I n s t i t u t e f o r K e y I n d i c a t o r s
Page 4
upon the chart in Figure 5, it is best to have a Phi Coefficient approaching +1.00 since the data
are more normally distributed2 than is the case with licensing data.
Continuing with the chart in Figure 5, a Phi Coefficient between +.75 and -.25 indicates that the
indicator is unpredictable in being able to predict overall compliance with the quality rating
assessment tool. Either a false positive in which the indicator appears too often in the low group
as being in compliance, or a false negative in which the indicator appears too often in the high
group as being out of compliance3. This can occur with Phi Coefficients above +.75 but it
becomes unlikely as they approach +1.00, although there is always the possibility that other
standards/rules/regulations could be found to be out of compliance (this was demonstrated in a
study conducted by the author (Fiene, 2013c). Another solution is to increase the number of key
indicators to be reviewed but this will cut down on the efficiency which is desirable and the
purpose of the key indicators.
The last possible outcome with the Phi Coefficient is if it is between -.26 and -1.00, this indicates
that the indicator is a terrible predictor because it is doing just the opposite of the desired. The
indicator would predominantly be in compliance with the low group rather than the high group
so it would be statistically predicting overall non-compliance. This is obviously undesirable.
Figure 5 – Thresholds for the Phi Coefficient (Fiene & Nixon, 1983, 1985)(Fiene, 2014)
The key indicators should then only be used with those programs that have attained the highest
rating. It is not intended for those programs that have attained lower ratings. However, even
with those programs that have attained the highest rating, periodically a full, comprehensive
review using the full set of standards for Qualistar Colorado should occur (see Figure 6 for a
graphical depiction). It is intended that a re-validation of the key indicators occur on a periodic
basis to make certain that the key indicators have not changed because of differences in
compliance with standards history. This is an important and necessary step for the program to
engage in to ascertain the overall validity and reliability of the assessment system. Also there
should not have been any major changes in the program while the key indicators are being
administered, such as the director leaving or a large percentage of teachers leaving or enrollment
increasing significantly, or a change in the licensing or accreditation status of the program.
Phi Coefficient Range Characteristic of Indicator Decision
(+1.00) – (+.76) Good Predictor Include
(+.75) – (-.25) Unpredictable Do not Include
(-.26) – (-1.00) Terrible Predictor Do not Include

Qualistar Rating Key Indicator Study - Fiene RIKI
R e s e a r c h I n s t i t u t e f o r K e y I n d i c a t o r s
Page 5
Figure 6 - Proposed DMLMA System with Key Indicators (KI)
Use of Qualistar Rating Key Indicators (QRKI) for Monitoring with a Full Review every 4th Year for Star 4
Programs.
1yr 1yr 1yr 1yr 1yr 1yr
This model is taken from the licensing literature and as will be pointed out in the Limitations and Conclusion Sections may not necessarily be appropriate for QRS/QRIS systems depending on a state’s QRS/QRIS data distribution. It is provided for illustrative purposes.
RESULTS
The results reported in this section are based upon a sample selected from the overall Qualistar
Rating database from its most recent monitoring reviews (N = 117). This was a representative
sample of the program’s QRS.
There are five components of the Qualistar Rating: Learning Environment, Family Partnerships,
Training and Education, Adult to Child Ratios and Group Size, and Accreditation. See Figures
10-14 in the Appendix for the graphical depictions of the data distributions for the five major
criteria. The data distributions are provided because a pre-requisite for calculating the key
indicator Phi Coefficients is the dichotomization of data with a skewed data distribution. Figures
10-14 display how much the data are skewed.
The Qualistar Rating is a zero-to-4 star system, with 4 stars indicating the highest level of
quality4. Eleven programs were rated at the Star 1 level, 19 programs were rated at the Star 2
level, 77 programs were rated at the Star 3 level, and 10 programs were rated at the Star 4 level
for a total of 117 programs included in these analyses. There were no programs in the sample
that earned less than one star.
Based upon the key indicator methodology described in the previous section, the only Qualistar
Rating standards that reached key indicator designation5 were the following: Family Partnership
Standard/Criterion 5 = The program provides opportunities for staff and families to get to know
one another; Family Partnership Standard/Criterion 7 = Families receive information on their
child’s progress on a regular basis, using a formal mechanism such as a report or parent
conference and Family Partnership Standard/Criterion 8 = Families are included in planning
and decision making for the program.
QRKI
QRKI
QRKI
QRKI
FULL
REVIEW
QRKI
QRKI
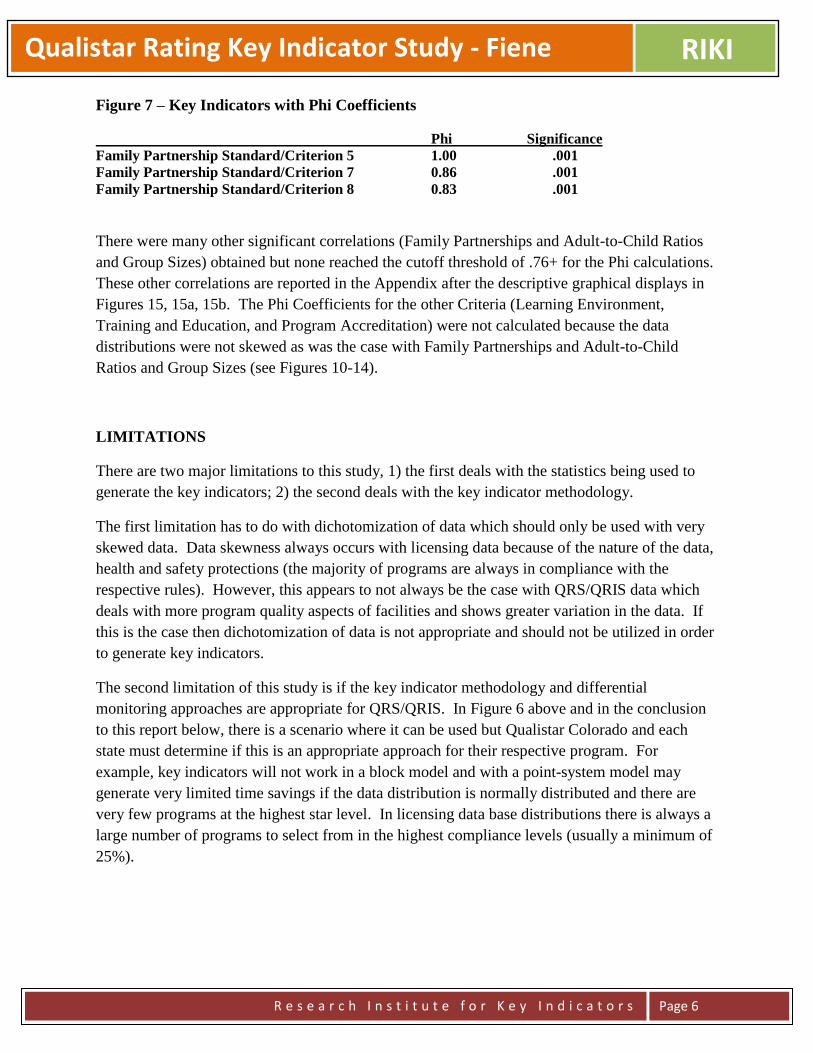
Qualistar Rating Key Indicator Study - Fiene RIKI
R e s e a r c h I n s t i t u t e f o r K e y I n d i c a t o r s
Page 6
Figure 7 – Key Indicators with Phi Coefficients
Phi Significance
Family Partnership Standard/Criterion 5 1.00 .001
Family Partnership Standard/Criterion 7 0.86 .001
Family Partnership Standard/Criterion 8 0.83 .001
There were many other significant correlations (Family Partnerships and Adult-to-Child Ratios
and Group Sizes) obtained but none reached the cutoff threshold of .76+ for the Phi calculations.
These other correlations are reported in the Appendix after the descriptive graphical displays in
Figures 15, 15a, 15b. The Phi Coefficients for the other Criteria (Learning Environment,
Training and Education, and Program Accreditation) were not calculated because the data
distributions were not skewed as was the case with Family Partnerships and Adult-to-Child
Ratios and Group Sizes (see Figures 10-14).
LIMITATIONS
There are two major limitations to this study, 1) the first deals with the statistics being used to
generate the key indicators; 2) the second deals with the key indicator methodology.
The first limitation has to do with dichotomization of data which should only be used with very
skewed data. Data skewness always occurs with licensing data because of the nature of the data,
health and safety protections (the majority of programs are always in compliance with the
respective rules). However, this appears to not always be the case with QRS/QRIS data which
deals with more program quality aspects of facilities and shows greater variation in the data. If
this is the case then dichotomization of data is not appropriate and should not be utilized in order
to generate key indicators.
The second limitation of this study is if the key indicator methodology and differential
monitoring approaches are appropriate for QRS/QRIS. In Figure 6 above and in the conclusion
to this report below, there is a scenario where it can be used but Qualistar Colorado and each
state must determine if this is an appropriate approach for their respective program. For
example, key indicators will not work in a block model and with a point-system model may
generate very limited time savings if the data distribution is normally distributed and there are
very few programs at the highest star level. In licensing data base distributions there is always a
large number of programs to select from in the highest compliance levels (usually a minimum of
25%).

Qualistar Rating Key Indicator Study - Fiene RIKI
R e s e a r c h I n s t i t u t e f o r K e y I n d i c a t o r s
Page 7
CONCLUSION/FUTURE RESEARCH/DISCUSSION/RECOMMENDATIONS
This study is the first of its kind in generating key indicators for a QRS based upon the analyses
performed with the Qualistar Rating data base. It potentially demonstrates that the use of the key
indicator methodology with QRS/QRIS could be feasible and warranted in order to focus limited
program monitoring resources in a most efficient and effective manner keeping the above stated
limitations in mind as stated in the previous Limitations Section. In the future, Qualistar
Colorado may want to pilot an approach utilizing a small group of programs and could focus
resources on the Family Partnership/Engagement standards on an ongoing basis between
comprehensive reviews as depicted in Figure 6 above for Star 4 programs. The time saved here
could then be redistributed to spending more time with the Star 1 programs.
It will be timely to see other states and programs who are interested in generating key indicators
if they have Family Partnership/Engagement standards as part of their respective QRS/QRIS to
determine if these standards reach the same threshold for key indicator designation as has
occurred in this study. It will also be interesting to see if any other state’s criteria/standards data
distributions are similar to what has been found in the Qualistar Rating or not.
However, as highlighted in the Limitations Section, states and programs need to consider if the
key indicator methodology and the resultant differential monitoring model is really warranted
and appropriate for their respective QRS/QRIS’s. As has been the case with Colorado’s
Qualistar Rating, only two of the five major criteria: Family Partnerships and Adult-Child
Ratio/Group Size were determined to be good candidates for the key indicator Methodology in
which the data were skewed6 enough to warrant dichotomization. The other three major criteria:
Learning Environment, Training and Education, and Program Accreditation were determined not
to be sufficiently skewed to warrant dichotomization. This sets up a decision making system in
which only 40% of the criteria are being used and severely limits the overall predictability of the
key indicators selected. Could the other criteria be used to generate key indicators? Of course,
but dichotomization of data should not be done when data are not highly skewed (MacCallun,
etal, 2002). Yes, we were successful in generating Key Indicators for the Qualistar Rating but
within a limited scenario in how they should be used. The results are not equivalent to what has
been found and utilized in the licensing literature where the licensing data are always highly
skewed. If a state or program find that all their standards are skewed in a similar way to
licensing data then dichotomization of data and the generation of key indicators is warranted.
A recommendation to Colorado’s Qualistar and other programs and states where they find the
data from their standards more normally distributed that they not use a key indicator approach.
The key indicator approach remains a reliable and valid methodology for licensing but only in
very special and limited cases will it be an appropriate monitoring approach for more program
quality focused systems, such as QRS/QRIS and accreditation. For those QRS/QRIS systems
where the standards are more normally distributed, the recommendation would be to continue to
use the full set of QRS/QRIS standards and not use an abbreviated set of standards.

Qualistar Rating Key Indicator Study - Fiene RIKI
R e s e a r c h I n s t i t u t e f o r K e y I n d i c a t o r s
Page 8
NOTES:
1. For analytical purposes, the top 10% of programs received an average score of 8 points or higher on a 10
point scale and the bottom 10% of programs received an average score of 2 points or less on a 10 point scale.
2. The reason for pointing out the need to have a higher Phi Coefficient than what has been reported previously
(Fiene & Nixon, 1983, 1985) is the fact that the dichotomization of data should only be used with skewed data
and not normally distributed data because it will accentuate differences. However, since the purpose of the
dichotomization of data is only for sorting into a high and low group, it would appear to be acceptable for this
purpose (MacCallun, etal, 2002. On the practice of dichotomization of quantitative variables, Psychological
Methods, 7, 1, 19-40.).
3. These results would show an increase in cells B and C in Figure 1 which is undesirable; it should
always be the case where A + D > B + C for key indicators to maintain their predictive validity.
4. The following point values equate to the various Star levels in the Qualistar Rating System (for detailed
information regarding the QRS system please see the following document: Qualistar Colorado – Qualistar
Rating Criteria Chart, November 2012):
Provisional = 0 – 9 points or Learning Environment score of 0
Star 1 = 10 - 17 points
Star 2 = 18 - 25 points
Star 3 = 26 - 33 points
Star 4 = 34 - 42 points
Qualistar Rating Criteria Chart:
Learning Environment = points are awarded based on average classroom scores on the
ERS Scales. (Score of component: 1 – 10)
Family Partnerships = points are awarded based on how well programs communicate
with collaborate with, and involve families. Score of component: 1 – 10)
Training and Education = points are awarded to teachers & center administrators based
on their professional development level and amount of experience, with criteria
separated by position. Score of component: 1 – 10
Adult-to-Child Ratios & Group Size = points are awarded based on the average adult-to
-child ratio and group size in each classroom. Score of component: 1 – 10
Program Accreditation = points are awarded for receiving and maintaining national
program accreditation through an approved organization. Score of component:
0 or 2 points
The reader needs to keep in mind that Qualistar Colorado is not a state agency but rather a private non-profit
agency.
5. The three Family Partnership Standards were met at the Star 4 level always or most of the time (see Figure
2).
6. The respective skewness figures are the following: Family Partnership = -1.425; Adult-Child Ratio/Group
Size = -1.506; Learning Environment = -0.946; Training and Education = 0.028; Program Accreditation =
7.548. See Figure 16 for basic descriptive statistics for these Criteria.
For additional information regarding this Report, please contact:
Richard Fiene, Ph.D., Director/President, Research Institute for Key Indicators (RIKI), 41 Grandview Drive, Middletown, PA.
17057; [email protected]; 717-944-5868 Phone and Fax; http://RIKInstitute.wikispaces.com

Qualistar Rating Key Indicator Study - Fiene RIKI
R e s e a r c h I n s t i t u t e f o r K e y I n d i c a t o r s
Page 9
REFERENCES AND ADDITIONAL RELATED READINGS REGARDING DIFFERENTIAL
MONITORING, RISK ASSESSMENT, AND KEY INDICATOR METHODOLOGIES:
Barnard, Smith, Fiene, Swanson (2006). Evaluation of Pennsylvania’s Keystone STARS Quality
Rating and Improvement System, Pittsburgh: Pennsylvania, Office of Child Development.
Fiene (2013a). A comparison of international child care and US child care using the Child Care
Aware – NACCRRA (National Association of Child Care Resource and Referral Agencies) child
care benchmarks, International Journal of Child Care and Education Policy, 7(1), 1-15.
Fiene (2013b)(2014). Differential monitoring logic model and algorithm. Middletown:
Pennsylvania, Research Institute for Key Indicators.
Fiene (2013c). Head Start Key Indicators. Middletown: Pennsylvania, Research Institute for Key
Indicators.
Fiene (2013d). Kansas Child Care Key Indicators. Middletown: Pennsylvania, Research Institute
for Key Indicators.
Fiene (2013e). Validation of Georgia’s core rule differential monitoring system. Middletown:
Pennsylvania, Research Institute for Key Indicators.
Fiene (2007). Child Development Program Evaluation & Caregiver Observation Scale, in T Halle
(Ed.), Early Care and Education Quality Measures Compendium, Washington, D.C.: Child
Trends.
Fiene (2003). Licensing related indicators of quality child care, Child Care Bulletin, winter
2002-2003, pps 12-13.
Fiene (2002a). Thirteen indicators of quality child care: Research update. Washington, DC:
Office of the Assistant Secretary for Planning and Evaluation, US Department of Health and
Human Services.
Fiene (2002b). Improving child care quality through an infant caregiver mentoring project, Child
and Youth Care Forum, 31(2), 75-83.
Fiene, Iutcovich, Johnson, & Koppel (1998). Child day care quality linked to opportunities for
professional development: An applied community psychology example. Community Psychologist,
31(1), 10-11.
Fiene (1996). Using a statistical-indicator methodology for accreditation, in NAEYC
Accreditation: A Decade of Learning and the Years Ahead, S. Bredekamp & B. Willer, editors,
Washington, D.C.: National Association for the Education of Young Children.
Fiene (1995). Utilizing a statewide training system to improve child day care quality: The other
system in a program quality improvement model. Child Welfare, Volume LXXIV, #6, November-
December, 1189-1201.
Qualistar Rating Key Indicator Study - Fiene RIKI
R e s e a r c h I n s t i t u t e f o r K e y I n d i c a t o r s
Page 10
Fiene (1985). Measuring the effectiveness of regulations, New England Journal of Human
Services, 5(2), 38-39.
Fiene (1981). A new tool for day care monitoring introduced by children's consortium,
Evaluation Practice, 1(2), 10-11.
Fiene, Greenberg, Bergsten, Carl, Fegley, & Gibbons (2002). The Pennsylvania early childhood
quality settings study, Harrisburg, Pennsylvania: Governor’s Task Force on Early Care and
Education.
Fiene & Kroh (2000). Licensing Measurement and Systems, NARA Licensing Curriculum.
Washington, D.C.: National Association for Regulatory Administration.
Fiene & Nixon (1985). Instrument based program monitoring and the indicator checklist for child
care, Child Care Quarterly, 14(3), 198-214.
Griffin & Fiene (1995). A systematic approach to policy planning and quality improvement for
child care: A technical manual for state administrators. Washington, D.C.: National Center for
Clinical Infant Programs-Zero to Three.
Kontos & Fiene (1987). Child care quality, compliance with regulations, and children's
development: The Pennsylvania Study, in Quality in Child Care: What Does Research Tell Us?
Phillips, editor, Washington, D.C.: National Association for the Education of Young Children.
Zellman, G. L. and Fiene, R. (2012). Validation of Quality Rating and Improvement Systems for
Early Care and Education and School-Age Care, Research-to-Policy, Research-to-Practice Brief
OPRE 2012. Washington, DC: Office of Planning, Research and Evaluation, Administration for
Children and Families, U.S. Department of Health and Human Services

Qualistar Rating Key Indicator Study - Fiene RIKI
R e s e a r c h I n s t i t u t e f o r K e y I n d i c a t o r s
Page 11
Appendix – Figure 8
DIFFERENTIAL MONITORING LOGIC MODEL & ALGORITHM (DMLMA©) (Fiene, 2012): A 4th
Generation ECPQIM – Early Childhood Program Quality Indicator Model
CI x PQ => RA + KI => DM + PD => CO
Definitions of Key Elements:
PC = Program Compliance/Licensing (Health and Safety) (Caring for Our Children) PQ = QRIS/Accreditation/Caregiver/Child Interactions/Classroom Environment Quality (ERS/CLASS/PAS/BAS) RA = Risk Assessment, (High Risk Rules) (Stepping Stones) KI = Key Indicators (Predictor Rules) (13 Key Indicators of Quality Child Care) DM = Differential Monitoring (How often to visit and what to review) PD = Professional Development/Technical Assistance/Training (Not pictured but part of Model) CO = Child Outcomes (Not pictured but part of Model)
Comprehensive
Licensing Tool (CI)
Structural Quality
Program Quality
Tool (PQ) - QRIS
Process Quality
Risk Assessment
Tool (RA)
Key Indicator
Tool (KI)
Differential
Monitoring (DM)
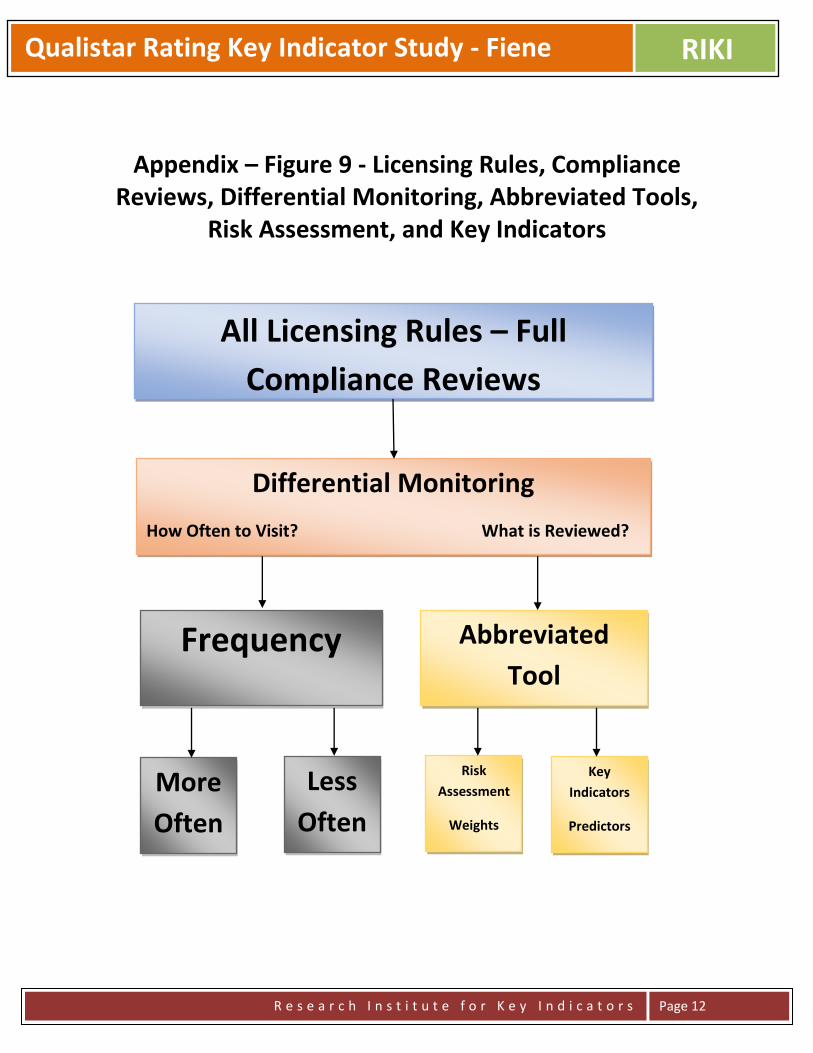
Qualistar Rating Key Indicator Study - Fiene RIKI
R e s e a r c h I n s t i t u t e f o r K e y I n d i c a t o r s
Page 12
Appendix – Figure 9 - Licensing Rules, Compliance Reviews, Differential Monitoring, Abbreviated Tools,
Risk Assessment, and Key Indicators
All Licensing Rules – Full
Compliance Reviews
Differential Monitoring
How Often to Visit? What is Reviewed?
Frequency Abbreviated
Tool
More
Often
Less
Often
Risk
Assessment
Weights
Key
Indicators
Predictors

Qualistar Rating Key Indicator Study - Fiene RIKI
R e s e a r c h I n s t i t u t e f o r K e y I n d i c a t o r s
Page 13
APPENDIX
Figure 10
Figures 10-14 depict the data distributions for overall Star points as well as for the major
criteria/standards (Training & Education, Learning Environment, Adult-to-Child Ratios & Group Size,
and Family Partnerships). Figures 13-14 clearly demonstrate how these respective criteria/standards are
extremely skewed data distributions while Figures 10-12 show a more normally distributed data pattern.
This is important for which standards can be dichotomized and phi coefficients generated.
Dichotomization of data should only be used with skewed data which is the case in figures 13-14. It is
not appropriate with the data distributions in figures 10-12. Also see Figure 16 for additional descriptive
statistics for the specific criteria.
0 1 2 3 4
OVERALL STAR POINTS
0
10
20
30
40
50
60
70
80

Qualistar Rating Key Indicator Study - Fiene RIKI
R e s e a r c h I n s t i t u t e f o r K e y I n d i c a t o r s
Page 14
Figure 11
0 1 2 3 4 5 6 7 8 9 10
TRAINING EDUCATION STAR POINTS
0
5
10
15
20
25
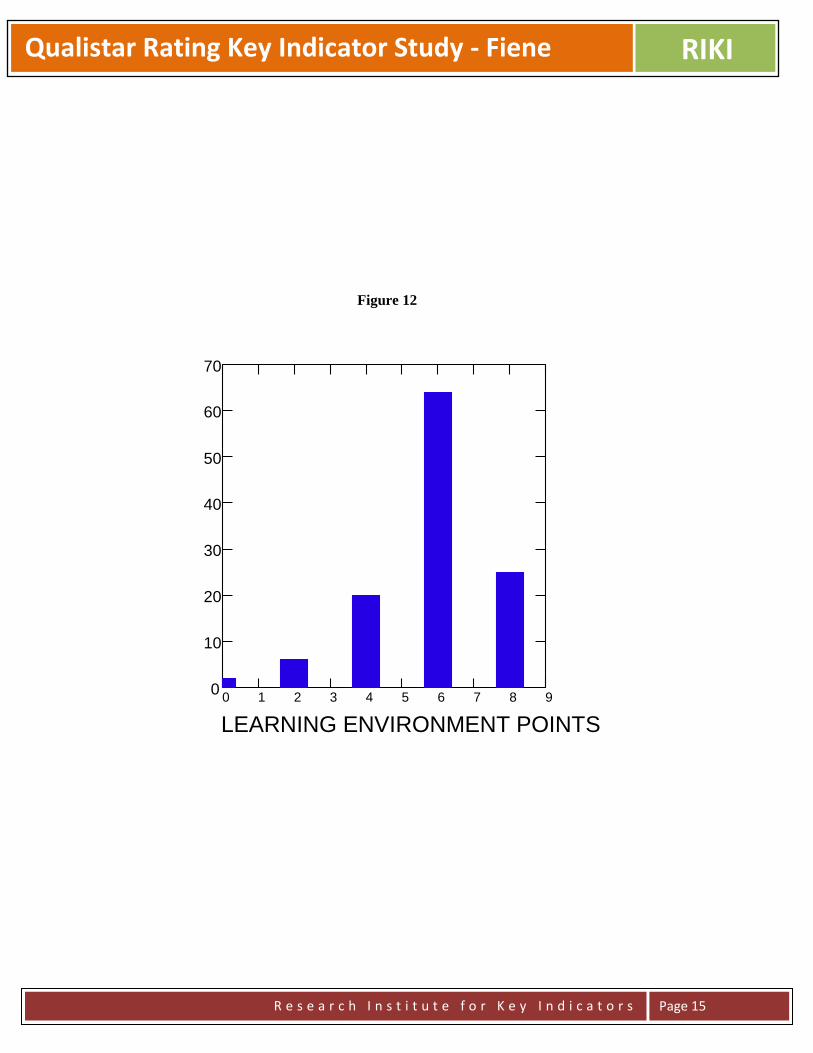
Qualistar Rating Key Indicator Study - Fiene RIKI
R e s e a r c h I n s t i t u t e f o r K e y I n d i c a t o r s
Page 15
Figure 12
0 1 2 3 4 5 6 7 8 9
LEARNING ENVIRONMENT POINTS
0
10
20
30
40
50
60
70
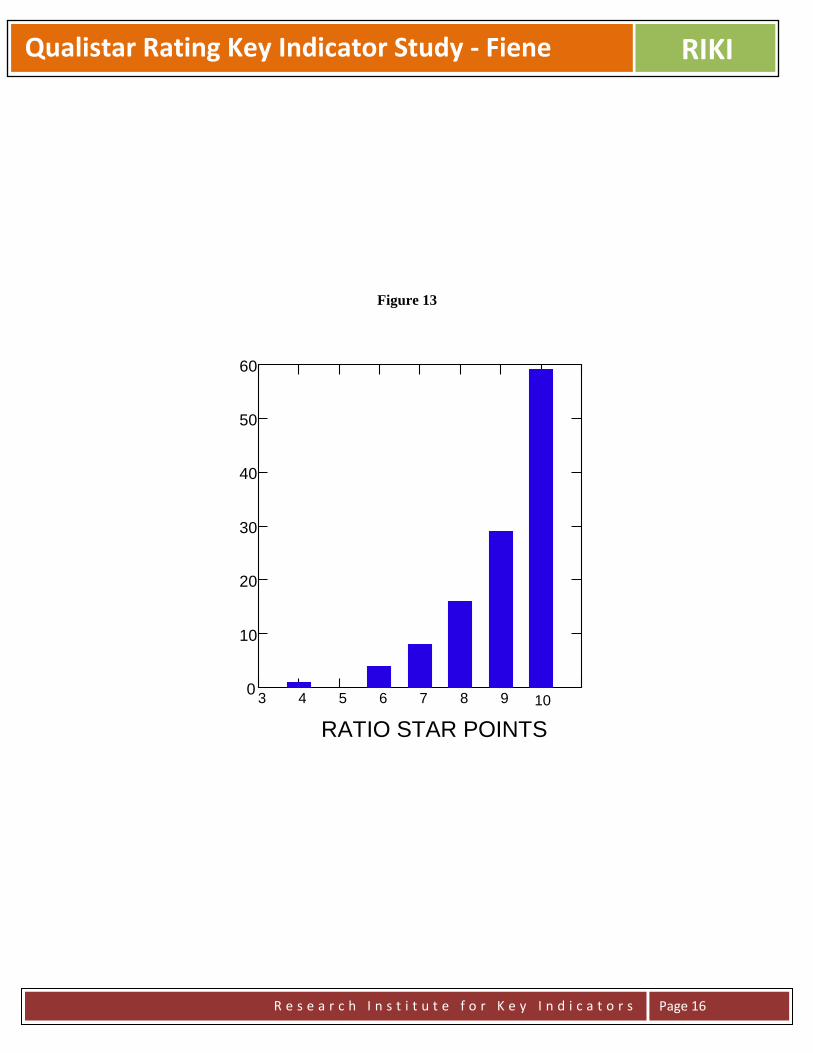
Qualistar Rating Key Indicator Study - Fiene RIKI
R e s e a r c h I n s t i t u t e f o r K e y I n d i c a t o r s
Page 16
Figure 13
3 4 5 6 7 8 9 10
RATIO STAR POINTS
0
10
20
30
40
50
60

Qualistar Rating Key Indicator Study - Fiene RIKI
R e s e a r c h I n s t i t u t e f o r K e y I n d i c a t o r s
Page 17
Figure 14
0 2 4 6 8 10
FAMILY PARTNERSHIP STAR POINTS
0
10
20
30
40
50
60
70
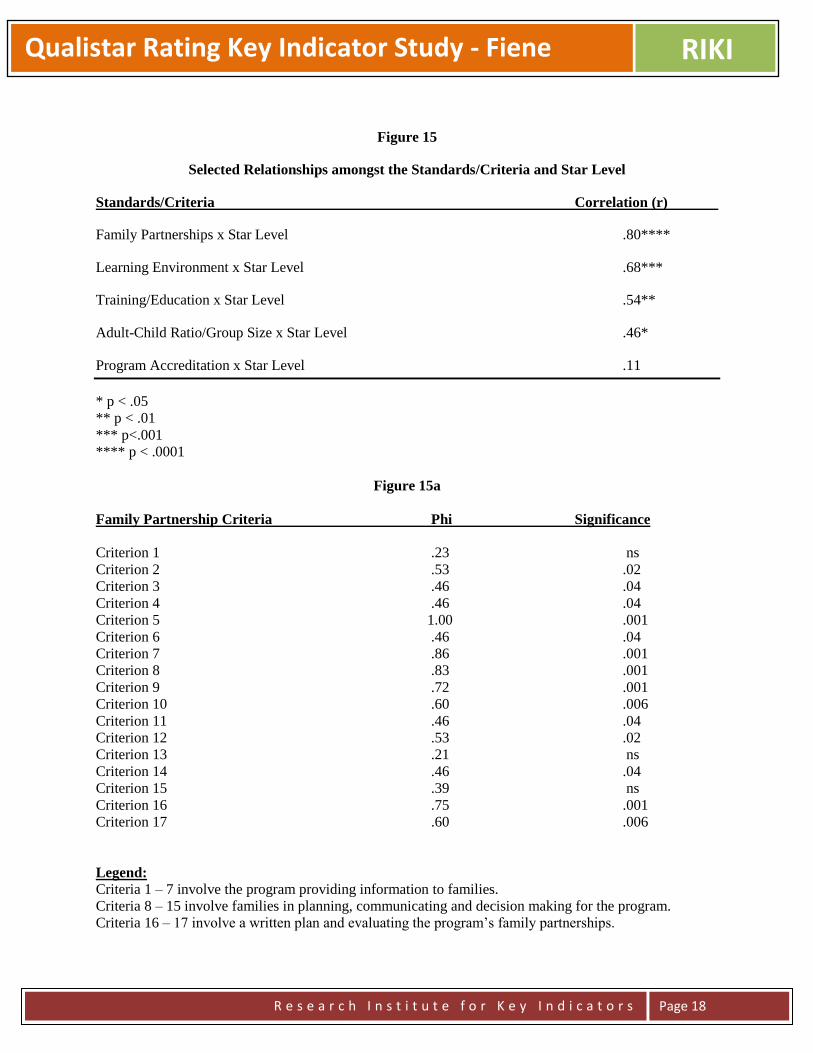
Qualistar Rating Key Indicator Study - Fiene RIKI
R e s e a r c h I n s t i t u t e f o r K e y I n d i c a t o r s
Page 18
Figure 15
Selected Relationships amongst the Standards/Criteria and Star Level
Standards/Criteria Correlation (r)
Family Partnerships x Star Level .80****
Learning Environment x Star Level .68***
Training/Education x Star Level .54**
Adult-Child Ratio/Group Size x Star Level .46*
Program Accreditation x Star Level .11
* p < .05
** p < .01
*** p<.001
**** p < .0001
Figure 15a
Family Partnership Criteria Phi Significance
Criterion 1 .23 ns
Criterion 2 .53 .02
Criterion 3 .46 .04
Criterion 4 .46 .04
Criterion 5 1.00 .001
Criterion 6 .46 .04
Criterion 7 .86 .001
Criterion 8 .83 .001
Criterion 9 .72 .001
Criterion 10 .60 .006
Criterion 11 .46 .04
Criterion 12 .53 .02
Criterion 13 .21 ns
Criterion 14 .46 .04
Criterion 15 .39 ns
Criterion 16 .75 .001
Criterion 17 .60 .006
Legend:
Criteria 1 – 7 involve the program providing information to families.
Criteria 8 – 15 involve families in planning, communicating and decision making for the program.
Criteria 16 – 17 involve a written plan and evaluating the program’s family partnerships.

Qualistar Rating Key Indicator Study - Fiene RIKI
R e s e a r c h I n s t i t u t e f o r K e y I n d i c a t o r s
Page 19
Figure 15b
Adult-Child Ratio/Group Size Phi Significance
Adult-Child Ratios .58 .0001
Group Size .33 .02
______________________________________________________________________
Family Partnerships and Adult-Child Ratio/Group Size standards/criteria phi coefficients were generated
because of the skewed data distributions. Phi coefficients were not generated for Learning Environment,
Training and Education or Program Accreditation because the data were not sufficiently skewed or
showed no variability at all in their respective distributions.
Figure 16
Basic Descriptive Statistics for Criteria
Criteria Mean Median Skewness
Family Partnerships 7.7 10 -1.425
Adult-to-Child Ratios & Group Size 9.1 10 -1.506
Learning Environment 5.8 6 -0.946
Training and Education 4.7 5 0.028
Program Accreditation 0.0 0 7.548
Total Star Level 2.7 3 -1.213
_________________________________________________________________________________

Three Opinions on Early Care Education Public Policy RIKI
R e s e a r c h I n s t i t u t e f o r K e y I n d i c a t o r s
Page 1
An Opinion on Rules/Regulations, Standards, and Guidelines in Early Care and Education
Richard Fiene, Ph.D.
August 2014
Over the past two years there has been a great deal of activity and interest in the Early Care and Education
(ECE) field related to rules/regulations, standards and guidelines. This interest comes at an opportune
time as the ECE field develops a balance between licensing (program compliance), program quality
improvement via QRIS (Quality Rating and Improvement Systems) & Pre-K programs, and structural and
process quality.
Several publications have been put forth that represent these various activities which I would like to
delineate and show how these various approaches fit together into a unified whole. The third edition of
Caring for Our Children is the comprehensive set of standards/guidelines related to health and safety in
the child care field. Its companion document called Stepping Stones is a risk assessment publication
which focuses on those standards/guidelines that place children at greatest risk of mortality/morbidity.
Thirteen Indicators of Quality Child Care: Research Update are the key indicators based upon Stepping
Stones and Caring for Our Children. A relatively new approach Caring for Our Children: Basics is a
combination of Stepping Stones and Thirteen Indicators of Quality Child Care.
I would like to propose the following model in how the above rules/regulations, standards and guidelines
relate to each other and how one builds upon the other:
This is a particularly exciting time in which we have several different tools that can be used to help
improve early care and education programs via the above model for health and safety and then utilizing
QRIS and Pre-K programs standards to build upon this solid licensing foundation.
Caring for Our Children standards/guidelines as the comprehensive set of health and safety
standards/guidelines for the early care and education field. 650 Standards.
Stepping Stones as the risk assessment tool based upon
morbidity/mortality. 138 Standards.
Caring for Our Children: Basics as the risk
assessment/key indicator tool. 55 Standards.
13 Key Indicators.

Three Opinions on Early Care Education Public Policy RIKI
R e s e a r c h I n s t i t u t e f o r K e y I n d i c a t o r s
Page 2
An Opinion on Balancing Structural and Process Quality Indicators in Early
Care and Education
I have been following a very interesting discussion in the early care and education field about quality
indicators and their impact on young children. As QRIS (Quality Rating & Improvement Systems)
systems have been providing the impetus for this discussion, I think it is time to readdress how process
and structural quality indicators both benefit a child’s development, albeit in different domains.
Hopefully this discussion will be one of inclusion rather than exclusion in which we do not place greater
emphasis on process quality indicators at the expense of structural quality indicators which appears to be
at the heart of this most recent discussion.
In the research literature, the focus of structural quality indicators are generally in the health and safety
domain and are more regulatable, such as staff-child ratio, group size, supervision, child immunizations
up to date, proper staff hand washing, etc; while the focus of process quality indicators have been
interactions amongst children and staff which do not lend themselves to being regulatable easily.
As a developmental research psychologist I have been delighted with the increased focus on the process
quality indicators and agree that we need to spend more time focusing our efforts on identifying the key
indicators that make a difference in a child’s developmental life in early care and education. However,
after 40 years of public policy research, I am not willing to throw the structural quality indicators “under
the bus”. It is important to advocate for those process quality indicators that have an impact on a child’s
language, social-emotional, motor, and cognitive development but we cannot leave out the child’s
physical well-being and healthy development. My concern as I listen to my fellow researchers, policy
makers, and legislative staff as I crisscross the country is that everyone is talking a lot about the process
quality indicators with little regard to the continued importance of the structural quality indicators.
I have lectured on this topic more than I would like to admit over the past 5 years. I was hoping by now
that the “either-or” discussion would have given way to an “and” discussion which accepts and embraces
the contributions of both structural and process quality indicators to a child’s development. As of this
writing, I haven’t seen a change and in fact I think the discussions are becoming more divisive rather than
inclusionary. So for that reason I am putting on paper my above opinion about this discussion and the
need for additional research to build more effective and efficient early care and education regulatory
systems that have a balance between structural and process quality indicators.
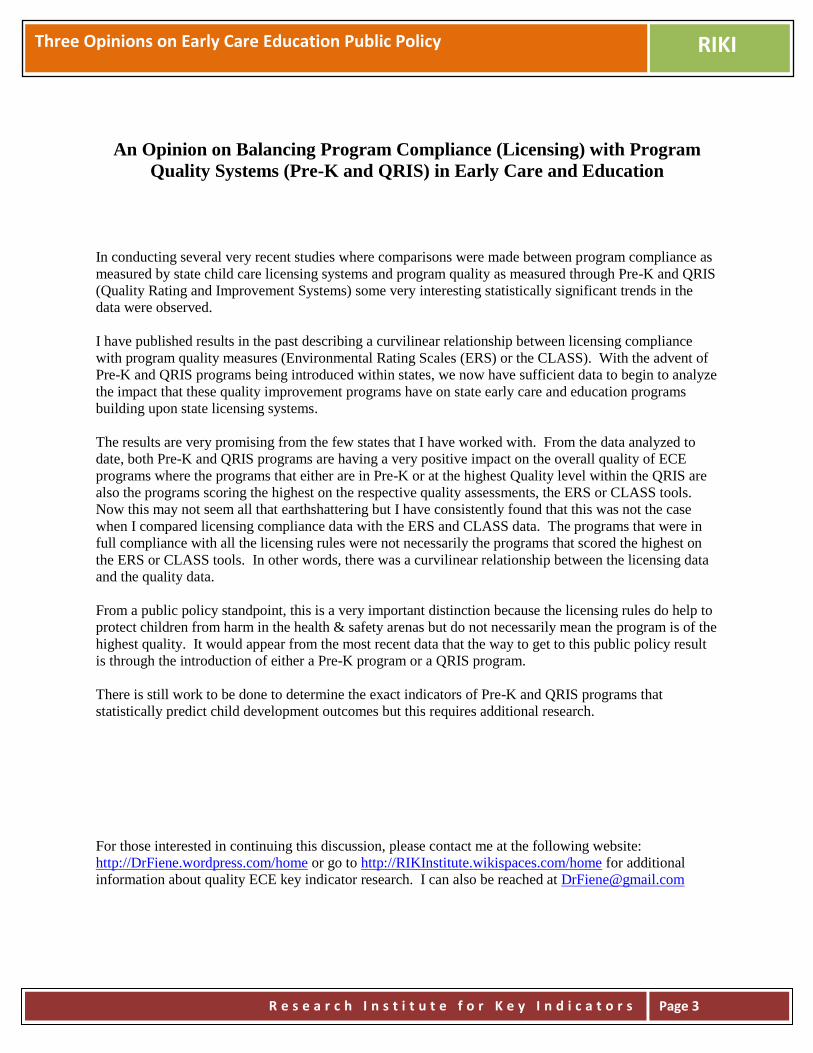
Three Opinions on Early Care Education Public Policy RIKI
R e s e a r c h I n s t i t u t e f o r K e y I n d i c a t o r s
Page 3
An Opinion on Balancing Program Compliance (Licensing) with Program
Quality Systems (Pre-K and QRIS) in Early Care and Education
In conducting several very recent studies where comparisons were made between program compliance as
measured by state child care licensing systems and program quality as measured through Pre-K and QRIS
(Quality Rating and Improvement Systems) some very interesting statistically significant trends in the
data were observed.
I have published results in the past describing a curvilinear relationship between licensing compliance
with program quality measures (Environmental Rating Scales (ERS) or the CLASS). With the advent of
Pre-K and QRIS programs being introduced within states, we now have sufficient data to begin to analyze
the impact that these quality improvement programs have on state early care and education programs
building upon state licensing systems.
The results are very promising from the few states that I have worked with. From the data analyzed to
date, both Pre-K and QRIS programs are having a very positive impact on the overall quality of ECE
programs where the programs that either are in Pre-K or at the highest Quality level within the QRIS are
also the programs scoring the highest on the respective quality assessments, the ERS or CLASS tools.
Now this may not seem all that earthshattering but I have consistently found that this was not the case
when I compared licensing compliance data with the ERS and CLASS data. The programs that were in
full compliance with all the licensing rules were not necessarily the programs that scored the highest on
the ERS or CLASS tools. In other words, there was a curvilinear relationship between the licensing data
and the quality data.
From a public policy standpoint, this is a very important distinction because the licensing rules do help to
protect children from harm in the health & safety arenas but do not necessarily mean the program is of the
highest quality. It would appear from the most recent data that the way to get to this public policy result
is through the introduction of either a Pre-K program or a QRIS program.
There is still work to be done to determine the exact indicators of Pre-K and QRIS programs that
statistically predict child development outcomes but this requires additional research.
For those interested in continuing this discussion, please contact me at the following website:
http://DrFiene.wordpress.com/home or go to http://RIKInstitute.wikispaces.com/home for additional
information about quality ECE key indicator research. I can also be reached at [email protected]
NARA Illinois Key Indicator Report - Fiene RIKI
R e s e a r c h I n s t i t u t e f o r K e y I n d i c a t o r s
Page 1
NARA Illinois Key Indicator Report for Centers, Group Homes, and Family
Homes
Richard Fiene, Ph.D.
May 30, 2014
ABSTRACT
This report will provide an analysis of Illinois Rules for child care centers, group homes, and family
homes for generating key indicators. There is a brief introduction regarding differential monitoring and
key indicators followed by the generated key indicators.
INTRODUCTION
The key indicator methodology is part of a program monitoring approach called Differential
Program Monitoring which was developed to help streamline the program monitoring of early
care and education programs (please see the appendix for two graphics which help to depict this
relationship). It was first applied in child care licensing but has been used in many other service
types, such as: Head Start Performance Standards, National Accreditation, and child and adult
residential programs. The methodologies are based upon statistical protocols that have been
developed in the tests and measurements literature in which an abbreviated set of items is used to
statistically predict as if the full test was applied. This methodology has been used in regulatory
analysis and is now being proposed for use in Quality Rating and Improvement Systems (QRIS).
TECHNICAL ASPECTS OF THE KEY INDICATOR METHODOLOGY
This section provides the technical and statistical aspects of the key indicator methodology. One
of the first steps is to sort the data into high and low groups, generally the highest and lowest
ratings can be used for this sorting. In very large states this is done on a sampling basis which

NARA Illinois Key Indicator Report - Fiene RIKI
R e s e a r c h I n s t i t u t e f o r K e y I n d i c a t o r s
Page 2
will be described later in the blueprint. Frequency data will be obtained on those programs in the
top level (usually top 20-25%) and the bottom level (usually the bottom 20-25%). The middle
levels are not used for the purposes of these analyses. These two groups (top level & the bottom
level) are then compared to how each program scored on each item within the specific
assessment tool (see Figure 1).
Figure 1 Providers In
Compliance
or Top 25%
Programs Out
Of Compliance
or Bottom 25%
Row Total
Highest level
(top 20-25%)
A B Y
Lowest level
(bottom 20-25%)
C D Z
Column Total W X Grand Total
Once the data are sorted in the above matrix, the following formula (Figure 2) is used to
determine if the standard is a key indicator or not by calculating its respective Phi coefficient.
Please refer back to Figure 1 for the actual placement within the cells. The legend (Figure 3)
below the formula shows how the cells are defined.
Figure 2 – Formula for Phi Coefficient
Figure 3 – Legend for the Cells within the Phi Coefficient
A = High Group + Programs in Compliance on Specific Compliance Measure. B = High Group + Programs out of Compliance on Specific Compliance Measure. C = Low Group + Programs in Compliance on Specific Compliance Measure. D = Low Group + Programs out of Compliance on Specific Compliance Measure. W = Total Number of Programs in Compliance on Specific Compliance Measure. X = Total Number of Programs out of Compliance on Specific Compliance Measure. Y = Total Number of Programs in High Group. Z = Total Number of Programs in Low Group.

NARA Illinois Key Indicator Report - Fiene RIKI
R e s e a r c h I n s t i t u t e f o r K e y I n d i c a t o r s
Page 3
Once the data are run through the formula in Figure 2, the following chart (Figure 4) can be used
to make the final determination of including or not including the item as a key indicator. Based
upon the chart in Figure 4, it is best to have a Phi Coefficient approaching +1.00 however that is
rarely attained with licensing data but has occurred in more normally distributed data.
Continuing with the chart in Figure 5, if the Phi Coefficient is between +.25 and -.25, this
indicates that the indicator is unpredictable in being able to predict overall compliance with the
quality rating assessment tool. Either a false positive in which the indicator appears too often in
the low group as being in compliance, or a false negative in which the indicator appears too often
in the high group as being out of compliance. This can occur with Phi Coefficients above +.25
but it becomes unlikely as we approach +1.00 although there is always the possibility that other
standards/rules/regulations could be found out of compliance (this was demonstrated in a study
conducted by the author. Another solution is to increase the number of key indicators to be
reviewed but this will cut down on the efficiency which is desirable and the purpose of the key
indicators.
The last possible outcome with the Phi Coefficient is if it is between -.26 and -1.00, this indicates
that the indicator is a terrible predictor because it is doing just the opposite of the decision we
want to make. The indicator would predominantly be in compliance with the low group rather
than the high group so it would be statistically predicting overall non-compliance. This is
obviously something we do not want to occur.
Figure 4 – Thresholds for the Phi Coefficient
Phi Coefficient Range Characteristic of Indicator Decision
(+1.00) – (+.26) Good Predictor Include
(+.25) – (-.25) Unpredictable Do not Include
(-.26) – (-1.00) Terrible Predictor Do not Include
NARA Illinois Key Indicator Report - Fiene RIKI
R e s e a r c h I n s t i t u t e f o r K e y I n d i c a t o r s
Page 4
RESULTS
Key indicators for child care homes (Please see the Appendix - Figure 7 for Phi
Coefficients):
Section 406.8 General Requirements for Day Care Homes
a) The physical facilities of the home, both indoors and outdoors, shall meet the following requirements for safety
to children.
1) The home shall have a first aid kit consisting of adhesive bandages, scissors, thermometer, non-permeable
gloves, Poison Control Center telephone number (1-800-222-1222 or 1-800-942-5969), sterile gauze pads, adhesive
tape, tweezers and mild soap.
18) There shall be written plans for fire and tornado emergencies. Caregivers and assistants in the home shall be
familiar with these plans.
A) The fire evacuation plan shall identify the exits from each area used for child care and shall specify the
evacuation route.
B) The fire evacuation plan shall identify a safe assembly area outside of the home. It shall also identify a near-by
indoor location for post-evacuation holding if needed.
C) The fire evacuation plan shall require that the home be evacuated before calling the local emergency number
911.
D) The written tornado plan shall specify what actions will be taken in the event of tornado or other severe weather
warning, including designation of those areas of the home to be used as the safe spots.
23) The licensee shall inspect the home daily, prior to arrival of children, ensuring that escape routes are clear
and that exit doors and exit windows are operable. A log of these daily inspections shall be maintained for at least
one year, and shall be available for review. The log shall reflect, at minimum, the date and time of each inspection
and the full name of the person who conducted it.
24) The licensee shall hold monthly fire inspections of the day care home.
Section 406.9 Characteristics and Qualifications of the Day Care Family
a) No individual may receive a license from the Department when the applicant, a member of the household age 13
and over, or any individual who has access to the children cared for in a day care home, or any employee of the day
care home, has not authorized the background check required by 89 Ill. Adm. Code 385 (Background Checks) and
been cleared in accordance with the requirements of Part 385.
t) The caregivers shall complete 15 clock hours of in-service training per licensing year in accordance with the
requirements in Appendix D of the rules.
1) Such training may be derived from programs offered by any of the entities identified in Appendix D of the rules.
2) Courses or workshops to meet this requirement include, but are not limited to, those listed in Appendix D of the
rules.
3) The records of the day care home shall document the training in which the caregiver has participated, and these
records shall be available for review by the Department.
4) Caregivers obtaining clock hours in excess of the required 15 clock hours per year may apply up to 5 clock hours
to the next year's training requirements.
Section 406.12 Admission and Discharge Procedures
b) Prior to acceptance of a child for care,
3) The caregiver shall require that the parent or guardian provide a certified copy of the child’s birth certificate. The
caregiver:
NARA Illinois Key Indicator Report - Fiene RIKI
R e s e a r c h I n s t i t u t e f o r K e y I n d i c a t o r s
Page 5
A) Shall provide a written notice to the parent or guardian of a child to be enrolled for the first time that within 30
days after enrollment the parent or guardian shall provide a certified copy of the child’s birth certificate or other
reliable proof of identity and age of the child.
i) The caregiver shall promptly make a copy of the certified copy and return the original certified copy to the parent
or guardian.
ii) If a certified copy of the birth certificate is not available, the parent or guardian must submit a passport, visa or
other governmental documentation as proof of the child’s identity and age and an affidavit or notarized letter
explaining the inability to produce a certified copy of the birth certificate [325 ILCS 50/5] .
iii) The notice to parent or guardian shall also indicate that the caregiver is required by law to notify the Illinois
State Police or local law enforcement agency if the parent or guardian fails to submit proof of the child’s identity
within the 30 day time frame;
h) All day care homes shall have a written policy that explains the actions the provider will take if a parent or
guardian does not retrieve, or arrange to have someone retrieve, his or her child at the designated, agreed upon time.
The policy shall consist of the provider’s expectations, clearly presented to the parent or guardian, in the form of a
written agreement that shall be signed by the parent or guardian, and shall include at least the following elements:
The consequences of not picking up the child on time, including:
Amount of late fee, if any, and when those fees begin to accrue;
The degree of diligence the provider will use to reach emergency contacts, e.g., number of attempted phone calls to
parents and emergency contacts, requests for police assistance in finding emergency contacts; and
Length of time the facility will keep the child beyond the pick-up time before contacting outside authorities, such as
the child abuse hotline or police.
Emphasis on the importance of having up-to-date emergency contact numbers on file.
Acknowledgement of the provider’s responsibility for the child’s protection and well-being until the parent or
outside authorities arrive.
A reminder to the day care provider that the child is not responsible for the situation. All discussions regarding these
situations shall be with the parent or guardian, never the child.
Section 406.14 Health, Medical Care and Safety
c) A medical report, on forms prescribed by the Department, shall be on file for each child, on the first day of care,
and shall be dated no earlier than 6 months prior to enrollment.
1) The medical report shall be valid for 2 years, except that subsequent examinations for school-age children shall
be in accordance with the requirements of Section 27.8-1 of the School Code [105 ILCS 5/27-8.1], provided copies
of the exam are on file at the facility.
2) If the child is in a high risk group, as determined by the examining physician, a tuberculin skin test by the
Mantoux method and the results of that test shall be included in the initial examination for all children who have
attained one year of age, or at the age of one year for children who are enrolled before their first birthday. The
tuberculin skin test by the Mantoux method shall be repeated when the children in high-risk groups begin
elementary and secondary school.
3) The initial examination shall show that children from 6 months through 6 years of age have been screened for
lead poisoning for children residing in an area defined as high risk by the Illinois Department of Public Health in its
Lead Poisoning Prevention Code (77 Ill. Adm. Code 845) or that a lead risk assessment has been completed for
children residing in an area defined as low risk by the Illinois Department of Public Health.
4) The report shall indicate that the child has been immunized as required by the rules of the Illinois Department of
Public Health for immunizations (77 Ill. Adm. Code 695). These required immunizations are poliomyelitis,
measles, rubella, diphtheria, mumps, pertussis, tetanus, hepatitis B, haemophilus influenza B, and varicella
(chickenpox) or provide proof of immunity according to requirements in Part 695.50 of the Department of Public
Health.
NARA Illinois Key Indicator Report - Fiene RIKI
R e s e a r c h I n s t i t u t e f o r K e y I n d i c a t o r s
Page 6
Key indicators for Group Child Care Homes (Please see the Appendix - Figure 7 for Phi
Coefficients):
Section 408.35 General Requirements for Group Day Care Home Family
f) The caregivers and all members of the household shall provide medical evidence that they are free of
communicable disease that may be transmitted while providing child care; and, in the case of caregivers, that they
are free of physical or mental conditions that could interfere with child care responsibilities. The medical report for
the caregivers shall be valid for 3 years.
Section 408.45 Caregivers
f) The caregivers shall complete 15 clock hours of in-service training per licensing year in accordance with the
requirements in Appendix G of the rules.
1) Such training may be derived from programs offered by any of the entities identified in Appendix G of the rules.
2) Courses or workshops to meet this requirement include, but are not limited to, those listed in Appendix G of the
rules.
Section 408.60 Admission and Discharge Procedures
j) All group day care homes shall have a written policy that explains the actions the provider will take if a parent or
guardian does not retrieve, or arrange to have someone retrieve, his or her child at the designated, agreed upon time.
The policy shall consist of the provider's expectations, clearly presented to the parent or guardian in the form of a
written agreement that shall be signed by the parent or guardian, and shall include at least the following elements:
1) The consequences of not picking up the children on time, including:
A) Amount of late fee, if any, and when those fees begin to accrue;
B) The degree of diligence the provider will use to reach emergency contacts, e.g., number of attempted phone calls
to parents and emergency contacts, requests for police assistance in finding emergency contacts; and
C) Length of time the facility will keep the child beyond the pick-up time before contacting outside authorities,
such as the child abuse hotline or police.
2) Emphasis on the importance of having up-to-date emergency contact numbers on file.
3) Acknowledgement of the provider's responsibility for the child's protection and well-being until the parent or
outside authorities arrive.
4) A reminder to staff that the child is not responsible for the situation. All discussions regarding these situations
shall be with the parent or guardian, never with the child.
Section 408.70 Health, Medical Care and Safety
a) A medical report, on forms prescribed by the Department, shall be on file for each child, on the first day of care,
and shall be dated no earlier than 6 months prior to enrollment.
1) The medical report shall be valid for 2 years, except that subsequent examinations for school-age children shall
be in accordance with the requirements of Section 27-8.1 of the School Code [105 ILCS 5/27-8.1], provided copies
of the exam are on file at the facility.
2) If the child is in a high risk group, as determined by the examining physician , a tuberculin skin test by the
Mantoux method and the results of that test shall be included in the initial examination for all children who have
attained one year of age, or at the age of one year for children who are enrolled before their first birthday. The
tuberculin skin test by the Mantoux method shall be repeated when children in high risk groups begin elementary
and secondary school.
3) The initial examination shall show that children from 6 months through 6 years of age have been screened for
lead poisoning for children residing in an area defined as high risk by the Illinois Department of Public Health in its
Lead Poisoning Prevention Code (77 Ill. Adm. Code 845) or that a lead risk assessment has been completed for
children residing in an area defined as low risk by the Illinois Department of Public Health.
4) The report shall indicate that the child has been immunized as required by the rules of the Illinois Department of
Public Health for immunizations (77 Ill. Adm. Code 695). These required immunizations are poliomyelitis,
measles, rubella, diphtheria, mumps, pertussis, tetanus, hepatitis B, haemophilus influenza B, and varicella
(chickenpox) or provide proof of immunity according to requirements in Part 695.50 of the Department of Public
Health.

NARA Illinois Key Indicator Report - Fiene RIKI
R e s e a r c h I n s t i t u t e f o r K e y I n d i c a t o r s
Page 7
Section 408.120 Records and Reports a) A facility shall maintain a record file on the children enrolled.
1) A written application for admission of each child shall be on file with the signature of the parent or guardian.

NARA Illinois Key Indicator Report - Fiene RIKI
R e s e a r c h I n s t i t u t e f o r K e y I n d i c a t o r s
Page 8
Key indicators for Child Care Centers (Please see the Appendix-Figure 7 for Phi Coefficients):
Section 407.100 General Requirements for Personnel
f) Staff shall have physical re-examinations every two years and whenever communicable disease or illness is
suspected.
Section 407.120 Personnel Records
a) A confidential file shall be maintained on each staff person and contain at least the following information:
1) A copy of a form prescribed by the Department which contains information on persons employed in the day care
center;
3) Three written character references, verified by the day care center;
4) Proof of educational achievement as required for the individual's position. Foreign credentials require additional
documentation providing a statement of the equivalency in the U.S. educational system;
Section 407.250 Enrollment and Discharge Procedures
d) The facility shall distribute a summary of the licensing standards, provided by the Department, to the parents or
guardian of each child at the time that the child is accepted for care in the facility. In addition, consumer information
materials provided by the Department including, but not limited to, information on reporting and prevention of child
abuse and neglect and preventing and reporting communicable disease shall be distributed to the parents or guardian
or each child cared for when designated for such distribution by the Department.
Section 407.260 Daily Arrival and Departure of Children
f) All day care centers shall have a written policy that explains to parents and staff the actions the center will take if
a parent or guardian does not pick up, or arrange to have someone pick up, his or her child at the designated, agreed
upon time. The policy shall consist of the provider's expectations clearly presented to the parent or guardian in the
form of a written agreement that shall be signed by the parent or guardian and shall include at least the following
elements:
1) The consequences of not picking up children on time shall be precisely communicated to parents, for example:
A) Amount of late fee, if any, and when those fees begin to accrue.
B) The degree of diligence the provider will use to reach emergency contacts, e.g., number of attempted phone calls
to parents and emergency contacts, requests for police assistance in finding emergency contacts, and so forth.
C) Length of time the facility will keep the child beyond the pick-up time before contacting outside authorities,
such as, the child abuse hotline, police, and so forth.
2) Emphasis on the importance of having up-to-date emergency contact numbers on file.
3) Acknowledgement of the provider’s responsibility for the child’s protection and well-being until the parent or
outside authorities arrive.
4) A policy that staff shall not hold the child responsible for the situation and that discussion of this issue will only
be with the parent or guardian and never with the child.
Section 407.270 Guidance and Discipline
a) The day care center shall develop a guidance and discipline policy for staff use that is also provided to parents.
Staff shall sign the guidance and discipline policy at the time of employment and parents shall sign the policy when
their child is enrolled. The policy shall include:
1) A statement of the center's philosophy regarding guidance and discipline;
2) Information on how discipline will be implemented by staff;
3) Information on how parents will be involved in the guidance and discipline process;
4) Information on how children will be involved in the guidance and discipline process; and
5) Written procedures for termination of a child's enrollment in the day care center because of disciplinary issues.
Section 407.310 Health Requirements for Children
a) A medical report on forms prescribed by the Department shall be on file for each child.
1) The initial medical report shall be dated less than 6 months prior to enrollment of infants, toddlers and preschool
children. For school-age children, a copy of the most recent regularly scheduled school physical may be submitted
NARA Illinois Key Indicator Report - Fiene RIKI
R e s e a r c h I n s t i t u t e f o r K e y I n d i c a t o r s
Page 9
(even if more than 6 months old) or the day care center may require a more recent medical report by its own
enrollment policy. If a health problem is suspected, the day care center may require additional documentation of the
child's health status.
Section 407.380 Equipment and Materials
b) Such equipment and materials for infants, toddlers and pre-school children shall be provided in the quantity and
variety specified in Appendix A: Equipment for Infants and Toddlers, Appendix B: Equipment for Preschool
Children and Appendix C: Equipment for School-Age Children of the Rules.

NARA Illinois Key Indicator Report - Fiene RIKI
R e s e a r c h I n s t i t u t e f o r K e y I n d i c a t o r s
Page 10
For additional information regarding this Report, please contact:
Richard Fiene, Ph.D., Director/President
Research Institute for Key Indicators (RIKI)
41 Grandview Drive
Middletown, PA. 17057
717-944-5868 Phone and Fax
http://RIKInstitute.wikispaces.com

NARA Illinois Key Indicator Report - Fiene RIKI
R e s e a r c h I n s t i t u t e f o r K e y I n d i c a t o r s
Page 11
Appendix – Figure 5
DIFFERENTIAL MONITORING LOGIC MODEL & ALGORITHM (DMLMA©) (Fiene, 2012): A 4th
Generation ECPQIM – Early Childhood Program Quality Indicator Model
CI x PQ => RA + KI => DM + PD => CO
Definitions of Key Elements:
PC = Program Compliance/Licensing (Health and Safety) (Caring for Our Children) PQ = QRIS/Accreditation/Caregiver/Child Interactions/Classroom Environment Quality (ERS/CLASS/PAS/BAS) RA = Risk Assessment, (High Risk Rules) (Stepping Stones) KI = Key Indicators (Predictor Rules) (13 Key Indicators of Quality Child Care) DM = Differential Monitoring (How often to visit and what to review) PD = Professional Development/Technical Assistance/Training (Not pictured but part of Model) CO = Child Outcomes (Not pictured but part of Model)
Comprehensive
Licensing Tool (CI)
Structural Quality
Program Quality
Tool (PQ) - QRIS
Process Quality
Risk Assessment
Tool (RA)
Key Indicator
Tool (KI)
Differential
Monitoring (DM)

NARA Illinois Key Indicator Report - Fiene RIKI
R e s e a r c h I n s t i t u t e f o r K e y I n d i c a t o r s
Page 12
Appendix – Figure 6 - Licensing Rules, Compliance Reviews, Differential Monitoring, Abbreviated Tools,
Risk Assessment, and Key Indicators
All Licensing Rules – Full
Compliance Reviews
Differential Monitoring
How Often to Visit? What is Reviewed?
Frequency Abbreviated
Tool
More
Often
Less
Often
Risk
Assessment
Weights
Key
Indicators
Predictors
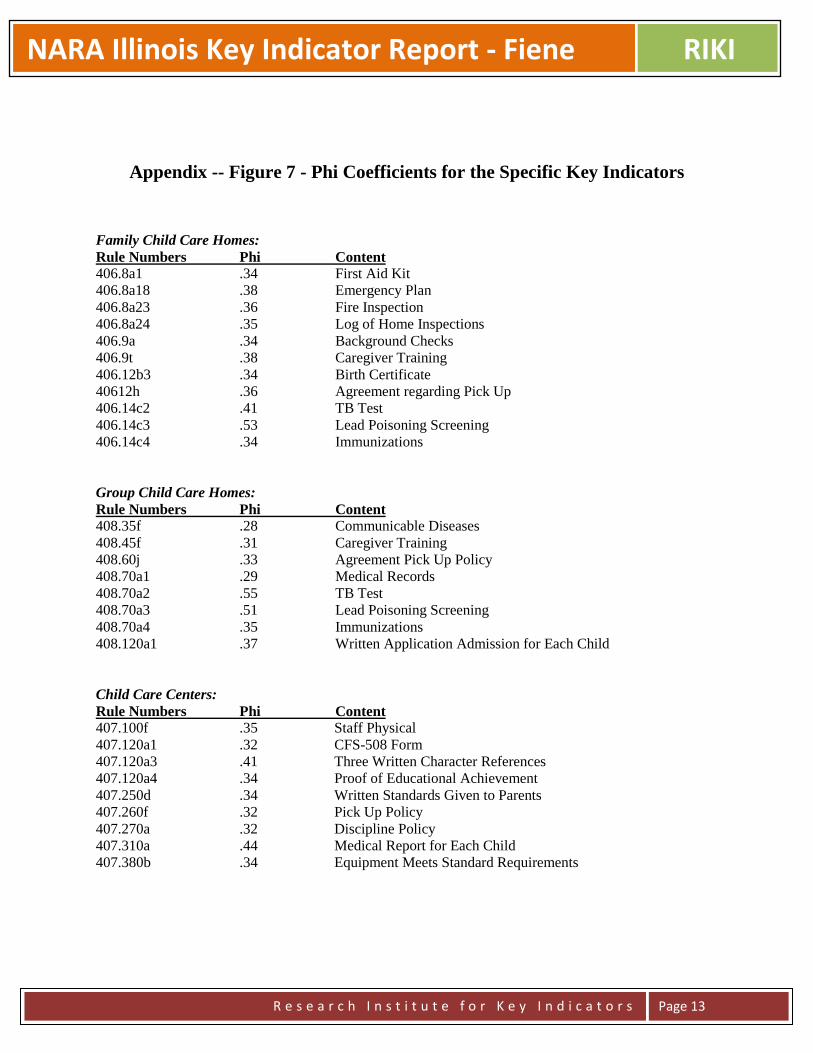
NARA Illinois Key Indicator Report - Fiene RIKI
R e s e a r c h I n s t i t u t e f o r K e y I n d i c a t o r s
Page 13
Appendix -- Figure 7 - Phi Coefficients for the Specific Key Indicators
Family Child Care Homes:
Rule Numbers Phi Content
406.8a1 .34 First Aid Kit
406.8a18 .38 Emergency Plan
406.8a23 .36 Fire Inspection
406.8a24 .35 Log of Home Inspections
406.9a .34 Background Checks
406.9t .38 Caregiver Training
406.12b3 .34 Birth Certificate
40612h .36 Agreement regarding Pick Up
406.14c2 .41 TB Test
406.14c3 .53 Lead Poisoning Screening
406.14c4 .34 Immunizations
Group Child Care Homes:
Rule Numbers Phi Content
408.35f .28 Communicable Diseases
408.45f .31 Caregiver Training
408.60j .33 Agreement Pick Up Policy
408.70a1 .29 Medical Records
408.70a2 .55 TB Test
408.70a3 .51 Lead Poisoning Screening
408.70a4 .35 Immunizations
408.120a1 .37 Written Application Admission for Each Child
Child Care Centers:
Rule Numbers Phi Content 407.100f .35 Staff Physical
407.120a1 .32 CFS-508 Form
407.120a3 .41 Three Written Character References
407.120a4 .34 Proof of Educational Achievement
407.250d .34 Written Standards Given to Parents
407.260f .32 Pick Up Policy
407.270a .32 Discipline Policy
407.310a .44 Medical Report for Each Child
407.380b .34 Equipment Meets Standard Requirements
Georgia Child Care Licensing Validation Study RIKI
R e s e a r c h I n s t i t u t e f o r K e y I n d i c a t o r s
Page 1
Georgia Child Care Licensing Study: Validating the Core Rule Differential
Monitoring System
Executive Summary
Richard Fiene, Ph.D.
The purpose of this study was to validate Georgia’s process for determining if a state-regulated
child care facility is compliant with basic state health and safety requirements. The process was
developed by staff at Bright from the Start: Georgia Department of Early Care and Learning
(DECAL). Currently Georgia utilizes a “Core Rule” risk assessment approach in which the
health and safety rules deemed most crucial to ensure children’s health and safety are used to
compute a program’s compliance status.
This validation study utilized a unique analytical model that compared licensing data with
previous key indicator (for readers not familiar with this term, please see the definitions on page
4 of the report) research and ascertained if the Core Rules accurately indicated a program’s
overall compliance with the total population of licensing rules.
Additional statistical analyses examined if the mathematical formula used to compute
compliance was an appropriate configuration of the data that discerned between those programs
that adequately met basic health and safety rules (compliant) and those that did not (non-
compliant). Also licensing data were compared to a representative sample of quality data
collected as part of a different study to examine the correlation between compliance and quality.
A Differential Monitoring Logic Model/Algorithm (DMLMA©) (Fiene, 2012) and a previous
validation framework (Zellman & Fiene, 2012) were used in the research.
One hundred and four child care centers (104 CCC) and 147 family child care (FCC) homes
were assessed. Licensing data over a four-year period (2008-2012) and matching program
quality data from a two-year period (2007-2008) were used in this study.
The study focused on three research questions:
1. Do the Core Rules CCCs and FCC homes serve as overall Key Indicators of compliance?
2. Does the Annual Compliance Determination Worksheet (ACDW) appropriately designate
programs as compliant or non-compliant related to health and safety?
3. Are the Core Rules related to program quality?
The analysis demonstrated that the Core Rules did serve as key indicators, and these key
indicators were identified for both center based and home based child care. The second analysis
concluded that the ACDW computation did distinguish between compliant and non-compliant
programs. Finally, the expected correlation between compliance and quality was found but only
for state-funded Pre-K classrooms, not for family child care nor for preschool classrooms that
were not part of the state-funded Pre-K.
Georgia Child Care Licensing Validation Study RIKI
R e s e a r c h I n s t i t u t e f o r K e y I n d i c a t o r s
Page 2
Georgia Child Care Licensing Study: Validating the Core Rule Differential
Monitoring System
Richard Fiene, Ph.D.
February 1, 2014
This study was made possible by a grant from Bright from the Start: Georgia Department of Early Care and
Learning. All opinions expressed in the report reflect the opinions of the author, not necessarily those of the
Department of Early Care and Learning.
ABSTRACT
The purpose of this study was to validate Georgia’s process for determining if a state-regulated child care facility is
compliant with basic state health and safety requirements. The process was developed by staff at Bright from the
Start: Georgia Department of Early Care and Learning (DECAL). Currently Georgia utilizes a “Core Rule” risk
assessment approach in which the health and safety rules deemed most crucial to ensure children’s health and safety
are used to compute a program’s compliance status. This validation study utilized a unique analytical model that
compared licensing data with previous key indicator (for readers not familiar with this term, please see the
definitions on page 4 of the report) research and ascertained if the Core Rules accurately indicated a program’s
overall compliance with the total population of licensing rules. Additional statistical analyses examined if the
mathematical formula used to compute compliance was an appropriate configuration of the data that discerned
between those programs that adequately met basic health and safety rules (compliant) and those that did not (non-
compliant). Also licensing data were compared to a representative sample of quality data collected as part of a
different study to examine the correlation between compliance and quality. A Differential Monitoring Logic
Model/Algorithm (DMLMA©) (Fiene, 2012) and a previous validation framework (Zellman & Fiene, 2012) were
used in the research. Child care centers (CCC) and family child care (FCC) homes were assessed. The analysis
demonstrated that the Core Rules did serve as key indicators, though this list should be reexamined. The second
analysis concluded that the computation could be simplified. Finally, the expected correlation between compliance
and quality was found but only in state-funded Pre-K classrooms; it was not found in preschool classrooms and
could not be validated. Family child care could not be validated either. As a result of the study, recommendations
were made to strengthen Georgia’s child care licensing system.
Acknowledgements:
Special thanks are extended to DECAL staff who had the vision to conduct this validation study: Bobby Cagle,
Commissioner; Kay Hellwig, Assistant Commissioner for Child Care Services; Kristie Lewis, Director of Child
Care Services; and Dr. Bentley Ponder, Director of Research & Evaluation. Also, researchers at the University of
North Carolina, Chapel Hill, Frank Porter Graham Child Development Institute , Dr. Donna Bryant and Dr. Kelly
Maxwell who made this study so much more significant by sharing program quality data from earlier studies they
completed in Georgia.
Georgia Child Care Licensing Validation Study RIKI
R e s e a r c h I n s t i t u t e f o r K e y I n d i c a t o r s
Page 3
INTRODUCTION
Background of Georgia’s Compliance Determination System
Similar to other states, Georgia has a licensing and monitoring system that oversees a diverse population of early
care and learning programs across the state. The licensing and monitoring system of early care and learning
programs is charged to Bright from the Start: Georgia Department of Early Care and Learning (DECAL), a state
early education department that also oversees and administers Georgia’s Pre-K Program, Child Care and
Development Block Grant, the Child and Adult Care Food Program, and the Summer Food Service Program. In
2012, DECAL’s licensing and monitoring system regulated approximately 6,300 early care and learning programs.
The crux of this regulation is determining if the programs meet Georgia’s health and safety rules. Programs that
meet these rules are determined to be compliant.
In the mid 2000’s, Georgia began experimenting with a process that determined whether or not a program was
designated as compliant with the state’s health and safety regulations by focusing on key Core Rules. These are
health and safety rules deemed crucial to minimizing risk related to children’s health and safety. Seventy-four rules
out of the 456 that programs must follow were classified as Core Rules1. Core Rules are cited by severity (low,
medium, high, extreme). It is important to note that this entails a risk assessment theoretical approach rather than a
Key Indicator statistical approach. This means that the Core Rules were determined by content analysis rather than
by a statistical procedure.
Though this system has undergone some slight revisions, this basic methodology is still in place:
1. All programs receive at least one full licensing study and one monitoring visit. At the licensing study all
applicable rules are examined. At the monitoring visit, only Core Rules (or any rule that was not met at the
licensing study) are examined.
2. If additional visits are conducted, the Core Rules are examined again at that time.
3. At the end of the fiscal year (June 30), each program receives a compliance determination. This
determination is based on all visits (licensing study, monitoring visit, and other reviews). A standardized
worksheet, Annual Compliance Determination Worksheet (ACDW), is used to make the computation that
determines the designation.
4. The compliance status remains until the next determination one year later. Programs do not have an
opportunity to contest the compliance determination, though programs have numerous opportunities to
contest any citation.
5. At the conclusion of Fiscal Year 2012, approximately 91% of the programs were classified as compliant. A
program’s eligibility for certain services, acceptance into Quality Rated and Georgia’s Pre-K Program, is
impacted by the program’s compliance determination.
Background of this Study
Since the compliance determination system has been used for several years, key policymakers at DECAL requested
an external review to validate if the system was operating as intended. Are the Core Rules a sufficient subsample to
measure a program’s overall regulation with the state’s health and safety regulations? Furthermore, does the
compliance determination formula appropriately differentiate compliant programs from non-compliant programs? In
other words, is the computation a viable way to make this designation? And finally, does compliance determination
serve as a sufficient indicator for other aspects of quality not addressed in Georgia’s health and safety rules?
The purpose of this study was to validate the aforementioned compliance determination process. This validation
process utilized a unique analytical model that compared licensing data with previous key indicator research and
ascertained if the Core Rules are an indication of a program’s overall compliance with the total population of
licensing rules. Second, additional statistical analyses examined if the mathematical formula used to compute
compliance was an appropriate configuration of the data that differentiated between those programs that adequately
met basic health and safety rules (compliant) and those that did not (non-compliant). Finally, licensing data were
1 The number of Core Rules was expanded in 2012 to include increased enforcement and sanctions regarding transportation. The new Core Rules were not part of this analysis.
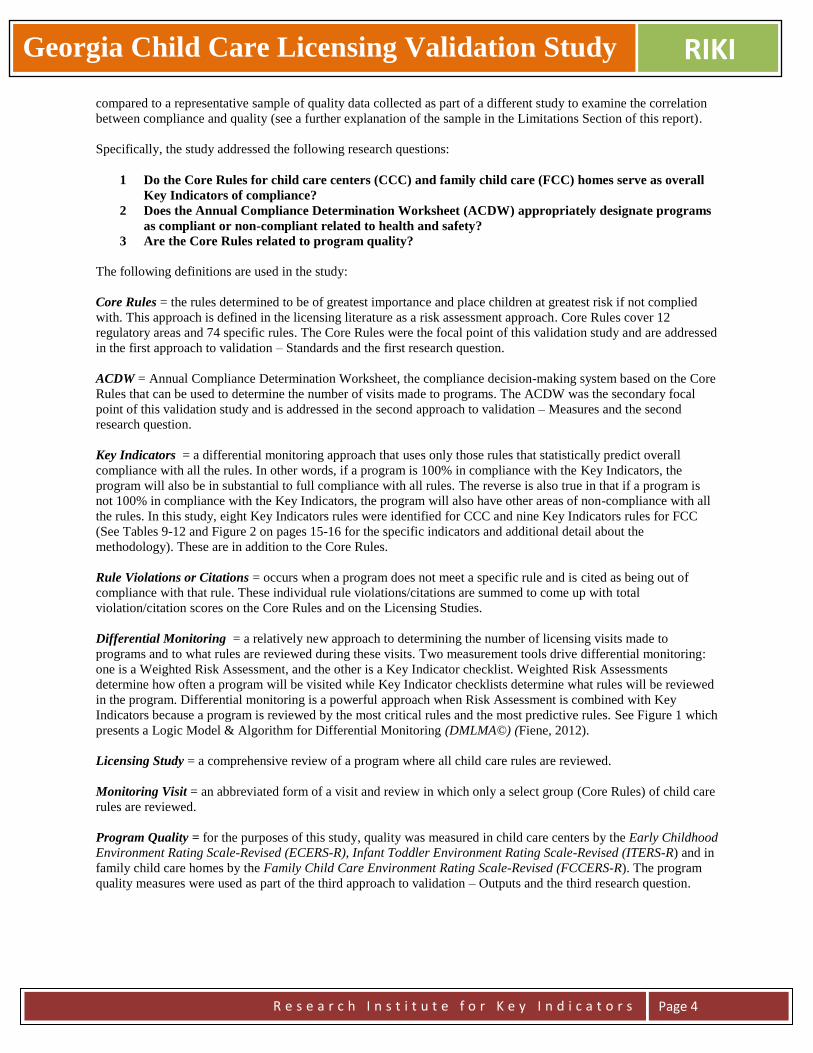
Georgia Child Care Licensing Validation Study RIKI
R e s e a r c h I n s t i t u t e f o r K e y I n d i c a t o r s
Page 4
compared to a representative sample of quality data collected as part of a different study to examine the correlation
between compliance and quality (see a further explanation of the sample in the Limitations Section of this report).
Specifically, the study addressed the following research questions:
1 Do the Core Rules for child care centers (CCC) and family child care (FCC) homes serve as overall
Key Indicators of compliance?
2 Does the Annual Compliance Determination Worksheet (ACDW) appropriately designate programs
as compliant or non-compliant related to health and safety?
3 Are the Core Rules related to program quality?
The following definitions are used in the study:
Core Rules = the rules determined to be of greatest importance and place children at greatest risk if not complied
with. This approach is defined in the licensing literature as a risk assessment approach. Core Rules cover 12
regulatory areas and 74 specific rules. The Core Rules were the focal point of this validation study and are addressed
in the first approach to validation – Standards and the first research question.
ACDW = Annual Compliance Determination Worksheet, the compliance decision-making system based on the Core
Rules that can be used to determine the number of visits made to programs. The ACDW was the secondary focal
point of this validation study and is addressed in the second approach to validation – Measures and the second
research question.
Key Indicators = a differential monitoring approach that uses only those rules that statistically predict overall
compliance with all the rules. In other words, if a program is 100% in compliance with the Key Indicators, the
program will also be in substantial to full compliance with all rules. The reverse is also true in that if a program is
not 100% in compliance with the Key Indicators, the program will also have other areas of non-compliance with all
the rules. In this study, eight Key Indicators rules were identified for CCC and nine Key Indicators rules for FCC
(See Tables 9-12 and Figure 2 on pages 15-16 for the specific indicators and additional detail about the
methodology). These are in addition to the Core Rules.
Rule Violations or Citations = occurs when a program does not meet a specific rule and is cited as being out of
compliance with that rule. These individual rule violations/citations are summed to come up with total
violation/citation scores on the Core Rules and on the Licensing Studies.
Differential Monitoring = a relatively new approach to determining the number of licensing visits made to
programs and to what rules are reviewed during these visits. Two measurement tools drive differential monitoring:
one is a Weighted Risk Assessment, and the other is a Key Indicator checklist. Weighted Risk Assessments
determine how often a program will be visited while Key Indicator checklists determine what rules will be reviewed
in the program. Differential monitoring is a powerful approach when Risk Assessment is combined with Key
Indicators because a program is reviewed by the most critical rules and the most predictive rules. See Figure 1 which
presents a Logic Model & Algorithm for Differential Monitoring (DMLMA©) (Fiene, 2012).
Licensing Study = a comprehensive review of a program where all child care rules are reviewed.
Monitoring Visit = an abbreviated form of a visit and review in which only a select group (Core Rules) of child care
rules are reviewed.
Program Quality = for the purposes of this study, quality was measured in child care centers by the Early Childhood
Environment Rating Scale-Revised (ECERS-R), Infant Toddler Environment Rating Scale-Revised (ITERS-R) and in
family child care homes by the Family Child Care Environment Rating Scale-Revised (FCCERS-R). The program
quality measures were used as part of the third approach to validation – Outputs and the third research question.

Georgia Child Care Licensing Validation Study RIKI
R e s e a r c h I n s t i t u t e f o r K e y I n d i c a t o r s
Page 5
Scoring for Licensing Variables/Data Collection Protocols:
Licensing Study = the total number of rule violations for a specific facility.
Core Rules = the total number of core rule violations.
ACDW/Compliance Designation = the annual compliance determination taken from the Annual Compliance
Determination Worksheet. Compliant [C] was coded as “1” in the data base; Non-Compliant [NC] was coded as “0”
in the data base.
Key Indicators = these were generated by a statistical methodology based upon the ability of the specific rule to
predict full compliance with all the rules. Data from the Licensing Studies were used to make this determination of
key indicator rule status.
METHODOLOGY AND ANALYTICAL FRAMEWORK
Licensing data over a four-year period (2008-2012) and matching program quality data from a two-year period
(2007-2008) were used in this study. Specifically, data from 104 child care centers and 147 family child care homes
were analyzed. Data from licensing studies (all rules) and monitoring visits (selected rules) were utilized. Program
quality data were provided by researchers from the FPG Child Development Institute at the University of North
Carolina at Chapel Hill (FPG), and the FPG research team matched these data points with the licensing data
provided by DECAL (See the following website for the specific reports -
http://decal.ga.gov/BftS/ResearchStudyOfQuality.aspx). All the data were analyzed by the Research Institute for
Key Indicators.
Two models were used to frame the analysis: a Validation Framework that uses four approaches (Zellman & Fiene,
2012) to validating quality rating and improvement systems (QRIS) being applied to licensing systems; and a
Differential Monitoring Logic Model and Algorithm (DMLMA©)(Fiene, 2012) were employed to answer the three
research questions for this Validation Study. The validation approaches are described below; the DMLMA© is
described at the beginning of the Findings Section of this report.
The first validation approach deals with examining the validity of key underlying concepts by assessing if basic
components and standards are the right ones by examining levels of empirical and expert support. For this study, this
approach used Key Indicators to validate the Core Rules since Risk Assessment and Key Indicators are differential
monitoring approaches. This answers the first research question.
The second validation approach deals with examining the measurement strategy and the psychometric properties of
the measures used by assessing whether the verification process for each rule is yielding accurate results. Properties
of the key rules can be measured through inter-rater reliability on observational measures, scoring of documentation,
and inter-item correlations to determine if measures are psychometrically sound. Cut scores can be examined to
determine the most appropriate ways to combine measures into summary ratings. For this study, the second
validation approach validates the use of the ACDW and Core Rules by comparing compliance decisions with the
Licensing Studies. This answers the second research question.
The third validation approach deals with assessing the outputs of the licensing process by examining the variation
and patterns of program level ratings within and across program types to ensure that the ratings are functioning as
intended. The approach examines the relationship of program level ratings to other more broadly based program
quality measures and examines alternate cut points and rules to determine how well the ratings distinguish different
levels of quality. For this study, this approach used data from Core Rules and Licensing Studies and data from
earlier program quality studies (Maxwell, et al., 2009a,b; 2010) for validation. This answers the third research
question.
Out of the four validation approaches (See Table 8), only three were utilized in this study. The fourth validation
approach deals with how ratings are associated with children’s outcomes. This approach examines the relationship

Georgia Child Care Licensing Validation Study RIKI
R e s e a r c h I n s t i t u t e f o r K e y I n d i c a t o r s
Page 6
between program level ratings and selected child outcomes to determine whether higher program ratings are
associated with better child outcomes. This approach did not have data that could be used in this study.
FINDINGS
The DMLMA© (See Figure 1) provides the conceptual model for assessing the overall effectiveness of Georgia’s
approach using Core Rules. In the model, the two main tools are Risk Assessment and Key Indicator measurements,
which are created from a statistical analysis of the comprehensive licensing tool. The comprehensive licensing tool
measures compliance with all rules. For the purposes of this study the Licensing Study represents the comprehensive
licensing tool while the Core Rules represent a Risk Assessment tool. For the Program Quality tools, the ECERS-R,
ITERS-R and FCCERS-R were utilized from an earlier program quality study by FPG Child Development Institute
at the University of North Carolina at Chapel Hill (Maxwell, et al., 2009a,b; 2010). Georgia currently does not use a
Key Indicator tool (see Table 1). With the DMLMA© analytical methodology, specific correlational thresholds are
expected (please refer to Figure 1 on page 14).
TABLE 1
DMLMA© Terminology Georgia Examples and Data Sources
Comprehensive Tool Licensing Study
Program Quality Tool ECERS-R and ITERS-R for CCC; FCCERS-R for FCC
Risk Assessment Tool Core Rules
Key Indicators Tool Not Present (Generated as part of this Study-see Tables 9/10)
Differential Monitoring Tool ACDW Compliance Determination
Before presenting the findings for the validation approaches, some basic descriptive statistics are provided regarding
the major variables in this study: Licensing Study, ACDW, Core Rules, and Key Indicators (see Table 2). The data
are provided for both child care centers and family child care homes. It is clear from these basic descriptive
statistics that the data distributions are very skewed in a positive fashion which means that there is very high
compliance with all the major licensing variables for this study. In other words, the majority of programs are in
substantial compliance with all the licensing rules and receive a compliant determination.
TABLE 2
Licensing Variable Mean Range SD Skewness Kurtosis
Licensing Study (CCC) 5.51 25 5.26 1.47 2.11
ACDW (CCC) 0.75 1 0.44 -1.17 -0.64
Core Rules (CCC) 4.47 22 4.72 1.81 3.60
Key Indicators (CCC) 1.68 6 1.61 0.90 0.073
Licensing Study (FCC) 5.85 33 5.71 1.56 3.37
ACDW (FCC) 0.87 1 0.34 -2.23 3.03
Core Rules (FCC) 1.61 11 1.75 1.99 6.61
Key Indicators (FCC) 2.37 8 2.13 0.63 -0.57 Licensing Study Mean = the average number of total rule violations.
ACDW Mean = the average score for a determination of compliance (1) or non-compliance (0).
Core Rules Mean = the average number of core rule violations.
Key Indicators Mean = the average number of key indicator violations.
The findings are presented by the three validation approaches of Standards, Measures, and Outputs as well as the
three research questions related to Key Indicators, Core Rules, and Program Quality.
1) Validation of Standards (First Approach to Validation) for answering the first research question: Do the
Core Rules for child care centers (CCC) and family child care (FCC) homes serve as overall key indicators of
compliance?
In this first approach to validation which focuses on Standards, Key Indicators were generated from the Licensing
Studies because Core Rules (a Risk Assessment tool) and Key Indicators are both Differential Monitoring
approaches (see Figure 1). The Core Rules were compared to the Key Indicators generated by the licensing data base
and there was a .49 correlation for CCC (n = 104) and .57 correlation for FCC (n = 147) which indicates a

Georgia Child Care Licensing Validation Study RIKI
R e s e a r c h I n s t i t u t e f o r K e y I n d i c a t o r s
Page 7
relationship between the Core Rules and Key Indicators at a p < .0001 significance level (Table 3). Also, the Key
Indicators were correlated with the Licensing Study data and significant results were determined with r values of .78
(p < .0001) for CCC (n =104) and .87 (p < .0001) for FCC (n = 147). These results clearly met the expected
DMLMA© thresholds between the key indicator rules with core rules (.50+) and licensing studies (.70+).
TABLE 3
Key Indicators with Core Rules and Licensing Study r = p < n =
Key Indicators and Core Rules (CCC) .49 .0001 104
Key Indicators and Licensing Study (CCC) .78 .0001 104
Key Indicators and Core Rules (FCC) .57 .0001 147
Key Indicators and Licensing Study (FCC) .87 .0001 147
Table 3 begins to demonstrate how the Georgia Child Care Licensing system is utilizing the DMLMA© terminology
from Table 1. With the generation of Key Indicators from this study, all the key elements within a differential
monitoring system are present. This crosswalk to the DMLMA© will continue in Tables 4 & 5.
2) Validation of Measures (Second Approach to Validation) for answering the second research question: Is
the Annual Compliance Determination Worksheet (ACDW) a valid measure in determining the overall
health and safety compliance of Georgia’s early care and learning programs?
The Core Rules and the ACDW were compared to the Licensing Study data and compliance designation to
determine the validation of the ACDW scoring protocol. There was a high correlation between the number of
violations on the Core Rules and the total licensing violations on the Licensing Studies (r = .69; p < .0001)(Table 4).
This result helps to validate that the ACDW is actually discriminating between high compliant and low compliant
providers for CCC. For FCC, there was also a high correlation between the number of violations on the Core Rules
and the total licensing violations on the Licensing Studies (r = .74; p < .0001). These results meet the DMLMA©
thresholds of .50+ for Licensing Studies and Core Rules.
When Core Rules were correlated with the ACDW compliance decisions, there was a significantly high correlation
for CCC (r = .76; p < .0001) and for FCC (r = .70; p < .0001). The key element of the ACDW scoring protocol is
that the Core Rules distinguish between high and low compliant providers. The CCC/Core Rules and ACDW have
been validated, as well as the FCC/Core Rules and ACDW because both the correlations were above the expected
DMLMA© threshold (.50+).
TABLE 4
Core Rules with Licensing Studies and ACDW r = p < n =
Core Rules and Licensing Studies (CCC) .69 .0001 104
Core Rules and ACDW (CCC) .76 .0001 104
Core Rules and Licensing Studies (FCC) .74 .0001 147
Core Rules and ACDW (FCC) .70 .0001 147
3) Validation of Outputs (Third Approach to Validation) for answering the third research question: Are the
Core Rules correlated with program quality?
For this approach, programs were divided into those that had an ITERS-R score, an ECERS-R score for a preschool
class, and an ECERS-R score for a Georgia’s Pre-K class; and those that had only an ITERS-R score and an
ECERS-R score for preschool. The sample was evenly divided. Since Georgia has placed substantial resources into
its Pre-K program, it was thought that this analysis might suggest if there was anything different between programs
with a Georgia’s Pre-K class and those without.
When the Core Rules for CCC’s were compared with program quality data (ECERS-R/PS + ITERS-R), a significant
correlation was not found between CCC (r = .27) for programs with only preschool classrooms but was found for
programs with Pre-K classrooms (ECERS-R/PK + ITERS-R) (r = .60). When Core Rules for FCC’s were compared

Georgia Child Care Licensing Validation Study RIKI
R e s e a r c h I n s t i t u t e f o r K e y I n d i c a t o r s
Page 8
to the FCC program quality data (FCCERS-R), the correlations were at a much lower level (r = .17) (See Table 5).
However, these results are constrained by the limited range of the data; see the Limitation Section that follows this
section.
Upon closer inspection of the correlations in Table 5 for CCC, it would appear that the CCC compliance system is
more valid with the state-funded Pre-K programs (.48) than with the preschool programs (.21) because the
correlations between the various Environment Rating Scales (ECERS-R + ITERS-R) are significant only when
compared to the respective compliance with all rules on the Licensing Studies in the programs that have Pre-K
programs. In making these comparisons, programs that had both ECERS-R and ITERS-R were combined and
compared to the respective Licensing Study data (these data were reversed scored in which the number of violations
were subtracted from a perfect score of 100). The differences are even more significant when you compare the
Environment Rating Scales and the Core Rules where the Pre-K programs’ correlation between the compliance with
Core Rules and Environment Rating Scales is .60 and preschool programs is .27 while the FCC is .17.
Program quality data refer to data collected in earlier studies by researchers from FPG (Maxwell, et al., 2009a,b;
2010) in which FPG collected Environment Rating Scales (ECERS-R; ITERS-R; FCCERS-R) data on a
representative sample of CCC and FCC (See (http://decal.ga.gov/BftS/ResearchStudyOfQuality.aspx). In
comparing the program compliance and program quality data, the analyses supported the validation of the CCC for
Pre-K only programs (DMLMA© threshold = .30+) but it was weaker for the FCC programs and not significant for
preschool programs and therefore could not be validated. See Table 13 on page 17 for a further explanation of the
CCC data distribution.
TABLE 5
Program Compliance and Quality Comparisons r = p < n=
ECERS-R/PK + ITERS-R and Licensing Studies .48 .001 45
ECERS-R/PK + ITERS-R and Core Rules .60 .0001 45
ECERS-R/PS + ITERS-R and Licensing Studies .21 ns 45
ECERS-R/PS + ITERS-Rand Core Rules .27 ns 45
FCCERS-R and Licensing Studies .19 .04 146
FCCERS-R and Core Rules .17 .03 146
LIMITATION
The sampling for this study was based on previous studies (Maxwell, 2009a,b; 2010) completed by FPG in which
program quality data were collected and analyzed. This study employed a subset of sites that were a representative
sample of Georgia’s child care licensing system. Not all of these sites could be used for this study because some had
closed or some did not have the necessary data to make comparisons. So the sample at this point is one of
convenience; however, 104 of the 173 CCC and 146 of the 155 FCC were used in this study, a significant number of
the original representative sample. Also, when the Environment Rating Scales (ECERS-R, ITERS-R, FCCERS-R)
scores were compared with the CCC and FCC samples, there were no significant differences (average difference
was .01-.03) between the two study samples (See Table 6).
TABLE 6
Environment Rating Scale Scores FPG This Study
ECERS-R Pre-K Total Scale Scores 4.16 4.15
ECERS-R Preschool Total Scale Scores 3.39 3.42
ITERS-R Total Scale Scores 2.74 2.72
FCCERS-R Total Scale Scores 2.50 2.49

Georgia Child Care Licensing Validation Study RIKI
R e s e a r c h I n s t i t u t e f o r K e y I n d i c a t o r s
Page 9
CONCLUSION
The CCC differential monitoring through the Core Rules/ACDW has been validated on the three approaches
(Standards, Measures, and Outputs (Pre-K Program only)) and three research questions (Key Indicators, Core Rules,
Program Quality (Programs with Georgia Pre-K only)) (See Table 7). The FCC differential monitoring through the
Core Rules/ACDW was validated on the first validation approach (Standards) and first research question (Key
Indicators); validated on the second validation approach (Measures) and second research question (Core Rules); but
not validated on the third validation approach (Outputs) and third research question (Program Quality).
TABLE 7
Correlations
Validation Approach/Research Question CCC Actual (Expected*) FCC Actual (Expected)
1 STANDARDS/Key Indicators VALIDATED VALIDATED
Key Indicators x Core Rules .49 (.50+) .57 (.50+)
Key Indicators x Licensing Studies .78 (.70+) .87 (.70+)
2 MEASURES/Core Rules/ACDW2 VALIDATED VALIDATED
Core Rules x Licensing Studies .69 (.50+) .74 (.50+)
Core Rules x ACDW .76 (.50+) .70 (.50+)
3 OUTPUTS/Program Quality VALIDATED NOT VALIDATED
Licensing Studies x ERS**/PK .48 (.30+) FCCERS .19 (.30+)
Core Rules x ERS/PK .60 (.30+) FCCERS .17 (.30+)
Licensing Studies x ERS/PS ------------ .21 (.30+)
Core Rules x ERS/PS ------------ .27 (.30+)
_____________________________________________________________________________________________
*DMLMA© Expected r Value Thresholds in Order to be Validated (Also see Figure 1 for additional details):
High correlations (.70+) = Licensing Studies x Key Indicators.
Moderate correlations (.50+) = Licensing Studies x Core Rules; Core Rules x ACDW; Core Rules x Key Indicators; Key Indicators x ACDW.
Lower correlations (.30+) = Program Quality Tools x Licensing Studies; Program Quality x Core Rules; Program Quality x Key Indicators.
Program Quality Tools = ECERS-R, ITERS-R, FCCERS-R.
**ERS = ECERS-R + ITERS-R
PK = Pre-K program
PS= Preschool program
A confounding of data occurred with the first two validation approaches because the Core Rules were influenced a
great deal by the National Child Care Key Indicators (NCCKI) (Fiene, 2002) where 10 of the 13 Core Rules
overlapped significantly with the NCCKI. This helped to increase the correlation between the Core Rules and the
Licensing Studies because the Core Rules represented both risk assessment and key indicator rules. Using both risk
assessment and key indicator rules together is an ideal differential monitoring approach (Fiene, 2012). Most states
use one or the other but generally not together. By including the newly generated key indicators from this study
where there is also overlap with the NCCKI, it should enhance the differential monitoring approach utilized by
DECAL.
_____________________________________________________________________________________________________________________ 2.
ACDW decisions were compared with using severity as a factor and not using it as a factor in the scoring system with Core Rules. No
significant differences were found between the two scoring systems; therefore, the results in this study represent Core Rule scores without severity included since this is the simpler model.
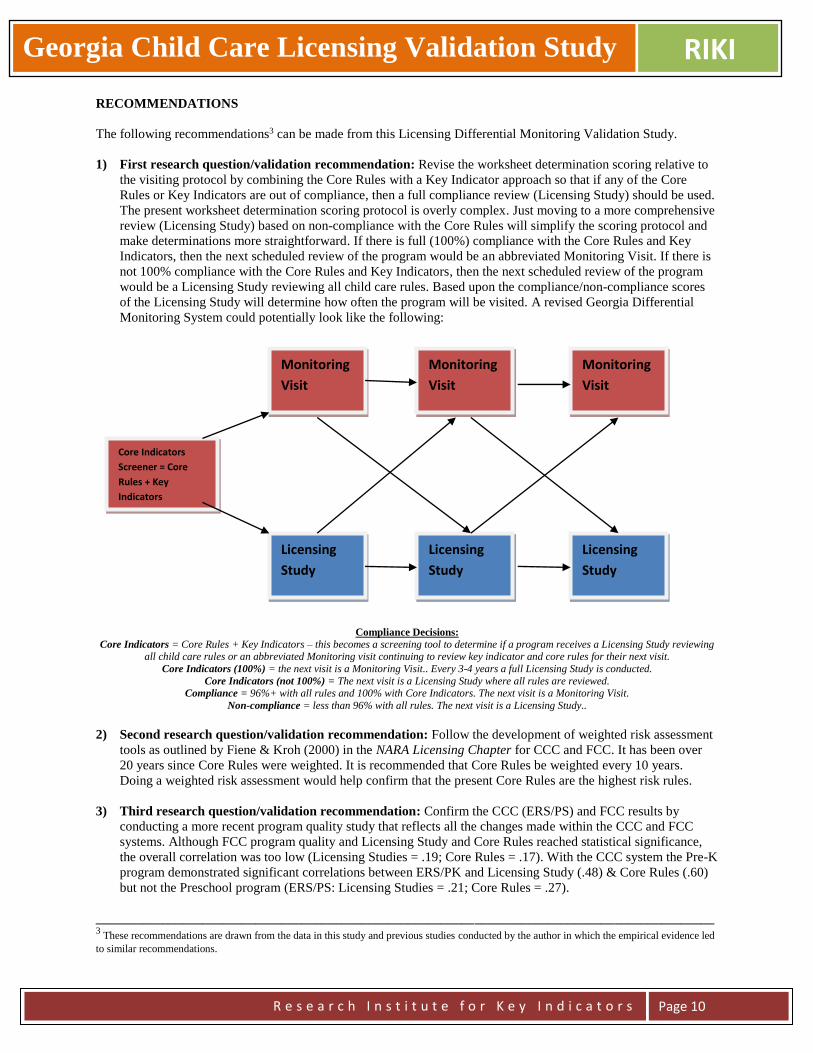
Georgia Child Care Licensing Validation Study RIKI
R e s e a r c h I n s t i t u t e f o r K e y I n d i c a t o r s
Page 10
RECOMMENDATIONS
The following recommendations3 can be made from this Licensing Differential Monitoring Validation Study.
1) First research question/validation recommendation: Revise the worksheet determination scoring relative to
the visiting protocol by combining the Core Rules with a Key Indicator approach so that if any of the Core
Rules or Key Indicators are out of compliance, then a full compliance review (Licensing Study) should be used.
The present worksheet determination scoring protocol is overly complex. Just moving to a more comprehensive
review (Licensing Study) based on non-compliance with the Core Rules will simplify the scoring protocol and
make determinations more straightforward. If there is full (100%) compliance with the Core Rules and Key
Indicators, then the next scheduled review of the program would be an abbreviated Monitoring Visit. If there is
not 100% compliance with the Core Rules and Key Indicators, then the next scheduled review of the program
would be a Licensing Study reviewing all child care rules. Based upon the compliance/non-compliance scores
of the Licensing Study will determine how often the program will be visited. A revised Georgia Differential
Monitoring System could potentially look like the following:
Compliance Decisions:
Core Indicators = Core Rules + Key Indicators – this becomes a screening tool to determine if a program receives a Licensing Study reviewing all child care rules or an abbreviated Monitoring visit continuing to review key indicator and core rules for their next visit.
Core Indicators (100%) = the next visit is a Monitoring Visit.. Every 3-4 years a full Licensing Study is conducted.
Core Indicators (not 100%) = The next visit is a Licensing Study where all rules are reviewed. Compliance = 96%+ with all rules and 100% with Core Indicators. The next visit is a Monitoring Visit.
Non-compliance = less than 96% with all rules. The next visit is a Licensing Study..
2) Second research question/validation recommendation: Follow the development of weighted risk assessment
tools as outlined by Fiene & Kroh (2000) in the NARA Licensing Chapter for CCC and FCC. It has been over
20 years since Core Rules were weighted. It is recommended that Core Rules be weighted every 10 years.
Doing a weighted risk assessment would help confirm that the present Core Rules are the highest risk rules.
3) Third research question/validation recommendation: Confirm the CCC (ERS/PS) and FCC results by
conducting a more recent program quality study that reflects all the changes made within the CCC and FCC
systems. Although FCC program quality and Licensing Study and Core Rules reached statistical significance,
the overall correlation was too low (Licensing Studies = .19; Core Rules = .17). With the CCC system the Pre-K
program demonstrated significant correlations between ERS/PK and Licensing Study (.48) & Core Rules (.60)
but not the Preschool program (ERS/PS: Licensing Studies = .21; Core Rules = .27).
_____________________________________________________________________________________________ 3 These recommendations are drawn from the data in this study and previous studies conducted by the author in which the empirical evidence led
to similar recommendations.
Core Indicators
Screener = Core
Rules + Key
Indicators
Monitoring
Visit
Licensing
Study
Monitoring
Visit
Monitoring
Visit
Licensing
Study
Licensing
Study
Georgia Child Care Licensing Validation Study RIKI
R e s e a r c h I n s t i t u t e f o r K e y I n d i c a t o r s
Page 11
REFERENCES
Fiene (2012). Differential monitoring logic model and algorithm (DMLMA©). Middletown, PA: Research Institute
for Key Indicators.
Fiene (2007). Child Development Program Evaluation & Caregiver Observation Scale, in T Halle (Ed.), Early Care
and Education Quality Measures Compendium, Washington, D.C.: Child Trends.
Fiene (2003). Licensing related indicators of quality child care, Child Care Bulletin, Winter 2002-2003, pps 12-13.
Fiene (2002). Thirteen indicators of quality child care: Research update. Washington, DC: Office of the Assistant
Secretary for Planning and Evaluation, US Department of Health and Human Services.
Fiene (1985). Measuring the effectiveness of regulations, New England Journal of Human Services, 5(2), 38-39.
Fiene (1981). A new tool for day care monitoring introduced by children's consortium, Evaluation Practice, 1(2), 10-11.
Fiene & Kroh (2000). Licensing Measurement and Systems, NARA Licensing Curriculum. Washington, D.C.:
National Association for Regulatory Administration.
Fiene & Nixon (1985). Instrument based program monitoring and the indicator checklist for child care, Child Care
Quarterly, 14(3), 198-214.
Griffin & Fiene (1995). A systematic approach to policy planning and quality improvement for child care: A
technical manual for state administrators. Washington, D.C.: National Center for Clinical Infant Programs-Zero to
Three.
Harms, T., Cryer, D.R., & Clifford, R.M. (2007). Family child care environment rating scale: Revised edition. New
York: Teachers College Press.
Harms, T., Cryer, D., & Clifford, R. M. (2006). Infant/toddler environment rating scale: Revised edition. New York:
Teachers College Press.
Harms, T., Clifford, R. M., & Cryer, D. (2005). Early childhood environment rating scale: Revised edition. New
York: Teachers College Press.
Maxwell, K. L., Early, D. M., Bryant, D., Kraus, S., Hume, K., & Crawford, G. (2009a). Georgia study of early care
and education: Child care center findings. Chapel Hill, NC: The University of North Carolina at Chapel Hill, FPG
Child Development Institute.
Maxwell, K. L., Early, D. M., Bryant, D., Kraus, S., Hume, K., & Crawford, G. (2009b). Georgia study of early care
and education: Findings from Georgia’s Pre-K Program. Chapel Hill, NC: The University of North Carolina at
Chapel Hill, FPG Child Development Institute.
Maxwell, K. L., Early, D. M., Bryant, D., Kraus, S., & Hume, K., (2010). Georgia study of early care and education:
Family child care findings. Chapel Hill: The University of North Carolina at Chapel Hill, FPG Child Development
Institute.
Morgan, Stevenson, Fiene, & Stephens (1986). Gaps and excesses in the regulation of child day care, Reviews of
Infectious Diseases--Infectious Diseases in Child Day Care: Management and Prevention, 8(4), 634-643.
Zellman, G. L. and Fiene, R. (2012). Validation of Quality Rating and Improvement Systems for Early Care and
Education and School-Age Care, Research-to-Policy, Research-to-Practice Brief OPRE 2012. Washington, DC:
Office of Planning, Research and Evaluation, Administration for Children and Families, U.S. Department of Health
and Human Services.

Georgia Child Care Licensing Validation Study RIKI
R e s e a r c h I n s t i t u t e f o r K e y I n d i c a t o r s
Page 12
TABLE 8 - FOUR APPROACHES TO VALIDATING A QRIS (Zellman & Fiene, 2012)
Approach Activities and
Purpose
Typical Questions
Approach Addresses
Issues and
Limitations
1. Examine the validity of
key underlying concepts
Assess whether basic QRIS
quality components and
standards are the “right”
ones by examining levels of
empirical and expert
support.
Do the quality components
capture the key elements of
quality?
Is there sufficient empirical
and expert support for
including each standard?
Different QRISs may use
different decision rules
about what standards to
include in the system.
2. Examine the
measurement strategy and
the psychometric properties
of the measures used to
assess quality
Examine whether the
process used to document
and verify each indicator is
yielding accurate results.
Examine properties of key
quality measures, e.g., inter-
rater reliability on
observational measures,
scoring of documentation,
and inter-item correlations
to determine if measures are
psychometrically sound.
Examine the relationships
among the component
measures to assess whether
they are functioning as
expected.
Examine cut scores and
combining rules to
determine the most
appropriate ways to
combine measures of
quality standards into
summary ratings.
What is the reliability and
accuracy of indicators
assessed through program
administrator self-report or
by document review?
What is the reliability and
accuracy of indicators
assessed through
observation?
Do quality measures
perform as expected? (e.g.,
do subscales emerge as
intended by the authors of
the measures?)
Do measures of similar
standards relate more
closely to each other than to
other measures?
Do measures relate to each
other in ways consistent
with theory?
Do different cut scores
produce better rating
distributions (e.g., programs
across all levels rather than
programs at only one or two
levels) or more meaningful
distinctions among
programs?
This validation activity is
especially important given
that some component
measures were likely
developed in low-stakes
settings and have not been
examined in the context of
QRIS.

Georgia Child Care Licensing Validation Study RIKI
R e s e a r c h I n s t i t u t e f o r K e y I n d i c a t o r s
Page 13
TABLE 8 (CONTINUED)
Approach Activities and
Purpose
Typical Questions
Approach Addresses
Issues and
Limitations
3. Assess the outputs of the
rating process
Examine variation and
patterns of program-level
ratings within and across
program types to ensure that
the ratings are functioning
as intended.
Examine relationship of
program-level ratings to
other quality indicators to
determine if ratings are
assessing quality in
expected ways.
Examine alternate cut points
and rules to determine how
well the ratings distinguish
different levels of quality.
Do programs with different
program-level ratings differ
in meaningful ways on
alternative quality
measures?
Do rating distributions vary
by program type, e.g.,
ratings of center-based
programs compared to
ratings of home-based
programs? Are current cut
scores and combining rules
producing appropriate
distributions across rating
levels?
These validation activities
depend on a reasonable
level of confidence about
the quality components,
standards and indicators as
well as the process used to
designate ratings.
4. Examine how ratings are
associated with children’s
outcomes.
Examine the relationship
between program-level
ratings and selected child
outcomes to determine
whether higher program
ratings are associated with
better child outcomes.
Do children who attend
higher-rated programs have
greater gains in skills than
children who attend lower-
quality programs?
Appropriate demographic
and program level control
variables must be included
in analyses to account for
selection factors.
Studies could be done on
child and program samples
to save resources.
Findings do not permit at-
tribution of causality about
QRIS participation but
inferences can be made
about how quality
influences children’s
outcomes.
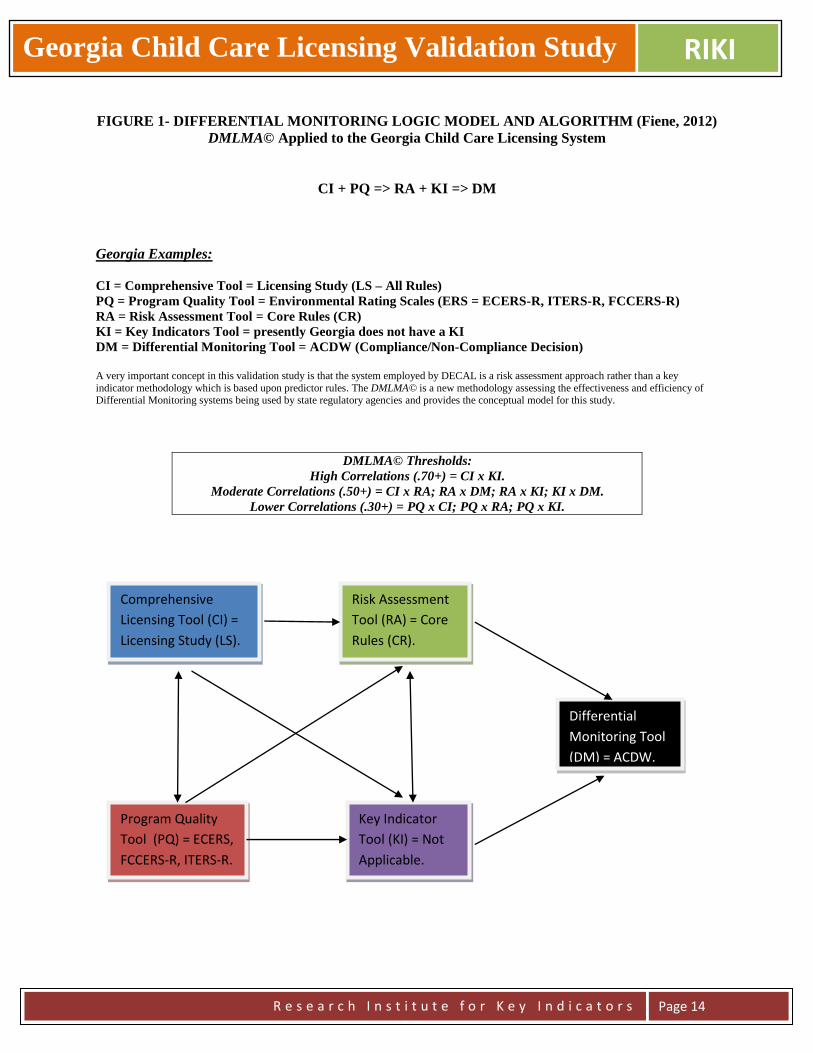
Georgia Child Care Licensing Validation Study RIKI
R e s e a r c h I n s t i t u t e f o r K e y I n d i c a t o r s
Page 14
FIGURE 1- DIFFERENTIAL MONITORING LOGIC MODEL AND ALGORITHM (Fiene, 2012)
DMLMA© Applied to the Georgia Child Care Licensing System
CI + PQ => RA + KI => DM
Georgia Examples:
CI = Comprehensive Tool = Licensing Study (LS – All Rules)
PQ = Program Quality Tool = Environmental Rating Scales (ERS = ECERS-R, ITERS-R, FCCERS-R)
RA = Risk Assessment Tool = Core Rules (CR)
KI = Key Indicators Tool = presently Georgia does not have a KI
DM = Differential Monitoring Tool = ACDW (Compliance/Non-Compliance Decision)
A very important concept in this validation study is that the system employed by DECAL is a risk assessment approach rather than a key
indicator methodology which is based upon predictor rules. The DMLMA© is a new methodology assessing the effectiveness and efficiency of Differential Monitoring systems being used by state regulatory agencies and provides the conceptual model for this study.
DMLMA© Thresholds:
High Correlations (.70+) = CI x KI.
Moderate Correlations (.50+) = CI x RA; RA x DM; RA x KI; KI x DM.
Lower Correlations (.30+) = PQ x CI; PQ x RA; PQ x KI.
Comprehensive
Licensing Tool (CI) =
Licensing Study (LS).
Program Quality
Tool (PQ) = ECERS,
FCCERS-R, ITERS-R.
Risk Assessment
Tool (RA) = Core
Rules (CR).
Key Indicator
Tool (KI) = Not
Applicable.
Differential
Monitoring Tool
(DM) = ACDW.
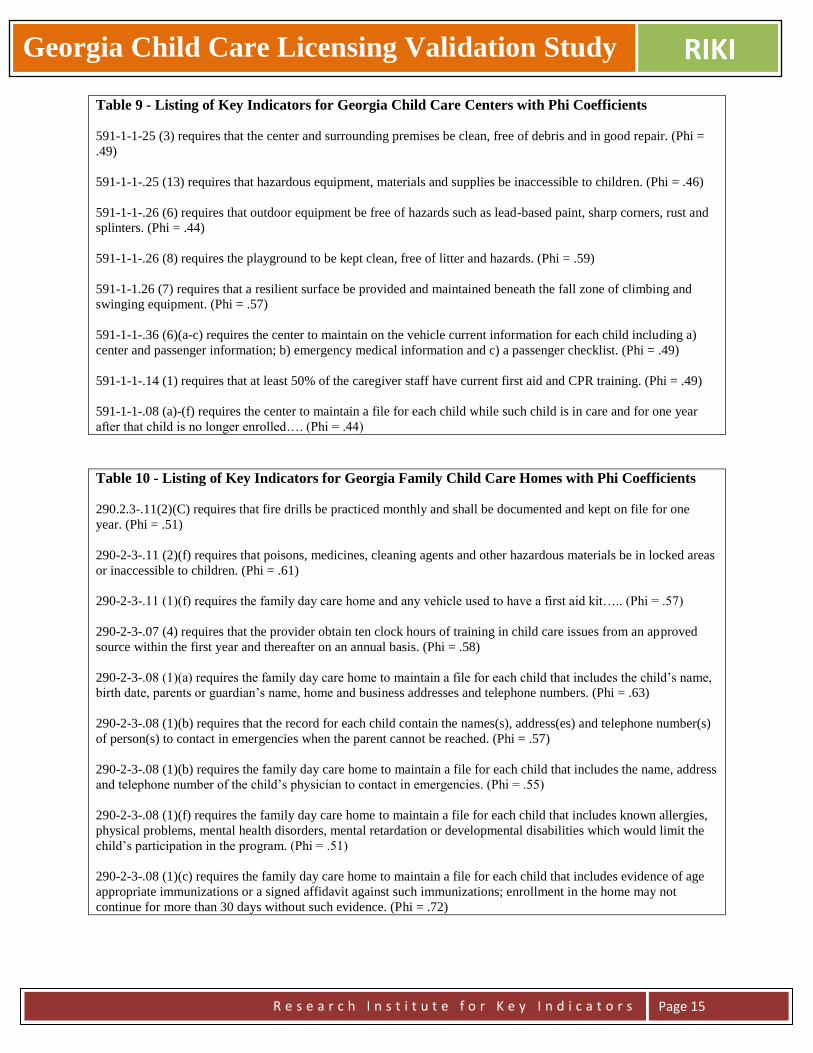
Georgia Child Care Licensing Validation Study RIKI
R e s e a r c h I n s t i t u t e f o r K e y I n d i c a t o r s
Page 15
Table 9 - Listing of Key Indicators for Georgia Child Care Centers with Phi Coefficients
591-1-1-25 (3) requires that the center and surrounding premises be clean, free of debris and in good repair. (Phi =
.49)
591-1-1-.25 (13) requires that hazardous equipment, materials and supplies be inaccessible to children. (Phi = .46)
591-1-1-.26 (6) requires that outdoor equipment be free of hazards such as lead-based paint, sharp corners, rust and
splinters. (Phi = .44)
591-1-1-.26 (8) requires the playground to be kept clean, free of litter and hazards. (Phi = .59)
591-1-1.26 (7) requires that a resilient surface be provided and maintained beneath the fall zone of climbing and
swinging equipment. (Phi = .57)
591-1-1-.36 (6)(a-c) requires the center to maintain on the vehicle current information for each child including a)
center and passenger information; b) emergency medical information and c) a passenger checklist. (Phi = .49)
591-1-1-.14 (1) requires that at least 50% of the caregiver staff have current first aid and CPR training. (Phi = .49)
591-1-1-.08 (a)-(f) requires the center to maintain a file for each child while such child is in care and for one year
after that child is no longer enrolled…. (Phi = .44)
Table 10 - Listing of Key Indicators for Georgia Family Child Care Homes with Phi Coefficients
290.2.3-.11(2)(C) requires that fire drills be practiced monthly and shall be documented and kept on file for one
year. (Phi = .51)
290-2-3-.11 (2)(f) requires that poisons, medicines, cleaning agents and other hazardous materials be in locked areas
or inaccessible to children. (Phi = .61)
290-2-3-.11 (1)(f) requires the family day care home and any vehicle used to have a first aid kit….. (Phi = .57)
290-2-3-.07 (4) requires that the provider obtain ten clock hours of training in child care issues from an approved
source within the first year and thereafter on an annual basis. (Phi = .58)
290-2-3-.08 (1)(a) requires the family day care home to maintain a file for each child that includes the child’s name,
birth date, parents or guardian’s name, home and business addresses and telephone numbers. (Phi = .63)
290-2-3-.08 (1)(b) requires that the record for each child contain the names(s), address(es) and telephone number(s)
of person(s) to contact in emergencies when the parent cannot be reached. (Phi = .57)
290-2-3-.08 (1)(b) requires the family day care home to maintain a file for each child that includes the name, address
and telephone number of the child’s physician to contact in emergencies. (Phi = .55)
290-2-3-.08 (1)(f) requires the family day care home to maintain a file for each child that includes known allergies,
physical problems, mental health disorders, mental retardation or developmental disabilities which would limit the
child’s participation in the program. (Phi = .51)
290-2-3-.08 (1)(c) requires the family day care home to maintain a file for each child that includes evidence of age
appropriate immunizations or a signed affidavit against such immunizations; enrollment in the home may not
continue for more than 30 days without such evidence. (Phi = .72)

Georgia Child Care Licensing Validation Study RIKI
R e s e a r c h I n s t i t u t e f o r K e y I n d i c a t o r s
Page 16
Table 11 - Key Indicator Formula Matrix for Generating Key Indicators*
(* This computation occurred for each licensing rule)
________________________________________________________________ A = High Group + Programs in Compliance on Specific Rule.
B = High Group + Programs out of Compliance on Specific Rule.
C = Low Group + Programs in Compliance on Specific Rule.
D = Low Group + Programs out of Compliance on Specific Rule.
W = Total Number of Programs in Compliance on Specific Rule.
X = Total Number of Programs out of Compliance on Specific Rule.
Y = Total Number of Programs in High Group.
Z = Total Number of Programs in Low Group . **High Group = Top 25% of Programs in Compliance with all Rules.
***Low Group = Bottom 25% of Programs in Compliance with all Rules.
****************************************************
Figure 2 - Key Indicator Statistical Methodology (Calculating the Phi Coefficient)
********************************************************
Table 12 – Phi Coefficient Decision Table
Phi Coefficient Range Characteristic of Indicator Decision
(+1.00) – (+.26) Good Predictor Include
(+.25) – (-.25) Unpredictable Do not Include
(-.26) – (-1.00) Terrible Predictor Do not Include
Providers In Compliance on Rule
Programs Out Of Compliance on Rule
Row Total
High Group**
A B Y
Low Group***
C D Z
Column Total
W X Grand Total

Georgia Child Care Licensing Validation Study RIKI
R e s e a r c h I n s t i t u t e f o r K e y I n d i c a t o r s
Page 17
Table 13 - Comparison of the Pre-K and Preschool Programs
Compliance Level* Pre-K ECERS-R**(N) Preschool ECERS-R***(N)
100 4.88 (4) 3.40 (15)
99 4.13 (6) 4.35 (7)
98 4.38 (6) 3.89 (13)
97 3.99 (4) 3.15 (9)
96 4.36 (2) 3.16 (13)
95 4.60 (2) 3.53 (5)
90 3.43 (2) 2.56 (5)
80 2.56 (1) 2.38 (2)
_____________________________________________________________________________________________
*Compliance Level = the number of child care rule violations subtracted from 100.
100 = Full Compliance with Rules
99-98 = Substantial Compliance with Rules
97-90 = Medium Level of Compliance with Rules
80 = Low Level of Compliance with Rules
**Pre-K ECERS-R = average score of Pre-K Program classrooms as compared to the respective compliance levels. (N) =
Sample Size.
***Preschool ECERS-R = average score of Preschool Program classrooms as compared to the respective compliance
levels. (N) = Sample Size.
_____________________________________________________________________________________________
From this comparison there is more of a linear relationship between compliance levels and ECERS-R average scores
for Pre-K Program classrooms than with the Preschool Program classrooms where there is more of a curvilinear or
plateau effect at the upper end of compliance levels (Full Compliance). In order to attain the necessary correlational
thresholds (+.30+) for validation for the third approach to validation, having a linear relationship rather than
curvilinear will enhance this occurring. When a curvilinear or plateau effect occurs there is too great a likelihood
that programs at a medium level of quality will be introduced into the highest (full) level of compliance. From a
public policy standpoint this is an undesirable result.
The other item to note with the data distributions is that the Preschool ECERS-R data are more restricted than the
Pre-K Program ECERS-R data. In other words, there is less variance in the Preschool Program ECERS-R data than
in the Pre-K Program ECERS-R data.
There is an important limitation in these data that the reader must be aware of in not drawing any conclusions that
the presence of a Pre-K Program classroom in any way is causing the change in licensing compliance. There is a
relationship between the two but there is no assumption of causality.

Georgia Child Care Licensing Validation Study RIKI
R e s e a r c h I n s t i t u t e f o r K e y I n d i c a t o r s
Page 18
Georgia Licensing Validation Technical Elements Appendix
Because of the nature of this report being a state’s first attempt at fully validating it’s Child Care Licensing Core
Rule Differential Monitoring Approach utilizing the Zellman & Fiene (2012) Validation Framework and Fiene’s
DMLMA (2012) Model, certain questions surfaced regarding the terminology and the methodology being used in
this report. This Technical Elements Appendix provides answers to specific questions that have been raised
regarding these methodologies.
1. How were the multiple years of data handled?
The Licensing Study data used to make the comparisons are the facility reports that were the earliest
facility observations so that these data would be closest to when the program quality data were collected.
The other more recent Licensing Studies were not used in this comparison.
2. If the Core Rules, Key Indicator, and Licensing Study values are counts of violations, how was the fact
that different sites had different numbers of visits handled?
Because only the earliest Licensing Study data was used, the number of visits were not an issue in the
scoring.
3. If the Core Rules, Key Indicator, and Licensing Study values are counts of violations, were all levels
of violation risk (low, medium, high, extreme) handled the same?
Yes, there were very few occurrences of high and extreme in the data base and also no significant
differences were found when a sample of the rule violations with and without the levels of violation risk
were compared. Therefore the simpler formula in which levels of violation risk were not used was
selected.
4. How did you determine the minimum correlations (DMLMA thresholds) for each analysis? Was this
computed separately for this analysis or are the minimum correlations based on previous work?
The DMLMA thresholds were determined from previous research work conducted by the author of this
study on this model over the past 30 years. These were the average correlational thresholds that have been
proposed for making validation determinations. The reason for utilizing the DMLMA model and
thresholds is that the Zellman & Fiene (2012) Framework provides guidance in how to select specific
validation approaches, what are the specific questions answered by the approach and what are the
limitations of the particular approach. The DMLMA model builds upon this but provides a suggested
scoring protocol by comparing correlational thresholds in a specific state to historical trends.
5. Was Phi calculated for every rule in the licensing study? Can the full list be added to the appendix?
Yes, Phi was calculated for every rule in the licensing study but most of them could not be computed
because there was so few rule violations in the majority of the rules. This is typical of state licensing data
sets and the full Phi comparisons are not depicted because it does not add any information to the state
report.

Georgia Child Care Licensing Validation Study RIKI
R e s e a r c h I n s t i t u t e f o r K e y I n d i c a t o r s
Page 19
6. How did you determine which of the Licensing Study rules should be counted as Key Indicators?
The Key Indicator statistical methodology based upon a specific cut off point for the Phi Coefficient in
which the p values were .0001 or less. This is a very stringent cut off point but it has been found
historically that the p values needed to be lowered as the data distributions became more skewed with
programs overall compliance levels increasing over time.
7. How were sites that had no infant/toddler (i.e., no ITERS score) handled for the third validation
approach? How were sites that had only a GA Pre-K (no preschool) handled?
For scoring purposes only those facilities that had both the ECERS and ITERS scores were used in making
comparisons with the licensing data related to the third approach to validation. The GA Pre-K were scored
and compared in the same way.
8. On Table 13, why is the number of violation subtracted from 100 (rather than from the maximum
possible)?
Generally this scoring is done because it is more intuitive to think in terms of 100% in compliance as a
score of “100” rather than a score of “0”. This conversion is used in all state licensing reports that involve
the DMLMA, Key Indicators and Risk Assessment Methodologies/Models.

Georgia Child Care Licensing Validation Study RIKI
R e s e a r c h I n s t i t u t e f o r K e y I n d i c a t o r s
Page 20
FOR ADDITIONAL INFORMATION REGARDING THIS REPORT AND STUDY:
Bentley Ponder, Ph.D.
DECAL Director of Research and Evaluation
Richard Fiene, Ph.D.
Research Institute for Key Indicators LLC
Kansas Child Care Licensing Key Indicator Study 2013
R e s e a r c h I n s t i t u t e f o r K e y I n d i c a t o r s
Page 1
Kansas Child Care Licensing Key Indicator Study
Richard Fiene, Ph.D.
INTRODUCTION
The purpose of this report is to provide the Kansas Child Care Office with basic analyses for the
development of their key indicator system for both centers and homes. Licensing data from 2012 taken from both
centers (CCC) (n = 482) and homes (FCC) (n = 500) were used in this Licensing Key Indicator study. The centers
were further broken down into 52 (11%) Head Start programs and 430 (89%) child care centers. The homes were
further broken down into 115 (23%) group homes and 385 (77%) family homes.
Definitions:
Key Indicators (KI) = a differential monitoring approach that employs using only those rules that statistically predict
overall compliance with all the rules. In other words, if a program is 100% in compliance with the Key Indicators
the program will also be in substantial to full compliance with all rules. The reverse is also true in that if a program
is not 100% in compliance with the Key Indicators, the program will also have other areas of non-compliance with
all the rules. In this study, 8 Key Indicator rules were identified for CCC and 6 Key Indicator rules for FCC. The
Key Indicators can be found in the Findings Section of this report.
Rule Violations or Citations = this occurs when a program does not meet a specific rule and is cited as being out of
compliance with that rule.
METHODOLOGY
A Differential Monitoring Logic Model and Algorithm (DMLMA©)(Fiene, 2012) was employed, in
particular, the key indicator methodology to generate the Key Indicators for this project. The DMLMA© is the 4th
generation of an Early Childhood Program Quality Indicator Model (ECPQIM)(Fiene & Nixon, 1985; Griffin &
Fiene, 1995; Fiene & Kroh, 2000).
The DMLMA© (see Figure 1) provides the conceptual model for assessing the overall effectiveness of a
differential monitoring system. The two main tools in a Differential Monitoring (DM) system are Risk Assessment
(RA) and Key Indicator (KI) measurement tools. Both the Risk Assessment and Key Indicator tools are derived
from a comprehensive licensing tool (CI) that measures compliance with all rules. For the purposes of this study the
Licensing Data taken from Kansas Monitoring Reviews represents the comprehensive licensing tool (CI). Kansas
presently does not use a Risk Assessment or a Program Quality tool (see Table 1).
Table 1
DMLMA© Terminology Kansas Examples and Data Sources
Comprehensive Tool (CI) Licensing Data from Kansas Monitoring Visits
Program Quality Tool (PQ) Not Applicable
Risk Assessment Tool (RA) Not Applicable
Key Indicators (KI) Generated from this Study
Differential Monitoring (DM) Not Applicable
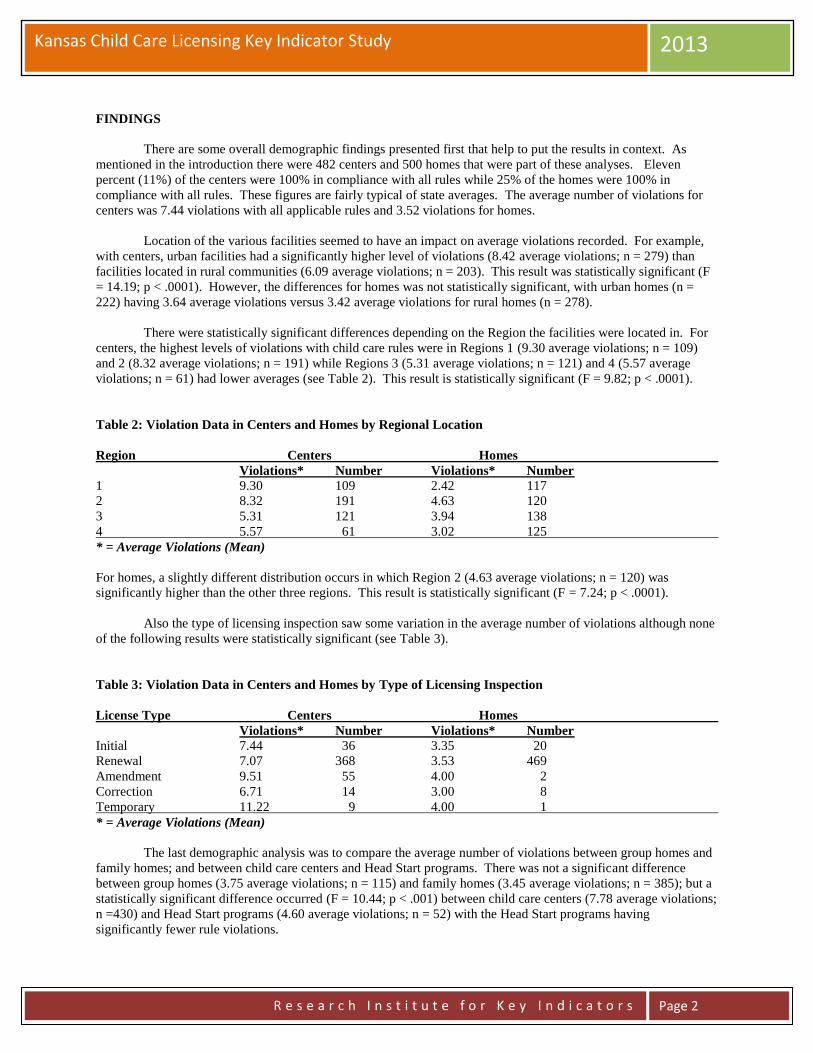
Kansas Child Care Licensing Key Indicator Study 2013
R e s e a r c h I n s t i t u t e f o r K e y I n d i c a t o r s
Page 2
FINDINGS
There are some overall demographic findings presented first that help to put the results in context. As
mentioned in the introduction there were 482 centers and 500 homes that were part of these analyses. Eleven
percent (11%) of the centers were 100% in compliance with all rules while 25% of the homes were 100% in
compliance with all rules. These figures are fairly typical of state averages. The average number of violations for
centers was 7.44 violations with all applicable rules and 3.52 violations for homes.
Location of the various facilities seemed to have an impact on average violations recorded. For example,
with centers, urban facilities had a significantly higher level of violations (8.42 average violations; n = 279) than
facilities located in rural communities (6.09 average violations; n = 203). This result was statistically significant (F
= 14.19; p < .0001). However, the differences for homes was not statistically significant, with urban homes (n =
222) having 3.64 average violations versus 3.42 average violations for rural homes (n = 278).
There were statistically significant differences depending on the Region the facilities were located in. For
centers, the highest levels of violations with child care rules were in Regions 1 (9.30 average violations; n = 109)
and 2 (8.32 average violations; n = 191) while Regions 3 (5.31 average violations; n = 121) and 4 (5.57 average
violations; n = 61) had lower averages (see Table 2). This result is statistically significant (F = 9.82; p < .0001).
Table 2: Violation Data in Centers and Homes by Regional Location
Region Centers Homes
Violations* Number Violations* Number
1 9.30 109 2.42 117
2 8.32 191 4.63 120
3 5.31 121 3.94 138
4 5.57 61 3.02 125
* = Average Violations (Mean)
For homes, a slightly different distribution occurs in which Region 2 (4.63 average violations; n = 120) was
significantly higher than the other three regions. This result is statistically significant (F = 7.24; p < .0001).
Also the type of licensing inspection saw some variation in the average number of violations although none
of the following results were statistically significant (see Table 3).
Table 3: Violation Data in Centers and Homes by Type of Licensing Inspection
License Type Centers Homes
Violations* Number Violations* Number
Initial 7.44 36 3.35 20
Renewal 7.07 368 3.53 469
Amendment 9.51 55 4.00 2
Correction 6.71 14 3.00 8
Temporary 11.22 9 4.00 1
* = Average Violations (Mean)
The last demographic analysis was to compare the average number of violations between group homes and
family homes; and between child care centers and Head Start programs. There was not a significant difference
between group homes (3.75 average violations; n = 115) and family homes (3.45 average violations; n = 385); but a
statistically significant difference occurred (F = 10.44; p < .001) between child care centers (7.78 average violations;
n =430) and Head Start programs (4.60 average violations; n = 52) with the Head Start programs having
significantly fewer rule violations.

Kansas Child Care Licensing Key Indicator Study 2013
R e s e a r c h I n s t i t u t e f o r K e y I n d i c a t o r s
Page 3
Key Indicator Findings
The following findings will provide the Key Indicators for centers (child care centers and Head Start) and
homes (family and group homes). It will provide a listing of the rules and the respective phi coefficients. These
Key Indicators were obtained from rank ordering the total compliance scores into quartiles with the 25% highest
violation scores for facilities as the low group and the lowest 25% violation scores for facilities as the high group.
Each rule was compared to this result by their respective compliance level, either being in or out of compliance with
the rule. Once these data were prepared the formula in Table 4 was used to determine if the rule met the predictive
level. Separate analyses for generating Key Indicators were not run for Head Start or Group Homes because of the
insufficient number of programs in each category.
Centers (Child Care Centers and Head Start)(See Table 5 for a Summary)
All results are reported with the specific rule, p < .0001, and phi coefficient from the formula in Table 4.
K.A.R.28-4-126b1. Each person regularly caring for children shall have a health assessment conducted by a
licensed physician or by a nurse trained to perform health assessments. The health assessment shall be conducted no
earlier than one year before the date of employment or initial application for a license or certificate of registration, or
not later than 30 days after the date of employment or initial application. (phi = .59)
K.A.R.28-4-126c1. Each person living, working or regularly volunteering in the facility shall have a record of a
negative tuberculin test or x-ray obtained not more than two years before the employment or initial application, for a
license or certificate of registration or not later than 30 days after the date of employment or initial application. (phi = .62)
K.A.R.28-4-423a18. The premises shall be maintained in good condition and shall be clean at all times, free from
accumulated dirt and trash, and any evidence of vermin or rodent infestation. Each outdoor trash and garbage
container shall be covered, and the contents shall be removed at least weekly. (phi = .59)
K.A.R.28-4-423a23. Medicines, household poisons, and other dangerous substances and instruments shall be in
locked storage. (phi = .60)
K.A.R.28-4-428aa3. Each licensee shall ensure that orientation is completed by each staff member who
will be counted in the staff-child ratio and by each volunteer who will be counted in the staff-child ratio. Each staff
member and volunteer shall complete the orientation within seven calendar days after the date of employment or
volunteering and before the staff member or volunteer is given sole responsibility for the care and supervision of
children. (phi = .51)
K.A.R.28-4-428ac1. Each staff member counted in the staff-child ratio, each volunteer counted in the
staff-child ratio, and each program director shall obtain certification in pediatric first aid and in pediatric CPR as
specified in this subsection either before the date of employment or volunteering or not later than 30 calendar days
after the date of employment or volunteering. (phi = .53)
K.A.R.28-4-430c3. Each staff member shall be trained to observe symptoms of illness, neglect, and child abuse,
and shall observe each child's physical condition daily. (phi = .54)
K.A.R.28-4-437d. The outdoor play space shall be well drained and free of hazards. (phi = .59)
_______________________________________________________________ Footnote:
Child Care Centers (CCC) – The correlation between the Key Indicators and all the rules was .77.
Family Child Care (FCC) – The correlation between the Key Indicators and all the rules was .80. Both these results exceed the DMLMA© Thresholds for KI x CI (.70).
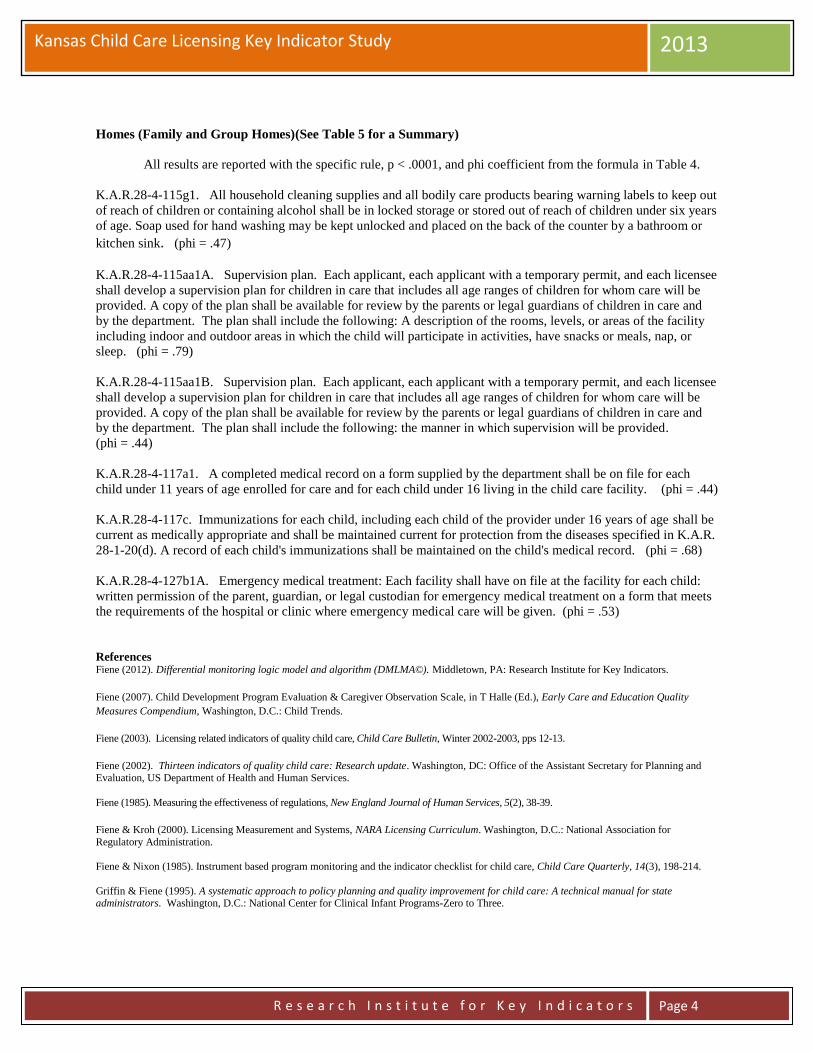
Kansas Child Care Licensing Key Indicator Study 2013
R e s e a r c h I n s t i t u t e f o r K e y I n d i c a t o r s
Page 4
Homes (Family and Group Homes)(See Table 5 for a Summary)
All results are reported with the specific rule, p < .0001, and phi coefficient from the formula in Table 4.
K.A.R.28-4-115g1. All household cleaning supplies and all bodily care products bearing warning labels to keep out
of reach of children or containing alcohol shall be in locked storage or stored out of reach of children under six years
of age. Soap used for hand washing may be kept unlocked and placed on the back of the counter by a bathroom or
kitchen sink. (phi = .47)
K.A.R.28-4-115aa1A. Supervision plan. Each applicant, each applicant with a temporary permit, and each licensee
shall develop a supervision plan for children in care that includes all age ranges of children for whom care will be
provided. A copy of the plan shall be available for review by the parents or legal guardians of children in care and
by the department. The plan shall include the following: A description of the rooms, levels, or areas of the facility
including indoor and outdoor areas in which the child will participate in activities, have snacks or meals, nap, or
sleep. (phi = .79)
K.A.R.28-4-115aa1B. Supervision plan. Each applicant, each applicant with a temporary permit, and each licensee
shall develop a supervision plan for children in care that includes all age ranges of children for whom care will be
provided. A copy of the plan shall be available for review by the parents or legal guardians of children in care and
by the department. The plan shall include the following: the manner in which supervision will be provided. (phi = .44)
K.A.R.28-4-117a1. A completed medical record on a form supplied by the department shall be on file for each
child under 11 years of age enrolled for care and for each child under 16 living in the child care facility. (phi = .44)
K.A.R.28-4-117c. Immunizations for each child, including each child of the provider under 16 years of age shall be
current as medically appropriate and shall be maintained current for protection from the diseases specified in K.A.R.
28-1-20(d). A record of each child's immunizations shall be maintained on the child's medical record. (phi = .68)
K.A.R.28-4-127b1A. Emergency medical treatment: Each facility shall have on file at the facility for each child:
written permission of the parent, guardian, or legal custodian for emergency medical treatment on a form that meets
the requirements of the hospital or clinic where emergency medical care will be given. (phi = .53)
References Fiene (2012). Differential monitoring logic model and algorithm (DMLMA©). Middletown, PA: Research Institute for Key Indicators.
Fiene (2007). Child Development Program Evaluation & Caregiver Observation Scale, in T Halle (Ed.), Early Care and Education Quality
Measures Compendium, Washington, D.C.: Child Trends.
Fiene (2003). Licensing related indicators of quality child care, Child Care Bulletin, Winter 2002-2003, pps 12-13.
Fiene (2002). Thirteen indicators of quality child care: Research update. Washington, DC: Office of the Assistant Secretary for Planning and
Evaluation, US Department of Health and Human Services.
Fiene (1985). Measuring the effectiveness of regulations, New England Journal of Human Services, 5(2), 38-39.
Fiene & Kroh (2000). Licensing Measurement and Systems, NARA Licensing Curriculum. Washington, D.C.: National Association for
Regulatory Administration.
Fiene & Nixon (1985). Instrument based program monitoring and the indicator checklist for child care, Child Care Quarterly, 14(3), 198-214.
Griffin & Fiene (1995). A systematic approach to policy planning and quality improvement for child care: A technical manual for state administrators. Washington, D.C.: National Center for Clinical Infant Programs-Zero to Three.

Kansas Child Care Licensing Key Indicator Study 2013
R e s e a r c h I n s t i t u t e f o r K e y I n d i c a t o r s
Page 5
Table 4: Kansas Key Indicator (KSKI) Formula Matrix
Key Indicator Statistical Methodology (Calculating the Phi Coefficient):
________________________________________________________________ A = High Group + Programs in Compliance on Specific Compliance Measure. B = High Group + Programs out of Compliance on Specific Compliance Measure. C = Low Group + Programs in Compliance on Specific Compliance Measure. D = Low Group + Programs out of Compliance on Specific Compliance Measure. W = Total Number of Programs in Compliance on Specific Compliance Measure. X = Total Number of Programs out of Compliance on Specific Compliance Measure. Y = Total Number of Programs in High Group. Z = Total Number of Programs in Low Group.
______________________________________________________________________ High Group = Top 25% of Programs in Compliance with all Compliance Measures. Low Group = Bottom 25% of Programs in Compliance with all Compliance Measures.
Phi Coefficient Range Characteristic of Indicator Decision
(+1.00) – (+.26) Good Predictor Include on KSKI (+.25) – (0) Too Easy Do not Include (0) – (-.25) Too Difficult Do not Include (-.26) – (-1.00) Terrible Predictor Do not Include
Providers In Compliance
Programs Out Of Compliance
Row Total
High Group A B Y
Low Group C D Z
Column Total W X Grand Total
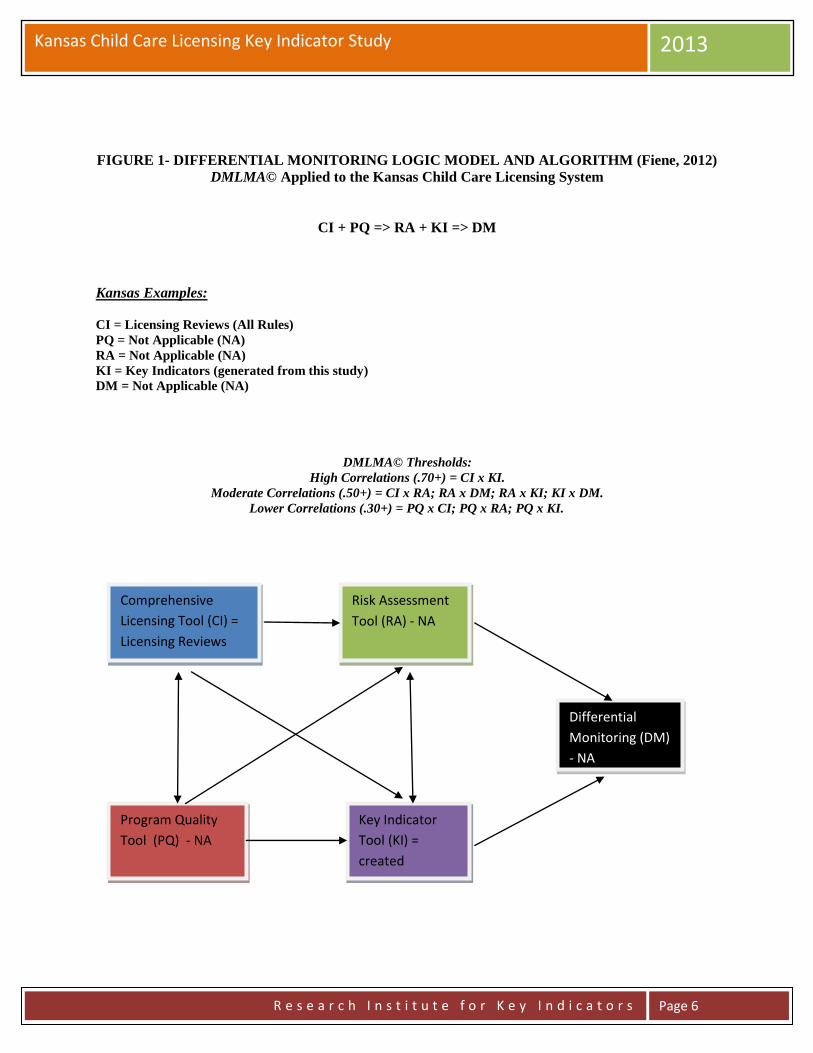
Kansas Child Care Licensing Key Indicator Study 2013
R e s e a r c h I n s t i t u t e f o r K e y I n d i c a t o r s
Page 6
FIGURE 1- DIFFERENTIAL MONITORING LOGIC MODEL AND ALGORITHM (Fiene, 2012)
DMLMA© Applied to the Kansas Child Care Licensing System
CI + PQ => RA + KI => DM
Kansas Examples:
CI = Licensing Reviews (All Rules)
PQ = Not Applicable (NA)
RA = Not Applicable (NA)
KI = Key Indicators (generated from this study)
DM = Not Applicable (NA)
DMLMA© Thresholds:
High Correlations (.70+) = CI x KI.
Moderate Correlations (.50+) = CI x RA; RA x DM; RA x KI; KI x DM.
Lower Correlations (.30+) = PQ x CI; PQ x RA; PQ x KI.
Comprehensive
Licensing Tool (CI) =
Licensing Reviews
Program Quality
Tool (PQ) - NA
Risk Assessment
Tool (RA) - NA
Key Indicator
Tool (KI) =
created
Differential
Monitoring (DM)
- NA

Kansas Child Care Licensing Key Indicator Study 2013
R e s e a r c h I n s t i t u t e f o r K e y I n d i c a t o r s
Page 7
Table 5 – Rule Numbers and Phi Coefficients for Centers and Homes
Centers
Rule Phi
K.A.R.28-4-126b1. .59
K.A.R.28-4-126c1. .62
K.A.R.28-4-423a18. .59 K.A.R.28-4-423a23. .60
K.A.R.28-4-428aa3. .51
K.A.R.28-4-428ac1. .53
K.A.R.28-4-430c3. .54
K.A.R.28-4-437d. .59
Homes
Rule Phi
K.A.R.28-4-115g1. .47
K.A.R.28-4-115aa1A. .79
K.A.R.28-4-115aa1B. .44
K.A.R.28-4-117a1. .44
K.A.R.28-4-117c. .68
K.A.R.28-4-127b1A. .53
For additional information regarding this report, please contact:
Richard Fiene, Ph.D., Director
Research Institute for Key Indicators
41 Grandview Drive
Middletown, PA. 17057
717-944-5868 Phone and Fax
http://pennstate.academia.edu/RickFiene

Wisconsin Program Monitoring Options Report - Fiene RIKI
R e s e a r c h I n s t i t u t e f o r K e y I n d i c a t o r s
Page 1
Wisconsin Department of Children and Youth Services Program Monitoring
Options Blueprint Report
Richard Fiene, Ph.D.
May 15, 2014
ABSTRACT
This report will provide a blueprint for consideration by Wisconsin’s Office of Children and Youth
Services regarding options for their program monitoring system. The report will be organized into the
following major headings: an introduction to program monitoring; how key indicators and risk
assessment fit into the larger program monitoring of human services; how key indicators and risk
assessment could be applied to Wisconsin’s system in particular; the technical aspects of differential
monitoring, risk assessment and key indicator methodology, the sample to be drawn from the population,
a timeline for this developmental effort; and potential cost savings from the approach. Many of the
examples drawn are from the child care/early care and education field rather than the child welfare/child
residential field because most of the best examples are occurring in child care and not child welfare at this
point in time. Hopefully, with this blueprint is implemented in children and youth services, we can begin
to change this fact.
INTRODUCTION
An effective and efficient program monitoring system is a goal of every state human service
agency in the USA. This has been an issue in the human services for over the past half century
as states grapple with increasing caseload sizes with shrinking resources. This report will
provide an overview to the topic and several options that the State of Wisconsin can begin to
explore related the program monitoring of children and youth services. The Risk Assessment,
Key Indicator, and Differential Program Monitoring Methodologies were developed to help
streamline the program monitoring of early care and education programs. It was first applied in
child care licensing (Fiene & Nixon, 1985) but has been used in many other service types, such
as: Head Start Performance Standards (Fiene, 2013a), National Accreditation (Fiene, 1996), and
child and adult residential programs (Kroh & Melusky, 2010). The methodologies are based
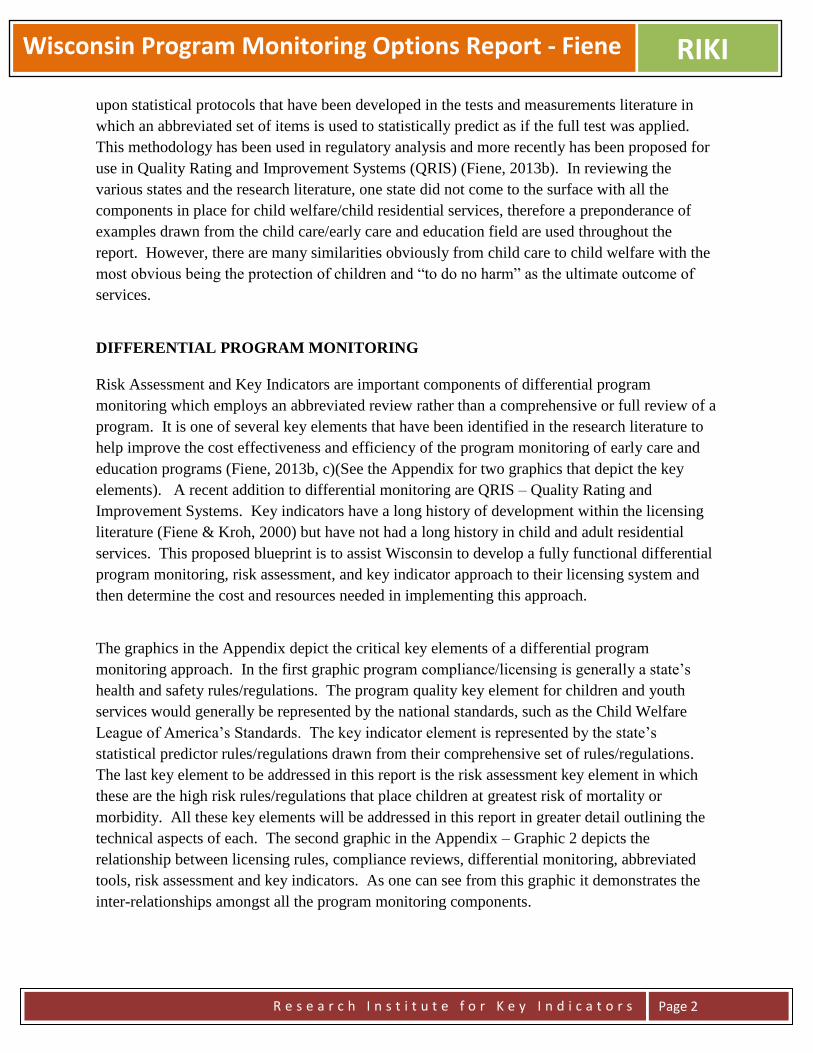
Wisconsin Program Monitoring Options Report - Fiene RIKI
R e s e a r c h I n s t i t u t e f o r K e y I n d i c a t o r s
Page 2
upon statistical protocols that have been developed in the tests and measurements literature in
which an abbreviated set of items is used to statistically predict as if the full test was applied.
This methodology has been used in regulatory analysis and more recently has been proposed for
use in Quality Rating and Improvement Systems (QRIS) (Fiene, 2013b). In reviewing the
various states and the research literature, one state did not come to the surface with all the
components in place for child welfare/child residential services, therefore a preponderance of
examples drawn from the child care/early care and education field are used throughout the
report. However, there are many similarities obviously from child care to child welfare with the
most obvious being the protection of children and “to do no harm” as the ultimate outcome of
services.
DIFFERENTIAL PROGRAM MONITORING
Risk Assessment and Key Indicators are important components of differential program
monitoring which employs an abbreviated review rather than a comprehensive or full review of a
program. It is one of several key elements that have been identified in the research literature to
help improve the cost effectiveness and efficiency of the program monitoring of early care and
education programs (Fiene, 2013b, c)(See the Appendix for two graphics that depict the key
elements). A recent addition to differential monitoring are QRIS – Quality Rating and
Improvement Systems. Key indicators have a long history of development within the licensing
literature (Fiene & Kroh, 2000) but have not had a long history in child and adult residential
services. This proposed blueprint is to assist Wisconsin to develop a fully functional differential
program monitoring, risk assessment, and key indicator approach to their licensing system and
then determine the cost and resources needed in implementing this approach.
The graphics in the Appendix depict the critical key elements of a differential program
monitoring approach. In the first graphic program compliance/licensing is generally a state’s
health and safety rules/regulations. The program quality key element for children and youth
services would generally be represented by the national standards, such as the Child Welfare
League of America’s Standards. The key indicator element is represented by the state’s
statistical predictor rules/regulations drawn from their comprehensive set of rules/regulations.
The last key element to be addressed in this report is the risk assessment key element in which
these are the high risk rules/regulations that place children at greatest risk of mortality or
morbidity. All these key elements will be addressed in this report in greater detail outlining the
technical aspects of each. The second graphic in the Appendix – Graphic 2 depicts the
relationship between licensing rules, compliance reviews, differential monitoring, abbreviated
tools, risk assessment and key indicators. As one can see from this graphic it demonstrates the
inter-relationships amongst all the program monitoring components.

Wisconsin Program Monitoring Options Report - Fiene RIKI
R e s e a r c h I n s t i t u t e f o r K e y I n d i c a t o r s
Page 3
KEY INDICATORS APPLIED TO WISCONSIN’S CHILDREN AND YOUTH
LICENSING SYSTEM
Before beginning the description of each of the key elements it is important to note that there are
some significant challenges because of the psychometric properties of licensing data such as the
severe skewness and kurtosis present in state licensing data systems. These challenges will be
addressed later in this blueprint in how to deal with skewness and kurtosis1.
As a footnote, the risk assessment and key indicators can eventually be tied to the professional
development/training/technical assistance system to link resources to specific needs of the
programs. It also has the capability of tying them to specific child outcomes at some point in the
future. This would be accomplished in the full implementation of the Differential Monitoring
Logic Model and Algorithm (DMLMA©) as depicted in the Appendix – Graphic 1.
TECHNICAL ASPECTS OF THE KEY INDICATOR METHODOLOGY
This section provides the technical and statistical aspects of the key indicator methodology. It
will provide the roadmap in taking the Wisconsin licensing data base through the necessary steps
to generating the respective key indicators.
One of the first steps is to sort the data into high and low groups, generally the highest and
lowest ratings can be used for this sorting. In very large states this is done on a sampling basis
which will be described later in the blueprint. Frequency data will be obtained on those
programs in the top level (usually top 20-25%) and the bottom level (usually the bottom 20-
25%). The middle levels are not used for the purposes of these analyses. These two groups (top
level & the bottom level) are then compared to how each program scored on each item within the
specific assessment tool (see Figure 1). An example is provided in Figure 2 from a previous
study conducted by the author (see Figure 2).
Figure 1 Providers In
Compliance
or Top 25%
Programs Out
Of Compliance
or Bottom 25%
Row Total
Highest level
(top 20-25%)
A B Y
Lowest level
(bottom 20-25%)
C D Z
Column Total W X Grand Total

Wisconsin Program Monitoring Options Report - Fiene RIKI
R e s e a r c h I n s t i t u t e f o r K e y I n d i c a t o r s
Page 4
Figure 2 depicts that all programs that were in the top 25% were also in the highest rating while
the bottom 25% were also in the lowest rating. The data depicted in Figure 2 are taken from
studies completed in Pennsylvania in 2002 (Fiene, etal) and 2006 (Barnard, Smith, Fiene &
Swanson) in which their quality rating and improvement system, Keystone STARS, was
validated. The reason for selecting this particular item from the ECERS – Early Childhood
Environment Rating Scale is that it demonstrates a perfect phi coefficient in discriminating
between the highest level and the lowest level. Most, if not all, of the licensing items that will
attain the threshold levels to become key indicators will not approach this phi coefficient.
Figure 2 – Pa.
Study (Fiene,
etal, 2002).
Providers In
Compliance
or Top 25%
Programs Out
Of Compliance
or Bottom 25%
Row Total
Highest Star
level in Pa.
117 0 117
Lowest Star
level in Pa.
0 35 35
Column Total 117 35 152
Once the data are sorted in the above matrix, the following formula (Figure 3) is used to
determine if Item 16 is a key indicator or not by calculating its respective Phi coefficient. Please
refer back to Figure 1 for the actual placement within the cells and Figure 2 for the data within
the cells. The legend (Figure 4) below the formula shows how the cells are defined.
Figure 3 – Formula for Phi Coefficient
Figure 4 – Legend for the Cells within the Phi Coefficient
A = High Group + Programs in Compliance on Specific Compliance Measure. B = High Group + Programs out of Compliance on Specific Compliance Measure. C = Low Group + Programs in Compliance on Specific Compliance Measure. D = Low Group + Programs out of Compliance on Specific Compliance Measure. W = Total Number of Programs in Compliance on Specific Compliance Measure. X = Total Number of Programs out of Compliance on Specific Compliance Measure. Y = Total Number of Programs in High Group. Z = Total Number of Programs in Low Group.
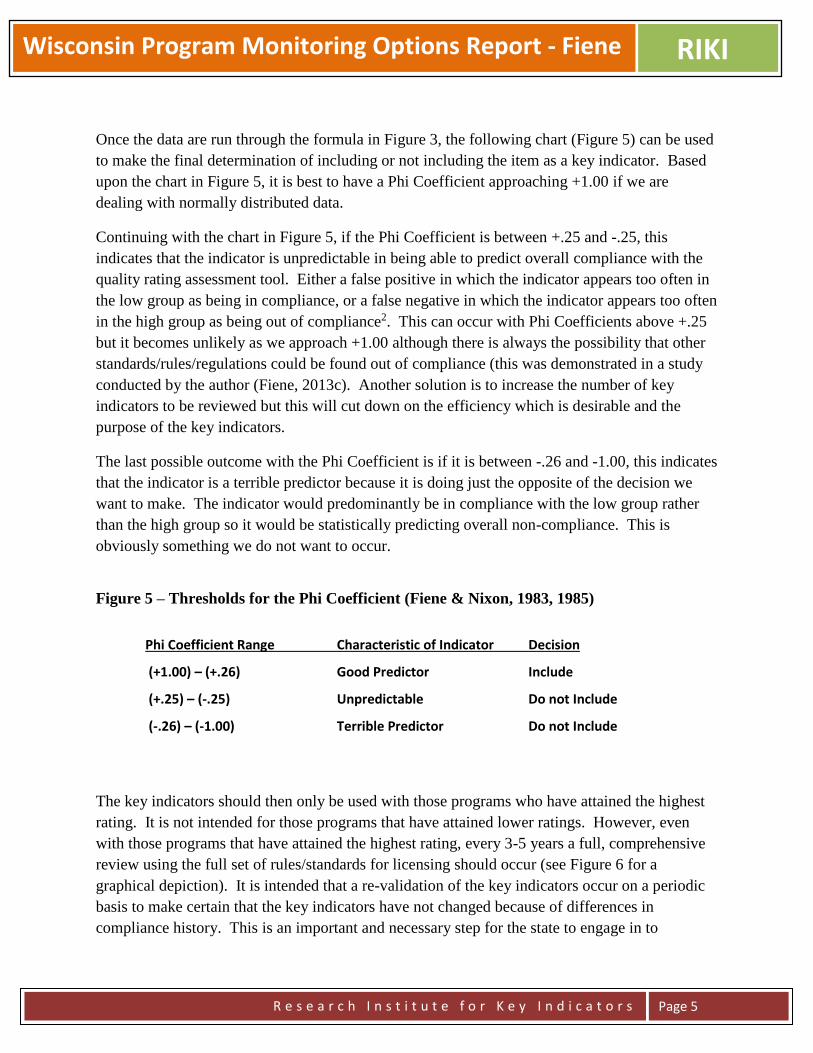
Wisconsin Program Monitoring Options Report - Fiene RIKI
R e s e a r c h I n s t i t u t e f o r K e y I n d i c a t o r s
Page 5
Once the data are run through the formula in Figure 3, the following chart (Figure 5) can be used
to make the final determination of including or not including the item as a key indicator. Based
upon the chart in Figure 5, it is best to have a Phi Coefficient approaching +1.00 if we are
dealing with normally distributed data.
Continuing with the chart in Figure 5, if the Phi Coefficient is between +.25 and -.25, this
indicates that the indicator is unpredictable in being able to predict overall compliance with the
quality rating assessment tool. Either a false positive in which the indicator appears too often in
the low group as being in compliance, or a false negative in which the indicator appears too often
in the high group as being out of compliance2. This can occur with Phi Coefficients above +.25
but it becomes unlikely as we approach +1.00 although there is always the possibility that other
standards/rules/regulations could be found out of compliance (this was demonstrated in a study
conducted by the author (Fiene, 2013c). Another solution is to increase the number of key
indicators to be reviewed but this will cut down on the efficiency which is desirable and the
purpose of the key indicators.
The last possible outcome with the Phi Coefficient is if it is between -.26 and -1.00, this indicates
that the indicator is a terrible predictor because it is doing just the opposite of the decision we
want to make. The indicator would predominantly be in compliance with the low group rather
than the high group so it would be statistically predicting overall non-compliance. This is
obviously something we do not want to occur.
Figure 5 – Thresholds for the Phi Coefficient (Fiene & Nixon, 1983, 1985)
The key indicators should then only be used with those programs who have attained the highest
rating. It is not intended for those programs that have attained lower ratings. However, even
with those programs that have attained the highest rating, every 3-5 years a full, comprehensive
review using the full set of rules/standards for licensing should occur (see Figure 6 for a
graphical depiction). It is intended that a re-validation of the key indicators occur on a periodic
basis to make certain that the key indicators have not changed because of differences in
compliance history. This is an important and necessary step for the state to engage in to
Phi Coefficient Range Characteristic of Indicator Decision
(+1.00) – (+.26) Good Predictor Include
(+.25) – (-.25) Unpredictable Do not Include
(-.26) – (-1.00) Terrible Predictor Do not Include

Wisconsin Program Monitoring Options Report - Fiene RIKI
R e s e a r c h I n s t i t u t e f o r K e y I n d i c a t o r s
Page 6
ascertain the overall validity and reliability of the assessment system. Also there should not have
been any major changes in the program while the key indicators are being administered, such as
the director/administrator leaving or a large percentage of staff leaving or caseloads increasing
significantly, or a change in the licensing status of the program.
Figure 6 - Proposed DMLMA System with Key Indicators (KI)
Use of Wisconsin Key Indicators (WKI) for Licensing with a Full Review every 4th Year
1yr 1yr 1yr 1yr 1yr 1yr
TECHNICAL ASPECTS OF THE RISK ASSESSMENT METHODOLOGY
The risk assessment methodology is very different from the key indicator methodology in that
compliance history data are not utilized but rather a best practice ranking according to risk is
used to determine which rules become core rules which have the greatest likelihood to place
children at significant risk of morbidity or mortality. This is done by having a group of experts
rank order all the rules on a Likert Scale from low risk to high risk of mortality or morbidity that
non-compliance with the rule places children at. This is generally done on a 1-10 scale with 1 =
low risk; 5 = medium risk; and 10 = high risk (see Figure 6A). The experts selected include but
are not limited to licensing staff, policy makers, researchers, providers, advocacy groups,
parents, and other significant stakeholders who will be impacted by the weighting of the rules.
Figure 6A – Example of a Likert Scale for Measuring Risk to Children
Low Risk Medium Risk High Risk
1 2 3 4 5 6 7 8 9 10
Once the data are collected from all the experts, it is averaged for each rule to determine its
relative rank in comparison to all the other rules. A significantly high threshold or cut off point
is determined so that no more than 5-10% of the rules become core rules. These core rules can
then be used in a differential monitoring approach (to be described more fully in the next section)
and/or with the key indicators to complete abbreviated reviews of child welfare programs. It is
recommended that such a practice of using both core rules and key indicators be used together
WKI
WKI
WKI
WKI
FULL
REVIEW
WKI
WKI

Wisconsin Program Monitoring Options Report - Fiene RIKI
R e s e a r c h I n s t i t u t e f o r K e y I n d i c a t o r s
Page 7
because than the state has the benefits of both methodologies in measuring risk and being able to
statistically predict overall compliance with a very short list of rules.
TECHNICAL ASPECTS DIFFERENTIAL MONITORING METHODOLOGY
There are a couple of other key technical aspects that need to be in place for a differential
monitoring system to work. The Differential Monitoring Logic Model and Algorithm
(DMLMA©)3(see the Appendix) is a 4th generational Early Childhood Program Quality
Indicator Model4 (ECPQIM4©) in which the major monitoring systems in early care and
education are integrated conceptually so that the overall early care and education system can be
assessed and validated. With this new model, it is now possible to compare results obtained
from licensing systems, quality assurance systems, risk assessment systems, key indicator
systems, technical assistance, and child protection outcome systems. The various approaches to
validation are interposed within this model and the specific expected correlational thresholds that
should be observed amongst the key elements of the model are suggested (see Figure 6B).
Figure 6B – Inter-Correlational Threshold Matrix
PQ RA KI DM PD CO
CI 0.3 0.5 0.7 0.5 0.5 0.3
PQ 0.3 0.3 0.3
RA 0.5 0.5 0.5 0.3
KI 0.5 0.5 0.3
DM 0.5
PD 0.3
Key Elements (see the Appendix): CI = state or federal standards, usually rules or regulations.
PQ = CWLA Standards or a Quality Assurance System. RA = risk assessment tools/systems in

Wisconsin Program Monitoring Options Report - Fiene RIKI
R e s e a r c h I n s t i t u t e f o r K e y I n d i c a t o r s
Page 8
which only the most critical rules/standards are measured. KI = key indicators in which only
predictor rules/standards are measured. DM = differential monitoring decision making in which
it is determined if a program is in compliance or not and the number of visits/the number of
rules/standards are ascertained from a scoring protocol. PD = technical assistance/training
and/or professional development system which provides targeted assistance to the program based
upon the DM results. CO = child outcomes which assesses how well the children are protected
which is the ultimate goal of the system.
Once the above key elements are in place, it is then possible to look at the relationships amongst
them to determine if the system is operating as it was intended. This is done through a validation
of the overall system and assessing the inter-correlations (Table 6B) to determine that the DM
system is improving the overall protection of the children it serves.
Wisconsin could use the following plan to implement the above approach:
STATE AGENCY PLAN (These Steps can be viewed as an overall plan as outlined in Zellman
& Fiene (2012):
The first step in utilizing the DMLMA for a state is to take a close look at its Comprehensive
Licensing Tool (CI) that it uses to collect violation data on all rules with all facilities in its
respective state. If the state does not utilize a tool or checklist or does not review all violation
data than it needs to consider these changes because the DMLMA is based upon an Instrument
Based Program Monitoring System (IPM) which utilizes tools/checklists to collect data on all
rules.
The second step for the state is to compare their state’s rules with the National Standards (such
as the CWLA National Standards for Best Practices) to determine the overlap and coverage
between the two. This is the first approach to validation which involves Standards review
(Zellman & Fiene, 2012).
The third step for the state is to compare the results from the CI with the RA tools. This step is
the second approach to validation which involves Measures (Zellman & Fiene, 2012). The
correlation between CI and RA should be at the .50 level or higher (.50+)(see Figure 6B).
The fourth step is for the state to generate a Key Indicator (KI) tool from the CI data base.
Please see Fiene & Nixon (1985) and Fiene & Kroh (2000) for a detailed explanation of the
methodology for generating a KI tool. This step is also part of the second approach to validation
which involves Measures. The correlation between the CI and KI should be very high (.70+)
because the KI is a subset of predictor rules taken from the CI data base.
The fifth step for the state is to use the RA and KI tools together to determine overall compliance
of facilities and how often and which rules will be monitored for future visits. This is the basic

Wisconsin Program Monitoring Options Report - Fiene RIKI
R e s e a r c h I n s t i t u t e f o r K e y I n d i c a t o r s
Page 9
component of a Differential Monitoring (DM) approach and continues the second approach to
validation (Measures). Also, this step should drive decisions within the technical
assistance/training/professional development (PD) system in what resources are allocated to a
particular facility. It would be expected that moderate correlations (.50+) would be found
amongst RA, KI, DM, and PD.
The sixth and final step for the state is to compare the results from the various monitoring tools
(CI, PQ, RA, KI) with any child development outcome (CO) data they collect. This is a
relatively new area and few, if any, states at this point have this capability on a large scale.
This step is the fourth approach to validation which involves Outcomes (Zellman & Fiene,
2012). The correlations between CI, PQ, RA, KI and CO will be on the lower end (.30+)
because there are so many other variables that impact the child other than child welfare services.
The last step is to present a logic model which depicts how a differential monitoring system
could potentially be actually used in Wisconsin (see Figure 6C).
Figure 6C – Logic Model for Compliance Decisions
Compliance Decisions:
Core Indicators = Core Rules + Key Indicators – this becomes a screening tool to determine if a program receives a AV or FV visit.
Core Indicators (100%) = the next visit is a Abbreviated Visit.. Every 3-4 years a Full Licensing Visit is conducted. Core Indicators (not 100%) = The next visit is a Full Licensing Visit where all rules are reviewed.
Compliance = 96%+ with all rules which indicates substantial to full compliance with all rules and 100% with Core Indicators. The next visit is
an Abbreviated Visit. Non-compliance = less than 96% with all rules which indicates lower compliance with all rules. The next visit is a Full Visit Study.
Core Indicators
Screener = CR +
KI
Abbreviated
Visit (AV)
Full Visit
(FV)
Abbreviated
Visit (AV)
Abbreviated
Visit (AV)
Full Visit
(FV)
Full Visit
(FV)

Wisconsin Program Monitoring Options Report - Fiene RIKI
R e s e a r c h I n s t i t u t e f o r K e y I n d i c a t o r s
Page 10
SAMPLE
Generally a sample is drawn from the population of early care and education facilities in
respective states. Wisconsin will not be any different because of the size of the overall child
welfare program. A random sample will be selected that represents the state population of child
welfare programs. This will be determined by the number of programs, how the programs are
distributed throughout the state, the size of the programs, the type of programs, etc… This will
need to be determined once the actual implementation of this blueprint report is started. The
author of this report can assist Wisconsin staff in how best to select the sample of programs.
TIMELINE
As soon as all the Wisconsin child welfare/child residential programs have gone through their
assessment phase, it will be possible to do the calculations to determine the Phi Coefficients and
generate the key indicators. I am guessing that this should not take any longer than 1 year but
could be completed in a much shorter period of time if the assessments on individual programs
could be moved up (see Figure 7). The analytical phase should take no longer than a month with
an additional month to write up the report. A face to face presentation of the analyses could be
done after these two months.
The timeline presented in Figure 7 can be adjusted to the specific needs for the Wisconsin
system. The timeline is based upon previous projects and the average time to generate risk
assessment core rules and key indicators. Another consideration or task is the development of
the policies and procedures to be developed and implemented regarding the use of key
indicators. This was not specifically listed on the timeline because it is something that is
generally developed throughout the project with feedback from all the stakeholders who will be
impacted by the use of this new approach to assessment and monitoring.
Figure 7 - WISCONSIN DMLMA PROJECT TIMELINE
TASK
MONTHS
Collect Data M1-M3 Sort Data
M2-3 Run Analyses
M3-5 Generate KI/RA
M6 Train on KI/RA
M6-7 KI/RA Reliable
M7-9 Implementation
M10-12

Wisconsin Program Monitoring Options Report - Fiene RIKI
R e s e a r c h I n s t i t u t e f o r K e y I n d i c a t o r s
Page 11
Legend:
KI – Key Indicators
RA – Risk Assessment
Collect Data – identify participant programs via sampling for KI and the stakeholders for RA.
Sort Data – KI - the individual programs are sorted into high and low groups representing the top 25% and the bottom 25% of
programs as they have scored on the respective rules/standards.
Run Analyses – KI - each individual item within each of the assessment tools for every program will be compared to the sorting
process of the high and low groups. RA – aggregate data into means for each rule, rank order the rules.
Generate KI/RA – a 2 x 2 matrix is constructed and the key indicators (KI) are generated from this matrix through the use of a
phi coefficient. A final report will be delivered to Wisconsin executive staff for both KI and RA core indicator rules.
Training on KI/RA – all staff who will be using the KI/RA will be trained on its use.
KI/RA Reliability – reliability will be established by having two staff go out together and administer the key indicators
separately and comparing their results.
Implementation – once reliability has been established, full implementation will begin.
COST SAVINGS
Again based upon previous studies most recently completed in California in 2010
(http://www.myccl.ca.gov/res/docs/12022010HandoutStakeholderMeeting.pdf), time savings of 50%
have been attained by using a key indicator or abbreviated tool in completing assessments. It
only makes sense that if an assessment can be completed in one hour rather than 2 – 4 hours that
a state will see time savings. It is being assumed that equivalent savings should also be the case
with Wisconsin’s licensing system although this cannot be made certain until the new key
indicator or abbreviated tool is actually used for a period of time. Once the new key indicators
are used for several months, comparisons could be made to when the full assessments were done.
CONCLUSION, OPTIONS, AND RECOMMENDATIONS
This blueprint report has given the basic empirical parameters to develop a differential
monitoring, risk assessment, and key indicator approach to Wisconsin’s Children and Youth
Licensing system4. By following this blueprint Wisconsin staff should be able to fully
implement the approach. Wisconsin staff would also need to determine if they have the internal
capability for the development of the key indicators or if there will be the need to outsource
certain aspects of the development. This will be an important consideration as Wisconsin moves
forward with this project. I have provided two options for your consideration in moving
forward.
Option 1 – Development of System Internally:
This would require either information systems or research & evaluation staff to analyze the data,
generate core key indicator rules, and training of staff. I could provide the necessary consulting
services to help the staff work through the methodology. This would probably require at least
one face to face meeting with regular monthly conference calls between myself and staff.
Discussions of the formatting of data and the types of analyses would be discussed and

Wisconsin Program Monitoring Options Report - Fiene RIKI
R e s e a r c h I n s t i t u t e f o r K e y I n d i c a t o r s
Page 12
demonstrated. The overall cost to develop the system internally with NARA support would be
approximately $100,000.
Option 2 – Development of System Externally:
In this option I could do all the methodological work demonstrating how I would need the data
sent to me, the analytical work in generating core key indicator rules, a report detailing the
methodology and results. The only thing that Wisconsin staff would need to do is get the data to
me, all other aspects of what is delineated in the timeline in Figure 7 would be completed by me.
This would probably require several face to face trips to explain the process, the results, and do
training of staff. Once everything was in place, Wisconsin staff would have a fully implemented
system. The overall cost to develop the system externally with NARA support would be
approximately $300,000.
Whatever option is selected the following recommendations are provided if Wisconsin staff
want to develop a program monitoring system based upon empirical data:
1) Wisconsin should move forward with enhancing their differential monitoring approach
in order to institute potential cost savings and reallocation of resources based upon
those cost savings.
2) Develop and implement a key indicator approach based upon the methodology
described in this blueprint.
3) Develop and implement a risk assessment approach based upon the methodology
described in this blueprint.
4) A staff caseload analysis should be completed based upon NARA’s Licensing
Workload Assessment in order to determine the exact number of additional staff
needed to fully implement a Differential Monitoring Approach.

Wisconsin Program Monitoring Options Report - Fiene RIKI
R e s e a r c h I n s t i t u t e f o r K e y I n d i c a t o r s
Page 13
Notes:
1. The reason for pointing out the need to have a higher Phi Coefficient than what has been reported previously
(Fiene & Nixon, 1983, 1985) is the fact that the dichotomization of data should only be used with skewed data
and not normally distributed data because it will accentuate differences. However, since the purpose of the
dichotomization of data is only for sorting into a high and low group, it would appear to be acceptable for this
purpose (MacCallun, etal, 2002. On the practice of dichotomization of quantitative variables, Psychological
Methods, 7, 1, 19-40.).
2. These results would show an increase in cells B and C in Figure 1 which is undesirable; it should
always be the case where A + D > B + C for key indicators to maintain their predictive validity. The distinction
between making decisions with skewed (Licensing) as versus normally distributed (ERS) data is an important
one because there is a greater likelihood with skewed data of introducing less than optimal programs into the
high group when sorting programmatic data into high and low groups. This then makes it more difficult to
identify the best programs. However, because of the distribution with skewed data the same cannot be said with
the low group in which case it is relatively easy to identify the problem programs. This is not as much of a
concern when the data are more normally distributed in which it is relatively easy to identify both the optimal
and problem programs. This is an excellent example of the need of weighting of standards in order to increase
the normal distribution of the data.
3. It is important to note that many of the examples are drawn from the child care research literature and not
from the child welfare research literature. The reason for this is most of the empirical basis for the development
of these methodologies was completed in child care over the past 40 years. It is important for the reader of this
report to keep this in mind and to make the necessary translations to the child welfare literature research base.
For example, when I describe the national health and safety standards in child care, the reader should be
thinking of the CWLA national standards for the various child welfare service types. QRIS systems can
translate to child welfare systems that locally have been built upon generic licensing systems. The DMLMA
model is a generic model for all human services and not only for child care, so the reader should be able to
make the translation from child care to child welfare.
4. There are two publications that are more pertinent to children & youth services and child welfare that I wrote
back in the 1980’s the Wisconsin staff may be interested in (Fiene & McDonald, (1987), Instrument Based
Program Monitoring and Indicator Checklist for Child Welfare, and Fiene (1981), Conceptual Framework for
Program Monitoring).
For additional information regarding this Blueprints Report, please contact:
Richard Fiene, Ph.D., Director/President
Research Institute for Key Indicators (RIKI)
41 Grandview Drive
Middletown, PA. 17057
717-944-5868 Phone and Fax
http://RIKInstitute.wikispaces.com

Wisconsin Program Monitoring Options Report - Fiene RIKI
R e s e a r c h I n s t i t u t e f o r K e y I n d i c a t o r s
Page 14
REFERENCES AND ADDITIONAL RELATED READINGS REGARDING DIFFERENTIAL
MONITORING, RISK ASSESSMENT, AND KEY INDICATOR METHODOLOGIES:
Barnard, Smith, Fiene, Swanson (2006). Evaluation of Pennsylvania’s Keystone STARS Quality
Rating and Improvement System, Pittsburgh: Pennsylvania, Office of Child Development.
Fiene (2013a). A comparison of international child care and US child care using the Child Care
Aware – NACCRRA (National Association of Child Care Resource and Referral Agencies) child
care benchmarks, International Journal of Child Care and Education Policy, 7(1), 1-15.
Fiene (2013b). Differential monitoring logic model and algorithm. Middletown: Pennsylvania,
Research Institute for Key Indicators.
Fiene (2013c). Head Start Key Indicators. Middletown: Pennsylvania, Research Institute for Key
Indicators.
Fiene (2013d). Kansas Child Care Key Indicators. Middletown: Pennsylvania, Research Institute
for Key Indicators.
Fiene (2013e). Validation of Georgia’s core rule differential monitoring system. Middletown:
Pennsylvania, Research Institute for Key Indicators.
Fiene (2007). Child Development Program Evaluation & Caregiver Observation Scale, in T Halle
(Ed.), Early Care and Education Quality Measures Compendium, Washington, D.C.: Child
Trends.
Fiene (2003). Licensing related indicators of quality child care, Child Care Bulletin, winter
2002-2003, pps 12-13.
Fiene (2002a). Thirteen indicators of quality child care: Research update. Washington, DC:
Office of the Assistant Secretary for Planning and Evaluation, US Department of Health and
Human Services.
Fiene (2002b). Improving child care quality through an infant caregiver mentoring project, Child
and Youth Care Forum, 31(2), 75-83.
Fiene, Iutcovich, Johnson, & Koppel (1998). Child day care quality linked to opportunities for
professional development: An applied community psychology example. Community Psychologist,
31(1), 10-11.
Fiene (1996). Using a statistical-indicator methodology for accreditation, in NAEYC
Accreditation: A Decade of Learning and the Years Ahead, S. Bredekamp & B. Willer, editors,
Washington, D.C.: National Association for the Education of Young Children.
Fiene (1995). Utilizing a statewide training system to improve child day care quality: The other
system in a program quality improvement model. Child Welfare, Volume LXXIV, #6, November-
December, 1189-1201.

Wisconsin Program Monitoring Options Report - Fiene RIKI
R e s e a r c h I n s t i t u t e f o r K e y I n d i c a t o r s
Page 15
Fiene (1985). Measuring the effectiveness of regulations, New England Journal of Human
Services, 5(2), 38-39.
Fiene (1981). A new tool for day care monitoring introduced by children's consortium,
Evaluation Practice, 1(2), 10-11.
Fiene, Greenberg, Bergsten, Carl, Fegley, & Gibbons (2002). The Pennsylvania early childhood
quality settings study, Harrisburg, Pennsylvania: Governor’s Task Force on Early Care and
Education.
Fiene & Kroh (2000). Licensing Measurement and Systems, NARA Licensing Curriculum.
Washington, D.C.: National Association for Regulatory Administration.
Fiene & Nixon (1985). Instrument based program monitoring and the indicator checklist for child
care, Child Care Quarterly, 14(3), 198-214.
Griffin & Fiene (1995). A systematic approach to policy planning and quality improvement for
child care: A technical manual for state administrators. Washington, D.C.: National Center for
Clinical Infant Programs-Zero to Three.
Kontos & Fiene (1987). Child care quality, compliance with regulations, and children's
development: The Pennsylvania Study, in Quality in Child Care: What Does Research Tell Us?
Phillips, editor, Washington, D.C.: National Association for the Education of Young Children.
Zellman, G. L. and Fiene, R. (2012). Validation of Quality Rating and Improvement Systems for
Early Care and Education and School-Age Care, Research-to-Policy, Research-to-Practice Brief
OPRE 2012. Washington, DC: Office of Planning, Research and Evaluation, Administration for
Children and Families, U.S. Department of Health and Human Services
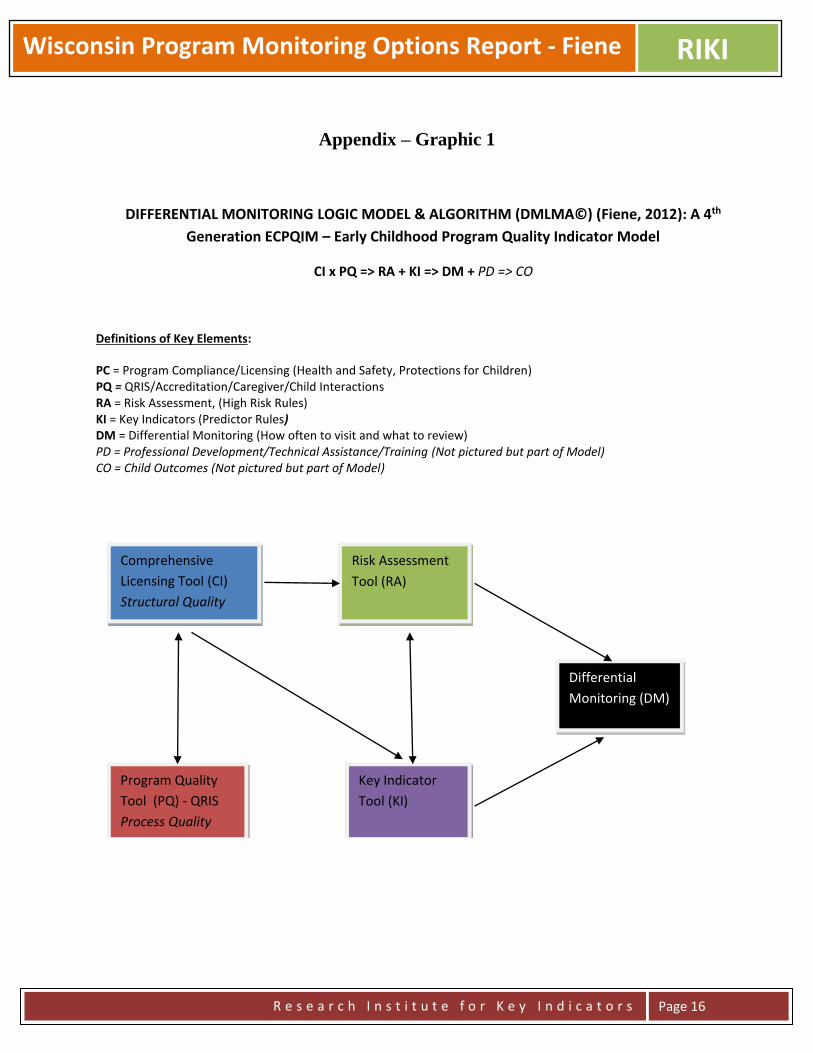
Wisconsin Program Monitoring Options Report - Fiene RIKI
R e s e a r c h I n s t i t u t e f o r K e y I n d i c a t o r s
Page 16
Appendix – Graphic 1
DIFFERENTIAL MONITORING LOGIC MODEL & ALGORITHM (DMLMA©) (Fiene, 2012): A 4th
Generation ECPQIM – Early Childhood Program Quality Indicator Model
CI x PQ => RA + KI => DM + PD => CO
Definitions of Key Elements:
PC = Program Compliance/Licensing (Health and Safety, Protections for Children) PQ = QRIS/Accreditation/Caregiver/Child Interactions RA = Risk Assessment, (High Risk Rules) KI = Key Indicators (Predictor Rules) DM = Differential Monitoring (How often to visit and what to review) PD = Professional Development/Technical Assistance/Training (Not pictured but part of Model) CO = Child Outcomes (Not pictured but part of Model)
Comprehensive
Licensing Tool (CI)
Structural Quality
Program Quality
Tool (PQ) - QRIS
Process Quality
Risk Assessment
Tool (RA)
Key Indicator
Tool (KI)
Differential
Monitoring (DM)

Wisconsin Program Monitoring Options Report - Fiene RIKI
R e s e a r c h I n s t i t u t e f o r K e y I n d i c a t o r s
Page 17
Appendix – Graphic 2 - Licensing Rules, Compliance
Reviews, Differential Monitoring, Abbreviated Tools, Risk Assessment, and Key Indicators
All Licensing Rules – Full
Compliance Reviews
Differential Monitoring
How Often to Visit? What is Reviewed?
Frequency Abbreviated
Tool
More
Often
Less
Often
Risk
Assessment
Weights
Key
Indicators
Predictors

ECELS ITQIP Pre-Test Report - Fiene RIKI
R e s e a r c h I n s t i t u t e f o r K e y I n d i c a t o r s
Page 1
ECELS Infant Toddler Program Quality Improvement Project (ITQIP)
Report of Pre-Test Data Collection
Richard Fiene, Ph.D.
August 1, 2014
ABSTRACT
This brief report will provide an analysis of the sites selected as part of the Infant Toddler Program
Quality Improvement Project (ITQIP) in the Pre-Test data collection phase.
INTRODUCTION
This report is the initial analysis looking at the pre-test scores between the 16 intervention sites
and the 16 control sites. This will be a descriptive report demonstrating the likenesses and
differences between the two groups.
The evaluation plan (see Figure 1 for the Logic Model Display) is a classic randomly assigned
clinical trial in which a group of child care programs will be randomly assigned to the
intervention group in receiving the specific training and technical assistance specific to the
selected CFOC3 standards. A comparison group also randomly assigned will receive the typical
training and technical assistance that is available through the state training system. These two
groups will be compared on the pre-test for equivalency and then one year later in a post-test
format. At this point the intervention group will be switched to a comparison format and the
comparison group will become the intervention group. If funding can be found to pay for it, a
second post-test would be performed at this data point to determine the latent effects of the
training/technical assistance.

ECELS ITQIP Pre-Test Report - Fiene RIKI
R e s e a r c h I n s t i t u t e f o r K e y I n d i c a t o r s
Page 2
Figure 1: LOGIC MODEL that supports the evaluation plan
Outputs Intervention Group Comparison Gr
Input/Resources
Outputs Intervention Gr Comparison Group
RESULTS of Pre-Test
Intervention Group
The range in scores was 175 to 267 with an average score of 208 out of a possible 322 points
(65%).
Control Group
The range in scores was 164 to 271 with an average score of 219 out of a possible 322 points
(68%).
The results clearly demonstrate that there are no significant differences between the two groups
on the pre-test scores with the exception of three items (SS 240, CA310, CA42).
EACH CFOC
STANDARD
Pre Test
Data
Pre Test
Data
Post Test
Data
2nd Post
Test Data
Post Test
Data
2nd Post
Test Data
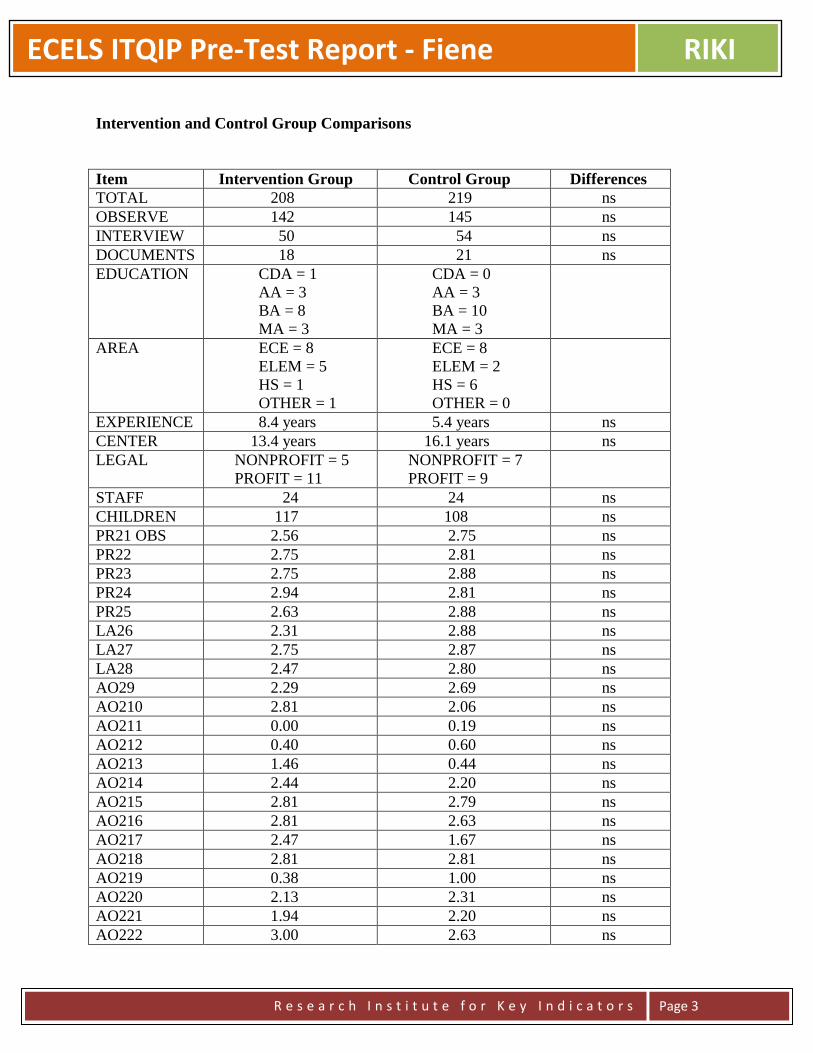
ECELS ITQIP Pre-Test Report - Fiene RIKI
R e s e a r c h I n s t i t u t e f o r K e y I n d i c a t o r s
Page 3
Intervention and Control Group Comparisons
Item Intervention Group Control Group Differences
TOTAL 208 219 ns
OBSERVE 142 145 ns
INTERVIEW 50 54 ns
DOCUMENTS 18 21 ns
EDUCATION CDA = 1
AA = 3
BA = 8
MA = 3
CDA = 0
AA = 3
BA = 10
MA = 3
AREA ECE = 8
ELEM = 5
HS = 1
OTHER = 1
ECE = 8
ELEM = 2
HS = 6
OTHER = 0
EXPERIENCE 8.4 years 5.4 years ns
CENTER 13.4 years 16.1 years ns
LEGAL NONPROFIT = 5
PROFIT = 11
NONPROFIT = 7
PROFIT = 9
STAFF 24 24 ns
CHILDREN 117 108 ns
PR21 OBS 2.56 2.75 ns
PR22 2.75 2.81 ns
PR23 2.75 2.88 ns
PR24 2.94 2.81 ns
PR25 2.63 2.88 ns
LA26 2.31 2.88 ns
LA27 2.75 2.87 ns
LA28 2.47 2.80 ns
AO29 2.29 2.69 ns
AO210 2.81 2.06 ns
AO211 0.00 0.19 ns
AO212 0.40 0.60 ns
AO213 1.46 0.44 ns
AO214 2.44 2.20 ns
AO215 2.81 2.79 ns
AO216 2.81 2.63 ns
AO217 2.47 1.67 ns
AO218 2.81 2.81 ns
AO219 0.38 1.00 ns
AO220 2.13 2.31 ns
AO221 1.94 2.20 ns
AO222 3.00 2.63 ns

ECELS ITQIP Pre-Test Report - Fiene RIKI
R e s e a r c h I n s t i t u t e f o r K e y I n d i c a t o r s
Page 4
AO223 2.44 2.06 ns
AO224 2.69 2.31 ns
AO225 2.88 2.75 ns
AO226 2.25 2.06 ns
SS227 1.80 2.63 ns
SS228 2.53 2.88 ns
SS229 3.00 3.00 ns
SS230 1.73 2.25 ns
SS231 3.00 3.00 ns
SS232 2.40 3.00 ns
SS233 2.25 3.00 ns
SS234 3.00 3.00 ns
SS235 2.88 2.80 ns
SS236 3.00 2.60 ns
SS237 3.00 2.75 ns
SS238 2.20 2.20 ns
SS239 3.00 3.00 ns
SS240 2.00 2.80 .05
DC241 1.50 1.56 ns
DC242 3.00 3.00 ns
DC243 2.69 2.38 ns
DC244 2.00 2.63 ns
DC245 2.56 2.81 ns
DC246 3.00 2.56 ns
DC247 1.20 2.33 ns
DC248 2.80 2.80 ns
DC249 2.13 2.00 ns
DC250 2.87 2.94 ns
DC251 3.00 3.00 ns
DC252 2.75 2.53 ns
DC253 3.00 3.00 ns
DC254 2.88 2.56 ns
DC255 2.56 2.75 ns
DC256 2.07 2.44 ns
HH257 2.25 2.27 ns
HH258 0.81 1.19 ns
HH259 2.31 1.81 ns
HH260 1.25 0.81 ns
HH261 2.38 2.27 ns
HH262 1.13 1.38 ns
HH263 2.44 2.44 ns
HH264 1.25 1.69 ns
CA31 INTER 1.60 0.86 ns
CA32 2.00 2.54 ns
CA33 2.73 2.71 ns

ECELS ITQIP Pre-Test Report - Fiene RIKI
R e s e a r c h I n s t i t u t e f o r K e y I n d i c a t o r s
Page 5
PR34 2.47 2.81 ns
PR35 1.94 2.25 ns
AO36 0.19 0.75 ns
AO37 0.88 0.80 ns
SN38 0.29 0.25 ns
SN39 0.60 1.00 ns
CA310 1.24 2.06 .05
CA311 1.94 2.20 ns
CA312 2.94 2.94 ns
PR313 2.82 3.00 ns
PR314 2.59 2.63 ns
AO315 0.35 0.94 ns
AO316 2.12 2.60 ns
SN317 0.77 0.75 ns
SN318 1.13 1.00 ns
CA319 1.63 2.19 ns
CA320 2.12 2.40 ns
CA321 3.00 3.00 ns
MA322 3.00 3.00 ns
MA323 2.94 2.93 ns
MA324 3.00 2.80 ns
MA325 2.94 3.00 ns
MA326 2.38 3.00 ns
MA327 2.44 3.00 ns
MA328 2.19 2.07 ns
CA41 DOCS 1.77 1.94 ns
CA42 0.59 1.44 .05
CA43 1.77 1.94 ns
CA44 2.29 2.38 ns
SS45 0.53 0.75 ns
SS46 0.53 1.07 ns
SS47 0.88 0.60 ns
SS48 0.53 0.75 ns
SS49 2.60 2.60 ns
MA410 0.47 0.87 ns
IM411 2.94 2.44 ns
IM412 0.82 2.80 ns
IM413 1.41 1.25 ns
IM414 0.42 0.63 ns
ns = not significant.

Hawaii QRIS Key Indicator Blueprint Report 2013
R e s e a r c h I n s t i t u t e f o r K e y I n d i c a t o r s
Page 1
Hawaii QRIS Key Indicator Blueprint Report
Richard Fiene, Ph.D.
August 30, 2013
ABSTRACT
This report will provide a blueprint for Hawaii’s QRIS in developing a key indicator approach to help
streamline their present assessment process. The report will be organized into the following major
headings: an introduction to the key indicator methodology; how key indicators fit into the larger
program monitoring of early care and education programs; how key indicators will be applied to QRIS
and to Hawaii’s QRIS in particular; the technical aspects of the key indicator methodology, the sample to
be drawn from the population, although the full population of early care and education programs may be
able to be used; potential results from the analyses; a timeline for this developmental effort; and potential
cost savings from the approach. This blueprint report will answer all the questions about developing key
indicators for QRIS, the what, how, why, when, etc…
INTRODUCTION
The Key Indicator Methodology was developed to help streamline the program monitoring of
early care and education programs. It was first applied in child care licensing (Fiene & Nixon,
1985) but has been used in many other service types, such as: Head Start Performance Standards
(Fiene, 2013a), National Accreditation (Fiene, 1996), and child and adult residential programs
(Kroh & Melusky, 2010). The methodology is based upon statistical protocols that have been
developed in the tests and measurements literature in which an abbreviated set of items is used to
statistically predict as if the full test was applied. This methodology has been used in regulatory
analysis and more recently has been proposed for use in Quality Rating and Improvement
Systems (QRIS) (Fiene, 2013b).

Hawaii QRIS Key Indicator Blueprint Report 2013
R e s e a r c h I n s t i t u t e f o r K e y I n d i c a t o r s
Page 2
DIFFERENTIAL PROGRAM MONITORING
Key indicators are an important component of differential program monitoring which employs an
abbreviated review rather than a comprehensive or full review of a program. It is one of several
key elements that have been identified in the research literature to help improve the cost
effectiveness and efficiency of the program monitoring of early care and education programs
(Fiene, 2013b, c)(See the Appendix). A recent addition to differential monitoring are QRIS –
Quality Rating and Improvement Systems. Key indicators have a long history of development
within the licensing literature (Fiene & Kroh, 2000) but have only recently been proposed to be
used with QRIS. This proposed blueprint is a first for a state to determine the feasibility of using
the key indicator approach with its QRIS system.
The other key elements of the differential program monitoring approach are the following:
program compliance/licensing which is generally a state’s health and safety rules/regulations that
govern child care. At the national level this would be Caring for Our Children: National
Performance Standards for Health and Safety in Child Care (2012). The program quality key
element is generally represented by the state’s QRIS. At the national level it is represented by
accreditation, such as NAEYC, NECPA, or NAFCC. The key indicator element is represented
by the state’s statistical predictor rules/regulations drawn from their comprehensive set of health
and safety rules/regulations that govern child care. At the national level, an example is the 13
Indicator of Quality Child Care (2002). This element can also represent a state’s statistical
predictor QRIS standards drawn from the comprehensive set of QRIS standards. The purpose of
this Blueprint Report is to develop these statistically predictor QRIS standards. The last key
element to be addressed in this report is the risk assessment key element in which these are the
high risk rules/regulations that place children at greatest risk of mortality or morbidity. At the
national level, an example is Stepping Stones to Caring for Our Children (2013). These are
generally determined via a weighting system in licensing or a point system with QRIS.
KEY INDICATORS APPLIED TO HAWAII’S QRIS
Hawaii’s QRIS is somewhat unique in that its assessment system is drawn very heavily from off-
the-shelf assessment tools, such as the ERS’s, CLASS, PAS/BAS in addition to QRIS program
standards. This will pose significant challenges because of the psychometric properties of these
standardized tools. However, with that said, the key indicator methodology is drawn directly
from the tests and measurements research literature in which it is an approach in taking a
comprehensive test and reducing it down to a group of statistical predictor items. The key
indicator methodology will not alter the scale structure of any of the assessment tools. The
purpose of the key indicator methodology is to establish a protocol

Hawaii QRIS Key Indicator Blueprint Report 2013
R e s e a r c h I n s t i t u t e f o r K e y I n d i c a t o r s
Page 3
so that a determination of a full score and the appropriate level can be statistically predicted from
a smaller set of items from that respective tool, in Hawaii’s QRIS standards, ERS’s, CLASS,
PAS/BAS, NAEYC, NAFCC.
The key indicators can eventually be tied to the professional development/training/technical
assistance system to link resources to specific needs of the programs. It also has the capability of
tying them to an early learning benchmarking and child outcomes at some point in the future.
This would be accomplished in the full implementation of the Differential Monitoring Logic
Model and Algorithm (DMLMA©) as depicted in the Appendix.
TECHNICAL ASPECTS OF THE KEY INDICATOR METHODOLOGY
This section provides the technical and statistical aspects of the key indicator methodology. It
will provide the roadmap in taking the Hawaii QRIS data base through the necessary steps to
generating the respective key indicators.
One of the first steps is to sort the data into high and low groups, generally the highest and
lowest ratings can be used for this sorting. In very large states this is done on a sampling basis
but in Hawaii’s case we should be able to use all the programs who participate in the QRIS and
not take a sample. Frequency data will be obtained on those programs in the top level (usually
top 20-25%) and the bottom level (usually the bottom 20-25%). The middle levels are not used
for the purposes of these analyses. These two groups (top level & the bottom level) are then
compared to how each program scored on each item within the specific assessment tool (see
Figure 1). An example would be the following: Item 16 from the ECERS – Encouraging
Children to Communicate. Sort all the providers by the number in the highest group and the
lowest. Then determine how each program scored on item 16, did they get a 5 or higher or a 3
and lower? Fill in the cells within Figure 1 accordingly (see Figure 2).
Figure 1 Providers In
Compliance
or Top 25%
Programs Out
Of Compliance
or Bottom 25%
Row Total
Highest level
(top 20-25%)
A B Y
Lowest level
(bottom 20-25%)
C D Z
Column Total W X Grand Total
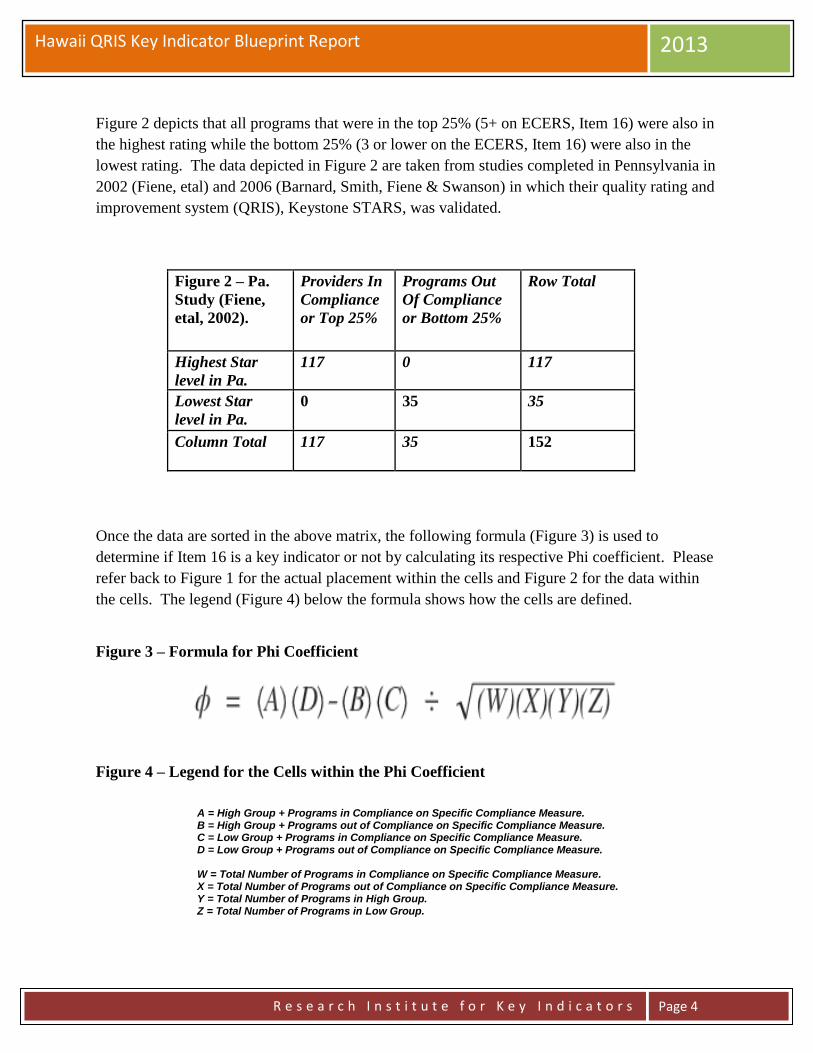
Hawaii QRIS Key Indicator Blueprint Report 2013
R e s e a r c h I n s t i t u t e f o r K e y I n d i c a t o r s
Page 4
Figure 2 depicts that all programs that were in the top 25% (5+ on ECERS, Item 16) were also in
the highest rating while the bottom 25% (3 or lower on the ECERS, Item 16) were also in the
lowest rating. The data depicted in Figure 2 are taken from studies completed in Pennsylvania in
2002 (Fiene, etal) and 2006 (Barnard, Smith, Fiene & Swanson) in which their quality rating and
improvement system (QRIS), Keystone STARS, was validated.
Figure 2 – Pa.
Study (Fiene,
etal, 2002).
Providers In
Compliance
or Top 25%
Programs Out
Of Compliance
or Bottom 25%
Row Total
Highest Star
level in Pa.
117 0 117
Lowest Star
level in Pa.
0 35 35
Column Total 117 35 152
Once the data are sorted in the above matrix, the following formula (Figure 3) is used to
determine if Item 16 is a key indicator or not by calculating its respective Phi coefficient. Please
refer back to Figure 1 for the actual placement within the cells and Figure 2 for the data within
the cells. The legend (Figure 4) below the formula shows how the cells are defined.
Figure 3 – Formula for Phi Coefficient
Figure 4 – Legend for the Cells within the Phi Coefficient
A = High Group + Programs in Compliance on Specific Compliance Measure. B = High Group + Programs out of Compliance on Specific Compliance Measure. C = Low Group + Programs in Compliance on Specific Compliance Measure. D = Low Group + Programs out of Compliance on Specific Compliance Measure. W = Total Number of Programs in Compliance on Specific Compliance Measure. X = Total Number of Programs out of Compliance on Specific Compliance Measure. Y = Total Number of Programs in High Group. Z = Total Number of Programs in Low Group.

Hawaii QRIS Key Indicator Blueprint Report 2013
R e s e a r c h I n s t i t u t e f o r K e y I n d i c a t o r s
Page 5
Once the data are run through the formula in Figure 3, the following chart (Figure 5) can be used
to make the final determination of including or not including the item as a key indicator. Based
upon the chart in Figure 5, it is best to have a Phi Coefficient approaching +1.00 since we are
dealing with normally distributed data1. This requirement is relaxed with licensing rules & QRIS
selected standards only (+.26 and higher) because the data are more skewed but this should not
be the case as much with Hawaii’s Quality Rating and Improvement System (QRIS) data
because the measures selected in the QRIS are mostly standardized tools with more normally
distributed data.
Continuing with the chart in Figure 5, if the Phi Coefficient is between +.25 and -.25, this
indicates that the indicator is unpredictable in being able to predict overall compliance with the
quality rating assessment tool. Either a false positive in which the indicator appears too often in
the low group as being in compliance, or a false negative in which the indicator appears too often
in the high group as being out of compliance2. This can occur with Phi Coefficients above +.25
but it becomes unlikely as we approach +1.00 although there is always the possibility that other
standards/rules/regulations could be found out of compliance (this was demonstrated in a study
conducted by the author (Fiene, 2013c) with Head Start programs). Another solution is to
increase the number of key indicators to be reviewed but this will cut down on the efficiency
which is desirable and the purpose of the key indicators.
The last possible outcome with the Phi Coefficient is if it is between -.26 and -1.00, this indicates
that the indicator is a terrible predictor because it is doing just the opposite of the decision we
want to make. The indicator would predominantly be in compliance with the low group rather
than the high group so it would be statistically predicting overall non-compliance. This is
obviously something we do not want to occur.
Figure 5 – Thresholds for the Phi Coefficient (Fiene & Nixon, 1983, 1985)
The key indicators should then only be used with those programs who have attained the highest
rating. It is not intended for those programs that have attained lower ratings. However, even
with those programs that have attained the highest rating, every 3-5 years a full, comprehensive
Phi Coefficient Range Characteristic of Indicator Decision
(+1.00) – (+.26) Good Predictor Include
(+.25) – (-.25) Unpredictable Do not Include
(-.26) – (-1.00) Terrible Predictor Do not Include

Hawaii QRIS Key Indicator Blueprint Report 2013
R e s e a r c h I n s t i t u t e f o r K e y I n d i c a t o r s
Page 6
review using the full assessment tools and QRIS standards should occur (see Figure 6 for a
graphical depiction). It is intended that a re-validation of the key indicators occur on a periodic
basis to make certain that the key indicators have not changed because of differences in
compliance history. This is an important and necessary step for the state to engage in to
ascertain the overall validity and reliability of the assessment system. Also there should not have
been any major changes in the program while the key indicators are being administered, such as
the director leaving or a large percentage of teachers leaving or enrollment increasing
significantly, or a change in the licensing status of the program.
Figure 6 - Proposed DMLMA System with Key Indicators (KI)
Use of Hawaii Key Indicators (HIKI) for QRIS with a Full Review every 4th Year
1yr 1yr 1yr 1yr 1yr 1yr
SAMPLE
Generally a sample is drawn from the population of early care and education facilities in the
respective state. With this being said, the chances are the full population will be able to be used
in Hawaii’s case because of the manageable number of facilities. This should be able to be done
with centers as well as with homes2a.
POTENTIAL RESULTS
The potential results are drawn from previous studies conducted by the author (Fiene, 2013b) in
which key indicators were generated for the ECERS-R and FCCERS-R. All the specific items in
the ECERS-R and FCCERS-R were run through the Phi Coefficient formula in Figure 3 above
after having sorted the data into a high group (5 or higher) and a low group (3 or less) for the
overall ECERS-R and FCCERS-R scores. This same procedure will be followed with the
Hawaii QRIS but in this case the individual ERS item score will be compared with the respective
Star Levels which will be sorted into a high group (top Level) and a low group (bottom Level) in
order to determine which individual ERS items become key indicators. This process will be
repeated for all ERS items and then extended to CLASS and PAS/BAS items as well as QRIS
standards and where appropriate to NAEYC and NAFCC items.
HIKI QRIS
HIKI QRIS
HIKI QRIS
HIKI QRIS
FULL
REVIEW
HIKI QRIS
HIKI QRIS
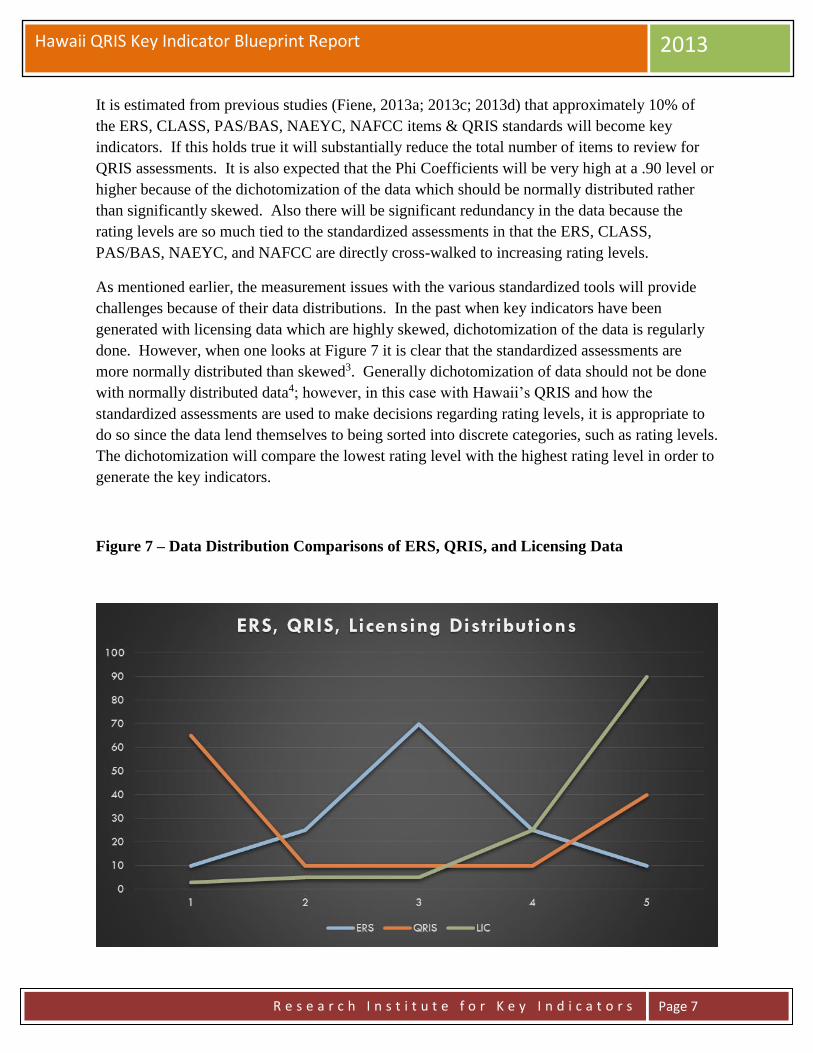
Hawaii QRIS Key Indicator Blueprint Report 2013
R e s e a r c h I n s t i t u t e f o r K e y I n d i c a t o r s
Page 7
It is estimated from previous studies (Fiene, 2013a; 2013c; 2013d) that approximately 10% of
the ERS, CLASS, PAS/BAS, NAEYC, NAFCC items & QRIS standards will become key
indicators. If this holds true it will substantially reduce the total number of items to review for
QRIS assessments. It is also expected that the Phi Coefficients will be very high at a .90 level or
higher because of the dichotomization of the data which should be normally distributed rather
than significantly skewed. Also there will be significant redundancy in the data because the
rating levels are so much tied to the standardized assessments in that the ERS, CLASS,
PAS/BAS, NAEYC, and NAFCC are directly cross-walked to increasing rating levels.
As mentioned earlier, the measurement issues with the various standardized tools will provide
challenges because of their data distributions. In the past when key indicators have been
generated with licensing data which are highly skewed, dichotomization of the data is regularly
done. However, when one looks at Figure 7 it is clear that the standardized assessments are
more normally distributed than skewed3. Generally dichotomization of data should not be done
with normally distributed data4; however, in this case with Hawaii’s QRIS and how the
standardized assessments are used to make decisions regarding rating levels, it is appropriate to
do so since the data lend themselves to being sorted into discrete categories, such as rating levels.
The dichotomization will compare the lowest rating level with the highest rating level in order to
generate the key indicators.
Figure 7 – Data Distribution Comparisons of ERS, QRIS, and Licensing Data

Hawaii QRIS Key Indicator Blueprint Report 2013
R e s e a r c h I n s t i t u t e f o r K e y I n d i c a t o r s
Page 8
TIMELINE
As soon as all early care and education programs have gone through their assessment phase, it
will be possible to do the calculations to determine the Phi Coefficients and generate the key
indicators. I am guessing that this should not take any longer than 1 year but could be completed
in a much shorter period of time if the assessments on individual programs could be moved up
(see Figure 8). The analytical phase should take no longer than a month with an additional
month to write up the report. A face to face presentation of the analyses could be done after
these two months.
The timeline presented in Figure 8 can be adjusted to the specific needs of Hawaii’s QRIS
system. The timeline is based upon previous projects and the average time to generate key
indicators. Another consideration or task is the development of the policies and procedures to be
developed and implemented regarding the use of key indicators. This was not specifically listed
on the timeline because it is something that is generally developed throughout the project with
feedback from all the stakeholders who will be impacted by the use of this new approach to
assessment and monitoring.
Figure 8 - HAWAII QRIS KEY INDICATOR (KI) PROJECT TIMELINE
TASK
MONTHS
1 2 3 4 5 6 7
Collect Data XXXXXXX
Sort Data
XXXXXXX
Run Analyses
XXXXXXX
Generate KI
XXXXXXX
Training on KI
XXXXXXX
KI Reliability
XXXXXXX
Implementation
XXXXXXX
Legend:
Collect Data – dependent upon the total number of programs participating it would be determined to collect data on all
participants or to complete a sample.
Sort Data – the individual programs are sorted into high and low groups representing the top 25% and the bottom 25% of
programs as they have scored on the respective assessment tools and standards.

Hawaii QRIS Key Indicator Blueprint Report 2013
R e s e a r c h I n s t i t u t e f o r K e y I n d i c a t o r s
Page 9
Run Analyses – each individual item within each of the assessment tools for every program will be compared to the sorting
process of the high and low groups.
Generate KI – a 2 x 2 matrix is constructed and the key indicators (KI) are generated from this matrix through the use of a phi
coefficient. A final report will be delivered to Hawaii executive staff.
Training on KI – all staff who will be using the KI will be trained on its use.
KI Reliability – reliability will be established by having two staff go out together and administer the key indicators separately
and comparing their results.
Implementation – once reliability has been established, full implementation will begin.
COST SAVINGS
Again based upon previous studies most recently completed in California in 2010
(http://www.myccl.ca.gov/res/docs/12022010HandoutStakeholderMeeting.pdf), time savings of 50%
have been attained by using a key indicator or abbreviated tool in completing assessments. It
only makes sense that if an assessment can be completed in one hour rather than 2 – 4 hours that
a state will see time savings. It is being assumed that equivalent savings should also be the case
with Hawaii’s QRIS although this cannot be made certain until the new key indicator or
abbreviated tool is actually used for a period of time. Once the new key indicators are used for
several months, comparisons could be made to when the full assessments were done.
CONCLUSION AND NEXT STEPS
This blueprint report has given the basic parameters to develop a key indicator approach to
Hawaii’s QRIS assessment tools. By following this blueprint Hawaii staff should be able to fully
implement the approach. Hawaii staff would also need to determine if they have the internal
capability for the development of the key indicators or if there will be the need to outsource
certain aspects of the development. This will be an important consideration as Hawaii moves
forward with this project. I have provided two options for your consideration in moving
forward.
Option 1 – Development of System Internally:
This would require either information systems or research & evaluation staff to analyze the data,
generate key indicators for each assessment tool, and training of staff. I could provide the
necessary consulting services to help the staff work through the methodology. This would
probably require at least one face to face meeting with regular monthly conference calls between
myself and staff. Discussions of the formatting of data and the types of analyses would be
discussed and demonstrated.
Option 2 – Development of System Externally:
In this option I could do all the methodological work demonstrating how I would need the data
sent to me, the analytical work in generating key indicators for each assessment tool, a report

Hawaii QRIS Key Indicator Blueprint Report 2013
R e s e a r c h I n s t i t u t e f o r K e y I n d i c a t o r s
Page 10
detailing the methodology and results. The only thing that Hawaii staff would need to do is get
the data to me, all other aspects of what is delineated in the timeline in Figure 8 would be
completed by me. This would probably require several face to face trips to explain the process,
the results, and do training of staff. Once everything was in place, Hawaii staff would have a
fully implemented system.
If the above options are of interest I can provide detailed budgets for either one or both.
Notes:
1, 4. The reason for pointing out the need to have a higher Phi Coefficient than what has been reported
previously (Fiene & Nixon, 1983, 1985) is the fact that the dichotomization of data should only be used with
skewed data and not normally distributed data because it will accentuate differences. However, since the
purpose of the dichotomization of data is only for sorting into a high and low group, it would appear to be
acceptable for this purpose (MacCallun, etal, 2002. On the practice of dichotomization of quantitative variables,
Psychological Methods, 7, 1, 19-40.).
2. These results would show an increase in cells B and C in Figure 1 which is undesirable; it should
always be the case where A + D > B + C for key indicators to maintain their predictive validity.
2a. If a sample must be drawn, I can help to provide the guidance in pulling such a sample.
3. The distinction between making decisions with skewed (Licensing) as versus normally distributed (ERS)
data is an important one because there is a greater likelihood with skewed data of introducing less than optimal
programs into the high group when sorting programmatic data into high and low groups. This then makes it
more difficult to identify the best programs. However, because of the distribution with skewed data the same
cannot be said with the low group in which case it is relatively easy to identify the problem programs. This is
not as much of a concern when the data are more normally distributed in which it is relatively easy to identify
both the optimal and problem programs. This is an excellent example of the need of weighting of standards in
order to increase the normal distribution of the data.

Hawaii QRIS Key Indicator Blueprint Report 2013
R e s e a r c h I n s t i t u t e f o r K e y I n d i c a t o r s
Page 11
REFERENCES AND ADDITIONAL RELATED READINGS REGARDING DMLMA:
Barnard, Smith, Fiene, Swanson (2006). Evaluation of Pennsylvania’s Keystone STARS Quality
Rating and Improvement System, Pittsburgh: Pennsylvania, Office of Child Development.
Fiene (2013a). A comparison of international child care and US child care using the Child Care
Aware – NACCRRA (National Association of Child Care Resource and Referral Agencies) child
care benchmarks, International Journal of Child Care and Education Policy, 7(1), 1-15.
Fiene (2013b). Differential monitoring logic model and algorithm. Middletown: Pennsylvania,
Research Institute for Key Indicators.
Fiene (2013c). Head Start Key Indicators. Middletown: Pennsylvania, Research Institute for Key
Indicators.
Fiene (2013d). Kansas Child Care Key Indicators. Middletown: Pennsylvania, Research Institute
for Key Indicators.
Fiene (2013e). Validation of Georgia’s core rule differential monitoring system. Middletown:
Pennsylvania, Research Institute for Key Indicators.
Fiene (2007). Child Development Program Evaluation & Caregiver Observation Scale, in T Halle
(Ed.), Early Care and Education Quality Measures Compendium, Washington, D.C.: Child
Trends.
Fiene (2003). Licensing related indicators of quality child care, Child Care Bulletin, winter
2002-2003, pps 12-13.
Fiene (2002a). Thirteen indicators of quality child care: Research update. Washington, DC:
Office of the Assistant Secretary for Planning and Evaluation, US Department of Health and
Human Services.
Fiene (2002b). Improving child care quality through an infant caregiver mentoring project, Child
and Youth Care Forum, 31(2), 75-83.
Fiene, Iutcovich, Johnson, & Koppel (1998). Child day care quality linked to opportunities for
professional development: An applied community psychology example. Community Psychologist,
31(1), 10-11.
Fiene (1996). Using a statistical-indicator methodology for accreditation, in NAEYC
Accreditation: A Decade of Learning and the Years Ahead, S. Bredekamp & B. Willer, editors,
Washington, D.C.: National Association for the Education of Young Children.
Fiene (1995). Utilizing a statewide training system to improve child day care quality: The other
system in a program quality improvement model. Child Welfare, Volume LXXIV, #6, November-
December, 1189-1201.

Hawaii QRIS Key Indicator Blueprint Report 2013
R e s e a r c h I n s t i t u t e f o r K e y I n d i c a t o r s
Page 12
Fiene (1985). Measuring the effectiveness of regulations, New England Journal of Human
Services, 5(2), 38-39.
Fiene (1981). A new tool for day care monitoring introduced by children's consortium,
Evaluation Practice, 1(2), 10-11.
Fiene, Greenberg, Bergsten, Carl, Fegley, & Gibbons (2002). The Pennsylvania early childhood
quality settings study, Harrisburg, Pennsylvania: Governor’s Task Force on Early Care and
Education.
Fiene & Kroh (2000). Licensing Measurement and Systems, NARA Licensing Curriculum.
Washington, D.C.: National Association for Regulatory Administration.
Fiene & Nixon (1985). Instrument based program monitoring and the indicator checklist for child
care, Child Care Quarterly, 14(3), 198-214.
Griffin & Fiene (1995). A systematic approach to policy planning and quality improvement for
child care: A technical manual for state administrators. Washington, D.C.: National Center for
Clinical Infant Programs-Zero to Three.
Kontos & Fiene (1987). Child care quality, compliance with regulations, and children's
development: The Pennsylvania Study, in Quality in Child Care: What Does Research Tell Us?
Phillips, editor, Washington, D.C.: National Association for the Education of Young Children.
Zellman, G. L. and Fiene, R. (2012). Validation of Quality Rating and Improvement Systems for
Early Care and Education and School-Age Care, Research-to-Policy, Research-to-Practice Brief
OPRE 2012. Washington, DC: Office of Planning, Research and Evaluation, Administration for
Children and Families, U.S. Department of Health and Human Services
For additional information regarding this report, please contact:
Richard Fiene, Ph.D., Director/President
Research Institute for Key Indicators (RIKI)
41 Grandview Drive
Middletown, PA. 17057
717-944-5868 Phone and Fax
http://RIKInstitute.wikispaces.com
http://pennstate.academia.edu/RickFiene

Hawaii QRIS Key Indicator Blueprint Report 2013
R e s e a r c h I n s t i t u t e f o r K e y I n d i c a t o r s
Page 13
Appendix
DIFFERENTIAL MONITORING LOGIC MODEL & ALGORITHM (DMLMA©) (Fiene, 2012): A 4th
Generation ECPQIM – Early Childhood Program Quality Indicator Model
CI x PQ => RA + KI => DM + PD => CO
Definitions of Key Elements:
PC = Program Compliance/Licensing (Health and Safety) (Caring for Our Children) PQ = QRIS/Accreditation/Caregiver/Child Interactions/Classroom Environment Quality (ERS/CLASS/PAS/BAS) RA = Risk Assessment, (High Risk Rules) (Stepping Stones) KI = Key Indicators (Predictor Rules) (13 Key Indicators of Quality Child Care) DM = Differential Monitoring (How often to visit and what to review) PD = Professional Development/Technical Assistance/Training (Not pictured but part of Model) CO = Child Outcomes (Not pictured but part of Model)
Comprehensive
Licensing Tool (CI)
Structural Quality
Program Quality
Tool (PQ) - QRIS
Process Quality
Risk Assessment
Tool (RA)
Key Indicator
Tool (KI)
Differential
Monitoring (DM)

ECELS ITQIP Pre-Test Item Ranges- Fiene RIKI
R e s e a r c h I n s t i t u t e f o r K e y I n d i c a t o r s
Page 1
ECELS Infant Toddler Program Quality Improvement Project (ITQIP)
Report of Pre-Test Data Collection Item Range Frequencies
Richard Fiene, Ph.D.
October 1, 2014
The following table contains the item range frequencies for all the items in the observation,
interview, and document sections of the ECELS Project ITQIP Data Collection Tool for the pre-
test data. The following scale delineates the scoring protocol: 0 = No; 1 = Partly (< 50%); 2 =
Mostly (= or > 50%); 3 = Fully (100%). There were 32 programs where pre-test data were
collected. For those items that do not total to 32, the item was not applicable (NA) or not
observable (No Opportunity (NOp)) for that specific program.
Item 0 1 2 3
PR21 OBS - 3 5 24
PR22 - 2 3 27
PR23 - 1 4 27
PR24 - 1 2 29
PR25 - 1 6 25
LA26 2 1 5 24
LA27 - 1 4 26
LA28 3 - 2 25
AO29 4 - 2 21
AO210 6 - - 26
AO211 31 - - 71
AO212 25 - - 5 AO213 13 1 2 6 AO214 7 - - 24 AO215 2 - - 28 AO216 1 1 4 26 AO217 5 2 1 16 AO218 2 - - 30 AO219 24 - - 7 AO220 7 1 2 22 AO221 9 - 2 20
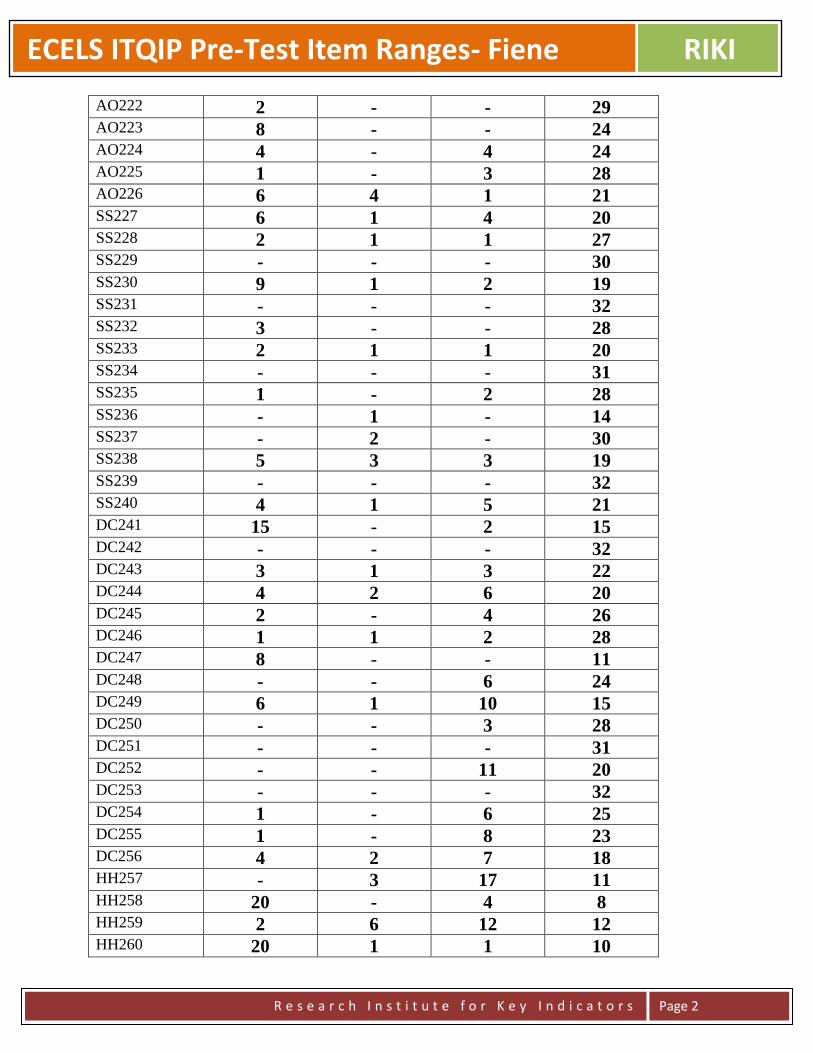
ECELS ITQIP Pre-Test Item Ranges- Fiene RIKI
R e s e a r c h I n s t i t u t e f o r K e y I n d i c a t o r s
Page 2
AO222 2 - - 29 AO223 8 - - 24 AO224 4 - 4 24 AO225 1 - 3 28 AO226 6 4 1 21 SS227 6 1 4 20 SS228 2 1 1 27 SS229 - - - 30 SS230 9 1 2 19 SS231 - - - 32 SS232 3 - - 28 SS233 2 1 1 20 SS234 - - - 31 SS235 1 - 2 28 SS236 - 1 - 14 SS237 - 2 - 30 SS238 5 3 3 19 SS239 - - - 32 SS240 4 1 5 21 DC241 15 - 2 15 DC242 - - - 32 DC243 3 1 3 22 DC244 4 2 6 20 DC245 2 - 4 26 DC246 1 1 2 28 DC247 8 - - 11 DC248 - - 6 24 DC249 6 1 10 15 DC250 - - 3 28 DC251 - - - 31 DC252 - - 11 20 DC253 - - - 32 DC254 1 - 6 25 DC255 1 - 8 23 DC256 4 2 7 18 HH257 - 3 17 11 HH258 20 - 4 8 HH259 2 6 12 12 HH260 20 1 1 10
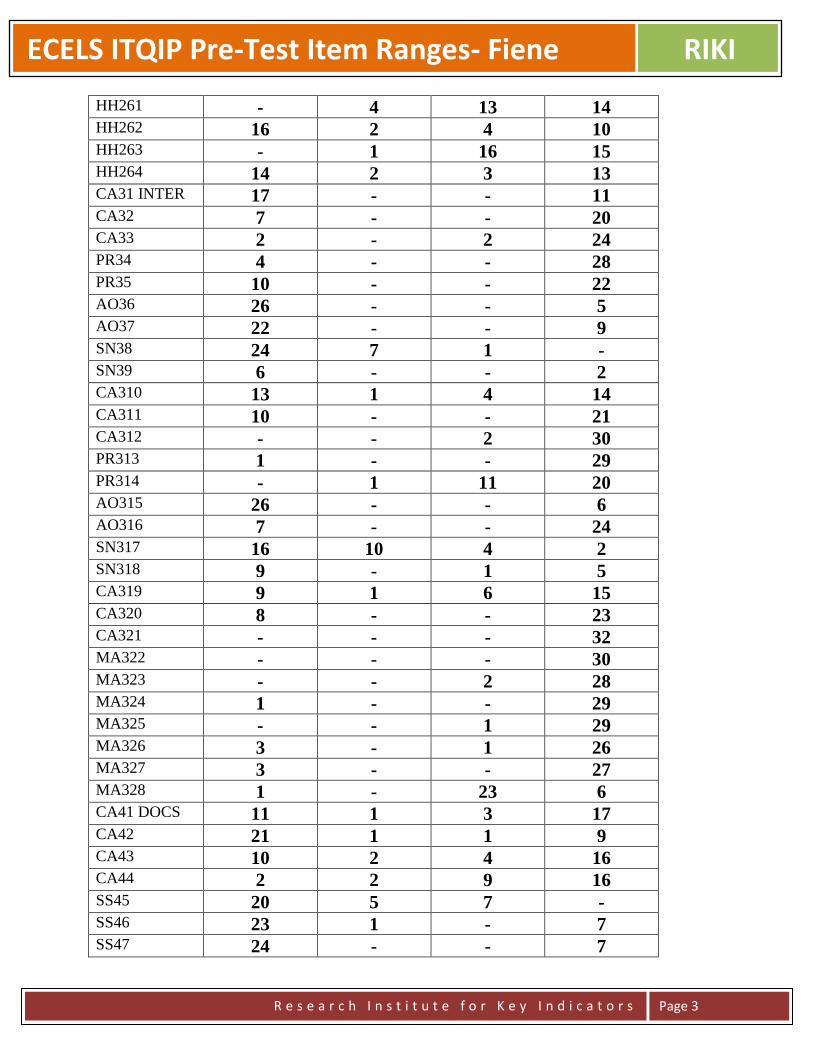
ECELS ITQIP Pre-Test Item Ranges- Fiene RIKI
R e s e a r c h I n s t i t u t e f o r K e y I n d i c a t o r s
Page 3
HH261 - 4 13 14 HH262 16 2 4 10 HH263 - 1 16 15 HH264 14 2 3 13 CA31 INTER 17 - - 11 CA32 7 - - 20 CA33 2 - 2 24 PR34 4 - - 28 PR35 10 - - 22 AO36 26 - - 5 AO37 22 - - 9 SN38 24 7 1 - SN39 6 - - 2 CA310 13 1 4 14 CA311 10 - - 21 CA312 - - 2 30 PR313 1 - - 29 PR314 - 1 11 20 AO315 26 - - 6 AO316 7 - - 24 SN317 16 10 4 2 SN318 9 - 1 5 CA319 9 1 6 15 CA320 8 - - 23 CA321 - - - 32 MA322 - - - 30 MA323 - - 2 28 MA324 1 - - 29 MA325 - - 1 29 MA326 3 - 1 26 MA327 3 - - 27 MA328 1 - 23 6 CA41 DOCS 11 1 3 17 CA42 21 1 1 9 CA43 10 2 4 16 CA44 2 2 9 16 SS45 20 5 7 - SS46 23 1 - 7 SS47 24 - - 7
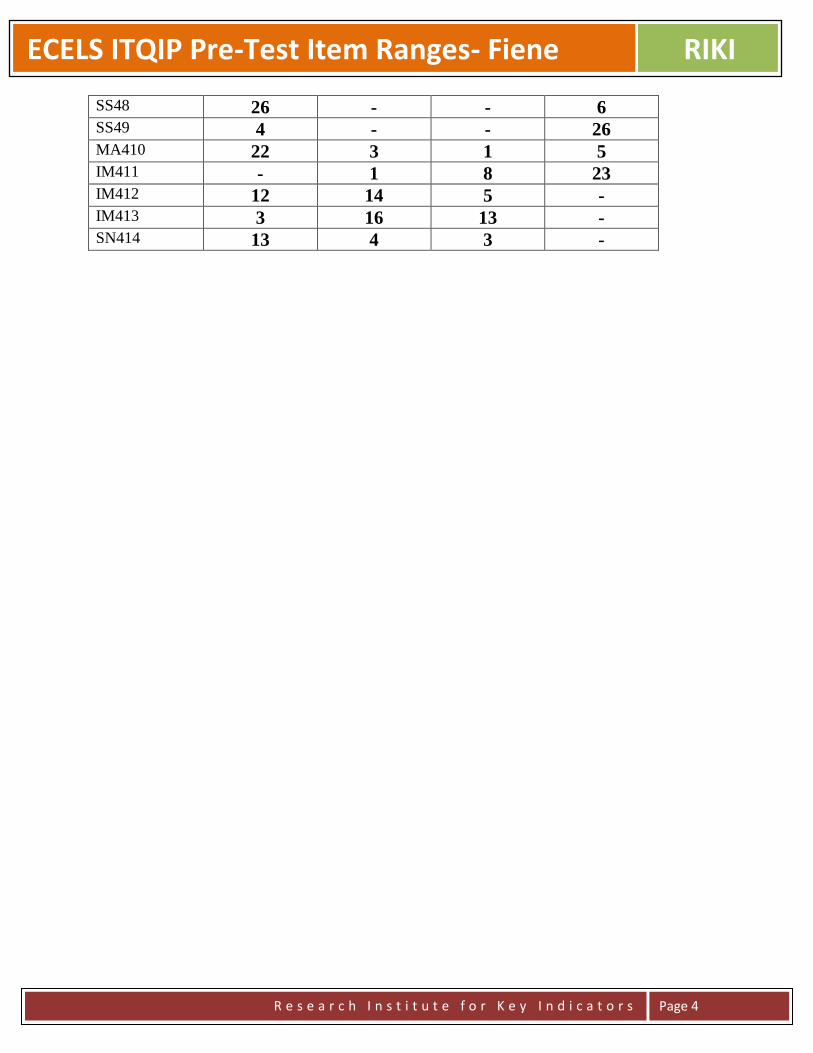
ECELS ITQIP Pre-Test Item Ranges- Fiene RIKI
R e s e a r c h I n s t i t u t e f o r K e y I n d i c a t o r s
Page 4
SS48 26 - - 6 SS49 4 - - 26 MA410 22 3 1 5 IM411 - 1 8 23 IM412 12 14 5 - IM413 3 16 13 - SN414 13 4 3 -

Oregon DMLMA, Risk Assessment, & Key Indicator Blueprint Report 2013
R e s e a r c h I n s t i t u t e f o r K e y I n d i c a t o r s
Page 1
Oregon DMLMA, Risk Assessment, & Key Indicator Blueprint Report
Richard Fiene, Ph.D.
September 30, 2013
ABSTRACT
This report will provide a blueprint for Oregon’s Early Care and Education/Child Care program
monitoring system in developing a Differential Program Monitoring, Risk Assessment, and Key Indicator
approach to help streamline their present licensing process. The report will be organized into the
following major headings: an introduction to the differential monitoring methodology; how key
indicators and risk assessment fit into the larger program monitoring of early care and education
programs; how key indicators and risk assessment will be applied to Oregon’s system in particular; the
technical aspects of differential monitoring, risk assessment and key indicator methodology, the sample to
be drawn from the population, potential results from the analyses; a timeline for this developmental effort;
and potential cost savings from the approach.
INTRODUCTION
The Risk Assessment, Key Indicator, and Differential Program Monitoring Methodologies were
developed to help streamline the program monitoring of early care and education programs. It
was first applied in child care licensing (Fiene & Nixon, 1985) but has been used in many other
service types, such as: Head Start Performance Standards (Fiene, 2013a), National Accreditation
(Fiene, 1996), and child and adult residential programs (Kroh & Melusky, 2010). The
methodologies are based upon statistical protocols that have been developed in the tests and
measurements literature in which an abbreviated set of items is used to statistically predict as if
the full test was applied. This methodology has been used in regulatory analysis and more
recently has been proposed for use in Quality Rating and Improvement Systems (QRIS) (Fiene,
2013b).

Oregon DMLMA, Risk Assessment, & Key Indicator Blueprint Report 2013
R e s e a r c h I n s t i t u t e f o r K e y I n d i c a t o r s
Page 2
DIFFERENTIAL PROGRAM MONITORING
Risk Assessment and Key Indicators are important components of differential program
monitoring which employs an abbreviated review rather than a comprehensive or full review of a
program. It is one of several key elements that have been identified in the research literature to
help improve the cost effectiveness and efficiency of the program monitoring of early care and
education programs (Fiene, 2013b, c)(See the Appendix). A recent addition to differential
monitoring are QRIS – Quality Rating and Improvement Systems. Key indicators have a long
history of development within the licensing literature (Fiene & Kroh, 2000) but have only
recently been proposed to be used with QRIS. This proposed blueprint is to assist Oregon to
develop a fully functional differential program monitoring, risk assessment, and key indicator
approach to their child care licensing system and then determine the feasibility of using the these
approaches with its QRIS system.
The other key elements of the differential program monitoring approach are the following:
program compliance/licensing which is generally a state’s health and safety rules/regulations that
govern child care. At the national level this would be Caring for Our Children: National
Performance Standards for Health and Safety in Child Care (2012). The program quality key
element is generally represented by the state’s QRIS. At the national level it is represented by
accreditation, such as NAEYC, NECPA, or NAFCC. The key indicator element is represented
by the state’s statistical predictor rules/regulations drawn from their comprehensive set of health
and safety rules/regulations that govern child care. At the national level, an example is the 13
Indicator of Quality Child Care (2002). This element can also represent a state’s statistical
predictor QRIS standards drawn from the comprehensive set of QRIS standards. The purpose of
this Blueprint Report is to develop these statistically predictor standards first for Oregon’s child
care licensing system and explore the possibility of expanding this to their QRIS system. The
last key element to be addressed in this report is the risk assessment key element in which these
are the high risk rules/regulations that place children at greatest risk of mortality or morbidity.
At the national level, an example is Stepping Stones to Caring for Our Children (2013). These
are generally determined via a weighting system in licensing or a point system with QRIS.
KEY INDICATORS APPLIED TO OREGON’S CHILD CARE LICENSING SYSTEM
Oregon’s licensing and QRIS systems are very similar to many other states’ licensing and QRIS
systems so that the methodologies employed in the past for developing risk assessment and key
indicators will be employed in this blueprint. There are some significant challenges because of
the psychometric properties of licensing data because of the severe skewness and kurtosis

Oregon DMLMA, Risk Assessment, & Key Indicator Blueprint Report 2013
R e s e a r c h I n s t i t u t e f o r K e y I n d i c a t o r s
Page 3
present in state data systems. These challenges will be addressed later in this blueprint in how to
deal skewness and kurtosis.
The risk assessment and key indicators can eventually be tied to the professional
development/training/technical assistance system to link resources to specific needs of the
programs. It also has the capability of tying them to an early learning benchmarking and child
outcomes at some point in the future. This would be accomplished in the full implementation of
the Differential Monitoring Logic Model and Algorithm (DMLMA©) as depicted in the
Appendix.
TECHNICAL ASPECTS OF THE KEY INDICATOR METHODOLOGY
This section provides the technical and statistical aspects of the key indicator methodology. It
will provide the roadmap in taking the Oregon licensing and QRIS data bases through the
necessary steps to generating the respective key indicators.
One of the first steps is to sort the data into high and low groups, generally the highest and
lowest ratings can be used for this sorting. In very large states this is done on a sampling basis
which will be described later in the blueprint. Frequency data will be obtained on those
programs in the top level (usually top 20-25%) and the bottom level (usually the bottom 20-
25%). The middle levels are not used for the purposes of these analyses. These two groups (top
level & the bottom level) are then compared to how each program scored on each item within the
specific assessment tool (see Figure 1). An example would be the following: Item 16 from the
ECERS – Encouraging Children to Communicate. Sort all the providers by the number in the
highest group and the lowest. Then determine how each program scored on item 16, did they get
a 5 or higher or a 3 and lower? Fill in the cells within Figure 1 accordingly (see Figure 2).
Figure 1 Providers In
Compliance
or Top 25%
Programs Out
Of Compliance
or Bottom 25%
Row Total
Highest level
(top 20-25%)
A B Y
Lowest level
(bottom 20-25%)
C D Z
Column Total W X Grand Total
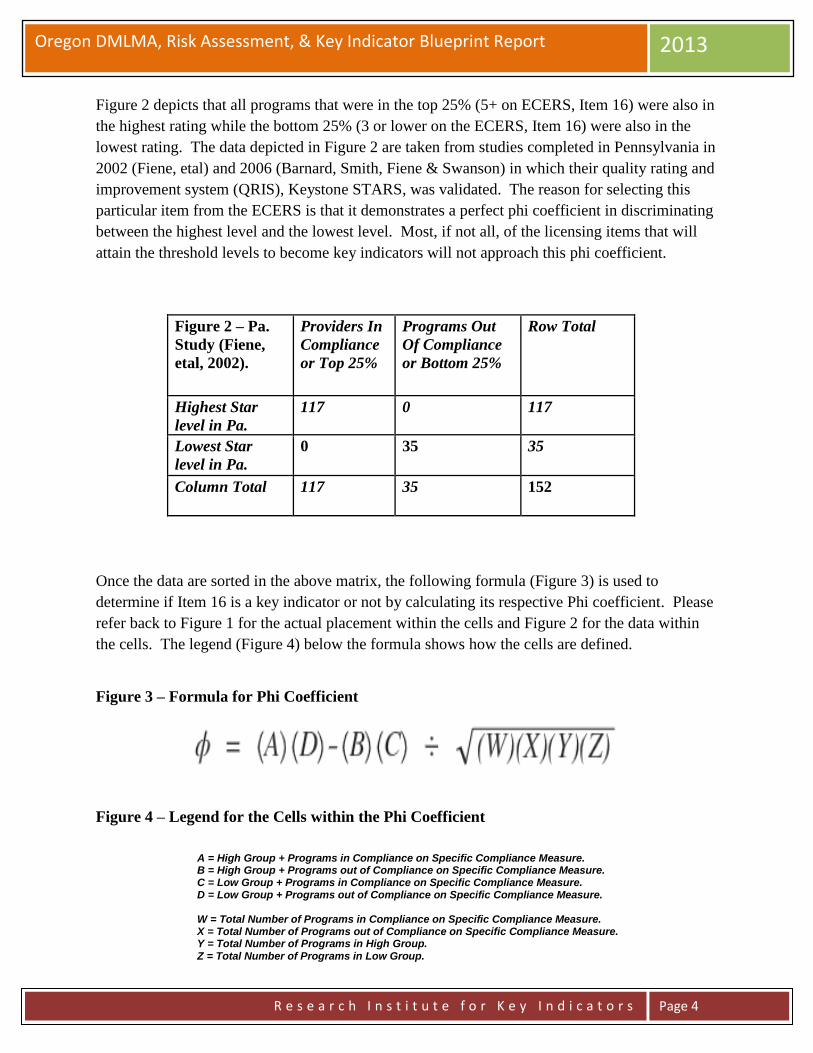
Oregon DMLMA, Risk Assessment, & Key Indicator Blueprint Report 2013
R e s e a r c h I n s t i t u t e f o r K e y I n d i c a t o r s
Page 4
Figure 2 depicts that all programs that were in the top 25% (5+ on ECERS, Item 16) were also in
the highest rating while the bottom 25% (3 or lower on the ECERS, Item 16) were also in the
lowest rating. The data depicted in Figure 2 are taken from studies completed in Pennsylvania in
2002 (Fiene, etal) and 2006 (Barnard, Smith, Fiene & Swanson) in which their quality rating and
improvement system (QRIS), Keystone STARS, was validated. The reason for selecting this
particular item from the ECERS is that it demonstrates a perfect phi coefficient in discriminating
between the highest level and the lowest level. Most, if not all, of the licensing items that will
attain the threshold levels to become key indicators will not approach this phi coefficient.
Figure 2 – Pa.
Study (Fiene,
etal, 2002).
Providers In
Compliance
or Top 25%
Programs Out
Of Compliance
or Bottom 25%
Row Total
Highest Star
level in Pa.
117 0 117
Lowest Star
level in Pa.
0 35 35
Column Total 117 35 152
Once the data are sorted in the above matrix, the following formula (Figure 3) is used to
determine if Item 16 is a key indicator or not by calculating its respective Phi coefficient. Please
refer back to Figure 1 for the actual placement within the cells and Figure 2 for the data within
the cells. The legend (Figure 4) below the formula shows how the cells are defined.
Figure 3 – Formula for Phi Coefficient
Figure 4 – Legend for the Cells within the Phi Coefficient
A = High Group + Programs in Compliance on Specific Compliance Measure. B = High Group + Programs out of Compliance on Specific Compliance Measure. C = Low Group + Programs in Compliance on Specific Compliance Measure. D = Low Group + Programs out of Compliance on Specific Compliance Measure. W = Total Number of Programs in Compliance on Specific Compliance Measure. X = Total Number of Programs out of Compliance on Specific Compliance Measure. Y = Total Number of Programs in High Group. Z = Total Number of Programs in Low Group.

Oregon DMLMA, Risk Assessment, & Key Indicator Blueprint Report 2013
R e s e a r c h I n s t i t u t e f o r K e y I n d i c a t o r s
Page 5
Once the data are run through the formula in Figure 3, the following chart (Figure 5) can be used
to make the final determination of including or not including the item as a key indicator. Based
upon the chart in Figure 5, it is best to have a Phi Coefficient approaching +1.00 since we are
dealing with normally distributed data1. This requirement is relaxed with licensing rules & QRIS
selected standards only (+.26 and higher) because the data are more skewed but this should not
be the case as much with Oregon’s Quality Rating and Improvement System (QRIS).
Continuing with the chart in Figure 5, if the Phi Coefficient is between +.25 and -.25, this
indicates that the indicator is unpredictable in being able to predict overall compliance with the
quality rating assessment tool. Either a false positive in which the indicator appears too often in
the low group as being in compliance, or a false negative in which the indicator appears too often
in the high group as being out of compliance2. This can occur with Phi Coefficients above +.25
but it becomes unlikely as we approach +1.00 although there is always the possibility that other
standards/rules/regulations could be found out of compliance (this was demonstrated in a study
conducted by the author (Fiene, 2013c) with Head Start programs). Another solution is to
increase the number of key indicators to be reviewed but this will cut down on the efficiency
which is desirable and the purpose of the key indicators.
The last possible outcome with the Phi Coefficient is if it is between -.26 and -1.00, this indicates
that the indicator is a terrible predictor because it is doing just the opposite of the decision we
want to make. The indicator would predominantly be in compliance with the low group rather
than the high group so it would be statistically predicting overall non-compliance. This is
obviously something we do not want to occur.
Figure 5 – Thresholds for the Phi Coefficient (Fiene & Nixon, 1983, 1985)
The key indicators should then only be used with those programs who have attained the highest
rating. It is not intended for those programs that have attained lower ratings. However, even
with those programs that have attained the highest rating, every 3-5 years a full, comprehensive
review using the full set of rules/standards for licensing and QRIS should occur (see Figure 6 for
a graphical depiction). It is intended that a re-validation of the key indicators occur on a periodic
basis to make certain that the key indicators have not changed because of differences in
compliance history. This is an important and necessary step for the state to engage in to
Phi Coefficient Range Characteristic of Indicator Decision
(+1.00) – (+.26) Good Predictor Include
(+.25) – (-.25) Unpredictable Do not Include
(-.26) – (-1.00) Terrible Predictor Do not Include

Oregon DMLMA, Risk Assessment, & Key Indicator Blueprint Report 2013
R e s e a r c h I n s t i t u t e f o r K e y I n d i c a t o r s
Page 6
ascertain the overall validity and reliability of the assessment system. Also there should not have
been any major changes in the program while the key indicators are being administered, such as
the director leaving or a large percentage of teachers leaving or enrollment increasing
significantly, or a change in the licensing status of the program.
Figure 6 - Proposed DMLMA System with Key Indicators (KI)
Use of Oregon Key Indicators (ORKI) for Licensing and/or QRIS with a Full Review every 4th Year
1yr 1yr 1yr 1yr 1yr 1yr
TECHNICAL ASPECTS OF THE RISK ASSESSMENT METHODOLOGY
The risk assessment methodology is very different from the key indicator methodology in that
compliance history data are not utilized but rather a best practice ranking according to risk is
used to determine which rules become core rules which have the greatest likelihood to place
children at significant risk of morbidity or mortality. This is done by having a group of experts
rank order all the rules on a Likert Scale from low risk to high risk of mortality or morbidity that
non-compliance with the rule places children at. This is generally done on a 1-10 scale with 1 =
low risk; 5 = medium risk; and 10 = high risk (see Figure 6A). The experts selected include but
are not limited to licensing staff, policy makers, researchers, child care providers, advocacy
groups, parents, and other significant stakeholders who will be impacted by the weighting of the
rules.
Figure 6A – Example of a Likert Scale for Measuring Risk to Children
Low Risk Medium Risk High Risk
1 2 3 4 5 6 7 8 9 10
Once the data are collected from all the experts, it is averaged for each rule to determine its
relative rank in comparison to all the other rules. A significantly high threshold or cut off point
is determined so that no more than 5-10% of the rules become core rules. These core rules can
then be used in a differential monitoring approach (to be described more fully in the next section)
HIKI QRIS
HIKI QRIS
HIKI QRIS
HIKI QRIS
FULL
REVIEW
HIKI QRIS
HIKI QRIS
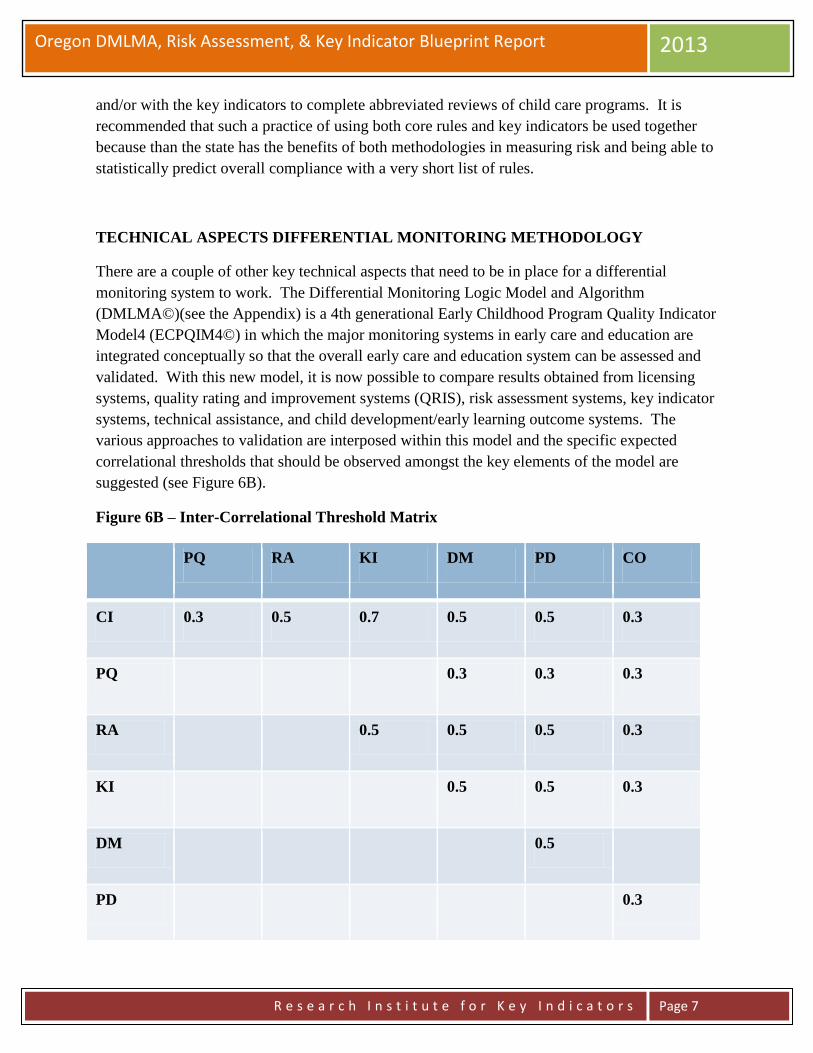
Oregon DMLMA, Risk Assessment, & Key Indicator Blueprint Report 2013
R e s e a r c h I n s t i t u t e f o r K e y I n d i c a t o r s
Page 7
and/or with the key indicators to complete abbreviated reviews of child care programs. It is
recommended that such a practice of using both core rules and key indicators be used together
because than the state has the benefits of both methodologies in measuring risk and being able to
statistically predict overall compliance with a very short list of rules.
TECHNICAL ASPECTS DIFFERENTIAL MONITORING METHODOLOGY
There are a couple of other key technical aspects that need to be in place for a differential
monitoring system to work. The Differential Monitoring Logic Model and Algorithm
(DMLMA©)(see the Appendix) is a 4th generational Early Childhood Program Quality Indicator
Model4 (ECPQIM4©) in which the major monitoring systems in early care and education are
integrated conceptually so that the overall early care and education system can be assessed and
validated. With this new model, it is now possible to compare results obtained from licensing
systems, quality rating and improvement systems (QRIS), risk assessment systems, key indicator
systems, technical assistance, and child development/early learning outcome systems. The
various approaches to validation are interposed within this model and the specific expected
correlational thresholds that should be observed amongst the key elements of the model are
suggested (see Figure 6B).
Figure 6B – Inter-Correlational Threshold Matrix
PQ RA KI DM PD CO
CI 0.3 0.5 0.7 0.5 0.5 0.3
PQ 0.3 0.3 0.3
RA 0.5 0.5 0.5 0.3
KI 0.5 0.5 0.3
DM 0.5
PD 0.3

Oregon DMLMA, Risk Assessment, & Key Indicator Blueprint Report 2013
R e s e a r c h I n s t i t u t e f o r K e y I n d i c a t o r s
Page 8
Key Elements (see the Appendix): CI = state or federal standards, usually rules or regulations
that measure health and safety - Caring for Our Children or Head Start Performance Standards
will be applicable here. PQ = Quality Rating and Improvement Systems (QRIS) standards at the
state level; ERS (ECERS, ITERS, FDCRS), CLASS, or CDPES (Fiene, 2007). RA = risk
assessment tools/systems in which only the most critical rules/standards are measured. Stepping
Stones is an example of this approach. KI = key indicators in which only predictor
rules/standards are measured. The Thirteen Indicators of Quality Child Care is an example of
this approach. DM = differential monitoring decision making in which it is determined if a
program is in compliance or not and the number of visits/the number of rules/standards are
ascertained from a scoring protocol. PD = technical assistance/training and/or professional
development system which provides targeted assistance to the program based upon the DM
results. CO = child outcomes which assesses how well the children are developing which is the
ultimate goal of the system.
Once the above key elements are in place, it is then possible to look at the relationships amongst
them to determine if the system is operating as it was intended. This is done through a validation
of the overall system and assessing the inter-correlations (Table 6B) to determine that the DM
system is improving the health, safety, program quality and ultimately the overall development
of the children it serves.
Oregon should use the following plan to implement the above approach:
STATE AGENCY PLAN (These Steps can be viewed as an overall plan as outlined in Zellman
& Fiene (2012):
The first step in utilizing the DMLMA for a state is to take a close look at its Comprehensive
Licensing Tool (CI) that it uses to collect violation data on all rules with all facilities in its
respective state. If the state does not utilize a tool or checklist or does not review all violation
data than it needs to consider these changes because the DMLMA is based upon an Instrument
Based Program Monitoring System (IPM) which utilizes tools/checklists to collect data on all
rules.
The second step for the state is to compare their state’s rules with the National Health and Safety
Performance Standards (Caring for Our Children) to determine the overlap and coverage
between the two. This is the first approach to validation which involves Standards review
(Zellman & Fiene, 2012).
The third step for the state if it utilizes a Risk Assessment (RA) tool is to assess the relationship
between this tool and Stepping Stones to determine the overlap and coverage between the two.
This is a continuation of the first approach to validation which involves Standards review
(Zellman & Fiene, 2012).

Oregon DMLMA, Risk Assessment, & Key Indicator Blueprint Report 2013
R e s e a r c h I n s t i t u t e f o r K e y I n d i c a t o r s
Page 9
The fourth step for the state is to compare the results from the CI with the RA tools. This step is
the second approach to validation which involves Measures (Zellman & Fiene, 2012). The
correlation between CI and RA should be at the .50 level or higher (.50+)(see Figure 6B).
In the fifth step, if a state is fortunate enough to have a QRIS – Quality Rating and Improvement
System in place and has sufficient program quality (PQ) data available then they will have the
ability to compare results from their CI tool with their PQ tool and validate outputs by
determining the relationship between compliance with health and safety rules (CI) and program
quality (PQ) measures, such as the ERS’s, CLASS, CDPES, etc… This is a very important step
because very few empirical demonstrations appear in the research literature regarding this
relationship. This step is the third approach to validation which involves Outputs (Zellman &
Fiene, 2012). It would be expected that lower correlations (.30+) would be found between CI
and PQ because these tools are measuring different aspects of quality such as health & safety
versus caregiver-child interactions or overall classroom quality.
The sixth step is for the state to generate a Key Indicator (KI) tool from the CI data base. Please
see Fiene & Nixon (1985) and Fiene & Kroh (2000) for a detailed explanation of the
methodology for generating a KI tool. This step is also part of the second approach to validation
which involves Measures. The correlation between the CI and KI should be very high (.70+)
because the KI is a subset of predictor rules taken from the CI data base. If a state did not want
to use the KI methodology, a direct comparison could be drawn from The Thirteen Indicators of
Quality Child Care (Fiene, 2002).
The seventh step for the state is to use the RA and KI tools together to determine overall
compliance of facilities and how often and which rules will be monitored for future visits. This
is the basic component of a Differential Monitoring (DM) approach and continues the second
approach to validation (Measures). Also, this step should drive decisions within the technical
assistance/training/professional development (PD) system in what resources are allocated to a
particular facility. It would be expected that moderate correlations (.50+) would be found
amongst RA, KI, DM, and PD.
The eighth and final step for the state is to compare the results from the various monitoring tools
(CI, PQ, RA, KI) with any child development outcome (CO) data they collect. This is a
relatively new area and few, if any, states at this point have this capability on a large scale.
However, as Early Learning Networks and Standards are developed, this will become more
common place. This step is the forth approach to validation which involves Outcomes (Zellman
& Fiene, 2012). The correlations between CI, PQ, RA, KI and CO will be on the lower end
(.30+) because there are so many other variables that impact children’s development other than
child care facilities.
The last step is to present a logic model which depicts how a differential monitoring system
could potentially be actually used in Oregon (see Figure 6C).
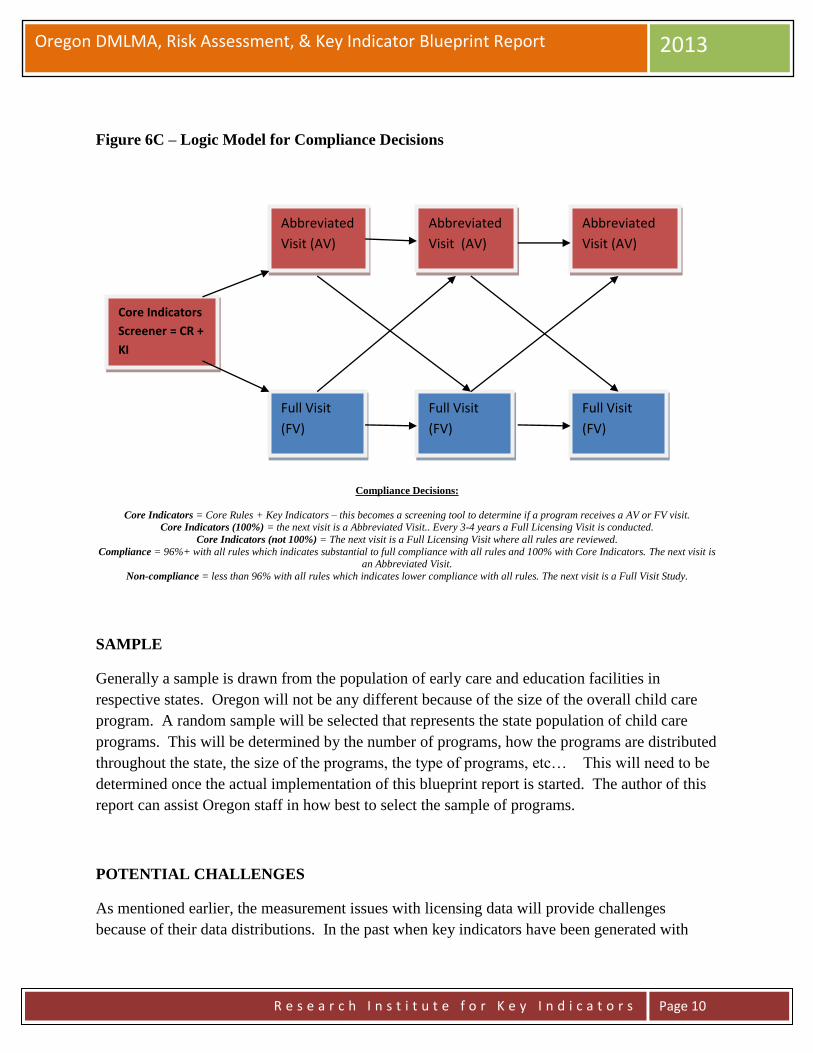
Oregon DMLMA, Risk Assessment, & Key Indicator Blueprint Report 2013
R e s e a r c h I n s t i t u t e f o r K e y I n d i c a t o r s
Page 10
Figure 6C – Logic Model for Compliance Decisions
Compliance Decisions:
Core Indicators = Core Rules + Key Indicators – this becomes a screening tool to determine if a program receives a AV or FV visit. Core Indicators (100%) = the next visit is a Abbreviated Visit.. Every 3-4 years a Full Licensing Visit is conducted.
Core Indicators (not 100%) = The next visit is a Full Licensing Visit where all rules are reviewed.
Compliance = 96%+ with all rules which indicates substantial to full compliance with all rules and 100% with Core Indicators. The next visit is an Abbreviated Visit.
Non-compliance = less than 96% with all rules which indicates lower compliance with all rules. The next visit is a Full Visit Study.
SAMPLE
Generally a sample is drawn from the population of early care and education facilities in
respective states. Oregon will not be any different because of the size of the overall child care
program. A random sample will be selected that represents the state population of child care
programs. This will be determined by the number of programs, how the programs are distributed
throughout the state, the size of the programs, the type of programs, etc… This will need to be
determined once the actual implementation of this blueprint report is started. The author of this
report can assist Oregon staff in how best to select the sample of programs.
POTENTIAL CHALLENGES
As mentioned earlier, the measurement issues with licensing data will provide challenges
because of their data distributions. In the past when key indicators have been generated with
Core Indicators
Screener = CR +
KI
Abbreviated
Visit (AV)
Full Visit
(FV)
Abbreviated
Visit (AV)
Abbreviated
Visit (AV)
Full Visit
(FV)
Full Visit
(FV)

Oregon DMLMA, Risk Assessment, & Key Indicator Blueprint Report 2013
R e s e a r c h I n s t i t u t e f o r K e y I n d i c a t o r s
Page 11
licensing data which are highly skewed, dichotomization of the data is regularly done3.
Generally dichotomization of data should not be done with normally distributed data4; however,
in this case with QRIS systems, it is appropriate to do so since the data lend themselves to being
sorted into discrete categories, such as rating levels. The dichotomization will compare the
lowest rating level with the highest rating level in order to generate the key indicators.
Figure 7 – Data Distribution Comparisons of ERS, QRIS, and Licensing Data
TIMELINE
As soon as all early care and education programs have gone through their assessment phase, it
will be possible to do the calculations to determine the Phi Coefficients and generate the key
indicators. I am guessing that this should not take any longer than 1 year but could be completed
in a much shorter period of time if the assessments on individual programs could be moved up
(see Figure 8). The analytical phase should take no longer than a month with an additional
month to write up the report. A face to face presentation of the analyses could be done after
these two months.
The timeline presented in Figure 8 can be adjusted to the specific needs for the Oregon system.
The timeline is based upon previous projects and the average time to generate risk assessment

Oregon DMLMA, Risk Assessment, & Key Indicator Blueprint Report 2013
R e s e a r c h I n s t i t u t e f o r K e y I n d i c a t o r s
Page 12
core rules and key indicators. Another consideration or task is the development of the policies
and procedures to be developed and implemented regarding the use of key indicators. This was
not specifically listed on the timeline because it is something that is generally developed
throughout the project with feedback from all the stakeholders who will be impacted by the use
of this new approach to assessment and monitoring.
Figure 8 - OREGON DMLMA PROJECT TIMELINE
TASK
MONTHS
Collect Data M1-M3 Sort Data
M2-3 Run Analyses
M3-5 Generate KI/RA
M6 Train on KI/RA
M6-7 KI/RA Reliable
M7-9 Implementation
M10-12
Legend:
KI – Key Indicators
RA – Risk Assessment
Collect Data – identify participant programs via sampling for KI and the stakeholders for RA.
Sort Data – KI - the individual programs are sorted into high and low groups representing the top 25% and the bottom 25% of
programs as they have scored on the respective rules/standards.
Run Analyses – KI - each individual item within each of the assessment tools for every program will be compared to the sorting
process of the high and low groups. RA – aggregate data into means for each rule, rank order the rules.
Generate KI/RA – a 2 x 2 matrix is constructed and the key indicators (KI) are generated from this matrix through the use of a
phi coefficient. A final report will be delivered to Oregon executive staff for both KI and RA core indicator rules.
Training on KI/RA – all staff who will be using the KI/RA will be trained on its use.
KI/RA Reliability – reliability will be established by having two staff go out together and administer the key indicators
separately and comparing their results.
Implementation – once reliability has been established, full implementation will begin.
COST SAVINGS
Again based upon previous studies most recently completed in California in 2010
(http://www.myccl.ca.gov/res/docs/12022010HandoutStakeholderMeeting.pdf), time savings of 50%
have been attained by using a key indicator or abbreviated tool in completing assessments. It
only makes sense that if an assessment can be completed in one hour rather than 2 – 4 hours that
a state will see time savings. It is being assumed that equivalent savings should also be the case
with Oregon’s licensing/QRIS although this cannot be made certain until the new key indicator
or abbreviated tool is actually used for a period of time. Once the new key indicators are used
for several months, comparisons could be made to when the full assessments were done.

Oregon DMLMA, Risk Assessment, & Key Indicator Blueprint Report 2013
R e s e a r c h I n s t i t u t e f o r K e y I n d i c a t o r s
Page 13
CONCLUSION AND NEXT STEPS
This blueprint report has given the basic parameters to develop a differential monitoring, risk
assessment, and key indicator approach to Oregon’s Licensing/QRIS systems. By following this
blueprint Oregon staff should be able to fully implement the approach. Oregon staff would also
need to determine if they have the internal capability for the development of the key indicators or
if there will be the need to outsource certain aspects of the development. This will be an
important consideration as Oregon moves forward with this project. I have provided two options
for your consideration in moving forward.
Option 1 – Development of System Internally:
This would require either information systems or research & evaluation staff to analyze the data,
generate core key indicator rules, and training of staff. I could provide the necessary consulting
services to help the staff work through the methodology. This would probably require at least
one face to face meeting with regular monthly conference calls between myself and staff.
Discussions of the formatting of data and the types of analyses would be discussed and
demonstrated.
Option 2 – Development of System Externally:
In this option I could do all the methodological work demonstrating how I would need the data
sent to me, the analytical work in generating core key indicator rules, a report detailing the
methodology and results. The only thing that Oregon staff would need to do is get the data to
me, all other aspects of what is delineated in the timeline in Figure 8 would be completed by me.
This would probably require several face to face trips to explain the process, the results, and do
training of staff. Once everything was in place, Oregon staff would have a fully implemented
system.
If the above options are of interest I can provide detailed budgets for either one or both.
Oregon DMLMA, Risk Assessment, & Key Indicator Blueprint Report 2013
R e s e a r c h I n s t i t u t e f o r K e y I n d i c a t o r s
Page 14
Notes:
1, 4. The reason for pointing out the need to have a higher Phi Coefficient than what has been reported
previously (Fiene & Nixon, 1983, 1985) is the fact that the dichotomization of data should only be used with
skewed data and not normally distributed data because it will accentuate differences. However, since the
purpose of the dichotomization of data is only for sorting into a high and low group, it would appear to be
acceptable for this purpose (MacCallun, etal, 2002. On the practice of dichotomization of quantitative variables,
Psychological Methods, 7, 1, 19-40.).
2. These results would show an increase in cells B and C in Figure 1 which is undesirable; it should
always be the case where A + D > B + C for key indicators to maintain their predictive validity.
3. The distinction between making decisions with skewed (Licensing) as versus normally distributed (ERS)
data is an important one because there is a greater likelihood with skewed data of introducing less than optimal
programs into the high group when sorting programmatic data into high and low groups. This then makes it
more difficult to identify the best programs. However, because of the distribution with skewed data the same
cannot be said with the low group in which case it is relatively easy to identify the problem programs. This is
not as much of a concern when the data are more normally distributed in which it is relatively easy to identify
both the optimal and problem programs. This is an excellent example of the need of weighting of standards in
order to increase the normal distribution of the data.

Oregon DMLMA, Risk Assessment, & Key Indicator Blueprint Report 2013
R e s e a r c h I n s t i t u t e f o r K e y I n d i c a t o r s
Page 15
REFERENCES AND ADDITIONAL RELATED READINGS REGARDING DMLMA:
Barnard, Smith, Fiene, Swanson (2006). Evaluation of Pennsylvania’s Keystone STARS Quality
Rating and Improvement System, Pittsburgh: Pennsylvania, Office of Child Development.
Fiene (2013a). A comparison of international child care and US child care using the Child Care
Aware – NACCRRA (National Association of Child Care Resource and Referral Agencies) child
care benchmarks, International Journal of Child Care and Education Policy, 7(1), 1-15.
Fiene (2013b). Differential monitoring logic model and algorithm. Middletown: Pennsylvania,
Research Institute for Key Indicators.
Fiene (2013c). Head Start Key Indicators. Middletown: Pennsylvania, Research Institute for Key
Indicators.
Fiene (2013d). Kansas Child Care Key Indicators. Middletown: Pennsylvania, Research Institute
for Key Indicators.
Fiene (2013e). Validation of Georgia’s core rule differential monitoring system. Middletown:
Pennsylvania, Research Institute for Key Indicators.
Fiene (2007). Child Development Program Evaluation & Caregiver Observation Scale, in T Halle
(Ed.), Early Care and Education Quality Measures Compendium, Washington, D.C.: Child
Trends.
Fiene (2003). Licensing related indicators of quality child care, Child Care Bulletin, winter
2002-2003, pps 12-13.
Fiene (2002a). Thirteen indicators of quality child care: Research update. Washington, DC:
Office of the Assistant Secretary for Planning and Evaluation, US Department of Health and
Human Services.
Fiene (2002b). Improving child care quality through an infant caregiver mentoring project, Child
and Youth Care Forum, 31(2), 75-83.
Fiene, Iutcovich, Johnson, & Koppel (1998). Child day care quality linked to opportunities for
professional development: An applied community psychology example. Community Psychologist,
31(1), 10-11.
Fiene (1996). Using a statistical-indicator methodology for accreditation, in NAEYC
Accreditation: A Decade of Learning and the Years Ahead, S. Bredekamp & B. Willer, editors,
Washington, D.C.: National Association for the Education of Young Children.
Fiene (1995). Utilizing a statewide training system to improve child day care quality: The other
system in a program quality improvement model. Child Welfare, Volume LXXIV, #6, November-
December, 1189-1201.
Oregon DMLMA, Risk Assessment, & Key Indicator Blueprint Report 2013
R e s e a r c h I n s t i t u t e f o r K e y I n d i c a t o r s
Page 16
Fiene (1985). Measuring the effectiveness of regulations, New England Journal of Human
Services, 5(2), 38-39.
Fiene (1981). A new tool for day care monitoring introduced by children's consortium,
Evaluation Practice, 1(2), 10-11.
Fiene, Greenberg, Bergsten, Carl, Fegley, & Gibbons (2002). The Pennsylvania early childhood
quality settings study, Harrisburg, Pennsylvania: Governor’s Task Force on Early Care and
Education.
Fiene & Kroh (2000). Licensing Measurement and Systems, NARA Licensing Curriculum.
Washington, D.C.: National Association for Regulatory Administration.
Fiene & Nixon (1985). Instrument based program monitoring and the indicator checklist for child
care, Child Care Quarterly, 14(3), 198-214.
Griffin & Fiene (1995). A systematic approach to policy planning and quality improvement for
child care: A technical manual for state administrators. Washington, D.C.: National Center for
Clinical Infant Programs-Zero to Three.
Kontos & Fiene (1987). Child care quality, compliance with regulations, and children's
development: The Pennsylvania Study, in Quality in Child Care: What Does Research Tell Us?
Phillips, editor, Washington, D.C.: National Association for the Education of Young Children.
Zellman, G. L. and Fiene, R. (2012). Validation of Quality Rating and Improvement Systems for
Early Care and Education and School-Age Care, Research-to-Policy, Research-to-Practice Brief
OPRE 2012. Washington, DC: Office of Planning, Research and Evaluation, Administration for
Children and Families, U.S. Department of Health and Human Services
For additional information regarding this report, please contact:
Richard Fiene, Ph.D., Director/President
Research Institute for Key Indicators (RIKI)
41 Grandview Drive
Middletown, PA. 17057
717-944-5868 Phone and Fax
http://RIKInstitute.wikispaces.com
http://pennstate.academia.edu/RickFiene
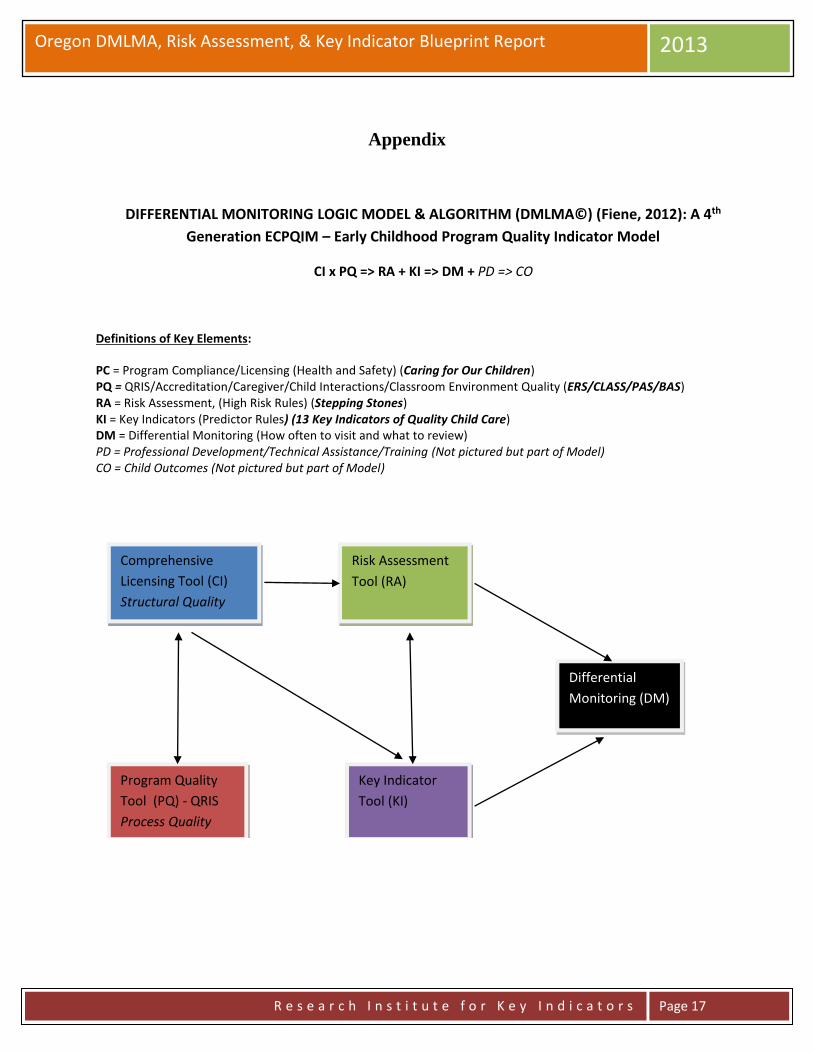
Oregon DMLMA, Risk Assessment, & Key Indicator Blueprint Report 2013
R e s e a r c h I n s t i t u t e f o r K e y I n d i c a t o r s
Page 17
Appendix
DIFFERENTIAL MONITORING LOGIC MODEL & ALGORITHM (DMLMA©) (Fiene, 2012): A 4th
Generation ECPQIM – Early Childhood Program Quality Indicator Model
CI x PQ => RA + KI => DM + PD => CO
Definitions of Key Elements:
PC = Program Compliance/Licensing (Health and Safety) (Caring for Our Children) PQ = QRIS/Accreditation/Caregiver/Child Interactions/Classroom Environment Quality (ERS/CLASS/PAS/BAS) RA = Risk Assessment, (High Risk Rules) (Stepping Stones) KI = Key Indicators (Predictor Rules) (13 Key Indicators of Quality Child Care) DM = Differential Monitoring (How often to visit and what to review) PD = Professional Development/Technical Assistance/Training (Not pictured but part of Model) CO = Child Outcomes (Not pictured but part of Model)
Comprehensive
Licensing Tool (CI)
Structural Quality
Program Quality
Tool (PQ) - QRIS
Process Quality
Risk Assessment
Tool (RA)
Key Indicator
Tool (KI)
Differential
Monitoring (DM)
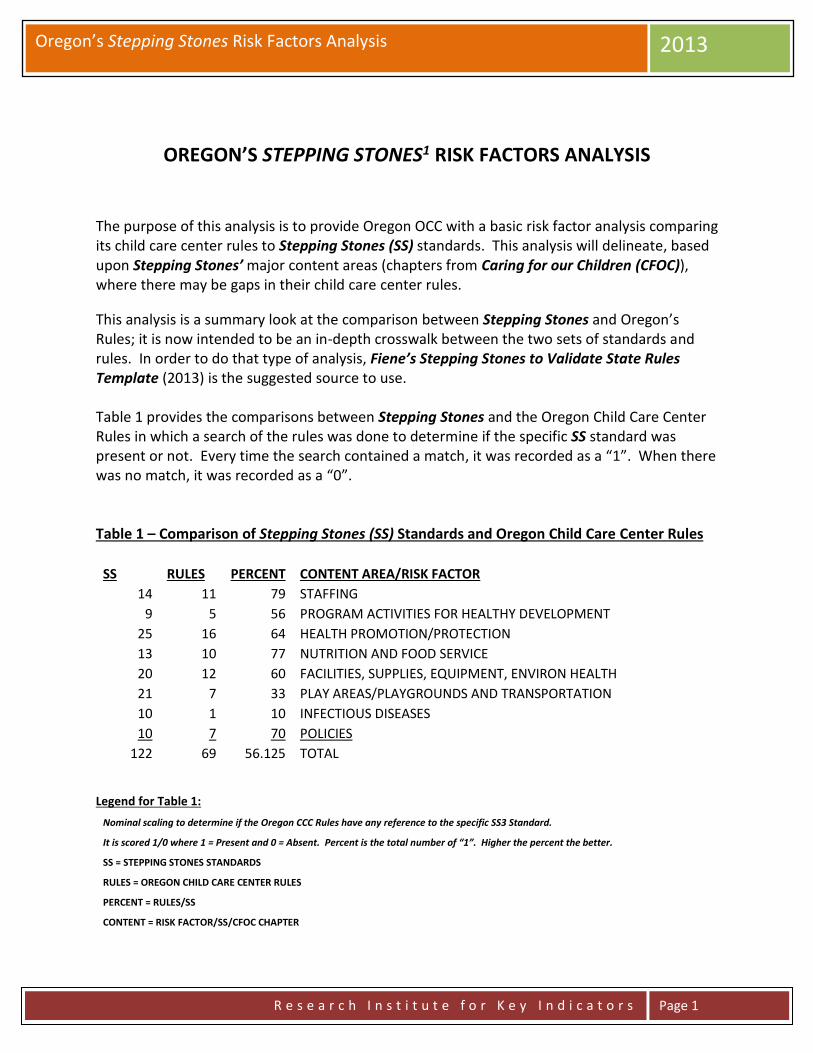
Oregon’s Stepping Stones Risk Factors Analysis 2013
R e s e a r c h I n s t i t u t e f o r K e y I n d i c a t o r s
Page 1
OREGON’S STEPPING STONES1 RISK FACTORS ANALYSIS
The purpose of this analysis is to provide Oregon OCC with a basic risk factor analysis comparing its child care center rules to Stepping Stones (SS) standards. This analysis will delineate, based upon Stepping Stones’ major content areas (chapters from Caring for our Children (CFOC)), where there may be gaps in their child care center rules.
This analysis is a summary look at the comparison between Stepping Stones and Oregon’s Rules; it is now intended to be an in-depth crosswalk between the two sets of standards and rules. In order to do that type of analysis, Fiene’s Stepping Stones to Validate State Rules Template (2013) is the suggested source to use. Table 1 provides the comparisons between Stepping Stones and the Oregon Child Care Center Rules in which a search of the rules was done to determine if the specific SS standard was present or not. Every time the search contained a match, it was recorded as a “1”. When there was no match, it was recorded as a “0”. Table 1 – Comparison of Stepping Stones (SS) Standards and Oregon Child Care Center Rules
SS RULES PERCENT CONTENT AREA/RISK FACTOR 14 11 79 STAFFING
9 5 56 PROGRAM ACTIVITIES FOR HEALTHY DEVELOPMENT
25 16 64 HEALTH PROMOTION/PROTECTION 13 10 77 NUTRITION AND FOOD SERVICE 20 12 60 FACILITIES, SUPPLIES, EQUIPMENT, ENVIRON HEALTH
21 7 33 PLAY AREAS/PLAYGROUNDS AND TRANSPORTATION
10 1 10 INFECTIOUS DISEASES 10 7 70 POLICIES
122 69 56.125 TOTAL
Legend for Table 1:
Nominal scaling to determine if the Oregon CCC Rules have any reference to the specific SS3 Standard.
It is scored 1/0 where 1 = Present and 0 = Absent. Percent is the total number of “1”. Higher the percent the better.
SS = STEPPING STONES STANDARDS
RULES = OREGON CHILD CARE CENTER RULES
PERCENT = RULES/SS
CONTENT = RISK FACTOR/SS/CFOC CHAPTER

Oregon’s Stepping Stones Risk Factors Analysis 2013
R e s e a r c h I n s t i t u t e f o r K e y I n d i c a t o r s
Page 2
This comparison was completed on the major chapter headings in Stepping Stones and Caring for our Children as delineated in the Content/Risk Factor Column in Table 1. The following table (Table 2) provides the detail of the contents of each content area/risk factor. Table 2 – Major Content/Risk Factor Areas (1-8) and Specific Content for Each Area
1. STAFFING A. CHILD:STAFF RATIO AND GROUP SIZE B. RECRUITMENT AND BACKGROUND
SCREENING C. DIRECTOR’S QUALIFICATIONS D. TEACHER’S QUALIFICATIONS E. PRE-SERVICE TRAINING F. ORIENTATION TRAINING G. FIRST AID AND CPR TRAINING H. STAFF HEALTH
2. PROGRAM ACTIVITIES FOR HEALTHY DEVELOPMENT
A. PROGRAM ACTIVITIES FOR INFANTS, TODDLERS, PRESCHOOLERS, AND SCHOOL AGE CHILDREN
B. SUPERVISION AND DISCIPLINE C. HEALTH INFORMATION SHARING D. HEALTH EDUCATION FOR CHILDREN E. HEALTH EDUCATION FOR STAFF F. HEALTH EDUCATION FOR PARENTS
3. HEALTH PROMOTION AND PROTECTION
A. DAILY HEALTH CHECK B. ROUTINE HEALTH SUPERVISION C. PHYSICAL ACTIVITY AND LIMITING
SCREEN TIME D. SAFE SLEEP E. ORAL HEALTH F. DIAPERING AND CHANGING SOILED
CLOTHING G. HAND HYGIENE H. EXPOSURE TO BODY FLUIDS I. EMERGENCY PROCEDURES J. CHILD ABUSE AND NEGLECT K. INCLUSION/EXCLUSION DUE TO
ILLNESS L. CARING FOR CHILDREN WHO ARE ILL M. MEDICATIONS
4. NUTRITION AND FOOD SERVICE
A. MEAL SERVICE, SEATING, SUPERVISION B. FOOD BROUGHT FROM HOME C. KITCHEN AND EQUIPMENT D. FOOD SAFETY

Oregon’s Stepping Stones Risk Factors Analysis 2013
R e s e a r c h I n s t i t u t e f o r K e y I n d i c a t o r s
Page 3
E. MEALS FROM OUTSIDE VENDORS OR CENTRAL KITCHEN
F. NUTRITION LEARNING EXPERIENCES FOR CHILDREN
G. NUTRITION EDUCATION FOR PARENTS
5. FACILITIES, SUPPLIES, EQUIPMENT, AND ENVIRONMENTAL HEALTH
A. GENERAL LOCATION, LAYOUT, AND CONSTRUCTION OF THE FACILITY
B. SPACE PER CHILD C. EXITS D. STEPS AND STAIRS E. EXTERIOR AREAS F. VENTILATION, HEATING, COOLING,
AND HOT WATER G. LIGHTING H. NOISE I. ELECTRICAL FIXTURES AND OUTLETS J. FIRE WARNING SYSTEMS K. WATER SUPPLY AND PLUMBING L. SEWAGE AND GARBAGE M. INTEGRATED PEST MANAGEMENT N. PREVENTION AND MANAGEMENT OF
TOXIC SUBSTANCES O. TOILET AND HANDWASHING AREAS P. DIAPER CHANGING AREAS Q. SLEEP AND REST AREAS
6. PLAY AREAS/PLAYGROUNDS AND TRANSPORTATION
A. PLAYGROUND SIZE AND LOCATION B. USE ZONES AND CLEARANCE
REQUIREMENTS C. PLAY AREA AND PLAYGROUND
SURFACING D. INSPECTION OF PLAY AREAS AND
EQUIPMENT E. ACCESS TO AND SAFETY AROUND
BODIES OF WATER F. POOL EQUIPMENT AND MAINTENANCE G. WATER QUALITY OF POOLS H. TRANSPORTATION SAFETY
7. INFECTIOUS DISEASES A. HOW INFECTIONS SPREAD B. IMMUNIZATIONS C. RESPIRATORY TRACT INFECTIONS D. ENTERIC (DIARRHEAL) INFECTIONS
AND HEPATITIS A VIRUS (HAV) E. SKIN AND MUCOUS MEMBRANE
INFECTIONS

Oregon’s Stepping Stones Risk Factors Analysis 2013
R e s e a r c h I n s t i t u t e f o r K e y I n d i c a t o r s
Page 4
F. BLOODBORNE INFECTIONS G. HERPES VIRUSES H. INTERACTION WITH STATE OR LOCAL
HEALTH DEPARTMENTS
8. POLICIES A. HEALTH POLICIES B. EMERGENCY/SECURITY POLICIES AND
PLANS C. TRANSPORTATION POLICIES D. PLAY AREA POLICIES E. FACILITY RECORDS/REPORTS F. CHILD RECORDS G. STAFF RECORDS
Table 2 provides you with the specific content as it relates to the risk factors. Figures 1 and 2 as well as Table 3 will provide the comparison between SS standards and Oregon’s child care center rules by these content areas/risk factors. Figure 1 does this comparison by listing for each content area/risk factor the frequency count where there is a match between rules and standards.
Figure 1 – Comparing Stepping Stones (SS) Standards and Oregon’s Child Care Center Rules
Legend for Figure 1:
1 = STAFFING 2 = PROGRAM ACTIVITIES FOR HEALTHY DEVELOPMENT
3 = HEALTH PROMOTION/PROTECTION
4 = NUTRITION AND FOOD SERVICE

Oregon’s Stepping Stones Risk Factors Analysis 2013
R e s e a r c h I n s t i t u t e f o r K e y I n d i c a t o r s
Page 5
5 = FACILITIES, SUPPLIES, EQUIPMENT, ENVIRON HEALTH
6 = PLAY AREAS/PLAYGROUNDS AND TRANSPORTATION
7 = INFECTIOUS DISEASES 8 = POLICIES
Figure 2 takes the data from Table 1 and Figure 1 and expresses the content areas/risk factors in the form of percents in which the percents represent the number of times the Oregon child care center rules and the Stepping Stones standards match.
Figure 2 – Percent of Stepping Stones Standards in Oregon’s Child Care Center Rules
Legend for Figure 1:
1 = STAFFING 2 = PROGRAM ACTIVITIES FOR HEALTHY DEVELOPMENT
3 = HEALTH PROMOTION/PROTECTION
4 = NUTRITION AND FOOD SERVICE
5 = FACILITIES, SUPPLIES, EQUIPMENT, ENVIRON HEALTH
6 = PLAY AREAS/PLAYGROUNDS AND TRANSPORTATION
7 = INFECTIOUS DISEASES 8 = POLICIES
It is evident from Table 1 and Figures 1 and 2 that the two areas where the greatest gap between the Stepping Stones standards and Oregon’s child care center rules is in the Infectious Diseases and Play Areas/Playgrounds and Transportation content areas/risk factors with a match rate of 10% and 33% respectively. The highest match rates are with the Staffing (79%) and Nutrition & Food Service (77%).

Oregon’s Stepping Stones Risk Factors Analysis 2013
R e s e a r c h I n s t i t u t e f o r K e y I n d i c a t o r s
Page 6
Based upon the above results there are some recommendations to be made where Oregon Office of Child Care staff may want to focus their attention for future rule formulation in the infectious diseases and the play area/playgrounds & transportation content areas. Notes: 1 The reason for using Stepping Stones rather than Caring for our Children is that Stepping Stones are the selected standards from CFOC that place children at greatest risk of mortality and morbidity if the standards are not complied with.
For additional information regarding this report, please contact: Richard Fiene, Ph.D., President, Research Institute for Key Indicators LLC (RIKI) 41 Grandview Avenue, Middletown, Pennsylvania 17057 Phone/Fax: 717-944-5868; Mobile: 717-598-8908 Website: rikinstitute.wikispaces.com Email: [email protected]
RIKILLC

1
11/25/2014
DIFFERENTIAL MONITORING: A FOURTH
GENERATIONAL EARLY CHILDHOOD
PROGRAM QUALITY INDICATOR MODEL
Richard Fiene, Ph.D.
This powerpoint has been presented in either its entirety or portions thereof at several National Venues during 2013 and 2014
RIKI Research Institute for Key Indicators
Methods for Achieving Quality Child Care
Regulatory Paradigms
DMLMA Logic Model & Validation Approaches
DMLMA Expected Thresholds
Licensing/Program Compliance (PC) and Program Quality (PQ)
Risk Assessment (RA) and Key Indicators (KI)
Differential Monitoring (DM)
Professional Development (PD) and Child Outcomes (CO)
Previous Models (ECPQIM 1 – 3)
Contents2

2
11/25/2014
Methods for Achieving Quality Child Care
GOALS
NONREGULATORY METHODS REGULATORY METHODS
Public Education
Training of
Caregivers &
Directors
Association
Membership
Newsletters.,
Journals & Books
Resource &
Referral Centers
Accreditation/CFOC
Credentialing
Rate Setting Fiscal Regulation
Quality Rating &
Improvement
Systems
Stepping
Stones
Environmental
Health
Licensing or
Registration
Building &
Fire Safety
Base line or floor of quality below which no service may legally operate
Exempt
ProgramsCriminal
Sanctions
Illegal Unlicensed
Operations
Abuse & Neglectful Care
Revised from YOUNG CHILDREN
Vol. 34 No. 6 Sept. 1979, pp. 22-27
Gwen G Morgan and updated by
Rick Fiene, Dec 2012.
3
Achieving Quality Child Care
Quality care is achieved by both
regulatory and non-regulatory
approaches. However, licensing
provides the threshold or floor of
quality below which no program
should be permitted to operate.
4

3
11/25/2014
Other regulatory approaches toward
achieving quality
Credentialing: A formally recognized process of certifying an
individual as having fulfilled certain criteria or
requisites. (PD)
Purchase of Regulation by contract in which performance
service contracts: standards are imposed as a contractual obligation. (PQ - QRIS)
Accreditation: The formal recognition that an agency or organization has compiled
with the requisites for accreditation by an accrediting body.
Accreditation usually requires the organization seeking this form of
recognition to pay for the cost of the process. The organization
bestowing the accreditation has no legal authority to compel
compliance. It can only remove accreditation. (PQ)
Best Practices: Through affiliation with professional organizations, an agency
becomes aware of “best practices” and establishes its own goals to
achieve a higher level of care services. (PQ – CFOC)
5
Non-regulatory approaches to achieving quality care
in human services facilities or programs
Consultation
Consumer Education
Peer Support Associations
Professional Organizations
Resource and Referral
Technical Assistance
Training-Staff Development
6

4
11/25/2014
y = 0.0453x + 0.2246R² = 0.8983
0
1
2
3
4
5
6
0 20 40 60 80 100 120PQ
= E
RS/C
LASS
PC = % Rule Compliance
Relationship between PC (CI) & PQ (Fiene & Nixon, 1985)(Fiene, 1985)
KI + RA
Low
Compliance
7
Comparing HSPS Violations with CLASS Scores (Fiene, 2013c)
HSPS/CM Violations IS ES CO Number/Percent
0 (Full Compliance) 3.03 5.99 5.59 75/19%
1-2 (Substantial Compliance) 3.15 5.93 5.50 135/35%
3-8 (Mid-Compliance) 2.87 5.85 5.37 143/40%
9-19 (Lower Compliance) 2.65 5.71 5.32 28/6%
20-25 (Lowest Compliance) 2.56 5.52 4.93 3/1%
Significance F = 4.92; p < .001 F = 4.918; p < .001 F = 4.174; p < .003
CM Violations = Compliance Measure Violations (lower score = higher compliance)(higher score = lower compliance)
IS = Average CLASS IS (Instructional Support) Score
ES = Average CLASS ES (Emotional Support) Score
CO = Average CLASS CO (Classroom Organization) Score
#/% = Number of programs and Percent of programs at each level of compliance
8
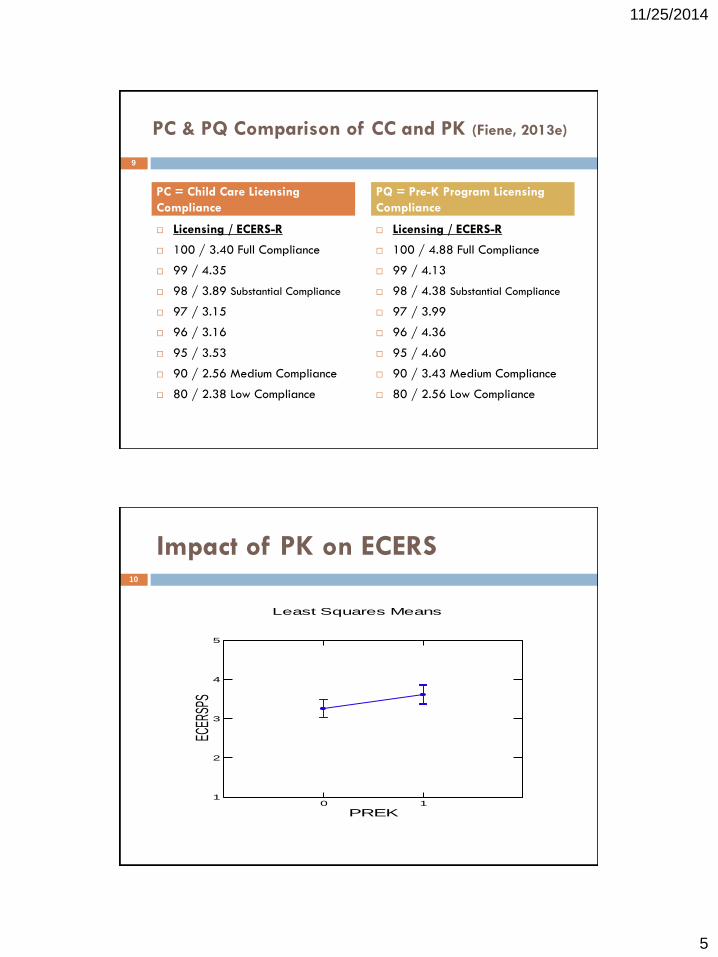
5
11/25/2014
PC & PQ Comparison of CC and PK (Fiene, 2013e)
Licensing / ECERS-R
100 / 3.40 Full Compliance
99 / 4.35
98 / 3.89 Substantial Compliance
97 / 3.15
96 / 3.16
95 / 3.53
90 / 2.56 Medium Compliance
80 / 2.38 Low Compliance
Licensing / ECERS-R
100 / 4.88 Full Compliance
99 / 4.13
98 / 4.38 Substantial Compliance
97 / 3.99
96 / 4.36
95 / 4.60
90 / 3.43 Medium Compliance
80 / 2.56 Low Compliance
PC = Child Care Licensing
Compliance
PQ = Pre-K Program Licensing
Compliance
9
Impact of PK on ECERS
Least Squares Means
0 1
PREK
1
2
3
4
5
ECER
SPS
10
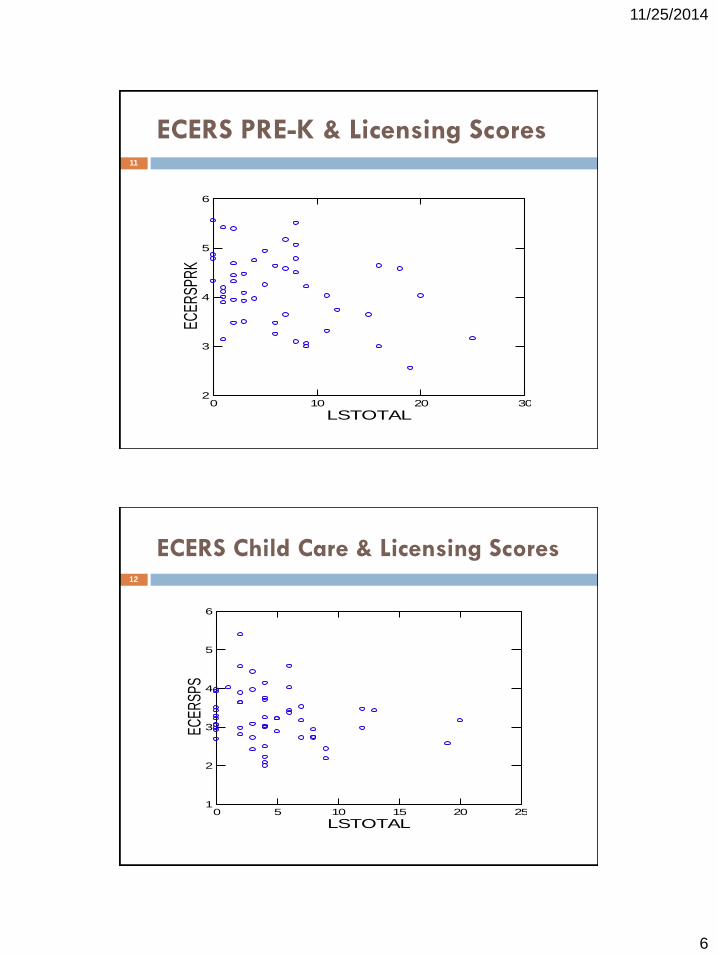
6
11/25/2014
ECERS PRE-K & Licensing Scores
0 10 20 30
LSTOTAL
2
3
4
5
6EC
ERSP
RK
11
ECERS Child Care & Licensing Scores
0 5 10 15 20 25
LSTOTAL
1
2
3
4
5
6
ECER
SPS
12
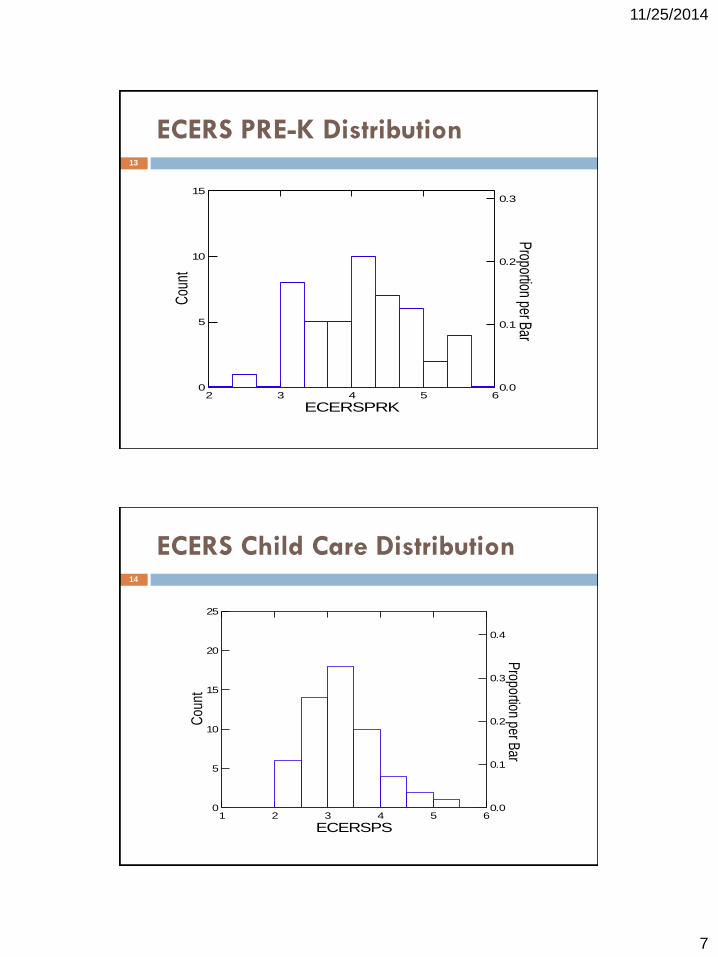
7
11/25/2014
ECERS PRE-K Distribution13
2 3 4 5 6
ECERSPRK
0.0
0.1
0.2
0.3P
roportion per Bar
0
5
10
15C
ount
ECERS Child Care Distribution
1 2 3 4 5 6
ECERSPS
0.0
0.1
0.2
0.3
0.4
Proportion per B
ar
0
5
10
15
20
25
Cou
nt
14
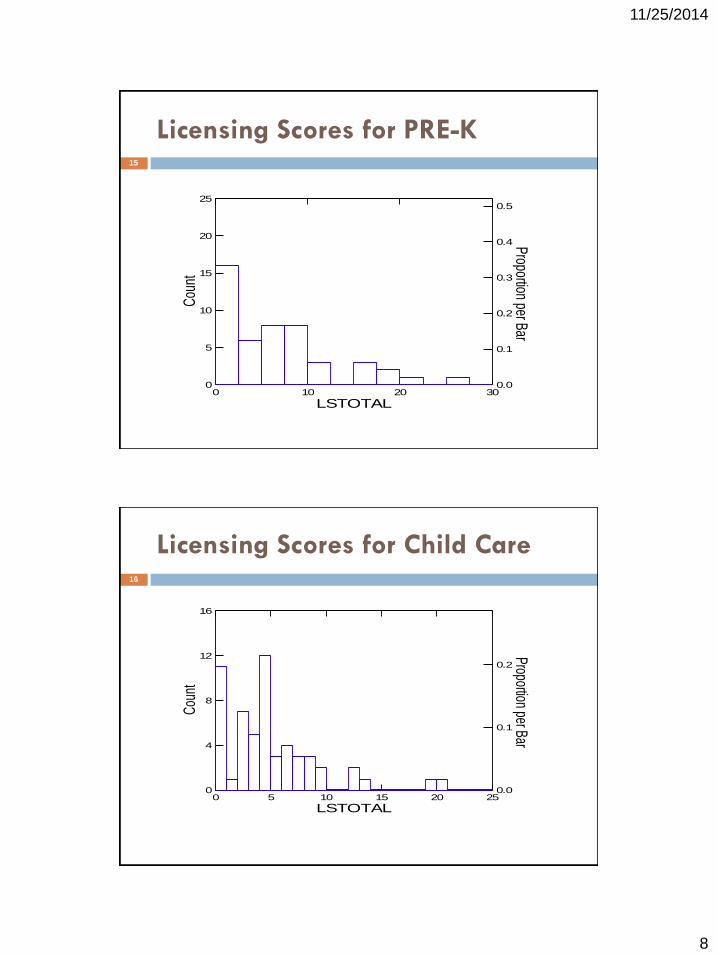
8
11/25/2014
Licensing Scores for PRE-K
0 10 20 30
LSTOTAL
0.0
0.1
0.2
0.3
0.4
0.5Proportion per Bar
0
5
10
15
20
25C
ount
15
Licensing Scores for Child Care
0 5 10 15 20 25
LSTOTAL
0.0
0.1
0.2
Proportion per Bar
0
4
8
12
16
Cou
nt
16

9
11/25/2014
Impact of Pre-K & Higher Standards
Pre-K only ECERS average = 4.15
These are classrooms funded by Pre-K.
Pre-K’s impact on child care, ECERS average = 3.60
These are classrooms not funded by Pre-K but in the
same building as a Pre-K funded classroom.
Child care only ECERS average = 3.26
These are classrooms in programs that are not funded
by Pre-K.
17
Impact of Pre-K on ECERS Scores18
Pre-K, 4.15
Pre-K & PS, 3.6
PS, 3.26
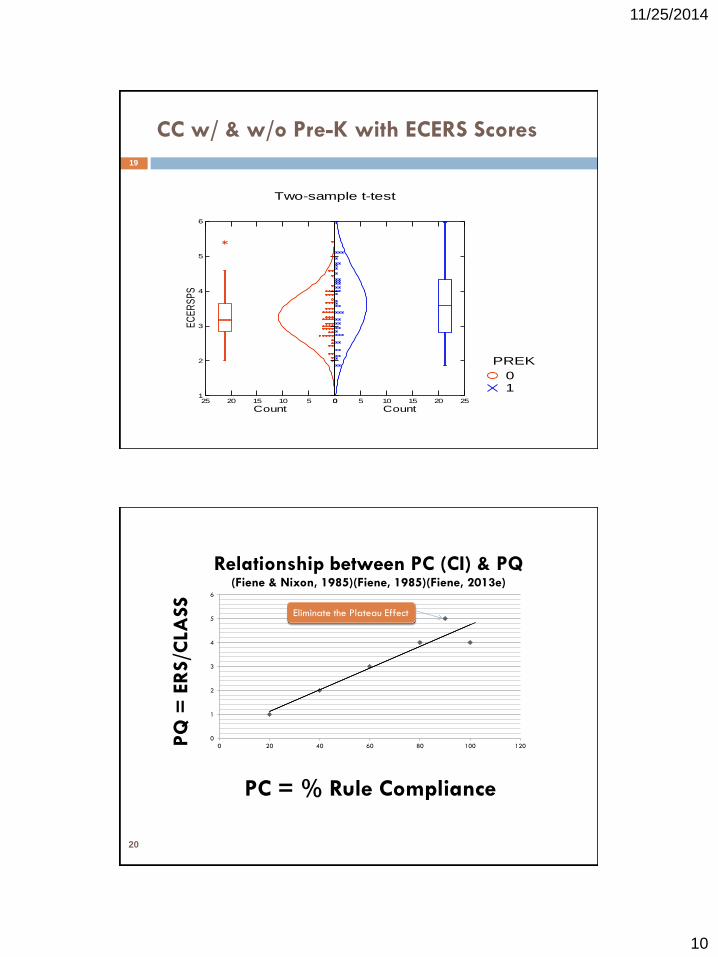
10
11/25/2014
CC w/ & w/o Pre-K with ECERS Scores
Two-sample t-test
10
PREK
0510152025
Count
1
2
3
4
5
6
EC
ER
SP
S
0 5 10 15 20 25
Count
19
20
0
1
2
3
4
5
6
0 20 40 60 80 100 120PQ
= E
RS/C
LASS
PC = % Rule Compliance
Relationship between PC (CI) & PQ (Fiene & Nixon, 1985)(Fiene, 1985)(Fiene, 2013e)
Eliminate the Plateau Effect
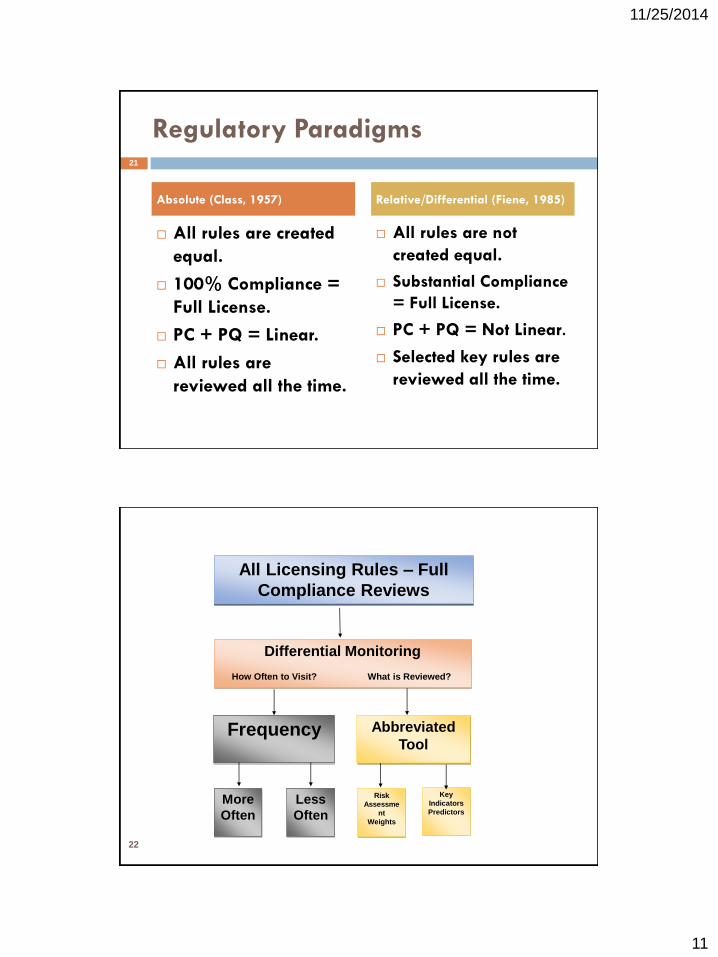
11
11/25/2014
Regulatory Paradigms
All rules are created
equal.
100% Compliance =
Full License.
PC + PQ = Linear.
All rules are
reviewed all the time.
All rules are not
created equal.
Substantial Compliance
= Full License.
PC + PQ = Not Linear.
Selected key rules are
reviewed all the time.
Absolute (Class, 1957) Relative/Differential (Fiene, 1985)
21
22
All Licensing Rules – Full
Compliance Reviews
Differential Monitoring
How Often to Visit? What is Reviewed?
Frequency Abbreviated
Tool
More
Often
Less
Often
Risk
Assessme
nt
Weights
Key
Indicators
Predictors
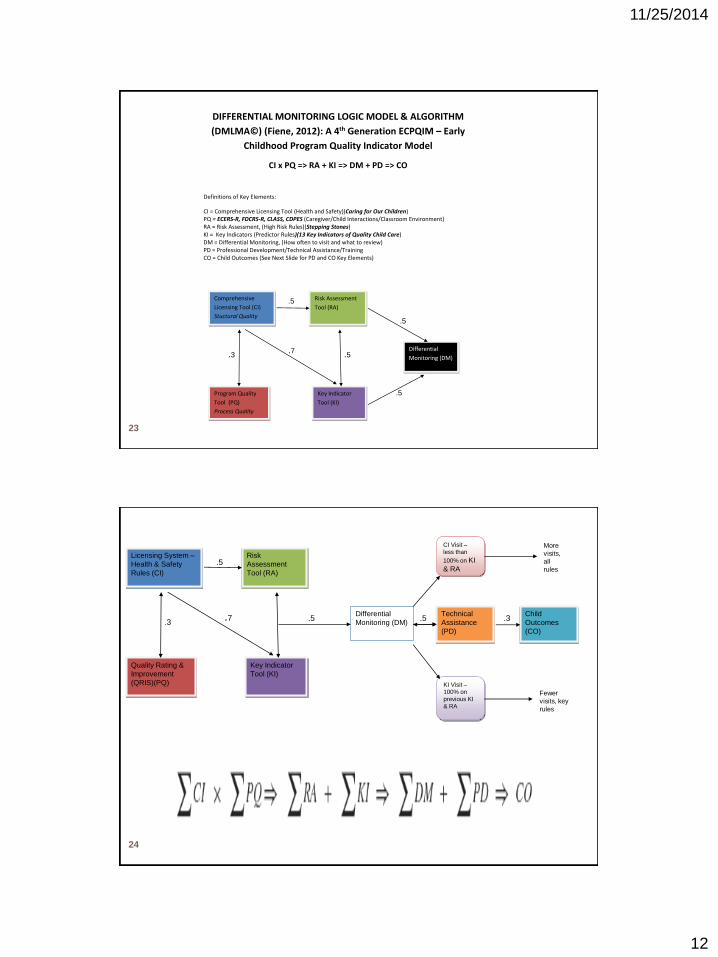
12
11/25/2014
DIFFERENTIAL MONITORING LOGIC MODEL & ALGORITHM
(DMLMA©) (Fiene, 2012): A 4th Generation ECPQIM – Early
Childhood Program Quality Indicator Model
CI x PQ => RA + KI => DM + PD => CO
Definitions of Key Elements:
CI = Comprehensive Licensing Tool (Health and Safety)(Caring for Our Children) PQ = ECERS-R, FDCRS-R, CLASS, CDPES (Caregiver/Child Interactions/Classroom Environment) RA = Risk Assessment, (High Risk Rules)(Stepping Stones) KI = Key Indicators (Predictor Rules)(13 Key Indicators of Quality Child Care) DM = Differential Monitoring, (How often to visit and what to review) PD = Professional Development/Technical Assistance/Training CO = Child Outcomes (See Next Slide for PD and CO Key Elements)
Comprehensive
Licensing Tool (CI)
Stuctural Quality
Program Quality
Tool (PQ)
Process Quality
Risk Assessment
Tool (RA)
Key Indicator
Tool (KI)
Differential
Monitoring (DM) .3 .7
.5
.5
.5
.5
23
Licensing System –
Health & Safety
Rules (CI)
Quality Rating &
Improvement
(QRIS)(PQ)
Risk
Assessment
Tool (RA)
Key Indicator
Tool (KI)
Differential
Monitoring (DM)
Technical
Assistance
(PD)
Child
Outcomes
(CO)
CI Visit –
less than
100% on KI
& RA
KI Visit –
100% on
previous KI
& RA
.3.7
.5
.5 .5 .3
More
visits,
all
rules
Fewer
visits, key
rules
24

13
11/25/2014
DIFFERENTIAL MONITORING LOGIC MODEL & ALGORITHM (DMLMA©) (Fiene, 2014): A 4th Generation ECPQIM – Early
Childhood Program Quality Indicator Model
CI x PQ(PD) => RA + KI => DM => CO
Definitions of Key Elements:
CI = Comprehensive Licensing Tool (Health and Safety)(Caring for Our Children)(Structural Quality) PQ = Program Quality Initiatives ( ECERS-R, FDCRS-R, CLASS, CDPES, QRIS, Accreditation) (Process Quality)
PD = Program Quality Initiatives (cont) - Professional Development/Technical Assistance/Training RA = Risk Assessment, (High Risk Rules/Standards)(Stepping Stones)
KI = Key Indicators (Predictor Rules/Standards)(13 Key Indicators of Quality Child Care) DM = Differential Monitoring, (How often to visit and what to review)
CO = Child Outcomes (Developmental, Health, & Safety Outcomes)
Comprehensive
Licensing Tool (CI)
Program Quality
Initiatives (PQ) &
(PD)
Risk Assessment
Tool (RA)
Key Indicator
Tool (KI)
Differential
Monitoring (DM)
25
Program Monitoring
Effectiveness/Efficiency Relationship
-5
0
5
10
15
20
How
Im
port
ant
How Much in Resources
Effectiveness (blue)/Efficiency (gold)
26

14
11/25/2014
27
28
Caring for Our Children standards/guidelines as the comprehensive set of health and safety
standards/guidelines for the early care and education field. 650 Standards.
Stepping Stones as the risk assessment tool based
upon morbidity/mortality. 138 Standards.
Caring for Our Children: Basics as the risk
assessment/key indicator tool. 55 Standards.
Key Indicators. 13 Standards
Relationship of Health and Safety Rules/Regulations, Standards, and Guidelines in Early Care and Education

15
11/25/2014
Validation Approaches (Zellman & Fiene, 2012)
First Approach (Standards)
CI x Caring for Our Children/Stepping Stones/13 Key
Indicators of Quality Child Care
Second Approach (Measures)
CI x RA + KI x DM
Third Approach (Outputs)
PQ x CI
Fourth Approach (Outcomes)
CO = PD + PQ + CI + RA + KI
29
DMLMA© Expected Thresholds
.70+
.50+
.30+
CI x KI
RA x CI; RA x DM; RA x
KI; DM x KI; DM x PD
PQ x CI; PQ x CO; RA x
CO; KI x CO; CI x CO
DMLMA© Expected Thresholds DMLMA© Key Elements Examples
30
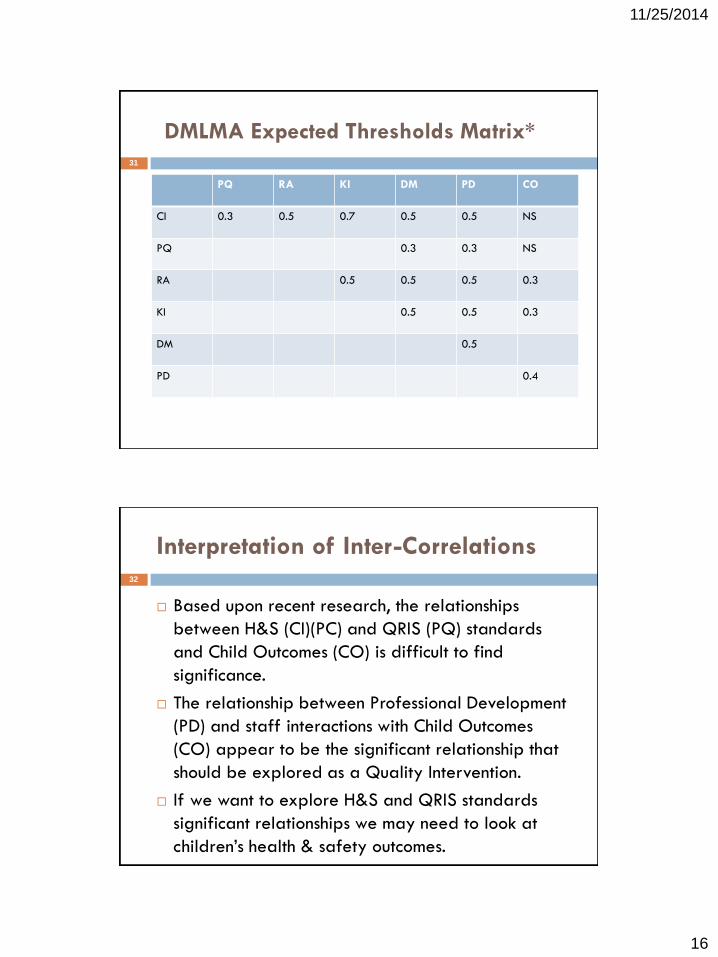
16
11/25/2014
DMLMA Expected Thresholds Matrix*
PQ RA KI DM PD CO
CI 0.3 0.5 0.7 0.5 0.5 NS
PQ 0.3 0.3 NS
RA 0.5 0.5 0.5 0.3
KI 0.5 0.5 0.3
DM 0.5
PD 0.4
31
Interpretation of Inter-Correlations
Based upon recent research, the relationships
between H&S (CI)(PC) and QRIS (PQ) standards
and Child Outcomes (CO) is difficult to find
significance.
The relationship between Professional Development
(PD) and staff interactions with Child Outcomes
(CO) appear to be the significant relationship that
should be explored as a Quality Intervention.
If we want to explore H&S and QRIS standards
significant relationships we may need to look at
children’s health & safety outcomes.
32
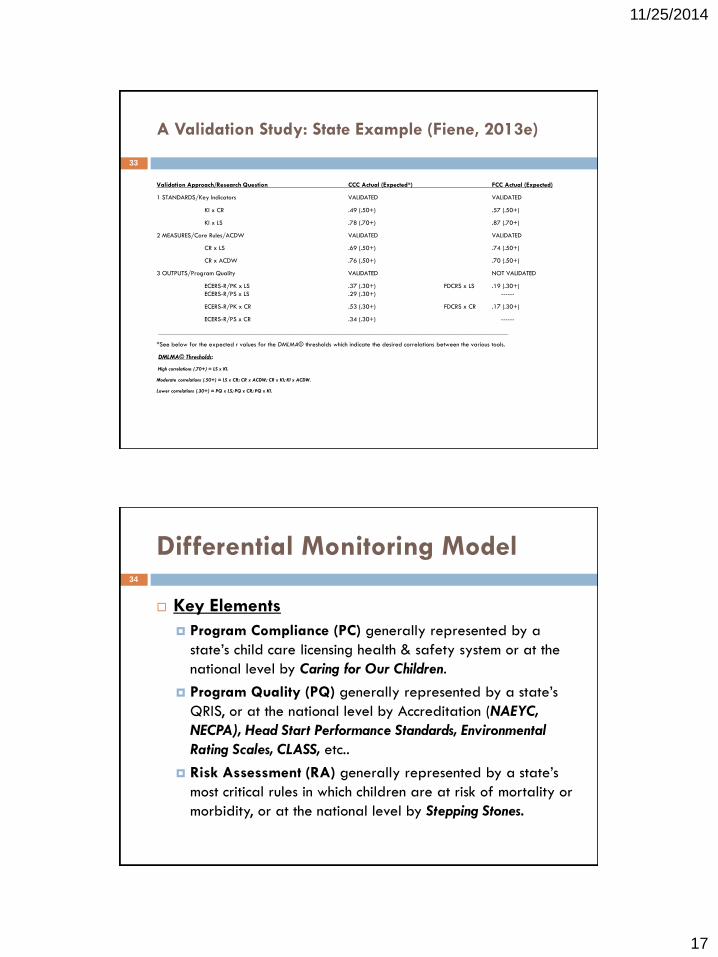
17
11/25/2014
A Validation Study: State Example (Fiene, 2013e)
Validation Approach/Research Question CCC Actual (Expected*) FCC Actual (Expected)
1 STANDARDS/Key Indicators VALIDATED VALIDATED
KI x CR .49 (.50+) .57 (.50+)
KI x LS .78 (.70+) .87 (.70+)
2 MEASURES/Core Rules/ACDW VALIDATED VALIDATED
CR x LS .69 (.50+) .74 (.50+)
CR x ACDW .76 (.50+) .70 (.50+)
3 OUTPUTS/Program Quality VALIDATED NOT VALIDATED
ECERS-R/PK x LS .37 (.30+) FDCRS x LS .19 (.30+)
ECERS-R/PS x LS .29 (.30+) ------
ECERS-R/PK x CR .53 (.30+) FDCRS x CR .17 (.30+)
ECERS-R/PS x CR .34 (.30+) ------
_________________________________________________________________________________________________________
*See below for the expected r values for the DMLMA© thresholds which indicate the desired correlations between the various tools.
DMLMA© Thresholds:
High correlations (.70+) = LS x KI.
Moderate correlations (.50+) = LS x CR; CR x ACDW; CR x KI; KI x ACDW.
Lower correlations (.30+) = PQ x LS; PQ x CR; PQ x KI.
33
Differential Monitoring Model
Key Elements
Program Compliance (PC) generally represented by a
state’s child care licensing health & safety system or at the
national level by Caring for Our Children.
Program Quality (PQ) generally represented by a state’s
QRIS, or at the national level by Accreditation (NAEYC,
NECPA), Head Start Performance Standards, Environmental
Rating Scales, CLASS, etc..
Risk Assessment (RA) generally represented by a state’s
most critical rules in which children are at risk of mortality or
morbidity, or at the national level by Stepping Stones.
34
18
11/25/2014
Differential Monitoring Model (cont)
Key elements (continued)
Key Indicators (KI) generally represented by a state’s
abbreviated tool of statistically predictive rules or at
the national level by 13 Indicators of Quality Child Care
and NACCRRA’s We CAN Do Better Reports.
Professional Development (PD) generally represented
by a state’s technical assistance/training/professional
development system for staff.
Child Outcomes (CO) generally represented by a
state’s Early Learning Network Standards.
35
Differential Monitoring Benefits
Differential Monitoring (DM) benefits to the state
are the following:
Systematic way of tying distinct state systems together
into a cost effective & efficient unified valid & reliable
logic model and algorithm.
Empirical way of reallocating limited monitoring
resources to those providers who need it most.
Data driven to determine how often to visit programs
and what to review, in other words, should a
comprehensive or abbreviated review be completed.
36

19
11/25/2014
Program Compliance/Licensing
(CI)(PC)
These are the comprehensive set of rules,
regulations or standards for a specific service
type.
Caring for Our Children (CFOC) is an example.
Head Start Performance Standards is an example.
Program meets national child care benchmarks
from NACCRRA’s We CAN Do Better Report.
No complaints registered with program.
Substantial to full compliance with all rules.
37
Advantages of Instrument Based
Program Monitoring (IPM)
Cost Savings
Improved Program Performance
Improved Regulatory Climate
Improved Information for Policy and Financial
Decisions
Quantitative Approach
State Comparisons
38
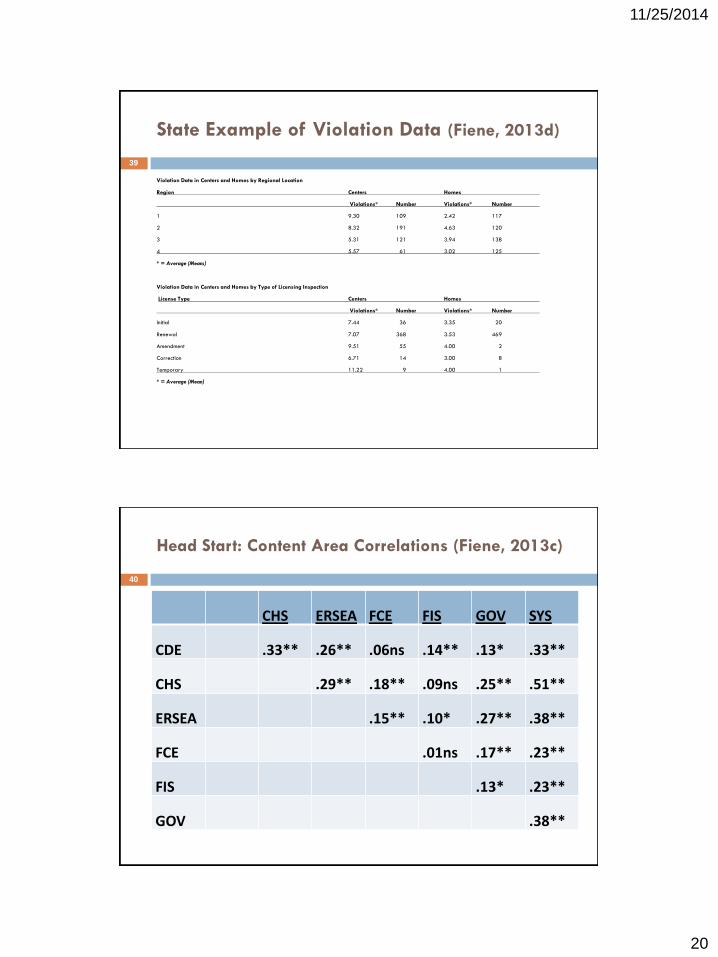
20
11/25/2014
State Example of Violation Data (Fiene, 2013d)
Violation Data in Centers and Homes by Regional Location
Region Centers Homes
Violations* Number Violations* Number
1 9.30 109 2.42 117
2 8.32 191 4.63 120
3 5.31 121 3.94 138
4 5.57 61 3.02 125
* = Average (Means)
Violation Data in Centers and Homes by Type of Licensing Inspection
License Type Centers Homes
Violations* Number Violations* Number
Initial 7.44 36 3.35 20
Renewal 7.07 368 3.53 469
Amendment 9.51 55 4.00 2
Correction 6.71 14 3.00 8
Temporary 11.22 9 4.00 1
* = Average (Mean)
39
Head Start: Content Area Correlations (Fiene, 2013c)
CHS ERSEA FCE FIS GOV SYS
CDE .33** .26** .06ns .14** .13* .33**
CHS .29** .18** .09ns .25** .51**
ERSEA .15** .10* .27** .38**
FCE .01ns .17** .23**
FIS .13* .23**
GOV .38**
40
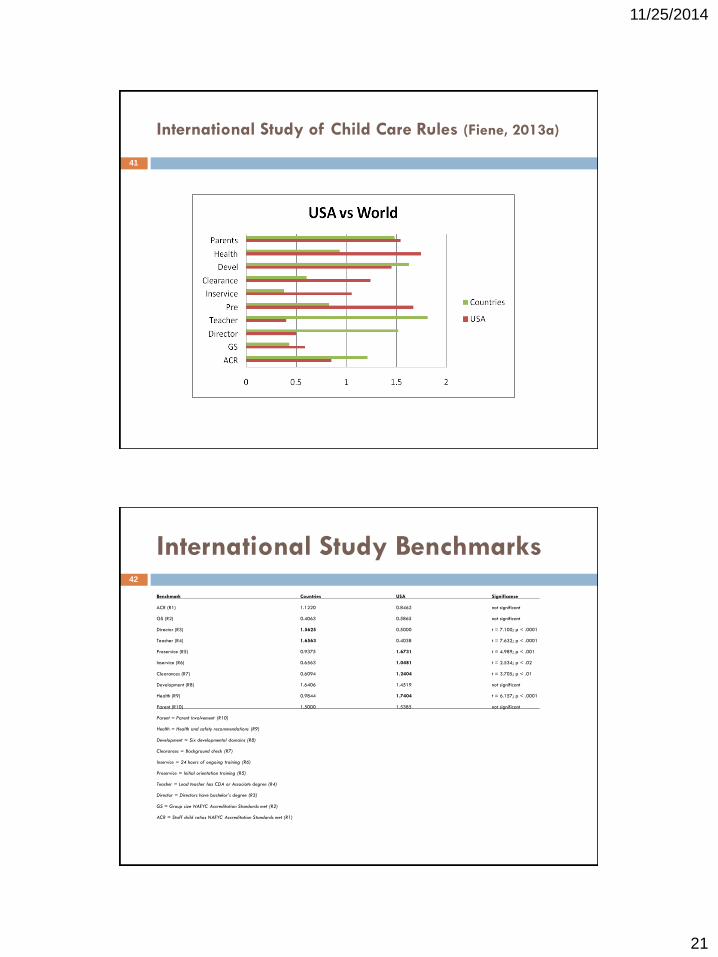
21
11/25/2014
International Study of Child Care Rules (Fiene, 2013a)
41
International Study Benchmarks
Benchmark Countries USA Significance
ACR (R1) 1.1220 0.8462 not significant
GS (R2) 0.4063 0.5865 not significant
Director (R3) 1.5625 0.5000 t = 7.100; p < .0001
Teacher (R4) 1.6563 0.4038 t = 7.632; p < .0001
Preservice (R5) 0.9375 1.6731 t = 4.989; p < .001
Inservice (R6) 0.6563 1.0481 t = 2.534; p < .02
Clearances (R7) 0.6094 1.2404 t = 3.705; p < .01
Development (R8) 1.6406 1.4519 not significant
Health (R9) 0.9844 1.7404 t = 6.157; p < .0001
Parent (R10) 1.5000 1.5385 not significant
Parent = Parent Involvement (R10)
Health = Health and safety recommendations (R9)
Development = Six developmental domains (R8)
Clearances = Background check (R7)
Inservice = 24 hours of ongoing training (R6)
Preservice = Initial orientation training (R5)
Teacher = Lead teacher has CDA or Associate degree (R4)
Director = Directors have bachelor’s degree (R3)
GS = Group size NAEYC Accreditation Standards met (R2)
ACR = Staff child ratios NAEYC Accreditation Standards met (R1)
42

22
11/25/2014
Program Quality (PQ)
Generally Quality Rating and Improvement
Systems (QRIS) and/or Accreditation systems
either used separately or together.
Program has attained at least a 5 on the various
ERS’s or an equivalent score on the CLASS.
Program has moved through all the star levels
within a five year timeframe.
Percent of programs that participate.
Generally PQ builds upon PC/Licensing system.
43
Keystone STARS ECERS Comparisons to Previous Early
Childhood Quality Studies (Barnard, Smith, Fiene & Swanson (2006))
0
1
2
3
4
5
6
1978 1984 1990 1996 2002 2006
Not in STARS
Start w/STARS
STARS 1&2
STARS 3&4
44

23
11/25/2014
45
46
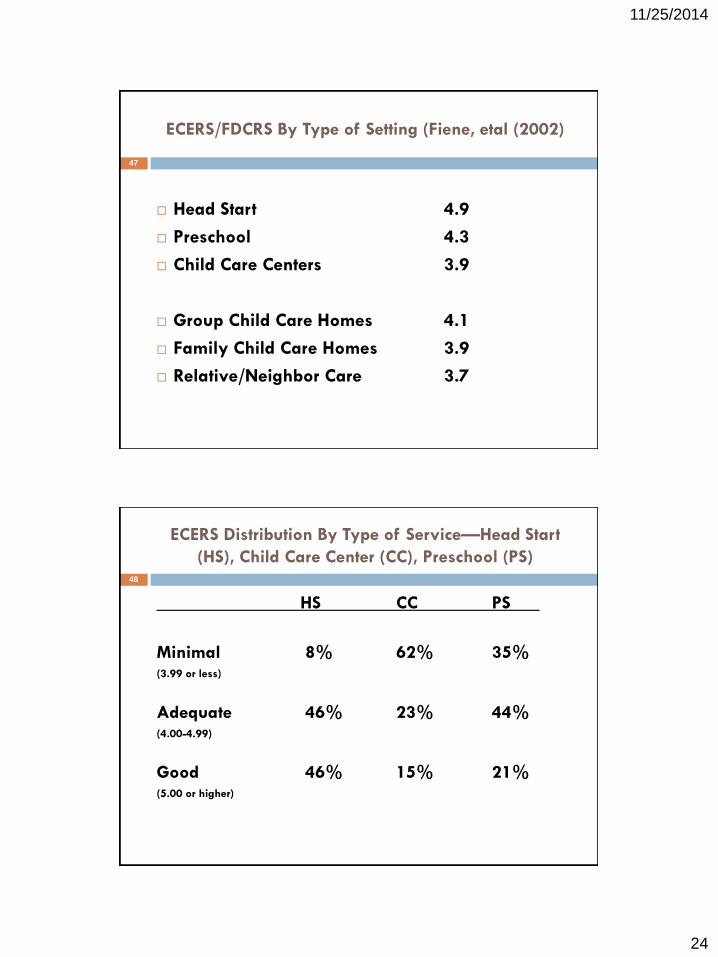
24
11/25/2014
ECERS/FDCRS By Type of Setting (Fiene, etal (2002)
Head Start 4.9
Preschool 4.3
Child Care Centers 3.9
Group Child Care Homes 4.1
Family Child Care Homes 3.9
Relative/Neighbor Care 3.7
47
ECERS Distribution By Type of Service—Head Start
(HS), Child Care Center (CC), Preschool (PS)
HS CC PS
Minimal 8% 62% 35%(3.99 or less)
Adequate 46% 23% 44% (4.00-4.99)
Good 46% 15% 21%(5.00 or higher)
48
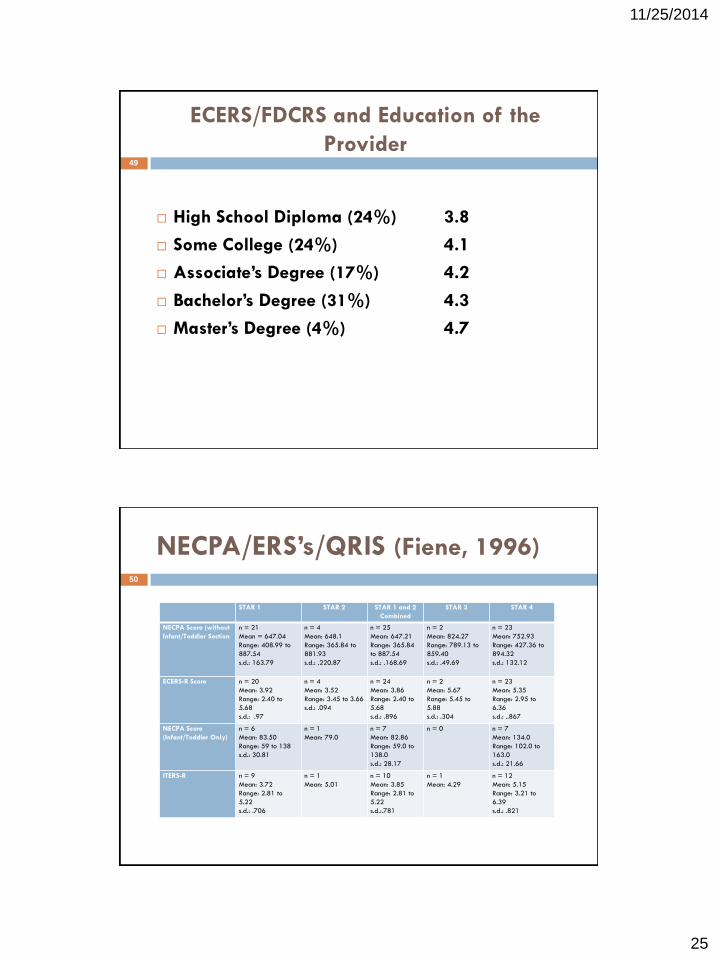
25
11/25/2014
ECERS/FDCRS and Education of the
Provider
High School Diploma (24%) 3.8
Some College (24%) 4.1
Associate’s Degree (17%) 4.2
Bachelor’s Degree (31%) 4.3
Master’s Degree (4%) 4.7
49
NECPA/ERS’s/QRIS (Fiene, 1996)
STAR 1 STAR 2 STAR 1 and 2
Combined
STAR 3 STAR 4
NECPA Score (without
Infant/Toddler Section
n = 21
Mean = 647.04
Range: 408.99 to
887.54
s.d.: 163.79
n = 4
Mean: 648.1
Range: 365.84 to
881.93
s.d.: .220.87
n = 25
Mean: 647.21
Range: 365.84
to 887.54
s.d.: .168.69
n = 2
Mean: 824.27
Range: 789.13 to
859.40
s.d.: .49.69
n = 23
Mean: 752.93
Range: 427.36 to
894.32
s.d.: 132.12
ECERS-R Score n = 20
Mean: 3.92
Range: 2.40 to
5.68
s.d.: .97
n = 4
Mean: 3.52
Range: 3.45 to 3.66
s.d.: .094
n = 24
Mean: 3.86
Range: 2.40 to
5.68
s.d.: .896
n = 2
Mean: 5.67
Range: 5.45 to
5.88
s.d.: .304
n = 23
Mean: 5.35
Range: 2.95 to
6.36
s.d.: ..867
NECPA Score
(Infant/Toddler Only)
n = 6
Mean: 83.50
Range: 59 to 138
s.d.: 30.81
n = 1
Mean: 79.0
n = 7
Mean: 82.86
Range: 59.0 to
138.0
s.d.: 28.17
n = 0 n = 7
Mean: 134.0
Range: 102.0 to
163.0
s.d.: 21.66
ITERS-R n = 9
Mean: 3.72
Range: 2.81 to
5.22
s.d.: .706
n = 1
Mean: 5.01
n = 10
Mean: 3.85
Range: 2.81 to
5.22
s.d.:.781
n = 1
Mean: 4.29
n = 12
Mean: 5.15
Range: 3.21 to
6.39
s.d.: .821
50
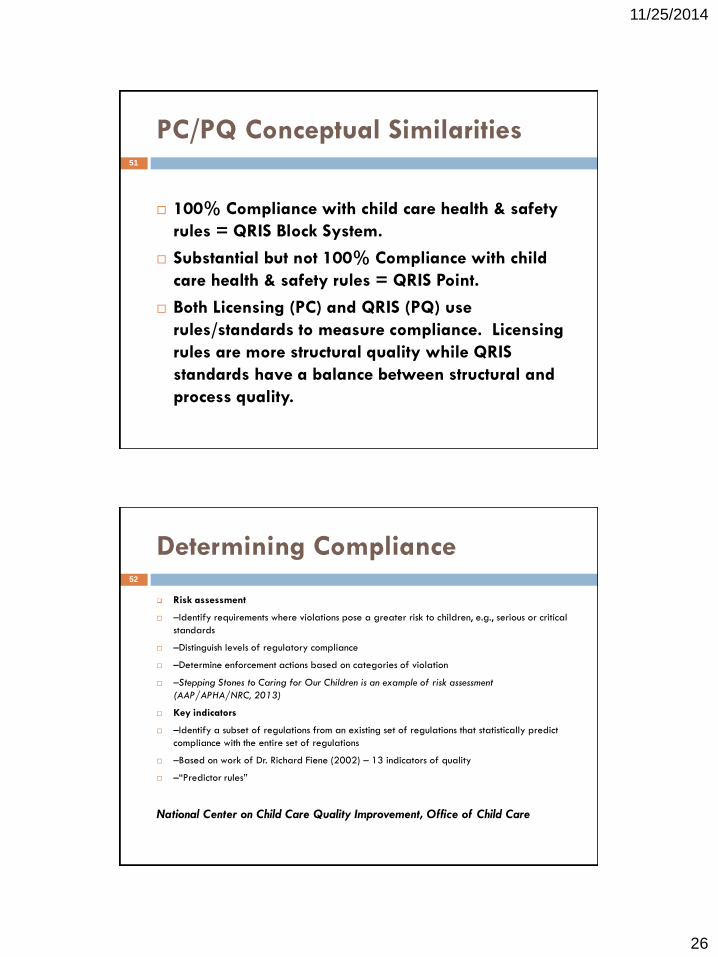
26
11/25/2014
PC/PQ Conceptual Similarities
100% Compliance with child care health & safety
rules = QRIS Block System.
Substantial but not 100% Compliance with child
care health & safety rules = QRIS Point.
Both Licensing (PC) and QRIS (PQ) use
rules/standards to measure compliance. Licensing
rules are more structural quality while QRIS
standards have a balance between structural and
process quality.
51
Determining Compliance
Risk assessment
–Identify requirements where violations pose a greater risk to children, e.g., serious or critical
standards
–Distinguish levels of regulatory compliance
–Determine enforcement actions based on categories of violation
–Stepping Stones to Caring for Our Children is an example of risk assessment
(AAP/APHA/NRC, 2013)
Key indicators
–Identify a subset of regulations from an existing set of regulations that statistically predict
compliance with the entire set of regulations
–Based on work of Dr. Richard Fiene (2002) – 13 indicators of quality
–“Predictor rules”
National Center on Child Care Quality Improvement, Office of Child Care
52
27
11/25/2014
Risk Assessment (RA)
Risk Assessment (RA) are those rules which place
children at greatest risk of mortality or morbidity.
Stepping Stones is example of Risk Assessment
Tool and Approach.
When Risk Assessment (RA) and Key Indicators
(KI) described in next slide are used together,
most cost effective and efficient approach to
program monitoring.
100% compliance with RA rules.
53
State Example of Risk Assessment Tool
CCLC / GDCH ANNUAL COMPLIANCE DETERMINATION WORKSHEET
DATE: CONSULTANT NAME:
FACILITY NAME: FACILITY ADDRESS:
Instructions: Enter visit(s) date and type in the grid below. Place an "X" in the box for any core rule category cited, at the appropriate risk level. When multiple risk levels are cited under one category, only the highest level of risk for that category should be listed on the grid below. Total the
number of categories cited at each risk level at the bottom. Then list the total number of "Low", "Medium", "High", and "Extreme" from all visits in the appropriate boxes below. Using the guidelines listed below, determine the facility's compliance, and fill it in the box labeled "Annual Compliance
Determination". Any non-core rule violations issued due to an injury or serious incident will be equivalent to a high-risk core rule category citation, and will be treated in the same way when determining a facility's compliance. Please note these instances in the comment section.
Visit date/type: Visit date/type: Visit date/type: Visit date/type: Visit date/type:
Core Rules Low Med High Extreme Low Med High Extreme Low Med High Extreme Low Med High Extreme Low Med High Extreme
Diapering- .10
Discipline- .11
Hygiene- .17
Infant Sleep Safety- .45
Medication- .20
Physical Plant- .25(13)
Playgrounds- .26
Staff:Child Ratios- .32(1) & (2)
Supervision- .32(6)
Swimming- .35
Transportation- .36
Field Trips- .13
TOTALS
TOTAL LOW: TOTAL MEDIUM: TOTAL HIGH:
ANNUAL COMPLIANCE DETERMINATION:
COMPLIANCE DETERMINATION CRITERIA FOR ONE TO THREE (1-3) VISITS:
Compliant = 0-5 core rule categories of Low risk, and /or No more than 2 core rule categories of Medium risk , or 1 Medium and 1 High risk
Not Compliant = 6 or more core rule categories of Low and/or 3 or more Medium risk, and / or 2 or more core rule categories of High risk
COMPLIANCE DETERMINATION CRITERIA FOR FOUR OR MORE (4 +) VISITS:
Compliant = 0-7 core rule categories of Low risk, and / or No more than 3 core rule categories of Medium risk, or 2 Medium and 1 High
Not Compliant = 8 or more Low Risk, 4-7 or more core rule categories of Medium risk, and / or 2 or more core rule categories of High risk
54

28
11/25/2014
RA Example = Stepping Stones55
13 Key Indicators/Stepping Stones
Crosswalk with State Rules Template56
13 Indicators/Stepping Stones
Standard
State Licensing Rule Analysis Analysis
Clarification
Recommendation Next
Steps
29
11/25/2014
Key Indicators (KI)(Fiene & Nixon, 1985)
Key Indicators are predictor rules that statistically
predict overall compliance with all rules.
13 Indicators of Quality Child Care is an example
of this approach.
Most effective if KI are used with the Risk
Assessment (RA) approach described on the
previous slide.
Must be 100% compliance with key indicator
rules.
57
Advantages of Key Indicators
Quality of Licensing is maintained.
Balance between program compliance
and quality.
Cost savings.
Predictor rules can be tied to child
outcomes.
58
30
11/25/2014
Pre-Requisites for Key Indicators
Licensing rules must be well written,
comprehensive, and measureable.
There must be a measurement tool in
place to standardize the application and
interpretation of the rules.
At least one year’s data should be
collected.
59
How to Develop Key Indicators
Collect data from 100-200 providers that
represent the overall delivery system in the state.
Collect violation data from this sample and sort
into high (top 25%) and low (bottom 25%)
compliant groups.
Statistical predictor rules based upon individual
compliance.
Add additional rules.
Add random rules.
60
31
11/25/2014
Criteria for Using Key Indicators
The facility had:
A regular license for the previous two years
The same director for the last 18 months
No verified complaints within the past 12 months
The operator has corrected all regulatory violations citied within 12 months prior to inspection
A full inspection must be conducted at least every third year
Not had a capacity increase of more than 10 percent since last full inspection
A profile that does not reveal a pattern of repeated or cyclical violations
No negative sanction issued within the past 3 years
61
Key Indicator Systems Summary
Time savings only.
Child care mostly.
Child care benchmarking.
Substantial compliance.
Safeguards.
Tied to outcomes study.
Adult residential – PA.
Child residential – PA.
Risk assessment/weighting.
Time and cost savings.
All services.
Benchmarks in all services.
CC national benchmarks.
Safeguards.
Tied to outcomes study.
National benchmarks.
Inter-National benchmarks.
Risk assessment/DMLMA.
1980 - 2010 2011+
62

32
11/25/2014
Key Indicator/Non-Compliance Relationship
0
2
4
6
8
10
12
Fre
quency
Effective Efficient
Key Indicator (blue)/Non-Compliance (gold)
63
Key Indicator Formula Matrix
Use data
from this
matrix in the
formula on
the next
slide in
order to
determine
the phi
coefficients.
Providers In
Compliance
with specific
standard
Programs Out
Of Compliance
with specific
standard
Row Total
High Group =
top 25%
A B Y
Low Group =
bottom 25%
C D Z
Column Total W X Grand Total
64
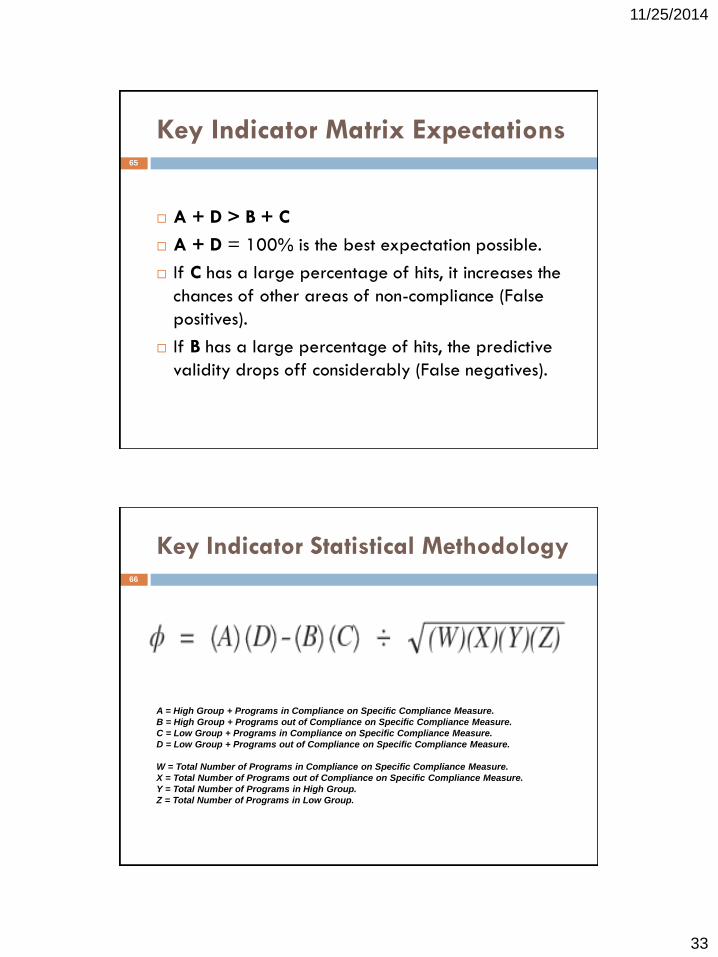
33
11/25/2014
Key Indicator Matrix Expectations
A + D > B + C
A + D = 100% is the best expectation possible.
If C has a large percentage of hits, it increases the
chances of other areas of non-compliance (False
positives).
If B has a large percentage of hits, the predictive
validity drops off considerably (False negatives).
65
Key Indicator Statistical Methodology
A = High Group + Programs in Compliance on Specific Compliance Measure.
B = High Group + Programs out of Compliance on Specific Compliance Measure.
C = Low Group + Programs in Compliance on Specific Compliance Measure.
D = Low Group + Programs out of Compliance on Specific Compliance Measure.
W = Total Number of Programs in Compliance on Specific Compliance Measure.
X = Total Number of Programs out of Compliance on Specific Compliance Measure.
Y = Total Number of Programs in High Group.
Z = Total Number of Programs in Low Group.
66
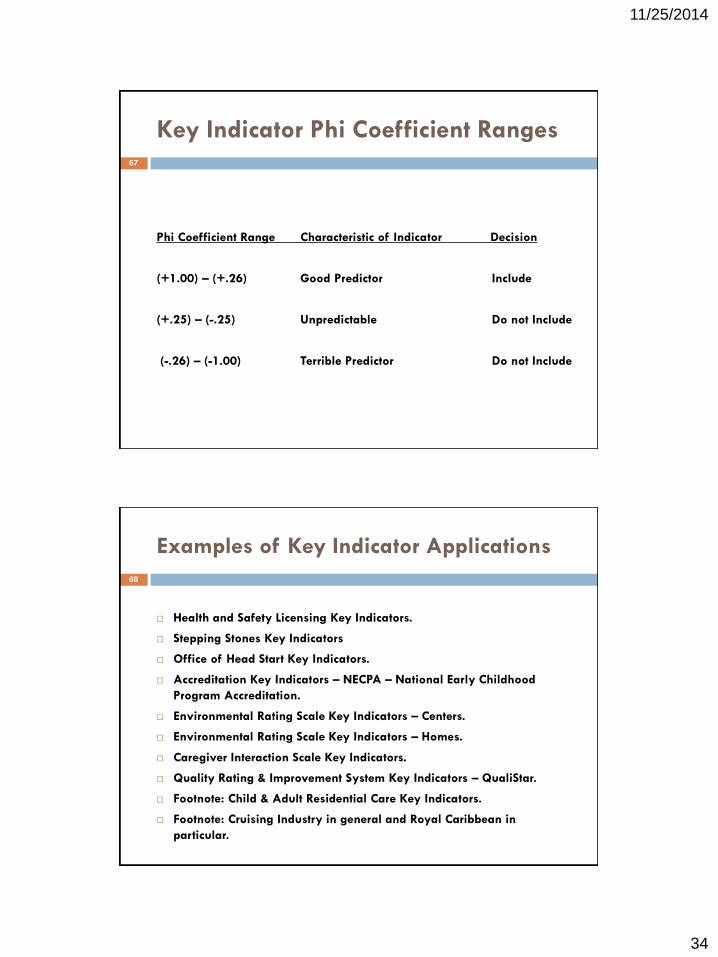
34
11/25/2014
Key Indicator Phi Coefficient Ranges
Phi Coefficient Range Characteristic of Indicator Decision
(+1.00) – (+.26) Good Predictor Include
(+.25) – (-.25) Unpredictable Do not Include
(-.26) – (-1.00) Terrible Predictor Do not Include
67
Examples of Key Indicator Applications
Health and Safety Licensing Key Indicators.
Stepping Stones Key Indicators
Office of Head Start Key Indicators.
Accreditation Key Indicators – NECPA – National Early Childhood
Program Accreditation.
Environmental Rating Scale Key Indicators – Centers.
Environmental Rating Scale Key Indicators – Homes.
Caregiver Interaction Scale Key Indicators.
Quality Rating & Improvement System Key Indicators – QualiStar.
Footnote: Child & Adult Residential Care Key Indicators.
Footnote: Cruising Industry in general and Royal Caribbean in
particular.
68

35
11/25/2014
Examples of Health & Safety Key Indicators(Fiene, 2002a, 2003, 2007, 2013, 2014)
Program is hazard free in-door and out-doors.
Adequate supervision of children is present.
Qualified staff.
CPR/First Aid training for staff.
Hazardous materials are inaccessible to children.
Staff orientation and training.
Criminal Record Checks.
Ongoing monitoring of program
69
Caring for Our Children (CFOC): Basics
Stepping Stones 3
Senate Bill 1086
Notice for Proposed Rule Making to Amend CCDF
Regulations
40 Indicators from Head Start Program Standards
15 Key Indicators from Stepping Stones 3 (Fiene)
77 Observable Health and Safety Standards for
Early Care and Education Providers from Caring for
Our Children (Alkon)
70
36
11/25/2014
Federal Legislation
In the House of Representatives, U. S., September
15, 2014. Resolved, That the bill from the Senate
(S. 1086) entitled ‘‘An Act to reauthorize and
improve the Child Care and Development Block
Grant Act of 1990, and for other purposes.’’, do
pass with the following
SECTION 1. SHORT TITLE. 1 This Act may be cited
as the ‘‘Child Care and Development Block Grant
Act of 2014’’.
71
QRIS Key Indicators – CO. QualiStar
The program provides opportunities for staff and
families to get to know one another.
Families receive information on their child’s
progress on a regular basis, using a formal
mechanism such as a report or parent conference.
Families are included in planning and decision
making for the program.
72

37
11/25/2014
The Key Indicators from Stepping Stones (3rd Edition)
1.1.1.2 - Ratios for Large Family Child Care Homes and Centers
1.3.1.1 - General Qualifications of Directors
1.3.2.2 - Qualifications of Lead Teachers and Teachers
1.4.3.1 - First Aid and CPR Training for Staff
1.4.5.2 - Child Abuse and Neglect Education
2.2.0.1 - Methods of Supervision of Children
3.2.1.4 - Diaper Changing Procedure
3.2.2.2 - Handwashing Procedure
3.4.3.1 - Emergency Procedures
3.4.4.1 - Recognizing and Reporting Suspected Child Abuse, Neglect, and Exploitation
3.6.3.1 - Medication Administration
5.2.7.6 - Storage and Disposal of Infectious and Toxic Wastes
6.2.3.1 - Prohibited Surfaces for Placing Climbing Equipment
7.2.0.2 - Unimmunized Children
9.2.4.5 - Emergency and Evacuation Drills/Exercises Policy
73
Development of Head Start Key Indicators
Interest in streamlining the monitoring protocol – Tri-Annual Reviews.
Selected a representative sample from the overall Head Start data base.
The Head Start monitoring system is an excellent candidate for
developing key indicators and differential monitoring system:
Highly developed data system to track provider compliance history.
Well written, comprehensive standards.
Monitoring Protocols in place for collecting data.
Risk assessment system in use.
Program quality (CLASS) data collected.
Example of a national system using key indicators.
Head Start has all the key elements present from the Differential
Monitoring Model as presented earlier.
74
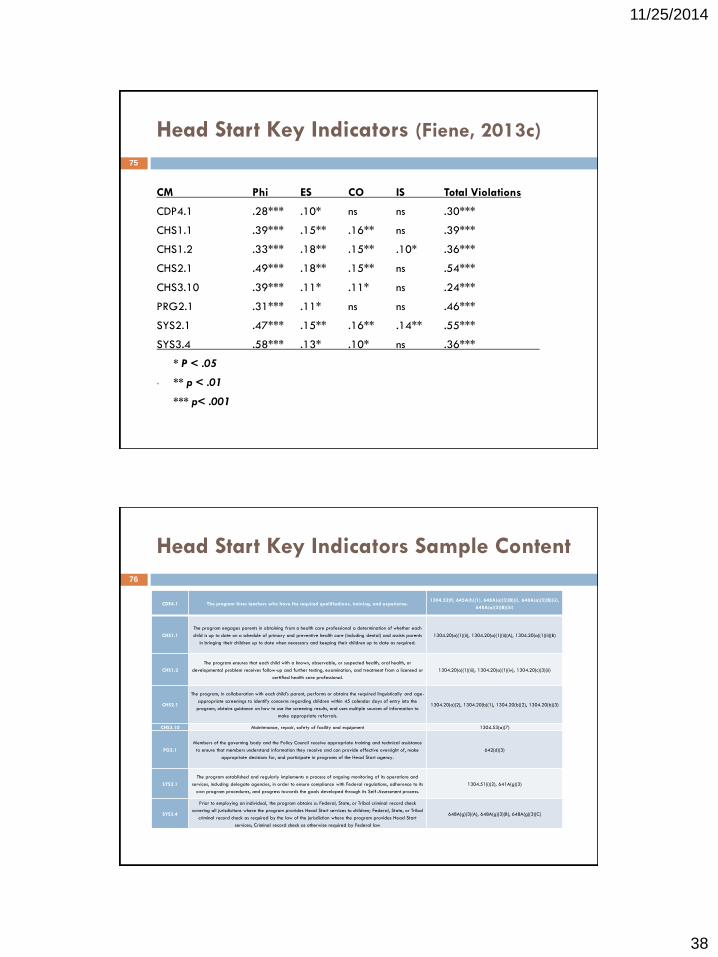
38
11/25/2014
Head Start Key Indicators (Fiene, 2013c)
CM Phi ES CO IS Total Violations
CDP4.1 .28*** .10* ns ns .30***
CHS1.1 .39*** .15** .16** ns .39***
CHS1.2 .33*** .18** .15** .10* .36***
CHS2.1 .49*** .18** .15** ns .54***
CHS3.10 .39*** .11* .11* ns .24***
PRG2.1 .31*** .11* ns ns .46***
SYS2.1 .47*** .15** .16** .14** .55***
SYS3.4 .58*** .13* .10* ns .36***
* P < .05
• ** p < .01
*** p< .001
75
Head Start Key Indicators Sample Content
CDE4.1 The program hires teachers who have the required qualifications, training, and experience.1304.52(f), 645A(h)(1), 648A(a)(3)(B)(i), 648A(a)(3)(B)(ii),
648A(a)(3)(B)(iii)
CHS1.1
The program engages parents in obtaining from a health care professional a determination of whether each
child is up to date on a schedule of primary and preventive health care (including dental) and assists parents
in bringing their children up to date when necessary and keeping their children up to date as required.
1304.20(a)(1)(ii), 1304.20(a)(1)(ii)(A), 1304.20(a)(1)(ii)(B)
CHS1.2
The program ensures that each child with a known, observable, or suspected health, oral health, or
developmental problem receives follow-up and further testing, examination, and treatment from a licensed or
certified health care professional.
1304.20(a)(1)(iii), 1304.20(a)(1)(iv), 1304.20(c)(3)(ii)
CHS2.1
The program, in collaboration with each child’s parent, performs or obtains the required linguistically and age-
appropriate screenings to identify concerns regarding children within 45 calendar days of entry into the
program, obtains guidance on how to use the screening results, and uses multiple sources of information to
make appropriate referrals.
1304.20(a)(2), 1304.20(b)(1), 1304.20(b)(2), 1304.20(b)(3)
CHS3.10 Maintenance, repair, safety of facility and equipment 1304.53(a)(7)
PG2.1
Members of the governing body and the Policy Council receive appropriate training and technical assistance
to ensure that members understand information they receive and can provide effective oversight of, make
appropriate decisions for, and participate in programs of the Head Start agency.
642(d)(3)
SYS2.1
The program established and regularly implements a process of ongoing monitoring of its operations and
services, including delegate agencies, in order to ensure compliance with Federal regulations, adherence to its
own program procedures, and progress towards the goals developed through its Self-Assessment process.
1304.51(i)(2), 641A(g)(3)
SYS3.4
Prior to employing an individual, the program obtains a: Federal, State, or Tribal criminal record check
covering all jurisdictions where the program provides Head Start services to children; Federal, State, or Tribal
criminal record check as required by the law of the jurisdiction where the program provides Head Start
services; Criminal record check as otherwise required by Federal law
648A(g)(3)(A), 648A(g)(3)(B), 648A(g)(3)(C)
76
39
11/25/2014
HSKI-C Monitoring Protocol
Administration for Children and Families
U. S. Department of Health and Human
Services
Office of Head Start
Head Start Key Indicator-Compliant (HSKI-C)
Monitoring Protocol for 2015
September 8, 2014
77
Conceptual Similarities Between Licensing
& QRIS and Key Indicator Methodology
100% Compliance with child care health & safety rules =
QRIS Block System. Cannot use Key Indicators.
Substantial but not 100% Compliance with child care health
& safety rules = QRIS Point. Can use Key Indicators.
Both Licensing and QRIS use rules/standards to measure
compliance. Licensing rules are more structural quality
while QRIS standards have a balance between structural
and process quality. Both rules and standards can be used
within the Key Indicator methodology.
78

40
11/25/2014
Other Examples of Key Indicators
CIS
Item 5 – Excited about Teaching
Item 7- Enjoys Children
Item 12 – Enthusiastic
FDCRS
Item 4 – Indoor Space Arrangement
Items 14b, 15b, 16 – Language
Item 18 – Eye hand Coordination
ECERS
Item 16 – Children Communicating
Item 31 – Discipline
79
Key Indicator (KI) Formula Matrix for ECERS
Item 16 – Children Communicating
These data are taken from a 2002 Program Quality Study (Fiene, et al) completed in Pennsylvania. The phi coefficient was 1.00. The first time this has occurred in generating key indicators. It was replicated in a 2006 QRIS – Keystone STARS Evaluation.
Providers with
a 5 or higher
on Item 16
Programs
with a 3 or
less on Item
16
Row Total
High Group –
5.00+ 117 0 117
Low Group –
3.00 or less 0 35 35
Column Total
117 35 152
80
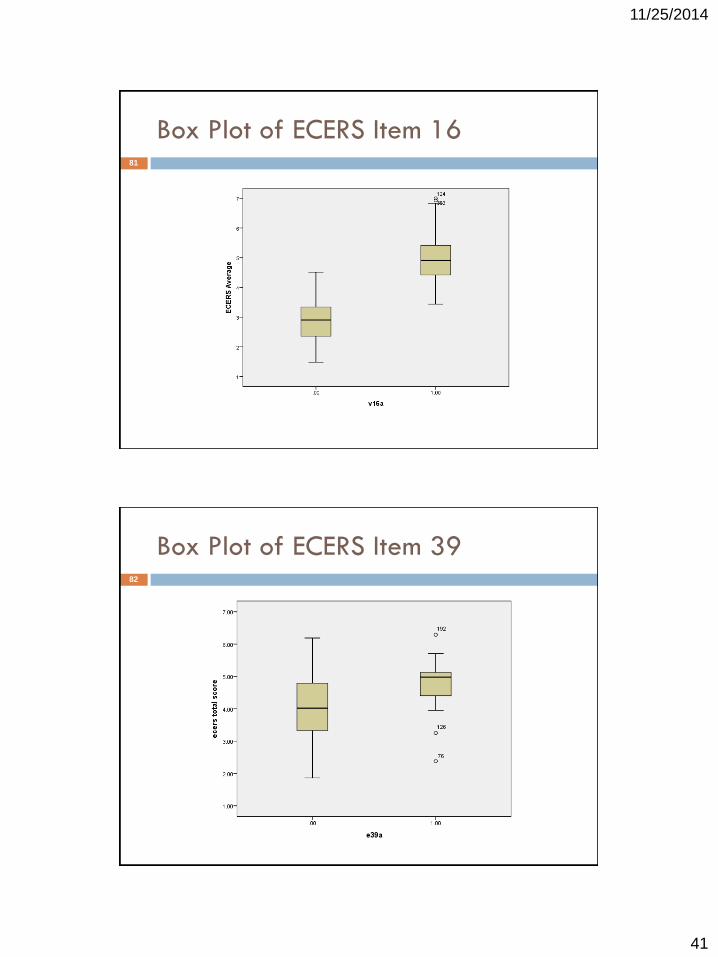
41
11/25/2014
Box Plot of ECERS Item 1681
Box Plot of ECERS Item 3982

42
11/25/2014
Normal & Skewed Data
0
10
20
30
40
50
60
70
80
90
100
0 25 50 75 100
Normal
Data
Licensing
Data
83
ECERS Total Scores84
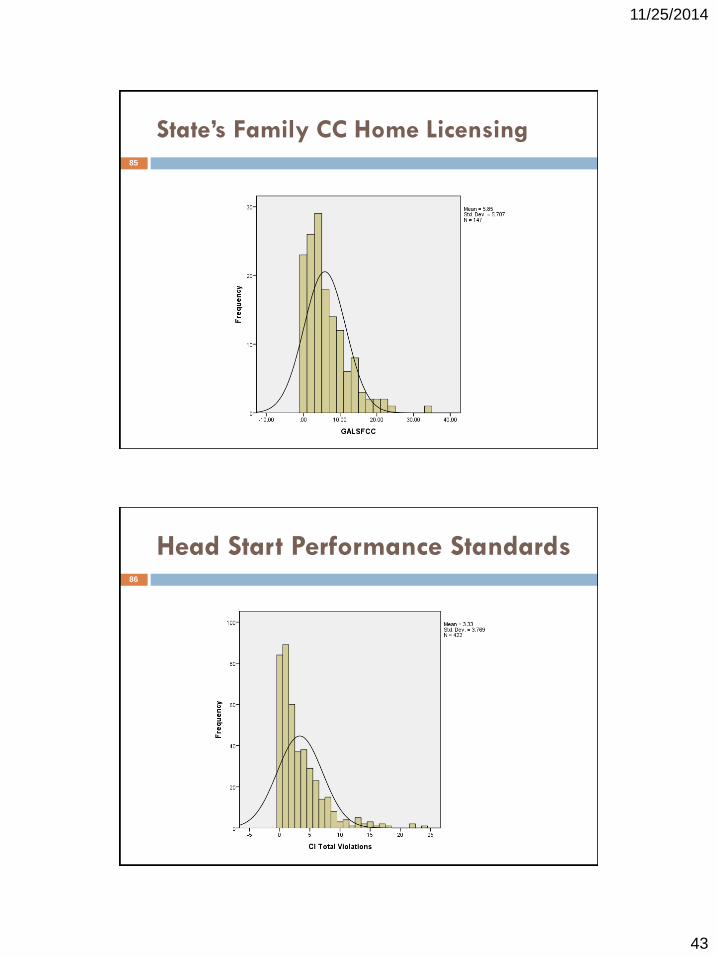
43
11/25/2014
State’s Family CC Home Licensing85
Head Start Performance Standards86
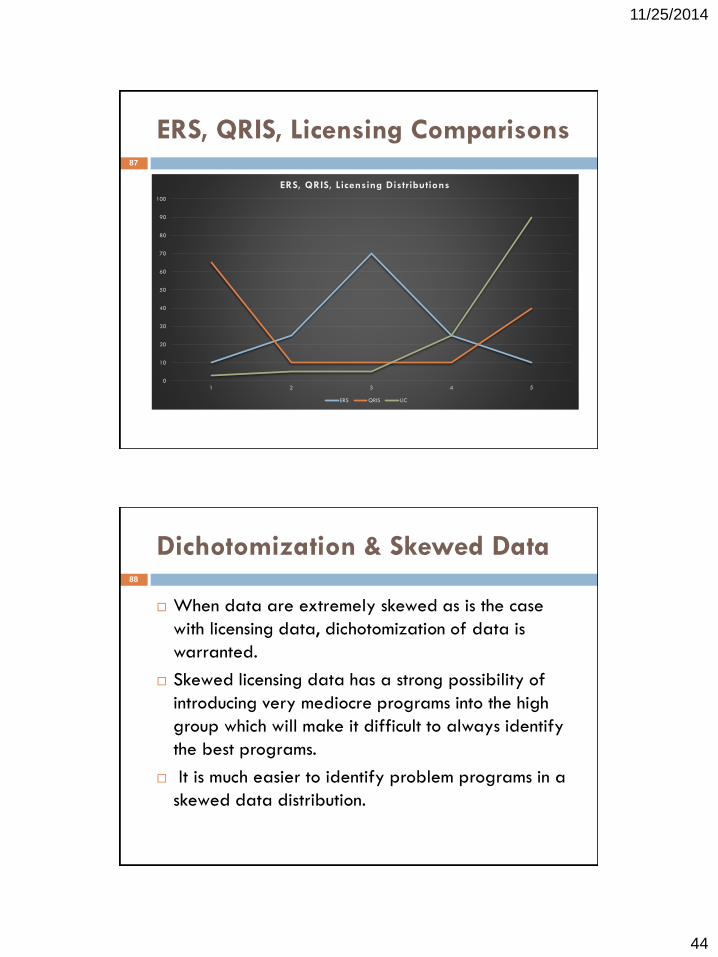
44
11/25/2014
ERS, QRIS, Licensing Comparisons87
0
10
20
30
40
50
60
70
80
90
100
1 2 3 4 5
ERS, QRIS, Licensing Distributions
ERS QRIS LIC
Dichotomization & Skewed Data
When data are extremely skewed as is the case
with licensing data, dichotomization of data is
warranted.
Skewed licensing data has a strong possibility of
introducing very mediocre programs into the high
group which will make it difficult to always identify
the best programs.
It is much easier to identify problem programs in a
skewed data distribution.
88

45
11/25/2014
Differential Monitoring Options
•Reward good compliance:
–Abbreviated inspection – if no serious violations, for a period of time
–Fewer full compliance reviews if compliance record is strong
•Response to non-compliance:
–Additional monitoring visits
–Technical assistance
•The number of core rule categories cited and the assigned risk level determines the
annual compliance level. (Georgia)
•Determine how often particular rules are included in inspections. Rules that pose the most
risk of harm to children if violated are reviewed during all inspections. (Virginia)
National Center on Child Care Quality Improvement, Office of Child Care
89
Provider Outcomes to Determine
Differential Monitoring (DM)
Fully licensed – substantial/full compliance.
Potentially accredited (NAEYC/NECPA).
Highest star rating.
Cost effective and efficient delivery system.
Little turnover of staff and director.
Fully enrolled.
Fund surplus.
The above results determine the number of times to visit
& what to review and resources allocated.
90
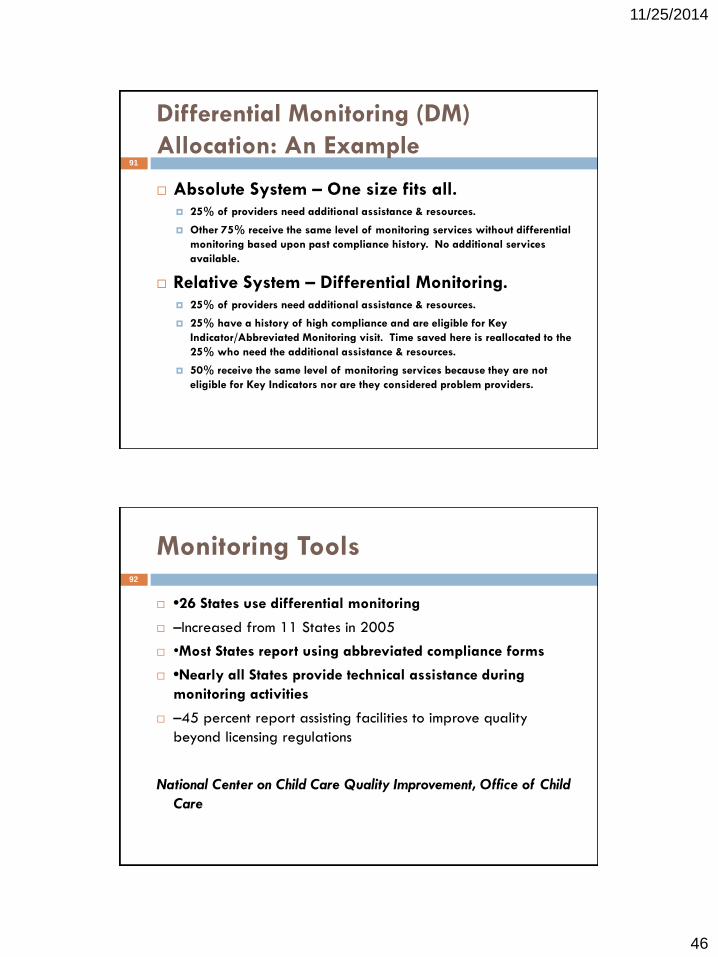
46
11/25/2014
Differential Monitoring (DM)
Allocation: An Example
Absolute System – One size fits all. 25% of providers need additional assistance & resources.
Other 75% receive the same level of monitoring services without differential
monitoring based upon past compliance history. No additional services
available.
Relative System – Differential Monitoring. 25% of providers need additional assistance & resources.
25% have a history of high compliance and are eligible for Key
Indicator/Abbreviated Monitoring visit. Time saved here is reallocated to the
25% who need the additional assistance & resources.
50% receive the same level of monitoring services because they are not
eligible for Key Indicators nor are they considered problem providers.
91
Monitoring Tools
•26 States use differential monitoring
–Increased from 11 States in 2005
•Most States report using abbreviated compliance forms
•Nearly all States provide technical assistance during
monitoring activities
–45 percent report assisting facilities to improve quality
beyond licensing regulations
National Center on Child Care Quality Improvement, Office of Child
Care
92
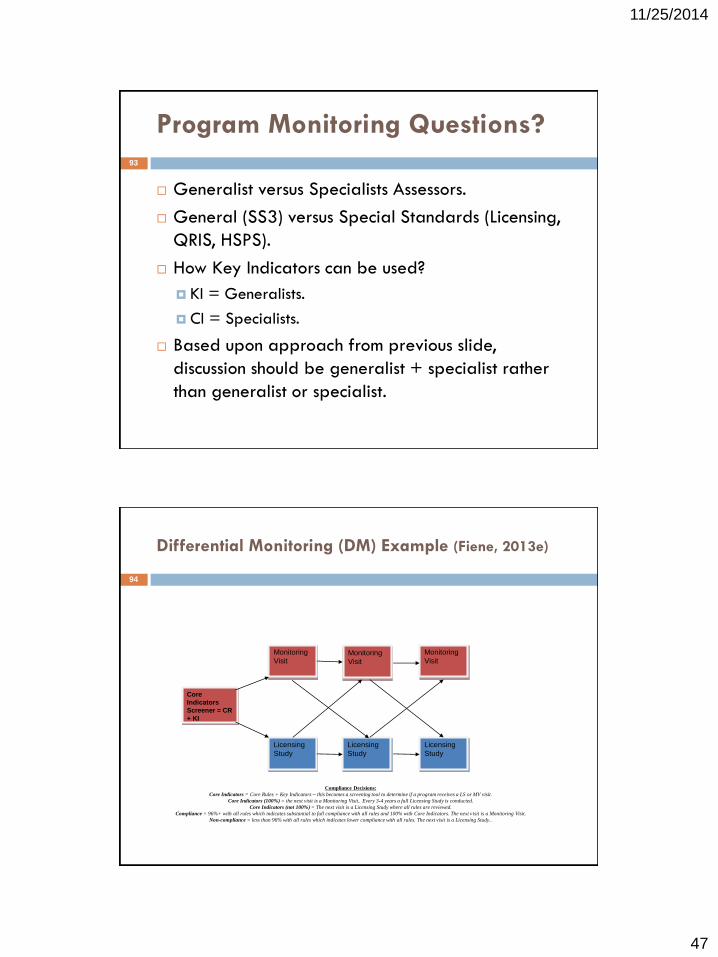
47
11/25/2014
Program Monitoring Questions?
Generalist versus Specialists Assessors.
General (SS3) versus Special Standards (Licensing,
QRIS, HSPS).
How Key Indicators can be used?
KI = Generalists.
CI = Specialists.
Based upon approach from previous slide,
discussion should be generalist + specialist rather
than generalist or specialist.
93
Differential Monitoring (DM) Example (Fiene, 2013e)
Core
Indicators
Screener = CR
+ KI
Monitoring
Visit
Licensing
Study
Monitoring
Visit
Monitoring
Visit
Licensing
Study
Licensing
Study
Compliance Decisions:
Core Indicators = Core Rules + Key Indicators – this becomes a screening tool to determine if a program receives a LS or MV visit.
Core Indicators (100%) = the next visit is a Monitoring Visit.. Every 3-4 years a full Licensing Study is conducted.
Core Indicators (not 100%) = The next visit is a Licensing Study where all rules are reviewed.
Compliance = 96%+ with all rules which indicates substantial to full compliance with all rules and 100% with Core Indicators. The next visit is a Monitoring Visit.
Non-compliance = less than 96% with all rules which indicates lower compliance with all rules. The next visit is a Licensing Study..
94
48
11/25/2014
Professional Development (PD)
(Fiene, 1995, Fiene, etal, 1998)
All staff have CDA or degrees in ECE.
Director has BA in ECE.
All staff take 24 hours of in-service training/yr.
Mentoring of staff occurs.
Training/PD fund for all staff.
Professional development/training/technical
assistance (PD) linked to Differential Monitoring
(DM) results.
95
Mentoring
Individualized, on-site support to help child care
staff implement the knowledge and skills they are
receiving in classroom instruction.
Benefits:
Building relationships.
Effecting long term change in best practices.
Providing a support system.
96

49
11/25/2014
Relationship between Child Care Income
and Quality Measures (Fiene, 2002b)
Correlations
1.000 .599** .107 .368* .661**
. .000 .568 .038 .000
49 45 31 32 37
.599** 1.000 .108 .507** .483**
.000 . .578 .004 .004
45 46 29 30 34
.107 .108 1.000 -.035 .311
.568 .578 . .851 .130
31 29 32 32 25
.368* .507** -.035 1.000 .451*
.038 .004 .851 . .021
32 30 32 33 26
.661** .483** .311 .451* 1.000
.000 .004 .130 .021 .
37 34 25 26 39
Pearson Correlation
Sig. (2-tailed)
N
Pearson Correlation
Sig. (2-tailed)
N
Pearson Correlation
Sig. (2-tailed)
N
Pearson Correlation
Sig. (2-tailed)
N
Pearson Correlation
Sig. (2-tailed)
N
ITERS
ARNETT
KIDI
BLOOM
DIR16
ITERS ARNETT KIDI BLOOM DIR16
Correlation is significant at the 0.01 level (2-tailed).**.
Correlation is significant at the 0.05 level (2-tailed).*.
97
Infant-Toddler Teacher Mentoring
0
2 0
4 0
6 0
8 0
10 0
12 0
14 0
16 0
Ite rs Arne tt Kidi Bloom
Pre - Te st
Post- Te st
98
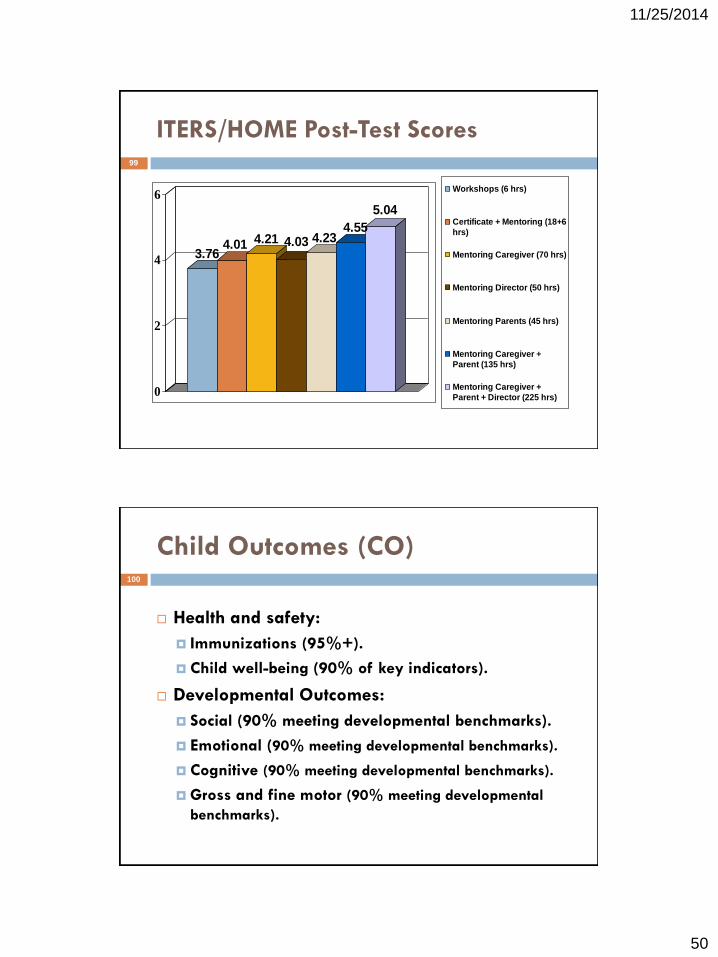
50
11/25/2014
ITERS/HOME Post-Test Scores
3.764.01 4.21 4.03 4.23
4.55
5.04
0
2
4
6Workshops (6 hrs)
Certificate + Mentoring (18+6
hrs)
Mentoring Caregiver (70 hrs)
Mentoring Director (50 hrs)
Mentoring Parents (45 hrs)
Mentoring Caregiver +
Parent (135 hrs)
Mentoring Caregiver +
Parent + Director (225 hrs)
99
Child Outcomes (CO)
Health and safety:
Immunizations (95%+).
Child well-being (90% of key indicators).
Developmental Outcomes:
Social (90% meeting developmental benchmarks).
Emotional (90% meeting developmental benchmarks).
Cognitive (90% meeting developmental benchmarks).
Gross and fine motor (90% meeting developmental
benchmarks).
100

51
11/25/2014
Correlation of Accreditation, Licensing, &
Training with Child Outcomes
Quality Training Accreditation Licensing
ECERS EWECS/CCECD NECPA/NAEYC SS
Slosson .23* .33*/.34* .29*/ .30* .19
CBI-INT .25* .15/ .14 .41*/ .21* .08
TELD .09 .28*/.22* .31*/ .35* .22*
ALI .44* .01/ .11 .13/ .04 .06
PBQ .37* .32*/.23* .44*/.40* .29*
CBI-SOC .26* .21* /.20* .19/ .23* .18
• p < .05
• Kontos & Fiene (1987).
101
Key Element Publication Summary
PC = Caring for Our Children (AAP/APHA/NRC, 2012).
PQ = National Early Childhood Program
Accreditation (NECPA)(Fiene, 1996).
RA = Stepping Stones (NRC, 2013).
KI = 13 Indicators of Quality Child Care (Fiene, 2002a).
DM = International Child Care & Education Policy (Fiene, 2013a).
PD = Infant Caregiver Mentoring (Fiene, 2002b).
CO = Quality in Child Care: The Pennsylvania Study Kontos & Fiene, 1997).
102
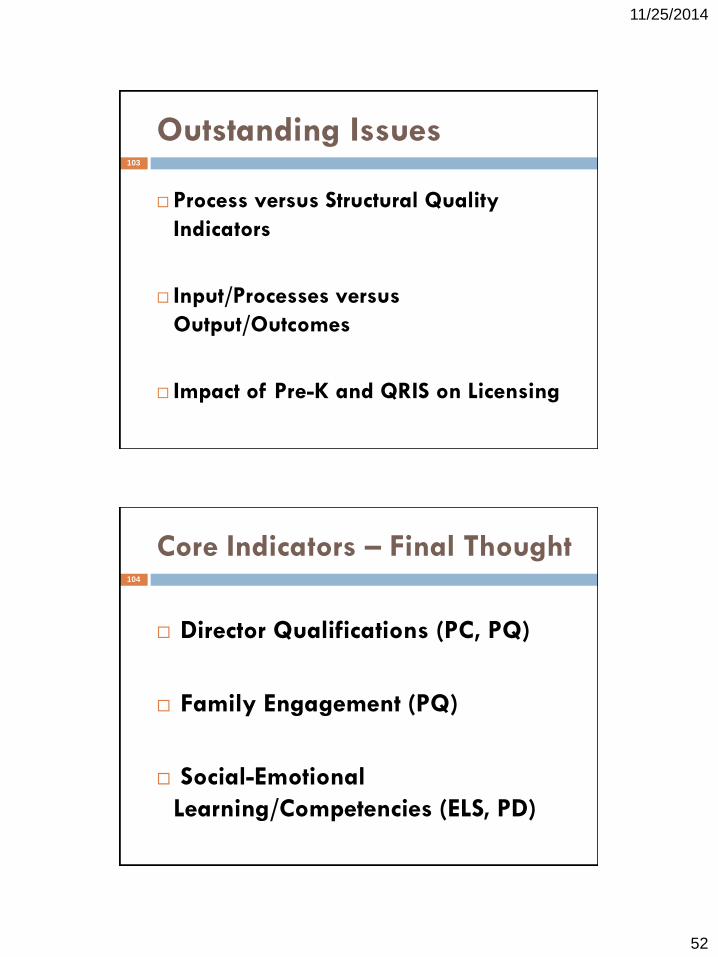
52
11/25/2014
Outstanding Issues
Process versus Structural Quality
Indicators
Input/Processes versus
Output/Outcomes
Impact of Pre-K and QRIS on Licensing
103
Core Indicators – Final Thought
Director Qualifications (PC, PQ)
Family Engagement (PQ)
Social-Emotional
Learning/Competencies (ELS, PD)
104

53
11/25/2014
National ECE Standards Development
Nixon Veto of Comprehensive Child Development
Bill 1971.
FIDCR Moratorium 1981.
Reagan Block Grant Formula 1983.
CCDBG enacted 1991.
Caring for Our Children (CFOC) 1st Ed. 1993.
CCDF enacted 2001.
NACCRRA First Report Card 2007.
CCDBG, CCDF, CFOC-Basics 2014.
105
The following graphics represent the previous
generations of ECPQIM 1-4 beginning in 1975
up to the present model (DMLMA, 2013).
ECPQIM 1- 4 Graphics106

54
11/25/2014
Compliance Study
&State Profile Rule
Change/Clarification
Guidance Material
Training & TA
Consumer Materials
ZERO TO THREE’s Better Care for the Babies Project: A System’s
Approach to State Child Care Planning—Griffin/Fiene (1995),
(ECPQIM 2), 1995 - 1999
Inputs Processes Outcomes
Agency Rule Making Authority Interagency Review Consistent Data Collection
Combined/Cost-Effective Use of
Resources to Meet State Priorities
Strength/Clarity of Rules Reduced
Duplication of Rules Consistency
Across Agencies
Monitoring Efficiency Program
Compliance Targeting Resources to
Areas of Need
Monitoring Effectiveness Training &
Technical Assistance Program
Compliance
Consensus-Building Increased State-
Local Cooperation
Comparison State
Standards to National
Guidelines Identifying
Gaps & Weakness
Weighted Indicator
Checklist
Field Survey
Focus Groups
Public Hearings
Regulations,
Requirements,
Codes,
Funding Rules
Monitoring System
Surveillance
Licensing
Registration
Certification
CCR&R
Local CC Programs
CC Organizations
Consumers
Monitors
108
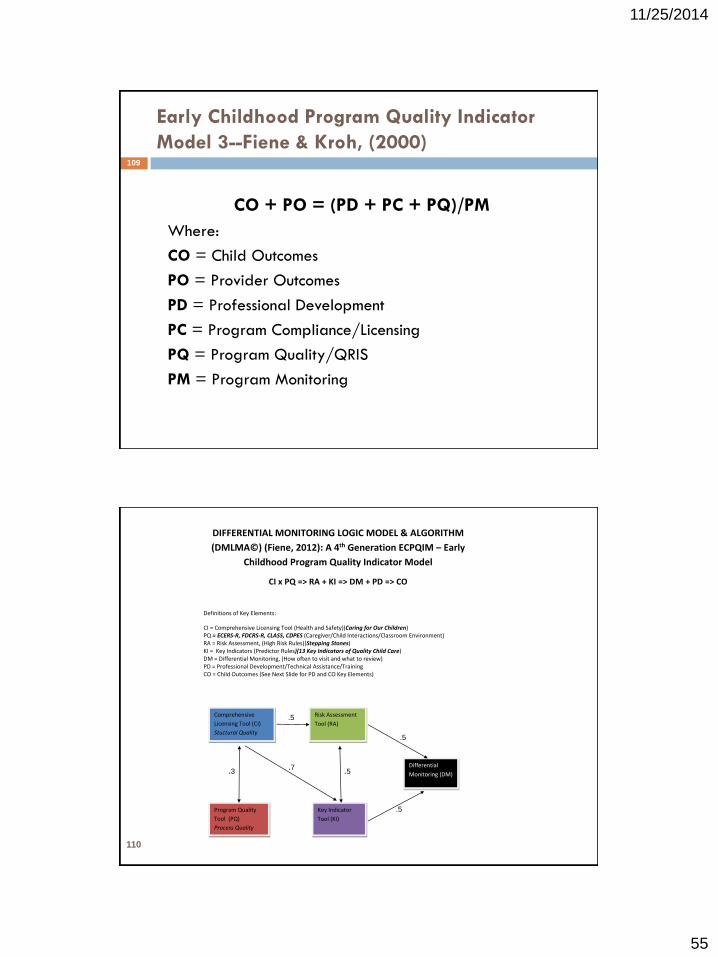
55
11/25/2014
Early Childhood Program Quality Indicator
Model 3--Fiene & Kroh, (2000)
CO + PO = (PD + PC + PQ)/PM
Where:
CO = Child Outcomes
PO = Provider Outcomes
PD = Professional Development
PC = Program Compliance/Licensing
PQ = Program Quality/QRIS
PM = Program Monitoring
109
DIFFERENTIAL MONITORING LOGIC MODEL & ALGORITHM
(DMLMA©) (Fiene, 2012): A 4th Generation ECPQIM – Early
Childhood Program Quality Indicator Model
CI x PQ => RA + KI => DM + PD => CO
Definitions of Key Elements:
CI = Comprehensive Licensing Tool (Health and Safety)(Caring for Our Children) PQ = ECERS-R, FDCRS-R, CLASS, CDPES (Caregiver/Child Interactions/Classroom Environment) RA = Risk Assessment, (High Risk Rules)(Stepping Stones) KI = Key Indicators (Predictor Rules)(13 Key Indicators of Quality Child Care) DM = Differential Monitoring, (How often to visit and what to review) PD = Professional Development/Technical Assistance/Training CO = Child Outcomes (See Next Slide for PD and CO Key Elements)
Comprehensive
Licensing Tool (CI)
Stuctural Quality
Program Quality
Tool (PQ)
Process Quality
Risk Assessment
Tool (RA)
Key Indicator
Tool (KI)
Differential
Monitoring (DM) .3 .7
.5
.5
.5
.5
110

56
11/25/2014
Early Childhood Program Quality Indicator
Models (ECPQIM 1 – 4)
ECPQIM 1: 1975 – 1994. Qualitative to Quantitative; focus on reliability;
data utilization; distinctions between program monitoring and
evaluation; Key Indicators, Weighted Rules, & principles of licensing
instrument design introduced. (Fiene, 1981; Fiene & Nixon, 1985).
ECPQIM 2: 1995 – 1999. Policy Evaluation and Regulatory Systems
Planning added to model. (Griffin & Fiene, 1995).
ECPQIM 3: 2000 – 2011. Inferential Inspections & Risk Assessment added
to model. (Fiene & Kroh, 2000).
ECPQIM 4: 2012 – present. Validation with expected Thresholds &
Differential Monitoring added; Quality Indicators introduced. (Fiene,
2012, 2013b).
111
RELATED PUBLICATIONS AND REPORTS
Barnard, Smith, Fiene, Swanson (2006). Evaluation of Pennsylvania’s Keystone STARS Quality Rating and Improvement System,
Pittsburgh: Pennsylvania, Office of Child Development.
Class (1957). Licensing, unpublished manuscript, USC: University of Southern California.
Fiene (2013a). A comparison of international child care and US child care using the Child Care Aware – NACCRRA (National
Association of Child Care Resource and Referral Agencies) child care benchmarks, International Journal of Child Care and
Education Policy, 7(1), 1-15.
Fiene (2013b). Differential monitoring logic model and algorithm. Middletown: Pennsylvania, Research Institute for Key
Indicators.
Fiene (2013c). Head Start Key Indicators. Middletown: Pennsylvania, Research Institute for Key Indicators.
Fiene (2013d). Kansas Child Care Key Indicators. Middletown: Pennsylvania, Research Institute for Key Indicators.
Fiene (2013e). Validation of Georgia’s core rule differential monitoring system. Middletown: Pennsylvania, Research Institute
for Key Indicators.
Fiene (2007). Child Development Program Evaluation & Caregiver Observation Scale, in T Halle (Ed.), Early Care and
Education Quality Measures Compendium, Washington, D.C.: Child Trends.
Fiene (2003). Licensing related indicators of quality child care, Child Care Bulletin, Winter 2002-2003, pps 12-13.
Fiene (2002a). Thirteen indicators of quality child care: Research update. Washington, DC: Office of the Assistant Secretary for
Planning and Evaluation, US Department of Health and Human Services.
Fiene (2002b). Improving child care quality through an infant caregiver mentoring project, Child and Youth Care Forum, 31(2),
75-83.
112
57
11/25/2014
RELATED PUBLICATIONS AND REPORTS
Fiene, Iutcovich, Johnson, & Koppel (1998). Child day care quality linked to opportunities for professional development: An applied
community psychology example. Community Psychologist, 31(1), 10-11.
Fiene (1996). Using a statistical-indicator methodology for accreditation, in NAEYC Accreditation: A Decade of Learning and the Years
Ahead, S. Bredekamp & B. Willer, editors, Washington, D.C.: National Association for the Education of Young Children.
Fiene (1995). Utilizing a statewide training system to improve child day care quality: The other system in a program quality improvement
model. Child Welfare, Volume LXXIV, #6, November-December, 1189-1201.
Fiene (1985). Measuring the effectiveness of regulations, New England Journal of Human Services, 5(2), 38-39.
Fiene (1981). A new tool for day care monitoring introduced by children's consortium, Evaluation Practice, 1(2), 10-11.
Fiene, Greenberg, Bergsten, Carl, Fegley, & Gibbons (2002). The Pennsylvania early childhood quality settings study, Harrisburg,
Pennsylvania: Governor’s Task Force on Early Care and Education.
Fiene & Kroh (2000). Licensing Measurement and Systems, NARA Licensing Curriculum. Washington, D.C.: National Association for
Regulatory Administration.
Fiene & Nixon (1985). Instrument based program monitoring and the indicator checklist for child care, Child Care Quarterly, 14(3), 198-
214.
Griffin & Fiene (1995). A systematic approach to policy planning and quality improvement for child care: A technical manual for state
administrators. Washington, D.C.: National Center for Clinical Infant Programs-Zero to Three.
Kontos & Fiene (1987). Child care quality, compliance with regulations, and children's development: The Pennsylvania Study, in Quality in
Child Care: What Does Research Tell Us?, Phillips, editor, Washington, D.C.: National Association for the Education of Young Children.
Zellman, G. L. and Fiene, R. (2012). Validation of Quality Rating and Improvement Systems for Early Care and Education and School-Age
Care, Research-to-Policy, Research-to-Practice Brief OPRE 2012. Washington, DC: Office of Planning, Research and Evaluation,
Administration for Children and Families, U.S. Department of Health and Human Services
113
For Additional Information:
Richard Fiene, Ph.D., Director
Research Institute for Key Indicators LLC (RIKI)
Email:
Website:
http://DrFiene.wordpress.com/home/
114