2014 fact book - meharry medical college
TRANSCRIPT

1
2014 Fact Book

2
TABLE OF CONTENTS
______________________________________________________
A Brief History of Meharry Medical College 3
The Board of Trustees 4
Meharry Mission Statement 5
Meharry Vision 6
Meharry Values 7
Degrees Offered 8
Student Applicants 9
Admissions 10
Enrollment 11
Degrees Granted 15
Postgraduate Training 28
Entering Student Tuition and Fees 20
Student Financial Aid 20
Faculty 21
Alumni Physicians 24
Alumni Dentists 27
Ph.D. Alumni 30
Employees 31

3
A Brief History of Meharry Medical College
Meharry Medical College was founded in 1876, as the Medical Department of Central
Tennessee College, to educate freed slaves as health care professionals. Fifty years prior
to its formal founding, a family of former slaves befriended sixteen-year-old Ohio farmer
Samuel Meharry while traveling through rural Kentucky. Meharry was touched by the
kindness and generosity of the desperately poor Black family and vowed to repay his debt
of gratitude. In 1876, Meharry and his brothers made a $30,000 gift toward the
establishment of the medical department of Central Tennessee College. The Freedman's
Aid Society of the Methodist Episcopal Church and the John F. Slater Fund also were
contributors.
In 1915, Meharry separated from Walden University (the successor institution to Central
Tennessee College), having received a new charter from the State of Tennessee. It did,
however, retain its affiliation with the Methodist Church. In January 1916, bylaws were
adopted providing for the governance of the College by an 18-member board of trustees.
On that same date, the board appointed Dr. George W. Hubbard as the institution's first
president.
In the years following, as Meharry continued to grow, it became necessary for the
College to move from its four-story building in south Nashville to its present location on
Dr. D. B. Todd Boulevard in north Nashville in 1931. The cost of the facility was $2
million and was made possible by major gifts from the Edward Harkness Foundation, the
Rockefeller Foundation, the Julius Rosenwald Fund and George Eastman of the Kodak
Foundation.
From these humble beginnings, the College has become the largest private, historically
Black institution in the United States exclusively dedicated to the education of health care
professionals and biomedical scientists. Today it includes the Schools of Medicine,
Dentistry, Graduate Studies and Research, and Allied Health. It has remained a private
institution and their respective accrediting bodies accredit all of the College’s schools and
academic programs. The College has also continued its relationship with the United
Methodist Church, receiving approval by the Church's University Senate and funding
from its Black College Fund.
The dental department within the Meharry Medical Department of Central Tennessee
College was conceived in 1884. Two years later, the dental course was organized within
the department as part of the medical curriculum. This expanded its mission as the first
institution in the Deep South to train African American dentists and it was also one of a
few in that era to promote the recruitment of women into the profession.

4
The Board of Trustees (as of November 2014)
Dr. Frank S. Royal Sr., Chairman
Mr. Milton H. Jones Jr., Vice Chairman
Dr. A. Cherrie Epps, President and Chief Executive Officer
Dr. Nelson L. Adams, III Dr. Lewis Hargett
Dr. Brandon Barton, Jr. Mr. Aubrey Harwell, Jr.
Dr. Kimbra Bell Balark Dr. Robert Holt
Dr. T. B. Boyd, III Dr. Velma Hunter-Jackson
Dr. Kim Cape Dr. Martin D. Jeffries
The Honorable Mrs. M. Inez Crutchfield Dr. Norman Jones
Dr. Fernando Daniels, III Mr. Lewis Lavine
Mr. Richard R. Davis Dr. Gerald Onuoha
Dr. Eric A. Floyd Mr. James E. Williams
Mr. Gary Garfield Mr. Lorenzo Williams
Mr. Derric A. Gregory, Sr. Dr. Robert L. Willliams, Jr.
Emeritus Members
Dr. Frank S. Royal, Sr., Chairman Emeritus
Dr. Richard G. Lester, Life Trustee
Dr. Abraham McIntosh, Trustee Emeritus
The Honorable Mary Pruitt, Trustee Emeritus
Dr. Neal Vanselow, Trustee Emeritus

5
Meharry Mission Statement
Meharry Medical College is an academic health center that exists
to improve the health and health care of minority and underserved
communities by offering excellent education and training
programs in the health sciences. True to its heritage, Meharry
places special emphasis on providing opportunities for people of
color, individuals from disadvantaged backgrounds, and others
regardless of race or ethnicity; delivering high quality health
services; and conducting research that fosters the elimination of
health disparities.

6
Meharry Vision
To enhance our national reputation and expand our global reach
as a quality-driven academic health center noted for its:
Leadership in diversifying the nation's health professions
work force;
Highly effective and innovative educational and training
programs;
Enlightened health policy development and culturally-
sensitive, evidence-based health services; and
Preeminence in focused research that leads to the
elimination of health disparities.

7
Meharry’s Core Values
Excellence: consistently achieving outstanding levels of
performance while upholding the highest standards of
ethical behavior, intellectual honesty, and professional
conduct.
Service: maintaining a nurturing and service-oriented
environment that exceeds expectations and treats all people
with compassion, dignity, and respect.
Accountability: accepting individual and collective
responsibility for preserving and effectively managing the
resources of the College.
Teamwork: encouraging, supporting and valuing the
collaborative efforts of faculty, staff, and students to
advance the quality of education, research, and patient care.
Innovation: promoting creativity and the development of
ideas that stimulate improvements in our intellectual and
operational endeavors.
Diversity: fostering ethnic, intellectual, social, and cultural
diversity.
Community-focused: demonstrating our concern for the
health care needs of underserved communities and
advocating for local, state, and national health and public
policies directed at improving the status of health of all
individuals.
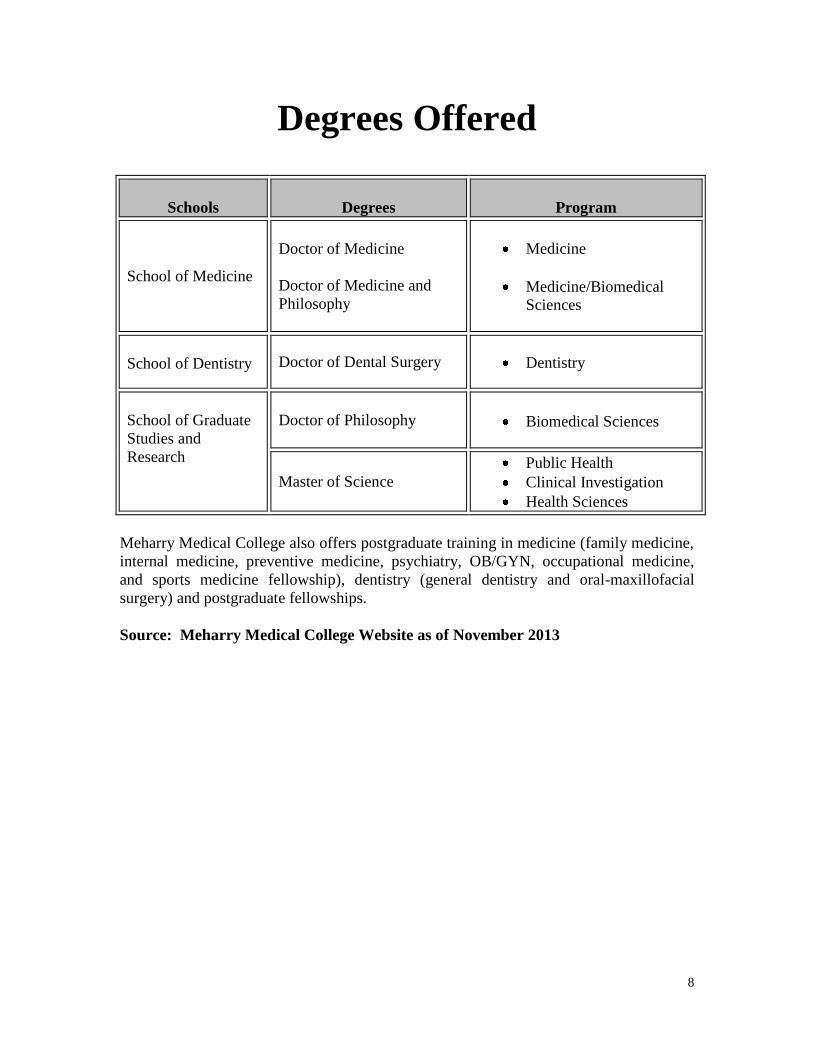
8
Degrees Offered
Schools Degrees Program
School of Medicine
Doctor of Medicine
Doctor of Medicine and
Philosophy
Medicine
Medicine/Biomedical
Sciences
School of Dentistry
Doctor of Dental Surgery Dentistry
School of Graduate
Studies and
Research
Doctor of Philosophy
Biomedical Sciences
Master of Science
Public Health
Clinical Investigation
Health Sciences
Meharry Medical College also offers postgraduate training in medicine (family medicine,
internal medicine, preventive medicine, psychiatry, OB/GYN, occupational medicine,
and sports medicine fellowship), dentistry (general dentistry and oral-maxillofacial
surgery) and postgraduate fellowships.
Source: Meharry Medical College Website as of November 2013

9
Student Applicants, Fall 2014
Student Applicants Number %
Medicine 6,262 77
Dentistry 1,805 22
Graduate Studies and Research (Ph.D.) 40 <1
Graduate Studies and Research (MSPH*) 53 <1
Total 8,160 100%
* Master of Science in Public Health
Source: Banner System as of October 2014

10
Admissions, Fall 2014
Admitted First-year Students Number %
Medicine 109 46
Dentistry 60 25
Graduate Studies and Research (Ph.D.) 6 2
Graduate Studies and Research (MSPH*) 21 9
Graduate Studies and Research (MHS**) 39 18
Total 235 100
* Master of Science in Public Health
**Master of Health Sciences
Source: Banner System as of October 2014

11
Enrollment, Fall 2014
* Master of Science in Public Health
**Master of Health Sciences
Source: Banner System as of October 2014
Enrollment by School Number %
Medicine 451 56
Dentistry 237 30
Graduate Studies and Research (Ph.D.) 40 5
Graduate Studies and Research (MSPH*) 35 4
Graduate Studies and Research (MHS**) 39 5
Total 802 100
12
Enrollment, Fall 2014
0
50
100
150
200
250
300
350
400
450
500
Fall 2012 Fall 2013 Fall 2014
Enrollment Trend by School
Medicine
Dentistry
Graduate Studies
and Research
* Master of Science in Public Health
**Master of Science in Clinical Investigation
***Master of Health Sciences
Source: Banner System as of October 2014
Enrollment Trend Fall
2012
Fall
2013
Fall
2014
Medicine 435 454 451
Dentistry 216 218 237
Graduate Studies and Research (Ph.D.) 46 47 40
Graduate Studies and Research (MSPH*) 44 38 35
Graduate Studies and Research (MSCI**) 5 0 0
Graduate Studies and Research (MHS***) 36 44 39
Total 782 801 802

13
Enrollment, Fall 2014
43% 45%
35%
57% 55%
65%
Medicine Dentistry Graduate Studies
and Research (Ph.D.,
MSPH & MHS)
Enrollment by School and Gender
Male
Female
Enrollment by School and Gender Male Female
Medicine 195 (43%) 256 (57%)
Dentistry 107 (45%) 130 (55%)
Graduate Studies and Research (Ph.D.) 11 (28%) 29 (72%)
Graduate Studies and Research (MSPH*) 14 (40%) 21 (60%)
Graduate Studies and Research (MHS**) 15 (38%) 24 (62%)
Total 342 (42%) 460 (58%)
* Master of Science in Public Health
**Master of Health Sciences
Source: Banner System as of October 2014

14
Enrollment, Fall 2014
80%
8% 7% 4%
1%
Black, Non-
Hispanic
White, Non-
Hispanic
Asian, Pacific
Islander
Hispanic American
Indian/Alaskan
Native
Meharry Student Enrollment by Ethnic Origin
Enrollment by
Ethnic Origin Medicine Dentistry
Graduate Studies and Research
Total (PH.D.) (MSPH*) (MHS**)
Black,
Non-Hispanic 353
(78%)
188
(79%)
36
(91%)
29
(83%)
39
(100%)
645
(80%)
White,
Non-Hispanic
38
(8%)
20
(8%)
2
(5%)
4
(11%)
0
(0%)
64
(8%)
Asian/Pacific
Islander
39
(9%)
14
(6%)
1
(2%)
2
(6%)
0
(0%)
56
(7%)
Hispanic 20
(4%)
15
(7%)
1
(2%)
0
(0%)
0
(0%)
36
(4%)
American Indian/
Alaskan Native
1
(1%)
0
(0%)
0
(0%)
0
(0%)
0
(0%)
1
(1%)
Total 451
(100%)
237
(100%)
40
(100%)
35
(100%)
39
(100%)
802
(100%)
* Master of Science in Public Health **Master of Health Sciences
Source: Banner System as of October 2014

15
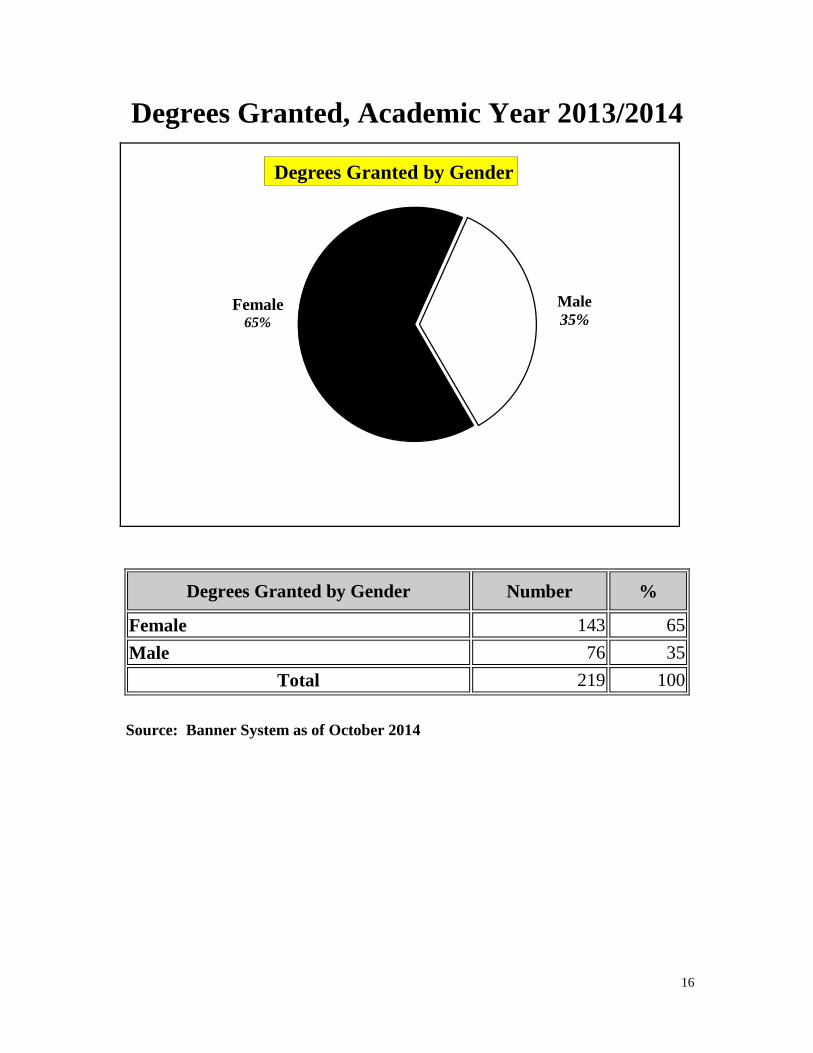
Degrees Granted, Academic Year 2013/2014
Degrees Granted by Program Number %
Medicine 98 45
Dentistry 42 19
Doctoral (Ph.D.) 10 5
Master of Science Public Health (MSPH) 24 11
Master of Clinical Investigation (MSCI) 3 1
Master of Health Sciences (MHS) 42 19
Total 219 100
Source: Banner System as of October 2014
16
Degrees Granted, Academic Year 2013/2014
Female 65%
Male
35%
Degrees Granted by Gender
Degrees Granted by Gender Number %
Female 143 65
Male 76 35
Total 219 100
Source: Banner System as of October 2014

17
Degrees Granted, Academic Year 2013/2014
Degrees Granted by Ethnic Origin Number %
Black, Non-Hispanic 184 84
White, Non-Hispanic 10 5
Asian/Pacific Islander 20 9
Hispanic 5 2
Total 219 100
Source: Banner System as of October 2014

18
Postgraduate Training, 2014
1%
6%
10%
5%
19%
17%
42%
Sports Medicine Fellowship
Occupational Medicine
OB/GYN
Preventive Medicine
Psychiatry
Family Medicine
Internal Medicine
School of Medicine Residents
School of Medicine Residents/Fellowships Number %
Internal Medicine 45 42
Family Medicine 18 17
Psychiatry 20 19
Preventive Medicine 5 5
OB/GYN 11 10
Occupational Medicine 6 6
Sports Medicine Fellowship 1 1
Total 106 100
Source: School of Medicine as of October 2014

19
Postgraduate Training, 2014
School of Dentistry Residents Number %
General Practice 9 69
Oral Maxillofacial Surgery 4 31
Total 13 100
Source: School of Dentistry as of November 2014

20
Entering Student Tuition and Fees,
Academic Year 2014/15
Program Academic Year 14/15
Medicine Tuition $40,695
Fees $7,768
Total $48,463
Dentistry Tuition $42,235
Fees $12,069
Total $54,304
Graduate Studies and Research (Ph.D.) Tuition $13,560
Fees $6,634
Total $20,194
Graduate Studies and Research (MSPH*)
* Master of Science in Public Health
Tuition $20,640
Fees $5,861
Total $26,501
Graduate Studies and Research (MHS**)
**Master of Health Sciences
Tuition $25,800
Fees $7,302
Total $33,102
Student Financial Aid, 2014
Scholarships/Grants Loans
School Amount # of
Students Amount
# of
Students
Medicine $2,868,768 250 $24,641,165 415
Dentistry $1,871,870 108 $14,006,255 207
Graduate Studies and
Research
$215,530 51 $3,260,968 88
Total $4,956,168 409 $41,908,388 710
Eighty-nine percent (89 %) of medical, dental, and graduate students received financial
aid in 2014.
Source: Office of Student Financial Aid via the IT Department, as of 11/19/14

21
Faculty, 2014
Faculty by Employment Status Number %
Full-time 197 92
Part-time 18 8
Total 215 100
Source: Banner Human Resource System as of November 1, 2014
(Instructional faculty are counted on the basis of an 11/12 month-salary contract)

22
Faculty, 2014
Faculty by Gender Number %
Female 89 41
Male 126 59
Total 215 100
Source: Banner Human Resource System as of November 1, 2014
(Instructional faculty are counted on the basis of an 11/12 month-salary contract)

23
Faculty, 2014
Faculty by Ethnic Origin Number %
Black, Non-Hispanic 125 58
White, Non-Hispanic 46 21
Asian/Pacific Islander 36 17
Hispanic 8 4
Total 215 100
Source: Banner Human Resource System as of November 1, 2014
(Instructional faculty are counted on the basis of an 11/12 month-salary contract)

24
Alumni Physicians
2%
2%
3%
4%
6%
7%
8%
11%
14%
17%
Orthopedic Surgery
Opthalmology
Emergency Medicine
Anesthesiology
Psychiatry
Pediatrics
General Surgery
Obstetrics/Gynecology
Internal Medicine
Family Practice
Ten Largest Alumni Physician Specialties
Ten Largest Alumni Physician Specialties Number %
Family Practice 776 17
Internal Medicine 661 14
Obstetrics/Gynecology 531 11
General Surgery 372 8
Pediatrics 335 7
Psychiatry 279 6
Anesthesiology 173 4
Emergency Medicine 142 3
Ophthalmology 90 2
Orthopedic Surgery 81 2
All Other Specialties 1,242 27
Total 4,682 100
Source: American Medical Association as of January 2014

25
Alumni Physicians
Primary Care
38%
Non-Primary
Care 58%
Unknown
4%
Alumni Physicians by Specialty
Specialty Number %
Primary Care (Internal Medicine, Pediatrics, and
Family Practice) 1,772 38
Non-Primary Care 2,720 58
Unknown 190 4
Total 4,682 100
Source: American Medical Association as of January 2014

26
Alumni Physicians
Ten States with the Most Alumni Physicians Number %
Tennessee (TN) 730 16
California (CA) 534 11
Georgia (GA) 354 8
Texas (TX) 298 6
New York (NY) 239 5
Florida (FL) 218 5
Alabama (AL) 176 4
Illinois (IL) 170 4
Michigan (MI) 168 4
Louisiana (LA) 166 4
All Other States 1,629 34
Total 4,682 100
Source: American Medical Association as of January 2014
16%
11%
8%6%
5% 5%4% 4% 4% 4%
TN CA GA TX NY FL AL IL MI LA
Ten States with the Most Alumni Physicians

27
Alumni Dentists
1%
1%
1%
1%
1%
2%
2%
81%
Endodontics
Prosthodontics
Public Health
Periodontics
Pediatric Dentistry
Oral Surgery
Orthodontics
General Practice
Alumni Dentist Specialties
Alumni Dentist Specialties Number %
General Practice 1,803 81
Orthodontics 53 2
Oral Surgery 41 2
Pediatric Dentistry 31 1
Periodontics 26 1
Public Health 24 1
Prosthodontics 22 1
Endodontics 13 1
Oral Pathology 5 <1
Unknown 196 9
Total 2,214 100
Source: American Dental Association as of January 2014

28
Alumni Dentists
Specialty Number %
General Practice 1,803 81
Other Specialties 215 10
Unknown 196 9
Total 2,214 100
Source: American Dental Association as of January 2014

29
Alumni Dentists
Ten States with the Most Alumni Dentists Number %
Tennessee (TN) 428 19
California (CA) 135 6
Georgia (GA) 133 6
Texas (TX) 127 6
Illinois (IL) 112 5
New York (NY) 105 5
Florida (FL) 97 4
Michigan (MI) 77 4
Virginia (VA) 77 4
North Carolina (NC) 76 3
All Other States 847 38
Total 2,214 100
Source: American Dental Association as of January 2014
19%
6% 6% 6% 5% 5% 4% 4% 4% 3%
TN CA GA TX IL NY FL MI VA NC
Ten States with the Most Alumni Dentists

30
Ph.D. Alumni
33%
1%
3%
10%
3%
20%
30%
Other
College Chairperson
Medical Student
Scientific Researcher
Medical Resident
College Professor
Postdoctoral Student
Ph.D. Alumni Positions
Position Number %
Postdoctoral Student 80 30
College Professor 52 20
Medical Resident 9 3
Scientific Researcher 26 10
Medical Student 7 3
College Chairperson 3 1
Other 88 33
Total 266 100
Source: School of Graduate Studies as of January 2014

31
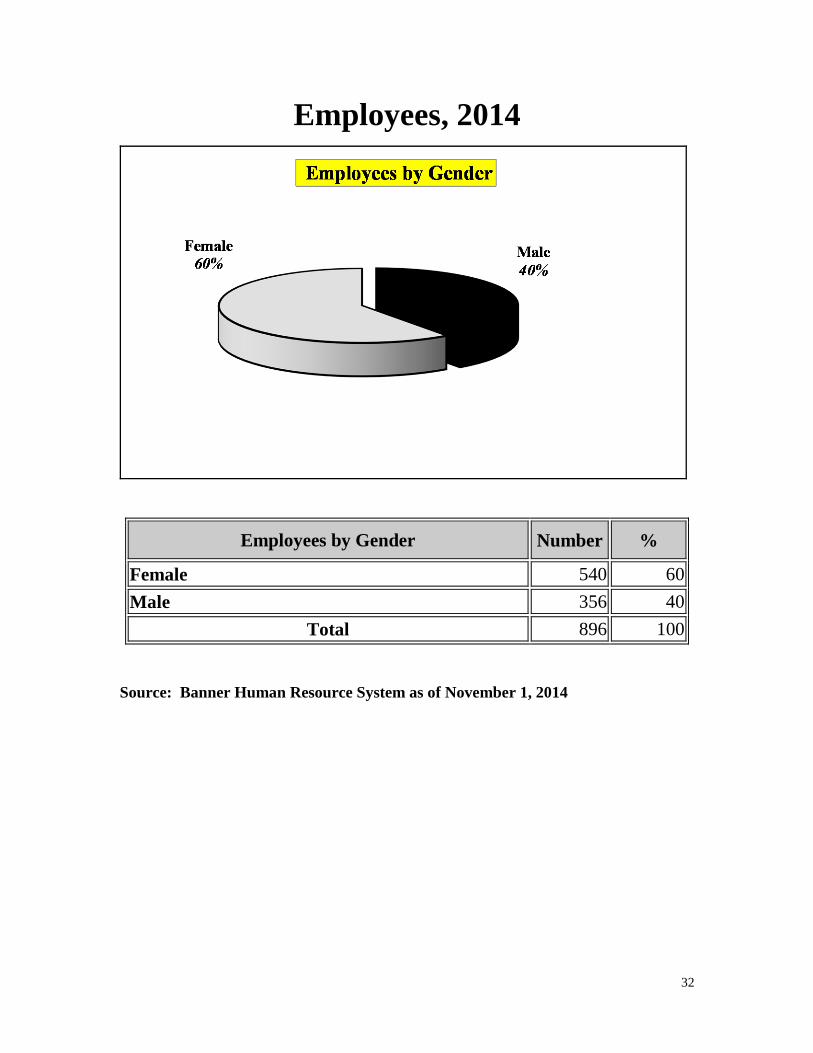
Employees, 2014
Employees by Employment Status Number %
Full-time 866 97
Part-time 30 3
Total 896 100
Source: Banner Human Resource System as of November 1, 2014
32
Employees, 2014
Employees by Gender Number %
Female 540 60
Male 356 40
Total 896 100
Source: Banner Human Resource System as of November 1, 2014

33
Employees, 2014
Employees by Ethnic Origin Number %
Black, Non-Hispanic 650 73
White, Non-Hispanic 124 14
Asian/Pacific Islander 90 10
Hispanic 31 3
American Indian/Alaskan Native 1 <1
Total 896 100
Source: Banner Human Resource System as of November 1, 2014

34
Embarking on a New Era of Achievement
MEHARRY MEDICAL COLLEGE 1005 Dr. D.B. Todd, Jr. Blvd.
Nashville, Tennessee 37208
(615) 327-6111
www.mmc.edu
PUBLICATION DATE: January 15, 2015