brian&diers,&carol&fox,&troy&cary,&john&meharry,&alex...
TRANSCRIPT

Brian Diers, Carol Fox, Troy Cary, John Meharry, Alex Lipka UIUC Bill Beavis, Dawn Gibson, Reka Howard Iowa State University Katy MarEn Rainy, Bill Muir, Alencar Xavier, Purdue University
Jim Specht and George Graef, University of Nebraska Perry Cregan, Qijian Song, USDA-‐ARS
William Schapaugh, Kansas State University Stella Kantartzi, Southern Illinois University Dechun Wang, Michigan State University Grover Shannon, University of Missouri Leah McHale, The Ohio State University Randy Nelson and Rouf Mian, USDA-‐ARS

• Background • Materials and
methods • Preliminary
results

• Map QTL controlling agronomic, composi;on, physiological and resistance traits across a wide range of soybean germplasm.
• Iden;fy beneficial QTL alleles from elite and exo;c germplasm
• Use informa;on to develop selec;on models for forward breeding.

• Nested associa;on mapping (NAM) combines advantages of linkage and associa;on mapping. – Linkage mapping -‐ Advantage of power in iden;fying QTL but disadvantage of poor map resolu;on.
– Associa;on mapping – Advantage of high map resolu;on but disadvantage of poor power in iden;fying QTL.

• Focus on MG III. • Used IA3023 as the hub parent.
• Poten;al parents (MG II-‐IV) were nominated by breeders.
• Tested with 1,536 SNP markers using the Golden Gate assays to iden;fy a diverse set of parents.

Parent Origin Parent Origin 4J105-3-4 Purdue Univ. LG94-1128 USDA-ARS
5M20-2-5-2 Purdue Univ. LG94-1906 USDA-ARS
CL0J095-4-6 Purdue Univ. LG97-7012 USDA-ARS
CL0J173-6-8 Purdue Univ. LG98-1605 USDA-ARS
HS6-3976 Ohio State Magellan Univ. of Missouri
LD00-3309 Univ. of Illinois Maverick Univ. of Missouri
LD01-5907 Univ. of Illinois NE3001 Univ. of Nebraska
LD02-4485 Univ. of Illinois Prohio Ohio State Univ.
LD02-9050 Univ. of Illinois S06-13640 Univ. of Missouri
LG03-2979 USDA-ARS Skylla Mich. State Univ.
LG03-3191 USDA-ARS TN05-3027 Univ. of Tenn.
LG00-3372 USDA-ARS U03-100612 Univ. of Nebraska
LG04-4717 USDA-ARS PI 398.881 South Korea
LG04-6000 USDA-ARS PI 427.136 South Korea
LG05-4292 USDA-ARS PI 437.169B Russia
LG05-4317 USDA-ARS PI 438.164B China
LG05-4464 USDA-ARS PI 518.751 Serbia
LG05-4832 USDA-ARS PI 561.370 China
LG90-2550 USDA-ARS PI 404.188A China
LG92-1255 USDA-ARS PI 574.486 China
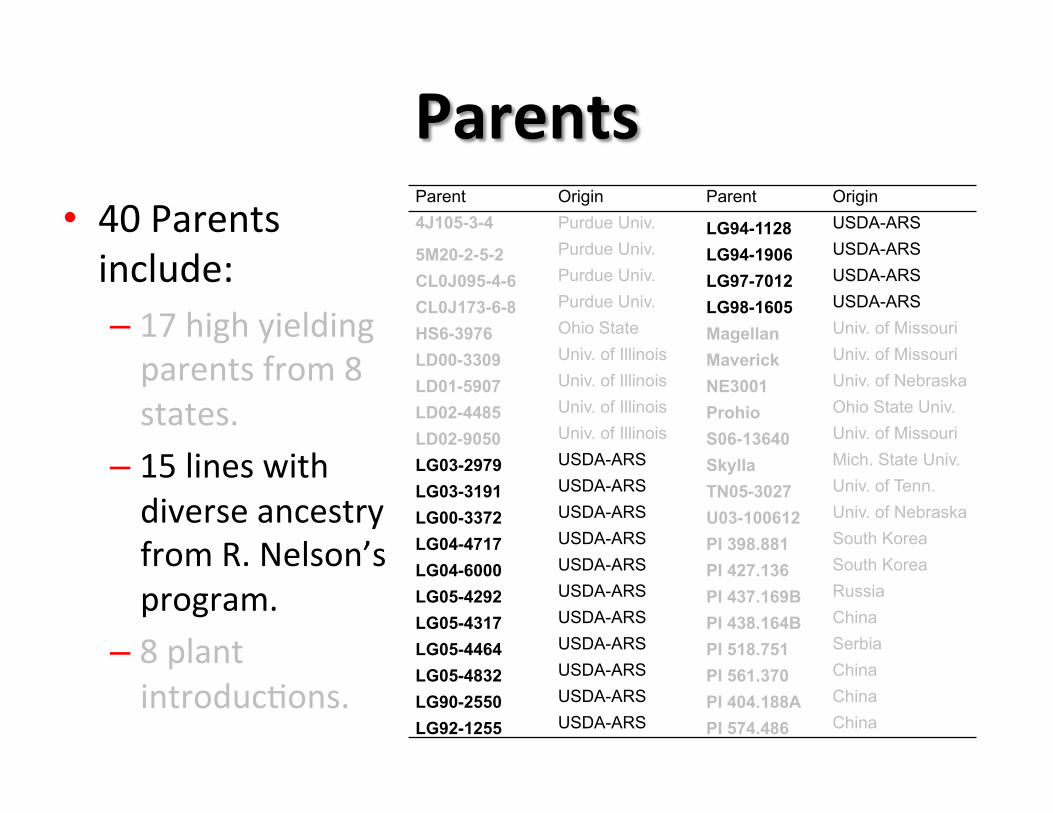
• 40 Parents include: – 17 high yielding parents from 8 states.
– 15 lines with diverse ancestry from R. Nelson’s program.
– 8 plant introduc;ons.
Parent Origin Parent Origin 4J105-3-4 Purdue Univ. LG94-1128 USDA-ARS
5M20-2-5-2 Purdue Univ. LG94-1906 USDA-ARS
CL0J095-4-6 Purdue Univ. LG97-7012 USDA-ARS
CL0J173-6-8 Purdue Univ. LG98-1605 USDA-ARS
HS6-3976 Ohio State Magellan Univ. of Missouri
LD00-3309 Univ. of Illinois Maverick Univ. of Missouri
LD01-5907 Univ. of Illinois NE3001 Univ. of Nebraska
LD02-4485 Univ. of Illinois Prohio Ohio State Univ.
LD02-9050 Univ. of Illinois S06-13640 Univ. of Missouri
LG03-2979 USDA-ARS Skylla Mich. State Univ.
LG03-3191 USDA-ARS TN05-3027 Univ. of Tenn.
LG00-3372 USDA-ARS U03-100612 Univ. of Nebraska
LG04-4717 USDA-ARS PI 398.881 South Korea
LG04-6000 USDA-ARS PI 427.136 South Korea
LG05-4292 USDA-ARS PI 437.169B Russia
LG05-4317 USDA-ARS PI 438.164B China
LG05-4464 USDA-ARS PI 518.751 Serbia
LG05-4832 USDA-ARS PI 561.370 China
LG90-2550 USDA-ARS PI 404.188A China
LG92-1255 USDA-ARS PI 574.486 China
• 40 Parents include: – 17 high yielding parents from 8 states.
– 15 lines with diverse ancestry from R. Nelson’s program.
– 8 plant introduc;ons.

• 40 popula;ons with 140 F5-‐derived RILs in each popula;on developed in Illinois and Nebraska (5,600 RILs).
• Gene;c marker work done in Beltsville by Cregan and Song. – 41 parents of the popula;ons tested with 50,000 SNP markers.
– Parents resequenced to iden;fy SNPs with rare alleles from IA3023.
– Lines in popula;ons tested with 5,300 SNP markers.

Chromosome Markers Map Units 1 189 67 2 235 105 3 203 93 4 164 93 5 207 92 6 236 87 7 239 116 8 274 154 9 162 83 10 251 109 11 225 107 12 171 58 13 249 121 14 205 71 15 205 90 16 179 86 17 194 152 18 314 87 19 249 74 20 162 85
Total 4313 1930

Chromosome 1 Chromosome 2 Chromosome 3
Chromosome 4 Chromosome 5 Chromosome 6
cM
Physical Distance
0
10
20
30
40
50
60
70
0 20000000 40000000 60000000 0
20
40
60
80
100
120
0 20000000 40000000 0
20
40
60
80
100
0 10000000 20000000 30000000 40000000 50000000
0
20
40
60
80
100
0 20000000 40000000 60000000 0
20
40
60
80
100
0 20000000 40000000 60000000 0
20
40
60
80
100
0 20000000 40000000 60000000

Chromosome 7 Chromosome 8 Chromosome 9
Chromosome 10 Chromosome 11 Chromosome 12
Physical Distance
0
20
40
60
80
100
120
140
0 20000000 40000000 0
20
40
60
80
100
120
140
160
0 20000000 40000000 0
20
40
60
80
100
0 20000000 40000000
0
20
40
60
80
100
120
0 20000000 40000000 60000000 0
20
40
60
80
100
120
0 20000000 40000000 0
20
40
60
80
0 20000000 40000000
cM

Chromosome 13 Chromosome 14 Chromosome 15
Chromosome 16 Chromosome 17 Chromosome 18
Physical Distance
0
20
40
60
80
100
120
140
160
0 20000000 40000000 0
20
40
60
80
0 20000000 40000000 0
20
40
60
80
100
0 20000000 40000000 60000000
0
20
40
60
80
0 20000000 40000000
0
20
40
60
80
100
120
0 20000000 40000000
0
20
40
60
80
100
0 20000000 40000000 60000000
cM

Brian Diers 16,000
Jim Specht and George Graef 16,000

Bill Beavis 12,800
Brian Diers 16,000
Katy Rainey 12,800
Jim Specht and George Graef 16,000

Dechun Wang 2,000
Rouf Mian 4,000
Leah McHale 4,000
Bill Beavis 12,800
Brian Diers 16,000
Katy Rainey 12,800
Stella Kantartzi 4,000
Grover Shannon 2,000
Jim Specht and George Graef 16,000
Bill Schapaugh 8,000

• Challenging environments for phenotyping. • 2012 SIU lost from poor emergence.
• 2013 Nebraska lost from hail.
• Seven environments suffered from significant lack of rainfall.

• Agronomic traits all environments: • Lodging, Height, Maturity, Seed yield.
• Agronomic traits at some environments: • R1, Seed wt.
• ComposiEon traits: • Protein, oil, elemental content (ionomics).
• Physiological traits: • Photosynthe;c traits derived from leaf reflectance, canopy
closure during flowering (light harves;ng ability), canopy structure.
• Serendipitous traits: • Leaf wil;ng, SDS, vein streak necrosis virus.
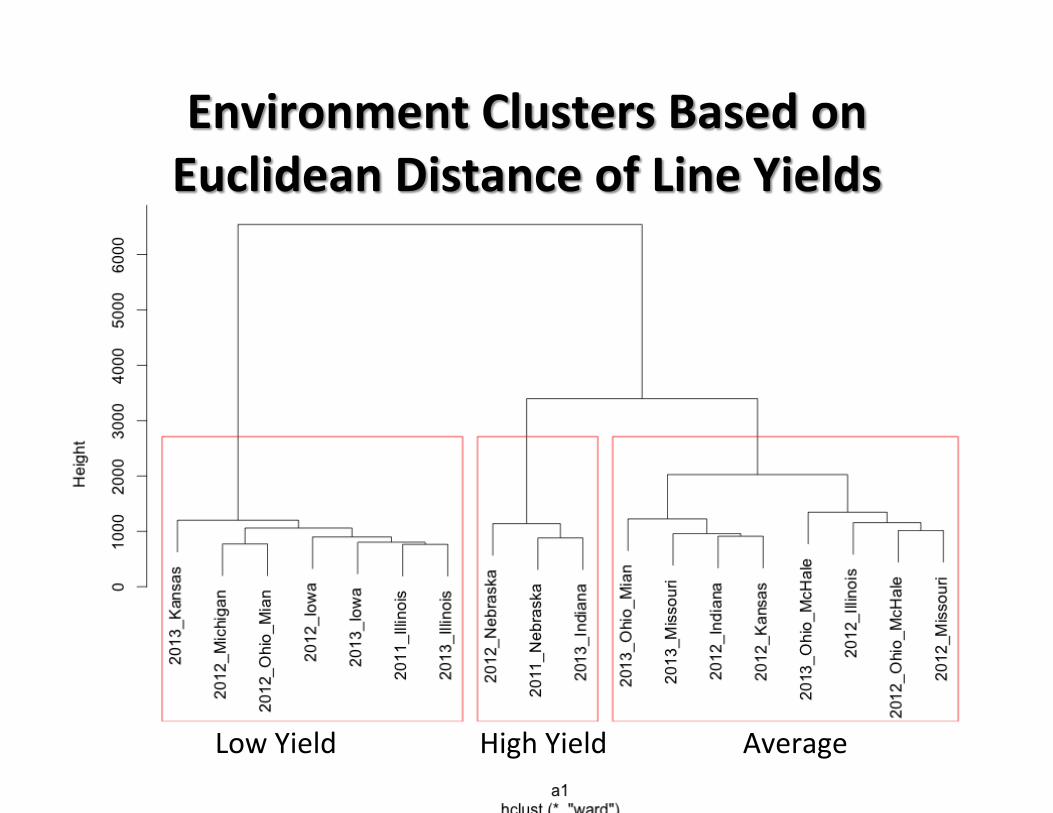
Low Yield High Yield Average

Elite Nelson PI Ancestry PI

• Finalize the gene;c marker data on the RILs. • Analyze the data with other gene;c models. • Project other marker data on the lines
– 491,000 SNPs from the parents (Qijian Song) – CNV data (Bob Stupar) – Methyla;on (Scof Jackson)
• Use NAM data to develop selec;on models.

• Data will be available May 15, 2015.
• Lines and parents will be available with MTAs.
