2014 university of georgia vidalia onion extension and
TRANSCRIPT

2014 University of Georgia Vidalia Onion Extension and Research Report

2014 University of Georgia Onion Research and Extension Report
Timothy Coolong (editor)
Contributing Authors
Department of Horticulture
Faculty Timothy Coolong
Juan Carlos Diaz-Perez
Staff Anthony Bateman
Jesus Bautista Melissa A. Brannon
Guna Gunawati
Department of Plant Pathology
Faculty Bhabesh Dutta
Ron Gitaitis David Langston Hunt Sanders
Staff
Michael Donahoo Michael Foster Erin Holliman
Jonathon Van Keith Searcy Samuel Smith
Department of Entomology
Faculty David G. Riley
Alton Sparks Jr.
Staff Donnie Cook Eric Evans
County and Regional Faculty
Chris Earls, Candler County ANR agent Jason Edenfield, Toombs County ANR agent
Billy Griffin, Tattnall County ANR agent Brooke Jeffries, Wheeler County ANR agent Jennifer Miller, Montgomery and Treutlen
counties ANR agent Cliff Riner, area onion agent
Chris Tyson, Tattnall County ANR agent
Vidalia Onion and Vegetable Research Center Staff
Cliff Riner, Superintendent Randy Hill
Denny Thigpen GA Department of Corrections
Much of the research presented in this report was sponsored by the Vidalia Onion Committee – We thank them for their support.

Contents
Report PageUGA Variety Trial Report 2012-13 Crop Season.....................................................................................................4
UGA Variety Trial Report 2013-14 Crop Season.....................................................................................................5
Impact of Fertilization Program on Yield and Quality of Vidalia Onions .............................................................10
Potassium Fertilization Effects on Sweet Onion Yield ..........................................................................................15
Impact of Poly-coated Urea Products for the Production of Vidalia Onions .........................................................17
Evaluation of Ignite S2 Transplant Dip on Vidalia Onion Yield ...........................................................................20
Effect of Sulfur Dioxide on the Efficacy of Controlled Atmosphere (CA) and Ozone Storage for the Postharvest Control of Botrytis aclada in Vidalia Sweet Onions ..........................................................................21
Investigation on the Spatio-temporal Spread of the Pseudomonas coronafaciens pv. morceparum in Onion Seedbeds and Production Fields .................................................................................................................25
Research Report on Management of Sour Skin 2013-14 Season ..........................................................................29
At Plant Applications of FRAC Group 7 Fungicides: Effect on Fungal Diseases and Yield in Vidalia Onions ...34
Effect of Pre-Harvest Fungicide Sprays and Commercial Drying on Black Mold of Onion ................................37
Thrips on Onions – Verimark Trial – VOVRC – 2014 ..........................................................................................40
Thrips Control in Onion Spray Trial 2013 .............................................................................................................42
Annual Report of the Vidalia Onion Research Laboratory, University of Georgia – Tifton Campus ...................45

UGA Extension Annual Publication 114 • 2014 University of Georgia Vidalia Onion Extension and Research Report4
UGA Variety Trial Report 2012-13 Crop Season
Cliff Riner1, Timothy Coolong2, Ron Gitaitis3, Jason Edenfield4, Chris Tyson5, Chris Earls6, Brooke Jeffries7, Jennifer Miller8,
Anthony Bateman2, Randy Hill9, and Denny Thigpen9
NoteA variety trial for the 2012-13 production season was completed; however, seedbed
production issues required sourcing some varieties from off-site locations. Therefore, while results were recorded, trial results for this season will not be published. The data will be available by request to any interested party. For these results, contact your local
Extension office or the Vidalia Onion and Vegetable Research Center.
1 Vidalia Onion Area Agent; 2 University of Georgia Department of Horticulture; 3 University of Georgia Department of Plant Pathology; 4
Toombs County, ANR Agent; 5 Tattnall County, ANR Agent; 6 Candler County, ANR Agent; 7 Wheeler County, ANR Agent; 8 Montgomery and Treutlen Counties, ANR Agent; 9 Vidalia Onion and Vegetable Research Center

UGA Extension Annual Publication 114 • 2014 University of Georgia Vidalia Onion Extension and Research Report 5
UGA Variety Trial Report 2013-14 Crop Season
Cliff Riner1, Timothy Coolong2, Ron Gitaitis3, Juan Carlos Diaz2, Jason Edenfield4, Chris Tyson5, Chris Earls6, Brooke Jeffries7, Jennifer Miller8, Anthony Bateman2, Billy Giffin5, Randy Hill9, and Denny Thigpen9
IntroductionThe University of Georgia evaluates short day
onions to determine their performance characteristics in standardized growing practices. The varieties are placed in the trial by participating seed companies. These trials are conducted at the Vidalia Onion and Vegetable Research Center.
Materials and MethodThere were 37 varieties entered into the 2013-14
trial. The seedbeds were grown at the Vidalia Onion and Vegetable Research Center in Lyons, Georgia. Seedbed treatment included a 75-gallon per acre fumigation treatment of metam sodium. The seedbeds were planted on September 16, 2013, and the trial was transplanted on November 18, 2013. Upon harvest and grading, one bag of jumbo onions per plot is sent to the Vidalia Onion Research Lab in Tifton, Georgia, to undergo controlled atmospheric storage conditions. The storage duration was carried out until September 15, 2014. Seedbed and trial fertility and fungicide programs are listed below.
The trial evaluated all 37 varieties in 25-foot long by 6-foot wide plots. Each variety was replicated four times and harvested based on a committee decision of maturity. The plant population for the trial was equivalent to 87,120 plants per acre.
Seedbed Fertility:• 150 lb/A of 18-46-0 applied the day of planting• 200 lb/A of 10-10-10 applied two weeks after planting• 200 lb/A of 10-10-10 applied four weeks after planting• 300 lb/A of 10-10-10 applied six weeks after plantingNote: All fertilizer applications were applied with a First Products brand drop spreader.
Trial Fertility:• 350 lb/A of 5-10-15 applied Dec. 3• 350 lb/A of 5-10-15 applied Jan. 9• 400 lb/A of 5-10-15 applied Feb. 3• 200 lb/A of CaNO3 applied Feb. 17• 200 lb/A of CaNO3 applied Mar. 3Total: 117 – 110 – 165 – 77
(N) (P) (K) (S)Note: Soil sample test results called for 60 units of phosphorus, 90 units of potash, and 60 units of sulfur.
Trial Fungicide Schedule:Date Fungicide Applied (including rate)Dec. 17: Pristine 14 oz/A +
MagnaBon(Copper) 12 oz/AJan. 16: Chlorothalonil 1.5 pt/A +
MagnaBon 12 oz/AFeb. 3: Pristine 14 oz/A + MagnaBon 12 oz/AFeb. 18: Catamaran 4 pt/AFeb. 28: Reason 5 oz/acre + Manzate 2 lb/AMar. 10: Pristine 14 oz/acre + MagnaBon 12 oz/AMar. 20: Catamaran 4 pt/AMar. 26: Inspire Super 1 pt/acre +
MagnaBon 12 oz/AMar. 31: Catamaran 4 pt/acreApr. 11: Inspire Super 1 pt/acre +
MagnaBon 12 oz/AApr. 21: Catamaran 4 pt/AApr. 28: Fontellis 1 pt/acre + MagnaBon 12 oz/A
Harvest Timing: Each variety was evaluated and selected for
harvest based upon signs of weak tops and adequate sized bulbs. A committee of Cooperative Extension agents determined the harvest/pulling of varieties. Participating seed companies reserve the right to specify when or what characteristics determine harvest of their variety.
April 17: Isabella, Candy Kim, Candy Ann, NUN 1002, NUN 1003, GoldenBoy
April 24: Sweet Agent, Sweet Treat, DP Sweet 1407, NUN 1008
April 28: XON-109Y, Ringo, Sweet Harvest, Pirate, Emy 55455, Century, Mr. Buck, Sapelo Sweet, Caramelo, NUN 1006, 11-26
May 5: Sweet Jasper, Sweet Uno, E61S.U6253, Red Coach, J3008, Red Hunter, Emy 55102, Emy 55164, Goldeneye, Savannah Sweet, Granex Yellow PRR, SV2657NK, Miss Megan, Sweet Caroline
May 19: Inkopah, Mata Hari

UGA Extension Annual Publication 114 • 2014 University of Georgia Vidalia Onion Extension and Research Report6
Results and DiscussionTables 1-6 show field and marketable yields as well as percent gradeout (culls removed at grading) and
percent colossal, jumbo, and medium bulbs, respectively. Table 7 reports data on loss during storage. For additional information regarding the performance of a given variety in this trial please contact your local Extension agricultural and natural resources agent or the Vidalia Onion and Vegetable Research Center.
We would like to thank the participating seed companies as well as the Vidalia Onion Committee for their support of this trial.
Table 1. Field (green) weights of varieties expressed on a per plot basis.Variety Field/Green Weight (lb/plot)DP 1407 206.3 a*Candy Kim 193.5 abMata Hari 190.1 cbRingo 180.3 bcdSweet Treat 180.3 bcdSweet Agent 177.4 cdeIsabella 176.2 cdeJ3008 172.1 defSweet Harvest 171.2 defgNun 1002 171.0 defgNun 1003 170.7 defgNun 1008 170.1 defgPirate 169.2 defgE61S.U6253 168.2 defghGoldenboy 167.0 defghiSweet Caroline 163.9 defghijMiss Megan 162.9 efghijkRed Hunter 157.6 fghijklNun 1006 156.0 fghijklmSavannah Sweet 154.7 ghijklmnSapelo Sweet 154.3 ghijklmnXon - 109Y 152.0 hijklmnCentury 151.0 ijklmnCandy Ann 150.1 jklmnGranex Yellow PRR 148.7 jklmnoEmy 55102 148.1 jklmnoSweet Jasper 146.7 klmnoGoldeneye 144.2 lmnoSV2657NK 143.7 lmnoMr. Buck 141.1 lmnoCaramelo 140.2 mnoRed Coach 138.6 noEmy 55455 138.4 noSweet Uno 137.4 noP1126 132.6 opEmy 55164 121.8 pInkopah 121.4 p* Letters that are the same between varieties indicate that those varieties are not significantly
different according to Fisher’s LSD (P ≤ 0.05).

UGA Extension Annual Publication 114 • 2014 University of Georgia Vidalia Onion Extension and Research Report 7
Table 2. Total marketable yield (40 lbs boxes per acre) after curing and grading.
Variety CompanyMarketable/Graded Weight
(40 lb boxes/acre)Mata Hari (RED) Nunhems 1147.8 a*Nun 1008 Nunhems 1111.5 abJ3008 Bejo 1081.7 abcPirate Bejo 1046.2 abcdSweet Agent Seminis 1030.2 abcdNun 1006 Nunhems 1009.9 bcdeSweet Jasper Sakata 989.5 bcdefE61S.U6253 Enza Zaden 984.5 bcdefNun 1002 Nunhems 952.5 cdefgSweet Caroline Nunhems 948.2 cdefghRed Hunter(RED) Bejo 941.6 defghiCentury Seminis 924.2 defghiNun 1003 Nunhems 923.5 defghiDP Sweet 1407 DP Seeds 916.9 defghiGoldeneye Seminis 874.8 efghijXON-109Y Sakata 873.4 efghijCaramelo Nunhems 873.4 efghijSapelo Sweet DP Seeds 863.2 fghijMiss Megan Dp Seeds 858.9 fghijEmy 55102 Emerald 848.7 fghijkEmy 55455 Emerald 834.2 ghijklMr. Buck DP Seeds 833.4 ghijklRingo Sakata 820.4 ghijklmCandy Kim Solar 808.0 hijklmnSweet Harvest Sakata 805.1 ijklmn11-26 (Grano) Pike Seeds 760.8 jklmnoCandy Ann Solar 757.2 jklmnoGrnx. Yellow PRR Seminis 745.6 jklmnoSweet Treat Shamrock 713.7 klmnoEmy 55164 Emerald 703.5 lmnopSweet Uno Enza Zaden 700.6 lmnopInkopah (RED) Emerald 686.8 mnopqSavannah Sweet Seminis 678.1 nopqRed Coach (RED) Enza Zaden 671.6 nopqSV2657NK Seminis 638.2 opqGolden Boy Shamrock 575.0 pqIsabella Wannamaker 553.9 q* Letters that are the same between varieties indicate that those varieties are not significantly different according to
Fisher’s LSD (P ≤ 0.05).

UGA Extension Annual Publication 114 • 2014 University of Georgia Vidalia Onion Extension and Research Report8
Table 3. Percent culls or gradeout.Variety Gradeout (%)*Sweet Jasper 93Nun 1008 90Nun 1006 89Emy 55164 89J3008 87Goldeneye 87Emy 55455 86Caramelo 86Pirate 85Century 84Mata Hari (RED) 83Red Hunter(RED) 82Mr. Buck 81E61S.U6253 81Sweet Agent 80Sweet Caroline 80XON-109Y 7911-26 (Grano) 79Emy 55102 79Inkopah (RED) 78Sapelo Sweet 77Nun 1002 77Nun 1003 74Miss Megan 73Sweet Uno 70Candy Ann 69Grnx. Yellow PRR 69Red Coach (RED) 67Sweet Harvest 65Ringo 63SV2657NK 61DP Sweet 1407 61Savannah Sweet 60Candy Kim (Grano) 58Sweet Treat 55Golden Boy 47Isabella 43* Note: Indicates the (Graded weight/Field Weight) X 100 = %
Gradeout. A variety with 75% grade out, would have discarded 25% of field weight in the grading process.
Table 4. Percent colossal bulbs of total marketable weight.Variety Colossal BulbsE61S.U6253 20.7%DP Sweet 1407 18.5%Sweet Treat 14.2%Sweet Harvest 11.0%Ringo 10.8%Sweet Agent 8.9%Goldenboy 7.9%Isabella 7.4%Candy Ann 6.6%Candy Kim 4.9%Nun 1002 4.7%Nun 1003 4.6%Sweet Caroline 4.3%Mr. Buck 2.6%Emy 55102 2.5%Miss Megan 2.5%XON-109Y 2.1%Mata Hari 2.0%Goldeneye 1.9%Nun 1008 1.8%Savannah Sweet 1.7%Nun 1006 1.6%Pirate 1.5%SV2657NK 1.2%Red Coach 1.2%J3008 1.1%Sapelo Sweet 1.1%Granx. Yellow PRR 0.8%Red Hunter 0.7%Inkopah 0.7%Caramelo 0.6%11 26 0.5%Emy 55455 0.4%Century 0.3%Sweet Jasper 0.2%Sweet Uno 0.0%Emy 55164 0.0%

UGA Extension Annual Publication 114 • 2014 University of Georgia Vidalia Onion Extension and Research Report 9
Table 5. Percent jumbo bulbs of total marketable weight.Variety Jumbo BulbsCandy Kim 88.1%Pirate 86.4%Goldenboy 85.8%Savannah Sweet 85.7%Nun 1008 85.6%Mata Hari 85.4%J3008 84.6%Nun 1002 84.5%Nun 1006 82.8%XON-109Y 82.3%Sweet Agent 81.9%Isabella 81.5%Goldeneye 81.1%Nun 1003 80.2%Granx. Yellow PRR 79.6%Sweet Treat 79.3%Sweet Caroline 78.9%Ringo 77.7%Century 77.5%DP Sweet 1407 77.3%Sapelo Sweet 76.6%Emy 55102 76.3%SV2657NK 76.3%Red Hunter 76.3%Caramelo 76.0%Miss Megan 76.0%Sweet Uno 75.9%Emy 55455 75.3%Mr. Buck 75.1%Sweet Harvest 74.5%Red Coach 74.5%Sweet Jasper 74.0%Candy Ann 72.5%Inkopah 70.0%11 26 69.5%Emy 55164 64.2%E61S.U6253 64.0%
Table 6. Percent medium bulbs of total marketable weight.Variety Medium BulbsEmy 55164 35.8%11 26 30.0%Inkopah 29.4%Sweet Jasper 25.8%Red Coach 24.4%Emy 55455 24.3%Sweet Uno 24.1%Caramelo 23.5%Red Hunter 23.1%SV2657NK 22.4%Sapelo Sweet 22.3%Mr. Buck 22.3%Century 22.1%Miss Megan 21.6%Emy 55102 21.1%Candy Ann 20.9%Granx. Yellow PRR 19.6%Goldeneye 17.0%Sweet Caroline 16.8%Nun 1006 15.6%XON-109Y 15.6%E61S.U6253 15.3%Nun 1003 15.2%Sweet Harvest 14.5%J3008 14.3%Savannah Sweet 12.7%Nun 1008 12.6%Mata Hari 12.5%Pirate 12.1%Ringo 11.5%Isabella 11.1%Nun 1002 10.8%Sweet Agent 9.2%Candy Kim 7.1%Sweet Treat 6.5%Goldenboy 6.3%DP Sweet 1407 4.2%

UGA Extension Annual Publication 114 • 2014 University of Georgia Vidalia Onion Extension and Research Report10
Table 7. Percent loss (disease/decay) during 16-20 weeks in controlled atmosphere storage.Cultivar Loss during storage (%)Nun 1002 68.5 aIsabella 66.9 aGolden Boy 63.2 abRingo 61.9 abCandy Kim 58.7 abcNun 1008 58.7 abcNun 1003 56.0 abcdSapelo Sweet 54.1 abcdSweet Agent 53.7 abcdeCandy Ann 52.8 abcdeXON-109Y 50.2 abcdefDP 1407 50.0 abcdefgInkopah 49.2 abcdefgh11-26 48.0 abcdefghSweet Treat 46.8 abcdefghiSweet Harvest 46.7 abcdefghiMata Hari 46.6 abcdefghiSweet Jasper 42.5 bcdefghijEmy 55102 36.7 cdefghijkEmy 55455 35.6 defghijkMr. Buck 34.6 defghijkSV2657NK 34.0 defghijkSweet Uno 31.5 efghijkSweet Caroline 29.5 fghijkCaramelo 29.5 fghijkCentury 28.4 fghijkGranex Yellow PRR 28.3 fghijkEmy 55164 27.7 ghijkE61S.U6253 27.3 hijkNun 1006 24.8 ijkPirate 24.1 jkMiss Megan 23.0 jkRed Coach 21.7 jkSavannah Sweet 20.1 kJ3008 17.2 kGoldeneye 16.9 kRed Hunter 16.2 k* Letters that are the same between varieties indicate that those varieties are not significantly
different according to Fisher’s LSD (P ≤ 0.05).
1 Vidalia Onion Area Agent; 2 University of Georgia Department of Horticulture; 3 University of Georgia Department of Plant Pathology; 4
Toombs County, ANR Agent; 5 Tattnall County, ANR Agent; 6 Candler County, ANR Agent; 7 Wheeler County, ANR Agent; 8 Montgomery and Treutlen Counties, ANR Agent; 9 Vidalia Onion and Vegetable Research Center

UGA Extension Annual Publication 114 • 2014 University of Georgia Vidalia Onion Extension and Research Report 11
Impact of Fertilization Program on Yield and Quality of Vidalia Onions
Timothy Coolong1 and Cliff Riner2
IntroductionFertility and production practices have been widely
studied in onion. However, the majority of studies have been conducted in isolation (only looking at a single or limited number factors) over a limited (one or two seasons) time period with a little or no genetic variation (single variety). For example previous field studies suggest that excessive nitrogen nutrition may contribute to poor storage life; while greenhouse-based trials have shown that high nitrogen levels can contribute to greater levels of methyl thiosulfinate precursors. However, no studies have been conducted evaluating both quality attributes simultaneously in field-grown crops. The lack of a systems-based evaluation makes it difficult for growers to put a value on relative risk associated with fertility and related production practices.
The objectives of this trial are to evaluate five fertilizer programs that are used by growers in some manner over five seasons. The results presented are for season one of production.
Materials and MethodOnion, ‘Golden Eye,’ and ‘Sapelo Sweet’ were
transplanted November 21, 2013. Five fertilizer programs with varying amounts of nitrogen (N), sulfur (S), and calcium (Ca) were utilized (Table 1). Potassium and phosphorous were balanced with potassium chloride and mono or diammonium
phosphate, respectively. Calcium was supplied with calcium chloride and calcium nitrate. Onions were harvested on May 9, 2014. Bulbs were cured and graded according to USDA standards. Ten-bulb subsamples were used for flavor analysis.
Enzymatically produced pyruvic acid (pungency) was measured using the method of Boyhan et al. (1999), while lachrymatory factor was measured using the method of Schmidt et al. (1996). Sugars were measured using HPLC.
Results and DiscussionThere were significant variety by treatment
interactions for total marketable, colossal, and medium bulb size yields as well as percentage of cull bulbs. Yields of jumbo bulbs were affected only by variety (Figures 1-4). There were no significant interactions present for onion flavor quality characteristics, although fertilizer treatment and variety affected lachrymatory factor and pungency levels (Table 2). Methyl thiosulfinate concentrations were not affected.
Table 1. Nutrient amounts supplied to onions during the 2014 growing season.
Treatment
Lb/acrePreplant Growth Total Season
N S Ca N S Ca N S CaControlz 50 60 - 100 - 110 150 60 110High N-S 100 120 - 120 - 130 220 120 130Low N-S 25 35 - 70 - 72 95 35 72High N (late) 50 60 - 190 - 185 220 60 185High Ca 25 35 - 140 - 390 150 60 390z Control treatment is based on University of Georgia recommended rates of N and S fertility.

UGA Extension Annual Publication 114 • 2014 University of Georgia Vidalia Onion Extension and Research Report12
Figure 1.
Figure 2.

UGA Extension Annual Publication 114 • 2014 University of Georgia Vidalia Onion Extension and Research Report 13
Figure 3.
Figure 4.

UGA Extension Annual Publication 114 • 2014 University of Georgia Vidalia Onion Extension and Research Report14
Table 2. Flavor quality for ‘Golden Eye’ and ‘Sapelo Sweet’ onion grown under five fertilizer treatments.
Treatment
Lachrymatory Factor Methyl Thiosulfinates Pungency
µmol/ml juice µmole/ g FWz pyruvic acid
High Ca 2.95ay 0.00047a 0.99abLow N-S 2.92a 0.00051a 1.24aControl 2.57ab 0.00043a 0.74bHigh N-S 1.92bc 0.00049a 0.60bHigh N 1.80c 0.00046a 0.74b
VarietyGolden Eye 2.68a 0.00042a 0.80aSapelo Sweet 2.18b 0.00052a 0.92az FW = fresh weighty Numbers within the same column followed by the same letter are not significantly different at P < 0.05 according to Fisher’s least
significant difference test.
1 Extension Vegetable Specialist, 2360 Rainwater Road, University of Georgia, Tifton, GA 31793; 2 Area Agent for Vidalia Onions, Vidalia Onion and Vegetable Research Farm, Lyons, GA 30436

UGA Extension Annual Publication 114 • 2014 University of Georgia Vidalia Onion Extension and Research Report 15
Potassium Fertilization Effects on Sweet Onion Yield
Juan Carlos Díaz-Pérez, Anthony Bateman, Guna Gunawati, and Jesús BautistaDepartment of Horticulture, University of Georgia, 2360 Rainwater Road, Tifton, GA, 31793
IntroductionAfter nitrogen (N), potassium (K) is the nutrient
required in largest amounts by plants (Marschner, 2012). Potassium deficient plants show reduced growth and limited photosynthesis and, under severe deficiency, can present chlorosis. Fruits and tubers have a high K requirement and may develop physiological disorders when they are deficient in K. In a study in Vidalia, GA, potassium fertilizer rates from 0 to 177 kg/ha K2O were applied to sweet onion; yields showed a quadratic response with the highest yield at 84 k/ha K2O (Boyhan et al., 2007).
Materials and MethodExperiments were conducted at the Horticulture
Farm, Tifton Campus, University of Georgia, in the winter of 2013 and 2014. Soil was a sandy-loam soil with a pH of about 6.5. Plants were grown on raised beds. Each bed had four rows 23-cm apart, with a plant spacing of 15 cm. Beds were covered with black plastic film mulch and there were two lines of drip tape per bed, each drip tape being located midway between rows in alternate rows. The drip tape (Ro-Drip, Roberts Irrigation Products Inc., San Marcos, Calif. [2000-01 and 2001-02]) had 10 cm emitter spacing, 0.50 L•h-
1 emitter flow at 5631 kg•m-2 pressure, 0.2 mm wall thickness, and was buried 3 cm deep. Before planting, all treatments received 672 kg/ha of 10-10-10 fertilizer. Onion ‘Yellow Granex PRR’ plants were transplanted on December 12, 2012 and 2013.
Starting eight weeks after transplanting, N (as 28-0-0) and K (as 0-0-25 [potassium thiosulfate]) were applied through the drip tape. Total N applied was 169 kg/ha. Five total K fertilizer levels (67, 134, 202, 269, and 336 kg/ha K2O) were evaluated in a randomized complete block design. Experimental plots consisted of a 6.1 m long bed (1.8 m centers) section.
Incidence of bolting (flower stems), sour skin (bacterial disease), and double-bulbs were determined as a percentage of plants with the symptoms. Plants were harvested when 20 percent of the necks had collapsed (tops down). Onions were hand-harvested and roots and tops were clipped; bulbs were left in the field for 48 hours for curing. After curing, bulbs were graded by size and appearance as marketable or cull
(USDA, 1995), counted, and weighed. After grading, a subsample of 10 marketable bulbs per replication was used for determination of soluble solids content (SSC) and pungency. Ten wedges from each bulb group were juiced in a pneumatic press. Several drops of the juice were applied to a hand-held refractometer) to measure SSC. Pyruvic acid is used routinely to measure onion flavor intensity (Lancaster and Boland, 1990). Data were analyzed using the Mixed Procedure of SAS (SAS Institute, ver. 9.4).
Results and DiscussionMarketable and total number and weight of onion
bulbs were not affected by K rate (Table 1). This indicates that a rate of 67 kg/ha K2O was sufficient to cover the K needs of onion plants. Thus, rates higher than 84 kg/ha K2O, as recommended by Boyhan et al. (2007), are likely unnecessary. Incidences of bolting (mean = 5 percent), sour skin (mean = 11 percent) and double-bulbs (mean = 1 percent) were also unaffected by K levels.
Bulb dry matter content, soluble solids content, and pungency were positively correlated among them, but they did not show linear relationships with K rate (data not shown). Bulbs fertilized with 240 kg/ha K2O had greatest values of bulb dry matter content, soluble solids content, and pungency.
Literature CitedBoyhan, G. E., Torrance, R. L., & Hill, C. R. (2007).
Effects of nitrogen, phosphorus, and potassium rates and fertilizer sources on yield and leaf nutrient status of short-day onions. HortScience, 42(3), 653-660.
Lancaster, J. E., & Boland, M. J., (1990). Flavor biochemistry. In: J. L. Brewster and H. D. Rabinowitch (Eds.), Onions and Allied Crops. (pp. 33-72). Boca Raton, FL: CRC Press.
Marschner, P. (Ed.). (2012). Mineral Nutrition of Higher Plants (3rd ed.). San Diego, CA: Academic Press.
U.S. Department of Agriculture, Agricultural Marketing Service. (1995). U.S. standards for grades of Bermuda-granex-grano type onions. Washington, D.C.:U.S. Department of Agriculture.

UGA Extension Annual Publication 114 • 2014 University of Georgia Vidalia Onion Extension and Research Report16
Table 1. Sweet onion yields as influenced by potassium (K2O) fertilization rate. Tifton, GA, winter of 2013 and 2014.
K2O (kg/ha)Marketable Total Bulb Weight
(g)1000/ha t/ha 1000/ha t/ha67 104 29 153 39 281134 97 28 152 42 295202 102 31 149 42 310269 97 29 154 42 304336 92 28 147 40 301P 0.342 0.658 0.324 0.583 0.491

UGA Extension Annual Publication 114 • 2014 University of Georgia Vidalia Onion Extension and Research Report 17
Impact of Poly-coated Urea Products for the Production of Vidalia Onions
Timothy CoolongDepartment of Horticulture, University of Georgia, 2360 Rainwater Road, Tifton, GA, 31793
IntroductionThere has been an increased interest in the use of
controlled release fertilizers in vegetable crops. While the uses of controlled release fertilizers, particularly poly-coated urea (PCU) products, have increased on agronomic crops, vegetable growers have been reluctant to use this technology. Some of the reasons why they have not been used are perceptions that they are too costly, release patterns are uneven, and that they may not provide adequate levels of nutrients during periods of rapid growth. To determine the suitability of two commercially available PCU products (Duration 120 and ESN) (Agrium Inc.) for Vidalia onion production, a trial was conducted during the 2014 growing season.
Materials and MethodThe varieties ‘Golden Eye’ and ‘Sapelo Sweet’
were used for this trial. Fertilizer treatments were applied November 20, 2013, and transplanting took place on November 21, 2013. Fertilizer treatments were incorporated using a tiller/bedder prior to pegging. Fertilizer treatments are presented in Table 1. Plant in-row spacing was 4 inches. Plants were managed according to standard practices with the exception of fertilizer treatments. Buried mesh bags containing both ESN and Duration PCU products were placed in plots at a depth of 6 inches on November 21, 2013, and excavated throughout the growing season to determine N release patterns.
Plants were harvested on May 12, 2014, and cured at 90°F for approximately two days. Bulbs were graded according to USDA standards for Bermuda-Granex-Grano Type onions (Colossal: >3.75 inches, Jumbo: 3-3.75 inches, Medium 2-3.25 inches, [small were unmarketable and culled]).
Mesh bags containing both Duration and ESN products were buried at planting and excavated throughout the growing season to determine nitrogen release rates.
Results and DiscussionOnions receiving all N preplant via PCU grew well
initially but appeared slightly yellow near maturity compared to other treatments. All other treatments, including 130 lb N PCU preplant, appeared dark green throughout growth. There was a significant freeze event in early January, 2014; however, all onions survived and suffered relatively little damage compared to other plantings in the area. ‘Sapelo Sweet’ bulbs appeared more vigorous than ‘Golden Eye’ throughout development and in general yielded more colossal bulbs.
Nitrogen release from PCU fertilizer was determined using the bag method. Evaluation dates were: November 21 (day 0), December 23, January 10, January 23, February 7, February 28, and March 18. Initial release from ESN was highest, with approximately 55-58 percent N released within the first month of growth. Release then slowed particularly
Table 1. Fertilizer treatments used in this trial.Fertilizer Treatment Nutrients Applied (lb/acre)Control (UGA Recommendation)
500 lbs 10-10-10 preplant + 100 lb diammonium phosphate in Jan. + 580 lb calcium nitrate (90 lb N) in Feb.
Standard Rate ‘ESN’ 360 lb ESN (160 lb N) preplant + 0-0-60 & 0-18-0
Standard Rate ‘Duration’ 360 lb Duration (160 lb N) preplant + 0-0-60 & 0-18-0
Low Rate ‘ESN’ 280 lb ESN (130 lb N) preplant + 0-0-60 & 0-18-0 + 190 lb calcium nitrate (30 lb N) in Feb.
Low Rate ‘Duration’ 280 lb Duration (130 lb N) preplant + 0-0-60 & 0-18-0 + 190 lb calcium nitrate (30 lb N) in Feb.
Complete at planting + ESN 500 lb 10-10-10 preplant + 190 lb calcium nitrate (30 lb N) in Feb. + 175 lb ESN (80 lb N) in Feb.

UGA Extension Annual Publication 114 • 2014 University of Georgia Vidalia Onion Extension and Research Report18
between the January 10 and January 23 sampling dates. During this time period year, there was a significant cold front that moved through the area. The Duration product had a more linear release pattern with a much slower initial release than the ESN. The final sample was pulled at 117 days post application. At this time the ESN product released approximately 90 percent of N, while the Duration product had released approximately 85 percent of N.
Total N levels were recorded during rapid growth (late February) and at harvest. As might be expected, N levels were lowest in bulbs receiving all N preplant as ESN, given the relatively rapid release after planting. Bulbs grown in the control plots had the highest levels of N at harvest, though they were not significantly different than the application of 10-10-10 preplant, followed by an application of ESN later in the season. Bulbs treated with Duration had N levels that were in between other treatments. This would be expected given the release curve of Duration (Figure 1). There was more N available later in the season with Duration compared to ESN, though not as much as when using completely soluble fertilizers (control) or a combination of granular fertilizer and a late application of ESN.
Total marketable yields were higher in ‘Sapelo Sweet’ than ‘Golden Eye’ due to the higher percentage of colossal bulbs produced by ‘Sapelo Sweet’ (Table 3). For ‘Sapelo Sweet,’ applications of Duration and ESN
at planting (130 lb N/acre) followed by an application of calcium nitrate later in the season yielded no differently than control or treatments receiving 10-10-10 at planting followed by a late application of ESN and calcium nitrate. In Golden Eye onion, the control treatments and those receiving 10-10-10 at planting followed by a late application of ESN yielded significantly more than most other treatments. The application of ESN at 130 lb N/acre preplant followed by a late season application of calcium nitrate was not significantly different than the control treatment.
These results suggest that PCU fertilizers can be used in the production of Vidalia onion, but they should be partnered with a soluble N-source or applications should be split over the season. Based on yield and release characteristics, an application of a complete granular fertilizer such as 10-10-10 at planting followed by a mid-season application of ESN should perform well. Because the release curve of the ESN is greater in the first few weeks, it is likely better suited for a late season application. Alternatively, an application of ESN or Duration at planting followed by a late season application of a soluble fertilizer (in this case calcium nitrate) also performed as well as the control when used in ‘Sapelo Sweet’ onion. Using this information, a recommendation may be to apply a PCU at planting combined with a low-N complete fertilizer to supply P and K, followed by a single late application of a soluble (calcium nitrate) fertilizer.
Figure 1.
We would like to thank Agrium Fertilizer Inc. for funding this research.

UGA Extension Annual Publication 114 • 2014 University of Georgia Vidalia Onion Extension and Research Report 19
Table 2. Total nitrogen levels in leaf and bulb tissue in ‘Sapelo Sweet’ and ‘Golden Eye’ onion.Treatment % Nitrogen
Sapelo Sweet Leafz BulbControl 3.59ay 1.62aComplete at planting + ESN 3.30a 1.59abStandard Rate Duration 3.25ab 1.44bLow Rate Duration 3.17ab 1.47bStandard Rate ESN 3.00b 1.26cLow Rate ESN 2.76b 1.45b
Golden Eye Leaf BulbControl 3.68a 1.81aComplete at planting + ESN 3.07b 1.67abStandard Rate Duration 3.27ab 1.45cdLow Rate Duration 3.46ab 1.62bcStandard Rate ESN 3.33ab 1.30dLow Rate ESN 3.13b 1.54bcz Leaf samples taken on 2/28. Bulb samples taken at harvest.y Treatments followed by the same letter within a given variety are not significantly different according to Duncan’s multiple range
test P < 0.05.
Table 3. Yield data for ‘Sapelo Sweet’ and ‘Golden Eye’ onion.
Treatment
40 lb units/acre %Total
Marketable Colossal Jumbo Medium CullSapelo SweetComplete at planting + ESN 1367 az 985 a 328 a 53 a 3.1 ab
Control 1272 ab 842 ab 375 a 55 a 5.8 aLow Rate Duration 1245 ab 824 ab 359 a 63 a 1.8 bLow Rate ESN 1230 ab 770 ab 420 a 40 a 3.7 abStandard Rate Duration 1100 bc 744 ab 302 a 54 a 4.4 abStandard Rate ESN 1044 c 595 b 385 a 64 a 3 ab
Golden EyeComplete at planting + ESN 1142 a 575 a 488 a 79 bc 3.7 aControl 1089 ab 555 ab 466 a 69 c 7.7 aLow Rate ESN 1004 bc 416 bc 509 a 79 bc 2.9 aLow Rate Duration 909 c 380 c 421 a 108 ab 2.8 aStandard Rate Duration 951 c 413 bc 418 a 120 a 2.7 aStandard Rate ESN 946 c 428 abc 452 a 66 c 2.9 az Treatments followed by the same letter within a given variety are not significantly different according to Duncan’s multiple range test P < 0.05.

UGA Extension Annual Publication 114 • 2014 University of Georgia Vidalia Onion Extension and Research Report20
Evaluation of Ignite S2 Transplant Dip On Vidalia Onion Yield
Chris Tyson1, Cliff Riner2, and Timothy Coolong3
IntroductionIgnite S2 is a soil and starter fertilizer product
labeled for use on many crops, including Vidalia onions. It has a guaranteed analysis of 1–0–1 and also contains 0.10 percent Boron, 0.02 percent Cobalt, 0.30 percent Manganese, 0.04 percent Molybdenum, and 0.40 percent Zinc by volume. It has been marketed for use on Vidalia onions as a transplant dip just prior to being set in the soil. The purpose of this investigation is to evaluate yield of onions treated with and without the Ignite S2 transplant dip treatment.
Materials and MethodsThis trial was conducted at the University of
Georgia Vidalia Onion and Vegetable Research Center in Lyons, Georgia. Onion seedlings, ‘Savannah Sweet’ were transplanted on November 19, 2013 in a single onion bed consisting of eight plots. Plots were 25 feet long and had a total area of 150 square feet. There were 10-foot non-planted buffers between each plot. Four of the eight plots were dipped in an Ignite S2 solution prior to being transplanted. The solution consisted of a 50/50 mixture of the Ignite S2 product and water. The remaining four plots were not given any transplant dip. The onions in the trial were then grown according to UGA Extension production guidelines, including fertility, irrigation, and pesticide recommendations. The plots were harvested on May 7, 2014. Field weights were taken for each plot, and each plot was also graded. Weights were recorded for Colossal, Jumbo, and Medium grades. A total marketable weight was also given for each plot.
Results and DiscussionData was compiled for the untreated and treated
plots, and converted to a per acre yield basis. There were obvious numerical differences in comparing the treated plots to the untreated plots. Statistical interpretation was run on the data to compare the two treatments. There were some statistical differences between the treated and untreated plots (Table 1). Results from this trial indicate there may be some yield benefit to using a starter fertilizer dip treatment. More research needs to be done with this product and others over multiple years to effectively evaluate yield benefits.
Table 1. Yield Data from Ignite S2 Trial.Treatment Fresh Colossal Jumbo Medium Total Marketable
Yield (40 lb units/acre)Treated 1270 a 23 a 784 a 101 a 908 aUntreated 1134 a 16 a 642 b 124 a 783 bP < 0.1 NS NS Sig NS SigP < 0.05 NS NS Sig NS NSNS = Not significant.Sig = Significant at either P < 0.1 or P < 0.05, according to Fisher’s least significant difference test.
1 Tattnall County, ANR Agent, University of Georgia Extension, Reidsville, Georgia 30453; 2 Vidalia Onion Area Agent, University of Georgia Extension, Lyons, Georgia 30436; 3 Vegetable Extension Specialist, University of Georgia, Tifton, Georgia 31793

UGA Extension Annual Publication 114 • 2014 University of Georgia Vidalia Onion Extension and Research Report 21
Effect of Sulfur Dioxide on the Efficacy of Controlled Atmosphere (CA) and Ozone Storage for the Postharvest Control of Botrytis
aclada in Vidalia Sweet Onions
Anthony Bateman1 and Juan Carlos Díaz-Pérez2
IntroductionGeorgia growers store Vidalia onions in controlled-
atmosphere (CA) or ozone treated storage facilities for long-term storage (two months or longer). However, the storage related disorder Botrytis neck rot (BNR) (Botrytis aclada) may cause significant storage losses. Previous trials using sulfur dioxide (SO2) as a postharvest fumigant to control Botrytis aclada showed positive results. Nonetheless, SO2 was not evaluated then as a pretreatment for CA or ozone storage. The objectives of this study were to evaluate SO2 as a pretreatment to CA and ozone storage to improve control of Botrytis aclada.
Materials and MethodOnions ‘WI-129’ (harvested on April 24, 2013)
and ‘Sweet Vidalia’ (harvested on May 1, 2013) were obtained from the Vidalia Onion and Vegetable Research Farm in Lyons, Georgia, and transported to the to the University of Georgia Black Shank Research Farm for curing.
Bulbs were put on separate peanut wagons for field (48 hours, open air, in direct sun) and forced air heat (95°F for 48 hours) curing. After curing, bulbs were taken to the Vidalia Onion Research Laboratory for grading and bagging.
Onion bulbs were fumigated with SO2 (0 ppm, 1,000 ppm, or 2,000 ppm for one hour). After SO2 treatment, bulbs were placed in CA (3 percent O2, 5 percent CO2, and 92 percent N2 at 34°F and 70 percent RH) or ozone-treated rooms (1 to 3 ppm/hour at 34°F and 70 percent RH) for two or four month storage.
Immediately after storage (day one) and after a 14-day shelf life period (70°F, ~70 percent RH), bulbs were graded, weighed and evaluated for incidence of BNR and other diseases (particularly sour skin, caused by Burkholderia cepacia), as well as storage disorders.
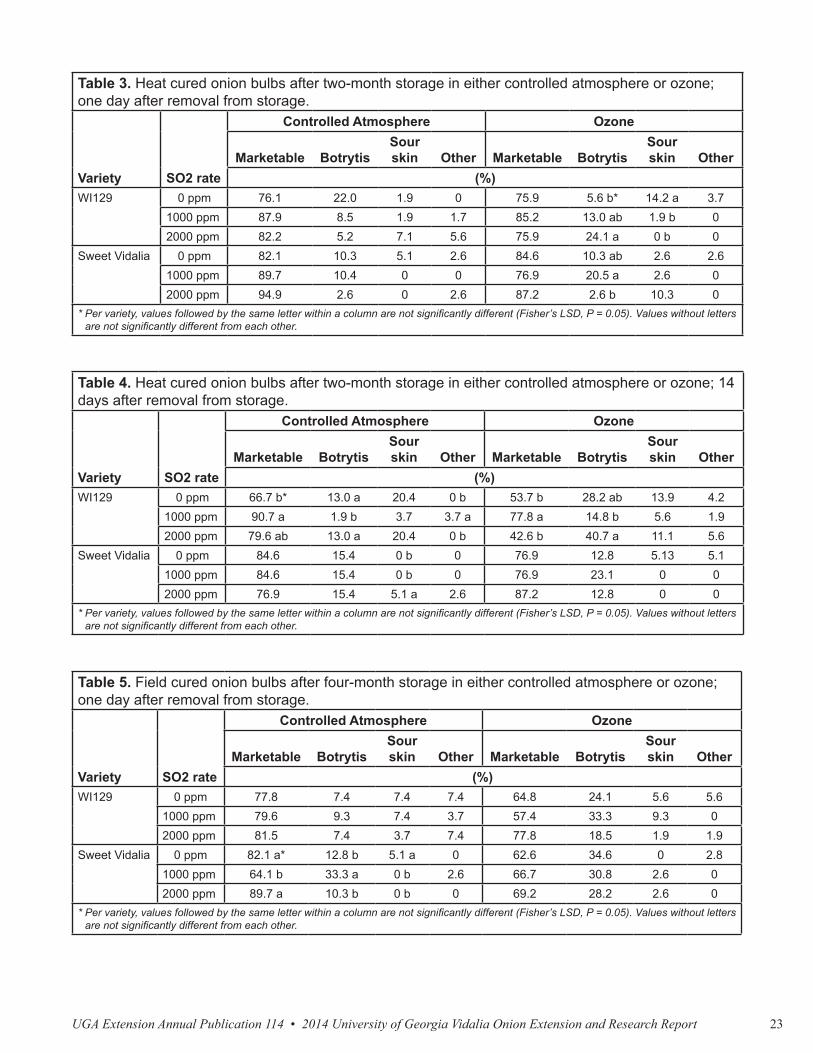
Results and Discussion After two months of storage, the variety ‘Sweet
Vidalia’ showed little benefit with addition of SO2. There were no significant improvements to field cured bulbs stored in CA or ozone (Tables 1-2). Heat
cured bulbs stored in CA showed an increase in sour skin during the shelf life portion of the study (Table 4). However, after four months of storage (day one), sour skin reduction was significant for field cured bulbs stored in CA (Table 5), but the 1,000 ppm rate had a significant decrease in marketable bulbs and an increase in BNR. While heat cured bulbs treated with 1,000 ppm of SO2 had a significant increase in sour skin in CA storage (Table 7), there was a significant increase in marketable bulbs at the 2,000 ppm SO2 with ozone in the shelf life study (Table 8).
Overall, the effects of the SO2 treatments were more beneficial to the early variety ‘WI129,’ particularly the heat-cured samples. Field cured samples had a significant reduction of BNR in ozone storage at 1,000 ppm SO2 after two months in storage (Table 1), resulting in a significant increase in the percentage of marketable bulbs immediately after storage as well as after 14 days in the shelf life study. While the percent marketable bulbs were not affected by the 2,000 ppm SO2 rate compared to the control, this treatment results in a significant reduction in the incidence of BNR (Table 2).
While ‘WI129’ heat cured and ozone-stored bulbs had less sour skin at both SO2 rates (Table 3), the 2,000 ppm SO2 rate had significantly more BNR. In the two month shelf life study, the 1,000 ppm SO2 treatment significantly affected heat-cured bulbs by increasing marketability and decreasing BNR in both CA and ozone storage (Table 4). For ‘WI129,’ there were no significant benefits of the SO2 treatments at the four month removal for field-cured bulbs stored in CA or ozone (Table 5 and 6).
The greatest benefit of SO2 seemed to be for heat cured bulbs at the four month removal. CA stored bulbs had significant increases in marketability and decreases in BNR at the 2,000 ppm rate for both the day one and 14 day (shelf) removal (Table 7 and 8). Ozone stored bulbs had significantly less BNR in the shelf life study (Table 8).
Also of note, after one month, CA changed from 3 percent O2 and 5 percent CO2 to 5 percent O2 and 5 percent CO2 due to equipment failure.

UGA Extension Annual Publication 114 • 2014 University of Georgia Vidalia Onion Extension and Research Report22
Utilizing SO2 as a pretreatment to CA and ozone storage for improved control of Botrytis aclada showed promising results. However, rates of SO2 use and application duration need additional evaluation to determine the best rate for short and long-term storage. Further work is also necessary on SO2 effects on early and standard onion varieties.
Literature CitedMacLean, D., Bateman, A., Torrance, R., Hill, R., &
Thigpen, D. (2009). Sulfur dioxide and ozone treatments for the postharvest control of storage disorders of Vidalia sweet onion. In Dan MacLean (Ed), Georgia onion research-Extension report 2009 (Cooperative Research-Extension Publication No. 3-2009) (pp. 50-52). Retrieved from http://www.caes.uga.edu/commodities/fruits/vidalia/publications.html.
MacLean, D., Bateman, A., Bansal, M., Torrance, R., Hill, R., and Thigpen, D. (2010). Sulfur dioxide and ozone treatments for the postharvest control of onion Botrytis. In Dan MacLean (Ed), Georgia onion research-Extension report 2010 (Cooperative Research-Extension Publication No. 3-2010) (pp. 66-70). Retrieved from http://www.caes.uga.edu/commodities/fruits/vidalia/publications.html.
Table 1. Field cured onion bulbs after two-month storage in either controlled atmosphere or ozone; one day after removal from storage.
Variety SO2 rate
Controlled Atmosphere Ozone
Marketable BotrytisSour skin Other Marketable Botrytis
Sour skin Other
(%)WI129 0 ppm 87.0 11.1 0 1.9 74.1 18.5 a* 1.9 5.6
1000 ppm 94.4 5.6 0 0 80.1 5.5 b 3.5 10.92000 ppm 96.3 1.9 0 1.9 74.1 18.5 a 3.7 3.7
Sweet Vidalia 0 ppm 97.4 2.6 0 0 92.3 7.7 0 01000 ppm 76.9 18.0 0 2.6 84.6 15.4 0 02000 ppm 89.7 7.7 2.6 0 79.5 18.0 2.6 0
* Per variety, values followed by the same letter within a column are not significantly different (Fisher’s LSD, P = 0.05). Values without letters are not significantly different from each other.
Table 2. Field cured onion bulbs after two-month storage in either controlled atmosphere or ozone; 14 days after removal from storage.
Variety
SO2 rate
Controlled Atmosphere Ozone
Marketable BotrytisSour skin Other Marketable Botrytis
Sour skin Other
(%)WI129 0 ppm 79.6 13.0 7.4 0 51.9 b* 33.3 a 13.0 1.9
1000 ppm 83.3 13.0 3.7 0 75.9 a 18.5 ab 5.6 02000 ppm 87.1 7.4 5.6 0 74.1 ab 13.0 b 11.1 1.9
Sweet Vidalia 0 ppm 84.6 10.3 2.6 2.6 48.7 43.6 5.1 2.61000 ppm 84.6 15.4 0 0 71.8 25.6 0 2.62000 ppm 89.7 2.6 5.1 2.6 79.5 15.4 2.6 2.6
* Per variety, values followed by the same letter within a column are not significantly different (Fisher’s LSD, P = 0.05). Values without letters are not significantly different from each other.
UGA Extension Annual Publication 114 • 2014 University of Georgia Vidalia Onion Extension and Research Report 23
Table 3. Heat cured onion bulbs after two-month storage in either controlled atmosphere or ozone; one day after removal from storage.
Variety
SO2 rate
Controlled Atmosphere Ozone
Marketable BotrytisSour skin Other Marketable Botrytis
Sour skin Other
(%)WI129 0 ppm 76.1 22.0 1.9 0 75.9 5.6 b* 14.2 a 3.7
1000 ppm 87.9 8.5 1.9 1.7 85.2 13.0 ab 1.9 b 02000 ppm 82.2 5.2 7.1 5.6 75.9 24.1 a 0 b 0
Sweet Vidalia 0 ppm 82.1 10.3 5.1 2.6 84.6 10.3 ab 2.6 2.61000 ppm 89.7 10.4 0 0 76.9 20.5 a 2.6 02000 ppm 94.9 2.6 0 2.6 87.2 2.6 b 10.3 0
* Per variety, values followed by the same letter within a column are not significantly different (Fisher’s LSD, P = 0.05). Values without letters are not significantly different from each other.
Table 4. Heat cured onion bulbs after two-month storage in either controlled atmosphere or ozone; 14 days after removal from storage.
Variety SO2 rate
Controlled Atmosphere Ozone
Marketable BotrytisSour skin Other Marketable Botrytis
Sour skin Other
(%)WI129 0 ppm 66.7 b* 13.0 a 20.4 0 b 53.7 b 28.2 ab 13.9 4.2
1000 ppm 90.7 a 1.9 b 3.7 3.7 a 77.8 a 14.8 b 5.6 1.92000 ppm 79.6 ab 13.0 a 20.4 0 b 42.6 b 40.7 a 11.1 5.6
Sweet Vidalia 0 ppm 84.6 15.4 0 b 0 76.9 12.8 5.13 5.11000 ppm 84.6 15.4 0 b 0 76.9 23.1 0 02000 ppm 76.9 15.4 5.1 a 2.6 87.2 12.8 0 0
* Per variety, values followed by the same letter within a column are not significantly different (Fisher’s LSD, P = 0.05). Values without letters are not significantly different from each other.
Table 5. Field cured onion bulbs after four-month storage in either controlled atmosphere or ozone; one day after removal from storage.
Variety
SO2 rate
Controlled Atmosphere Ozone
Marketable BotrytisSour skin Other Marketable Botrytis
Sour skin Other
(%)WI129 0 ppm 77.8 7.4 7.4 7.4 64.8 24.1 5.6 5.6
1000 ppm 79.6 9.3 7.4 3.7 57.4 33.3 9.3 02000 ppm 81.5 7.4 3.7 7.4 77.8 18.5 1.9 1.9
Sweet Vidalia 0 ppm 82.1 a* 12.8 b 5.1 a 0 62.6 34.6 0 2.81000 ppm 64.1 b 33.3 a 0 b 2.6 66.7 30.8 2.6 02000 ppm 89.7 a 10.3 b 0 b 0 69.2 28.2 2.6 0
* Per variety, values followed by the same letter within a column are not significantly different (Fisher’s LSD, P = 0.05). Values without letters are not significantly different from each other.

UGA Extension Annual Publication 114 • 2014 University of Georgia Vidalia Onion Extension and Research Report24
Table 6. Field cured onion bulbs after four-month storage in either controlled atmosphere or ozone; 14 days after removal from storage.
Variety
SO2 rate
Controlled Atmosphere Ozone
Marketable BotrytisSour skin Other Marketable Botrytis
Sour skin Other
(%)WI129 0 ppm 72.2 14.8 3.7 9.3 61.1 25.9 7.4 5.6 b*
1000 ppm 61.1 24.1 13.0 1.9 59.3 20.4 9.3 11.1 ab2000 ppm 59.3 22.2 9.3 9.3 70.4 5.6 7.4 16.7 a
Sweet Vidalia 0 ppm 79.5 18.0 2.6 0 53.85 33.3 2.6 10.31000 ppm 59.0 30.8 7.7 2.6 71.79 23.1 0 5.12000 ppm 71.8 18.0 10.3 0 61.54 28.1 2.6 7.7
* Per variety, values followed by the same letter within a column are not significantly different (Fisher’s LSD, P = 0.05). Values without letters are not significantly different from each other.
Table 7. Heat cured onion bulbs after four-month storage in either controlled atmosphere or ozone; one day after removal from storage.
Variety
SO2 rate
Controlled Atmosphere Ozone
Marketable BotrytisSour skin Other Marketable Botrytis
Sour skin Other
(%)WI129 0 ppm 61.1 b* 31.5 a 1.9 5.6 64.8 31.5 3.7 0 b
1000 ppm 79.6 a 14.8 ab 3.7 1.9 59.3 20.4 11.1 9.3 a2000 ppm 81.5 a 7.4 b 3.7 7.4 59.3 31.5 3.7 5.6 ab
Sweet Vidalia 0 ppm 87.2 10.3 0 b 2.6 79.5 18.0 0 2.61000 ppm 84.6 7.7 5.1 a 2.6 87.2 10.3 0 2.62000 ppm 92.3 5.1 0 b 2.6 87.2 0 5.1 7.7
* Per variety, values followed by the same letter within a column are not significantly different (Fisher’s LSD, P = 0.05). Values without letters are not significantly different from each other.
Table 8. Heat cured onion bulbs after four-month storage in either controlled atmosphere or ozone; 14 days after removal from storage.
Variety
SO2 rate
Controlled Atmosphere Ozone
Marketable BotrytisSour skin Other Marketable Botrytis
Sour skin Other
(%)WI129 0 ppm 42.6 b* 33.3 a 13.0 11.1 b 33.3 57.4 a 5.6 3.7 b
1000 ppm 51.1 ab 19.8 ab 9.1 20.1 a 53.7 18.5 b 11.1 16.7 a2000 ppm 68.5 a 9.3 b 18.5 3.7 b 51.9 31.5 b 5.6 11.1 ab
Sweet Vidalia 0 ppm 64.1 23.1 5.1 7.7 46.2 b 35.9 7.7 10.31000 ppm 53.9 41.0 2.6 2.6 59.0 ab 30.8 2.6 7.72000 ppm 76.9 10.3 7.7 5.1 79.5 a 15.4 0 5.1
* Per variety, values followed by the same letter within a column are not significantly different (Fisher’s LSD, P = 0.05). Values without letters are not significantly different from each other.
1 Research Technician and 2Research Horticulturist, UGA Department of Horticulture, 2360 Rainwater Road, Tifton, GA, 31793

UGA Extension Annual Publication 114 • 2014 University of Georgia Vidalia Onion Extension and Research Report 25
Investigation on the Spatio-temporal Spread of the Pseudomonas coronafaciens pv. morceparum
in Onion Seedbeds and Production Fields
Ronald Gitaitis1, Bhabesh Dutta1, David Langston1, Samuel Smith1, Jonathon Van Keith Searcy1, Erin Holliman1, Cliff Riner2, and Jason Edenfield3
Introduction Yellow bud (YB) is an emerging bacterial disease
of onion that has the potential to severely affect Vidalia onion production. Since first being reported in 2007, this disease has been spreading to counties within the Vidalia onion zone (VOZ). Symptoms of YB include intense chlorosis in emerging leaves and severe blight in the older leaves, leading to stand loss, reduced bulb size, and the creation of avenues of entry for secondary, soft rot organisms. The causal organism is a gram-negative bacterium and confirmed as a novel pathovar of Pseudomonas coronafaciens. The proposed name for this organism is P. coronafaciens pv. morceparum (Pcm).
Utilizing the previous grant award from the Vidalia Onion Commission, we surveyed and identified two weed species (Italian ryegrass and curly dock) that can harbor Pcm during the spring and summer months in the Vidalia onion zone. The bacterial strains isolated from the weeds produced YB symptoms when onions were inoculated under greenhouse conditions. We also observed that the bacterium can potentially be seedborne as onion seedlings grown from artificially inoculated seeds developed typical YB symptoms (Dutta et al., 2013, 2014).
As a continued research, we investigated the spatio-temporal spread of Pcm in the onion seedbed and in the production field. In addition, effects of time of sampling and irrigation events on the detection of Pcm as aerosols at two heights 3 feet and 6 feet were investigated. We also evaluated the potential risk of disease spread from curly dock (weed) planted along the edge of the onion field.
Materials and MethodDetermining the spatial and temporal spread of
the YB bacterium in onion seedbeds. Onion seeds (cv. Century) were planted at the Vidalia Onion and Vegetable Research Farm, near Reidsville, Georgia. Onion seedlings at one end of a plot (50 feet) were inoculated three weeks after planting by infiltrating leaves with a bacterial suspension containing 1 ×
108 CFU/ml of Pcm. The source of inoculum was represented as a line source. Plots with seedlings inoculated with PBS served as the negative control. Onion seedlings were monitored for the presence of disease at weekly intervals until eight weeks. In addition, air samples were collected at two different heights—3 feet and 6 feet above inoculated and uninoculated plots at every 10 feet, 20 feet, 30 feet, 40 feet, and 50 feet from a line source. This was done to determine the spread of Pcm as aerosols. The air-samples were also taken at two different time periods of a day, i.e., at 9:00 a.m. and 3:00 p.m. Air samplings were done using an Andersen six-stage viable air sampler, and samples were tested for the bacterium by plating assay. Four replications of treatment were used in a single experiment, and this experiment was done two times (2013 and 2014).
Determining the potential spread of Pcm from inoculated curly dock (weed) along the edge of an onion field to healthy onion plants. Field experiments were conducted at the UGA Vidalia Onion and Vegetable Research Farm, near Reidsville, Georgia. Onion seedlings were transplanted onto raised beds with a length of 50 feet. In this study, curly dock seedlings were planted along the edges of the onion field. After one week of planting, curly dock seedlings were inoculated by spraying with a suspension of Pcm containing 1 × 10⁸ CFU/ml. Onion plots without curly dock were used as control plots. Four replications of treatment were used in a single experiment, and this experiment was done two times (2013 and 2014). Plots were evaluated for the YB symptoms every week until eight weeks.
ResultsDetermining the spatial and temporal spread
of the YB bacterium in onion seedbeds. In our two years of investigations, we observed the spread of Pcm through aerosols to a distance of 20 feet from line source of inoculum to healthy onion seedlings by 7 days post inoculation (dpi) (Table 1). By 14 and 21 dpi, Pcm spread to a distance of 50 feet as aerosols
UGA Extension Annual Publication 114 • 2014 University of Georgia Vidalia Onion Extension and Research Report26
with 10 percent and 40 percent of the samples tested positive for the bacterium, respectively (Table 1). In general, Pcm was detected as aerosols in plots at least two weeks prior to the YB incidence observed on seedlings. YB incidence was not observed in control plots, whereas in treated plots, symptoms appeared in inoculated plants by 7 dpi.
However, by 14 dpi, YB incidence was observed in plots (10 percent incidence) 20 feet away from the line source of inoculum. By 21 dpi, symptomatic onion seedlings (30 percent) were observed at a distance of 50 feet from the line source of inoculum (Table 1).
Once the entire plot was infected with Pcm and YB symptoms appeared at 50 feet from line source of inoculum, effects of sampling time, sampling height, and irrigation events on bacterial detection in aerosols were evaluated. Aerosols were assayed at every 10 feet, 20 feet, 30 feet, 40 feet, and 50 feet from a line source. At the sampling height of 3 feet, higher percentages of the Pcm were detected in aerosols at 9 a.m. than at 3 p.m., whereas at the height of 6 feet, higher percentages of the bacterium was detected at 3 p.m. than at 9 a.m. (Table 2). The mean percentages of Pcm detected at 9 a.m. from heights 3 feet and 6 feet were 2.54×10²
and 1.81×10² CFU/m3, respectively. In addition, after overhead irrigation, percentage of Pcm positive aerosol samples decreased at both heights, 3 feet and 6 feet for both sampling periods (Table 2).
Determining the potential spread of Pcm from inoculated curly dock (weed) along the edge of an onion field to healthy onion plants. YB symptoms were not observed from onion plots where curly dock plants were inoculated with sterile water. In contrast, onion plots where curly dock was inoculated with Pcm, YB symptoms were observed at 10 feet (15 percent) from the inoculum source by 14 dpi. By 21 and 28 dpi, YB symptoms were observed at 30 feet (52 percent) and 50 feet (64.5 percent), respectively, from the point source of inoculum (curly dock). Aerosols collected during morning hours (9 a.m.) at 3 feet of height from the ground level, were assayed for Pcm as described above. Pcm was detected in aerosols at 10 feet (24.5 percent) and 20 feet (43.8 percent) away from point source by 7 and 14 dpi, respectively. By 21 and 28 dpi, the bacterium was detected in aerosols at 40 feet (45 percent) and 50 ft (32 percent) from the point source of inoculum, respectively.
ConclusionsWe demonstrated the spread of Pcm or the YB
bacterium from a source of inoculum to healthy onion seedlings in seedbeds. Our finding show that the
bacterium can spread through aerosols to a distance of 50 feet from a source of inoculum by 21 dpi.
We also evaluated the potential spread of Pcm through aerosols generated before and after over-head irrigation. Results from this study indicated that Pcm in aerosols were in higher percentages at 6 feet off the ground during afternoon hours (3 p.m.) than during morning hours (9 a.m.). In addition, higher percentages of aerosols with Pcm were detected before irrigation than after irrigation. This can be explained by rising air pulling bacteria off of plant surfaces and irrigation driving them out of the air back to the ground or onto plant surfaces.
Finally, we investigated the potential risk of disease spread from curly dock (weed) planted along the edge of an onion field. Results from this study indicated the spread of Pcm from weeds to healthy onion seedlings occurred within 7 dpi of the weeds. By the end of 28 dpi, YB symptoms were observed on seedlings at a distance of 50 feet from inoculated weeds. In conclusion, under favorable conditions, the YB bacterium can potentially be spread from an infected source (onion seedlings or weeds) to healthy seedlings as aerosols. The spread of this pathogen can occur rapidly, and hence, proper integrated disease management options need to be evaluated for this situation.
ReferencesDutta, B., Gitaitis, R. D., Webster, T. M., Sanders, H.,
Smith, S., & Langston, D. B. (2014). Distribution and survival of pseudomonas sp. on Italian ryegrass (Lolium multiflorum) and curly dock (Rumex crispus) in Georgia. Plant Disease, 98(5), 660-666.
Dutta, B., Gitaitis, R. D., Lewis, K. L., Booth, C., Langston, D. B., Webster, T. M., Riner, C. M., & Edenfield, J. D. (2013). New report of Lolium multiflorum L. and Rumex crispus L. as resident weed hosts of epiphytic populations of Psuedomonas sp., causal agent of yellow bud in onions in Georgia, USA. New Disease Report, 27(18).
1 Department of Plant Pathology, University of Georgia - Tifton Campus; 2 Vidalia Onion Area Agent, UGA Extension, Tattnall County; 3 Toombs County, ANR Agent

UGA Extension Annual Publication 114 • 2014 University of Georgia Vidalia Onion Extension and Research Report 27
Tabl
e 1.
Tem
pora
l and
spa
tial s
prea
d of
the
YB
in th
e on
ion
seed
beds
dur
ing
2013
and
201
4.
Dis
tanc
ea (ft)
Tim
e (d
ays
post
inoc
ulat
ion)
b
07
1421
Aer
osol
sa
mpl
es w
ith
YB (%
)cYB
inci
denc
e (%
)d
Aer
osol
sa
mpl
es w
ith
Pcm
(%
)YB
inci
denc
e (%
)
Aer
osol
sa
mpl
es w
ith
Pcm
(%)
YB in
cide
nce
(%)
Aer
osol
sa
mpl
es w
ith
Pcm
(%)
YB in
cide
nce
(%)
00
050
1080
3570
85
100
030
060
2050
50
200
020
030
2050
75
300
00
020
040
35
400
00
020
060
30
500
00
010
040
30
a D
ista
nce
from
poi
nt s
ourc
e of
inoc
ulum
.b
Sam
plin
g tim
e af
ter i
nocu
latio
n of
a li
ne s
ourc
e of
inoc
ulum
(oni
on s
eedl
ings
) with
Pcm
.c
Per
cent
age
of a
eros
ol s
ampl
es d
etec
ted
posi
tive
for P
cm b
y di
agno
stic
ass
ays.
Ten
repl
icat
es o
f aer
osol
sam
ples
wer
e ta
ken
at e
ach
sam
plin
g di
stan
ce a
nd a
ssay
ed fo
r the
pre
senc
e of
P
cm. S
ampl
ing
heig
ht fo
r aer
osol
sam
ple
colle
ctio
n w
as 3
ft.
d P
erce
ntag
e of
see
dlin
gs s
how
ing
typi
cal y
ello
w b
ud (Y
B) s
ympt
oms
at e
ach
sam
plin
g di
stan
ce. P
erce
ntag
e w
as d
educ
ed b
ased
on
calc
ulat
ing
YB
sym
ptom
s fo
r 20
onio
n se
edlin
gs a
t eac
h sa
mpl
ing
dist
ance
.

UGA Extension Annual Publication 114 • 2014 University of Georgia Vidalia Onion Extension and Research Report28
Tabl
e 2.
Mea
n po
pula
tion
of P
cm re
cove
red
in a
eros
ol p
artic
les
durin
g tw
o-sa
mpl
ing
perio
ds in
exp
erim
enta
l oni
on s
eedb
eds
durin
g a
norm
al s
unny
day
with
an
aver
age
tem
pera
ture
of 1
5 ±3
°C a
nd 6
5 pe
rcen
t RH
(201
3 an
d 20
14).
Sam
plin
g tim
e (h
)Sa
mpl
ing
heig
ht (f
t)
Sam
plin
g di
stan
ce
from
line
sou
rce
of
inoc
ulum
(ft)
Bef
ore
over
head
irrig
atio
nA
fter o
verh
ead
irrig
atio
nPe
rcen
tage
of a
eros
ol
sam
ples
with
Pcm
Mea
n lo
g10
CFU
/m3
Perc
enta
ge o
f aer
osol
sa
mpl
es w
ith P
cmM
ean
log10
C
FU/m
3
0900
-100
03
070
.01
3.37
210
.02.
1310
50
.02.
1820
.01.
4220
30
.01.
87nd
3nd
30
30.0
3.56
ndnd
40
15.0
2.72
ndnd
50
5.0
1.45
ndnd
0900
-100
06
040
.04.
3230
.03.
4110
20
.03.
1610
.02.
2420
20
.02.
0710
.03.
6230
nd
ndnd
nd40
nd
ndnd
nd50
nd
ndnd
nd
1500
-160
0
3
020
.02.
1230
.04.
3210
30
.04.
2610
.02.
1420
nd
nd20
.02.
6530
nd
ndnd
nd40
nd
ndnd
nd50
nd
ndnd
nd
1500
-160
06
0 80
.04.
1315
.02.
6210
65
.04.
0212
.01.
7620
55
.03.
743.
02.
7230
50
.02.
87nd
nd40
35
.03.
32nd
nd50
15
.02.
63nd
nd
1 P
erce
ntag
e of
aer
osol
a s
ampl
es a
ssay
ed p
ositi
ve fo
r Pcm
by
plat
ing
assa
y.2
Mea
n P
cm p
opul
atio
ns re
cove
red
by p
latin
g as
say
from
the
plat
es u
pon
air-s
ampl
ing
for 5
min
utes
.3
Pcm
not
det
ecte
d fro
m a
ir-sa
mpl
es.

UGA Extension Annual Publication 114 • 2014 University of Georgia Vidalia Onion Extension and Research Report 29
Research Report on Management of Sour Skin 2013-14 Season
R.D. Gitaitis, A.W. Selph, and B. DuttaDepartment of Plant Pathology, University of Georgia, Tifton, GA 31793
IntroductionSour skin of onion is an annual threat to onion
quality and profitability of the Vidalia onion industry. Although a postharvest disease, sour skin gets its start in the field as the majority of inoculum is from a soilborne bacterium, Burkholderia cepacia. There are limited options available to manage bacterial diseases, and there are even fewer for those pathogens that are soilborne. Fumigants that are effective against either soilborne fungi or nematodes are ineffective against the sour skin bacterium. In fact, B. cepacia is often used as a bioremediation organism, meaning it can digest many chemicals and break them down into simpler compounds. In other words, it can eat fumigant chemicals. Thus there is a need for new approaches to develop a management strategy for sour skin.
Previous results indicated that there were differences in certain mineral elements in healthy onion bulbs from plots with lower levels of sour skin compared to bulbs from plots with higher levels. Furthermore, multiple regression models were developed to explain the different levels of disease observed in the different plots. Of particular interest in these models were the importance of several heavy metal cation ratios, namely, Copper:Iron, Copper:Manganese, Manganese:Zinc, and Iron:Zinc. These four elements are known cofactors of the three superoxide dismutase enzymes that help detoxify reactive oxygen species (i.e., act as antioxidants), which in turn could stimulate systemic acquired resistance mechanisms in plant metabolism. In previous years, the Copper:Iron ratio was the largest contributing factor to the model, and this same ratio has been observed as the largest contributing factor in our work with disease resistance of tobacco to tomato spotted wilt and resistance of pepper to bacterial leaf spot.
Materials and MethodField plots for two trials were established in a
randomized complete block design at the Blackshank Farm near Tifton, Georgia. In Trial 1, treatments consisted of CM, CP, CS, CZ, OM, OP, OS, and OZ; where C = carrot and O = onion, as winter crops, and
M = Pearl Millet, P = peanut, S = soybean, and Z = maize as summer crops double-cropped behind either carrot or onion. In Trial 2, treatments consisted of supplements to standard N-P-K fertilizer and calcium nitrate practices where: 1 = magnesium sulfate + cupric sulfate + calcium chloride; 2 = magnesium sulfate + cupric sulfate + calcium chloride + zinc chelate; 3 = magnesium sulfate + cupric sulfate + gypsum; 4 = iron chelate + gypsum; 5 = magnesium sulfate + cupric sulfate + calcium chloride + Actigard; 6 = iron chelate + gypsum + zinc chelate; 7 = iron chelate + gypsum + zinc chelate + Actigard; and 8 = Standard N-P-K (6-12-18 with 4 percent sulfur) + calcium nitrate levels and applications as recommended by UGA Extension.
The supplements were selected for further evaluation based on earlier results from micro-plot studies and were applied. Supplements were applied five times over a course of time, beginning in mid-December and ending in early March. Weeds and insects were managed according to protocols recommended by UGA Extension. Onion bulbs were undercut on May 7 when approximately 70 percent of onion leaves were down and then allowed to dry in the field for 48 hours. Onion bulbs were rated for sour skin incidence and severity by cutting bulbs after two weeks of storage in the packinghouse.
Tissue and soil samples were sent to the UGA Plant and Soil Analysis Laboratory in Athens, Georgia, for mineral analysis. Results were compiled and all statistical analyses were performed using SAS version 9.3 (SAS Institute Inc., Cary, NC, USA). Development of PCR primers to evaluate expression of Cu-ZnSOD and MnSOD genes were developed from gene sequences of garlic and African oil palm, respectively, found in the GenBank.
Results and DiscussionThe field study results were that predictive disease
models (Figures 1-3, 5) could be developed for both soil and tissue data using mineral concentrations and ratios of certain minerals to one another. These models were highly significant and could explain, on average, slightly more than 37 percent of the sour skin levels observed. There were no apparent problems of co-

UGA Extension Annual Publication 114 • 2014 University of Georgia Vidalia Onion Extension and Research Report30
Figure 1. 2014 Tissue Model: Fit of observed vs. predicted values from macro plots (double-cropping/rotation) for sour skin severity based on mineral content of bulbs. % Sour Skin = -353 CuFe + 35 NaFe + 27.8 MnZn – 1.77 Mn + 0.04 Ca + 0.003 N – 28.8; P = 0.00002; Adj. R2 = 0.34
linearity in any of the models as indicated by all VIF values being less than 5.0 (Table 1).
In addition, all models displayed acceptable patterns when residuals were plotted against predicted values (data not shown) except for the micro-plot tissue model, which displayed a fan-shaped pattern when raw data were evaluated. This pattern occurs due to unequal (non-constant) variances and the variance of the error increases as the mean increases. A transformation of the data can help stabilize these variances. The best transformation was ASINH (inverse hyperbolic sine), which alleviated the problem and altered the model very little.
Of particular interest was the fact that manganese (Mn) levels in the soil in Trial 2 had no apparent correlation with sour skin levels (Figure 4) but different Mn levels occurred in the bulbs and significantly correlated with sour skin levels (Figure 5) despite the fact that no supplemental Mn was applied to those onions.
However, when the effects of supplemental copper and iron were evaluated (Figures 6-8), it can be seen that interactions with each other as well as Mn occurred. As expected, when supplemental copper was applied, there was an increased level of copper in the bulbs (Figure 6) in contrast to when iron was applied. However, there were actually higher levels of iron in bulbs from added copper than from the added iron (Figure 7).
Of greater interest for disease resistance, there was a trend of higher levels of manganese in bulb tissues from adding supplemental iron (Figure 8). Furthermore, bulbs with lower levels of sour skin contained significantly higher levels of manganese (Figure 9).
The effects of supplemental iron and copper on the expression of superoxide dismutase genes and the relationship to disease can be seen in Figures 10-12. Added copper up-regulated Cu-ZnSOD more so than added iron, and in general, there were higher levels of sour skin in treatments with supplemental copper (Figure 12). In contrast, added iron not only increased Mn content in bulb tissues but also up-regulated MnSOD more so than added copper (Figure 11), and added iron correlated with lower levels of sour skin. Another trend observed and not fully understood is that lower levels of sour skin occurred with gypsum as the source of calcium when compared to calcium chloride (Figure 12).
In summary, several predictive models were developed from micronutrient levels in both the soil and plant tissues that significantly correlated (Table 1) with levels of sour skin in 2014. Furthermore, the
elements Cu, Fe, Mn, and Zn appeared as components of these models displaying a trend since 2012 (Table 2). In particular, when the first three independent variables in the eight models developed from 2012-2014 are evaluated, these four elements and their combinations occur 86 percent of the time when compared to all the other elements and element combinations assessed. Furthermore, the elements Cu, Fe, Mn, and Zn occurred 94 percent of the time as the first independent variable in the nine models developed from 2012-2014.
Since these four elements are co-factors of the three main types of superoxide dismutase enzymes, namely Cu-ZnSOD, FeSOD, and MnSOD, we attempted to develop methods to assess their effect on those enzymes. Successful PCR protocols were developed to assess expression of the Cu-ZnSOD and MnSOD genes by using sequences in GenBank for genes of these two enzymes from garlic and African oil palm, respectively. Similar attempts to develop a PCR protocol for FeSOD and NPR1 protein did not meet with success. Thus, we were able to develop a protocol for only two of the four genes of interest because we were hampered by the fact that the onion genome has never been sequenced. To resolve this problem, we have submitted RNA samples for analysis using trancriptomics and hope to develop the necessary tools to also evaluate FeSOD and NPR1 protein. Understanding gene expression from these four different elements will help us to understand how minerals interact to affect disease resistance.

UGA Extension Annual Publication 114 • 2014 University of Georgia Vidalia Onion Extension and Research Report 31
Figure 2. 2014 Tissue Model*: Fit of observed vs. predicted values from micro plots (fertility treatments) for sour skin severity based on mineral content of bulbs. % Sour Skin = -3.16 CuFe – 0.55 Mn + 6.4; *P = 0.00001; Adj. R2 = 0.32
* Data had to be transformed (ASINH) with this model to remove problems identified by a fan shaped residual pattern using raw data. This pattern occurs due to unequal (non-constant) variances. The variance of the error increases as the mean increases. A transformation of the data can help stabilize these variances. The best transformation was ASINH.
Figure 3. 2014 Soil Model: Fit of observed vs. predicted values from micro plots (fertility treatments) for sour skin severity based on mineral content of soil. % Sour Skin = -359.7 Mo – 31 CuFe + 20.5 Ni – 6.1 PMg – 0.31 FeCu + 0.13 Mg + 69.4; P = 0.02; Adj. R2 = 0.343
Figure 4. Levels of manganese (Mn) in soil in micro-plots plotted against levels of sour skin, indicating no significant relationship between sour skin and Mn levels in the soil.
Figure 5. Levels of manganese (Mn) in onion bulbs from micro-plots plotted against levels of sour skin. Model: Sour Skin Severity = -1.03 Mn + 57.49; P = 0.00003; Adj. R2 = 0.28

UGA Extension Annual Publication 114 • 2014 University of Georgia Vidalia Onion Extension and Research Report32
Figure 6. Copper (Cu) levels in onion bulbs selected for SOD analysis; bulbs were either supplemented with iron (low disease) or copper (high disease).
Figure 7. Iron (Fe) levels in onion bulbs selected for SOD analysis; bulbs were either supplemented with iron (low disease) or copper (high disease).
Figure 8. Trend of manganese (Mn) levels in onion bulbs supplemented with iron (low disease) or copper (high disease).
a
b
Figure 9. Manganese levels in a subset of bulbs (n = 6/trt) with either low levels or high levels of sour skin and then selected for superoxide dismutase analysis.
a
b
Figure 10. Relative Expression of Cu-ZnSOD gene in onion bulbs supplemented with iron (low disease) or copper (high disease).
Figure 11. Relative Expression of MnSOD gene in onion bulbs supplemented with iron (low disease) or copper (high disease).

UGA Extension Annual Publication 114 • 2014 University of Georgia Vidalia Onion Extension and Research Report 33
Table 1. Summary of Statistics Of Sour Skin Models 2012-2014.Year Source Sample Type P Value Adj. R2 VIF Rangea
2014 Macro Plot Bulb Tissue Severity 0.00004** 0.34 1.24–2.022014 Macro Plot Bulb Tissue Incidence 0.00004** 0.32 1.26–3.332014 Micro Plot Bulb Tissue 0.00001** 0.32 1.17–1.172014 Micro Plot Soil 0.02* 0.33 1.06–3.442014 Micro Plot Soil 0.00001** 0.30 NAa VIF can be used to assess problems of co-linearity; if VIF > 5 there is some concern that co-linearity among independent variables might
exist, and if VIF > 10, it should be considered that co-linearity is indeed a problem in the model.
Table 2. Summary of Sour Skin Models Listing First Three Variables 2012-2014Year Source Sample Type 1st Variable 2nd Variable 3rd Variable2012 Macro Plot Tissue Incidence - 139 CuFe - 14.7 ZnFe + 0.7 Mn2012 Macro Plot Soil - 49 ZnFe + 40 Cu + 6 MnZn2012 Macro Plot Tissue Incidence - 145 CuFe2013 Grocery Store Tissue Incidence - 17.9 CuFe - 0.34 Al + 0.003 K2014 Macro Plot Tissue Severity - 353 CuFe + 35 NaFe + 27.8 MnZn2014 Macro Plot Tissue Incidence - 49.9 CuMn - 1.56 FeMn - 1.06 Mn2014 Micro Plot Tissue Severity - 3.16 CuFe - 0.55 Mn 2014 Micro Plot Soil - 359.7 Mo - 31 CuFe + 20.5 Ni2014 Micro Plot Soil - 0.46 Mn
Figure 12. Effects of fertility on postharvest levels of sour skin.
Treatments: 1 = MgSO4 + Cu + CaCl22 = MgSO4 + Cu + CaCl2 + Zn3 = MgSO4 + Cu + gypsum 4 = Fe + gypsum 5 = MgSO + Cu + CaCl2 +Actigard6 = Fe + gypsum + Zn7 = Fe + gypsum + Zn + Actigard8 = Standard NPK

UGA Extension Annual Publication 114 • 2014 University of Georgia Vidalia Onion Extension and Research Report34
At Plant Applications of FRAC Group 7 Fungicides: Effect on Fungal Diseases and Yield in Vidalia Onions
F. Hunt Sanders, Jr.1, Cliff M. Riner2, and Michael J. Foster3
IntroductionFRAC (Fungicide Resistance Action Committee)
Group 7 fungicides are systemic fungicides that inhibit cellular respiration. The fungicide boscalid is a group 7 fungicide, and it has been used in onion production for many years. Boscalid is an active ingredient in the fungicides Pristine (boscalid + pyraclostrobin) and Endura (boscaild). Since 2009, we have been investigating the use of at-plant applications of Endura for the control of onion diseases and have found that a single at-plant application of Endura can reduce botrytis leaf blight and pink root diseases. We also found that Endura at-plant treatments increase yields in some varieties of Vidalia onions (Sanders and Langston, 2009).
Recently, two new Group 7 fungicides, Fontelis (penthiopyrad), and Merivon (fluxapyroxad + pyraclostrobin), have been labeled for use in onion production. It was the purpose of this investigation to compare Endura to the new Group 7 fungicdes (Fontelis and Merivon) and determine if these products give similar disease suppression and yield increases as Endura.
Materials and MethodBetween November 2013 and May 2014, a field
trial was conducted at the Vidalia Onion and Vegetable Research and Educational Center in Lyons, Georgia. Onions were transplanted on November 19 into 6-foot beds. Each bed had four onion rows that were 11-inches apart, and onion spacing within the rows was 6 inches. The experimental design was a 2x2 factorial with six replications. Factor one was onion variety (‘Pirate’ or ‘Sweet Jasper’) and factor two was fungicide treatment. Production guidelines for growing sweet onions published by UGA Extension were followed, except for fungicide applications. Fungicides were applied the day of planting (November 19) by either dipping transplants before planting or by banding fungicides over the onions rows after planting. Banding applications were applied with a CO2 backpack sprayer with 4006E tips calibrated to deliver 47 GPA at 25-30 psi. Nozzles were 11-inches apart and lined up over each onion row. Onions were monitored for disease,
and plots were rated for Botrytis leaf blight, purple blotch, and pink root during the season. Onions were harvested at maturity, and yields were recorded. Means were separated using Fisher’s protected LSD P ≤ 0.05.
Results and DiscussionComparing the two onion varieties used in this
study, there were no differences in incidence or severity of purple blotch/Stemphilium blight, Botrytis leaf blight, or pink root. However, the variety ‘Pirate’ did out yield the variety ‘Sweet Jasper’ (Table1).
At-plant fungicides applications had no effect on the diseases evaluated for the variety ‘Sweet Jasper,’ however, there was an increase in yield in ‘Sweet Jasper’ onions treated with Endura (transplant dip), Endura (banded spray), and Merivon (Table 2).
In the variety ‘Pirate,’ there was a difference in disease suppression between fungicide treated onions and the untreated control. Onion plots treated with Endura (transplant dip), Fontelis, or Topsin + Endura had less Botrytis leaf blight than untreated plots (Table 3). Also, plots treated with Merivon, Fontelis, or Topsin, had less purple blotch/Stemphilium blight than untreated plots (Table 3). There was no difference in yield in the variety ‘Pirate’ between fungicide treated plots and the untreated control plots (Table 3). Results from this trial are similar to results from previous at-plant studies with Endura, where we have seen a small amount of disease suppression in either Botrytis leaf blight and/or purple blotch/Stemphilium blight late in the growing season. But we have also seen a relatively large increase in onion yield for the amount of disease suppression that is observed. It’s possible this phenomenon is due to suppression of soil borne diseases during the early part of the growing season (November to December).
In our studies, we typically do not evaluate soil-borne diseases early in the season because it requires destructive sampling. In the future, we may plant larger plots to accommodate destructive sampling during the season to determine if the soil-borne disease hypothesis is correct, and we would like to determine which soil-borne pathogens are possibly being suppressed with at plant fungicide treatments.

UGA Extension Annual Publication 114 • 2014 University of Georgia Vidalia Onion Extension and Research Report 35
Another aspect of the Ggroup 7 fungicides that is worth mentioning is how long these fungicides remain in the onion plants after they are applied. The Botrytis leaf blight and purple blotch/Stemphilium disease ratings were taken on March 20 and April 28, respectively (Table 3). Even though the amount of disease suppression was small, it is incredible that the fungicides were applied in November the previous year. Results from this trial indicate that Endura, Fontelis, and Merivon are very similar in there systemicity, and that they all can suppress onion pathogens months after they were applied.
Summary and ConclusionsThe trial presented here is very similar to other
at-plant fungicide studies that we have conducted in the past using the Group 7 fungicide Endura (Sanders and Langston, 2009). The main difference is that we included two new Group 7 fungicides (Merivon and
Fontelis). These new fungicides performed just as well as Endura in suppressing Botrytis leaf blight and purple blotch/Stemphilium blight, and Merivon was just as effective as Endura at increasing yields in the onion variety ‘Sweet Jasper.’
ReferencesSanders, F. H., Jr., Langston, D. B., Jr., & Foster
M. J. (2009). Effect of fungicides dip treatments on fungal diseases and yield of transplanted sweet onions year 2. In Dan MacLean (Ed), Georgia onion research-Extension report 2009 (Cooperative Research-Extension Publication No. 3-2019) (pp. 8-10). Retrieved from http://www.caes.uga.edu/commodities/fruits/vidalia/publications.html.
Table 1. Effect of Vidalia onion variety on fungal diseases and yield.Variety PB/SB1 BLB2 Pink root3 Green weights4
‘Pirate’ 54.6 a5 2.0 a 5.0 a 49295 a‘Sweet Jasper’ 60.4 a 1.8 a 2.9 a 44786 b1 Purple blotch and Stemphyllium leaf blight severity 4/28/14, 0-100 scale where 0 = no disease and 100 = total leaf area diseased.2 Botrytis leaf blight severity 3/20/14, 0-100 scale where 0 = no disease and 100 = total leaf area diseased.3 Pink root incidence was rated on 5/5/14.4 Field weights of onions in lbs/Acre.5 Means in columns with the same letter(s) are not significantly different according to mean separation by Fisher’s protected LSD at P<0.05.
Table 2. Effect of fungicide treatment on fungal diseases and yield (variety ‘Sweet Jasper’).Treatments and Rates PB/SB1 BLB2 Pink Root3 Green Weights4
Endura 2.3 oz/10 gal (dip) 53.3 a5 1.7 a 12.5 a 48133 aEndura 6.8 oz/A (banded spray) 58.3 a 1.25 a 0.0 a 46563 abMerivon 11 fl oz/A (banded spray) 59.2 a 1.0 a 2.5 a 48061 aFontelis 24 fl oz/A (banded spray) 60.8 a 2.42 a 5.0 a 44358 bcTopsin 40 fl oz/A + Endura 6.8 oz/A (banded spray)
60.8 a 1.5 a 5.0 a 43995 bc
Topsin 40 fl oz/A (banded spray) 60.0 a 1.8 a 2.5 a 42906 cUntreated 63.3 a 3.1 a 5.0 a 42398 c1 Purple blotch and Stemphyllium leaf blight severity 4/28/14, 0-100 scale where 0 = no disease and 100 = total leaf area diseased.2 Botrytis leaf blight severity 3/20/14, 0-100 scale where 0 = no disease and 100 = total leaf area diseased.3 Pink root incidence was rated on 5/5/14.4 Field weights of onions in lbs/Acre. 5 Means in columns with the same letter(s) are not significantly different according to mean separation by Fisher’s protected LSD at P<0.05.

UGA Extension Annual Publication 114 • 2014 University of Georgia Vidalia Onion Extension and Research Report36
Table 3. Effect of fungicide treatment on fungal diseases and yield (variety ‘Pirate’).Treatments and Rates PB/SB1 BLB2 Pink Root3 Green Weights4
Endura 2.3 oz/10 gal (dip) 53.3 ab5 1.3 bc 12.5 a 48133 aEndura 6.8 oz/A (banded spray) 60.0 a 2.2 a-c 7.5 a 49803 aMerivon 11 fl oz/A (banded spray) 50.8 b 1.9 a-c 0.0 a 51183 aFontelis 24 fl oz/A (banded spray) 50.8 b 1.0 c 0.0 a 49005 aTopsin 40 fl oz/A + Endura 6.8 oz/A (banded spray)
57.5 ab 1.5 bc 7.5 a 50747 a
Topsin 40 fl oz/A (banded spray) 50.8 b 2.6 ab 12.5 a 49295 aUntreated 59.2 a 3.3 a 5.0 a 47335 a1 Purple blotch and Stemphyllium leaf blight severity 4/28/14, 0-100 scale where 0= no disease and 100= total leaf area diseased2 Botrytis leaf blight severity 3/20/14, 0-100 scale where 0= no disease and 100= total leaf area diseased3 Pink root incidence, was rated on 5/5/14.4 Field weights of onions in lbs/Acre 5 Means in columns with the same letter(s) are not significantly different according to mean separation by Fisher’s protected LSD at P<0.05
1 Disease Management Specialist, Department of Plant Pathology, University of Georgia, Tifton, GA 31793; 2 Vidalia Onion Area Agent, UGA Extension, Lyons, GA 30436; 3 Research Professional I, Department of Plant Pathology, University of Georgia, Tifton, GA 31793

UGA Extension Annual Publication 114 • 2014 University of Georgia Vidalia Onion Extension and Research Report 37
Effect of Pre-harvest Fungicide Sprays and Commercial Drying on Black Mold of Onion
F. Hunt Sanders, Jr.1, Cliff M. Riner2, Jason Edenfield3, Chris Tyson4, and Michael J. Foster5
IntroductionBlack mold caused by the fungus Aspergillus
niger, has become a major concern for some of the Vidalia onion producers in recent years. This may be partly due to the relatively new drying facilities used by some producers, which dry large volumes of onions in rooms heated with hot air for one to two days. A. niger grows readily at the temperatures used to dry onions in this manner, with optimum growth for the fungus between 82-93 degrees F. In response to some of the Vidalia onion grower’s concerns, we started an investigation into the causes and possible control of black mold in stored Vidalia onions. The purpose of this investigation was to determine if pre-harvest applications of fungicides can reduce the amount of black mold in stored Vidalia onions and determine the effect of commercial driers on black mold.
Materials and MethodThree on farm trails were conducted between
November 2012 and August 2014. All trials were split plot designs with fungicide treatment being the main plot and post-harvest drying or field curing being the sub plots. All treatments were replicated at least four times.
2013 Black Mold Trials: Two trials were conducted in 2013, one in
Tattnall County and one in Toombs County. Fungicide treatments in both trials were in addition to the fungicide programs that each grower used, and treatments were applied at two times during the growing season. The first applications (early season) were initiated within three days of planting and continued on a two week interval for a total of three applications. The later treatments (late season) were initiated on March 26 and continued on a two week interval for a total of four applications, with the final application applied eight days before harvest.
Onions were harvested on May 14 for both trials, and two 20 bulb sub-samples were taken from each plot. One sample was taken to each grower’s drier and dried, and the other sample was taken to the Vidalia Onion Lab in Tifton, Georgia. Onions that were taken directly to Tifton were placed into cold storage on May
14, and the onions that the growers dried were taken to Tifton and placed into cold storage on May 20. Onions were taken out of cold storage on July 1 and placed under shelter in the Onion Lab for 16 days, after which the onions were evaluated for black mold incidence and severity. Means were separated using Fisher’s protected LSD P ≤ 0.05.
2014 Black Mold Trial: One trial was conducted in 2014 in Tattnall County,
Georgia. Fungicide treatments were applied in addition to the fungicide programs that the grower used. Like the 2013 trials, treatments were applied at two times during the growing season. The first applications (early season) were initiated within three days of planting and continued on a two week interval for a total of three applications. The later treatments (late season) were initiated on May 3 with follow up applications applied on May 12 and May 19, with the final application applied the day of harvest.
Onions were harvested on May 19, and two 20 bulb sub-samples were taken from each plot. Both samples were taken to the grower’s packing shed, where one sample was dried and the other was placed outside the drier in the packing shed. After drying was completed, both samples were placed into cold storage at the same time. Onions were taken out of cold storage on July 17 and taken to the Vidalia Onion Lab in Tifton, where they were placed under shelter for seven days before evaluation. Onions were evaluated and data was analyzed in the same way as the 2013 trials.
Results and DiscussionEffect of Pre-harvest Fungicide Applications
on Black Mold. The fungicides used in 2013 and 2014 were chosen either for their know efficacy of A. niger on onion or other crops or because of their efficacy on similar fungi. In the 2013 and 2014 Tattnall County trials, there was no difference in black mold suppression between any of the plots treated with pre-harvest fungicides and the untreated check. However, there was some black mold suppression in plots treated with Omega 500 (fluazinam) and Switch (fludioxinil + cyprodinil) in the 2013 Toombs County trial (Tables 1-2). Although some suppression was seen using pre-

UGA Extension Annual Publication 114 • 2014 University of Georgia Vidalia Onion Extension and Research Report38
harvest fungicides in one trial, the overall performance of the fungicides used was disappointing for all three trials, and the suppression seen in the 2013 Toombs County trial was not adequate. Part of the problem in trying to control post-harvest black mold with fungicides is that the fungus can get under one or more dry onion scales, making it difficult to target.
We thought that applying fungicides during the early growing season would help suppress latent infections of A. niger, which might develop later in the season or in storage. We also thought that applying fungicides late season, and as close to harvest as possible, would suppress A. niger from infiltrating the outer scales of onions during the harvesting process. Results from this investigation indicate that these hypotheses are incorrect, and we were unsuccessful at targeting post-harvest black mold with pre-harvest applied fungicides.
Effect of Commercial Drying on Black Mold. In all three trials in this investigation, two sub-samples were taken from each plot in order to compare onions that were field cured to those that were field cured and dried at each location.
In the 2013 Tattnall and Toombs County trials, onions that were field cured and dried had significantly more black mold incidence and severity than onions that were only field cured (Table 3). However, there was a flaw in the experimental design of the 2013 trials. Onions that were field cured were taken to the Vidalia Onion Lab and placed into cold storage six days before the onions that were dried. This discrepancy allowed for the dried onions to be subjected to potentially more A. niger infections while they were outside the driers before and after drying. With this in mind, the 2014 trial was designed where both the dried and field cured onions stayed in the grower’s packing shed for the same amount of time, and both sets of onions were placed in the same cold room at the same time.
Results from the 2014 trial were similar to the 2013 trials where the onions that were dried had significantly more black mold than the onions that were field cured (Table 3). These results indicate that some growers are exacerbating their problem with black mold by drying their onions. However, drying is essential for long term storage of Vidalia onions because it reduces other diseases like Botrytis neck rot.
In the future, we are going to turn our attention towards the conditions that different growers use when drying onions, and hopefully provide some information about what drying conditions will not exacerbate post-harvest black mold. It is unlikely that increasing the temperature while drying is going to have an effect
on black mold since the pathogen is inhibited at 116 degrees F. However, we might be able to reduce the amount of humidity in the driers by increasing the airflow around the onions. Reducing the humidity may help alleviate the problem with black mold since spore germination is inhibited at 76 percent humidity.
Summary and ConclusionsBetween November 2012 and August 2014, we
conducted a series of experiments designed to reduce black mold in stored Vidalia onions. These experiments had two components where we evaluated pre-harvest fungicides and post-harvest drying for control of the disease. Pre-harvest fungicide applications did not reduce black mold in stored onions in two of the three field trials conducted; however, black mold was reduced in one trial by applying Omega 500, or Switch. Black mold was increased by commercial drying in all three trials conducted. Results from this investigation indicate that applying pre-harvest fungicides is not an effective strategy for controlling post-harvest black mold infections, and that some onion growers are exacerbating their black mold problems by drying their onions.

UGA Extension Annual Publication 114 • 2014 University of Georgia Vidalia Onion Extension and Research Report 39
Table 1. Effect of pre-harvest fungicide treatment on Black Mold 2013 Trials.
Treatments and Rates
2013 Tattnall County 2013 Toombs CountyBlack mold
Severity1Black Mold %
Incidence2Black mold
SeverityBlack Mold %
IncidenceQuadris 2.08 SC 12 fl oz/A 25 a3 97.5 a 37 a 100 aSwitch 62.5 WG 14 oz/A 25 a 95.0 a 33 b 76.8 cOmega 500 SC 1pt/A 38 a 92.5 a 33 b 95.6 bScala 5 SC 18 fl oz/A 30 a 100 a 45 a 100 aUntreated 36 a 93.1 a 46 a 100 a1 Black mold severity was rated on a 0-100 scale where 0 = no A. niger present, 50 = 50% of the onion surface covered with A. niger, and
100 = 100% of the onion surface covered with A. niger. Each onion was rated and the severity was averaged for each plot (n = 20). 2 Black Mold % incidence was rated by counting the number of onion bulbs in each plot that had visible A. niger sporulation and dividing
that number by the total number of onion bulbs in each plot (n = 20).3 Means followed by the same letter(s) are not significantly different according to Fisher’s protected LSD test at P ≤ 0.05.
Table 2. Effect of pre-harvest fungicide treatment on Black Mold 2014 Trial in Tattnall County.Treatments and Rates Black mold Severity1 Black Mold % Incidence2
Quadris 2.08 SC, 12 fl oz/A 13.2 a3 56.7 aSwitch 62.5 WG, 14 oz/A 11.5 a 55.4 aOmega 500 SC, 1 pt/A 13.0 a 55.8 aInspire Super 338 SC, 20 fl oz/A 11.4 a 54.6 aUntreated 13.3 a 62.5 a1 Black mold severity was rated on a 0-100 scale where 0 = no A. niger present, 50 = 50% of the onion surface covered with A. niger, and
100 = 100% of the onion surface covered with A. niger. Each onion was rated and the severity was averaged for each plot (n = 20). 2 Black Mold % incidence was rated by counting the number of onion bulbs in each plot that had visible A. niger sporulation and dividing
that number by the total number of onion bulbs in each plot (n = 20).3 Means followed by the same letter(s) are not significantly different according to Fisher’s protected LSD test at P ≤ 0.05.
Table 3. Effect of commercial drying on Black Mold 2013 and 2014 Trials.
Method
2013 Tattnall County 2013 Toombs County 2014 Tattnall CountyBlack Mold Severity1
Black Mold % Incidence2
Black Mold Severity
Black Mold % Incidence
Black Mold Severity
Black Mold % Incidence
Field Cured Onions
26.0 b3 93.9 b 34.0 b 93.2 b 10.6 b 49.9 b
Dried Onions 41.0 a 99.1 a 44.0 a 99.7 a 12.8 a 58.7 a1 Black mold severity was rated on a 0-100 scale where 0 = no A. niger present, 50 = 50% of the onion surface covered with A. niger, and
100 = 100% of the onion surface covered with A. niger. Each onion was rated and the severity was averaged for each plot (n = 20). 2 Black Mold % incidence was rated by counting the number of onion bulbs in each plot that had visible A. niger sporulation and dividing
that number by the total number of onion bulbs in each plot (n = 20).3 Means followed by the same letter(s) are not significantly different according to Fisher’s protected LSD test at P ≤ 0.05.
1 Disease Management Specialist, Department of Plant Pathology, University of Georgia, Tifton, GA 31793; 2 Vidalia Onion Area Agent, University of Georgia, Lyons, GA 30436; 3 Toombs County, ANR Agent; 4 Tattnall County, ANR Agent; 5 Research Professional I, Department of Plant Pathology, University of Georgia, Tifton, GA 31793
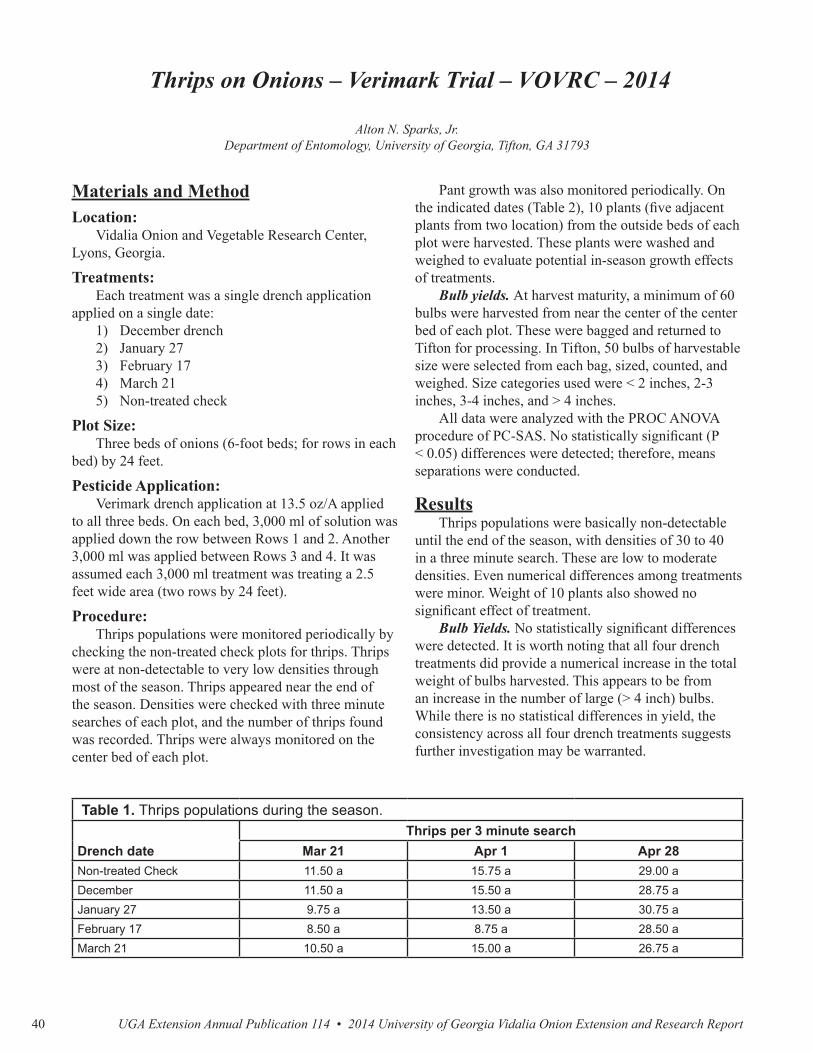
UGA Extension Annual Publication 114 • 2014 University of Georgia Vidalia Onion Extension and Research Report40
Thrips on Onions – Verimark Trial – VOVRC – 2014
Alton N. Sparks, Jr. Department of Entomology, University of Georgia, Tifton, GA 31793
Pant growth was also monitored periodically. On the indicated dates (Table 2), 10 plants (five adjacent plants from two location) from the outside beds of each plot were harvested. These plants were washed and weighed to evaluate potential in-season growth effects of treatments.
Bulb yields. At harvest maturity, a minimum of 60 bulbs were harvested from near the center of the center bed of each plot. These were bagged and returned to Tifton for processing. In Tifton, 50 bulbs of harvestable size were selected from each bag, sized, counted, and weighed. Size categories used were < 2 inches, 2-3 inches, 3-4 inches, and > 4 inches.
All data were analyzed with the PROC ANOVA procedure of PC-SAS. No statistically significant (P < 0.05) differences were detected; therefore, means separations were conducted.
ResultsThrips populations were basically non-detectable
until the end of the season, with densities of 30 to 40 in a three minute search. These are low to moderate densities. Even numerical differences among treatments were minor. Weight of 10 plants also showed no significant effect of treatment.
Bulb Yields. No statistically significant differences were detected. It is worth noting that all four drench treatments did provide a numerical increase in the total weight of bulbs harvested. This appears to be from an increase in the number of large (> 4 inch) bulbs. While there is no statistical differences in yield, the consistency across all four drench treatments suggests further investigation may be warranted.
Materials and MethodLocation:
Vidalia Onion and Vegetable Research Center, Lyons, Georgia.
Treatments:Each treatment was a single drench application
applied on a single date:1) December drench2) January 273) February 174) March 215) Non-treated check
Plot Size: Three beds of onions (6-foot beds; for rows in each
bed) by 24 feet.
Pesticide Application: Verimark drench application at 13.5 oz/A applied
to all three beds. On each bed, 3,000 ml of solution was applied down the row between Rows 1 and 2. Another 3,000 ml was applied between Rows 3 and 4. It was assumed each 3,000 ml treatment was treating a 2.5 feet wide area (two rows by 24 feet).
Procedure:Thrips populations were monitored periodically by
checking the non-treated check plots for thrips. Thrips were at non-detectable to very low densities through most of the season. Thrips appeared near the end of the season. Densities were checked with three minute searches of each plot, and the number of thrips found was recorded. Thrips were always monitored on the center bed of each plot.
Table 1. Thrips populations during the season.
Drench dateThrips per 3 minute search
Mar 21 Apr 1 Apr 28Non-treated Check 11.50 a 15.75 a 29.00 aDecember 11.50 a 15.50 a 28.75 aJanuary 27 9.75 a 13.50 a 30.75 aFebruary 17 8.50 a 8.75 a 28.50 aMarch 21 10.50 a 15.00 a 26.75 a

UGA Extension Annual Publication 114 • 2014 University of Georgia Vidalia Onion Extension and Research Report 41
Table 2. Plant growth during the season.
Drench dateWeight of 10 plants (g)
Dec 17 Jan 13 Jan 27 Feb 17 Mar 10Non-treated Check 23.55 a 44.24 a 48.07 a 101.93 a 474.85 aDecember 21.33 a 41.25 a 45.13 a 98.85 a 403.98 aJanuary 27 29.41 a 46.20 a 54.76 a 110.18 a 354.37 aFebruary 17 25.37 a 50.05 a 56.19 a 101.70 a 354.37 aMarch 21 25.43 a 41.95 a 57.07 a 117.28 a 396.89 a
Table 3. Bulb grades by number at harvest.
Drench dateNumber of bulbs by size
2-3 in 3-4 in > 4 in TotalNon-treated Check 7.75 31.25 11.00 50December 3.00 28.75 18.25 50January 27 2.75 30.25 17.00 50February 17 5.00 26.50 18.50 50March 21 5.75 28.75 15.50 50
Table 4. Bulb grades by weight at harvest.
Drench dateWeight of bulbs by size (lb)
2-3 in 3-4 in > 4 in TotalNon-treated Check 3.11 20.17 11.20 34.48December 1.17 18.67 20.16 40.00January 27 1.11 20.31 18.36 39.78February 17 1.97 16.72 19.34 38.03March 21 2.13 20.23 16.80 39.16
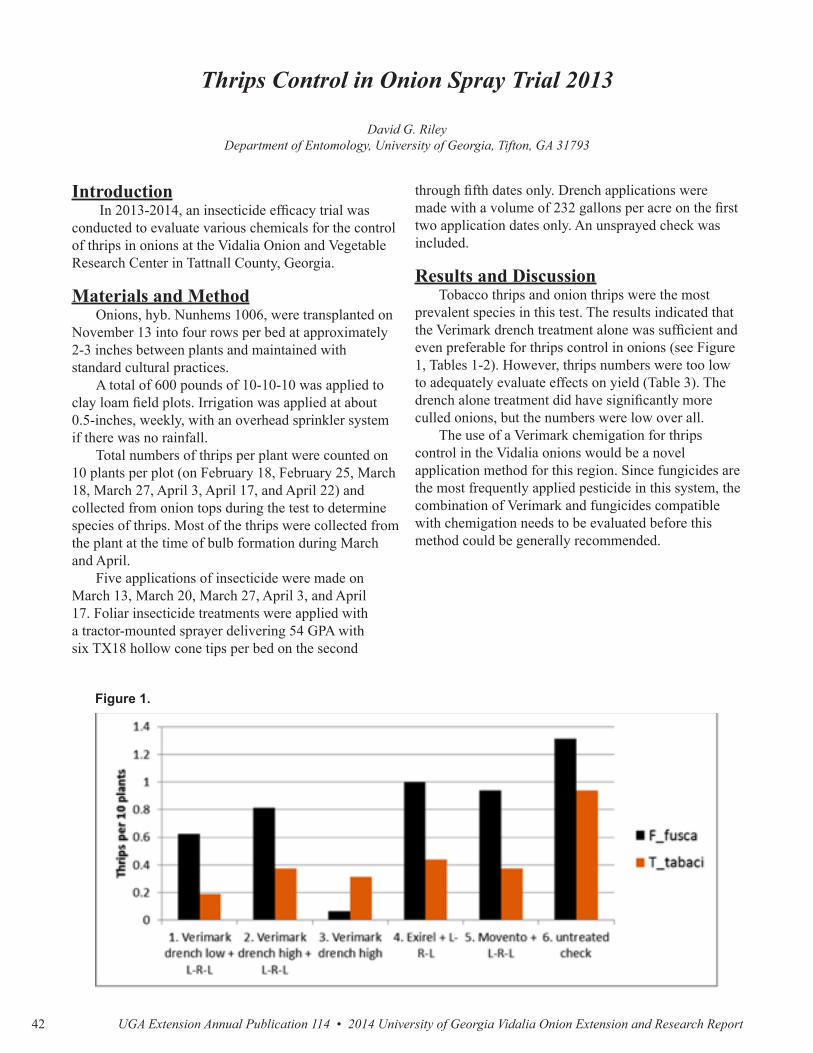
UGA Extension Annual Publication 114 • 2014 University of Georgia Vidalia Onion Extension and Research Report42
Thrips Control in Onion Spray Trial 2013
David G. Riley Department of Entomology, University of Georgia, Tifton, GA 31793
Introduction In 2013-2014, an insecticide efficacy trial was
conducted to evaluate various chemicals for the control of thrips in onions at the Vidalia Onion and Vegetable Research Center in Tattnall County, Georgia.
Materials and MethodOnions, hyb. Nunhems 1006, were transplanted on
November 13 into four rows per bed at approximately 2-3 inches between plants and maintained with standard cultural practices.
A total of 600 pounds of 10-10-10 was applied to clay loam field plots. Irrigation was applied at about 0.5-inches, weekly, with an overhead sprinkler system if there was no rainfall.
Total numbers of thrips per plant were counted on 10 plants per plot (on February 18, February 25, March 18, March 27, April 3, April 17, and April 22) and collected from onion tops during the test to determine species of thrips. Most of the thrips were collected from the plant at the time of bulb formation during March and April.
Five applications of insecticide were made on March 13, March 20, March 27, April 3, and April 17. Foliar insecticide treatments were applied with a tractor-mounted sprayer delivering 54 GPA with six TX18 hollow cone tips per bed on the second
through fifth dates only. Drench applications were made with a volume of 232 gallons per acre on the first two application dates only. An unsprayed check was included.
Results and DiscussionTobacco thrips and onion thrips were the most
prevalent species in this test. The results indicated that the Verimark drench treatment alone was sufficient and even preferable for thrips control in onions (see Figure 1, Tables 1-2). However, thrips numbers were too low to adequately evaluate effects on yield (Table 3). The drench alone treatment did have significantly more culled onions, but the numbers were low over all.
The use of a Verimark chemigation for thrips control in the Vidalia onions would be a novel application method for this region. Since fungicides are the most frequently applied pesticide in this system, the combination of Verimark and fungicides compatible with chemigation needs to be evaluated before this method could be generally recommended.
Figure 1.
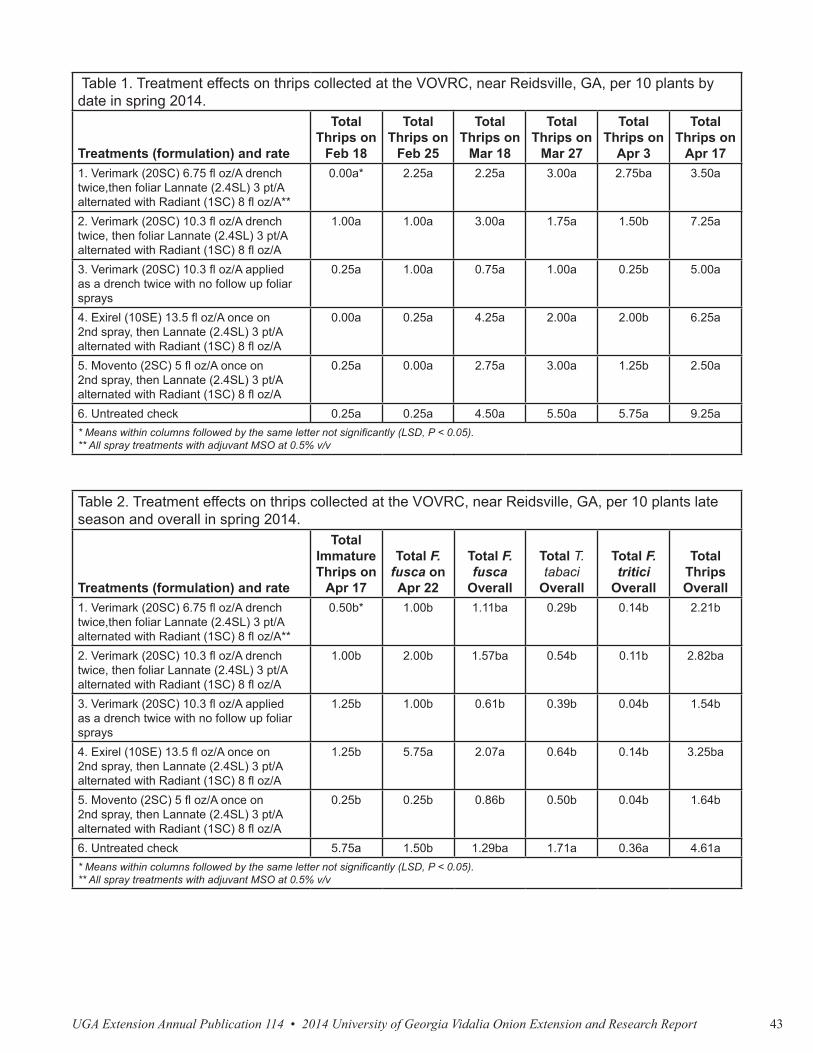
UGA Extension Annual Publication 114 • 2014 University of Georgia Vidalia Onion Extension and Research Report 43
Table 1. Treatment effects on thrips collected at the VOVRC, near Reidsville, GA, per 10 plants by date in spring 2014.
Treatments (formulation) and rate
Total Thrips on
Feb 18
Total Thrips on
Feb 25
Total Thrips on
Mar 18
Total Thrips on
Mar 27
Total Thrips on
Apr 3
Total Thrips on
Apr 171. Verimark (20SC) 6.75 fl oz/A drench twice,then foliar Lannate (2.4SL) 3 pt/A alternated with Radiant (1SC) 8 fl oz/A**
0.00a* 2.25a 2.25a 3.00a 2.75ba 3.50a
2. Verimark (20SC) 10.3 fl oz/A drench twice, then foliar Lannate (2.4SL) 3 pt/A alternated with Radiant (1SC) 8 fl oz/A
1.00a 1.00a 3.00a 1.75a 1.50b 7.25a
3. Verimark (20SC) 10.3 fl oz/A applied as a drench twice with no follow up foliar sprays
0.25a 1.00a 0.75a 1.00a 0.25b 5.00a
4. Exirel (10SE) 13.5 fl oz/A once on 2nd spray, then Lannate (2.4SL) 3 pt/A alternated with Radiant (1SC) 8 fl oz/A
0.00a 0.25a 4.25a 2.00a 2.00b 6.25a
5. Movento (2SC) 5 fl oz/A once on 2nd spray, then Lannate (2.4SL) 3 pt/A alternated with Radiant (1SC) 8 fl oz/A
0.25a 0.00a 2.75a 3.00a 1.25b 2.50a
6. Untreated check 0.25a 0.25a 4.50a 5.50a 5.75a 9.25a* Means within columns followed by the same letter not significantly (LSD, P < 0.05).** All spray treatments with adjuvant MSO at 0.5% v/v
Table 2. Treatment effects on thrips collected at the VOVRC, near Reidsville, GA, per 10 plants late season and overall in spring 2014.
Treatments (formulation) and rate
Total Immature Thrips on
Apr 17
Total F. fusca on Apr 22
Total F. fusca
Overall
Total T. tabaci
Overall
Total F. tritici
Overall
Total Thrips Overall
1. Verimark (20SC) 6.75 fl oz/A drench twice,then foliar Lannate (2.4SL) 3 pt/A alternated with Radiant (1SC) 8 fl oz/A**
0.50b* 1.00b 1.11ba 0.29b 0.14b 2.21b
2. Verimark (20SC) 10.3 fl oz/A drench twice, then foliar Lannate (2.4SL) 3 pt/A alternated with Radiant (1SC) 8 fl oz/A
1.00b 2.00b 1.57ba 0.54b 0.11b 2.82ba
3. Verimark (20SC) 10.3 fl oz/A applied as a drench twice with no follow up foliar sprays
1.25b 1.00b 0.61b 0.39b 0.04b 1.54b
4. Exirel (10SE) 13.5 fl oz/A once on 2nd spray, then Lannate (2.4SL) 3 pt/A alternated with Radiant (1SC) 8 fl oz/A
1.25b 5.75a 2.07a 0.64b 0.14b 3.25ba
5. Movento (2SC) 5 fl oz/A once on 2nd spray, then Lannate (2.4SL) 3 pt/A alternated with Radiant (1SC) 8 fl oz/A
0.25b 0.25b 0.86b 0.50b 0.04b 1.64b
6. Untreated check 5.75a 1.50b 1.29ba 1.71a 0.36a 4.61a* Means within columns followed by the same letter not significantly (LSD, P < 0.05).** All spray treatments with adjuvant MSO at 0.5% v/v

UGA Extension Annual Publication 114 • 2014 University of Georgia Vidalia Onion Extension and Research Report44
Table 3. Treatment effects on onion yield at the VOVRC, near Reidsville, GA, per 30 feet of bed, spring 2014.
Treatments (formulation) and rate
Weight of Colossal Size
Bulbs
Weight of Jumbo Size
BulbsCull Bulb
CountTotal Weight of Bulbs per Plot
1. Verimark (20SC) 6.75 fl oz/A drench twice,then foliar Lannate (2.4SL) 3 pt/A alternated with Radiant (1SC) 8 fl oz/A**
30.1a* 137a 12.3b 174a
2. Verimark (20SC) 10.3 fl oz/A drench twice, then foliar Lannate (2.4SL) 3 pt/A alternated with Radiant (1SC) 8 fl oz/A
45.5a 153a 11.8b 204a
3. Verimark (20SC) 10.3 fl oz/A applied as a drench twice with no follow up foliar sprays
49.1a 141a 19.0a 193a
4. Exirel (10SE) 13.5 fl oz/A once on 2nd spray, then Lannate (2.4SL) 3 pt/A alternated with Radiant (1SC) 8 fl oz/A
41.2a 147a 7.0b 196a
5. Movento (2SC) 5 fl oz/A once on 2nd spray, then Lannate (2.4SL) 3 pt/A alternated with Radiant (1SC) 8 fl oz/A
42.0a 152a 12.3b 201a
6. Untreated check 34.4a 146a 11.3b 186a* Means within columns followed by the same letter not significantly (LSD, P < 0.05).** All spray treatments with adjuvant MSO at 0.5%

UGA Extension Annual Publication 114 • 2014 University of Georgia Vidalia Onion Extension and Research Report 45
Annual Report of the Vidalia Onion Research Laboratory University of Georgia – Tifton Campus
Anthony Bateman and Juan Carlos Diaz-Perez Department of Horticulture, UGA Tifton, 2360 Rainwater Road, Tifton, GA, 31793
IntroductionThe Vidalia Onion Research Laboratory facilitates many post-harvest activities. Be it shelter, equipment, or
cold or controlled atmospheric storage, the Onion Lab supports a wide array of vegetable and fruit research. This report lists the users and their usage of this facility for the 2012-2013 season.
Table 1. Experiments requiring CA storage.Researcher(s) Crop(s) Experiment Number
RoomsStorage specifications Duration
(months)Gitaitis, Torrance, Riner, Diaz
Onion Variety Trial 4 34°F + 70% RH3% O2 + 5% CO2 + 92% N2
4
Diaz Onion Storage 4 34°F + 70% RHCA
3% O2 + 5% CO2 + 92% N2Ozone @ 2-3.0 ppm/hrPre-storage fumigation
SO2 (1hr trt @ 1000 and 2000 ppm)
2
Diaz Onion Storage 1 34°F + 70% RH3% O2 + 5% CO2 + 92% N2
2
Picha, Diaz Sweet Potato Storage 8 38°F + ambient conditionsRegular air
45°F + ambient conditionsRegular air
58°F + ambient conditionsRegular air
CA45°F + 90% RH
5% O2 + 10% CO2 + 85% N258°F + 90% RH
5% O2 + 10% CO2 + 85% N238°F + 90% RH
5% O2 + 95% N245°F + 90% RH
5% O2 + 95% N258°F + 90% RH
5% O2 + 95% N2
0.75
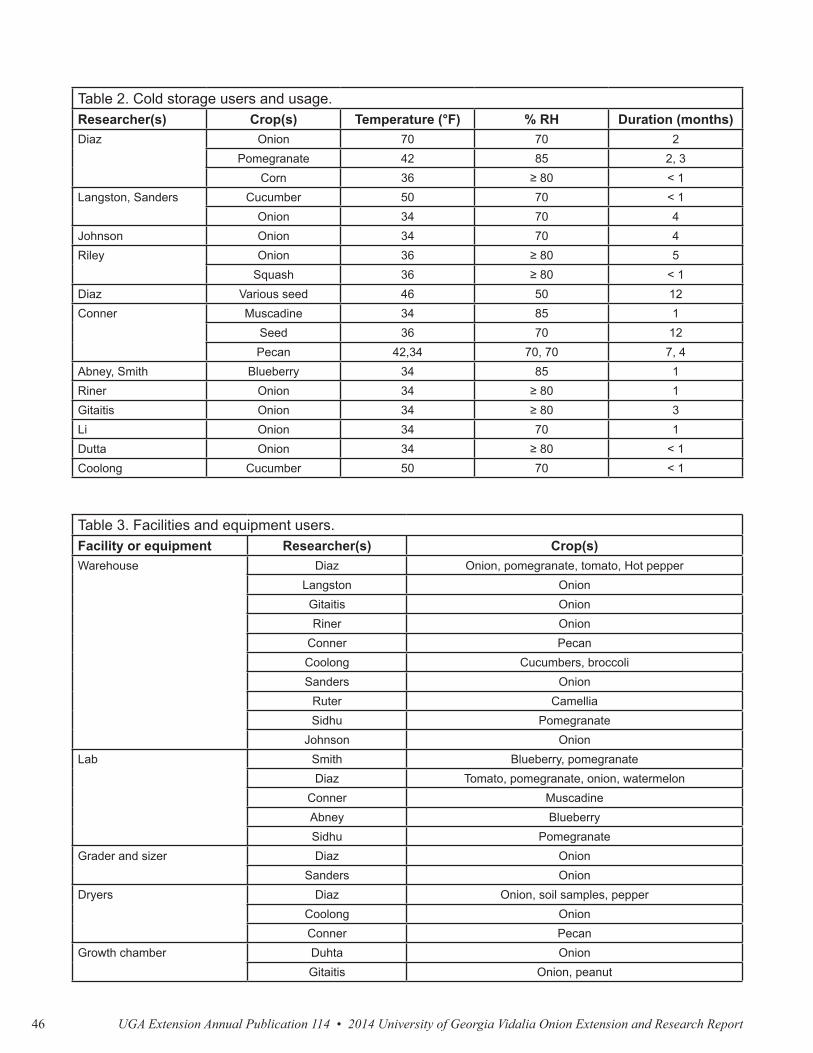
UGA Extension Annual Publication 114 • 2014 University of Georgia Vidalia Onion Extension and Research Report46
Table 2. Cold storage users and usage.Researcher(s) Crop(s) Temperature (°F) % RH Duration (months)Diaz Onion 70 70 2
Pomegranate 42 85 2, 3Corn 36 ≥ 80 < 1
Langston, Sanders Cucumber 50 70 < 1Onion 34 70 4
Johnson Onion 34 70 4Riley Onion 36 ≥ 80 5
Squash 36 ≥ 80 < 1Diaz Various seed 46 50 12Conner Muscadine 34 85 1
Seed 36 70 12Pecan 42,34 70, 70 7, 4
Abney, Smith Blueberry 34 85 1Riner Onion 34 ≥ 80 1Gitaitis Onion 34 ≥ 80 3Li Onion 34 70 1Dutta Onion 34 ≥ 80 < 1Coolong Cucumber 50 70 < 1
Table 3. Facilities and equipment users.Facility or equipment Researcher(s) Crop(s)Warehouse Diaz Onion, pomegranate, tomato, Hot pepper
Langston OnionGitaitis OnionRiner Onion
Conner PecanCoolong Cucumbers, broccoliSanders Onion
Ruter CamelliaSidhu Pomegranate
Johnson OnionLab Smith Blueberry, pomegranate
Diaz Tomato, pomegranate, onion, watermelonConner MuscadineAbney BlueberrySidhu Pomegranate
Grader and sizer Diaz OnionSanders Onion
Dryers Diaz Onion, soil samples, pepperCoolong OnionConner Pecan
Growth chamber Duhta OnionGitaitis Onion, peanut


Annual Publication 114 June 2015
The University of Georgia and Fort Valley State University, the U.S. Department of Agriculture and counties of the state cooperating. UGA Extension offers educational programs, assistance and materials to all people without regard to race, color, national origin, age, gender or disability.
The University of Georgia is committed to principles of equal opportunity and affirmative action.
extension.uga.edu/publications