2014_05-21_oecd-eclac-pse eu-lac forum_forster
TRANSCRIPT

INCOME INEQUALITY, REDISTRIBUTION AND
SOCIAL PROTECTION IN THE OECD AREA
Michael Förster
Directorate for Employment, Labour and Social Affairs,Social Policy Division
www.oecd.org/social/inequality.htm
2nd European-Latin America Economic ForumEurope and Latin America in the wake of global paradigm shifts
and new trends in the world economy20 – 21 May 2014

2/20
1. TRENDS: How have income inequalities developed over the longer run and during the Great Recession?
2. CAUSES: What are the major underlying forces behind increases in inequality?
3. REMEDIES: Which policies are most promising to counter increases in inequality?
Questions addressed in recent OECD work (Growing Unequal?, Divided We Stand..)

3/20
Large country differences in levels of income inequality
Data refer to 2011 or latest year available. Source: OECD Income Distribution Database (www.oecd.org/social/inequality.htm).Note: the Gini coefficient ranges from 0 (perfect equality) to 1 (perfect inequality). Gaps between poorest and richest are the ratio of average income of the bottom 10% to average income of the top 10%. Income refers to cash disposable income adjusted for household size.

4/20
Income inequality before and since the Great Recession: the facts
Long-term trends in inequality of disposable income (Gini coefficient)
Source: OECD Income Distribution Database, www.oecd.org/social/income-distribution-database.htmNote: Income refers to disposable income adjusted for household size.

5/20
.. only a few countries with high starting levels recorded drops in inequalityLong-term trends in inequality of disposable income, cont.
Source: OECD Income Distribution Database, www.oecd.org/social/income-distribution-database.htmNote: Income refers to disposable income adjusted for household size.
6/20
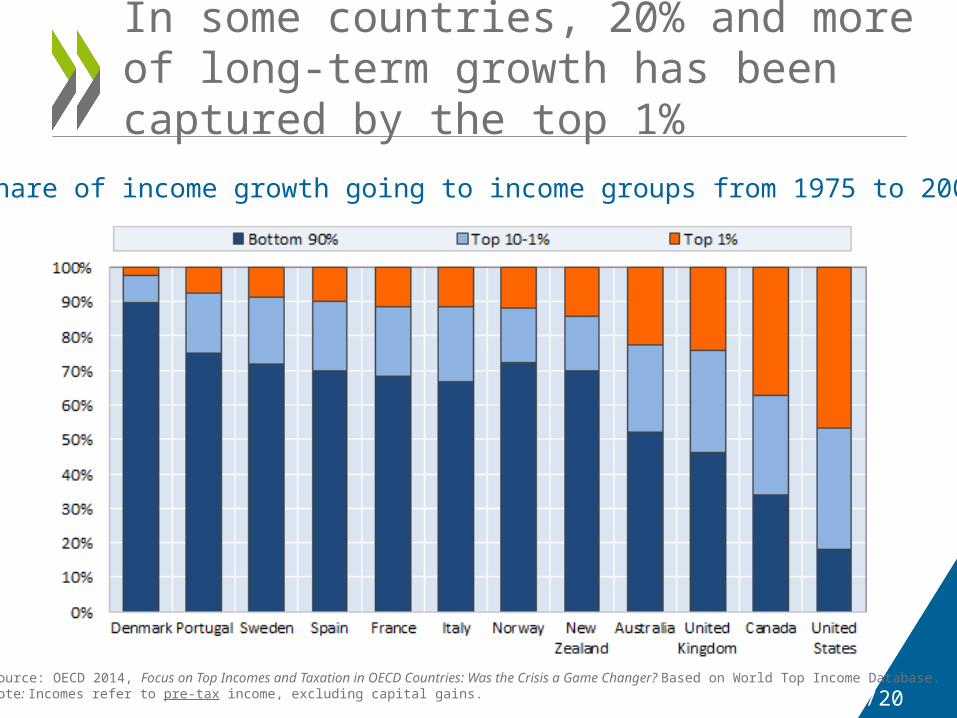
In some countries, 20% and more of long-term growth has been captured by the top 1%
Share of income growth going to income groups from 1975 to 2007
Source: OECD 2014, Focus on Top Incomes and Taxation in OECD Countries: Was the Crisis a Game Changer? Based on World Top Income Database. Note: Incomes refer to pre-tax income, excluding capital gains.

7/20
• Income inequality increased in a large majority of OECD countries over the past 2-3 decades, including in traditionally more equal countries;
• Only a few high-inequality countries bucked the trend (mainly LAC): there was thus some convergence towards higher inequality across OECD countries;
• Income inequality increased during both recession and boom periods and despite employment growth, up to the recession;
• In many countries, income inequality increased especially at the top;
• OECD countries recorded a historically high level of inequality as they were shattered by the crisis in 2008.
Summary of the key stylised facts on trends in income inequality over the past 3 decades

8/20
No direct effect:– Globalisation (trade, FDI)
Ambiguous effects:– Changes in regulations and institutions
Lesser culprit:– Changing household/family structures
Main culprits:– Skill-biased technological changes– Changes in employment patterns and working conditions– Weaker redistribution via the tax/benefit system
Off-setting factor:– Increase in education levels off-set much of the drive towards
rising inequality
OECD evidence on the main drivers of rising inequality in OECD countries

9/20Source: OECD 2013, Crisis squeezes incomes and puts pressure on inequality and poverty. Note: Data refer to the working-age population.
Inequality of (gross) market and disposable (net) income, working-age persons
Redistribution through taxes and benefits plays an important role in almost all OECD countries

10/20
Among the two instruments, cash transfers play a more significant role, especially in Europe
Source OECD 2014, preliminary data. Note: Data refer to the working-age population.
Respective redistributive effects of direct taxes and cash transfers, 2011

11/20
.. but redistribution became weaker in most OECD countries until the onset of the crisis
Source: OECD Income Distribution Database, www.oecd.org/social/income-distribution-database.htm
Percentage reduction of income disparity through taxes and transfers, working-age persons

12/20
• Changes in overall redistribution were mainly driven by benefits: taxes also played a role, but to a lesser extent;
• Spending levels have been a more important driver of these changes than tighter targeting of benefits;
• Spending shifted towards “inactive” benefits, leading to reduced activity rates and higher market-income inequality.
Why have tax/benefit systems become less successful at reducing inequality?

13/20
Social services taken together have an important redistributive impact
• With 13% of GDP, in-kind transfers are higher than all cash transfers together (11%)
– Highest in Sweden and Denmark (20%), lowest in Estonia and Slovak Republic (10%)
• If services were imputed in income, household resources would increase by 28%, …
• … inequality would decrease by one fifth,...
• … and poverty would fall by 40% (or more).

14/20
Public services reduce inequality by a fifth, on average
Household income inequality (Gini coefficients) before and after accounting for public services
Source: OECD 2011, Divided we Stand. Note: Services include public services for education, health, social housing, child care and elderly care.

15/20
• In many countries, the welfare state has prevented income inequality going from bad to worse in the first years of the Great Recession (2007 – 2010)…
• …but as the jobs crisis persists and fiscal consolidation takes hold, there is a growing risk of further rising inequality and poverty.
Income distribution trends during the crisis in the OECD area: The bottom line

16/20
During the 1st phase of the crisis, market income inequality rose considerably
Source: OECD Income Distribution Database, www.oecd.org/social/income-distribution-database.htm Note: Data refer to the working-age population.
Percentage point changes in inequality of household market and disposable income, 2007 - 2010

17/20
Initial crisis response raised social protection
Changes to redistribution policies, mid-2008 – 2010
Source: OECD (2011), Economic Crisis and Beyond: Social Policies for the Recovery. OECD Ministerial Meeting on Social Policy.

18/20
Social transfers are more often part of consolidation plans than other areas of public spending
Source: OECD 2014, Society at a Glance, www.oecd.org/fr/social/panoramadelasociete.htm Reading note: 70% of ocuntris have vplanned to cut welfare spending on working-age transfers in 2012.
Major programme measures in fiscal consolidation plans, by area of public spending: percent of countries participating

19/20
Both redistribution and inclusive employment policies matter
Three main policy avenues to tackle too-high inequality:
• Reforming tax and benefit systems : Government transfers (cash and in-kind) have an important role to play to safeguard low-income households.There is also scope for reviewing some tax provisions in light of increased “tax capacity" among top-income households;
• Boosting employment and career prospects (“more and better jobs”) : Facilitate and encourage access to employment for under-represented groups and address labour market segmentation;
• Investing in human capital: Promote up-skilling of the workforce, better training and education for the low-skilled.
Policy lessons from OECD work

Thank you for your attention!
www.oecd.org/social/inequality.htm
Follow us on Twitter:@OECD_Social