2014/15 winter program
DESCRIPTION
2014/15 Winter Program. Program Rates, Limits, and Potential Costs. Analysis Group May 23, 2014. Oil Inventory Program : Program Design. Analysis Group has been asked by ISO-NE to help review possible rates, limits and costs associated with its 2014-15 Winter Program - PowerPoint PPT PresentationTRANSCRIPT

BOSTON CHICAGO DALLAS DENVER LOS ANGELES MENLO PARK MONTREAL NEW YORK SAN FRANCISCO WASHINGTON
2014/15 Winter ProgramProgram Rates, Limits, and Potential Costs
Analysis GroupMay 23, 2014

PAGE 2
Analysis Group has been asked by ISO-NE to help review possible rates, limits and costs associated with its 2014-15 Winter Program
This presentation provides information relevant to setting the rates for the unused oil inventory and unused contracted LNG (“unused fuel inventory”) program, and provides potential costs for the unused fuel inventory, dual fuel commissioning, and demand response programs.
Factors to consider in setting the Unused Oil Inventory Program rate
Rate is based on an assessment of the costs to hold oil inventory given carrying costs, hedging costs and liquidity risks
Unused Oil Inventory Program Rate would be applied consistently across programs
Assessment of potential costs
Unused Oil Inventory Unused Contract LNG Dual Fuel Commissioning Program Demand Response Program
Oil Inventory Program: Program Design

PAGE 3
Generator decisions about the quantity and timing of oil inventory purchases will reflect a number of factors:
The need to meet market obligations – e.g., Capacity Supply Obligations
The potential for infra-marginal supply in energy markets (available inventory provides an energy market supply option)
Expectations regarding ability to replenish oil inventory over various time scales (tomorrow, next week, next month, etc.)
Costs and risks of holding unused oil inventory
The fixed rate for the Unused Oil Inventory Program should be designed to mitigate inventory costs and risks, recognizing asset owners have other incentives for establishing inventory (supply obligations, infra-marginal returns)
Oil Inventory Program: Establishing the Rate

PAGE 4
Holding Cost estimates: four types of costs and risks are quantified Carrying Cost – the opportunity cost of dollars invested in securing oil
inventory, over the time period that inventory is held
Price Risk – the risk that prices decrease subsequent to purchase of oil inventory
Availability Cost – compensation to cover expected availability charge
Liquidity Risk – the risk that the value of stored oil not used by the end of the winter season can not be easily liquidated
Rate designed as a directional incentive, to mitigate such risks in consideration of these estimates and factors
Need not eliminate 100% of costs/risks for all units – other incentives exist (obligations, inframarginal returns) that are not quantified
Oil Inventory Program: Establishing the Rate
PAGE 5
Carrying cost reflects the opportunity cost of dollars used to purchase inventory
Appropriate cost of capital reflects multiple factors, and depends on treatment of other risks Cost of capital will be lower if other actions are taken to mitigate price risk
(e.g., purchase of put options)
Cost of capital will vary across market participants based on many factors, including size of balance sheet, ability to access capital markets and other constraints on capital and cash flow
Approach to carrying cost considers program risks Firms’ WACC used as a proxy for risk free rate plus premiums for other
risks (liquidity risk, compliance risk, etc.)
Elements of Holding Cost: Carrying Cost
PAGE 6
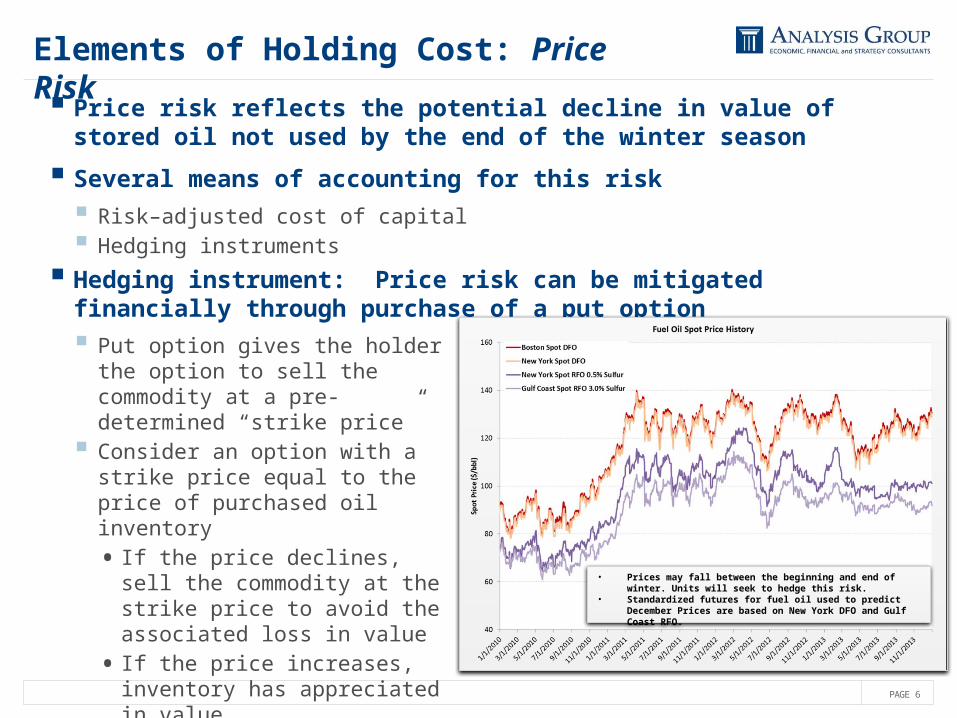
Price risk reflects the potential decline in value of stored oil not used by the end of the winter season
Several means of accounting for this risk
Risk–adjusted cost of capital Hedging instruments
Hedging instrument: Price risk can be mitigated financially through purchase of a put option
Elements of Holding Cost: Price Risk
Put option gives the holder the option to sell the commodity at a pre-determined “strike price”
Consider an option with a strike price equal to the price of purchased oil inventory
• If the price declines, sell the commodity at the strike price to avoid the associated loss in value
• If the price increases, inventory has appreciated in value
• Prices may fall between the beginning and end of winter. Units will seek to hedge this risk.
• Standardized futures for fuel oil used to predict December Prices are based on New York DFO and Gulf Coast RFO.
PAGE 7
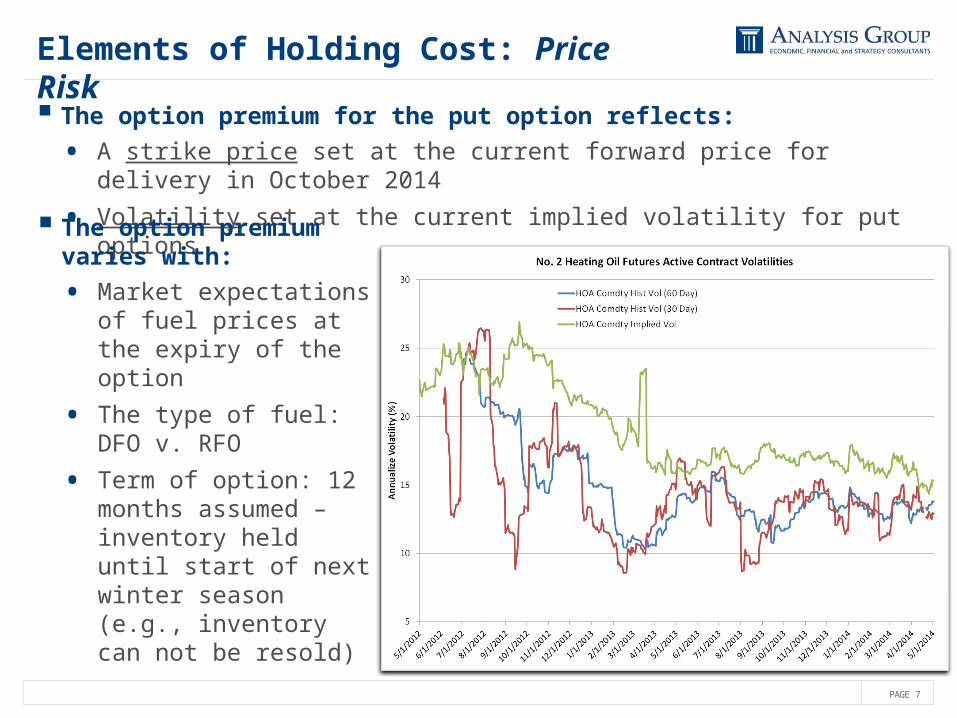
The option premium for the put option reflects:
• A strike price set at the current forward price for delivery in October 2014
• Volatility set at the current implied volatility for put options
Elements of Holding Cost: Price Risk
The option premium varies with:
• Market expectations of fuel prices at the expiry of the option
• The type of fuel: DFO v. RFO
• Term of option: 12 months assumed – inventory held until start of next winter season (e.g., inventory can not be resold)

PAGE 8
Total compensation under the oil inventory program will reflect an Availability Charge
Availability Charge = Program Payment x (100% - Availability Metric)
Program participants can be expected to factor in this charge when determining willingness to participate in the program
Expected Availability Charge will reflect a resource’s expectation about its ability to maintain availability during the winter program (less reliable resources would require higher compensation)
For each resource, holding cost is adjusted upward to reflect expected availability:
Availability Adjusted Holding Cost = Holding Cost / (100% - Availability Metric)
Availability Metric reflects actual unit unavailability, Dec – Feb 2008 – 2014
Capped at 8.7% (Historical weighted average oil unit unavailability)
Accounting for expected charge does not account for all of the risk associated with potential unavailability (e.g., unexpected full winter outage)
Elements of Holding Cost: Availability Charge

PAGE 9
Liquidity risk reflects the risk that excess inventory cannot be sold at the end of the winter period
Treating oil inventory as a financial asset assumes the asset can be sold (liquidated); may not be reasonable for some units due to cost or technical barriers
Several factors potentially affect how liquidity risk affects oil inventory decisions
Cost to resell oil inventory (salvage cost) Risk of extended holding – that is, what is the risk that inventory is not used to
produce energy for an extended period
Liquidity risk and price risk are independent – that is, compensating for liquidity risk will not eliminate the price risk that the fuel oil will have depreciated over the winter months
Liquidity risk can be compensated through a risk premium
A reasonable level for liquidity risk premium would reflect: The discount for reselling inventory Interim payments from ISO for holding inventory
Risk premium implied in WACC for merchant generators sufficient to cover liquidity risk
Elements of Holding Cost: Liquidity Risk

PAGE 10
Unused Oil Inventory Program rate is set based on calculation of holding costs for individual units
Individual unit holding costs calculated using
Carrying cost at generator WACC (from FCM Sloped Demand Curve filing) – assumed to include premiums for liquidity and other non-price risks
12-month put option using existing oil futures price for December 1 and current expectations around volatility
Rate selected to cover holding costs of units sufficient to meet an inventory goal roughly equivalent to the quantity purchased last winter
Result: Rate equal to $18/barrel
Program Costs will depend on oil inventory remaining on March 1
Estimated based on remaining inventory as of February and March in last winter season
High/low estimates based on 100% remaining, and 25% remaining, respectively
Setting Unused Oil Inventory Program Rate

PAGE 11
The rate for the Unused Contracted LNG Program is based upon the Unused Oil Inventory Program rate, converted to $/MMBtu
Result: Rate equal to $3/MMBtu
Program Costs will depend on unused contracted volume remaining on February 28
Estimate based on data on current LNG supply capacity
Estimate under different scenarios of unused contracted LNG remaining match analysis of unused oil inventory program rate
Setting Unused Contracted LNG Program Rate

PAGE 12
Maximum Program Costs would occur in the cases where a large amount of oil inventory or unused contracted LNG remains after the winter
Unused Fuel Inventory Program Costs
Expected Oil Inventory as of
December 1, 2014 (mil bbl)1
Unused Oil Program
Rate ($/bbl)
Maximum Unused
Contracted LNG
(mil MMBtu)2
LNG Equivalent of Unused
Oil Program Rate
($/MMBtu)3
3.54 $18 6.10 $3
Percentage of Expected Unused Oil
Inventory and Unused Contracted
LNG Remaining4
Expected Unused Oil
Program Cost ($ mil)
Expected Unused
Contracted LNG Program
Cost ($ mil)
Combined Unused Fuel
Inventory Program Costs
($ mil)
100% $63.8 $18.8 $82.675.1% $47.9 $14.2 $62.046.4% $29.6 $8.8 $38.425.0% $15.9 $4.7 $20.7
Notes:
[2] Assumed based on 2 day maximum contract volumes.[3] LNG Program Rates are based on the $18/bbl oil program rate. Conversion is done using oil heat content values from EIA data.
[1] Expected Oil Inventory is the quantity of oil approved for payments under the 2013-2014 Winter Program.
[4] 75.1% is the percentage of system-wide December 2013 oil inventory remaining as of March 2014 (after some inventory refills). 46.4% is the percentage of system-wide December 2013 oil inventory remaining as of February 2014, the month of smallest system inventory during winter 2013-2014.
PAGE 13
Costs of recommissioning dual fuel capability typically fall into three categories:
Tuning and testing of controls, burners and nozzles Upgrading or testing of water systems Cleaning and maintenance on tanks
Some of these costs need to be incurred periodically under normal operations (e.g., tank cleaning and maintenance)
Fuel costs associated with testing the unit represent a large portion of expected costs
Cannot rely on performing tests when resource is in-merit (although potentially can schedule to minimize NCPC)
Testing requirements may vary across resources, in particular depending on:
State-level environmental requirements Whether the resource has maintained its permits
Dual Fuel Commissioning Program – Testing Costs

PAGE 14
Potential program costs estimates reflect several assumptions
12 units would participate totaling around 3,500MW of winter capacity NCPC compensation for 20 hours of testing
In practice, hours of testing needed to fully tune the resource could exceed this cap
Resources have the incentive to be efficient, with or without fuel cost recovery
NCPC amount reflects Forecasted fuel prices Net of energy market revenues (using historical October-November
RTLMPs) Resource-specific heat rate and capacity (assuming tests must be
performed at full capacity) Resource-specific start-up costs, assuming 3 cold starts per unit on
the secondary fuel Resource-specific no-load costs for the 20 hours of testing on
secondary fuel
Maximum program costs are estimated at $12.9 million
Dual Fuel Commissioning Program Costs

PAGE 15
Potential program costs estimates reflect several assumptions
Monthly payment and Energy payment costs assume 100 MW of participation
Monthly payment rate is based on the oil program rate: $1.80/kW-month Energy payments are assumed at the average payment rate of last
year’s program Energy payments assume 50 hours of dispatch
Demand Response Program costs are estimated at $2.4 million
Demand Response Program – Program Costs

PAGE 16
Combined Winter Program Costs
Estimate combines the Unused Oil Inventory, Unused Contracted LNG, and Dual Fuel Commissioning Programs
Dual Fuel Commissioning Program costs assumed constant across scenarios
Demand Response Program costs assumed constant across scenarios
Percentage of Expected Unused
Oil Inventory and Unused
Contracted LNG Remaining
Combined Unused Fuel
Inventory Program Costs
($ mil)
Dual Fuel Commissioning
Program Costs
($ mil)
Demand Response
Program Costs
($ mil)
Total Inventory, Dual
Fuel, and Demand
Response Program
Costs ($ mil)
100% $82.6 $12.9 $2.4 $97.875.1% $62.0 $12.9 $2.4 $77.246.4% $38.4 $12.9 $2.4 $53.625.0% $20.7 $12.9 $2.4 $35.9

PAGE 17
Paul HibbardTodd SchatzkiAnalysis Group111 Huntington Avenue, 10th Floor Boston, MA [email protected]