2014/2 - université catholique de louvain
TRANSCRIPT

2014/2
■
The agricultural invasion and the political economy of agricultural trade policy in Belgium, 1875-1900
Maarten Van Dijck and Tom Truyts
Center for Operations Research and Econometrics
Voie du Roman Pays, 34
B-1348 Louvain-la-Neuve Belgium
http://www.uclouvain.be/core
D I S C U S S I O N P A P E R

CORE DISCUSSION PAPER 2014/2
The agricultural invasion and the political economy of agricultural trade policy in Belgium, 1875-1900
Maarten VAN DIJCK 1 and Tom TRUYTS2
January 2014
Abstract
After 1875, cheap grain from the United States and Russia flooded the European markets. Many countries like Germany, France, and Sweden turned to agricultural trade protection, while others, like the UK and Denmark, held on to a free trade position. Belgium adopted a middle position, leaving its grain markets open but protecting animal husbandry, dairy production, and the processing of foodstuffs. The econometric analysis of the votes of Belgian Members of Parliament on four proposals to install protectionist measures on agricultural trade seeks to identify which economic or political interests explain the Belgian policy option.
1 Flemish Heritage Agency, B-1210 Brussels, Belgium; Faculty of Business Economics, University of Hasselt, Belgium. E-mail: [email protected] 2 CEREC, Saint-Louis University, B-1000 Brussels, Belgium; Department of Economics, University of Leuven, B-3000 Leuven; Belgium; Université catholique de Louvain, CORE, B-1348 Louvain-la-Neuve, Belgium. E-mail: [email protected]
We thank Erik Schokkaert, Peter Solar, Johan Swinnen, Leen Van Molle and seminar participants in Leuven, Brussels and Louvain-la-Neuve for their helpful comments. We are grateful to Niels Peeters for research assistance.

3
Introduction
The abolition of protectionist corn laws in all European countries, after 1846, heralded
a period of agricultural free trade. By the late 1870s, the agricultural invasion set this
policy under severe pressure in most European countries. The massive import of
wheat, in particular from Russia and the US, led to a price fall in these products and
sparked a renewed demand for agricultural protection by corn producers. On the other
hand, the industrial depression starting in the 1870s drove industrial producers to seek
protection for industrial products. These elements brought, combined with local
political factors such as the Kulturkampf in Germany, electoral victories to
conservative political parties favouring the imposition of trade tariffs. In Germany,
the elections of 1878 resulted in a government that imposed the protectionist tariff law
of 1879. In France, the Republican government adjusted its agricultural trade policy
starting from 1881 (Aldenhoff-Hübinger 2005). In 1888, after elections in 1887
installed a protectionist government, Sweden followed suit by introducing tariffs on a
number of agricultural and industrial products. Also, Italy, Spain, and the Austro-
Hungarian Empire returned to protection of their home markets. The United Kingdom
and Denmark remained free trade oriented (Bairoch 1976 and 1986, Kindleberger
1978, Tracy 1989, and Irwin 1994).
The different reactions have raised questions on the determinants of agricultural
tariffs in the last quarter of the nineteenth century. Interest-based explanations were
explored by Cheryl Schonhardt-Bailey (1998), Sibylle Lehman (2010), and Lehman
and Oliver Volckart (2011) to explain the German and Swedish return to
protectionism. Kevin O’Rourke (1997) also finds many countries’ reactions to the
agricultural invasion consistent with an interest-based account of trade policy
formation. These interest-based explanations, using the specific factors model and the

4
Heckscher-Ohlin-Samuelson model, seem to work far better for this episode of tariff
history than for the explanation of Corn Law Repeal in the United Kingdom
(McKeown 1989, McLean and Bustani 1999, and Schonhardt-Bailey 2003 and 2006)
and Belgium (Van Dijck and Truyts 2011) in the middle of the century.
In this article, we study the Belgian partial return to agricultural protection in the
1880s and 1890s as a test of interest-based explanations. Belgium is an interesting
case for a number of reasons. First, Belgian tariff policy held a middle position
between the countries that opted for protectionism and the countries that remained on
a free trade course. Second, the Belgian economic structure was very close to the
British one. The share of agriculture in GDP dropped from 37% in 1846 to 23.2% in
1880 and 15.84% in 1895 (Goossens 1992; Blomme 1992, p. 277). Yet unlike the
UK, the outcome of trade policy formation in Belgium led to some protectionist
measures. Third, like in Germany, France, and Sweden, the Belgian election of 1884
brought the conservative Catholic party to power. The Liberal government was
defeated after battles with the Catholic party and clergy over the position of religion
in schools. This ‘school war’ was to some extent comparable to the Kulturkampf in
Germany (Clark and Kaiser 2003). After 1884, with a clear majority in Parliament
and with the agricultural interests agitating for protectionist tariffs, the conservative
government only partially embraced a protectionist policy. Free trade for wheat and
rye was upheld, while products from animal husbandry and food processing were
protected by tariffs. Fourth, the strong statistical tradition of the country, dating back
to the pioneering work of Adolphe Quetelet, provides data of exceptional quality and
quantity at constituency level (‘arrondissement’). This material is used to make an in
depth profile of the constituencies.

5
We study why Belgium did not return to full-fledged agricultural protectionism after
the conservative electoral victory in 1884, but rather chose a middle position between
protectionist Europe (Germany, France, Sweden) and free trade Europe (UK,
Denmark). How did the agricultural invasion and the industrial crisis affect trade
policy? Previous qualitative research has analysed the Belgian tariff policy (Suetens
1955, p. 110-116 and 126-135) and the position of the Catholic (Van Molle 1989 and
2008) and Socialist parties (Craeybeckx 1973 and 1974; Hüberman 2008) towards the
countryside and agricultural policy, but these studies have not systematically analyzed
interest-based explanations of the Belgian tariff policy.1 We study the votes of the
Belgian Members of Parliament on four proposals to reinstate trade protection. In our
roll-call analysis, we analyse the relative importance of personal economic interests,
party politics, ideology, and the economic and demographic interests of
Representatives’ constituencies as determinants of voting.
Belgium’s trade policy 1875-‐1900
Around 1875, the price decline of wheat and rye on the world market became tangible
in Belgium (Figure 1). The average wheat price between 1860 and 1870 was 30.35
Belgian Franks for 100kg, while the five year average between 1868 and 1872 was as
high as 31.6 fr/100kg. This dropped to a five year average around 1895 of 15.68
fr/100kg (Gadisseur 1990, p. 756-761). Likewise, the price of rye was halved. The
price of meat fell with 25%, and most products of animal husbandry fetched much
lower prices. The agricultural interests in Belgium started to demand protectionist
tariffs, a demand that became louder after the German adoption of protectionist tariffs
in 1879. With prices decreasing further at the beginning of the 1880s and the national

6
elections of 1884 coming closer, the cry for agricultural protection was voiced in
Parliament by a number of Catholic politicians.
Figure 1: Prices and import of wheat and rye
The elections of 10 June 1884 brought a large scale victory for the Catholic party. The
agricultural crisis was one major election theme, but only one next to the budget,
military policy, and the school war (Van Molle 1989; Lamberts and Lory 1986). The
school war in particular was the major bone of contention. In 1879 and 1881 the
Liberal government voted a law that extended and secularised the network of public
schools. This led to a protracted polarization between Catholics and Liberals and to
the foundation of a Federation of Catholic political organisations in 1884 (Wils 1986).
After the electoral victory of June 1884, the Catholic party dominated Belgian
Parliament up to the First World War . The Catholic government strengthend the

7
network of Catholic schools in the subsequent years, making the polarisation of
political life even stronger (Deneckere 2005, p. 477-500).
After 1884 agricultural tariffs became an issue that was discussed continuously and
intensely for over a decade. In the 1830s and 1840s, the Catholic party had been
protectionist minded, but it had left this position for a free trade stance in the 1850s
and beyond (Van Dijck 2008; Van Dijck and Truyts 2011). When agricultural prices
began to drop in the 1870s, it were Catholic party members that voiced a preference
for tariffs to protect grain production and animal husbandry. The Catholic party was
clearly stronger in the more rural districts in the north, while the political strongholds
of the Liberals and later the Socialists were the cities and industrial centers of the
provinces of Liège and Hainaut (De Smaele 2009). Yet, a substantial number of
Catholic representatives, under the leadership of their prime minister August
Beernaert, resisted agricultural tariffs. The majority of the Liberal representatives, and
after 1894 the majority of the Socialists, defended a free trade policy (Craeybeckx
1973 and 1974; Hüberman 2008). Within a year after the election of 1884, a group of
four Catholic representatives consisting of Eugène Dumont, Jules de Burlet, Léon
Pastur, and Georges Snoy proposed tariffs on livestock, meat, cereals and flour.
Because of the evolution of the prices, so the submitters of the bill upheld, the value
of agricultural lands was declining and so were the rents. On 10 July 1885 the House
of Representatives rejected the two articles contained in this bill, proposing on the one
hand tariffs for cereals and on the other hand tariffs on live animals and meat (Van
Molle 1989, p. 132).
A number of Catholic representatives insisted on demanding agricultural tariffs after
July 1885. Dumont, de Burlet, Pastur and Snoy introduced a new bill on 15 December
1885, which was defended by a group of Catholic representatives and the Catholic

8
minister of agriculture. However, this new bill did not include tariffs on wheat and
rye. From now on the debate centered on tariffs on animals and meat. Although the
Catholic prime minister, Beernaert, and a number of Catholic representatives objected
tariffs for livestock and meat, this proposal eventually led to the law of 18 June 1887,
which raised moderate tariffs for livestock and meat (Suetens 1955, p. 116; Van
Molle, 1989, p. 129-133). The discussion on the bill only started in April 1887, as
political life was interrupted by riots in the industrial centers in March 1886. The
reaction of the police and army left 28 laborers dead. The riots had as a consequence,
besides the start of a hesitating social policy, that tariffs on breadgrains could easily
be depicted as a misery tax that would cause land rents to rise. This would only be in
the interest of the landed classes (Suetens 1955, p. 115). After 1886 no further
legislative initiative was taken to introduce taxes on basic breadgrains.
Between 1890 and 1894, different bills or amendments were introduced to expand the
protectionist measures, but it never came to a vote for various political reasons (Van
Molle 1989, p. 134-136). This changed after March 1894 when the free trade minded
prime minister Beernaert was replaced by de Burlet, one of the architects of the
protectionist proposals in 1885 and the law of 1887 after political differences in the
Catholic party over the tariff question and the reform of the franchise. This and the
electoral victory of October 1894 opened the way for the general tariff law of 12 July
1895.
The election of 14 October 1894 was the first election in Belgian history with general
male franchise.The agricultural crisis was a major election theme because the
Catholics feared that the Socialists would pilfer the farmers’ votes. Both the Liberals
and the Socialists sought a clear position towards the farming population (Craeybeckx
1973 and 1974). However, the Catholics secured an owerwhelming majority in 1894

9
(104 out of 152 seats) with a number of policy measures aimed specifically at the
countryside (Van Molle 2008). The Liberals only retained 20 seats in the Lowerhouse
out of 61 before the election and for the first time in Belgian history, 28 Socialist
representatives entered Partliament (Luykx 1985, p. 178 and 208).
The ensuing general tariff law of 12 July 1895 did not introduce tariffs for grain, a
subject that remained taboo in Parliament, despite the Catholic farmers organisations
agitating strongly for grain tariffs. Neither did it increase the tariffs on livestock and
meat. The law of 1895 did introduce tariffs on cacao, canned foodstuffs, honey, fresh
and dried fruits, cream and milk, gingerbread, flour, pasta, butter and margarine, a
number of luxury goods (such as saffron, foie gras, and truffles), and finally one kind
of cereal: oats. The law also provided protectionist tariffs for a number of textiles,
clothing, tapestry, books, cast iron and ironware, musical instruments, leatherware,
watches, hides, perfumes, soap, and so on (Moniteur belge 14 July 1895, p. 2553-
2560). The general idea of the protectionist laws of 1887 and 1895 was to orient
Belgian agriculture towards the fattening up of livestock, dairy production, fruit and
vegetables, and the processing of food. These products and activities were more suited
to the Belgian agricultural structure, dominated by small farms, and provided for a
higher added value (Van Molle 2008, p. 164).
The winners and losers of free trade: research hypotheses
Our econometric analysis understands a Member of Parliament’s preferences in the
votes on the two proposals of 1885 and the laws of 1887 and 1895 as a trade-off
between his personal convictions and party affiliation, his personal economic
interests, and the interests of his constituency, which he must serve to ensure re-
election. O’Rourke 1997, Schonhardt-Bailey 1998, and Lehman 2010 have explained

10
the typical theoretical framework, the specific factors and the Heckscher-Ohlin-
Samuelson models, used to formulate hypotheses about the interests of the different
players in the choice of trade policy. We confront this framework with the Belgian
economic structure to formulate our research hypotheses.
The specific factors model holds that labor is immobile between sectors (specific) and
that therefore the workers and employers in a certain sector have the same sectoral
interest. If so, then sectoral interests can be determined from trade balances. Figure 2
depicts the Belgian trade balance for the period 1860-1910 for seven goods and shows
which sectors were exporting and which were import-competing. In the second half of
the nineteenth century, Belgium became an importer of foodstuffs and an exporter of
industrial products. The wheat producers were most severely hit by the agricultural
invasion. Livestock had a small net shortage. The self-sufficiency for bread grains
plummeted from 62.6% in 1880 to 27.8% in 1910, while the self-sufficiency for meat
increased from 85.4% to 95.6% (Blomme 1992, p. 282). Based on the agricultural
trade balances, livestock and wheat producers would be expected to favor
protectionism very strongly.
Figure 2: Trade balance 1860-1910: net export (in 1000 fr.)

11
On the other hand, Figure 2 shows that Belgium had a number of strong industrial
exporting sectors: machines, iron and steel, and primary products such as coal. We
expect these industries to be in favor of free trade. Belgium had been strong in
textiles, but this sector slowly turned from exporting to import-competing, and would
therefore have shifted from a free trade position to favoring protectionism in the first
five years of the 1890s. The recovery of the textile sector after 1895 may itself have
been the result of the imposed import tariffs.
However, a number of migration researchers have shown that labor was mobile. As
the wages were higher in industry, a number of land laborers migrated from the
countryside to the industrial centers (Schepens 1973; Stengers 1978; Goddeeris and
Hermans 2012). The development of the Belgian industrial sector meant that labor
could find an alternative income outside agriculture. The absolute number of farmers
remained stable around 775,000 between the middle of the century and 1896, but the

12
relative importance of agricultural employment dropped quickly from just under 50%
in 1846 to about 25% around 1900 (Klep 1976; Blomme 1992). After the end of the
industrial crisis around 1895, the employment in the agricultural sector also
descended in absolute terms (De Brabander 1983, p. 36, 46 and annex B; De Moor
2001). The number of land laborers decreased from 180,000 in 1880 to 161,000 in
1910. As this indicates a certain amount of sectoral mobility, the laborers would be
expected to be in favor of free trade. This is consistent with the viewpoint of the
Socialists and liberal progressivists as described by Jan Craeybeckx (1973, p. 228)
and Michael Hüberman (2008).
Because labor was to a certain extent mobile, we have a closer look at the Heckscher-
Ohlin-Samuelson model. The Heckscher-Ohlin-Samuelson model understands
differences in the relative scarcity of various production factors as an important
motivation for international trade. Countries can produce goods more cheaply when
this production intensively uses relatively abundant production factors. Countries will
export such goods, and import goods produced predominantly with more scarce
factors. Trade thus stimulates demand for abundant production factors and reduces
demand for relatively scarce factors. Therefore, trade benefits owners of the former
and harms owners of the latter. We then particularly expect owners of relatively
scarce production factors to request trade protection.
In Belgium capital and labor were the relatively abundant factors. Labor, being
mobile, would generally be in favor of free trade. As capital was relatively abundant
in Belgium, the most capital intensive heavy industries, such as coal, steel, and
machine building, would be in favor of free trade. However, the position of the
owners of textile companies, an activity that was much less capital intensive, is
unclear.

13
Relatively speaking, steamships and the development of large-scale agriculture in the
U.S. and Russia made land much more scarce in Belgium. Indeed, one of the main
effects of the agricultural invasion was the lowering of the value and rent of land
(O’Rourke 1997). In Belgium, the rents dropped in a spectacular manner between
1870 and 1895. In real terms, Belgian leases went down on average with 23%
(Vanhaute 2001, p. 31 and 34). This indicates that landowners would be in favor of
protection - in particular those in the constituencies with the largest share of wheat
growing. We divide all constituencies into four quartiles according to the share of
agricultural land used for growing wheat. Figure 3 depicts the evolution of the
average lease prices of agricultural land for these four quartiles and illustrates how
lease prices were higher where the land allowed for more wheat production. Most
important for our analysis, Figure 3 shows that the decline in lease prices was the
steepest in constituencies specialized in growing wheat.
Figure 3: Average lease prices of fields (quartiles in % agricultural land for wheat in
1866)
But what was the position of the small farmers who received voting rights in 1893?
Lehman (2010, p. 151-152 and 154) and Schonhardt-Bailey (1998, p. 302) argue that

14
the policy preference of the agricultural sector was not homogenous, but depended on
farm size and specialization. It would be rational for large farms, specialized in land-
intensive products such as grain, to be in favor of protectionism. For small farms
specialized in labor intensive products, such as fruits and vegetables, or less land-
intensive products, such as livestock and dairy products, it would be rational to be in
favor of free trade. The Belgian agricultural structure was one of smallholdings where
population pressure, the equal division of inheritances, and the division of land into
smaller units by landlords accelerated the fragmentation of farms in the second half of
the nineteenth century. In 1895 ca. 635,000 farms (76.5% of all farms) were smaller
than 2 hectare. Vanhaute estimated that 2 ha was the limit to make a distinction
between households in which farming provided a sub-income and real commercial
agricultural exploitations (Vanhaute 1993). In 1880, 472,000 farms were even smaller
than 0.5 ha. These smallholdings produced almost exclusively for their own needs and
only brought occasional surpluses to the market (Segers and Van Molle 2004, p. 56).
The average farm size in Belgium was 2.3 hectare, much smaller than Denmark (14
ha), Great-Britain (12 ha), or Germany (6 ha). According to Vanhaute (2001)
exploitations smaller than 20 ha accounted for two thirds of the agricultural area. It
should follow from this structure that a large share of Belgian agriculture would be in
favor of free trade. The country counted less than 4,000 farms that were bigger than
50 hectare. These were concentrated in the heavy clay region that ran south of
Brussels from the west of the country to Liège in the east (districts of Tournai, Ath,
Soignies, Nivelles, Gembloux, and Waremme). It would be expected that farmers in
these districts would be in favor of protection.
15
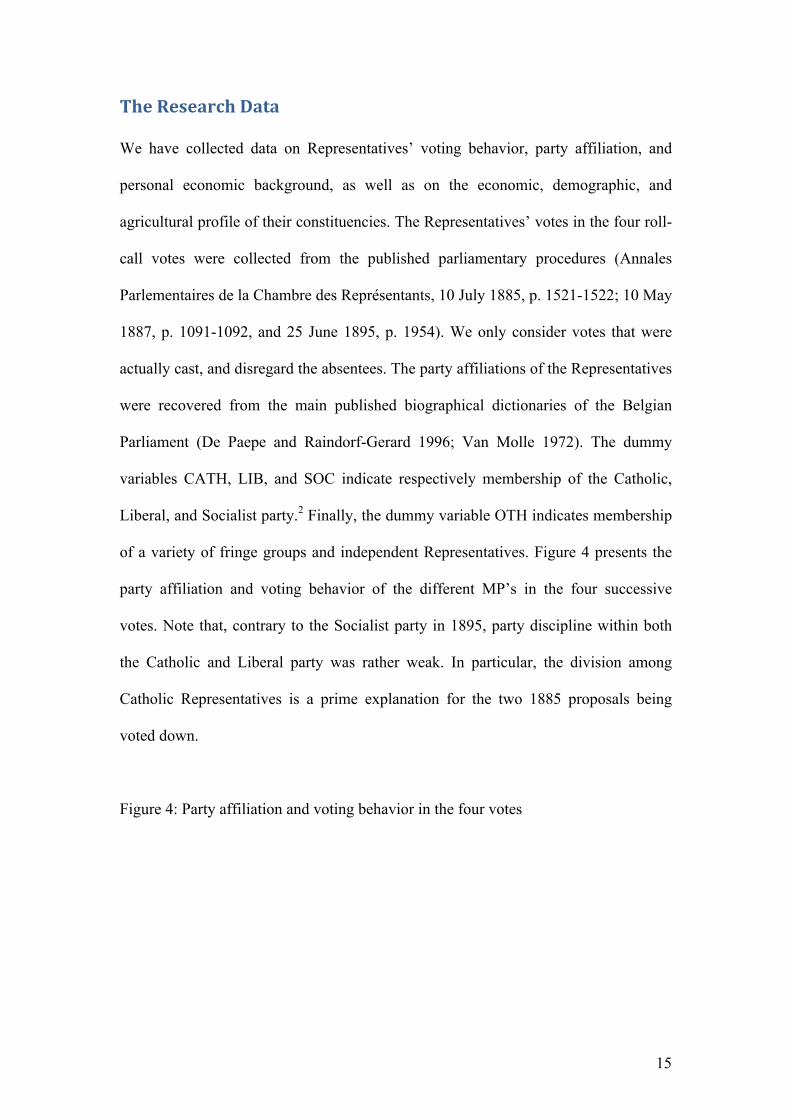
The Research Data
We have collected data on Representatives’ voting behavior, party affiliation, and
personal economic background, as well as on the economic, demographic, and
agricultural profile of their constituencies. The Representatives’ votes in the four roll-
call votes were collected from the published parliamentary procedures (Annales
Parlementaires de la Chambre des Représentants, 10 July 1885, p. 1521-1522; 10 May
1887, p. 1091-1092, and 25 June 1895, p. 1954). We only consider votes that were
actually cast, and disregard the absentees. The party affiliations of the Representatives
were recovered from the main published biographical dictionaries of the Belgian
Parliament (De Paepe and Raindorf-Gerard 1996; Van Molle 1972). The dummy
variables CATH, LIB, and SOC indicate respectively membership of the Catholic,
Liberal, and Socialist party.2 Finally, the dummy variable OTH indicates membership
of a variety of fringe groups and independent Representatives. Figure 4 presents the
party affiliation and voting behavior of the different MP’s in the four successive
votes. Note that, contrary to the Socialist party in 1895, party discipline within both
the Catholic and Liberal party was rather weak. In particular, the division among
Catholic Representatives is a prime explanation for the two 1885 proposals being
voted down.
Figure 4: Party affiliation and voting behavior in the four votes

16
The personal interests and professional background of the Representatives were
retrieved from the main biographical dictionaries of the Belgian Parliament and of
other Belgian institutions (Schepens 1976; Stengers 1975; Lehoucq and Valcke 1993;
Kurgan-Van Hentenrijk 1996; Caulier-Mathy 1996; De Paepe, and Raindorf-Gerard
1996). The dummy variable PERAGT indicates personal interests in the agricultural
sector as large landowner or agricultural professional. Large landownership was
derived from the lists of voters eligible for the Senate. Eligibility for the Senate
required a very high level of taxes paid, which could in practice only be achieved by
large landowners. Furthermore, Representatives with a professional background as
agricultural industrialists, traders in agricultural machinery or membership of the
advisory agricultural commissions, officials of the farmers movement, and
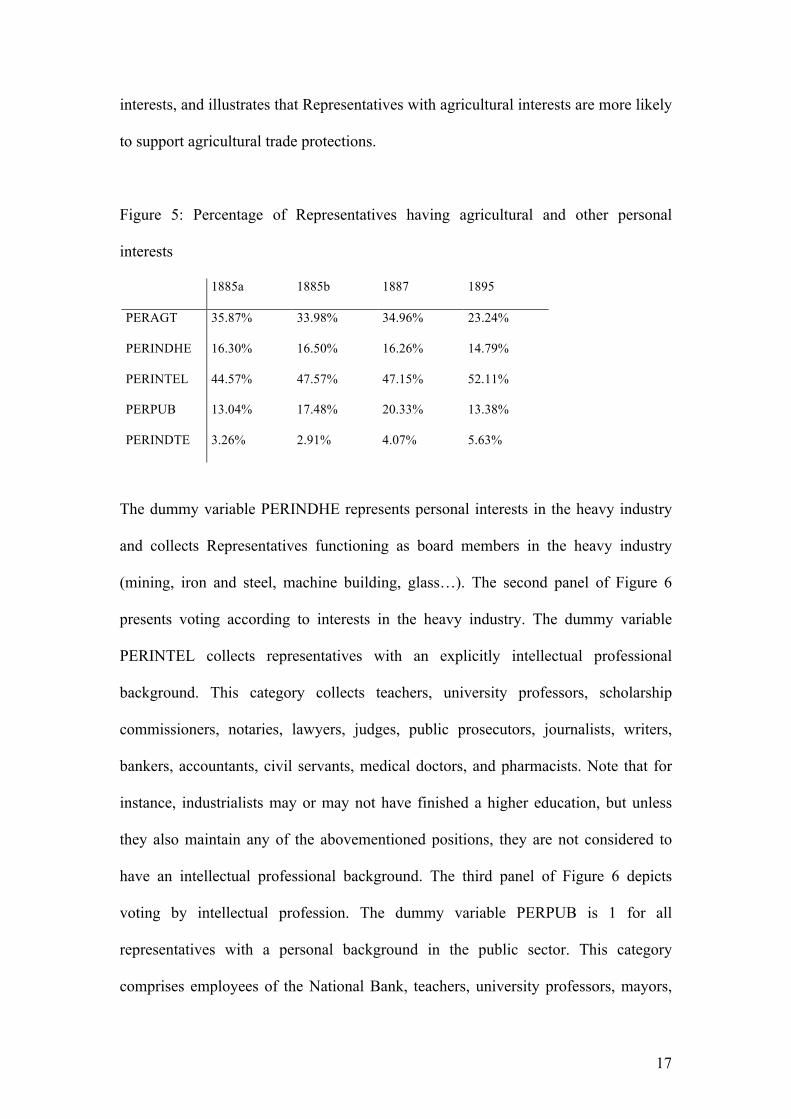
veterinaries are designated as having agricultural interests. Figure 5 depicts the overall
percentage of Representatives having agricultural (and other) interests for each of the
four votes. Figure 6 presents voting of Representatives with and without agricultural
1885a 1885b
CATH LIB SOC OTH total CATH LIB SOC OTH total
Abstention 2 6 0 0 8 Abstention 0 0 0 0 0
Protection 36 3 0 0 39 Protection 38 5 0 0 43
Free trade 19 25 0 9 53 Free trade 21 30 0 9 60
total 57 34 0 9 100 Total 59 35 0 9 103
1887 1895
CATH LIB SOC OTH total CATH LIB SOC OTH total
Abstention 2 0 0 3 5 Abstention 5 0 0 0 5
Protection 62 4 0 3 69 Protection 74 3 1 0 78
Free trade 12 36 0 6 54 Free trade 19 15 29 1 64
Total 76 40 0 12 128 total 98 18 30 1 147
Table: voting by party
17
interests, and illustrates that Representatives with agricultural interests are more likely
to support agricultural trade protections.
Figure 5: Percentage of Representatives having agricultural and other personal
interests
1885a 1885b 1887 1895
PERAGT 35.87% 33.98% 34.96% 23.24%
PERINDHE 16.30% 16.50% 16.26% 14.79%
PERINTEL 44.57% 47.57% 47.15% 52.11%
PERPUB 13.04% 17.48% 20.33% 13.38%
PERINDTE 3.26% 2.91% 4.07% 5.63%
The dummy variable PERINDHE represents personal interests in the heavy industry
and collects Representatives functioning as board members in the heavy industry
(mining, iron and steel, machine building, glass…). The second panel of Figure 6
presents voting according to interests in the heavy industry. The dummy variable
PERINTEL collects representatives with an explicitly intellectual professional
background. This category collects teachers, university professors, scholarship
commissioners, notaries, lawyers, judges, public prosecutors, journalists, writers,
bankers, accountants, civil servants, medical doctors, and pharmacists. Note that for
instance, industrialists may or may not have finished a higher education, but unless
they also maintain any of the abovementioned positions, they are not considered to
have an intellectual professional background. The third panel of Figure 6 depicts
voting by intellectual profession. The dummy variable PERPUB is 1 for all
representatives with a personal background in the public sector. This category
comprises employees of the National Bank, teachers, university professors, mayors,

18
judges, police commissioners, public prosecutors, and civil servants.3 The fourth
panel of Figure 6 represents voting of representatives by background in the public
sector. Finally, the dummy variable PERINDTE indicates personal interests in the
textiles industry, and collects Representatives who owned cotton, wool or linen
industries or worked as tailors. The last panel of Figure 6 represents voting of
Representatives in the textiles industry.
Figure 5: Personal interests and voting

19
In order to identify to what extent MP’s represent their constituencies’ interests, we
have collected data on the economic, demographic, and agricultural characteristics of
their constituencies. The industrial and demographic profile of each of the 41
constituencies is reconstructed by means of the population and industrial censuses of
1890. The variable popden represents the population density of each constituency.
The variable proindr represents the share of the professional population working in
the heavy industry (coal, iron and steel, machines and glass). The variable protexr
represents the share of the professional population working in the textiles industry.
The summary statistics of these variables (unweighted for the constituencies’ number
of Representatives) are presented in Figure 7.
Figure 6: Descriptive statistics of the constituency variables
Variable Mean Std. Dev. Min Max
livestock (in 1885) 53,910.28 24,698.61 20,568 12,4339.7
livestock (in 1895) 63,008.61 28,972.04 22,868 153,959
cerealr (in 1885) 0.22 0.15 0.01 0.54
cerealr (in 1895) 0.20 0.10 0.02 0.33
Popden 2.22 1.51 0.37 6.53
proindr 0.05 0.10 0.00 0.43
Protexr 0.04 0.07 0.00 0.28
studcatr 0.63 0.21 0.31 0.96
Observations : 41
The agricultural profile of each constituency is further characterized by data from the
agricultural censuses of 1880 and 1895. Throughout the period 1880-1895, Belgian
agriculture was rapidly changing in reaction to the agricultural invasion. For this
reason, we characterize the agricultural profile of the 41 constituencies by linearly

20
interpolating between the census data of 1880 and 1895. The variable cerealr
represents the share of a constituency’s agricultural surface used for growing wheat
and rye. The variable livestock reflects number of cows and pigs in a constituency.
Figure 7 presents the summary statistics of these variables for 1885 and 1895. Note
how the increased livestock holdings illustrate the reorientation of Belgian agriculture
toward meat and dairy production. The decreased share of agricultural land used for
growing wheat and rye is reinforced by a general reduction in exploited agricultural
land from 2.7 million ha in 1880 to 2.6 million ha in 1895.
To capture the importance of the school struggle as a basis of party formation and
political power, we characterize the educational profile of a constituency by the
variable studcatr. This variable represents the share of primary school children
enlisted in Catholic schools in the constituency and was retrieved from the
educational census of 1880 (Malou 1881, p. 15-16). We believe that this variable
captures the strength of the network of Catholic organizations and the importance of
Catholic opposition against the Liberal school policy in the different constituencies.
Analysis of Representatives voting behavior
In the four votes, eighteen MP’s have abstained (eight for the first 1885 vote, none for
the second, five in 1887, and five in 1895). We omit these abstentions from our
analysis. Subsequently, the votes can be analyzed as a binary variable. We apply a
probit analysis on each vote separately, to allow for maximal flexibility and to
account for differences in the historical circumstances and in the voted proposals.4
Figure 8 presents the marginal effects of a probit regression at the means, while taking
a Representative’s party as well as personal and constituency interests into account.

21
Figure 7: Probit marginal effects (at the mean) with party affiliation
Dependent variable: Protectionist vote
1885a 1885b 1887 1895
LIB (d) -0.97*** -0.94*** -0.97*** -0.54***
(0.062) (0.073) (0.041) (0.15)
OTH (d) -0.57***
(0.20)
SOC (d) -0.58***
(0.19)
PERAGT (d) 0.33 0.055 0.28 0.027
(0.25) (0.20) (0.18) (0.22)
PERINDHE (d) -0.47** -0.60*** -0.30 0.070
(0.23) (0.11) (0.31) (0.22)
PERINTEL (d) -0.53** -0.49*** 0.17 -0.12
(0.25) (0.17) (0.19) (0.16)
PERPUB (d) 0.86*** 0.40** 0.34** 0.15
(0.15) (0.20) (0.17) (0.34)
PERINDTE (d) 0.42*** 0.15
(0.13) (0.48)
cerealr 4.70* 3.27** 6.66*** 5.81***
(2.58) (1.43) (1.71) (1.50)
ln(livestock) 0.35 0.58** 0.28 -0.32
(0.38) (0.29) (0.37) (0.30)
popden -0.45** -0.36*** -0.35*** -0.30***
(0.21) (0.099) (0.099) (0.068)
proindr 1.25 3.18* 0.21 -4.45
(3.36) (1.86) (1.50) (3.11)
protexr 1.12 2.96* -0.95 0.89
(2.42) (1.62) (1.06) (1.44)
studcatr -3.39* -2.36** -2.29* -1.76*
(1.88) (1.09) (1.28) (1.01)
N 81 92 123 141
pseudo R-sq 0.75 0.60 0.71 0.68
Marginal effects; Standard errors in parentheses
(d) for discrete change of dummy variable from 0 to 1
* p<0.10, ** p<0.05, *** p<0.01

22
First, party affiliation proves to be a very important predictor of voting. Keeping all
else fixed at the mean, a Liberal Representative is on average respectively 97% and
94% less likely to support trade protection in the 1885 votes than a Catholic
Representative. Likewise, the independent and Socialist MP’s are both statistically
and historically significantly more likely to object trade protection in all four votes
than the Catholics.
Second, personal economic background is an important factor, except in 1895.
Representatives with personal interests in agriculture are consistently more likely to
support protection, although this effect is never statistically significantly different
from 0 at the usual confidence levels. As theory predicts, personal interests in the
heavy industry decrease ceteris paribus the likelihood of a protectionist vote, although
this is only significant in the two 1885 votes - in other words before the Troubles of
1886 and when only agricultural protection was at stake. MP’s with an intellectual
professional background seem less prone to support protectionist measures. This
possibly reflects an exposure to the free trade theories of political economy during
their studies, although a number of economics textbooks at for instance the University
of Leuven took on a more protectionist stance in the 1890s (Erreygers and Van Dijck
2011). Representatives with a background in the public sector are, keeping all else
constant, more inclined to prefer trade protection. MP’s with a background in the
textiles industry are more supportive of protectionist measures, but this effect is only
significant in 1887.
Finally, the interests of Representatives’ constituencies are reflected in their voting. A
larger share of agricultural land sowed with wheat and rye increases the likelihood of
a protectionist vote significantly. A greater importance of livestock increases the
likelihood of a protectionist vote, and statistically significantly so in the second vote

23
of 1885, which proposes tariffs on meat imports. A greater population density
decreases on average the support for trade protection. The share of the professional
population working in the heavy and textiles industry decreases the likelihood of a
protectionist vote, although this effect disappears for textiles in the voting on the
general tariff proposal of 1895, which included a substantial package of protectionist
measures on textiles. Finally, a greater share of primary school children enrolled in
Catholic schools consistently decreases ceteris paribus the likelihood of a
protectionist vote.
The interpretation of the coefficients in Figure 8 is somewhat confounded by the fact
that the party affiliation of a constituency’s Representative already represents a
constituency’s interests, as the constituents have likely elected a Representative which
they believe best capable of serving their interests. Similarly, a Representative’s
choice to adhere a certain party depends on his personal economic background.
Although such multicollinearity does not invalidate our results, it can make
interpretation more tedious. For this reason, Figure 9 presents the marginal effects (at
the mean) of a probit regression which takes only personal and constituency interests
into account.5
Figure 8: Probit marginal effects (at the mean) without party affiliation
Personal background and constituency interests
Dependent variable: Protectionist vote
1885a 1885b 1887 1895
PERAGT (d) 0.25 0.095 0.21 0.13
(0.19) (0.16) (0.13) (0.20)
PERINDHE (d) -0.44*** -0.45*** -0.40* 0.26
(0.10) (0.080) (0.21) (0.19)

24
PERINTEL (d) -0.30* -0.29** 0.10 -0.11
(0.18) (0.14) (0.14) (0.14)
PERPUB (d) 0.35 0.17 0.18 0.37
(0.25) (0.17) (0.13) (0.28)
PERINDTE (d) 0.19 0.088
(0.22) (0.37)
cerealr 1.53 0.74 2.75*** 4.92***
(1.17) (0.85) (0.82) (1.19)
ln(livestock) 0.15 0.27* 0.78*** -0.13
(0.19) (0.16) (0.20) (0.20)
popden -0.28*** -0.24*** -0.29*** -0.22***
(0.076) (0.055) (0.053) (0.049)
proindr -1.29 0.50 1.31 -5.99***
(1.48) (1.12) (0.86) (1.67)
protexr -2.74* -0.90 -1.90** 0.0018
(1.40) (0.99) (0.79) (1.08)
studcatr -0.17 0.56 1.61*** -0.25
(0.61) (0.44) (0.51) (0.57)
N 89 100 123 142
pseudo R-sq 0.59 0.43 0.54 0.61
Marginal effects; Standard errors in parentheses
(d) for discrete change of dummy variable from 0 to 1
* p<0.10, ** p<0.05, *** p<0.01
Note first that the effect of personal interests is less pronounced when party affiliation
is not controlled for. This suggests that party formation was not so much aligned
around personal interest based preferences for trade policy. It does suggest that party
affiliation in itself was an important predictor of trade policy preferences, independent

25
of personal professional background, and that personal economic interests are an
important factor in explaining Representative’s deviation from the party line.
Likewise, the effects of agricultural specialization in wheat and rye and of population
density is less pronounced if one does not control for party affiliation. This can again
indicate that the demographic and agricultural profile of a constituency is a relatively
weak predictor of its Representative’s party affiliation, but that these can help to
explain differences in voting within a party.
This is no longer the case for the industrial profile of a constituency, however. The
effects of employment in the heavy and textiles industry is mostly more negative if
one does not control for party affiliation. The main industrial centers were
traditionally Liberal party strongholds, and these constituencies’ preference for free
trade in Figure 8 is absorbed by their Representatives’ Liberal party affiliation.
Whereas the effect of the share of primary school children in Catholic schools was
clearly negative if party affiliation is controlled for, this effect is mixed if the
Representative’s party is omitted from the analysis. Constituencies with a greater
importance of Catholic primary schools are more likely to elect a Catholic
Representative. But Figure 4 already showed that the Catholic party was divided on
the trade policy question in a free trade and a protectionist faction. Conditional on
party membership, the effect of the school war intensity was clearly negative. This
can suggest that the electoral basis of Catholic Representatives could take two
substitute forms: the promotion of agricultural interests and the protection of the role
of religion in education and society. The negative marginal effects of studcatr in
Figure 8 can mean that in constituencies where the opposition against the Liberal
school policy was fierce (larger share of children in Catholic schools), Catholic
Representatives could rely on average more on the protection of religion in society to

26
ensure reelection, and were as such less inclined to stand up for the agricultural
interests.
Figure 4 shows that the division of the Catholic party between a free trade oriented
faction and a protectionist faction as well as the changing balance of power between
these factions are the key to understanding Belgium’s change in trade policy in the
1880s and 1890s. Figure 10 illustrates the differences between the Catholic factions
by depicting the conditional means of all explanatory variables, and compares these
with the means in the Liberal party. In terms of personal interests, the Catholic free
trade faction is clearly characterized by more outspoken heavy industry interests than
the protectionist faction, and gathers, at least in 1885, more Representatives with
intellectual professions. The protectionist Catholics are more prone to have personal
agricultural interests and a public sector background. In terms of constituency
background, the Catholic party’s free trade faction clearly stems from more densely
populated constituencies. This is consistent with Craeybeckx’s (1973, p. 221) intuitive
feeling on this divide on the Catholic side between the free trade group around prime
minister Beernaert and the protectionists. In 1885, the Catholic free trade faction also
still represents the textiles industry centers. Towards 1895, the Representatives of the
textiles industry centers have moved towards the protectionist faction in the Catholic
party. This, in combination with the extension of voting rights, led to a shift in the
balance of power within the Catholic party, making the protectionist Catholic faction
sufficiently strong to pass the laws of 1887 and 1895, as illustrated in Figure 4.
Figure 9: conditional means Catholic factions and Liberals
1885a 1885b
CATH : free CATH : LIB CATH : free CATH : LIB

27
traders protectionist traders protectionist
PERAGT 28.57% 44.44% 35.29% 28.57% 42.11% 34.29%
PERINDHE 19.05% 2.78% 26.47% 19.05% 2.63% 28.57%
PERINTEL 61.9% 44.44% 44.18% 61.9% 47.37% 45.71%
PERPUB 4.76% 16.67% 26.47% 14.29% 15.79% 25.71%
PERINDTE 4.76% - 2.94% 4.76% - 2.86%
cerealr 25.98% 23.40% 23.74% 25.08% 23.64% 23.58%
ln(livestock) 10.76 11.00 10.88 10.79 10.98 10.89
popden 3.14 1.80 3.39 3.26 1.87 3.46
proindr 0.46% 2.36% 15.83% 0.59% 2.20% 16.05%
protexr 7.76% 3.13% 5.81% 5.93% 4.00% 5.66%
studcatr 81.54% 66.69% 45.94% 79.76% 67.86% 45.57%
1887 1895
CATH : free
traders
CATH :
protectionist LIB
CATH : free
traders
CATH :
protectionist LIB
PERAGT 28.57% 40.32% 32.50% 12.50% 32.43% 16.67%
PERINDHE 28.57% 3.23% 37.50% 20.83% 12.16% 5.56%
PERINTEL 42.86% 51.61% 42.5% 45.83% 48.65% 72.22%
PERPUB 14.29% 20.97% 22.50% - 13.51% 5.56%
PERINDTE - 4.84% 2.50% 4.17% 6.76% -
cerealr 20.57% 25.50% 20.31% 24.50% 26.16% 13.64%
ln(livestock) 10.89 11.12 10.81 11.44 11.16 11.11
popden 3.65 2.48 3.67 5.11 2.70 2.45
proindr 3.69% 2.38% 18.06% 1.01% 0.93% 11.47%
protexr 6.36% 5.69% 4.19% 2.47% 5.88% 0.92%
studcatr 73.05% 69.21% 42.39% 65.67% 72.15% 37.86%

28
Conclusions
The agricultural invasion and subsequent agricultural crisis as well as the resulting
rise of protectionism in much of continental Europe, induced Belgium to a partial
reinstallation of tariffs on imports of agricultural products. Although the conservative
Catholic party held a firm majority in Parliament, it was divided on the agricultural
trade issue. A Catholic free trade faction mostly collected MP’s with a personal
background in the heavy industry, representing on average more densely populated
constituencies. The protectionist faction consisted more of Representatives with
personal interests in agriculture and the public sector. In 1885, the Catholic free trade
faction together with the Liberal Representatives was sufficiently large to vote down
two proposals on the installation of tariffs on cereals and on meat. The workers
uprising of 1886 made tariffs on bread grains politically unfeasible. As such,
agricultural interests thereafter focussed their efforts on the protection of agricultural
sectors which generated a higher added value and were more suited to the fragmented
Belgian agricultural structure, such as livestock farming and diary production. In 1887
and 1895, two protectionist laws were voted which installed tariffs on respectively
livestock and on a broad range of products, including some agricultural products such
as flour, canned products (meat, fish, vegetables and fruit), butter and margarine
(excluding all cereals but oats). This move towards protection reflected the
protectionist faction gaining ground within the Catholic party. Although the Catholic
party was a key force in the Belgian liberalization of agricultural trade between the
1850s and 1873, it was also within this party that the agricultural interests’ cry for
renewed protection found the most sympathetic ears. With the extension of voting
rights, the votes of the farmers became a major source of competition among the
different political parties. Under these electoral pressures, the Catholic party proved

29
most successful in building an agricultural ideology which put agriculture in the
spotlight as a cornerstone of society, thus securing the farmer’s votes. By the end of
the nineteenth century, the Catholic party had established itself as the single protector
of agricultural interests. The growing importance of agricultural interests in electoral
terms together with the demands of the textiles industry for protection shifted the
balance of power within the Catholic party and resulted in the adoption of trade
protection in 1887 and 1895.
Our results also suggest that the pressures on Catholic MP’s to profile themselves as
defenders of agricultural interests were less pronounced in constituencies where the
opposition against the Liberal school policy had been more intense and where
Catholic Representatives had already built a solid electoral basis on the defence of the
position of religion in education and society.
A remarkable conclusion is that interest based explanations work much better in the
study of late nineteenth century agricultural trade policy in Europe than for the study
of the repeal of the Corn Laws in the middle of the century. Here, it is important to
take one qualitative element into consideration. The main political discussion between
1815 and 1850 was who would lose or gain from free trade in agricultural products. It
was clear that the landowners would stand to lose, that industrialists would gain, but
the effect on the real incomes of the laborers was much less clear. The lasting legacy
of these political debates was not so much a (reversible) free trade policy, but a shared
mental blueprint for the interpretation of the effects of tariffs.
Appendix
Figure 10: Probit marginal effects (at mean) with constituency interests only

30
Dependent variable: Protectionist vote
1885a 1885b 1887 1895
cerealr 1.30 0.56 2.69*** 4.17***
(0.90) (0.73) (0.76) (1.03)
ln(livestock) 0.018 0.18 0.78*** -0.12
(0.15) (0.14) (0.19) (0.18)
popden -0.24*** -0.21*** -0.29*** -0.20***
(0.052) (0.046) (0.048) (0.045)
proindr -2.55* -0.33 1.05 -5.64***
(1.46) (0.95) (0.81) (1.37)
protexr -1.82* -0.80 -1.46** -0.16
(1.03) (0.83) (0.73) (0.88)
Studcatr -0.63 0.19 1.54*** -0.038
(0.50) (0.38) (0.47) (0.51)
N 92 103 123 142
pseudo R-sq 0.48 0.31 0.48 0.58
Marginal effects; Standard errors in parentheses
(d) for discrete change of dummy variable from 0 to 1
* p<0.10, ** p<0.05, *** p<0.01
References
Aldenhoff-Hübinger, Rita. “Deux pays, deux politiques agricoles? Le protectionnisme
en France et Allemagne (1880-1914).” Histoire et Sociétés Rurales 23, no. 1 (2005):
65-87.
Bairoch, Paul. Commerce extérieur et développement économique de l’Europe au
XIXe siècle. Parijs : École des Hautes Études en Sciences Sociales, 1976.

31
_______. “European Trade Policy, 1815-1914.” In The Cambridge Economic History
of Europe. Volume VIII. The Industrial Economies: The Development of Economic
and Social Policies, edited by Peter Mathias and Sidney Pollard, 1-160. Cambridge:
Cambridge University Press, 1986.
Blomme, Jan. The Economic Development of Belgian Agriculture: 1880-1980. A
Quantitative and Qualitative Analysis. Louvain: Leuven University Press, 1993.
Caulier-Mathy, Nicole. Le monde des parlementaires liégeois 1831-1893. Essai de
socio-biographies. Brussels: Palais des Académies, 1996.
Chambre des Représentants de Belgique. Annales parlementaires. Brussels: Chambre
des Représentants, parliamentary years 1885, 1887 and 1895.
Clark, Christopher, and Wolfram Kaiser, eds. Culture Wars. Secular-Catholic
Conflict in Nineteenth-Century Europe. Cambridge: Cambridge University Press,
2003.
Craeybeckx, Jan. “De agrarische depressie van het einde der XIXe eeuw en de
politieke strijd om de boeren.” Belgisch Tijdschrift voor Nieuwste Geschiedenis 4, no.
1-2 (1973): 191-231 and 5, no. 1-2 (1974): 181-225.
De Brabander, Guido L. Regionale structuur en werkgelegenheid. Een economische
en geografische studie over de Belgische lange-termijn-ontwikkeling. Brussels:
Académie Royale de Belgique, 1983.
De Moor, Martina. “The occupational and geographical mobility of farm labourers in
Flanders from the end of the 19th to the middle of the 20th century.” In Labour and
labour markets between town and countryside (Middle Ages - 19th century), edited by
Bruno Blondé, Eric Vanhaute and Michèle Galand, 292-304. Turnhout: Brepols,
2001.

32
De Paepe, Jean-Luc and Christiane Raindorf-Gerard. Le Parlement belge 1831-1894,
données biographiques. Brussels: Académie Royale de Belgique, 1996.
De Smaele. Henk. Rechts Vlaanderen. Religie en stemgedrag in negentiende-eeuws
België. Louvain, Leuven University Press, 2009.
Deneckere, Gita. “Nieuwe geschiedenis van België, 1878-1905.” In Nieuwe
geschiedenis van België I, 1830-1905, edited by Els Witte, Jean-Pierre Nandrin,
Eliane Gubin and Gita Deneckere, 443-664. Tielt: Lannoo, 2005.
Erreygers, Guido, and Maarten Van Dijck “‘A Powerful Instrument of Progress’.
Economic Textbooks in Belgium.” In The Economic Reader. Textbooks, Manuals and
the Dissemination of the Economic Sciences during the Nineteenth and Early
Twentieth Centuries, edited by Massimo M. Augello en Marco E.L. Guidi, 214-247.
Londen and New York: Routledge, 2011.
Gadisseur, Jean. Histoire quantitative et développement de la Belgique au XIXe siècle.
vol. IV, 1a: Le produit physique de la Belgique, 1830-1913. […] Agriculture.
Brussels: Académie Royale de Belgique, 1990.
Goddeeris, Idesbald, and Roeland Hermans, eds. Migrants flamands en Wallonie
1850-2000. Brussels: Racine, 2012.
Goossens, Martine. The Economic Development of Belgian Agriculture: A Regional
Perspective, 1812-1846. Brussels: Académie Royale de Belgique, 1992.
Huberman, Michael. “Ticket to trade: Belgian labour and globalization before 1914.”
Economic History Review 61, no. 2 (2008): 326-359.
Irwin, Douglas A. “The Political Economy of Free Trade: Voting in the British
General Election of 1906.” Journal of Law and Economics 37, no. 1 (1994): 75-108.
Kindleberger, Charles P. Economic Response. Comparative Studies in Trade, Finance
and Growth. Cambridge, MA: Cambridge University Press, 1978.

33
Klep, Paul M. “De agrarische beroepsbevolking van de provincies Antwerpen en
Brabant,1846-1910. Nieuwe evaluaties van kwantitatief historisch materiaal.”
Bijdragen tot de geschiedenis, inzonderheid van het oud hertogdom Brabant 59,
(1976): 25-69.
Kurgan-Van Hentenrijk, Ginette, ed. Dictionnaire des patrons en Belgique: les
hommes, les entreprises, les réseaux. Brussels: De Boeck, 1996.
Lamberts, Emiel, and Jacques Lory. 1884: un tournant politique en Belgique. De
machtswisseling van 1884 in België. Brussels: FUSL, 1986.
Lehmann, Sibylle H. “The German Elections in the 1870s: Why Germany Turned
from Liberalism to Protectionism.” Journal of Economic History 70, no. 1 (2010):
146-178.
_______, and Oliver Volckart. “The political economy of agricultural protection:
Sweden 1887.” European Review of Economic History 15, no. 1 (2011): 29-59.
Lehoucq, Nicole, and Tony Valcke. De fonteinen van de Oranjeberg. Politiek-
institutionele geschiedenis van de provincie Oost-Vlaanderen van 1830 tot nu. Gent:
Stichting Mens en Kultuur, 1993.
Luykx, Theo, and Marc Platel. Politieke geschiedenis van België. 1 van 1789 tot
1944. Antwerpen: Kluwer Rechtswetenschappen, 1985.
Malou, Jules. Récensement de la population des écoles primaires et gardiennes au 15
décembre 1880. Brussels: Gobbaerts, 1881.
McKeown, Timothy J. “The Politics of Corn Law Repeal and Theories of
Commercial Policy.” British Journal of Political Science 19, no. 3 (1989): 353–80.
McLean, Iain, and Camilla Bustani. “Irish Potatoes and British Politics: Interests,
Ideology, Heresthetic, and the Repeal of the Corn Laws.” Political Studies 47, no. 5
(1999): 817–36.

34
Moniteur belge 14 July 1895.
O’Rourke, Kevin. “The European grain invasion.” Journal of Economic History 57,
no. 4 (1997): 775–801.
Schepens Luc. Van vlaskutser tot Franschman. Bijdrage tot de geschiedenis van de
Westvlaamse plattelandsbevolking in de negentiende eeuw. Brugge: Westvlaams
Ekonomisch Studiebureau, 1973.
_______. De Provincieraad van West-Vlaanderen, vol. 1, 1836-1921. Tielt: Lannoo,
1976.
Schonhardt-Bailey, Cheryl. “Parties and Interests in the Marriage of Iron and Rye.”
British Journal of Political Science 28, no. 2 (1998): 291-330.
_______. “Ideology, Party, and Interests in the British Parliament of 1841–1847.”
British Journal of Political Science 33, no. 4 (2003): 581–605.
_______. From the Corn Laws to Free Trade: Interests, Ideas, and Institutions in
Historical Perspective. Cambridge, MA: MIT Press, 2006.
Segers, Yves, and Leen Van Molle. Leven van het land. Boeren in België 1750-2000.
Louvain: Davidsfonds, 2004.
Stengers, Jean. Index des éligibles au Sénat, 1831-1893. Brussels: Académie Royale
de Belgique, 1975.
_______. Émigration et immigration en Belgique au XIXe et au XXe siècles. Brussels:
Académie Royale de Belgique, 1978.
Suetens, Max. Histoire de la politique commercial de la Belgique depuis 1830 jusqu’à
nos jours. Brussels: Libraire Encyclopedie, 1955.
Tracy, Michael. Government and Agriculture in Western Europe 1880-1988. New
York: Harvester Wheatsheaf, 1989.

35
Van Dijck, Maarten. De wetenschap van de wetgever. De klassieke politieke economie
en het Belgische landbouwbeleid, 1830-1884. Louvain: Leuven University Press,
2008.
Van Dijck, Maarten and Tom Truyts, “Ideas, Interests, and Politics in the Case of
Belgian Corn Law Repeal, 1834-1873.” Journal of Economic History 71, no. 1
(2011): 185-210.
Van Molle, Paul. Le Parlement Belge 1894-1972. Antwerp-Utrecht: Standaard
Wetenschappelijke Uitgeverij, 1972.
Van Molle, Leen. Katholieken en landbouw. Landbouwpolitiek in België 1884-1914.
Louvain: Leuven University Press, 1989.
_______. “A State for the Peasants or the Peasants for the State? The Two Faces of
Belgian Agricultural Policy, 1830-1914.” In The State and Rural Societies. Policy and
Education in Europe 1750-2000, edited by Nadine Vivier, 159-176. Turnhout:
Brepols, 2008.
Vanhaute, Eric. “Eigendomsverhoudingen in de Belgische en Vlaamse landbouw
tijdens de 18de en 19de eeuw.” Belgisch Tijdschrift voor Nieuwste Geschiedenis 24,
no. 1-2 (1993): 185-226.
_______. “Rich Agriculture and Poor Farmers: Land, Landlords and Farmers in
Flanders in the Eighteenth and Nineteenth Centuries.” Rural History 12, no. 1 (2001):
19-40.
Wils, Lode. “De katholieke partij in de 19e eeuw: organisatie, programma en
aanhang.” In 1884: Un tournant politique en Belgique. De machtswisseling van 1884
in België, edited by Emiel Lamberts and Jacques Lory, 69-97. Brussels: FUSL, 1986.

36
1 We do not use the framework of King (1997) to analyse the elections of 1884, 1886 and 1894 as
Lehman (2010) did. Such approach is inappropriate to our setting because the elections were dominated
by several political issues and because all parties voted dividedly on the tariffs issue.
2 We have also included Daens, single Representative of the Christian Workers’ party in this category,
because the agricultural program of Daens was highly similar to that of the Socialist party. See
Craeybeckx (1973, 224) on this issue.
3 The categories indicated by the personal background variables are not mutually exclusive. Teachers
and university professors are for instance included in both PERINTEL and PERPUB, and can also be
included in PERAGT, e.g. because of being large landowners.
4 For the results reported in this section, we have selected the functional forms which provided the best
fit to the data from the set of historically meaningful and interesting specifications and under the
constraint that the reported results are robust to alterations in functional form and variable selection.
5 One could argue that the personal economic background of a Representative is similarly co-
determined by the interests of his constituency. However, this does not generate particular
interpretation (or estimation) problems, and is not intrinsically different from multicolinearity issues at
the level of constituency characteristics (for instance correlation between population density and
industrialization). As a robustness check, the reader can verify in appendix that the marginal effects of
a probit regression with only constituency interests do not differ much from the coefficients reported in
Figure 8.

Recent titles CORE Discussion Papers
2013/37 Lionel ARTIGE, Antoine DEDRY and Pierre PESTIEAU. Social security and economic
integration. 2013/38 Nicolas BOUCKAERT and Erik SCHOKKAERT. Differing types of medical prevention appeal
to different individuals. 2013/39 Pierre M. PICARD. Trade, economic geography and the choice of product quality. 2013/40 Tanja B. MLINAR and Philippe CHEVALIER. Pooling in manufacturing: do opposites attract? 2013/41 Chiara CANTA and Marie-Louise LEROUX. Public and private hospitals, congestion, and
redistribution. 2013/42 Mathieu LEFEBVRE, Pierre PESTIEAU and Gregory PONTHIERE. FGT poverty measures
and the mortality paradox: Theory and evidence. 2013/43 Nada BELHADJ, Jean J. GABSZEWICZ and Ornella TAROLA. Social awareness and duopoly
competition. 2013/44 Volker BRITZ, P. Jean-Jacques HERINGS and Arkadi PREDTETCHINSKI. On the
convergence to the Nash bargaining solution for action-dependent bargaining protocols. 2013/45 Pasquale AVELLA, Maurizio BOCCIA and Laurence WOLSEY. Single item reformulations
for a vendor managed inventory routing problem: computational experience with benchmark instances.
2013/46 Alejandro LAMAS, Tanja MLINAR, Liang LU and Philippe CHEVALIER. Revenue management for operations with urgent orders.
2013/47 Helmuth CREMER, Firouz GAHVARI and Pierre PESTIEAU. Uncertain altruism and the provision of long term care.
2013/48 Claire DUJARDIN, Vincent LORANT and Isabelle THOMAS. Self-assessed health of elderly people in Brussels: does the built environment matter?
2013/49 Marc FLEURBAEY, Marie-Louise LEROUX, Pierre PESTIEAU and Grégory PONTHIERE. Fair retirement under risky lifetime.
2013/50 Manuel FÖRSTER, Ana MAULEON and Vincent VANNETELBOSCH. Trust and manipulation in social networks.
2013/51 Anthony PAPAVASILIOU, Yi HE and Alva SVOBODA. Self-commitment of combined cycle units under electricity price uncertainty.
2013/52 Ana MAULEON, Elena MOLIS, Vincent VANNETELBOSCH and Wouter VERGOTE. Dominance invariant one-to-one matching problems.
2013/53 Jean GABSZEWICZ and Skerdilajda ZANAJ. (Un)stable vertical collusive agreements. 2013/54 François MANIQUET and Massimo MORELLI. Approval quorums dominate participation
quorums. 2013/55 Mélanie LEFÈVRE and Joe THARAKAN. Intermediaries, transport costs and interlinked
transactions. 2013/56 Gautier M. KRINGS, Jean-François CARPANTIER and Jean-Charles DELVENNE. Trade
integration and the trade imbalances in the European Union: a network perspective. 2013/57 Philip USHCHEV, Igor SLOEV and Jacques-François THISSE. Do we go shopping downtown
or in the 'burbs'? Why not both? 2013/58 Mathieu PARENTI. Large and small firms in a global market: David vs. Goliath. 2013/59 Paul BELLEFLAMME and Francis BLOCH. Dynamic protection of innovations through
patents and trade secrets. 2013/60 Christian HAEDO and Michel MOUCHART. Specialized agglomerations with areal data:
model and detection. 2013/61 Julien MARTIN and Florian MAYNERIS. High-end variety exporters defying distance: micro
facts and macroeconomic implications. 2013/62 Luca G. DEIDDA and Dimitri PAOLINI. Wage premia, education race, and supply of educated
workers. 2013/63 Laurence A. WOLSEY and Hande YAMAN. Continuous knapsack sets with divisible
capacities.

Recent titles CORE Discussion Papers - continued
2013/64 Francesco DI COMITE, Jacques-François THISSE and Hylke VANDENBUSSCHE. Verti-
zontal differentiation in export markets. 2013/65 Carl GAIGNÉ, Stéphane RIOU and Jacques-François THISSE. How to make the metropolitan
area work? Neither big government, nor laissez-faire. 2013/66 Yu. NESTEROV and Vladimir SHIKHMAN. Algorithmic models of market equilibrium. 2013/67 Cristina PARDO-GARCIA and Jose J. SEMPERE-MONERRIS. Equilibrium mergers in a
composite good industry with efficiencies. 2013/68 Federica RUSSO, Michel MOUCHART and Guillaume WUNSCH. Confounding and control in
a multivariate system. An issue in causal attribution. 2013/69 Marco DI SUMMA. The convex hull of the all-different system with the inclusion property: a
simple proof. 2013/70 Philippe DE DONDER and Pierre PESTIEAU. Lobbying, family concerns and the lack of
political support for estate taxation. 2013/71 Alexander OSHARIN, Jacques-François THISSE, Philip USHCHEV and Valery VERBUS.
Monopolistic competition and income dispersion. 2013/72 N. Baris VARDAR. Imperfect resource substitution and optimal transition to clean
technologies. 2013/73 Alejandro LAMAS and Philippe CHEVALIER. Jumping the hurdles for collaboration: fairness
in operations pooling in the absence of transfer payments. 2013/74 Mehdi MADANI and Mathieu VAN VYVE. A new formulation of the European day-ahead
electricity market problem and its algorithmic consequences. 2014/1 Erik SCHOKKAERT and Tom TRUYTS. Preferences for redistribution and social structure. 2014/2 Maarten VAN DIJCK and Tom TRUYTS. The agricultural invasion and the political economy
of agricultural trade policy in Belgium, 1875-1900.
Books V. GINSBURGH and S. WEBER (2011), How many languages make sense? The economics of linguistic
diversity. Princeton University Press. I. THOMAS, D. VANNESTE and X. QUERRIAU (2011), Atlas de Belgique – Tome 4 Habitat. Academia
Press. W. GAERTNER and E. SCHOKKAERT (2012), Empirical social choice. Cambridge University Press. L. BAUWENS, Ch. HAFNER and S. LAURENT (2012), Handbook of volatility models and their
applications. Wiley. J-C. PRAGER and J. THISSE (2012), Economic geography and the unequal development of regions.
Routledge. M. FLEURBAEY and F. MANIQUET (2012), Equality of opportunity: the economics of responsibility.
World Scientific. J. HINDRIKS (2012), Gestion publique. De Boeck. M. FUJITA and J.F. THISSE (2013), Economics of agglomeration: cities, industrial location, and
globalization. (2nd edition). Cambridge University Press. J. HINDRIKS and G.D. MYLES (2013). Intermediate public economics. (2nd edition). MIT Press. J. HINDRIKS, G.D. MYLES and N. HASHIMZADE (2013). Solutions manual to accompany intermediate
public economics. (2nd edition). MIT Press.
CORE Lecture Series R. AMIR (2002), Supermodularity and complementarity in economics. R. WEISMANTEL (2006), Lectures on mixed nonlinear programming. A. SHAPIRO (2010), Stochastic programming: modeling and theory.