2015-2016 internship project reports prepared by office...
TRANSCRIPT

0 | P a g e
2015-2016 Internship Project Reports
Prepared by Office of Sustainability
September 2016
1 | P a g e
Introduction
The Sustainable Stanford Internship Program provides a paid opportunity for students to gain hands-on
experience implementing programs that influence on-campus sustainability. Each intern will commit to a
summer or academic year-long program working to manage a campus sustainability project and bring
about tangible results. In addition to gaining experience in sustainability project design and
implementation, interns gain exposure to sustainability careers and a network of program alumni.
The 2015-16 Sustainable Stanford Intern Cohort included more than 35 undergraduate and graduate
students. More information on this program is available at http://sustainable.stanford.edu/internships
Table of Contents
Promoting Sustainability in the School of Medicine 2
Identifying Unnecessary Landscaping in Residential Areas 4
Discovering Water Efficiency Opportunities in Graduate Housing 7
Auditing Residential Lighting Needs 10
Measuring Composting in Campus Cafes 13
Establishing a Baseline for Cardinal Green Athletics 15
Engaging the Campus in Conservation Campaigns 18
Communicating Zero Waste Efforts to the Campus Community 21

2 | P a g e
Promoting Sustainability in the School of Medicine
1. Team Member: Trinidad Cisneros
2. Supervisor: Rashmi Sahai
3. Internship Title: School of Medicine Sustainability Intern
4. Project Summary: As an SSP Intern at the SOM, my research is centered on developing policies that improve waste
management (WM) and recycling practices. Extensive research has been done to improve WM in
residential and commercial settings, although, little work has been done to evaluate WM practices in
research facilities. Laboratories produced high volumes of waste a day, and it is important to identify
recycling barriers and develop effective WM policies.
My research is focused on bringing together WM stakeholders at the SOM, evaluate the current WM
practices from an infrastructural, and on a lab-by-lab basis, and use this information to determine
interventions. Preliminary findings suggest that barriers to proper WM include insufficient
communication between all WM stakeholders, misinformation about what constitutes recyclable
material, and the need for adequate recycling waste bins in labs and throughout facilities. Moreover,
after surveying 100 SSM graduate students, we identified novel recycling (Styrofoam, Gloves, Garments,
Ice Packs and Paper Towels) and resource sharing opportunities.
From the survey results, we decided to focus on two initiatives for the first half of 2016 - glove recycling
and a spring sharing event.
5. Project Status:
Glove recycling: Bin location and funding available. We are awaiting completion of recycling bins and submission of work order to place bins into respective locations. Marketing will be conducted afterwards with direct outreach to labs in MSLS and SIM1.
Spring sharing event: Event was
successful and will be conducted in
2017.

3 | P a g e
6. Internship Time Commitment (hours worked on average- check one):
1-3 hrs/wk 3-8 hrs/wk 8+ hrs/wk
7. Measureable Outcomes:
Developed a marketing, branding and awareness campaign that helped the sustainability
program penetrate over 100 research labs at Stanford’s School of Medicine.
Developed and conducted the first resource and waste management survey that received over
100 responses and that identified four-key environmental initiatives for the sustainability
program.
Planned and led a team of two student groups and eight university departments in the first
resource-sharing event at the School of Medicine that saved over $90,000 of research funds.
Worked in a team to secure over $3000 of funding to support the glove-recycling program and
the resource-sharing event.
8. Project Highlights/Favorite Moments:
Working with Rashmi, Julie Muir and Craig Barney
All of the measurable outcomes listed above
9. Project Challenges/Lessons Learned:
Insufficient time to work on projects
Maintaining project momentum requires persistence and consistent communication.
10. Resources Used/Contacts Established: All involved in spring sharing event and * for glove recycling.
Property Management, Roldan Penagos*
PSSI, Julie Muir*
SBSA, Dylan Hale
BioAIMS, Carlos Medina, Miranda Stratton
Office of Graduate Education, Terrence Mayes, Monica Devlin
Office of Wellness, Roxana Farias
Building Manager, Lorry I. Lokey Stem Cell Research Building, Linda Heneghan*
EH&S, Craig Barney*
Office of Facilities, Planning and Management, Linda Barcomb Director*

4 | P a g e
Identifying Unnecessary Landscaping in Residential Areas
1. Team Members: Chuqiao Dong, Erik Rosenberg, Julia Goolsby, Sierra Killian, Erin Pang, Stanley Gu,
Tanvi Gambhir
2. Supervisor: Kristin Parineh
3. Internship Title: Water Efficiency Landscape Study
4. Project Summary: Our project focuses on surveying the lawns in undergraduate and graduate housing areas to evaluate
water efficiency. In 2014, Stanford used about 1.1 million gallons of water per day on irrigation, and
11% of this water use belonged to student housing and dining areas. Through our project, we hope to
identify lawns with low water efficiency that can potentially be removed or replaced by drought tolerant
plants to help Stanford reduce irrigation water usage.
We developed a series of lawn survey criteria, including lawn size, shape, slope, degree of shading, wind
protection, usage frequency, and the number of sprinkler heads, along with a scoring key. We used
measuring sticks to determine the size of the lawn, and level/rope and tape measure to determine the
slope. We used a phone GPS app called “Where I am” to record the coordinates of the lawn, so that
people can easily pinpoint each piece in Google Earth later.
After we surveyed all the lawns and recorded the data, I calculated a total score for each lawn based on
the scoring key. Lawns with higher scores tend to be more curved on the edge, less shaded, not
protected from wind, and used less frequently. Therefore these lawns have higher potential for removal
or replacement. In addition, I calculated the ratio of the number of sprinkler heads to the lawn size. I
compared the ratio for each lawn to the average ratio and also to the average ratio plus one standard
deviation. For lawns with a ratio
higher than the average plus one
standard deviation, we may reduce
the number of sprinkler heads.
5. Project Status: We have finished surveying the
lawns in Escondido Village (EV),
Manzanita, Branner, Crothers,
Arrillaga, Wilbur, Stern, and Munger.
Next steps would be: 1) look for flow
5 | P a g e
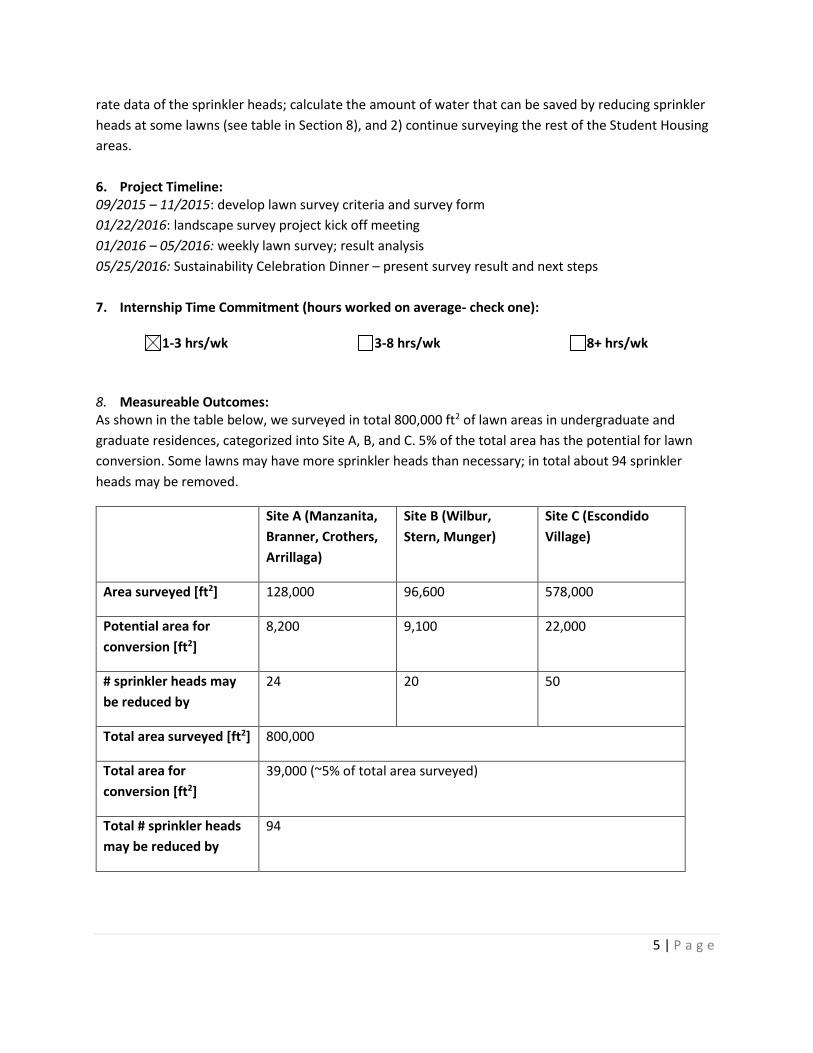
rate data of the sprinkler heads; calculate the amount of water that can be saved by reducing sprinkler
heads at some lawns (see table in Section 8), and 2) continue surveying the rest of the Student Housing
areas.
6. Project Timeline: 09/2015 – 11/2015: develop lawn survey criteria and survey form
01/22/2016: landscape survey project kick off meeting
01/2016 – 05/2016: weekly lawn survey; result analysis
05/25/2016: Sustainability Celebration Dinner – present survey result and next steps
7. Internship Time Commitment (hours worked on average- check one):
1-3 hrs/wk 3-8 hrs/wk 8+ hrs/wk
8. Measureable Outcomes: As shown in the table below, we surveyed in total 800,000 ft2 of lawn areas in undergraduate and
graduate residences, categorized into Site A, B, and C. 5% of the total area has the potential for lawn
conversion. Some lawns may have more sprinkler heads than necessary; in total about 94 sprinkler
heads may be removed.
Site A (Manzanita,
Branner, Crothers,
Arrillaga)
Site B (Wilbur,
Stern, Munger)
Site C (Escondido
Village)
Area surveyed [ft2] 128,000 96,600 578,000
Potential area for
conversion [ft2]
8,200 9,100 22,000
# sprinkler heads may
be reduced by
24 20 50
Total area surveyed [ft2] 800,000
Total area for
conversion [ft2]
39,000 (~5% of total area surveyed)
Total # sprinkler heads
may be reduced by
94

6 | P a g e
9. Project Highlights/Favorite Moments: My favorite moments are when I was surveying the lawns in EV with Erik, Sierra, and Julia. Most of the
lawn areas in EV have very irregular shapes, and we struggled together on how to divide up the lawns
into various shapes (rectangles, trapezoid, etc.) so we can easily measure the size. For the past several
months, we spent almost every Sunday afternoon together for a one- or two-hour survey, and I value
the friendship we developed through the process.
10. Project Challenges/Lessons Learned: My role in this project was a bit like a group leader, which I was not quite used to at first. I was worried if
I would do or say something wrong in our meeting or in our weekly surveying activities. As I worked
more with the other members and knew them better, I became more comfortable about our project
and my role.
While we were surveying, we found it hard to determine the degree of shading of the lawns, as the
amount of shade depends on the time of the day, the weather (cloudy or sunny), and the season
(whether the trees have leaves). Therefore the value we recorded is only a rough estimation and may
not be very accurate.
7 | P a g e
Discovering Water Efficiency Opportunities in Graduate Housing
1. Team Member: Sierra Killian
2. Supervisor: Kristin Parineh
3. Internship Title: Residential and Dining Enterprises Sustainable Housing Intern
4. Project Summary: My primary project was a study on water use in Escondido Village residences. In each apartment, I
measured the flow rates of the shower and the kitchen and bathroom sinks, noted any leaking faucets,
recorded whether there were any washing machines and dishwashers and whether they were Energy
Star certified, and placed a dye tablet in each toilet to test for leaks. Following each audit, I created
personalized water reports that explained how the resident’s faucets and appliances compared to R&DE
standard flow rates and practices. The reports also provided contact information for replacing faucets
and instructions to fill out a FixIt request to repair leaks. In the first stage of the project, I worked with
Davianna Olert, an intern with the Office of Sustainability who conducted a plug load study, and
surveyed residents who expressed interest via email and had scheduled appointments. In the second
stage, I knocked on doors and performed audits for willing residents in buildings 24 through 61. Almost
everyone who answered the door agreed to participate. I surveyed 47 apartments in total.
In addition to my water audits, I worked on Chuqiao Dong’s lawn survey project. I measured the size,
slope, and number of sprinkler heads for lawns in Escondido Village once a week.
Because I am on the leadership team for Green Living Council this year, I also worked on Wilbur Water
Wars. I emailed dorm captains, coordinated food delivery for prizes, and updated the signs in each
dorm once a week.
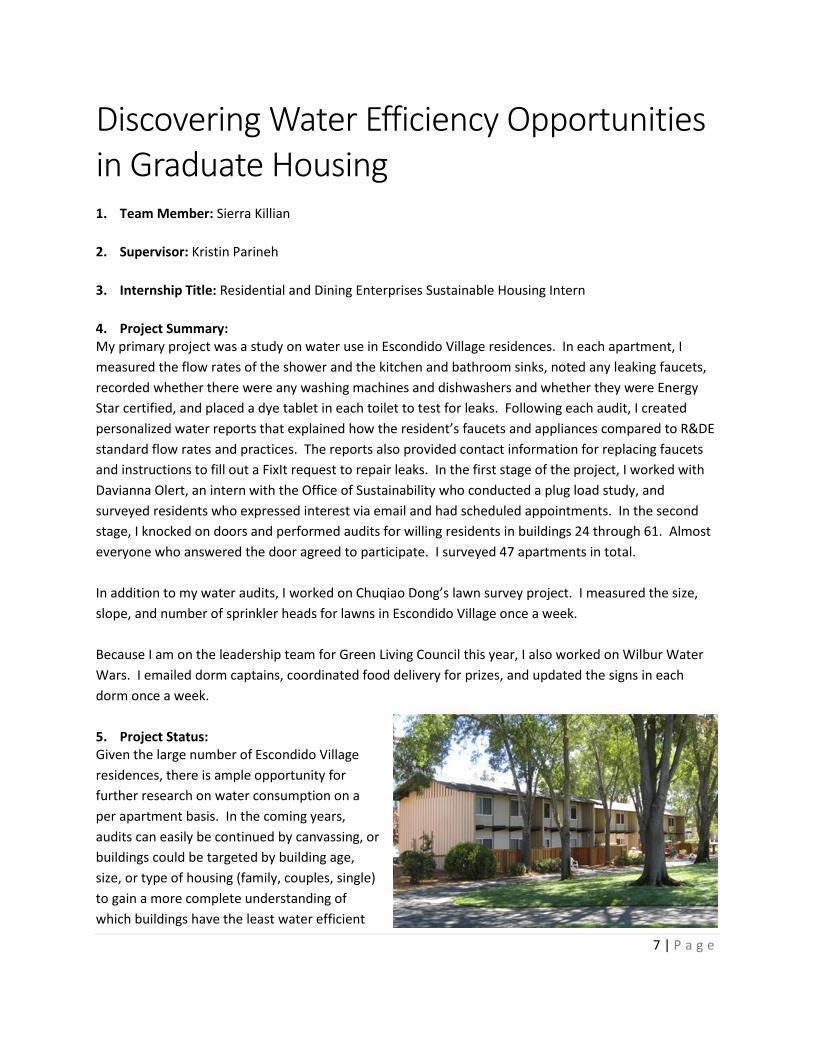
5. Project Status: Given the large number of Escondido Village
residences, there is ample opportunity for
further research on water consumption on a
per apartment basis. In the coming years,
audits can easily be continued by canvassing, or
buildings could be targeted by building age,
size, or type of housing (family, couples, single)
to gain a more complete understanding of
which buildings have the least water efficient

8 | P a g e
faucets and what factors might contribute to that inefficiency. With the upcoming demolition of the
buildings along Serra Street and the subsequent construction of new buildings, more effort should be
focused on the other buildings because they are older and less likely to meet R&DE’s standards.
6. Project Timeline: October
wrote drafts of potential emails to send to building managers, community associates, and residents
contacted building managers November
met with John Frankfurt, building manager in EV
created preliminary design for report December
conducted 24 audits in conjunction with the Office of Sustainability’s plug load study January
wrote first draft of report February
revised draft of report with feedback of supervisor March
continued to revise report April
sent out reports from first round of audits
sent out follow-up email for residents who expressed interest during the first stage of audits but did not fit in the schedule
May
began door-to-door audits
conducted 23 audits and sent out reports for each
7. Internship Time Commitment (hours worked on average- check one):
1-3 hrs/wk 3-8 hrs/wk 8+ hrs/wk
8. Measureable Outcomes: I performed audits for 47 apartments in Escondido Village and created personalized reports for each.
Almost every residence had larger flow rates than the R&DE standard for both their bathroom sink and
their shower. On average, the bathroom sinks I audited were wasting 1.12 gallons of water per minute
of use compared to the R&DE standard. Similarly, the showers examined in my study wasted an average
of 0.95 gallons per minute of use. Kitchen sinks wasted less water compared to the standard, with an
average of 0.22 gallons per minute wasted.
In my work with the lawn survey project, I helped survey 385,300 square feet of lawn. For each parcel
of lawn, I helped count sprinkler heads, measure the dimensions, calculate the area, and determine the
amount of shade and slope.
9 | P a g e
For Wilbur Water Wars, I coordinated communications with dorm captains from each of the eight
dorms. I also ordered and helped deliver cupcakes for 80 residents as a prize for a one-day competition
halfway through the overall competition. Finally, I updated the signs for between one and eight of the
dorms on a weekly basis for six weeks.
9. Project Highlights/Favorite Moments: Many of the highlights for me were during the canvassing stage of my auditing. I have audited for an
environmental non-profit in the past and did not often receive enthusiastic responses from the people
with whom I spoke. Because of that, I was very pleasantly surprised by how willing Stanford graduate
students were to having me audit their apartment. One woman stands out in particular because she
stopped her countertop dishwasher mid-cycle so that I could check the flow rate of the kitchen sink,
asked about my academic interests, and suggested a professor for me to contact.
10. Project Challenges/Lessons Learned: One of the challenges for me was deciding when my reports were good enough to send out. My
supervisor provided helpful feedback, but I had a difficult time determining when timeliness outweighed
perfecting the small details of the report. After initially being intimidated by the prospect of going door
to door, I also learned that canvassing is not as painful as I had thought.
11. Resources Used/Contacts Established: I received the flow rate bags and dye tablets for my audits from Jennifer Fitch in the Water Quality,
Efficiency, and Stewardship department in Land, Buildings, and Real Estate. I also met with John
Frankfurt, a building manager with R&DE, to discuss my project and address potential obstacles.

10 | P a g e
Auditing Residential Lighting Needs
1. Team Members: Sarah Kolarik, Teo Camacho
2. Supervisor: Kristin Parineh
3. Internship Title: Energy Efficiency Lighting Intern
4. Project Summary: The overall purpose for this project is to look at how improving the efficiency of undergraduate student
lights can reduce the amount of energy used per light. Before I was brought on as an intern, Kristin was
developing an ROI case for replacing the current fluorescent light bulbs and the fixtures themselves with
LED and more efficient lighting fixtures. However, while researching everything for the case, there were
no studies about average dorm light usage; only studies looking into single-family homes and big
commercial buildings. For Kristin, this meant that she was missing the most crucial piece of information
in completing the ROI case. When I was brought on to work with Kristin, we talked about how we were
going to collect this data and how many data points we needed. I then went to work setting up a
working relationship with the PG&E Learning Library to rent light sensors and learn how to install and
collect data from them, meanwhile Kristin worked with housing to find appropriate rooms to survey.
Sarah then joined our project, using it as her Earth Systems Senior Project. Much like myself, the
majority of Sarah’s work was interactions with the students, getting their consent to participate in the
study, installing the light sensors, and then collecting the data
from the sensors. We ended up doing two sets of data collection
for two weeks at a time. We were able to rent 20 sensors from
PG&E for each of the two sets meaning we had a total of 40 data
points. Of those 40, 4 of the data points ended up being unusable
because of various factors like malfunctioning sensor or
misplacing of the sensor when installed; this gave us 36 usable
data points to look at which was well within our target range
necessary for an accurate depiction of average light usage.
After the installation, removal, and extracting data from the
sensors, Sarah and I got to work on the analysis of the numbers
we had. The average undergraduate light usage per room ended
up being just over 6 hours per day. Other data analysis further
broke it down by room type (single, one room double, etc.),
students per room, composition of the room (freshman,
sophomore, etc.), and various other factors.
11 | P a g e
5. Project Status: Kristin, Sarah, and I were able to complete the project this year. All of the work, in terms of what was
being asked of the internship, is over; however, there are next steps to the bigger project. The next step
is coming up over the summer, with installation of the new LED light bulbs. Further steps down the road
include widespread changes of not only the light bulbs but also the light fixtures.
6. Project Timeline: Late September 2015: setup the approach to the study
October 2015: Contacting PG&E center about the light sensors and get an estimate of what we will be
working with
November 2015: Start doing the first round of sensor installations
December 2015: Remove the sensors and collect the data from each of them, return the sensors to
PG&E
January 2016: Contact the PG&E center again about renting the sensors one more time, install sensors
February 2016: Remove sensors, collect the data, and return the sensors
March 2016: Meeting with Kristin about what is coming up in the project with different meetings and
presentations to be had
April 2016: Data Analysis
May 2016: Presentation to various housing people about our study
June 2016: End of the year celebrations and wrap up for the internship
7. Internship Time Commitment (hours worked on average- check one):
1-3 hrs/wk 3-8 hrs/wk 8+ hrs/wk
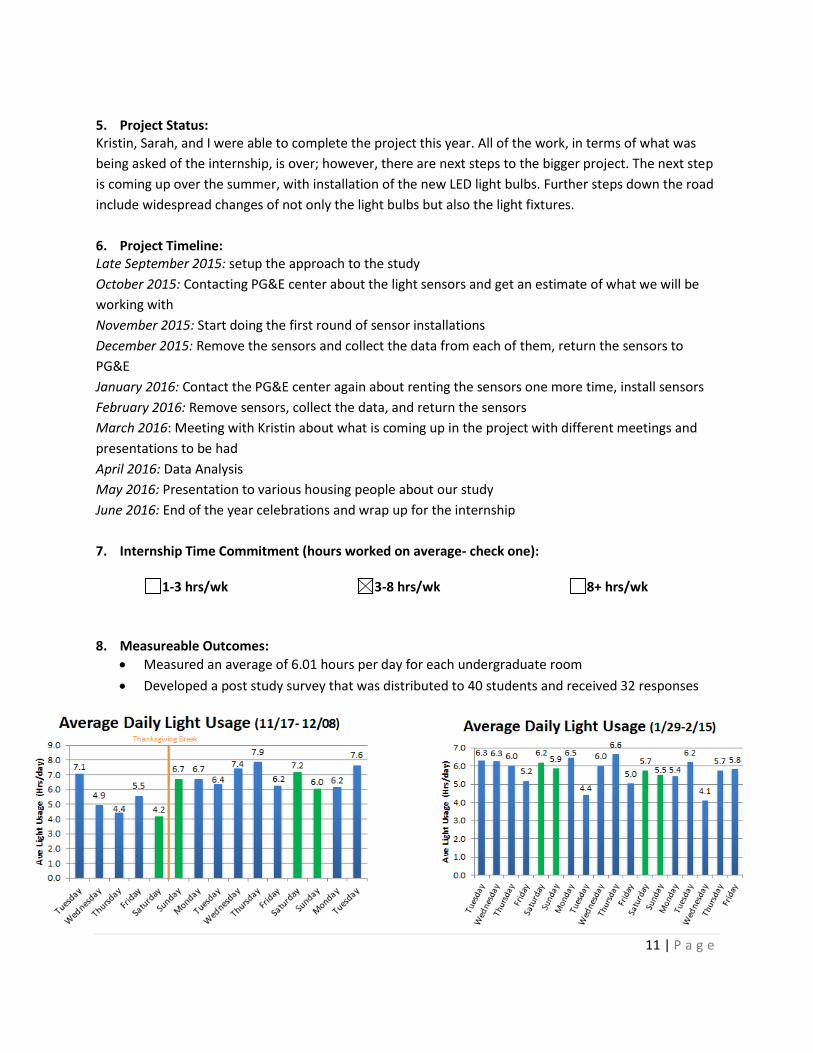
8. Measureable Outcomes:
Measured an average of 6.01 hours per day for each undergraduate room
Developed a post study survey that was distributed to 40 students and received 32 responses

12 | P a g e
9. Project Highlights/Favorite Moments:
This project was great to work on because Sarah and Kristin were incredible to work with. There was
never a dull moment working with these two and I am really lucky/happy that I had the opportunity
to work with them.
10. Project Challenges/Lessons Learned: I think the one main challenge we faced was getting responses for any survey we would send out.
Some people were just unresponsive no matter how many emails you would send them or any
incentives you would give.
11. Resources Used/Contacts Established: I worked with the PG&E Lending Library primarily
http://www.pge.com/mybusiness/edusafety/training/pec/toolbox/tll/form/index.jsp?WT.mc_id=Va
nity_pectll. Website can be found above and any contact information came from the request email
address.

13 | P a g e
Measuring Composting in Campus Cafes
1. Team Members: Brittany Morra and Lauren Block
2. Supervisor: Julie Muir
3. Internship Title: Zero Waste Intern
4. Project Summary: Our primary purpose was to help the cafés on campus improve their composting and waste programs. We devised a yearlong cycle to address this, consisting of an initial survey and evaluation, followed by a recommendation template and guidelines for further actions. The first step was to devise a survey of criteria necessary to determine the current success of the café’s waste system. We created a series of categories, including tostay materials, togo materials, reusable incentives, bin types, bin locations, correct bagging, colorcoding, and signage. We also devised a quantitative and quasibinary grading system based on factors in that category. For each feature, which we explain clearly in a rubric included in the appendix, we gave a 1 if the café possessed the feature and a 0 if they did not (certain features permitted a 0.5). We then visited every café and assessed their systems based on these criteria. We ranked the cafés based on their scores out of their total possible scores. Given the varying setups of the cafés, not all cafés could possibly obtain all possible points (for instance, some cafés have no potential for a tostay option), so we ranked them on a percentage of their possible points they obtained. Furthermore, we only shared the rankings with cafés below the top 25% because studies show that otherwise the top cafés would regress towards the mean and begin to perform more poorly. Using the evaluations, we created a recommendations template including a brief explanation of the project, the action items for improvement, an explanation of their score and the rubric, and resources for signage and the waste system on campus. We also included a list of recommended items the cafés could use to replace their noncompostables with. The next steps are to distribute these recommendations and help the cafés move forwards on these steps.
5. Project Status: The surveys for this year are complete. The recommendations are almost finished and will be by the end of the year. Moving on, they will be distributed over the summer and we will help lead the cafés through implementation.

14 | P a g e
6. Project Timeline:
By the end of November we had created a survey template.
By the end of January, we had surveyed all the cafés.
Over winter quarter, we created and recreated the recommendations template and began to fill them in for the various cafés.
By the end of the year, we will have completed all the recommendations.
Over the summer, we will work with the cafés to help them implement the recommended actions. This will likely continue for several months afterwards and, in truth, is an ongoing process.
Next fall quarter, the surveys will be conducted again and the cycle will continue. 12. Internship Time Commitment (hours worked on average- check one):
1-3 hrs/wk 3-8 hrs/wk 8+ hrs/wk
7. Measureable Outcomes:
Created a generalized set of criteria to survey the cafés
Created a quantitative rubric for grading cafés on these criteria
Surveyed every café on campus using this set of criteria
Developed a recommendation template for cafés
Filled out the recommendation template for each café
Privately ranked cafés based on their qualitative scores
Developed guidelines for sharing the information with the cafés
8. Project Highlights/Favorite Moments: The very first café survey, Brittany and I went together to the Bookstore Café. Unsure of what we were doing, we had many awkward incidents with the workers while gathering information. We were surprised by how many points the café was missing, especially taken aback by the issues with the bins. Looking back, the naiveté of that moment is as sadly amusing as our discovery that all bags were being put in the landfill dumpster.
9. Project Challenges/Lessons Learned: Sometimes, gathering the information could be difficult. It pays to be straightforward and to gather what is necessary. People do not notice or care if others are searching through the bins or grabbing a couple extra spoon samples. The entirely quantitative surveying of the cafés turned out to be highly useful because of its inarguable and objective nature. Taking a binary approach, in particular, with a clear rubric makes the system defensible and durable.
15 | P a g e
Establishing a Baseline for Cardinal Green Athletics
1. Team Members: Benjamin Churnside
2. Supervisor: Moira Hafer
3. Internship Title: Athletics Intern
4. Project Summary: During the fall quarter, I spent my time putting together a milestone review for Stanford’s athletic
department. Within this report, I noted any steps taken by Stanford that promoted sustainability or
made the athletic department and its several facilities more “green” overall. The report is now used as
an easy reference tool in order to keep track of any progress or changes that the athletic department
has made. Several sustainability-related categories were featured in the report including energy, waste
management and water use. Alongside this report, I also compiled a similar report for all of the schools
within the PAC 12.
In the winter and spring quarter, I worked on improving waste management within Stanford’s athletic
department through a waste bin project. I inventoried several athletic facilities to determine number of
trash, recycling and composting bins present at each location. After noting this, I put together a waste
bin report to assess the current state of waste management at Stanford athletic facilities. The report
outlined bin counts, landfill diversion rates and any recommended actions that could be executed in
order to make any improvements. Based on the report, I worked with Moira and several others to
determine the new types of bins that would be purchased as well as determining the placement of these
new bins.
5. Project Status: The sustainability report was completed at the
end of fall quarter. The waste bin project is still
underway. Currently, funds have been set aside
for the purchasing of the new waste bins. Also,
we have determined the exact locations of where
the bins will actually be placed. Now, the next
step will be to place the order for the bins and
actually install them into the various locations.
16 | P a g e
6. Project Timeline: November: Completed Stanford Milestone Review & Completed PAC 12 Sustainability Report
February: Completed bin inventory of athletic facilities
March: Created list of recommendations for improving waste management efforts of Stanford’s athletic
department. Determined potential savings and diversion rates of different facilities inventoried.
April: Completed Waste Bin Report
June: Exact locations of new bins determined
7. Internship Time Commitment (hours worked on average- check one):
1-3 hrs/wk 3-8 hrs/wk 8+ hrs/wk
8. Measureable Outcomes:
Created a milestone review of Stanford athletics’ sustainability efforts
Created a PAC 12 sustainability report outlining the sustainability efforts made by other schools
Inventoried several athletic department facilities to determine different amounts of waste bins
Analyzed potential costs and savings for the athletic department if new bins were to be purchased
Developed a list of recommendations that could be used by the athletic department to improve their waste management efforts
Created a waste bin report to outline the current state of waste management for the athletic department
Determined number of new bins and the locations of where they will be placed throughout athletic facilities
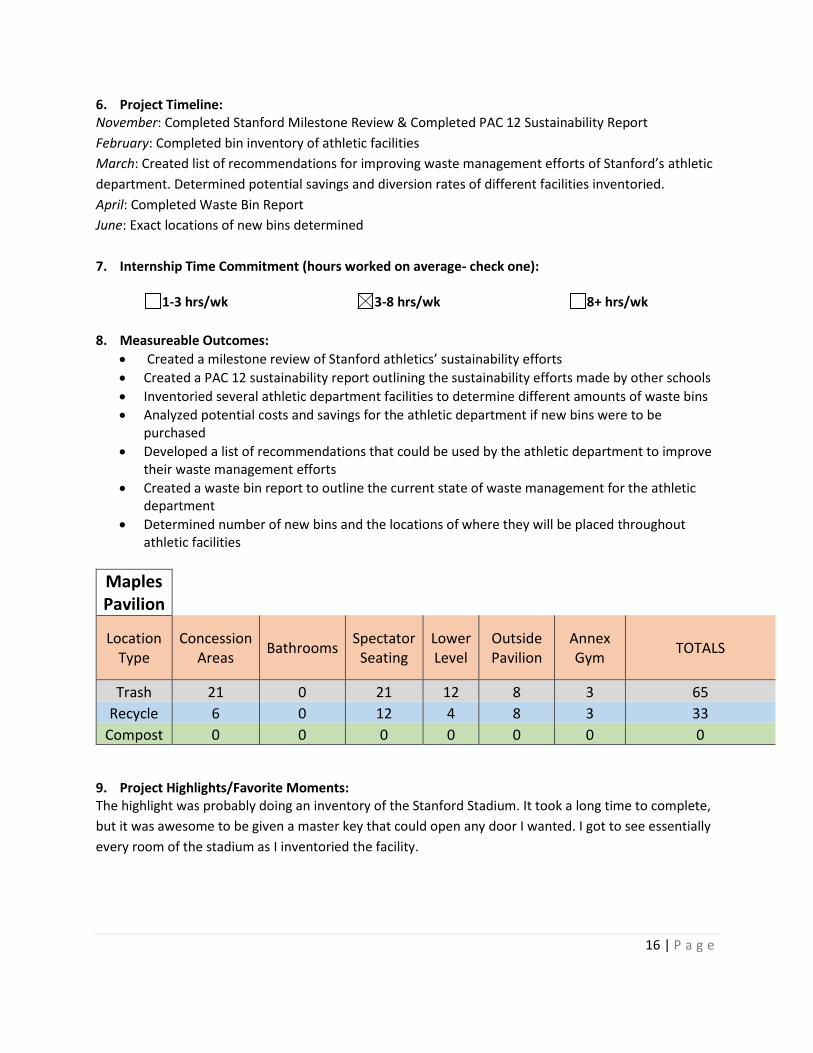
Maples Pavilion
Location Type
Concession Areas
Bathrooms Spectator
Seating Lower Level
Outside Pavilion
Annex Gym
TOTALS
Trash 21 0 21 12 8 3 65
Recycle 6 0 12 4 8 3 33
Compost 0 0 0 0 0 0 0
9. Project Highlights/Favorite Moments: The highlight was probably doing an inventory of the Stanford Stadium. It took a long time to complete,
but it was awesome to be given a master key that could open any door I wanted. I got to see essentially
every room of the stadium as I inventoried the facility.

17 | P a g e
10. Project Challenges/Lessons Learned: The biggest challenge was realizing how many areas that the athletic department can improve in. It was
a challenge in that it was easy to get caught up in multiple areas at once when you need to simply tackle
one problem at a time. That way, instead of starting multiple projects, you can commit to finishing one
at a time and making sure it actually gets completed.
18 | P a g e
Engaging the Campus in Conservation Campaigns
1. Team Member (s): Darel Scott
2. Supervisor: Meghan Brightwater 3. Internship Title: Outreach and Engagement Intern 4. Project Summary: My primary projects and activities were supporting Sustainable Stanford campaigns (i.e., Recyclemania,
Water Wise, Give and Go) by recruiting volunteers, advertising the events, tabling to get campus
involvement, and setup, takedown, and activities at the respective events. I was also in charge of making
weekly social media posts for Twitter that highlighted on and off campus sustainability, attending and
facilitating parts of Stanford Student Working Group (SSWG) meeting, and helping to discuss and
brainstorm the future of the campus Green Store.
My secondary project was working with the Black Community Services Center (BCSC) on a sustainability
plan, which essentially was aimed to make the BCSC more sustainable from building energy intensity to
the waste disposal.
Although not a part of my primary or secondary projects, through my sorority, Alpha Kappa Alpha
Sorority Inc., I was able to head a committee that hosted an event entitled Fresh on the Farm. This event
was a Cardinal Green picnic at the Terman Fountain. Attendees played sustainability games that
educated on proper waste sorting, ate vegan food from Veggie Grill, and won raffle prizes for their
participation. This event served the food with compostable materials. Lastly, through a class called the
Advanced Design Thinking Studio, I conducted a design study on how to improve waste sorting efficiency
in Tresidder.
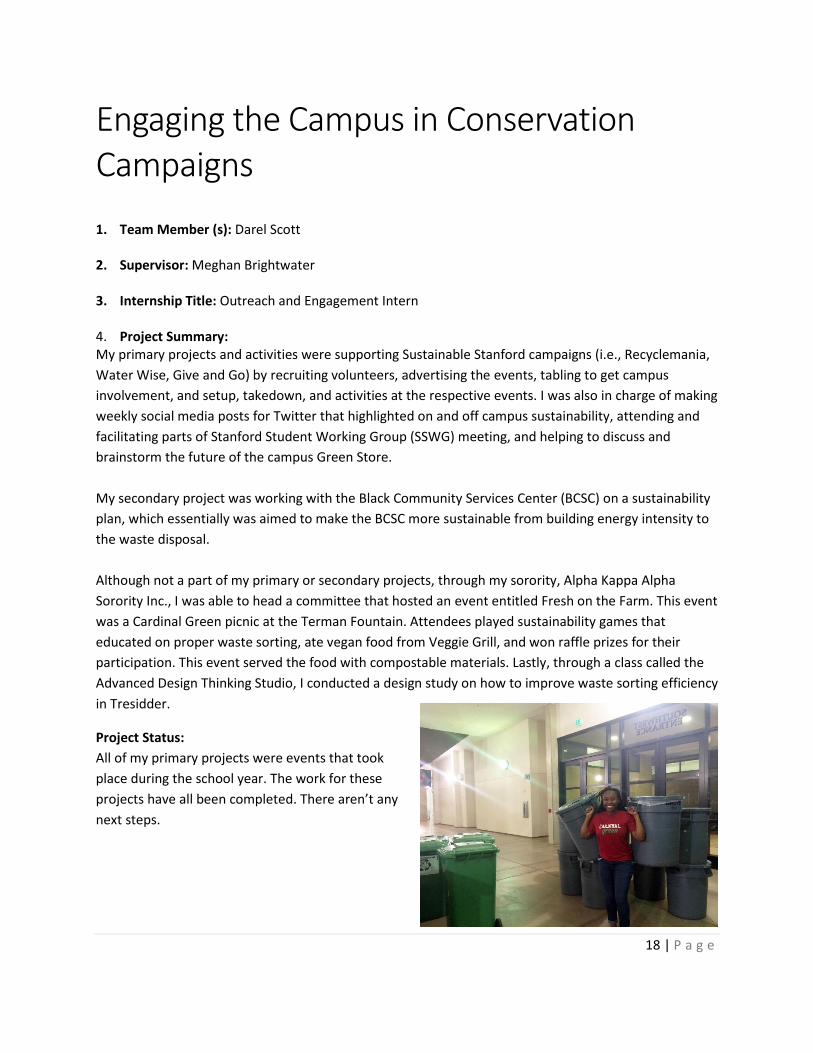
Project Status:
All of my primary projects were events that took
place during the school year. The work for these
projects have all been completed. There aren’t any
next steps.
19 | P a g e
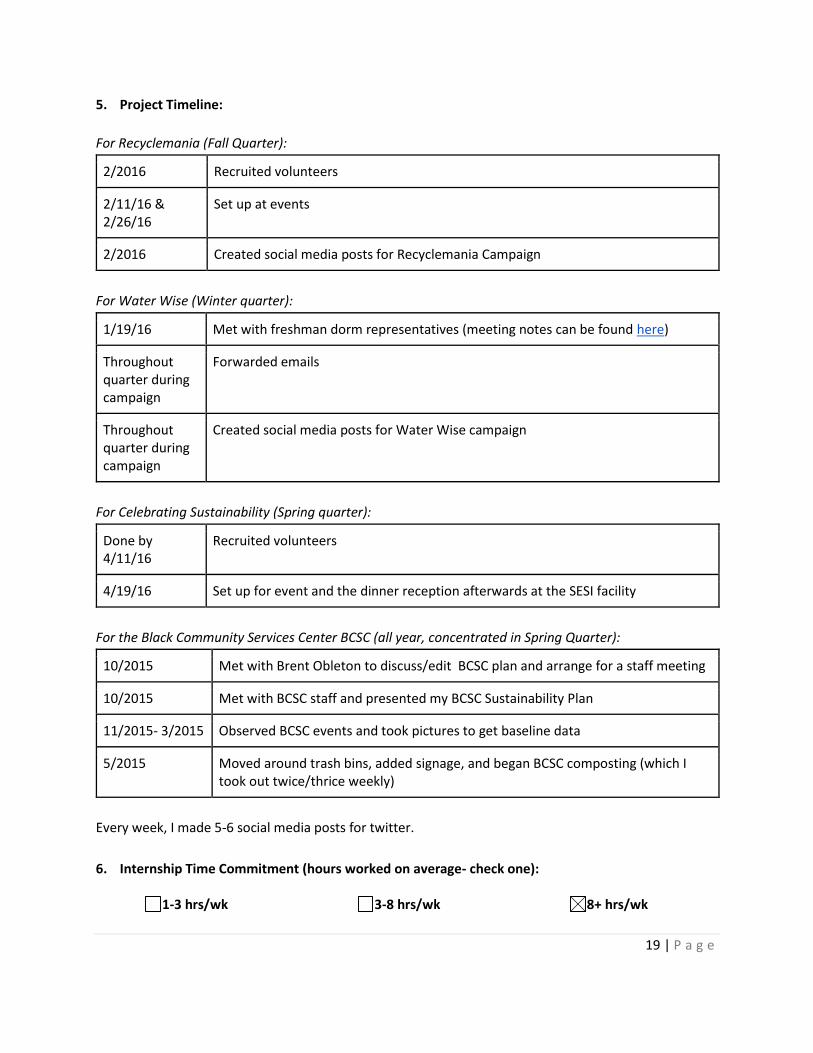
5. Project Timeline:
For Recyclemania (Fall Quarter):
2/2016 Recruited volunteers
2/11/16 & 2/26/16
Set up at events
2/2016 Created social media posts for Recyclemania Campaign
For Water Wise (Winter quarter):
1/19/16 Met with freshman dorm representatives (meeting notes can be found here)
Throughout quarter during campaign
Forwarded emails
Throughout quarter during campaign
Created social media posts for Water Wise campaign
For Celebrating Sustainability (Spring quarter):
Done by 4/11/16
Recruited volunteers
4/19/16 Set up for event and the dinner reception afterwards at the SESI facility
For the Black Community Services Center BCSC (all year, concentrated in Spring Quarter):
10/2015 Met with Brent Obleton to discuss/edit BCSC plan and arrange for a staff meeting
10/2015 Met with BCSC staff and presented my BCSC Sustainability Plan
11/2015- 3/2015 Observed BCSC events and took pictures to get baseline data
5/2015 Moved around trash bins, added signage, and began BCSC composting (which I took out twice/thrice weekly)
Every week, I made 5-6 social media posts for twitter.
6. Internship Time Commitment (hours worked on average- check one):
1-3 hrs/wk 3-8 hrs/wk 8+ hrs/wk

20 | P a g e
7. Measureable Outcomes: ● Conversed with students on campus, in and outside of the classroom, about environmental
sustainability ● Taught students and staff on proper waste sorting (using PSSI’s system) by playing waste sorting
games ● Recruited volunteers for events ● Set up signage, waste bins, and tables at events ● Created social media posts for Twitter (@SustainableStanford) ● Set up waste sorting infrastructure and signage in the Black Community Services Center (BCSC) ● Started conversations about sustainable living and what that looks like in the BCSC ● Tracked waste sorting practice in the BCSC for one month to get baseline qualitative data on
waste sorting ● Changed compost bins twice or thrice a week for 3 weeks to test whether composting could be a
viable option for the BCSC in the future 8. Project Highlights/Favorite Moments: I thoroughly enjoyed working at the Celebrating Sustainability dinner at the SESI facility. It was fun setting up and decorating. During Recyclemania, it was really nice to be able to include my sorority sisters in the game day sustainability volunteering. For my secondary project, I was very proud to see that my project got staff members thinking about sustainability. Compost bins were ordered for an event after I had talked to staff members about making BCSC events more sustainable. One highlight from Fresh on the Farm was when people got into the waste sorting game. They were all really excited and that excitement spread through the events. It was very nice to see people get so pumped about sorting waste correctly. 9. Project Challenges/Lessons Learned: For my primary projects, it was a little difficult getting
volunteers for event and getting people interested during
tabling. I found that incentives are very important for
getting volunteers and for tabling having a concise “elevator
pitch” is very important.
For my personal project, I hit a lot of roadblocks because I
did not have as much support as I thought I would from
BCSC staff and leadership. This made it difficult to enact
policies and BCSC plans/changes. I found that I just had to
take the lead and ask for forgiveness. I ended up never
having to ask for forgiveness because most people were
appreciative of my work. I also found it difficult to get
people to be sustainable even after I set up the waste
sorting infrastructure. My next steps would be educating

21 | P a g e
staff on how to make their events more sustainable and finding ways to enact policies or social norms
that surround sustainable behavior in the community center (e.g., a bring your own water bottle policy,
putting smart strips on the computers and printers, only purchasing compostable materials for events).
10. Resources Used/Contacts Established: On campus, I worked with Brent Obleton ([email protected]) at the Black Community Services Center and Mark Jordan ([email protected]) at The Axe & Palm. I did not work with any organization off campus.
22 | P a g e
Communicating Zero Waste Efforts to the Campus Community
1. Team Members: Alison Chen
2. Supervisor: Julie Muir
3. Internship Title: Zero Waste Intern (Events)
4. Project Summary: Social Media: My main endeavor with social media this year was creating and managing a Facebook
page for PSSI/Stanford Recycling. Currently, I make posts throughout the week that feature
sustainability news and events on campus, as well as environmentally-focused articles, videos, and
websites. I also create content to be shared on the page as well, such as graphics to showcase Stanford’s
weekly RecycleMania achievements and campus sustainability interns.
Cardinal Green Event Feedback: The event feedback template emerged from the desire to create a
simple and concise way to communicate with various campus event organizers how they could improve
their event sustainability and limit the waste they produced. Starting from scratch this year, I began by
creating a template with guidelines that could be used to evaluate events. After refining the template, I
started attending Cardinal Green Events and evaluating their sustainability and zero waste practices.
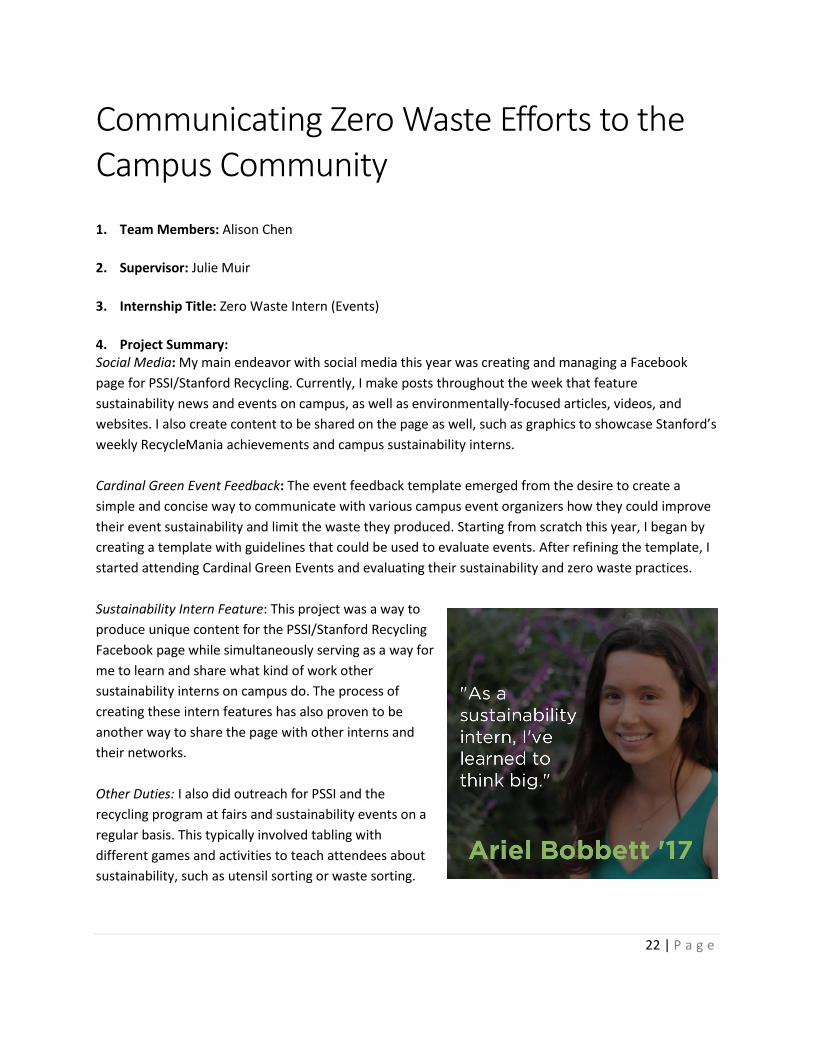
Sustainability Intern Feature: This project was a way to
produce unique content for the PSSI/Stanford Recycling
Facebook page while simultaneously serving as a way for
me to learn and share what kind of work other
sustainability interns on campus do. The process of
creating these intern features has also proven to be
another way to share the page with other interns and
their networks.
Other Duties: I also did outreach for PSSI and the
recycling program at fairs and sustainability events on a
regular basis. This typically involved tabling with
different games and activities to teach attendees about
sustainability, such as utensil sorting or waste sorting.

23 | P a g e
5. Project Status:
My social media project is still ongoing, indefinitely. Future work on social media will include efforts to
expand PSSI/Stanford Recycling’s social media followers, as well as increase engagement with our
current followers. To expand our social media audience, I am hoping to promote the Facebook page at
any future tabling events we attend, as well as potential intern socials where other interns and students
can come meet us and learn about the work we do.
The Cardinal Green Event Feedback is also ongoing. Going forward, I would like to develop evaluation
guidelines that are more objective, similar to the criteria used to evaluate café sustainability on campus.
Hopefully, this will produce more consistent feedback and enable multiple interns to attend and
consistently evaluate more events in the future.
6. Project Timeline:
Social Media
January
Start Facebook page February
Initiate RecycleMania highlights March
Reach out for Sustainability Intern Feature participants
Continue RecycleMania highlights April
Wrap up RecycleMania highlights
Begin posting Sustainability Intern Features May
Continue posting Sustainability Intern Features June
Continue Sustainability Intern Features
Cardinal Green Events Feedback
November
Develop feedback template December
Meet with Julie and refine template January
Meet with Meghan and discuss Cardinal Green Events February
Begin evaluation
Evaluate Winter Harvest Festival March
Evaluate BeWell Wellness Fair - April
24 | P a g e
o Evaluate Celebrating Sustainability Fair o Evaluate Earthfest
7. Internship Time Commitment (hours worked on average- check one):
1-3 hrs/wk 3-8 hrs/wk 8+ hrs/wk
8. Measureable Outcomes: Describe the measurable outcomes of your primary and secondary projects during this internship.
- Gained 32 likes on Facebook - Emailed 34 sustainability interns to participate in Sustainability Intern Feature - Received 17 submissions for Sustainability Intern Feature - Created 5 RecycleMania highlights and shared on Facebook - Created 3 Sustainability Intern Features and shared on Facebook - Attended and evaluated 4 campus events, including 3 Cardinal Green Events
9. Project Highlights/Favorite Moments:
One of my favorite moments was talking to prospective freshman at Earthfest, organized by
Students for a Sustainable Stanford. It was really interesting to interact with people who were
entirely unfamiliar with Stanford’s waste sorting program and educate them knowing that they
were coming from that perspective.
10. Project Challenges/Lessons Learned:
One of the major challenges I faced with social media was expanding our followership after I created the
Facebook page. Once we started growing our audience, how to engage with people through our posts
also became a consideration.
A major lesson I learned with online engagement was that people tend to be more responsive to links
that can be clicked, such as videos or websites. Furthermore, I discovered that sharing posts from PSSI’s
page using my personal Facebook account was the most
effective way to increase the amount of people that a
post reached and, subsequently, the amount of
engagement it received.
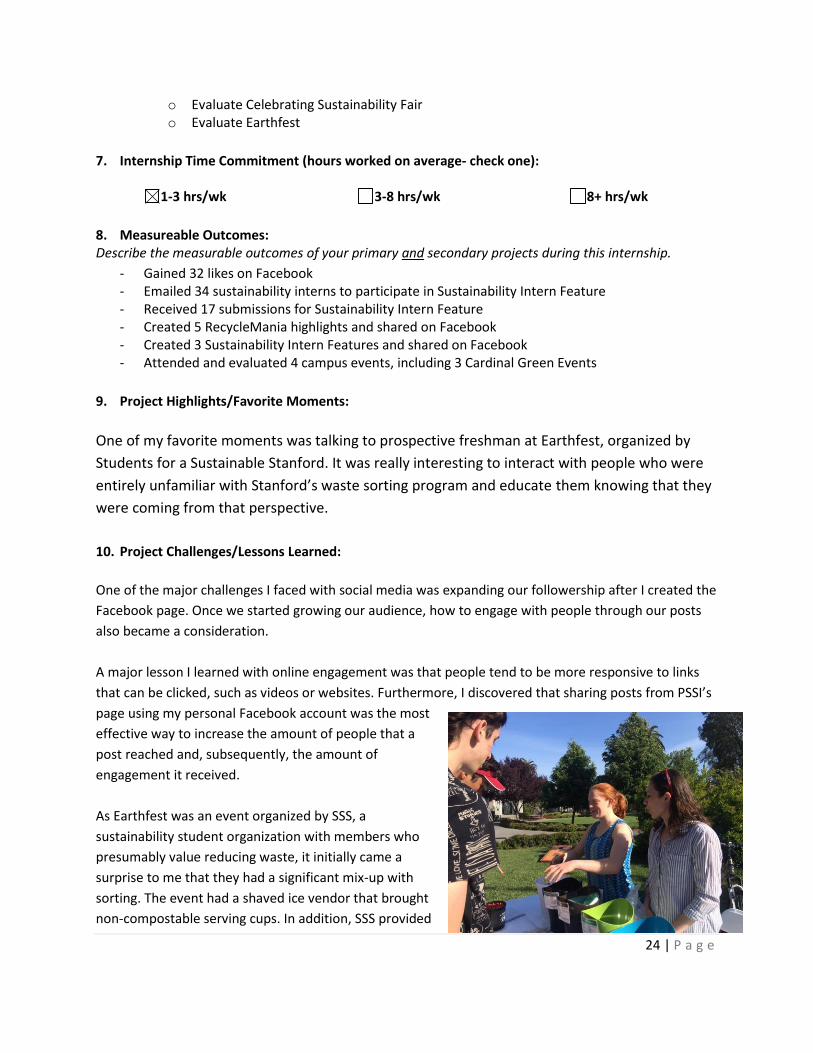
As Earthfest was an event organized by SSS, a
sustainability student organization with members who
presumably value reducing waste, it initially came a
surprise to me that they had a significant mix-up with
sorting. The event had a shaved ice vendor that brought
non-compostable serving cups. In addition, SSS provided

25 | P a g e
the spoons, which were also non-compostable. However, the event organizers put up signs indicating
that shaved ice cups and spoons should be deposited in the compost bins when both should have
actually gone in the landfill. That event taught me that, oftentimes, even good intention is not sufficient
to reach zero waste. Ultimately, it’s education that makes a difference.