2015 actuarial report on the financial … · 2015 actuarial report on the financial outlook ......
TRANSCRIPT

Department of Health & Human Services
2015 ACTUARIAL REPORT
ON THE FINANCIAL OUTLOOK
FOR MEDICAID
Office of the Actuary
Centers for Medicare & Medicaid Services
United States Department of Health & Human Services


Report to Congress
2015 ACTUARIAL REPORT ON THE FINANCIAL OUTLOOK FOR
MEDICAID
Sylvia Mathews Burwell
Secretary of Health and Human Services
2015


2015 ACTUARIAL REPORT
ON THE FINANCIAL OUTLOOK
FOR MEDICAID
Prepared by:
Christopher J. Truffer, FSA, MAAA
Christian J. Wolfe, FSA, MAAA
Kathryn E. Rennie, ASA
Office of the Actuary
Centers for Medicare & Medicaid Services
United States Department of Health & Human Services


i
STATEMENT FROM THE CHIEF ACTUARY
The Medicaid program is of critical importance to American society. It is the second
largest health program as measured by expenditures (second only to Medicare) and
the largest as measured by enrollment, and Medicaid represents one-sixth of the
health economy. In 2014, its outlays of $497 billion accounted for a sizeable portion
of Federal and State budgets and were a significant source of revenue for health care
providers and insurers. As importantly, Medicaid serves as a safety net for the
Nation’s most vulnerable populations, covering about 64 million beneficiaries in 2014,
including those newly eligible under the Medicaid expansion. In this report, we
analyze key historical Medicaid trends—both financial and demographic—and
include projections of expenditures and enrollment to inform the public and help
policy makers gain insight into the future of the program.
Projections of health care costs are inherently uncertain. For Medicaid, such
projections present an even greater challenge as enrollment and costs are very
sensitive to economic conditions. The economic assumptions used to generate the
Medicaid projections in this report are the same as those used by the 2015 OASDI
and Medicare Boards of Trustees in their annual reports to Congress.
It is my opinion that (i) the techniques and methodology used herein to project the
future costs of the Medicaid program are based upon sound principles of actuarial
practice and are generally accepted within the actuarial profession, and (ii) the
principal assumptions and resulting actuarial estimates are, individually and in the
aggregate, reasonable for the purpose of projecting such costs under current law.
Considering the substantial uncertainties inherent in projecting future health care
costs, readers should be aware that actual future Medicaid costs could differ
significantly from these estimates.
I would like to thank team leader Chris Truffer and team members C.J. Wolfe and
Kathryn Rennie for their diligent efforts in preparing this report. We welcome
feedback from readers; comments may be sent to [email protected].
Paul Spitalnic, ASA, MAAA
Chief Actuary
Centers for Medicare & Medicaid Services

ii
EXECUTIVE SUMMARY
The joint Federal-State Medicaid program provides health care assistance to certain
low-income people and is one of the largest payers for health care in the United
States. This report presents an analysis of past Medicaid trends and 10-year
projections of expenditures and enrollment, including the impacts of the 2014
eligibility changes under the Affordable Care Act. Like other projections of future
health care costs and coverage, these projections are subject to uncertainty.
HIGHLIGHTS AND FINDINGS
2014 Medicaid Information
Total Medicaid outlays in Federal fiscal year (FY) 2014 were $496.3 billion;
$301.5 billion or 61 percent represented Federal spending, and $194.8 billion
or 39 percent represented State spending. Medicaid outlays increased by
8.4 percent between 2013 and 2014 due primarily to Medicaid eligibility
expansion under the Affordable Care Act, and Federal Medicaid outlays
increased by 13.6 percent.
Medicaid provided health care assistance for an estimated 64.0 million people
on average in 2014, including 4.3 million newly eligible adults in the first
9 months of Affordable Care Act eligibility expansions. Enrollment is
estimated to have grown by 9.2 percent between 2013 and 2014; excluding
newly eligible adults, enrollment growth is estimated to have been 1.8 percent.
Per enrollee spending for health goods and services is estimated to have been
$7,315 in 2014. Estimated per enrollee spending for children ($3,141), non-
newly eligible adults ($4,914), and newly eligible adults ($5,488) was much
lower than that for aged enrollees ($15,113) and enrollees with disabilities
($18,789), reflecting the differing health statuses of, and use of goods and
services by, the members of these groups. Per enrollee spending is estimated
to have increased 0.1 percent between 2013 and 2014, largely due to the
introduction of newly eligible adults, whose per enrollee costs were lower than
the average per enrollee cost. (These figures exclude expenditures for U.S.
Territories, administration, disproportionate share hospital payments, and
unallocated collections and prior period adjustments.) Excluding newly eligible
adults, per enrollee costs are estimated to have increased 2.0 percent in 2014.
2015 Medicaid Estimates
Medicaid expenditures are estimated to have increased 12.1 percent to
$554.3 billion in 2015. Because the Federal government paid for 100 percent of
the costs of newly eligible enrollees and the number of these enrollees doubled
in 2015, the Federal share of all Medicaid expenditures is estimated to have
increased to 63 percent in 2015 (from 61 percent in 2014), and Federal
iii
expenditures are estimated to have grown 16.2 percent to $347.5 billion. State
Medicaid expenditures are estimated to have increased 5.9 percent to
$206.8 billion.
Average Medicaid enrollment is estimated to have increased 7.7 percent to
68.9 million people in 2015. Nearly all of the growth in enrollment is estimated
to have been among newly eligible adults (4.8 million of the 4.9-million
increase).
10-Year Medicaid Projections (2015-2024)
Over the next 10 years, expenditures are projected to increase at an average
annual rate of 6.4 percent and to reach $920.5 billion by 2024.
Average enrollment is projected to increase at an average annual rate of
1.9 percent over the next 10 years and to reach 77.5 million in 2024.
Impacts of the Eligibility Changes under the Affordable Care Act
Medicaid expenditures for adults newly eligible under the Affordable Care Act
are projected to amount to $717 billion over the period 2015 through 2024.
Most of this increase—$667 billion, or about 93 percent—is projected to be paid
by the Federal government.
The expansion is estimated to have increased average annual enrollment by
4.3 million people in FY 2014 (or 6.3 million in calendar year 2014) and by a
projected 11.8 million people by 2024. These estimates are based on 2014 data,
preliminary 2015 data, and the assumption that additional States would
expand eligibility, such that 45 percent of potentially newly eligible enrollees
resided in States that expanded Medicaid eligibility in 2014, 50 percent resided
in States that expanded eligibility in 2015 and 2016, and 55 percent reside in
States that would expand eligibility by 2017 and later years.
Most States covered newly eligible adults through managed care programs and
used risk mitigation strategies to offset the risks that the costs of the newly
eligible adults were greater, or less, than projected. The most common
approaches were risk corridors and minimum medical loss ratios. Based on the
anticipated results of these approaches in 2014 and 2015, the Federal
government is expected to receive payments from managed care plans in 2016
and 2017, reflecting lower beneficiary costs in 2014 and 2015 than were
anticipated when the managed care capitation rates were initially developed
for those years.

iv
CONTENTS
STATEMENT FROM THE CHIEF ACTUARY ............................................................. i
EXECUTIVE SUMMARY ............................................................................................. ii
CONTENTS .................................................................................................................. iv
I. INTRODUCTION ....................................................................................................... 1
II. OVERVIEW OF MEDICAID .................................................................................... 2
III. ACTUARIAL ANALYSIS ........................................................................................ 5
A. FISCAL YEAR 2014 MEDICAID OUTLAYS AND ENROLLMENT ................ 5
B. HISTORICAL MEDICAID TRENDS ................................................................ 10
C. MEDICAID EXPENDITURES AND ENROLLMENT PROJECTIONS,
FISCAL YEARS 2015–2024 ............................................................................. 13
D. IMPACTS OF THE MEDICAID ELIGIBILITY EXPANSION ........................ 26
E. COMPARISON TO 2014 REPORT PROJECTIONS ....................................... 30
F. MEDICAID IN CONTEXT ................................................................................ 32
IV. SUMMARY OF DATA, ASSUMPTIONS, AND METHODOLOGY .................... 37
V. CONCLUSION ........................................................................................................ 45
VI. APPENDIX ............................................................................................................ 47
A. DATA SOURCES ............................................................................................... 47
B. KEY ASSUMPTIONS ........................................................................................ 53
C. RESIDUAL ANALYSIS RESULTS AND ASSUMPTIONS ............................. 57
D. DATA FOR SELECTED FIGURES .................................................................. 62
E. FINANCIAL MANAGEMENT REPORT DATA .............................................. 67

1
I. INTRODUCTION
Medicaid is a cooperative program between the Federal and State governments to
pay for health care and medical services for certain low-income persons in the United
States and its Territories. The Federal and the State governments share
responsibilities in designing, administering, and funding the program. The Centers
for Medicare & Medicaid Services (CMS) is the agency charged with administering
Medicaid for the Federal government.
This is the seventh annual Medicaid report prepared by the Office of the Actuary
(OACT) at CMS. Its purpose is to describe the past and projected trends for Medicaid
expenditures and enrollment, including estimates for Federal fiscal year (FY) 2015
and projections over the next 10 years. It also describes the data available on
Medicaid spending and enrollment, as well as the methodology and assumptions used
in the projections. Finally, this report places the Medicaid program within the context
of Federal and State government spending and the U.S. health care system.

2
II. OVERVIEW OF MEDICAID
Authorized by Title XIX of the Social Security Act, Medicaid was signed into law in
1965 and is an optional program for the States. Currently all States, the District of
Columbia, and all of the Territories have Medicaid programs.1
The Federal government establishes certain requirements for the States’ Medicaid
programs. The States then administer their own programs, determining the eligibility
of applicants, deciding which health services to cover, setting provider reimbursement
rates, paying for a portion of the total program, and processing claims.
Eligibility for enrollment in Medicaid is determined by both Federal and State law.
Title XIX of the Social Security Act specifies which groups of people must be eligible,
and States have the flexibility to extend coverage to additional groups. In addition to
income, eligibility is typically based on several other factors, including age, disability
status, other government assistance, other health or medical conditions such as
pregnancy, and in some cases financial resources (or assets). Beginning January
2014, the Affordable Care Act provides the States the authority under their State
plans to expand Medicaid eligibility to almost all individuals under age 65 who are
living in families with income below 138 percent of the Federal poverty level (FPL)
(and who are citizens or eligible legal residents), with the Federal government paying
100 percent of the costs for newly eligible adults.2 (In addition, the Affordable Care
Act also simplified eligibility processes for most adults, children, and pregnant
women who are covered by Medicaid.)
Title XIX specifies that certain medical services must be covered under Medicaid,
while also granting the States flexibility to cover many other benefits. Services
usually covered include hospital care, physician services, laboratory and other
diagnostic tests, prescription drugs, dental care, and many long-term care services.
The States also have the options to use managed care plans to provide and coordinate
benefits and States may apply for waivers of certain requirements that allow more
flexibility in developing specialized benefit packages for specific populations.
Generally, States must provide the same benefit package to all core Medicaid
enrollees Exceptions to these requirements include the use of waivers, demonstration
1 For more information on Medicaid, including information on eligibility and covered services, see
B. Klees, C. Wolfe, and C. Curtis, “Brief Summaries of Medicare & Medicaid,” November 2015
(https://www.cms.gov/Research-Statistics-Data-and-Systems/Statistics-Trends-and-Reports/
MedicareProgramRatesStats/Downloads/MedicareMedicaidSummaries2015.pdf). 2 The estimated impacts of the expansion of Medicaid eligibility on enrollment and expenditures are
presented in the Actuarial Analysis section of this report. The Affordable Care Act technically specifies
an upper income threshold of 133 percent of the FPL but also allows a 5-percent income disregard,
making the effective threshold 138 percent. The Supreme Court ruling in National Federation of
Independent Business v. Sebelius, 132 S. Ct. 2566 (2012), provided that a State may not lose Federal
funding for its existing program when it does not implement the Medicaid eligibility expansion under
the Affordable Care Act.

3
projects, and alternative benefit plans; notably, States must provide an alternative
benefit plan, including all essential health benefits, to the new adult population
under the Affordable Care Act. In addition, there may be limited benefits provided
for individuals who are eligible based only on medical need, through Medicare savings
programs, or through special family planning groups.3
The Federal government and the States share the responsibility for funding
Medicaid. States pay providers or managed care organizations for Medicaid costs and
then report these payments to CMS. The Federal government pays for a percentage
of the costs of medical services by reimbursing each State; this percentage, known as
the Federal Medical Assistance Percentage (FMAP), is calculated annually for each
State based on a statutory formula that takes into account State per capita income
with some adjustments prescribed by legislation.4 Notably, the Affordable Care Act
specifies FMAPs for adult beneficiaries who are newly eligible as a result of the
Medicaid expansion that began in 2014 (in States that implement the expansion).
Additionally, the Federal government pays for a portion of each State’s
administration costs. Beneficiary cost sharing, such as deductibles or co-payments,
and beneficiary premiums are very limited in Medicaid and do not represent a
significant share of the total cost of health care goods and services for Medicaid
enrollees.
In contrast to the Federal Medicare program, Medicaid’s financial operations are not
financed through trust funds. Other than a very small amount of premium revenue
from enrollees, as noted above, and some other sources of State revenue (such as some
provider taxes), there are no dedicated revenue sources comparable to the Medicare
Hospital Insurance payroll tax. Medicaid costs are met primarily by Federal and
State general revenues, on an as-needed basis; the States may also rely on local
government revenues to finance a portion of their share of Medicaid costs. The
Federal financing is authorized through an annual appropriation by Congress. These
funds are then spent through daily draws from the general fund of the Treasury in
the amounts required to pay that day’s Federal matching amounts on the State
program expenditures. As a result, Medicaid outlays and revenues are automatically
in financial balance, there is no need to maintain a contingency reserve, and, unlike
Medicare, the “financial status” of the program is not in question from an actuarial
perspective.
3 The Medicare Savings Programs provide assistance to low-income aged persons and persons with
disabilities for their share of Medicare costs. Different programs cover a combination of the
beneficiary’s Part A premium, Part B premium, Part A deductible, and Part B cost-sharing
requirements. 4 In general, Title XIX specifies that the FMAP for each State cannot be lower than 50 percent or
higher than 83 percent; in FY 2014, FMAPs ranged from 50.00 percent to 73.05 percent. Also, Title XIX
provides for specific FMAP levels for certain States and, in some cases, for specific services or
populations.

4
Medicaid coverage is extremely valuable to the low-income individuals and families
who qualify for the health care services provided by the program. By extension, the
program is also valuable to society at large, as it enables the least-fortunate members
of the population to obtain the health care they need in an orderly way. Furthermore,
the program provides financial benefits to entities including governments and health
care providers that may otherwise not be compensated for providing health care
services to these individuals and families. It is also important, of course, to consider
the costs to society of providing this coverage and to anticipate likely future trends in
such costs. The balance of this report is intended to describe these trends.5
5 This report does not cover expenditures or enrollment under the Children’s Health Insurance
Program (CHIP), whether such expenditures are made for a program operated under Title XIX or Title
XXI of the Social Security Act. CHIP provides health coverage to many children in households with
income above Medicaid eligibility levels. CHIP funding is authorized only through 2017. Should CHIP
funding not be reauthorized, Federal payment would continue for children enrolled in Medicaid
expansion CHIP at the regular Medicaid matching rate. For the purpose of this report, CHIP is
assumed to be fully funded through the entire projection period, and there are no assumed increases
in Medicaid expenditures or enrollment as a result of the expiration of CHIP funding.

5
III. ACTUARIAL ANALYSIS
A. FISCAL YEAR 2014 MEDICAID OUTLAYS AND ENROLLMENT
The Federal government and the States collectively spent $496.6 billion for Medicaid
in 2014. Of this amount, the Federal government paid $301.5 billion, representing
about 61 percent of net program outlays, and the States paid $194.8 billion, or about
39 percent of net outlays. Table 1 summarizes total Medicaid outlays for 2014.
Table 1—Medicaid Outlays for Fiscal Year 2014 by Type of Payment (in billions)
Title XIX Outlays1 Federal Share State Share Total
Medical Assistance Payments: Acute Care Benefits2 $91.7 $60.4 $152.1 Long-Term Care Benefits2 66.2 50.0 116.2 Capitation Payments and Premiums2 120.3 71.3 191.6 Disproportionate Share Hospital (DSH)
Payments2 10.2 7.9 18.1 Adjustments3 −5.2 −4.0 −9.2
Subtotal, Medical Assistance Payments 283.2 185.6 468.8
Administration Payments 15.2 9.2 24.4 Vaccines for Children Program 3.8 — 3.8
Gross Outlays 302.2 194.8 497.0
Collections4 −0.7 — −0.7
Net Outlays 301.5 194.8 496.6 Totals may not add due to rounding. 1 Federal outlays are the funds drawn from the U.S. Treasury by the States. The State and total outlays are estimated, reflecting spending as reported by the States for the purposes of drawing Federal funding from the U.S. Treasury. Expenditures represent the spending as it was paid by the State to health care plans or providers. While expenditures and outlays are generally similar, they are not equal mainly due to the timing differences between the States paying for services and the States receiving Federal funds. Neither outlays nor expenditures include Title XIX costs in support of the Children's Health Insurance Program. 2 Benefit expenditures as reported on the CMS-64 (Net Services). 3 Adjustments include net adjustments of benefits from prior periods and the difference between expenditures and outlays. 4 Collections from Medicare Part B for the Qualifying Individuals (QI) program and from other miscellaneous sources.
The great majority of Medicaid spending—94 percent of total outlays in 2014—was
for medical assistance payments. In table 1, these payments are divided into four
major categories: acute care, long-term care, capitation payments and premiums, and
disproportionate share hospital (DSH) payments.
Acute care includes fee-for-service spending for inpatient and outpatient hospital
care, physician and other medical professional services, prescription drugs, dental
care, laboratory and imaging tests, mental hospital services, and case management
costs, as well as coinsurance payments for beneficiaries in managed care plans. Long-
term care fee-for-service includes spending on nursing home services, home health
care, intermediate care facility services, and home and community-based services.
Capitation payments and premiums include premiums paid to Medicaid managed
care plans, pre-paid health plans, other health plan premiums, and premiums for
Medicare Part A and Part B. DSH payments are provided to certain hospitals that
6
have furnished care for a significant number of uninsured persons and Medicaid
beneficiaries and that have acquired, as a result, a substantial amount of
uncompensated care costs.
Of these four categories, capitation payments and other premiums represented the
largest portion of Medicaid spending in 2014, accounting for $191.6 billion or
41 percent of Medicaid benefit expenditures. This was a significant increase over
2013, largely driven by newly eligible individuals, as the majority of the enrollees
were covered by managed care plans. Fee-for-service acute care expenditures were
the next largest expenditure category, constituting $152.1 billion or 32 percent of
benefit expenditures. Medicaid spending for fee-for-service long-term care amounted
to $116.2 billion, representing 25 percent of expenditures on benefits, and DSH
payments accounted for $18.1 billion, or 4 percent, of Medicaid benefits in 2014.
Medicaid outlays for program administration totaled $24.4 billion in 2014—
$15.2 billion in Federal outlays and $9.2 billion in State outlays—and represented
5 percent of Medicaid outlays. Included in administration outlays were $2.4 billion in
health information technology incentive payments to providers.6 Medicaid also
provided $3.8 billion in 2014 for the Vaccines for Children program.7
Enrollment is measured as “person-year equivalents,” or the average enrollment over
the course of a year. In 2014, Medicaid enrollment was estimated to be 64.0 million
(including enrollment in the U.S. Territories).8
Table 2 shows estimated enrollment and expenditures by eligibility group for 2014.
Historically, children have been the largest group of Medicaid enrollees. In 2014,
children are estimated to have numbered 27.5 million, representing 43 percent of
overall Medicaid enrollment. There were an estimated 15.0 million non-newly eligible
adults (23 percent of enrollment) and an estimated 4.3 million newly eligible adults
(7 percent). Finally, enrollees with disabilities and aged enrollees are estimated to
have numbered 10.2 million and 5.4 million (16 percent and 8 percent of Medicaid
enrollment, respectively). Another 1.5 million enrollees (2 percent) were estimated
6 Health information technology incentive payments were provided for by the American Recovery and
Reinvestment Act of 2009 and are paid entirely by the Federal government. This figure does not
include payments to States to administer the health information technology incentive payment
program. 7 The Vaccines for Children program is administered by the Centers for Disease Control and
Prevention and provides vaccines for children enrolled in Medicaid, as well as for other children who
might otherwise not be able to afford vaccines. All Vaccine for Children program costs are paid by the
Federal government. 8 Past reports have provided figures for “ever-enrolled” enrollment, or the number of people who were
enrolled at any time during the year. As no data are currently available that show the number of newly
eligible adults who were ever-enrolled, and since there is no historical experience with this population,
this report does not provide an estimate of ever-enrolled enrollment for 2014.

7
for the five U.S. Territories with Medicaid programs (Puerto Rico, the U.S. Virgin
Islands, Guam, American Samoa, and the Northern Mariana Islands).
Table 2—Estimated Enrollment, Expenditures, and Per Enrollee Expenditures, by Enrollment Category, Fiscal Year 2014
Eligibility Group Enrollment1 (in millions)
Expenditures (in billions)
Per Enrollee Spending
(2014)
Per Enrollee Spending
(2013) Percent Change
Children 27.5 $86.5 $3,141 $2,960 6.1%
Adults 15.0 73.6 4,914 4,580 7.3%
Expansion Adults 4.3 23.9 5,488 — —
Persons with Disabilities 10.2 192.1 18,789 18,969 −0.9%
Aged 5.4 81.7 15,113 15,423 −2.0%
Subtotal 62.5 457.8 7,324 7,318 0.1%
Territories2 1.5 2.1 1,384 — — Collections and Adjustments — −7.9 — — —
DSH — 18.1 — — —
Administration — 24.4 — — —
Total 64.0 494.5 7,724 7,773 −0.6% Totals may not add due to rounding. 1 Measured in person-year equivalents. 2 Territory enrollment is estimated and based on the data reported in the CMS-64. Expenditures reflect only the amounts paid by the Federal government and the corresponding Territory share; some Territory programs spend additional amounts beyond what is covered by the Federal allotments and Territory share. As no source of Territory enrollment data is available for 2013, per enrollee costs for 2013 are not shown.
The average per enrollee cost for 2014 is estimated to have been $7,324 (including
Federal and State shares, based on person-year equivalent enrollment and excluding
DSH outlays, Territorial enrollees and costs, adjustments, and administration costs).
In estimated average benefits for 2014, children in Medicaid received $3,141, non-
newly eligible adults received $4,914, and newly eligible adults received $5,488.9 In
all three instances, these average costs reflect the relatively favorable health status
of the enrollment groups; however, among adult enrollees, a significant number are
pregnant women, whose costs are on average relatively greater. As would be
expected, expenditures are substantially greater for the aged and persons with
disabilities; aged beneficiaries received an estimated $15,113 in benefits on average,
and beneficiaries with disabilities are estimated to have received an average of
$18,789 in benefits.10
9 The costs of newly eligible adults in 2014 may reflect pent-up demand and persons with relatively
greater health care needs enrolling more quickly; however, there is still uncertainty about the actual
costs of this population, which is described later in this report. 10 The average per enrollee costs may also vary substantially among States. These variations may
reflect differences in State Medicaid programs (for example, eligibility levels, benefits offered, provider
reimbursement rates, or program design) and differences in the overall health care market across
States.

8
Territory per enrollee expenditures ($1,384 in 2014) are less than those of other
populations covered by Medicaid, as costs of care are lower in the Territories and
fewer services are provided by Territory programs. In addition, these amounts reflect
only the Federal allotments and the Territory expenditures necessary to draw down
those allotments; some Territory programs spend above this amount for their
Medicaid programs.
Figure 1 shows each enrollment group’s relative share of enrollment and
expenditures in Medicaid in 2014. While enrollees with disabilities and aged enrollees
are the smallest enrollment groups in Medicaid, they account for the majority of
spending. Conversely, children and adults are the largest enrollment groups in
Medicaid, but they receive a relatively smaller share of expenditures.
Figure 1—Estimated Medicaid Enrollment and Expenditures by Enrollment Group, as Share of Total, Fiscal Year 2014
Children44%
Children19%
Non-Newly Eligible Adults24%
Non-Newly Eligible Adults16%
Newly Eligible Adults7%
Newly Eligible Adults5%
Persons with Disabilities
16%
Persons with Disabilities
42%
Aged 9%
Aged 18%
Enrollment Expenditures
Note: Totals and components exclude DSH expenditures, Territorial enrollees and expenditures, and adjustments. Totals may not add to 100 percent due to rounding.
Combined, spending on aged beneficiaries and beneficiaries with disabilities
constituted 60 percent of Medicaid benefit expenditures in 2014, but these groups
accounted for only 25 percent of all enrollees. Children and adults represented
75 percent of all enrollees in 2014, while only 40 percent of benefit expenditures were
for enrollees in these two groups.

9
These differences between the relative shares of enrollment and expenditures result
from per enrollee costs that vary dramatically among the enrollment groups. The
differences in average costs, while substantial, actually understate the impact of
differences in health status for these groups. In particular, Medicaid pays almost all
health care costs for enrolled children and adults. However, many aged beneficiaries
or beneficiaries with disabilities are also enrolled in Medicare, which is the primary
payer of benefits before Medicaid; thus, the per enrollee Medicaid estimates are less
than the total cost of such beneficiaries’ annual health care across all payers.11
With the start of the eligibility expansion provided for by the Affordable Care Act,
expenditures and enrollment grew more quickly in 2014 than in recent years.
Expenditures increased 8.5 percent, as compared to 5.7 percent in 2013, and
enrollment is estimated to have grown 9.2 percent. The increase in expenditures and
enrollment in 2014 is mostly attributable to newly eligible adults receiving coverage
throughout the year.12
Per enrollee benefit costs are estimated to have increased slightly (from $7,318 to
$7,324, or 0.1 percent higher than in 2013), as costs for newly eligible adults were
lower than the average Medicaid costs per enrollee. Excluding newly eligible adults
and their benefit costs, Medicaid expenditures for all other populations increased only
2.9 percent in 2014 while enrollment increased 0.9 percent, resulting in per enrollee
cost growth of 2.0 percent.13
11 In 2011, Medicaid expenditures for persons eligible for Medicare and full Medicaid benefits (full-
benefit dual-eligible beneficiaries) amounted to $112.0 billion, and Medicare expenditures for these
persons were $140.9 billion, for a total of $252.9 billion in expenditures between both programs.
Medicaid accounted for about 44 percent of the total spending on full-benefit dual-eligible
beneficiaries. In addition, for persons eligible for Medicare and limited Medicaid benefits (generally
payments for Medicare premiums or cost sharing), Medicaid benefits are typically an even smaller
proportion of their total benefits ($2.1 billion of $41.5 billion, or about 5 percent, in 2011). See Exhibit 3
in Data Book: Beneficiaries Dually Eligible for Medicare and Medicaid, Medicare Payment Advisory
Commission and Medicaid and CHIP Payment and Access Commission, 2016. 12 There are some differences between Medicaid outlays and Medicaid expenditures, mainly due to
timing differences between States paying for services and States receiving Federal funds. Thus, the
levels and trends in outlays and expenditures differ slightly. 13 These results do not account for any additional administrative costs that may be associated with
newly eligible adults, nor do they account for the enrollment and costs of newly eligible adults who
had been previously enrolled in 2013 (for example, those adults covered under eligibility expansions
prior to 2014).

10
B. HISTORICAL MEDICAID TRENDS
Since the start of the program, the year-to-year growth rates of total Medicaid
expenditures (Federal and State expenditures combined) and enrollment have varied
substantially, as can be seen in figure 2 and figure 3. The growth in expenditures over
time reflects growth in the number of enrollees in the program and growth in the cost
per enrollee. Enrollment growth is a result of a change in the number of people
eligible and electing to participate in the program, but it is also strongly influenced
by legislative changes to the eligibility criteria. Similarly, per enrollee costs vary over
time due to changes in the use of medical services and the prices paid to providers of
health care services and supplies, as well as legislative and other policy changes to
the benefits offered by State Medicaid programs.
Figure 2—Historical and Projected Medicaid Expenditures and Annual Growth Rates, Fiscal Years 1966–2024
-5%
0%
5%
10%
15%
20%
25%
30%
35%
40%
$0
$100
$200
$300
$400
$500
$600
$700
$800
$900
1965 1970 1975 1980 1985 1990 1995 2000 2005 2010 2015 2020
An
nu
al
Gro
wth
Rate
Exp
en
dit
ure
s (
in b
illio
ns)
Fiscal Year
Actual Projected
Annual Growth Rate (right axis)
Expenditures(left axis)

11
Figure 3—Historical and Projected Medicaid Enrollment and Annual Growth Rates, Fiscal Years 1966–2024
-10%
-5%
0%
5%
10%
15%
20%
25%
30%
35%
0
10
20
30
40
50
60
70
80
90
1965 1970 1975 1980 1985 1990 1995 2000 2005 2010 2015 2020
An
nu
al
Gro
wth
Rate
En
rollm
en
t (i
n m
illio
ns o
f p
ers
on
-year
eq
uiv
ale
nts
)
Fiscal Year
Actual Projected
Annual Growth Rate (right axis)
Enrollment(left axis)
From 2005 to 2014, Medicaid expenditures grew at an average annual rate of
5.3 percent, but annual growth rates varied substantially over the last 10 years (from
−0.3 percent in 2006 to 8.5 percent in 2014). Growth in health care expenditures is
driven primarily by several key factors: growth in the population, changes in the use
of health care services, and changes in the prices of health care services. In addition
to these, several other factors affected Medicaid expenditure trends in recent history.
Federal legislation had a significant effect on historical expenditure trends. The
Medicare Modernization Act of 2003 created the Medicare Part D program, and in
2006 most prescription drug coverage for dual-eligible beneficiaries (those eligible for
both Medicaid and Medicare) shifted from Medicaid to Medicare Part D. All dual-
eligible beneficiaries were automatically enrolled in Part D, and Medicare served as
the primary source of their prescription drug coverage. As a result of this shift in
coverage, Medicaid drug spending (net of rebates) decreased 46 percent from 2005 to
2006, and aggregate Medicaid spending was 0.3 percent lower than in 2005,
decreasing for the first time in the program’s history.
The American Recovery and Reinvestment Act of 2009 provided for temporary
increases in the Federal share of Medicaid payments in 2009, 2010, and 2011, as well
as for health information technology incentive payments that were funded entirely

12
by the Federal government. While the increase in the Federal share of Medicaid
payments was significant, it is not estimated to have affected total Medicaid
expenditure growth in those years.
The Affordable Care Act also had a number of provisions that affected Medicaid
starting in 2010; however, most of the changes to the Medicaid program through 2013
are estimated to have had only minor effects on Medicaid expenditure growth rates.
In 2014, the expansion of eligibility to most adults with incomes less than 138 percent
of the FPL led to a significant increase in expenditures and enrollment.
Medicaid expenditure growth is also affected by States’ decisions in operating their
programs. In the past, States took steps to control the costs of their Medicaid
programs, especially during periods of relatively faster growth, and many States have
taken such steps to slow the rate of expenditure growth in recent history.14 Common
methods have included freezing or reducing provider reimbursement rates and
limiting or curtailing optional health care benefits. States also have used managed
care and alternative care delivery approaches to manage costs in their Medicaid
programs.
Medicaid enrollment grew at an average annual rate of 3.6 percent from 2005 to 2014.
Annual growth rates varied substantially, from a low of −0.5 percent in 2007 to a high
of 9.2 percent in 2014. Changes in Medicaid enrollment were generally driven by
population growth and by changes in economic growth and unemployment rates. In
general, Medicaid enrollment increases more quickly during economic recessions, and
growth slows as the economy expands. Faster Medicaid enrollment growth in turn
typically leads to increases in expenditure growth. Medicaid enrollment and
expenditure trends followed these historical patterns during the 2001 recession and
the 2007-2009 recession and during the subsequent economic recoveries. The
Affordable Care Act provided for an expansion of Medicaid eligibility, which
contributed to the substantial increase in enrollment in 2014.
14 These State actions are well documented in the annual 50-State survey of Medicaid programs
conducted by the Kaiser Family Foundation; see V. Smith, et al., “Medicaid Reforms to Expand
Coverage, Control Costs and Improve Care: Results from a 50-State Medicaid Budget Survey for State
Fiscal Years 2015 and 2016,” Kaiser Family Foundation, October 2015.

13
C. MEDICAID EXPENDITURES AND ENROLLMENT PROJECTIONS,
FISCAL YEARS 2015–2024
The projections presented in this report reflect Medicaid medical assistance
payments (or “benefit” expenditures) and Medicaid enrollment. Administration costs
are also included and are based on the projections from the President’s Fiscal Year
2017 Budget, as well as on administrative cost data reported to CMS.15 Other
Title XIX expenditures (such as the Vaccines for Children program) are not included.
Historical and projected Medicaid expenditures for medical assistance payments and
administration are shown in table 3.16,17
15 The projections of administration expenditures are based on the projected trends for Medicaid
administration outlays in the President’s Budget but are adjusted to be consistent with the
expenditures reported in the CMS-64; total expenditures are also projected for administration,
whereas the President’s Budget projects only Federal outlays. 16 In table 5, enrollment and expenditure data for the period 1966-1976 have been revised to be
consistent with the current definition of the Federal fiscal year (October-September). 17 There are differences between Medicaid outlays and Medicaid expenditures, mainly due to timing
disparities between States paying for services and States receiving Federal funds. Thus, the levels and
trends in outlays and expenditures differ slightly, and the amounts shown in table 5 differ from those
shown in table 3.

14
Table 3—Historical and Projected Medicaid Enrollment and Expenditures and Average Federal Share of Expenditures, Selected Years
(Enrollment in millions of person-year equivalents, expenditures in billions of dollars)
Fiscal Year
Total Expenditures Benefit Expenditures
Administration Expenditures
Avg. Federal Share Enrollment Total Federal State Total Federal State Total Federal State
Historical data: 1966 4.0 $0.9 $0.5 $0.4 $0.9 $0.4 $0.4 $0.0 $0.0 $0.0 50% 1970 14.0 5.1 2.8 2.3 4.9 2.6 2.2 0.2 0.1 0.1 54% 1975 20.2 13.1 7.3 5.9 12.6 6.9 5.6 0.6 0.3 0.3 55% 1980 19.6 25.2 14.0 11.2 24.0 13.3 10.7 1.2 0.7 0.5 55% 1985 19.8 41.3 22.8 18.4 39.3 21.7 17.6 2.0 1.2 0.8 57% 1990 22.9 72.2 40.9 31.3 68.7 38.9 29.8 3.5 2.0 1.5 57% 1995 33.4 159.5 90.7 68.8 151.8 86.5 65.3 7.7 4.2 3.4 57% 2000 34.5 206.2 117.0 89.2 195.7 111.1 84.6 10.6 5.9 4.7 57% 2005 46.3 315.9 180.4 135.5 300.7 172.1 128.7 15.1 8.3 6.8 57% 2006 46.7 315.1 179.3 135.8 299.0 170.6 128.5 16.0 8.7 7.3 57% 2007 46.4 332.2 189.0 143.2 315.8 180.0 135.8 16.4 9.0 7.5 57% 2008 47.7 351.9 200.2 151.7 334.2 190.6 143.6 17.7 9.6 8.1 57% 2009 50.9 378.6 246.3 132.3 360.3 236.3 124.0 18.3 10.0 8.3 65% 2010 54.5 401.5 269.8 131.7 383.6 260.0 123.6 17.9 9.8 8.1 67% 2011 55.8 427.4 270.7 156.7 407.9 259.8 148.1 19.5 10.9 8.6 63% 2012 57.3 431.2 248.9 182.3 409.0 235.2 173.9 22.2 13.7 8.4 58% 2013 58.6 455.6 262.7 192.9 432.7 248.5 184.2 22.9 14.2 8.7 58% 2014 64.0 494.5 299.1 195.3 470.0 283.9 186.1 24.4 15.2 9.2 61%
Projections: 2015 68.9 554.3 347.5 206.8 527.5 331.1 196.4 26.8 16.3 10.5 63% 2016 70.5 582.8 364.3 218.6 554.9 346.8 208.1 28.0 17.5 10.5 63% 2017 71.6 607.2 374.0 233.2 578.4 356.1 222.3 28.8 17.9 10.9 62% 2018 72.9 647.5 400.1 247.4 617.5 381.6 235.9 30.0 18.5 11.5 62% 2019 73.9 686.9 424.0 262.9 655.8 404.9 250.9 31.1 19.2 12.0 62% 2020 74.7 728.2 446.3 281.9 695.7 426.3 269.4 32.5 20.0 12.5 61% 2021 75.5 772.3 472.7 299.6 738.4 451.8 286.5 34.0 20.9 13.1 61% 2022 76.2 818.7 501.0 317.7 783.3 479.3 304.0 35.5 21.8 13.7 61% 2023 76.9 868.0 531.2 336.9 831.0 508.4 322.6 37.0 22.7 14.3 61% 2024 77.5 920.5 563.2 357.3 881.9 539.5 342.4 38.7 23.7 14.9 61%
Note: Enrollment is estimated for 2012, 2013, and 2014.

15
Expenditures
Total Medicaid expenditures (Federal and State combined) for medical assistance
payments and administration are estimated to have grown 12.1 percent in 2015 to
$554.3 billion and are projected to reach $920.5 billion by 2024, increasing at an
average rate of 6.4 percent per year over the next 10 years. Federal government
spending on Medicaid medical assistance payments and administration costs is
estimated to have increased by 16.2 percent to $347.5 billion in 2015, representing
63 percent of total Medicaid benefit expenditures. Federal spending on Medicaid is
projected to reach $563.2 billion by 2024, or 61 percent of total spending. State
Medicaid expenditures for benefits and administration are estimated to have
increased to $206.8 billion in 2015, a growth rate of 5.9 percent, and are projected to
reach $357.3 billion by 2024.
The Affordable Care Act contains many Medicaid provisions, most of which were
implemented by 2014 and are expected to significantly influence future Medicaid
expenditure trends. Included in these provisions is a substantial increase in Medicaid
eligibility that began in 2014. The impacts of the increase in Medicaid eligibility are
presented in more detail in the next section.
In recent history, the average annual Federal share has been about 57 percent of total
expenditures, with several years of greater Federal shares due to changes specified
in legislation. Over the next 10 years, the Federal share of Medicaid expenditures is
projected to vary because of several acts of legislation. The average Federal share was
58 percent in 2013 and increased to 61 percent in 2014 due mainly to the higher
FMAP for newly eligible Medicaid beneficiaries. In 2015, the average Federal share
is estimated to have increased to 63 percent, and it is expected to decline to 61 percent
by 2021 and to remain at that level through 2024. This decrease in the average
Federal matching rate is a result of the legislated decrease in expansion matching,
as costs for the newly eligible adults are matched at 100 percent through 2016 but
are set to decrease gradually to 90 percent by 2020.
Total Medicaid expenditures (Federal and State combined) for medical assistance
payments, excluding those for administration, are estimated to have grown
12.2 percent in 2015 to $527.5 billion. This is a faster rate of growth than in 2014
(8.6 percent) and reflects a substantial acceleration from the growth rates in previous
years. Medicaid expenditures on such payments are projected to reach $881.9 billion
by 2024, increasing at an average rate of 6.5 percent per year over the next 10 years.
Federal government spending on these Medicaid payments is estimated to have been
$331.1 billion in 2015 and is projected to grow to $539.5 billion by 2024.
Continued growth in Medicaid benefit expenditures in 2015 is largely attributable to
the Medicaid eligibility expansion, which began on January 1, 2014 under the
Affordable Care Act. The majority of the projected acceleration was driven by newly

16
eligible enrollees, with an increase in both the number of enrollees and the per
enrollee costs.
Administration costs are estimated to have amounted to $26.8 billion in 2015,
reflecting an increase of 9.8 percent. This growth follows a smaller increase in 2014
of 6.5 percent. The projected growth is expected to have been driven by additional
administration costs associated with continued increases in enrollment and
expenditures in 2015 related to Medicaid expansion, while health information
technology incentive payments are expected to have decreased from $2.4 billion in
2014 to $1.7 billion in 2015. Administration costs are projected to reach $38.7 billion
by 2024, growing at an average annual rate of 4.7 percent. While administrative costs
are estimated to have constituted 4.8 percent of total Medicaid costs in 2015, this
percentage is projected to decline to 4.2 percent by 2024.
Figure 4 shows historical and projected Medicaid benefit expenditures by four major
categories of services: acute care fee-for-service, long-term care fee-for-service,
capitation payments and premiums, and DSH.18
18 The data for selected figures in the report can be found in section D of the Appendix.

17
Figure 4—Past and Projected Medicaid Expenditures for Medical Assistance Payments, by Type of Payment, Fiscal Years 2000–202419
(in billions)
$0
$100
$200
$300
$400
$500
$600
2000 2002 2004 2006 2008 2010 2012 2014 2016 2018 2020 2022 2024
Fiscal Year
Actual Projected
DSH
Capitation Payments and Premiums
Long-Term Care (Fee-for-Service)
Acute Care (Fee-for-Service)
Over the next 10 years, expenditures for capitation payments and premiums are
expected to grow faster than expenditures for the other major Medicaid service
categories, as shown in figure 4. These expenditures are projected to grow
10.4 percent per year on average from 2015 to 2024 (from $191.6 billion in 2014 to
$514.9 billion in 2024), which would be 3.9 percentage points faster than overall
Medicaid benefit growth. Relatively faster projected growth in these payments is
driven by the Medicaid eligibility expansion under the Affordable Care Act, since
most of the newly eligible adults are enrolled in managed care plans. Moreover,
expenditures for capitation payments and premiums have grown substantially more
quickly than other service expenditures in recent history, as States have increased
utilization of managed care, particularly for their aged enrollees and persons with
disabilities. From 2001 to 2013—prior to Medicaid expansion in 2014—Medicaid
payments for managed care plans and other premiums grew on average 12.3 percent
per year, faster than overall Medicaid benefit expenditures (6.5 percent). In 2014
alone, these payments increased by 26.2 percent, due primarily to the aforementioned
expansion enrollees. The use of managed care plans within Medicaid has increased
19 The data for this graph can be found in table 17 in section D of the Appendix.

18
over time, with 77 percent of enrollees covered by at least one managed care program
and 61 percent covered by a comprehensive managed care program in 2014.20 The
increase in the use of managed care programs accounts for much of the difference
between the capitation payment and overall Medicaid expenditure growth rates;
however, this increase does not necessarily account for the differences in per enrollee
cost growth between those enrolled in managed care and those not enrolled.
Acute care fee-for-service expenditures are projected to grow at an average rate of
3.5 percent per year over the next decade, from $152.1 billion in 2014 to $213.8 billion
in 2024. In 2015, these expenditures are estimated to have increased by 4.6 percent,
a growth rate that is expected to be partly due to the increase in adult enrollees
related to the eligibility expansion, as some of their costs were covered through fee-
for-service programs (although the majority of the expenditures are expected to be
paid under managed care).
Medicaid spending on fee-for-service long-term care is projected to grow by
3.0 percent on average for 2015 through 2024, increasing from $116.2 billion in 2014
to $156.6 billion in 2024. Aged enrollees and enrollees with disabilities receive the
vast majority of long-term care services, and growth in these expenditures is driven
in part by growth in enrollment among these beneficiaries. Newly eligible adults,
along with other adults and children, are expected to need very few long-term care
services. In recent history, Medicaid expenditures on these services have been flat;
from 2010 through 2014, long-term care expenditures decreased at an average rate
of 0.2 percent per year, compared to 8.7-percent average annual growth from 2005
through 2009. This deceleration reflects relatively slower growth in reimbursement
rates and utilization of long-term care services. Additionally, there has been
increased use of managed care for long-term care in Medicaid over the last several
years, which has slowed fee-for-service expenditure growth in the program. As a
result, the projected growth rate for long-term care expenditures continues to remain
low.21
20 Centers for Medicare & Medicaid Services, 2014 Medicaid Managed Care Enrollment Report.
https://www.medicaid.gov/medicaid-chip-program-information/by-topics/data-and-systems/medicaid-
managed-care/downloads/2014-medicaid-managed-care-enrollment-report.pdf. 21 Use of home and community-based services can substantially reduce expenditures for enrollees who
would otherwise have had to enter a nursing home or who transition from institutional to community
settings. Conversely, the expanding use of these services, by those who would not otherwise have had
nursing home care, adds to overall program costs, and may offset some amount of the savings realized
by reducing the use of institutional long-term care services. Growth in the use of home and community
long-term care reflects the increase in the number of home and community-based waivers in Medicaid.
In addition, in Olmstead v. L.C., 119 S. Ct. 2176 (1999), the Supreme Court ruled that, under the
Americans with Disabilities Act of 1990, States must provide community-based placement for persons
with disabilities when appropriate and consistent with consumer wishes. This ruling is also expected
to have led to an increase in non-institutional long-term care expenditures in Medicaid.

19
Medicaid DSH expenditures are typically expected to grow at the same rate as the
Medicaid Federal DSH allotments, which are based on the Consumer Price Index
(CPI). The Affordable Care Act, however, prescribes reductions in Medicaid DSH
allotments, and subsequent legislation has extended those reductions through 2025.22
Thus, the average growth rate for DSH spending is projected to be −4.7 percent over
the next 10 years, with DSH expenditures decreasing from $18.1 billion in 2014 to
$11.2 billion in 2024.
Enrollment
Increasing levels of Medicaid enrollment are expected to contribute to expenditure
growth over the next 10 years. Historical and projected Medicaid enrollments are
shown by category in figure 5.
22 Reductions to DSH allotments were prescribed under current law for 2017 through 2024. The
Medicare Access and CHIP Reauthorization Act of 2015 (Public Law 114-10) delayed the reductions
until 2018, made changes to the annual reduction amounts, and extended the reductions through 2025.

20
Figure 5—Past and Projected Numbers of Medicaid Enrollees, by Category, Fiscal Years 2000–202423
(in millions of person-year equivalents)
Territories Aged
Persons with Disabilities
Children
Non-Newly Eligible Adults
0
10
20
30
40
50
60
70
80
90
2000 2002 2004 2006 2008 2010 2012 2014 2016 2018 2020 2022 2024
Fiscal Year
Actual Projected
Newly Eligible Adults
Total enrollment is estimated to have increased from 64.0 million in 2014 (including
1.5 million enrollees in the U.S. Territories) to 68.9 million in 2015—an increase of
7.7 percent, primarily because of continuing growth among newly eligible adults.
Excluding the newly eligible adults, enrollment in 2015 is estimated to have
increased by only 0.2 percent, whereas in 2014 non-newly eligible enrollment
increased 1.8 percent. While more aged individuals are estimated to have enrolled in
2015, enrollment among all other non-newly eligible populations is expected to have
remained level between 2014 and 2015.
Enrollment in 2016 is projected to grow by only 2.3 percent, as the enrollment rate
for newly eligible adults is projected to slow and the percentage of people living in
States that expand eligibility is not expected to change significantly from 2015 to
2016.
The total number of Medicaid enrollees is projected to increase during 2017 through
2024 at a rate of about 1.2 percent per year, reflecting population growth and an
increase in the number of aged enrollees as baby boomers continue to reach age 65.
Excluding newly eligible enrollment groups, growth in the number of aged adults is
23 The data for this graph can be found in table 18 in section D of the Appendix.

21
expected to be faster than that for the other categories of enrollment; the average
annual growth rate for aged adults is estimated to be 3.2 percent over the next
10 years. By 2024, Medicaid enrollment is projected to increase to 77.5 million.
Per Enrollee Costs
In addition to increases in Medicaid enrollment, the average costs of benefits for all
enrollees are projected to increase over the next 10 years. Figure 6 displays historical
and projected average Medicaid benefit expenditures per enrollee for all enrollees
collectively and by eligibility group.
Figure 6—Past and Projected Medicaid Expenditures on Medical Assistance Payments Per Enrollee, by Enrollment Category, Fiscal Years 2005–202424
$0
$5,000
$10,000
$15,000
$20,000
$25,000
$30,000
2005 2007 2009 2011 2013 2015 2017 2019 2021 2023
Fiscal Year
Actual Projected
Persons with Disabilities
Aged
Children
Non-Newly Eligible Adults
Average of All Enrollees
Newly Eligible Adults
Note: Per enrollee amounts for 2012, 2013, and 2014 are based on actual expenditures and estimated enrollment.
Per enrollee benefit costs are projected to grow somewhat faster from 2015 through
2024 than they did in the previous 8-year period.25 For aged Medicaid enrollees,
benefit costs per enrollee grew from $15,023 in 2006 to $15,113 in 2014 (an average
annual growth rate of 0.1 percent over the period) and are projected to reach $22,566
24 The data for this graph can be found in table 19 in section D of the Appendix. 25 The years from 2007 to 2014 are used as a reference as they cover a sufficiently long period to
compare long-term trends while excluding the effects of the start of the Medicare prescription drug
program in 2006, which significantly lowered Medicaid per enrollee costs, especially for aged enrollees
and persons with disabilities.

22
in 2024 (an average annual rate of 4.1 percent over 2015 to 2024). Similarly, per
enrollee benefits costs for persons with disabilities increased from $15,743 in 2007 to
$18,130 in 2014 (an average annual growth rate of 2.2 percent) and are projected to
reach $30,060 in 2024 (4.8 percent average annual growth over 2015 to 2024).
The slow rate of growth of long-term care expenditures in recent history contributed
to limited growth in the benefit costs for aged enrollees and persons with disabilities,
as these individuals receive the vast majority of long-term care services.
Expenditures for institutional long-term care (primarily nursing facility services)
grew very slowly, while costs for community long-term care (including home and
community-based waiver services) grew relatively quickly, although the growth rate
has decelerated more recently. Slow cost growth for long-term care through fee-for-
service programs was partially offset by increasing managed care expenditures,
especially for managed long-term care services. During and immediately after the
2007-2009 recession, States took stronger actions to limit Medicaid expenditure
growth, including freezing or reducing provider reimbursement rates.26
Aged enrollees and persons with disabilities are projected to experience the lowest
average benefit cost growth over the next 10 years compared to other enrollee groups,
due in large part to projected relatively slower growth in the cost of long-term care
services. States are expected to continue to use more home and community-based
long-term care to postpone enrollees’ need for long-term care facilities as long as
possible. In addition, States are projected to shift long-term care expenditures from
fee-for-service programs into managed care. As a result, managed care expenditures
are expected to grow more quickly and to constitute a larger share of benefits for aged
enrollees and persons with disabilities.
While average benefit cost growth is expected to be slower over the next 10 years for
aged enrollees and persons with disabilities than for other populations in Medicaid,
it is nevertheless expected to be faster than in recent history. In addition to the
deceleration of historical growth by legislative changes that affected Medicaid, States
have instituted fewer provider reimbursement rate freezes and reductions and have
allowed for more rate increases in 2013 and 2014, and it is expected that these
increases will continue in the future.27
Benefit costs per enrollee for adults (excluding the newly eligible) are projected to
grow somewhat faster over the next 10 years. Adult per enrollee costs increased from
$3,503 in 2006 to $4,914 in 2014 (a 4.3-percent annual average growth rate), and they
are projected to increase to $8,266 by 2024 (a 5.3-percent average annual growth
rate). Benefit costs per enrollee for children are expected to follow a similar pattern,
having grown from $2,348 in 2006 to $3,141 in 2014 (a 3.7-percent average annual
growth rate), and such costs are projected to grow to $5,243 by 2024 (a 5.3-percent
26 V. Smith, et al., “Medicaid Reforms to Expand Coverage, Control Costs and Improve Care: Results
from a 50-State Medicaid Budget Survey for State Fiscal Years 2015 and 2016.” 27 Ibid.

23
average annual growth rate). As was the case for aged enrollees and persons with
disabilities, in the past several years States have taken steps to control the Medicaid
expenditure growth that occurred during and after the 2007-2009 recession,
especially in limiting or reducing provider reimbursement rates.28
Spending for managed care represented over half of Medicaid expenditures for adults
and children in 2014, and, for these enrollees, this type of care is expected to be the
fastest growing service category over the next 10 years. More recently, States have
made fewer provider reimbursement rate reductions and are instituting more rate
increases, and together these factors are anticipated to contribute to somewhat faster
expenditure growth.29
Although the estimated average benefit costs for newly eligible adults are expected
to be greater than those for other adults in 2014 and 2015, such expenditures are
projected to ultimately be slightly lower over the next several years. More detail on
these projections is provided in the next section of this report.
Enrollment Mix
The growth in average Medicaid benefit expenditures per enrollee for all enrollment
categories is significantly affected by the relative proportion of enrollment across
these categories. In this report, the “enrollment mix” is defined as the contribution of
the change in these relative proportions to the growth in Medicaid benefit
expenditures per enrollee. This concept is similar to “age-gender mix” effects in other
health care plans or programs (which measure the contribution to health care
expenditures of changes in the relative proportion of enrollees by age and by gender
in a plan). The enrollment mix differs in that it does not specifically consider gender
and considers age in only broad ranges, but it does take into account the disability
status of enrollees.
The enrollment mix is an important consideration in analyzing and projecting
Medicaid benefit expenditures. While the effects of age-gender mix on other programs
are usually relatively small and do not change significantly from year to year, the
effect of enrollment mix on Medicaid expenditures can be substantially larger or
smaller and may vary greatly from year to year. This variation can occur because
Medicaid enrollment categories experience substantially different average costs—
average Medicaid costs for aged enrollees and persons with disabilities are much
greater than those of child and adult enrollees—and because the enrollment growth
for these groups may vary among categories and may fluctuate annually.
For this report, the enrollment mix is measured as the difference between the
increase in Medicaid benefit expenditures per enrollee and the increase in Medicaid
28 Ibid. 29 Ibid.
24
benefit expenditures per enrollee if enrollment were held constant each year. To
calculate this difference, enrollment was set at 2011 levels for each enrollment
category.30
From 2007 to 2014, Medicaid benefit expenditures per enrollee grew at an average
annual rate of 2.0 percent (including newly eligible adults). The effects of changes in
enrollment mix over this time period reduced spending growth by an average of
0.5 percentage point per year; that is, excluding the impacts of changes in enrollment,
Medicaid benefit expenditures per enrollee would have grown 2.5 percent per year.
The effects of the changes in enrollment mix on spending ranged from −2.0 percent
to 1.0 percent over these 8 years. The negative effects of the changes in enrollment
mix were the result of relatively faster enrollment growth for children and adults
than for aged enrollees and enrollees with disabilities, especially from 2008 to 2010,
and the addition of newly eligible adults in 2014.
Medicaid benefit expenditures per enrollee are estimated to have increased
4.4 percent in 2015 (including newly eligible adults). Excluding the impact of the
change in the enrollment mix, Medicaid benefit expenditures per enrollee are
estimated to have increased 5.7 percent. This relatively large difference is the result
of an increase in the enrollment of newly eligible adults, whose per enrollee costs are
estimated to have been relatively lower than the average costs of all enrollees in 2015.
Per enrollee expenditure growth was fastest among newly eligible adults (as
described more fully in the next section of the report). The average per enrollee cost
for all adults is estimated to have increased 12.0 percent in 2015; excluding the newly
eligible, the average per enrollee cost for adults is estimated to have grown only
5.0 percent.
While Medicaid benefit expenditures per enrollee are projected to grow more rapidly
over the next 10 years at an average annual rate of 4.1 percent, changes in enrollment
mix are projected to decrease per enrollee Medicaid expenditure growth by an average
of 0.3 percentage point per year over this time period. Consequently, excluding the
effect of changes in the enrollment mix, Medicaid benefit expenditures per enrollee
are projected to grow at an average annual rate of 4.5 percent.
The small negative impact of enrollment mix is largely attributable to the projected
enrollment and costs of the newly eligible adults. The projected enrollment of more
newly eligible adults in 2016 and 2017 (with costs that are projected to be less than
the average Medicaid cost per enrollee) contributes to negative enrollment mix effects
through 2018. After 2018, the enrollment mix effect is projected to be positive
(between 0.2 percent and 0.3 percent per year) because the projected growth rate of
aged Medicaid enrollees is expected to be faster than that of other populations, as
more members of the baby boom generation reach age 65. (Excluding the newly
30 As the base year for enrollment, 2011 was selected because it was the latest year for which complete
Medicaid enrollment data were available. A review of the measurement of enrollment mix using other
years as the base year showed no significant differences in results.

25
eligible adults, the projected enrollment mix from 2015 through 2024 would be
0.6 percent.)
Medicaid benefit expenditures per enrollee grew at an average annual rate of
2.4 percent per year from 2007 through 2014, excluding the effects of changes in the
enrollment mix. For 2015 through 2024, such expenditures are projected to increase
4.8 percent per year on average. This difference is the result of two factors: (i) efforts
by States to limit Medicaid expenditure growth (most notably, in 2011 and 2012) are
not projected to continue with the same intensity into the future; and (ii) medical
price inflation is projected to be modestly faster in the next 10 years than in recent
history.
Impacts of Recent Legislation
The impacts of the following legislative actions are reflected in these projections:
The Medicare Access and CHIP Reauthorization Act (Public Law 114-10) made
the Qualifying Individuals (QI) program permanent and extended CHIP
allotments through 2017.
The Consolidated Appropriations Act (Public Law 114-39) limited durable
medical equipment reimbursements to Medicare payment rates and placed a
moratorium on the annual fee on health insurance providers for 2017.
The Bipartisan Budget Act of 2015 (Public Law 114-74) applied an additional
rebate requirement to generic drugs in the Medicaid program and made
changes to Supplementary Security Income (SSI) enrollment that are
estimated to result in a small increase in Medicaid spending.
The National Defense Authorization Act (Public Law 114-92) modified
protection of Afghan allies with a small impact to Medicaid costs due to an
increase in the number of immigration visas.
The net impact of these laws on Federal Medicaid expenditures from 2015 through
2024 is projected to be an increase of about $2.9 billion. These changes to the program
are projected to have a negligible effect on Medicaid enrollment.

26
D. IMPACTS OF THE MEDICAID ELIGIBILITY EXPANSION
The Affordable Care Act provided for the expansion of Medicaid eligibility to almost
all persons under age 65 who are living in families with incomes below 138 percent
of the FPL beginning in 2014 (and who are citizens or eligible legal residents).31
Adults who are eligible under the new criteria are those that meet the definition of
“newly eligible” in section 1905(y)(2) of the Social Security Act.32,33
This expansion added 4.3 million newly eligible adult person-year equivalents to
enrollment during the 9 months that the new eligibility rules were in effect for
FY 2014 (or 6.3 million in calendar year 2014), and this figure is estimated to have
grown to 9.1 million by 2015. By 2024, newly eligible adult enrollment is projected to
reach 11.8 million.
Total Medicaid benefit expenditures for the new adult enrollees were $23.9 billion
over the last 9 months of FY 2014. Expenditures are estimated to have increased to
$58.0 billion in 2015 and to reach $90.6 billion by 2024. The Affordable Care Act
specifies a higher Federal matching rate for newly eligible beneficiaries, decreasing
from 100 percent in 2014, 2015, and 2016 to 90 percent by 2020 and beyond. Thus,
the Federal government paid all of these costs in 2014 and 2015 and will do so in 2016
as well, whereas the States paid none of the costs in the first 2 years and will also not
pay any costs in 2016. By 2024, the States are projected to pay $9.1 billion of the costs
for newly eligible adults.
In National Federation of Independent Business (NFIB) v. Sebelius, the Supreme
Court ruled that a State may not lose Federal funding for its existing program if it
does not implement the Medicaid eligibility expansion under the Affordable Care Act.
31 While reports prior to 2014 included estimates of Medicaid expenditures and enrollment for all
sections of the Affordable Care Act, the 2014 report presented estimates related only to the eligibility
expansion sections of the legislation. This 2015 report presents estimates for only the enrollment of
newly eligible adults and the expenditures for those persons, and it does not provide separate
estimates of the impact that the Affordable Care Act may have had on other Medicaid populations. It
was previously expected that this legislation would lead to increases in enrollment (and thus
expenditures) for other Medicaid-eligible individuals, but it is not possible to determine those impacts
from the available data. Given that the most significant effects were anticipated in 2014 and 2015,
this report does not provide separate estimates for the impact of the Affordable Care Act on the non-
newly eligible. 32 “Newly eligible” individuals are persons between the ages of 19 and 64 who, beginning in 2014, are
enrolled in the new adult group and who would not have been eligible for full Medicaid benefits,
benchmark coverage (described in subparagraph (A), (B), or (C) of section 1937(b)(1) of the Social
Security Act), or benchmark-equivalent coverage (described in section 1937(b)(2) of the Social Security
Act) as of December 1, 2009. An individual may also be newly eligible if he or she would have been
eligible but could not have been enrolled for such benefits or coverage because the applicable Medicaid
waiver or demonstration had limited or capped enrollment as of December 1, 2009. 33 The estimates of Medicaid enrollment and expenditures due to the eligibility expansion also include
State programs that have received waivers to cover newly eligible enrollees in qualified health plans
on the Health Insurance Marketplaces.

27
Based on the information currently available about the States’ intentions for their
Medicaid programs, it is estimated that (i) 45 percent of potentially newly eligible
persons resided in States that expanded eligibility in 2014, (ii) 50 percent of
potentially newly eligible persons resided in States that expanded eligibility by 2015,
(iii) in 2016, 50 percent of potentially newly eligible persons would reside in States
that expand eligibility, and (iv) in 2017 and later years, 55 percent of potentially
newly eligible persons would reside in States that expand eligibility as additional
States implement the eligibility expansion.
It is possible that more or fewer States may expand Medicaid eligibility than have
been assumed for 2016 and later years. To the extent that the actual number of States
opting for expansion differs from the assumptions used in these projections, future
costs and enrollment would likely differ by a similar proportion, taking into account
the sizes of the potentially newly eligible populations in those States.
In 2014, the average benefit costs of newly eligible adult enrollees are estimated to
have been greater than those for non-newly eligible adult enrollees in the program.
Newly eligible adults are estimated to have had average benefit costs of $5,488 in
2014, 12 percent greater than non-newly eligible adults’ average benefit costs, which
are estimated to have been $4,914. Per enrollee costs for newly eligible adults are
estimated to have grown to $6,366 in 2015 (an increase of 16 percent), while the costs
of other adults are estimated to have been $5,159—a difference of 23 percent. These
estimates are substantially different from those in last year’s report, in which average
benefit costs for newly eligible adults were estimated to decrease by 22 percent from
2014 to 2015. While the newly eligible adult per enrollee costs in 2014 were slightly
lower than estimated in last year’s report ($5,488 compared to $5,517, or about
1 percent lower), the estimated per enrollee costs for 2015 in this year’s report are
substantially greater ($6,366 compared to $4,281, or about 49 percent higher).
There are several reasons that may account for the differences between the estimates
in this year’s report and those in previous reports. First, it is possible that States
reported more expenditures in 2015 that were incurred in 2014, thereby making the
per enrollee costs in 2015 appear higher than they would actually be. More
significantly, both in magnitude and in the direction of the growth rate, the
differences in the estimates occurred largely because the managed care capitation
rates were set at higher levels than anticipated for the newly eligible adults. Most of
the States that implemented the eligibility expansion are covering newly eligible
adults in Medicaid managed care programs, and on average the capitation rates for
the newly eligible adult enrollees were significantly greater in 2014 and 2015 than
previously estimated (and shown in past Medicaid reports). In particular, two
assumptions varied considerably. Many States included adjustments to reflect a
higher level of acuity or morbidity among newly eligible adults compared to non-
newly eligible adults. In most States, these adjustments were positive (in other

28
words, newly eligible adults had a higher level of acuity than non-newly eligible
adults), and in some cases the adjustments were substantial.34
States also included other adjustments in the capitation rates for newly eligible
adults. Many States projected increased costs due to pent-up demand, expecting that
many enrollees would have been previously uninsured and would use additional
services in the first several months of coverage. Some States also included
adjustments for adverse selection with the anticipation that the persons who were
most likely to enroll in the first year would be those with the greatest health care
needs.
Data for newly eligible adults are still limited. While CMS has reported some
enrollment and expenditure data for this group, data on claims and managed care
encounters, along with data on the health status and demographics of these enrollees,
are not available. Thus, there is still considerable uncertainty about the health care
costs of newly eligible adults in 2014 and 2015, as well as for future years.
Given the uncertainty inherent in covering a large new population in Medicaid (many
of whom were expected to have been previously uninsured), most States that
implemented the eligibility expansion included risk-sharing arrangements in their
contracts with managed care plans for newly eligible adults in 2014 and 2015.35 The
most common approaches were to use a risk corridor or to use a minimum medical
loss ratio. Under a risk corridor, the managed care plans would return some
payments to the State and the Federal government if the average benefits per
enrollee or loss ratio fell below a certain level or ratio, and the plans would receive
additional payments from the State and the Federal government if the average
benefits per enrollee or loss ratio exceeded a certain level or ratio. In States requiring
a minimum medical loss ratio, the managed care plans would return some payments
to the State and the Federal government if the loss ratio fell below a certain level, but
the plans would not receive additional funding if the loss ratio was higher than
expected.
34 It is difficult to generalize about the adjustments that the States have estimated for several reasons.
States may have defined differently the non-newly eligible adult population that served as the basis
for comparison for the newly eligible adults. (For example, States may have compared the newly
eligible adults to only non-newly eligible childless adults or to childless adults and parents or caretaker
adults, or States may have compared the newly eligible adults to only non-disabled adults or to non-
disabled adults and some adults with disabilities.) Most States also removed from the comparison
pregnant women who are not newly eligible for Medicaid, but the projections in this report include
pregnant women among non-newly eligible adults; thus, it is difficult to directly compare the
assumptions the States made with the projections and analysis in this report. In addition, States used
various methodologies to develop these adjustments and in some cases combined them with other
adjustments (for example, for adverse selection or pent-up demand). 35 Of the States that did not use a risk-sharing arrangement, several covered newly eligible adults
under fee-for-service arrangements, and one covered enrollees through private health insurance plans
using premium assistance. Several other States chose not to use risk-sharing arrangements.

29
As a result of these arrangements, there is the potential that the ultimate payments
for newly eligible adults in 2014 and 2015 may be notably greater, or less, than those
currently reported. Few States had reported the results of these contractual
arrangements by the end of 2015. Based on the results of States that have reported
such information, and comparisons of the costs for newly eligible and non-newly
eligible adults enrolled in Medicaid, the Federal government is projected to receive
an estimated $3.2 billion from the risk-mitigation strategies in 2014 and an estimated
$5.5 billion from those arrangements in 2015; moreover, it is expected that similar
amounts would be paid to the Federal government in 2016 and 2017, respectively,
representing about 9 percent of capitation payments for newly eligible adults in 2014
and 2015. Since few States have reported the results of these contractual provisions,
and because of the different arrangements employed by those States and the
uncertainty regarding the costs of the new adult enrollees, it is possible that the
actual amounts returned to the Federal government could be significantly greater, or
less, than estimated here. It is also possible—although unlikely—that the net effect
on Federal expenditures would be an increase in costs as opposed to a decrease in
costs. In addition, since few States have reported these results to CMS thus far, it is
possible that the actual payments to the Federal government (or potentially from the
Federal government) could occur later than expected.
While the per enrollee costs shown for 2014 and 2015 in this report do not include the
potential returns to the Federal government, it is illustrative to see the impact that
subtracting these amounts would have on per enrollee costs in those years. Prorating
these estimated recoveries over the fiscal years would reduce the newly eligible adult
per enrollee costs by about 9 percent in each of 2014 ($5,001) and 2015 ($5,796).
Taking into account the results of the risk-mitigation strategies from the States that
have reported and the estimated impacts of the other States, the projected per
enrollee costs for newly eligible adults for 2016 amount to $5,910, a 7.2-percent
decrease from 2015. Per enrollee costs are projected to decline further in 2017 to
$5,439 (a decrease of 8.0 percent from 2016). By 2024, the costs per enrollee for newly
eligible adults are expected to be $7,649, which would be about 7 percent lower than
those for other adults. This difference in projections is less than in previous reports;
in the 2014 report, per enrollee costs for newly eligible adults were projected to be
about 30 percent lower than those for non-newly eligible adults by 2023.
Due to the limited data on newly eligible enrollees in 2014 and 2015 and the
uncertainties regarding both their health care costs and enrollment in the program,
the estimates and projections regarding this population should still be considered less
certain than the projections for other populations. Both expenditures and enrollment
may differ significantly from the projections shown in this report.

30
E. COMPARISON TO 2014 REPORT PROJECTIONS
The projections of Medicaid expenditures in this report are slightly higher than in
the 2014 Actuarial Report on the Financial Outlook for Medicaid. Figure 7 compares
the 2014 projections of total Medicaid expenditures (including Federal and State) to
those in last year’s report.
Figure 7—Projected Medicaid Expenditures: Comparison of 2014 versus 2015 Actuarial Reports on the Financial Outlook for Medicaid,
Fiscal Years 2008–202336 (in billions)
$0
$100
$200
$300
$400
$500
$600
$700
$800
$900
$1,000
2009 2010 2011 2012 2013 2014 2015 2016 2017 2018 2019 2020 2021 2022 2023 2024
2014 Report
2015 Report
Actual Projected
Expenditures in 2015 ($554.3 billion) were higher than estimated last year
($529.0 billion), representing a 4.8-percent difference. Most of this difference is
attributable to higher newly eligible enrollment and higher per capita expenditures
than estimated in last year’s report. Projected spending of $868.0 billion in 2023 is
4.0 percent higher than the corresponding amount from last year ($835.0 billion). In
total, the 10-year projections from 2014 through 2023 are $242.1 billion, or
3.7 percent, higher. The increase over the 10-year period was mainly the result of
differences between the projected 2015 expenditures in the 2015 and 2014 reports.
36 The data for this graph can be found in table 20 in section D of the Appendix.

31
Offsetting the higher base spending are a number of other factors. The projected
increases in utilization (or the residual factors) were slower in this year’s report than
in last year’s. As recent historical expenditures have grown more slowly, the outlook
for future utilization growth in the program has changed accordingly. In addition, the
assumption regarding how many States would expand Medicaid in the future has
been lowered (from States covering 60 percent of potentially newly eligible adults to
55 percent), and this modification partly offsets higher projected expenditures by
2023.
Medicaid enrollment is expected to be somewhat lower by 2023 than projected in the
2014 report for the same year. Enrollment is projected to reach 76.9 million by 2023,
whereas enrollment was projected to be 78.8 million by 2023 in last year’s report
(a difference of 2.4 percent). This difference is due to updated enrollment data for
2011, partial enrollment data for 2012 and 2013, and the assumption that fewer
States would elect to implement the eligibility expansion than assumed last year. In
particular, historical enrollment among children was lower than previously
estimated, resulting in lower enrollment levels over the projection period. Child
enrollment is projected to reach 29.6 million in 2023, compared to 31.9 million in last
year’s report. Total Medicaid enrollment from 2014 through 2023 is projected to grow
at an average rate of 2.8 percent, which is lower than last year’s projection of
3.0 percent over the same period.

32
F. MEDICAID IN CONTEXT
From the estimates and analysis of health spending in the U.S. provided by the
national health expenditure (NHE) accounts, additional insight can be obtained into
the role of Medicaid within the total U.S. health care system.37 Medicaid spending in
the 2014 NHE accounts represented 16.4 percent of total NHE. Private health
insurance was the largest source of spending on health care in 2014, accounting for
32.7 percent of total NHE, while Medicare paid for 20.4 percent.38
The historical NHE also presents health care spending by the original source of
financing (or sponsor). In calendar year (CY) 2014, Medicaid represented 36.2 percent
of Federal government expenditures on health services and supplies and 37.0 percent
of such spending by State and local governments. For the first time since 2010 (when
the Federal share of Medicaid payments was temporarily increased), Medicaid is
larger than Medicare as a share of Federal government expenditures on health
services and supplies. (Medicare accounted for 34.2 percent of Federal expenditures
in 2014.) Medicaid is the largest source of Federal general revenue-based spending
on health services. A sizeable portion of Medicare spending is funded by income from
dedicated revenue sources—which include Medicare Part A payroll taxes and Part B
and Part D beneficiary premiums—with the balance from Federal general revenues.
In contrast, Medicaid does not have any dedicated Federal revenue source; all Federal
spending on Medicaid comes from general revenue. For State governments, Medicaid
is the largest source of general revenue-based spending on health services, although
spending on all other health programs in 2009 exceeded spending on Medicaid,
largely because of the temporary increases to the FMAP.39
Moreover, Medicaid has a greater number of enrollees than Medicare. In FY 2014,
Medicaid is estimated to have covered 64.0 million individuals (including persons
residing in U.S. Territories). In comparison, Medicare covered an average of
53.8 million people during CY 2014.40 Within these totals, there are substantial
differences between the programs in the number and nature of people covered. For 37 The historical Medicaid spending data and projections presented in this report differ slightly from
the NHE estimates and projections in several ways. Some of the differences are as follows: (i) the data
and projections featured in this report are shown on a fiscal year basis, whereas the NHE amounts
are on a calendar year basis; (ii) the NHE accounts make several adjustments to Medicaid, such as
classifying Medicaid spending for Medicare premiums as Medicare spending; and (iii) the NHE
accounts use somewhat different definitions of services than do the data presented in this report. 38 A. Martin, et al., “National Health Spending in 2014: Faster Growth Driven By Coverage Expansion
And Prescription Drug Spending,” Health Affairs, 35, no.1 (2016): 150-160. 39 Ibid. There are some State dedicated revenues for Medicaid. For more detail on this analysis of
health care spending by sponsor, see the methodology paper at http://www.cms.gov/Research-
Statistics-Data-and-Systems/Statistics-Trends-and-Reports/NationalHealthExpendData/Downloads/
dsm-11.pdf. 40 The 2015 Annual Report of the Boards of Trustees of the Federal Hospital Insurance and Federal
Supplementary Medical Insurance Trust Funds (https://www.cms.gov/research-statistics-data-and-
systems/statistics-trends-and-reports/reportstrustfunds/downloads/tr2015.pdf).

33
example, Medicare automatically covers nearly all people over age 65 (44.9 million
beneficiaries in 2014), but only those aged individuals with very low incomes and
assets—and who apply for the coverage—become Medicaid enrollees (estimated at
5.4 million). Enrollment for persons with disabilities was more similar between the
two programs; Medicaid covered an estimated average of 10.2 million persons with
disabilities in 2014, while Medicare covered 8.9 million beneficiaries with disabilities.
Although the definition of disability is essentially the same for the two programs, the
other eligibility criteria are entirely different.41 Finally, as noted earlier, a majority
of Medicaid enrollees are either children or certain adults in families with low
incomes. Medicare does not have comparable categories of beneficiaries. Dual-eligible
individuals are estimated to have accounted for $144.2 billion of total Medicaid
expenditures in 2014, or 33 percent of benefits.42
Among the different types of health care services, Medicaid plays the largest role in
the funding of long-term care. According to the 2014 NHE, Medicaid is estimated to
have paid for 35.6 percent of all freestanding home health care and 31.9 percent of
all freestanding nursing home care in the U.S. In addition, Medicaid covered an
estimated 55.8 percent of other health, personal, and residential care in 2014,
including Medicaid payments for intermediate care facilities and for home and
community-based waivers.43 Medicaid has a major responsibility for providing long-
term care because the program covers some aged persons and many persons with
disabilities of all ages, who tend to be the most frequent and most costly users of such
care, and because private health insurance and Medicare often furnish only limited
coverage for these benefits. Many people who pay for nursing home care or
community-based long-term care privately become impoverished due to the expense;
as a result, these people eventually become eligible for Medicaid. Figure 8 shows the
percentage of total spending for the major health care services that Medicaid covers.
41 Medicaid eligibility for individuals with disabilities is based on income and asset criteria (among
other measures). Medicare eligibility generally depends on an individual’s sufficient participation in
the paid work force prior to disability. Despite these different requirements, a significant number of
persons with disabilities qualify for coverage under both Medicaid and Medicare. 42 These figures reflect actual 2014 reported expenditures from the CMS-64 and projected 2014
enrollment (based on 2011, 2012, and 2013 MAX data). 43 A. Martin, et al., “National Health Spending in 2014: Faster Growth Driven By Coverage Expansion
And Prescription Drug Spending.”

34
Figure 8—Medicaid Expenditures as Percentage of Total U.S. Health Expenditures, by Service Category, Calendar Year 2014
Total16.4%
Other Professional Services7.4%
Dental Services8.9%
Prescription Drugs9.2%
Physician and Clinical Services10.6%
Durable Medical Equipment13.2%
Hospital Care17.3%
Nursing Care Facilities and Continuing Care Retirement Communities
31.9%
Home Health Care35.6%
Other Health, Residential, and Personal Care
55.8%
0% 10% 20% 30% 40% 50% 60% 70%
Medicaid Share
Serv
ice
Medicaid represents a significant share of the Federal and State budgets. In FY 2015,
out of a total of $3,688 billion spent by the Federal government for all purposes,
$350 billion (or 9.5 percent) can be attributed to Medicaid. Under the President’s
Fiscal Year 2017 Budget, Federal outlays on Medicaid are projected to account for
9.5 percent of all Federal outlays by 2024.44
According to the National Association of State Budget Officers (NASBO), Medicaid
represented an estimated 25.6 percent of all State government spending in State
fiscal year 2014.45 This amount, however, includes all Federal contributions to State
Medicaid spending, as well as expenditures from State general revenue funds and
other State funds (which for Medicaid may include provider taxes, fees, donations,
assessments, and local funds). According to NASBO, Medicaid was the largest
program in 2014. When only State general revenues are considered, however,
Medicaid spending constituted an estimated 19.3 percent of State expenditures in
2014 (the same percentage as in 2013), placing it well behind elementary and
44 More information on the Federal budget is available in Analytical Perspectives, Budget of the United
States Government, Fiscal Year 2017. 45 State Expenditure Report: Examining Fiscal 2013−2015 State Spending, National Association of
State Budget Officers, 2015.

35
secondary education. Overall in 2014, State general revenue expenditures for
Medicaid increased by 4.2 percent, which was slightly faster than the overall State
general revenue growth rate of 3.9 percent.
As shown in figure 9, Medicaid represented about 2.9 percent of the Gross Domestic
Product (GDP) in 2014, which was an increase from the program’s 2.7-percent share
in 2013. In large part, this result reflects the increases in Medicaid expenditures
associated with the eligibility expansion in 2014.
Figure 9—Past and Projected Medicaid Expenditures as Share of GDP, Fiscal Years 1966–202446
0%
1%
2%
3%
4%
5%
Fiscal Year
Actual Projected
Note: Percentages are affected by economic cycles.
In 2015, GDP is estimated to have grown at a rate of 4.2 percent, while Medicaid
spending is estimated to have increased by 12.1 percent, due in part to the continuing
coverage expansion under the Affordable Care Act. Accordingly, Medicaid spending
is estimated to have increased to 3.1 percent as a share of GDP in 2015.
As seen in figure 9, the program’s expenditures are projected to continue to grow to
3.3 percent of GDP by 2024. From 2015 through 2024, Medicaid expenditures are
projected to increase about 1.4 percentage points faster than GDP on average per
year. Much of this difference is expected to be due to the eligibility expansion, which
46 The data for this graph can be found in table 21 in section D of the Appendix.
36
accounts for 0.6 percentage point, or about half, of the difference between projected
Medicaid expenditure and GDP growth rates over the 10 years.
This projection of Medicaid spending as a share of GDP is greater than the projection
included in last year’s report. The share of GDP devoted to Medicaid in 2023 is
projected to be 3.2 percent, about 0.1 percentage point higher than the
2014 projection. Medicaid expenditures are projected to grow more rapidly than
previously projected, driven by higher costs for the newly eligible adult population.

37
IV. SUMMARY OF DATA, ASSUMPTIONS, AND
METHODOLOGY
Projections of Medicaid expenditures and enrollment are highly dependent on both
demographic and economic assumptions. The most important such assumptions are
those regarding the growth of health care prices, growth in the use of health care
goods and services, overall economic growth, individual wage growth, and population
growth. In addition, there are various “programmatic” factors that have historically
influenced Medicaid expenditure and enrollment trends, including decisions by the
States regarding eligibility and payment rules for their Medicaid plans, the coverage
of and enrollment in other health insurance programs, including Medicare and
private health insurance, and changes in the participation rates of eligible persons in
Medicaid. The projections also depend on the nature and quality of the available data
on Medicaid operations. This section briefly describes the sources of data and
assumptions that are used to generate the Medicaid projections shown in this report;
further detail is provided in sections A and B of the Appendix.
Data Sources
The data and assumptions on which these Medicaid projections are based are derived
from three major sources. The first source is CMS data, which are submitted by the
States to CMS on a regular basis. These data include the CMS-64 Financial
Management Report (FMR) and the Medicaid Analytic eXtract (MAX).
The FMR provides separate Federal and State expenditures for all Medicaid fee-for-
service programs and capitation arrangements.47 The data and projections in this
Medicaid actuarial report rely on the “Net Services” FMR, while prior Medicaid
reports used the “Base” FMR. Both the Net Services and Base FMRs provide the same
total expenditures, but the former allocates prior period adjustments by service, while
the latter does not. Neither the total expenditures reported nor the projected total
expenditures are changed as a result of the switch from the Base to the Net Services
FMR, but the benefit expenditures per enrollee are generally increased (since the
benefit expenditures are more complete and thus are greater), as are the benefit
expenditures for some categories of service. OACT made this change because using
the Net Services FMR provides a more accurate allocation of the costs (by category of
service and by enrollment category) than does reporting a significant portion of
expenditures as prior period adjustments, and because further complications arise
when the Base FMR is used and adjustments are allocated to the newly eligible
adults. The effects of changing from the Base to the Net Services FMR are described
more fully in section A of the Appendix.
47 More information on the CMS-64 is available on the CMS website at http://medicaid.gov/Medicaid-
CHIP-Program-Information/By-Topics/Data-and-Systems/MBES/medicaid-budget-and-
expenditure-system-MBES.html. Additional detail is provided in section A of the Appendix.

38
Table 4 shows the 2014 Medicaid medical assistance payments and administration
costs reported in the Net Services FMR.
Table 4—Total Medical Assistance Payments and Administration Expenditures from the CMS-64 Financial Management Report, Fiscal Year 2014
Type of Payment Total Federal State
Medical Assistance Payments $470,011,904,943 $283,935,251,308 $186,076,653,635 Administration Costs 24,399,466,827 15,181,424,592 9,218,042,235 Total Expenditures 494,411,371,770 299,116,675,900 195,294,695,870
Note: The complete CMS-64 Financial Management Report for medical assistance payments and administrative costs in FY 2014 is provided in section D of the Appendix and is available on the CMS website at https://www.medicaid.gov/medicaid-chip-program-information/by-topics/financing-and-reimbursement/expenditure-reports-mbes-cbes.html. This report uses data that are more recent than the information that is published online, and as a result there are small differences between the amounts shown in this table and the Appendix and those shown elsewhere in the report.
CMS data also include MAX, which contains both service and demographic data
supplied by the States, including provider payments and enrollment counts, and is
derived from the Medicaid Statistical Information System (MSIS).48 MAX
expenditure data include only total Medicaid expenditures and do not provide data
separately for Federal or State expenditures. Several adjustments are made to merge
the CMS-64 and MAX data together for use in preparing projections. In past Medicaid
reports, historical data and projections relied on Annual Person Summary (APS) data
files from MSIS. It is worth noting that MAX data are based on the same claims data
from MSIS, and although there are differences in the way the claims are summarized,
these differences do not have a significant impact on the projections in this report.
The change to MAX was made because prior reports from MSIS (such as the APS)
have been discontinued, and using MSIS claims data directly proved to be technically
impractical. The effects of changing from MSIS to MAX are described in section A of
the Appendix. Historical data shown in the report from 2000 through 2004 are based
on MSIS.
Table 5 shows average annual Medicaid enrollment by enrollment category for the
last 5 years of complete enrollment data.
48 More information regarding MAX can be found on the CMS website at
https://www.cms.gov/research-statistics-data-and-systems/computer-data-and-systems/
medicaiddatasourcesgeninfo/maxgeneralinformation.html, and more information regarding MSIS can
be found on the CMS website at http://www.medicaid.gov/Medicaid-CHIP-Program-Information/By-
Topics/Data-and-Systems/MSIS/Medicaid-Statistical-Information-System.html.

39
Table 5—Average Annual Medicaid Enrollment by MAX Enrollment Category, Fiscal Years 2007–2011
Enrollment Category 2007 2008 2009 2010 2011
Aged 4,538,274 4,633,327 4,742,798 4,902,403 5,024,767
Persons with Disabilities 8,306,574 8,559,183 8,915,394 9,221,414 9,697,492
Children 21,315,335 21,790,290 23,338,750 25,320,255 26,076,618
Adults 10,074,624 10,664,823 11,675,142 12,894,319 13,535,364
Children (Unemployed Parent) 110,053 136,864 182,751 217,681 234,629
Unemployed Adults 124,624 118,178 148,525 181,847 200,381
Foster Care Children 880,243 904,297 897,986 880,381 839,798
Breast and Cervical Cancer Act Enrollees 31,313 34,294 38,152 40,055 41,881
Total 45,381,040 46,841,256 49,939,498 53,658,355 55,650,929
Note: MAX data for 2011 are supplemented with MSIS data for Kansas and Maine, as information for these two States is unavailable in the 2011 MAX data.
Key Assumptions
The Boards of Trustees for Old-Age, Survivors, and Disability Insurance (OASDI, or
Social Security) and Medicare constitute the second source for the data and
assumptions.49 The projections in this Medicaid report are based on the same
economic and demographic assumptions that were developed by the Trustees and
used to determine the intermediate estimates presented in their statutory
2015 annual reports to Congress on the financial status of the OASDI and Medicare
programs. The Trustees’ intermediate economic assumptions are also used to develop
the health care service price forecasts underlying the projections in this report.50 Due
to large changes in the projected and actual 2016 Part B premium, however,
premiums for Part A and Part B from the President’s Fiscal Year 2017 Budget were
used for projecting Medicaid expenditures on Medicare premiums.
The third source of underlying data and assumptions—NHE historical data and
projections—is used for comparing Medicaid expenditures and enrollment with
49 The 2015 Annual Report of the Boards of Trustees of the Federal Hospital Insurance and Federal
Supplementary Medical Insurance Trust Funds (https://www.cms.gov/research-statistics-data-and-
systems/statistics-trends-and-reports/reportstrustfunds/downloads/tr2015.pdf) and The 2015 Annual
Report of the Board of Trustees of the Federal Old-Age and Survivors Insurance and Federal Disability
Insurance Trust Funds (https://www.ssa.gov/oact/TR/2015/tr2015.pdf). 50 These assumptions are different from those used for projections in the President’s Fiscal Year 2017
Budget. Consequently, the projections presented in this report usually differ somewhat from the
President’s Budget projections. In addition, due to differences in the timing of this report and the
Budget, later data are generally available for use in this report. Finally, while the Trustees’ economic
assumptions underlie both the Medicare Trustees Report and the Medicaid actuarial report, the two
sets of health care service price growth forecasts are not the same. The two programs have significantly
different statutory mechanisms for setting provider price updates, and these differences are reflected
in the updated assumptions for each program.
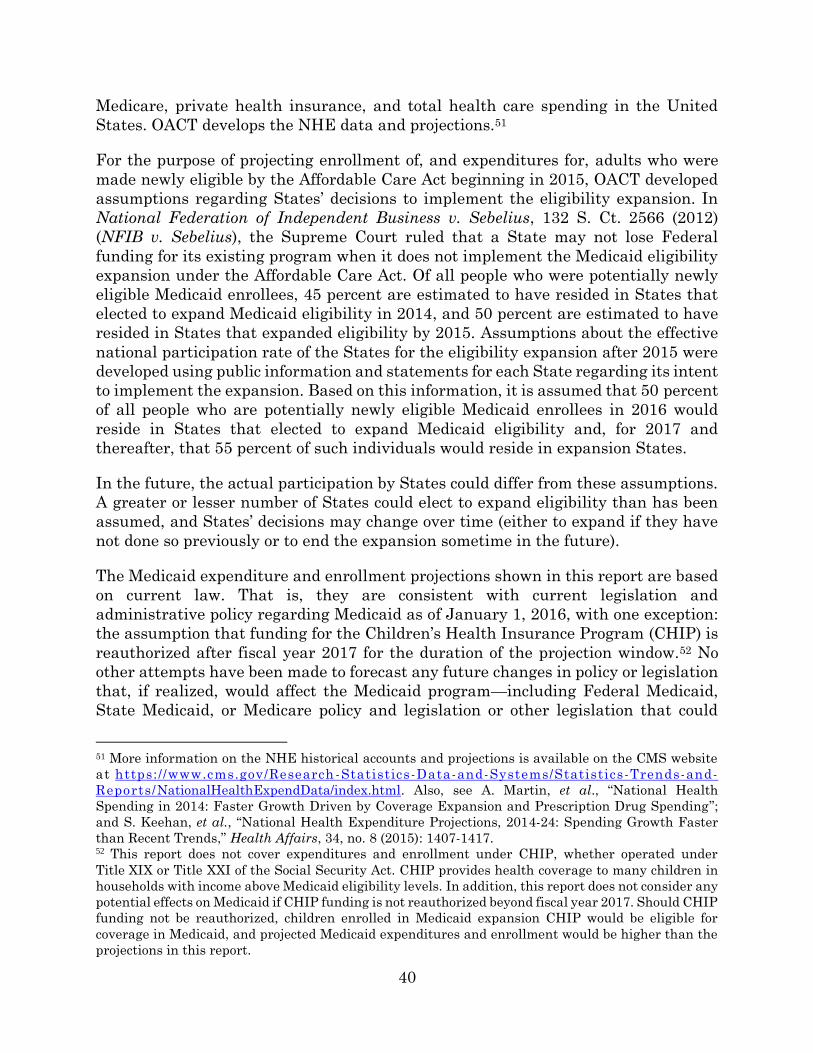
40
Medicare, private health insurance, and total health care spending in the United
States. OACT develops the NHE data and projections.51
For the purpose of projecting enrollment of, and expenditures for, adults who were
made newly eligible by the Affordable Care Act beginning in 2015, OACT developed
assumptions regarding States’ decisions to implement the eligibility expansion. In
National Federation of Independent Business v. Sebelius, 132 S. Ct. 2566 (2012)
(NFIB v. Sebelius), the Supreme Court ruled that a State may not lose Federal
funding for its existing program when it does not implement the Medicaid eligibility
expansion under the Affordable Care Act. Of all people who were potentially newly
eligible Medicaid enrollees, 45 percent are estimated to have resided in States that
elected to expand Medicaid eligibility in 2014, and 50 percent are estimated to have
resided in States that expanded eligibility by 2015. Assumptions about the effective
national participation rate of the States for the eligibility expansion after 2015 were
developed using public information and statements for each State regarding its intent
to implement the expansion. Based on this information, it is assumed that 50 percent
of all people who are potentially newly eligible Medicaid enrollees in 2016 would
reside in States that elected to expand Medicaid eligibility and, for 2017 and
thereafter, that 55 percent of such individuals would reside in expansion States.
In the future, the actual participation by States could differ from these assumptions.
A greater or lesser number of States could elect to expand eligibility than has been
assumed, and States’ decisions may change over time (either to expand if they have
not done so previously or to end the expansion sometime in the future).
The Medicaid expenditure and enrollment projections shown in this report are based
on current law. That is, they are consistent with current legislation and
administrative policy regarding Medicaid as of January 1, 2016, with one exception:
the assumption that funding for the Children’s Health Insurance Program (CHIP) is
reauthorized after fiscal year 2017 for the duration of the projection window.52 No
other attempts have been made to forecast any future changes in policy or legislation
that, if realized, would affect the Medicaid program—including Federal Medicaid,
State Medicaid, or Medicare policy and legislation or other legislation that could
51 More information on the NHE historical accounts and projections is available on the CMS website
at https://www.cms.gov/Research -Statistics-Data-and-Systems/Statistics-Trends-and-
Reports/NationalHealthExpendData/index.html. Also, see A. Martin, et al., “National Health
Spending in 2014: Faster Growth Driven by Coverage Expansion and Prescription Drug Spending”;
and S. Keehan, et al., “National Health Expenditure Projections, 2014-24: Spending Growth Faster
than Recent Trends,” Health Affairs, 34, no. 8 (2015): 1407-1417. 52 This report does not cover expenditures and enrollment under CHIP, whether operated under
Title XIX or Title XXI of the Social Security Act. CHIP provides health coverage to many children in
households with income above Medicaid eligibility levels. In addition, this report does not consider any
potential effects on Medicaid if CHIP funding is not reauthorized beyond fiscal year 2017. Should CHIP
funding not be reauthorized, children enrolled in Medicaid expansion CHIP would be eligible for
coverage in Medicaid, and projected Medicaid expenditures and enrollment would be higher than the
projections in this report.

41
affect private health insurance plans. Thus, while changes in Federal or State
Medicaid policy have been a significant factor affecting the patterns of growth in
expenditures and enrollment over history, no future changes in policy are assumed
(beyond those already scheduled under current law).
Methodology
Health actuaries typically base estimates of medical expenditures on three major
factors:
• C – the number of people enrolled in the program (“caseload”),
• U – the quantity of services each person uses (“utilization”), and
• P – the reimbursement (“price”) for each unit of service.
The product of these three factors yields an estimate of total expenditures for medical
services:
𝐸 = 𝐶 × 𝑈 × 𝑃 (1)
Direct application of equation (1) requires data on utilization and reimbursement
rates for Medicaid that are not currently available or practical to maintain.53 An
alternative recursive approach is therefore used for the projections, as described
below.
Instead of using equation (1), the projection algorithm begins with development of
data on the current level of Medicaid expenditures, by eligibility category and by type
of medical service, to serve as a projection base. Changes in the three determinants
of expenditures in equation (1) are then projected for future years and applied
sequentially to the base year expenditures. Thus, if Ey represents expenditures in
year y, then
𝐸𝑦+1 = 𝐸𝑦 × (1 + 𝑐𝑦+1) × (1 + 𝑢𝑦+1) × (1 + 𝑝𝑦+1) (2)
where cy+1, uy+1, and py+1 are the assumed or projected rates of change in caseload,
utilization, and prices, respectively, between years y and y+1. Equation (2) is applied
separately to expenditures for each combination of the Medicaid eligibility categories
and categories for type of service.
With a few exceptions, caseload factors vary by eligibility category, price factors vary
by type of service, and utilization factors can vary by both eligibility category and
type of service. The projected caseload factors are determined by trend and regression
53 No comprehensive sources are available that track reimbursement rates and use by service for all
Medicaid programs. Because the expenditure data reported by the States in the CMS-64 are at an
aggregate service level, each category likely includes various services with different numbers of claims
and distinct reimbursement rates. Additionally, reimbursement rates and service use are different for
each State.

42
analysis of Medicaid enrollment data. Projections of future enrollment by eligibility
category are based on estimates of the change in the share of the U.S. population
enrolled in Medicaid, which has historically varied with changes in the
unemployment rate. The relationship between Medicaid enrollment and
unemployment reflects (i) how many people are without other forms of insurance and
(ii) how many people might qualify for Medicaid based on its income requirements.
Historically, this relationship has varied by eligibility category; in general, children
and adult enrollment in Medicaid has been more sensitive to changes in the
unemployment rate, and the enrollment of aged persons and persons with disabilities
has been relatively less sensitive.
Price changes are derived from economic forecasts produced for the 2015 Medicare
Trustees Report, including forecasts for economy-wide inflation, inflation for prices
of medical services, and wage growth. Utilization is treated as the residual between
total growth and the growth due to enrollment and price changes. The estimate of
utilization is determined by an analysis of the historical interrelationship of
expenditure, caseload, and price factor growth.54 The residual factor, while termed
“utilization,” reflects not only the change in the average number of services per
enrollee but also changes in the “intensity” or average complexity of the services. In
addition, any errors in the measurement of the number of enrollees and price per
service are implicitly included in the residual.
The methodology used to develop the utilization factor for the projections is calculated
by service and by enrollment category. While for some services historical utilization
is similar across enrollment categories, utilization in services disproportionately
concentrated in one or two enrollment categories can vary significantly by enrollment
category. In these cases, projecting utilization by both type of service and enrollment
category improves the accuracy of the forecast. In addition, the growth of managed
care in Medicaid has reduced historical fee-for-service utilization for several types of
service. The extent to which States appear to have maximized their use of managed
care or are likely to continue to expand is measured and projected in the utilization
factor for managed care services and the affected fee-for-service categories.
The results obtained from the “Caseload, Utilization, Price” (“CUP”) recursive
forecast, using equation (2), are frequently adjusted to be consistent with recent
expenditure data and outlay trends.
It is important to note that some of the reported line items in the financial data are
not projected using category- or service-specific growth rates with respect to caseload,
utilization, or price. Collections reported by the States constitute the largest such
item, and they are projected to grow at the underlying total Medicaid expenditure
growth rate, calculated net of all reported collections. In addition, payments for the
Medicare Part A and Part B premiums are projected to grow at the same rate as the
54 More details on the trend residual methodology are included in section C of the Appendix.

43
premiums projected in the President’s Fiscal Year 2017 Budget, and separate
utilization and price trends are not developed.
The projections of newly eligible adult enrollment and costs are based on currently
available data from the CMS-64 and on several assumptions, including projections of
population growth, eligibility for and enrollment in other forms of health care
coverage (such as employer-sponsored insurance and the Health Insurance
Marketplaces), and growth in the utilization and prices of health care services. In
addition, preliminary indications are that the actual costs for these beneficiaries are
significantly less than the payments made to managed care plans to cover them.
These results are considered in developing the projected per enrollee costs for newly
eligible adults. The Analysis section of the report discusses this issue in more detail.
The projections in the report also include estimated payments that the Federal
government is anticipated to receive from managed care plans (via the States)
through risk corridors and minimum medical loss ratio requirements for the newly
eligible adults covered in managed care in 2014 and 2015. (These payments are
described in more detail in section III.D of the report.) To develop these estimates,
per enrollee costs of the newly eligible adults in 2014 and 2015 were compared to
projections of the costs of non-newly eligible adults. The costs for the non-newly
eligible were based on data from the 2010 APS, adjusted to discount the costs of
pregnant women (as pregnant women are not expected to be among the newly
eligible) and projected forward using the data and assumptions of per enrollee costs
underlying this report. The costs of the newly eligible individuals were compared to
the projected costs for non-newly eligible individuals after adjusting for assumptions
of additional costs due to pent-up demand among the new enrollees. The amounts
estimated to be owed by plans in each State were then determined using a “model”
risk corridor (reflecting average terms for the risk corridor, such as how much risk
remained with the plan and how much remained with the Federal government), and
those amounts were adjusted to match in the States that have reported preliminary
risk corridor or minimum medical loss ratio amounts to CMS. While this methodology
provides a reasonable indication of the amounts that the Federal government is likely
to receive from the managed care plans, in actuality the amounts could be
significantly greater, or less, than estimated.
In addition to benefit expenditures, this report includes projections of administration
costs that are based on historical administrative cost reporting, as well as projected
growth rates from the President’s Fiscal Year 2017 Budget.
Like any projection of future health care costs, the Medicaid projections presented
here are necessarily uncertain. Actual numbers of enrollees, the number of services
used, and the reimbursement levels per service will depend on all of the factors
described previously—none of which can be predicted with certainty. Past increases
in Medicaid and other health care costs have often been relatively volatile, adding to
the difficulty of correctly anticipating future trends. Moreover, the impacts of the

44
numerous sections of the Affordable Care Act that affect Medicaid, especially the
broadening of Medicaid eligibility in 2014, introduce additional uncertainty into these
projections. Finally, there is relatively limited experience for people who became
eligible for and enrolled in Medicaid in 2014 and 2015; accordingly, while these
estimates are more certain than those in previous reports, they should still be
considered uncertain due to the relative lack of program data and experience to
inform them and the uncertainty about which States will expand their eligibility
standards in the future.
The projections shown in this report should be regarded only as a reasonable
indication of future Medicaid costs under current law and from today’s perspective.
It is important to recognize that actual costs in the future could differ significantly
from these projections, as a result of (i) unanticipated developments in demographic,
economic, or health cost growth trends and (ii) any further changes in the legislation
governing Medicaid.
Sections A and B of the Appendix includes additional detail regarding the data,
assumptions, and methodologies used in the projections in this report.

45
V. CONCLUSION
Medicaid expenditures are estimated to have grown 12.1 percent in 2015 and to have
reached $554.3 billion. Faster growth in enrollment is estimated to have been
strongly driven by the eligibility expansion that started on January 1, 2014 under the
Affordable Care Act, and per enrollee costs increased in 2015 as well. Although
growth is expected to slow after 2015, enrollment and expenditures are expected to
continue to steadily increase, with total Medicaid expenditures growing to a projected
$920.5 billion by 2024. The projected annual average growth rate of Medicaid
expenditures from 2015 to 2024 is 6.4 percent—notably faster than the projection of
average annual GDP growth of 5.0 percent. Should these trends continue as projected
under current law, Medicaid’s share of State budgets would continue to expand
absent other changes to the program, budget expenditures, or budget revenues, while
its share of the Federal budget would remain about the same.
While some data are available on the number of newly eligible adults enrolled in
Medicaid and their health care costs, there is still a considerable amount of
uncertainty regarding the projections of the eligibility expansion impacts. Along with
the expansion of Medicaid eligibility, other significant changes occurred in 2014 and
2015, including the conversion of the income eligibility criteria to a modified adjusted
gross income (MAGI) basis and the start of the Health Insurance Marketplaces.
Accordingly, the actual expenditures, enrollment, and effects of the Medicaid
eligibility expansion may differ from the estimates and projections presented in this
report.
The proportion of Medicaid expenditures for capitation payments and premiums is
projected to increase, as is the number of enrollees that receive all or some of their
Medicaid benefits through a managed care plan. This trend accelerated as many
States covered newly eligible enrollees through managed care plans in 2014 and 2015.
In addition, States have continued to expand the use of managed care to cover aged
enrollees and enrollees with disabilities and to provide for long-term care services
through managed care programs. Thus, understanding how the use of managed care
in Medicaid will affect future expenditure growth—and how fee-for-service
expenditures for acute care and long-term care will also be affected—will be an
important consideration for Medicaid programs in the future.
Because Medicaid does not have any dedicated revenue source at the Federal level or
a trust fund approach to financing, the solvency of the program is not an issue; the
expenditures of each State (or Territory) program are covered by the State’s revenues
plus Federal matching general revenues. However, even without solvency as a
concern, Medicaid constitutes a significant portion of spending by both Federal and
State governments and thus is important to evaluate as part of the budget.
Typically the cost growth rates of different payers and programs, such as Medicare,
Medicaid, and private health insurance plans, are related. Attempts by one payer or

46
program to affect costs can have a direct or indirect impact on other payers and
programs. Whether such efforts are focused on the payment or management of health
care specific to certain programs, or on the delivery or practice of health care
generally, it will be important to consider the potential effects not just on Medicaid
but across all health care payers. Programs and demonstrations that focus on health
care provided for persons enrolled in both Medicare and Medicaid (dual-eligible
beneficiaries), or that focus on Medicare but also include some dual-eligible
beneficiaries, may have effects on the costs and quality of care paid for by Medicaid.
This report includes projections of the current-law Medicaid program. As policy
makers consider changes or reforms to the program, for Medicaid specifically or for
the broader health care system, particular attention may need to be paid to the ways
in which Medicaid differs from other types of health care coverage—for example, in
its administration, the benefits offered, the populations covered, and the ways in
which it pays for health care. Other important issues for consideration, as Medicaid’s
role continues to evolve, are provider participation, Medicaid payment rates, and
beneficiary access to services.

47
VI. APPENDIX
A. DATA SOURCES
Projections of Medicaid expenditures and enrollment are highly dependent on both
demographic and economic assumptions, as well as on program data. This section
describes the sources and limitations of data and assumptions that are used to
generate the Medicaid projections shown in this report.
CMS-64 (Financial Management Reports)
The CMS-64 reports (Financial Management Reports, or FMRs) are products of the
Medicaid and CHIP Budget and Expenditure Systems (MBES/CBES). These reports
are submitted by the States quarterly and provide current fiscal year spending. The
expenditure amount shown on the FMR is a summary of expenditures for the various
mandatory and optional services covered by the Medicaid State programs. In
addition, in 2014 the CMS-64 began reporting monthly enrollment data by
enrollment category as well as quarterly expenditures for newly eligible adults.55
The mandatory services contained in the FMR include inpatient and outpatient
hospital care, physician services, nursing facility care for individuals aged 21 or older,
family planning services, rural health clinic services, home health care, laboratory
and x-ray tests, other practitioner services, federally qualified health center services,
and early and periodic screening, diagnostic, and treatment services for children
under age 21 (EPSDT). Among the many reported optional services that States may
provide are clinic services, prescription drugs, services furnished by intermediate
care facilities for the intellectually disabled, hospice care, home and community-
based care to certain persons with chronic impairments, and targeted case
management services. Additionally, the FMR captures expenditures for DSH
payments, offsets to drug spending through rebates, Medicare Part A and Part B
premiums paid for those dually eligible for Medicare and Medicaid, premiums paid
for Medicaid-only capitated arrangements, and expenditures for home and
community-based waiver programs.
The FMR also includes the separate Federal and State expenditures for all Medicaid
fee-for-service programs and capitation arrangements. The FMR is available on a
“Net Services” basis and a “Base” basis, both of which report the same total
expenditures. The historical data and projections provided here are based on the
55 The CMS-64 reports enrollment and expenditures for enrollees in the “VIII group,” which includes
those persons who are eligible under the criteria of section 1902(a)(10)(A)(i)(VIII) of the Social Security
Act. Most enrollees in this group are newly eligible adults, but some adults who may have been eligible
under pre-2014 criteria are in this group as well. The CMS-64 provides data on both newly eligible
adults and other enrollees in the VIII group separately for 2014 and 2015.

48
expenditure data in the Net Services reports. This is a change from previous Medicaid
reports, which used the Base reports for historical data and projections.
The main difference between the Net Services and Base reports is that the Base
report provides service-level expenditures that were both incurred and paid in the
current quarter, whereas the Net Services report shows expenditures by service on a
paid basis. The Base report allocates expenditures that were paid in a different
quarter than the services were incurred as prior period adjustments, and it similarly
groups all collections (negative adjustments to payments) together. The Net Services
report allocates all prior period adjustments to individual services, and it reports as
collections only those collections that are not associated with a specific service (such
as recoveries for fraud, waste, and abuse). Total expenditures are the same in both
reports.
Because the Net Services report allocates prior period adjustments by service, the net
effect is that the amount of prior period adjustments to expenditures is reduced while
expenditures by category of service are increased. Therefore, the amounts reported
for benefit expenditures by category of service and for benefit expenditures per
enrollee are more complete and effectively higher under the Net Services report than
under the Base report, and, as a result, these benefit expenditures by category of
service and the accompanying projections are greater than shown in previous
Medicaid reports.
Table 6 compares per enrollee by enrollment category under the Base FMR and the
Net Services FMR for 2005 through 2014.

49
Table 6—Medicaid Medical Assistance Payments Per Enrollee, by Enrollment Category, Base FMR and Net Services FMR Comparison,
Fiscal Years 2005–2014
Base FMR on APS Data
Fiscal Year Aged Disabled Children Adults
2005 $15,515 $15,957 $2,138 $3,366 2006 14,863 15,490 2,276 3,436 2007 14,903 15,989 2,471 3,694 2008 15,576 16,290 2,537 3,893 2009 15,821 17,126 2,604 4,011 2010 15,472 17,514 2,591 4,065 2011 15,837 18,120 2,679 4,391 2012 15,558 17,213 2,732 4,230 2013 15,519 17,331 2,841 4,371 2014 15,339 17,354 3,152 4,594
Net Services FMR on APS Data
Fiscal Year Aged Disabled Children Adults
2005 $15,702 $16,448 $2,176 $3,407 2006 15,154 15,976 2,286 3,467 2007 15,209 16,643 2,528 3,834 2008 15,852 16,895 2,575 4,008 2009 16,063 17,901 2,653 4,125 2010 15,827 18,387 2,670 4,177 2011 16,319 18,988 2,779 4,499 2012 15,893 18,200 2,834 4,313 2013 15,549 18,834 3,012 4,547 2014 15,569 18,584 3,137 4,897
Base FMR and Net Services FMR Difference
Fiscal Year Aged Disabled Children Adults
2005 1.2% 3.1% 1.8% 1.2% 2006 2.0% 3.1% 0.4% 0.9% 2007 2.1% 4.1% 2.3% 3.8% 2008 1.8% 3.7% 1.5% 2.9% 2009 1.5% 4.5% 1.9% 2.8% 2010 2.3% 5.0% 3.1% 2.8% 2011 3.0% 4.8% 3.8% 2.4% 2012 2.2% 5.7% 3.7% 2.0% 2013 0.2% 8.7% 6.0% 4.0% 2014 1.5% 7.1% −0.5% 6.6%
Medicaid Analytic eXtract (MAX) and the Medicaid Statistical Information System
(MSIS)
The Medicaid Statistical Information System (MSIS) is the basic source of State-
submitted eligibility and claims data on the Medicaid population, its demographic
characteristics, utilization of health care services, and payments. The purpose of
MSIS is to collect, manage, analyze, and disseminate information on eligible

50
individuals, beneficiaries, utilization, and payment for services that are covered.
States provide CMS with quarterly files consisting of specified data elements for
persons covered by Medicaid and adjudicated claims for medical services reimbursed
with Title XIX funds. Four types of claims files representing inpatient services, long-
term care, prescription drugs, and non-institutional services are submitted. Claims
records contain information on the types of services used, providers, service dates,
costs, and types of reimbursements. Eligibility characteristics, such as basis-of-
eligibility and maintenance assistance status, are the foundation of the enrollment
projections; specifically, the primary basis-of-eligibility categories consist of aged
persons, persons who are blind or have other disabilities, non-disabled children
(including foster care children), and non-aged, non-disabled adults (including women
eligible under the Breast and Cervical Cancer Act eligibility expansion).
The data and projections in this report generally rely on the Medicaid Analytic
eXtract (MAX). MAX contains both service and demographic data supplied by the
States, including provider payments and enrollment counts, and is derived from
MSIS.56 As is the case with MSIS, MAX expenditure data include only total Medicaid
expenditures, and MAX does not provide data separately for Federal or State
expenditures. Several adjustments are made to the CMS-64 and MAX data to merge
them together for use in preparing projections.
In past Medicaid reports, historical data and projections relied on data from MSIS—
mainly from the Annual Person Summary (APS) files. It is worth noting that MAX
data are based on claims data from MSIS, and although there are differences in the
way the claims are summarized, these differences do not have a significant impact on
the projections in this report. Historical data shown in the report from 2000 through
2004 are based on MSIS.
Table 7 compares per enrollee costs by enrollment category using the APS data and
the MAX data for 2005 through 2014.
56 More information regarding MAX can be found on the CMS website at
https://www.cms.gov/research-statistics-data-and-systems/computer-data-and-systems/
medicaiddatasourcesgeninfo/maxgeneralinformation.html.

51
Table 7—Medicaid Medical Assistance Payments Per Enrollee, by Enrollment Category, APS and MAX Comparison,
Fiscal Years 2005–2014 (Per Enrollee Spending)
Net Services on APS Data
Fiscal Year Aged Disabled Children Adults
2005 $15,702 $16,448 $2,176 $3,407 2006 15,154 15,976 2,286 3,467 2007 15,209 16,643 2,528 3,834 2008 15,852 16,895 2,575 4,008 2009 16,063 17,901 2,653 4,125 2010 15,827 18,387 2,670 4,177 2011 16,319 18,988 2,779 4,499 2012 15,893 18,200 2,834 4,313 2013 15,549 18,834 3,012 4,547 2014 15,569 18,584 3,137 4,897
Net Services on MAX Data
Fiscal Year Aged Disabled Children Adults
2005 $15,254 $16,405 $2,247 $3,407 2006 15,023 15,743 2,348 3,503 2007 15,124 16,589 2,591 3,894 2008 15,631 17,013 2,640 3,987 2009 15,738 17,744 2,723 4,162 2010 15,591 18,176 2,730 4,219 2011 15,780 18,267 2,865 4,526 2012 15,745 18,130 2,822 4,438 2013 15,427 18,976 2,963 4,584 2014 15,106 18,793 3,144 4,910
APS and MAX Data Difference
Fiscal Year Aged Disabled Children Adults
2005 −2.9% −0.3% 3.2% 0.0% 2006 −0.9% −1.5% 2.7% 1.0% 2007 −0.6% −0.3% 2.5% 1.6% 2008 −1.4% 0.7% 2.6% −0.5% 2009 −2.0% −0.9% 2.6% 0.9% 2010 −1.5% −1.1% 2.2% 1.0% 2011 −3.3% −3.8% 3.1% 0.6% 2012 −0.9% −0.4% −0.4% 2.9% 2013 −0.8% 0.8% −1.6% 0.8% 2014 −3.0% 1.1% 0.2% 0.3%
Users of Medicaid data may note discrepancies between the expenditure information
captured in MAX and the CMS-64. For example, DSH payments and Medicare
premiums do not appear in MAX. Whereas actual payments are reflected in the
CMS-64, in MAX adjudicated claims data are used. Service definitions vary in these
two sources as well. Territorial data for American Samoa, Guam, the Northern
Mariana Islands, Puerto Rico, and the Virgin Islands appear in the CMS-64, but not

52
in MAX. Each State has a different system for capturing statistical (MSIS) and
financial (CMS-64) data.
It is important to note the limitations that are associated with the data described in
this section. First, MAX data are available for 48 States through 2011, for only 40 in
2012, and for only 30 in 2013, while MSIS data are available for two additional States
in 2011. MAX (and the MSIS data from which MAX is derived) is the only available
source of complete enrollment data.57 Consequently, to relate 2011, 2012, and 2013
actual expenditures to the number of enrollees, estimates of Medicaid enrollment are
prepared for those years for the missing States.58 For 2014 (and for the projections
for 2015 through 2024), enrollment is estimated using a regression model and
historical data, including available State data for 2011, 2012, and 2013. MAX also
does not provide data on enrollment in Territory programs, and thus enrollment
figures for Territories are estimated from previous data; to estimate enrollment in
the Territories for 2014 and 2015, for example, data from the CMS-64 are used.
Accordingly, there is uncertainty regarding the estimates of the number of enrollees
and expenditures by enrollment category in the most recent historical years.59
Another qualification is that it was only in 2014 that the CMS-64 began providing
data on enrollment or spending by enrollment category (and, in the case of spending
by enrollment category, only for newly eligible adults or other adults in the
“VIII group”).60 In addition, the definitions of medical service categories are not
consistent between the MAX (or the MSIS) and the other data sources. Adjustments
are made to develop a data set that contains not only service-level expenditures that
match the CMS-64 data but also expenditures by enrollment group; accordingly, the
MAX and the CMS-64 are merged together to provide a more complete understanding
of Medicaid spending. Since the service definitions are different between these two
sources, MAX data are used to estimate spending by enrollment group for each
Medicaid service reported in the CMS-64.61 While every State that chose to expand
its program is reporting enrollment data in the CMS-64, regular updates to these
57 While the CMS-64 provides enrollment data starting in 2014, there is no period in which the MSIS
or MAX data overlap with the CMS-64, and thus it is not possible to determine how closely the two
sources match. The figures in this report are based on the MAX data, and the CMS-64 enrollment data
are used only for newly eligible adults and for enrollment in the Territories, which are not included in
any current MAX data. 58 In this report, child Medicaid enrollees consist of non-disabled children, children of unemployed
parents, and foster care children; adult Medicaid enrollees consist of non-disabled non-aged adults,
unemployed adults, and women covered under the Breast and Cervical Cancer Act expansion; and
disabled Medicaid enrollees consist of blind or disabled persons. 59 CMS is in the process of transitioning Medicaid data from MSIS to the Transformed Medicaid
Statistical Information System (T-MSIS), but T-MSIS is not currently available. 60 The “VIII group” refers to enrollees who are eligible under section 1902(a)(10)(A)(i)(VIII) of the Social
Security Act, including newly eligible adults. 61 Certain services in the CMS-64 for which there is little to no history are combined with other services
assumed to have a matching underlying distribution of spending by eligibility category.

53
submissions indicate that the data are not yet final for FY 2015. To develop the
enrollment estimates and projections for this report, the CMS-64 enrollment data
were used only for the number of newly eligible adults enrolled.
Finally, OACT reviewed the data sources used in these projections for reasonableness
but relied on CMS program components and the States to ensure the quality of the
data.
B. KEY ASSUMPTIONS
The primary demographic, economic, and health cost inflation assumptions
underlying the Medicaid projections shown in this report are the same as those used
by the Social Security and Medicare Boards of Trustees in their 2015 reports to
Congress.62
The price assumptions used to develop the Medicaid expenditure projections are
derived from the assumptions included in the Social Security and Medicare Trustees
Reports. While these price assumptions are specifically meant to measure the
changes in the prices that Medicare would pay providers, they also generally reflect
the projected growth in the prices of health care services.
As noted in section IV of this report, there is no single data source available that
tracks all Medicaid prices or price changes. In addition, since States do not have a
prescribed methodology for updating provider reimbursement rates, there are no
specific or consistent forecasts of the changes in the prices for health care services
that can be used across all Medicaid programs. Accordingly, OACT relies on other
forecasts from Medicare, which are assumed to be reasonable projections of the
underlying growth in health care prices that States would consider when changing
provider reimbursement rates within their Medicaid programs.
The principal economic assumptions include growth in average wages and the CPI.
These and other assumptions are used to generate health care service input price
indices (or “market baskets”) for inpatient hospital and home health care services.
These indices serve as indicators of increases in Medicaid payments per service.
It is important to note that these price assumptions may not accurately measure the
underlying changes in the prices paid by Medicaid programs year to year. States have
significant discretion in setting reimbursement rates, and in any given year the
changes in rates paid to providers may differ from the changes in the price
assumptions that are used to project future price changes for Medicaid expenditures.
Thus, while these price forecasts are expected to reasonably estimate the changes in
prices over time, they may not be precise measures of the actual changes in prices in
62 Further information on the Trustees’ population projections and economic assumptions is available
in the 2015 Social Security and Medicare Trustees Reports (https://www.cms.gov/research-statistics-
data-and-systems/statistics-trends-and-reports/reportstrustfunds/downloads/tr2015.pdf).

54
any State Medicaid program. Moreover, to the extent that any specific price
assumption is not an accurate assessment of the change in the price paid for any
particular service, the difference between the actual change in price and the change
in the price assumption would be reflected in the residual factor. While in general the
residual factor is meant to represent changes in utilization, it would also incorporate
errors in the measurement of prices.
Medicaid enrollment is projected by eligibility category: aged persons, persons with
disabilities, children, newly eligible adults, and other adults. The model measures
enrollment by eligibility category as a percentage of the U.S. population by relevant
age group (aged—U.S. population aged 65 and over; disabled—U.S. population aged
0-64; children—U.S. population aged 0-19; and adults—U.S. population aged 20-64).
Historical enrollment is measured for 1992 through 2011—the period for which
reliable enrollment data exist in MSIS (1992-2004) and MAX (2005-2011).63
The relationship between the change in the share of the U.S. population enrolled in
Medicaid by eligibility category and the change in the national U.S. unemployment
rate is measured using a regression model. Analysis conducted in developing this
enrollment model has shown that the unemployment rate is the most meaningful
factor in analyzing changes in historical Medicaid enrollment. Other economic
variables either are not statistically significant or do not improve the accuracy of the
model. In addition, changes in the unemployment rate have a strong theoretical
relationship with Medicaid enrollment. As the unemployment rate increases, fewer
people have jobs, leading in turn to a greater number of people with lower incomes
and more individuals likely eligible for Medicaid. Moreover, a decrease in the number
of people with jobs is likely to lead to fewer people with private health insurance, and
as a result more people may enroll in Medicaid for health care coverage. Conversely,
as the unemployment rate decreases, an increase in the number of people with jobs
is likely to lead to increases in income and more people with private health insurance,
and consequently enrollment growth in Medicaid may be slower. The Trustees do not
typically forecast economic cycles, and thus the projections of Medicaid enrollment in
this report do not exhibit the same cyclical variation that enrollment has experienced
historically.
The change in the share of the U.S. enrolled population is projected forward using
the results of the regression model and forecasts of the unemployment rate from the
2015 Social Security Trustees Report for each eligibility category. Enrollment is
projected using those results and the forecasts of the U.S. population from the 2015
63 Medicaid enrollment data have lagged by as much as 2 years in recent history, and this lag has
increased during the transition to the new Medicaid data system. CMS is in the process of transitioning
Medicaid data from MSIS to the Transformed Medicaid Statistical Information System (T-MSIS), but
T-MSIS is not currently available. Until the system is operational, it is unclear what data will be
available and what form the data will take. More information about T-MSIS is available at
http://www.medicaid.gov/medicaid-chip-program-information/by-topics/data-and-systems/medicaid-
and-chip-operational-data.html.

55
Trustees Report. The projections from the model may be adjusted, in particular for
estimates of enrollment in recent years (in this Medicaid report, enrollment is
estimated for 2012, 2013, and 2014); in estimating historical enrollment, other data
or information is often used to adjust the results from the Medicaid enrollment
models. Typically, other sources do not provide enrollment at the same level of detail
as shown in MAX or in this Medicaid report, but such sources may inform the overall
level of enrollment or the growth rate of total enrollment in those historical years.
Changes in the utilization of services and other changes in expenditures not reflected
in changes in enrollment or prices are reflected in the “residual” factors in the model.
The trend residual approach to projecting Medicaid expenditures begins with an
analysis of historical Medicaid expenditures per enrollee on a service-by-service basis.
The annual percent change in these per enrollee expenditures is compared to the
change in the applicable price indicator (listed below), and the differential, or
residual, is calculated. This residual measures the collective impact of changes in
utilization and “intensity” (average complexity) of services, case mix effects, and other
factors, and it is calculated by service and by eligibility category. For the purpose of
developing projected expenditures, the residual may be calculated as the average
across all eligibility categories (typically when the residuals across eligibility
categories have similar values, or when the amount of spending for one or more
eligibility categories is relatively small and there are potential concerns about the
credibility of the residual factor). The basis of the projected residual is the historical
average of the residual value (either as a weighted average or an unweighted average
over the previous several years), but adjustments may be made by gradually
increasing or decreasing the residual toward the average residual for a broader
category of services (such as all acute care, all long-term care, or all medical services).
The residuals are adjusted to limit the value of any particular service from
significantly increasing or decreasing more than the value of all services (or broader
categories of services). In general, the residual of all services (or broader categories
of services) tends to be more stable, but it is necessary to use residuals by service to
account for changes in the Medicaid program as well. Often, these adjustments are
made to reflect areas in which there has likely been a shift between services or
categories of services in recent history, but projecting those changes to continue at
the same rate over 10 years would not necessarily be the best estimate of future
expenditures.
One key example concerns the historical shifts of Medicaid expenditures from fee-for-
service programs (especially acute care services, such as hospital services, physician
and other professional services, and prescription drugs) to managed care. As part of
the adjustment, managed care expenditures as a share of total expenditures were
reviewed by State and by eligibility category. This review provided more detailed
information on the use of managed care across States, as well as some evidence
regarding the extent to which recent expenditure growth in managed care programs
was driven by the States’ expansion of their use of these programs. The analysis

56
suggested that managed care expenditures were likely to continue to grow relatively
quickly but, over time, were more likely to slow, as the rate at which States shift
expenditures to managed care programs slows. Similarly, the analysis suggested that
the residuals for acute care services in general would increase over the same period
as the shift from fee-for-service programs decelerates.
The table below shows the price indicators currently used to produce Medicaid
expenditure projections.
Type of Service Price Indicator
Inpatient and outpatient hospital Medicare hospital input price index (market basket),
before the application of productivity adjustment
Physician, clinic, and related services Medical CPI increase
Institutional long-term care Maximum of CPI increase and average wage increase
Community long-term care and home
and community-based waiver services
Medicare home health input price index, before the
application of productivity adjustment
Prescription drugs CPI increase
Managed care Medical CPI increase
One exception to the trend residual methodology occurs in the case of some premiums.
The costs for Medicare premiums financed by Medicaid are based on the projected
premium rates for Medicare Parts A and B in the President’s Fiscal Year 2017
Budget. The proportions of aged and blind or disabled enrollees who are “bought into”
Medicare by the States or the Federal government through premium payments are
assumed to remain at historical levels.

57
C. RESIDUAL ANALYSIS RESULTS AND ASSUMPTIONS
This section provides the results of the analysis used to calculate the residual factors
for the projections. The following tables show the historical residual factors and the
projected values by eligibility category and by service for the largest five services (as
measured by total 2014 expenditures).
Table 8—Historical and Projected Residual Factors for Aged Enrollees, Selected Services, Fiscal Years 2009–2024
Fiscal Year
Nursing Facility
Managed Care
Home and Community-
Based Waivers Inpatient Hospital
Personal Care
Historical data:
2009 0.6% 4.6% 2.0% −1.3% 0.6%
2010 −5.7% 30.4% −7.1% −4.4% −5.7%
2011 −3.7% 7.3% −0.7% 23.8% −10.3%
2012 −8.1% 36.3% −5.9% −16.4% −5.6%
2013 −4.5% 21.2% 3.7% −4.3% −64.9%
2014 −7.2% −3.8% −3.9% −16.0% 52.9%
Projections:
2015 −5.7% 15.1% −0.3% −6.7% −14.7%
2016 −5.3% 13.2% −0.3% −6.0% −13.3%
2017 −4.9% 11.2% −0.3% −5.4% −11.8%
2018 −4.4% 9.3% −0.3% −4.7% −10.4%
2019 −4.0% 7.3% −0.3% −4.1% −8.9%
2020 −3.6% 5.4% −0.3% −3.4% −7.5%
2021 −3.6% 5.4% −0.3% −3.4% −7.5%
2022 −3.6% 5.4% −0.3% −3.4% −7.5%
2023 −3.6% 5.4% −0.3% −3.4% −7.5%
2024 −3.6% 5.4% −0.3% −3.4% −7.5%
Table 8 shows the residual factors for the largest five services for aged enrollees based
on estimates of 2014 expenditures; spending for these services constituted 82 percent
of total estimated Medicaid expenditures for aged enrollees, as shown in table 9.
(Medicare Part B premiums are shown below, but residual factors are not calculated
for Medicare premiums.)
Table 9—Fiscal Year 2014 Selected Service Expenditures for Aged Enrollees
(in billions)
Service 2014 Expenditures
Nursing Facility $36.9 Managed Care 12.8 Home and Community-Based Waivers 5.9 Medicare Part B Premiums 5.3 Inpatient Hospital 3.0 Personal Care 2.8
Total Expenditures for Aged Enrollees 81.7

58
Table 10—Historical and Projected Residual Factors for Enrollees with Disabilities, Selected Services, Fiscal Years 2009–2024
Fiscal Year Managed Care
Home and Community-
Based Waivers
Inpatient Hospital
Nursing Facility
Prescription Drugs (and Rebates)
Historical data:
2009 7.3% 7.2% 2.2% 3.3% 1.5%
2010 3.6% 1.2% 1.1% −5.6% −2.0%
2011 9.2% −2.5% 7.1% 1.2% 1.3%
2012 27.0% −1.8% −13.9% −5.9% −23.3%
2013 21.1% 19.3% −3.0% −2.0% −19.9%
2014 9.5% −13.2% −13.7% −7.1% 0.8% Projections:
2015 12.7% −0.3% −6.4% −3.9% −5.4%
2016 9.1% −0.3% −5.8% −3.7% −4.9%
2017 5.5% −0.3% −5.2% −3.4% −4.4%
2018 5.5% −0.3% −4.5% −3.2% −3.9%
2019 5.5% −0.3% −3.9% −2.9% −3.3%
2020 5.5% −0.3% −3.3% −2.7% −2.8%
2021 5.5% −0.3% −3.3% −2.7% −2.8%
2022 5.5% −0.3% −3.3% −2.7% −2.8%
2023 5.5% −0.3% −3.3% −2.7% −2.8%
2024 5.5% −0.3% −3.3% −2.7% −2.8%
Table 10 shows the residual factors for the top five services for enrollees with
disabilities based on estimates of 2014 expenditures; spending for these services
constituted 68 percent of total estimated Medicaid expenditures for enrollees with
disabilities, as shown in table 11. (Prescription drug expenditures do not include
Medicaid prescription drug rebates.)
Table 11—Fiscal Year 2014 Selected Service Expenditures for Enrollees with Disabilities
(in billions)
Service 2014 Expenditures
Managed Care Organizations $45.0 Home and Community-Based Waivers 36.4 Inpatient Hospital 24.4 Nursing Facility 12.7 Prescription Drugs 11.5
Total Expenditures for Enrollees with Disabilities 192.1

59
Table 12—Historical and Projected Residual Factors for Child Enrollees, Selected Services, Fiscal Years 2009–2024
Fiscal Year Managed
Care Inpatient Hospital
Prescription Drugs (and Rebates) Physician
Outpatient Hospital
Historical data:
2009 1.8% −4.0% 1.5% −1.9% 9.7%
2010 −1.2% −8.9% −2.0% 3.8% −1.3%
2011 10.6% 3.2% 1.3% −2.6% 5.7%
2012 0.1% −9.2% −23.3% −18.2% −18.4%
2013 12.7% 7.4% −19.9% −12.0% 0.7%
2014 11.5% −12.8% 0.8% −3.7% −13.7%
Projections:
2015 5.8% −4.6% −3.9% −5.4% −5.1%
2016 4.3% −3.5% −3.0% −4.1% −3.9%
2017 2.8% −2.4% −2.1% −2.8% −2.7%
2018 2.8% −2.4% −2.1% −2.8% −2.7%
2019 2.8% −2.4% −2.1% −2.8% −2.7%
2020 2.8% −2.4% −2.1% −2.8% −2.7%
2021 2.8% −2.4% −2.1% −2.8% −2.7%
2022 2.8% −2.4% −2.1% −2.8% −2.7%
2023 2.8% −2.4% −2.1% −2.8% −2.7%
2024 2.8% −2.4% −2.1% −2.8% −2.7%
Table 12 shows the residual factors for the top five services for the child population
based on estimates of 2014 expenditures; spending for these services constituted
80 percent of total estimated Medicaid expenditures for children, as shown in
table 13. (Prescription drug expenditures do not include Medicaid prescription drug
rebates.)
Table 13—Fiscal Year 2014 Selected Service Expenditures for Child Enrollees
(in billions)
Service 2014 Expenditures
Managed Care Organizations $45.0 Inpatient Hospital 12.5 Prescription Drugs 4.5 Physician Services 4.1 Outpatient Hospital 3.2
Total Expenditures for Children 86.5

60
Table 14—Historical and Projected Residual Factors for Adult Enrollees, Selected Services, Fiscal Years 2009–2024
Fiscal Year Managed
Care Inpatient Hospital
Outpatient Hospital
Prescription Drugs (and Rebates) Physician
Historical data:
2009 1.1% −7.7% 5.8% 11.7% −14.3%
2010 4.9% −9.2% −4.1% 8.2% −1.8%
2011 11.0% 13.2% 4.4% 7.5% 0.5%
2012 3.8% −14.3% −12.0% −37.2% −16.9%
2013 2.6% 3.5% 11.0% −15.6% −11.5%
2014 14.7% −14.1% −12.7% 3.4% 2.5%
Projections:
2015 6.2% −5.8% −3.3% −0.3% −7.2%
2016 4.6% −4.4% −2.5% −0.3% −5.5%
2017 3.0% −3.0% −1.8% −0.3% −3.7%
2018 3.0% −3.0% −1.8% −0.3% −3.7%
2019 3.0% −3.0% −1.8% −0.3% −3.7%
2020 3.0% −3.0% −1.8% −0.3% −3.7%
2021 3.0% −3.0% −1.8% −0.3% −3.7%
2022 3.0% −3.0% −1.8% −0.3% −3.7%
2023 3.0% −3.0% −1.8% −0.3% −3.7%
2024 3.0% −3.0% −1.8% −0.3% −3.7%
Table 14 shows the residual factors for the top five services for the adult population
based on estimates of 2014 expenditures; spending for these services constituted
90 percent of total estimated Medicaid expenditures for adults, as shown in table 15.
(Prescription drug expenditures do not include Medicaid prescription drug rebates.)
Table 15—Fiscal Year 2014 Selected Service Expenditures for Adult Enrollees
(in billions)
Service 2014 Expenditures
Managed Care Organizations $40.8 Inpatient Hospital 12.9 Outpatient Hospital 4.7 Prescription Drugs 4.0 Physician Services 3.7
Total Expenditures for Adults 73.6
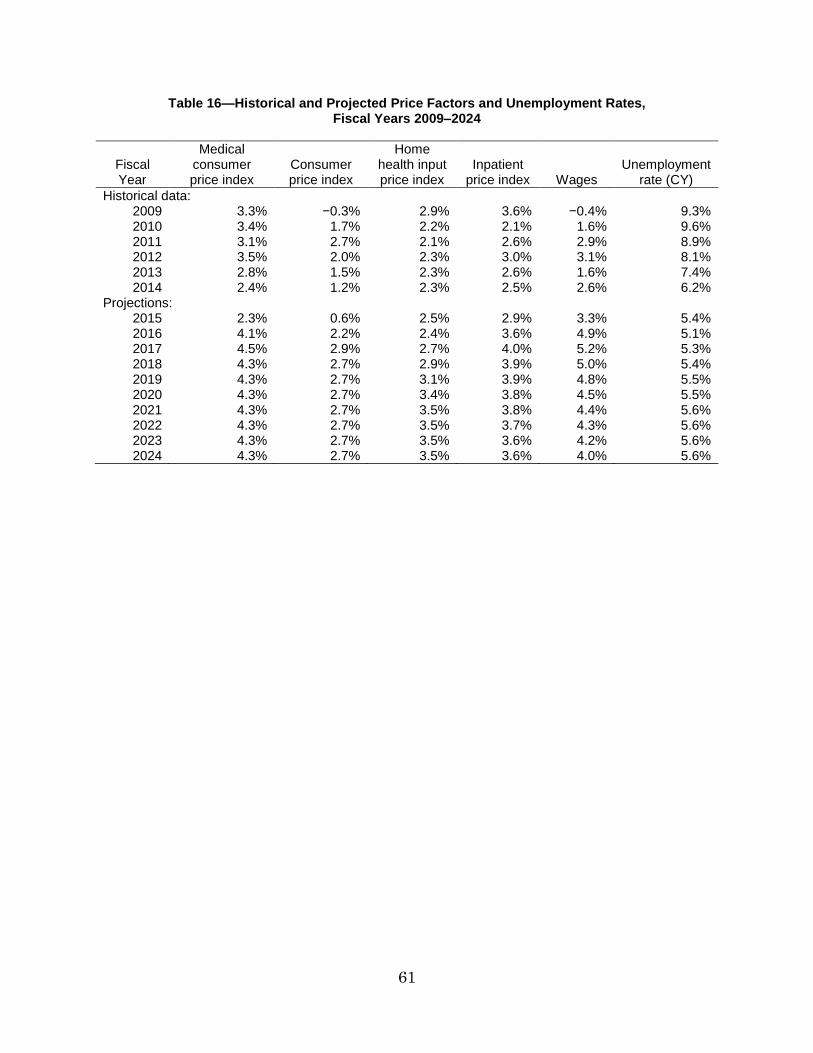
61
Table 16—Historical and Projected Price Factors and Unemployment Rates, Fiscal Years 2009–2024
Fiscal Year
Medical consumer price index
Consumer price index
Home health input price index
Inpatient price index Wages
Unemployment rate (CY)
Historical data: 2009 3.3% −0.3% 2.9% 3.6% −0.4% 9.3% 2010 3.4% 1.7% 2.2% 2.1% 1.6% 9.6% 2011 3.1% 2.7% 2.1% 2.6% 2.9% 8.9% 2012 3.5% 2.0% 2.3% 3.0% 3.1% 8.1% 2013 2.8% 1.5% 2.3% 2.6% 1.6% 7.4% 2014 2.4% 1.2% 2.3% 2.5% 2.6% 6.2%
Projections: 2015 2.3% 0.6% 2.5% 2.9% 3.3% 5.4% 2016 4.1% 2.2% 2.4% 3.6% 4.9% 5.1% 2017 4.5% 2.9% 2.7% 4.0% 5.2% 5.3% 2018 4.3% 2.7% 2.9% 3.9% 5.0% 5.4% 2019 4.3% 2.7% 3.1% 3.9% 4.8% 5.5% 2020 4.3% 2.7% 3.4% 3.8% 4.5% 5.5% 2021 4.3% 2.7% 3.5% 3.8% 4.4% 5.6% 2022 4.3% 2.7% 3.5% 3.7% 4.3% 5.6% 2023 4.3% 2.7% 3.5% 3.6% 4.2% 5.6% 2024 4.3% 2.7% 3.5% 3.6% 4.0% 5.6%

62
D. DATA FOR SELECTED FIGURES
The following tables provide the data underlying selected figures in the report.
Table 17—Past and Projected Medicaid Expenditures for Medical Assistance Payments, by Type of Payment, Fiscal Years 2000–2024
(Data for Figure 4)
(in billions)
Fiscal Year Acute care
FFS Long-term care FFS
Capitation payments & premiums
Disproportionate share hospital
payments
Historical data: 2000 $78.8 $67.9 $33.9 $14.4 2001 88.2 73.9 37.8 15.5 2002 103.2 81.1 44.7 15.4 2003 114.0 84.2 50.7 13.0 2004 124.0 87.3 52.7 15.4 2005 131.4 82.8 58.6 17.1 2006 121.3 101.1 65.0 17.1 2007 130.1 102.3 72.6 16.0 2008 131.7 108.1 82.8 17.1 2009 140.7 115.7 93.5 17.8 2010 151.2 117.2 104.3 17.6 2011 161.3 119.5 116.9 17.3 2012 148.0 119.3 132.5 17.1 2013 152.6 119.4 151.8 16.4 2014 152.1 116.2 191.6 18.1
Projections: 2015 159.2 119.1 239.3 18.4 2016 162.6 121.9 264.1 18.5 2017 166.5 124.8 283.2 18.9 2018 172.6 128.5 309.4 17.2 2019 179.4 132.8 338.1 16.3 2020 186.1 137.4 368.3 15.3 2021 193.1 142.3 400.9 14.3 2022 200.0 147.1 435.9 13.2 2023 206.8 151.9 473.9 12.2 2024 213.8 156.6 514.9 11.2
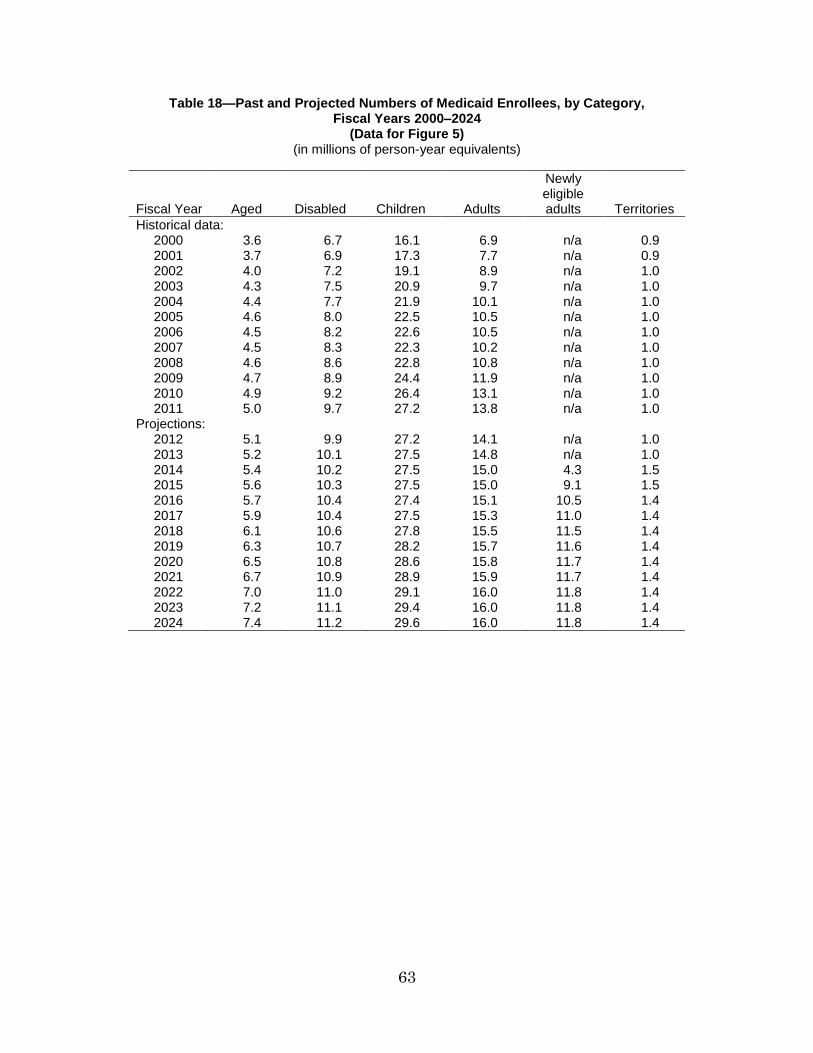
63
Table 18—Past and Projected Numbers of Medicaid Enrollees, by Category, Fiscal Years 2000–2024
(Data for Figure 5) (in millions of person-year equivalents)
Fiscal Year Aged Disabled Children Adults
Newly eligible adults Territories
Historical data: 2000 3.6 6.7 16.1 6.9 n/a 0.9 2001 3.7 6.9 17.3 7.7 n/a 0.9 2002 4.0 7.2 19.1 8.9 n/a 1.0 2003 4.3 7.5 20.9 9.7 n/a 1.0 2004 4.4 7.7 21.9 10.1 n/a 1.0 2005 4.6 8.0 22.5 10.5 n/a 1.0 2006 4.5 8.2 22.6 10.5 n/a 1.0 2007 4.5 8.3 22.3 10.2 n/a 1.0 2008 4.6 8.6 22.8 10.8 n/a 1.0 2009 4.7 8.9 24.4 11.9 n/a 1.0 2010 4.9 9.2 26.4 13.1 n/a 1.0 2011 5.0 9.7 27.2 13.8 n/a 1.0
Projections: 2012 5.1 9.9 27.2 14.1 n/a 1.0 2013 5.2 10.1 27.5 14.8 n/a 1.0 2014 5.4 10.2 27.5 15.0 4.3 1.5 2015 5.6 10.3 27.5 15.0 9.1 1.5 2016 5.7 10.4 27.4 15.1 10.5 1.4 2017 5.9 10.4 27.5 15.3 11.0 1.4 2018 6.1 10.6 27.8 15.5 11.5 1.4 2019 6.3 10.7 28.2 15.7 11.6 1.4 2020 6.5 10.8 28.6 15.8 11.7 1.4 2021 6.7 10.9 28.9 15.9 11.7 1.4 2022 7.0 11.0 29.1 16.0 11.8 1.4 2023 7.2 11.1 29.4 16.0 11.8 1.4 2024 7.4 11.2 29.6 16.0 11.8 1.4

64
Table 19—Past and Projected Medicaid Expenditures on Medical Assistance Payments Per Enrollee, by Enrollment Category, Fiscal Years 2000–2024
(Data for Figure 6) (in dollars per person-year equivalent enrollee)
Fiscal Year Aged Disabled Children Adults
Newly eligible adults
Average of all
enrollees
Historical data: 2000 $14,124 $12,218 $1,741 $2,805 n/a $5,411 2001 14,720 13,016 1,860 2,901 n/a 5,593 2002 14,817 14,471 2,030 2,975 n/a 5,829 2003 14,401 15,035 2,040 3,093 n/a 5,839 2004 14,700 15,157 2,079 3,245 n/a 5,900 2005 15,254 16,405 2,247 3,407 n/a 6,308 2006 15,023 15,743 2,348 3,503 n/a 6,255 2007 15,124 16,589 2,591 3,894 n/a 6,700 2008 15,631 17,013 2,640 3,987 n/a 6,863 2009 15,738 17,744 2,723 4,162 n/a 6,982 2010 15,591 18,176 2,730 4,219 n/a 6,923 2011 15,780 18,267 2,865 4,526 n/a 7,126
Projections: 2012 15,745 18,130 2,822 4,438 n/a 7,071 2013 15,423 18,969 2,960 4,580 n/a 7,318 2014 15,113 18,789 3,141 4,914 $5,488 7,324 2015 15,582 19,693 3,298 5,159 6,366 7,639 2016 16,299 20,633 3,471 5,431 5,910 7,903 2017 16,973 21,459 3,654 5,720 5,439 8,155 2018 17,645 22,372 3,846 6,023 5,555 8,505 2019 18,398 23,426 4,050 6,348 5,856 8,938 2020 19,135 24,576 4,263 6,688 6,178 9,401 2021 19,917 25,822 4,491 7,053 6,516 9,900 2022 20,741 27,138 4,728 7,435 6,873 10,427 2023 21,628 28,548 4,978 7,837 7,252 10,990 2024 22,566 30,060 5,243 8,266 7,649 11,595

65
Table 20—Projected Medicaid Expenditures: Comparison of 2014 versus 2015 Actuarial Reports on the Financial Outlook for Medicaid, Fiscal Years 2000–2024
(Data for Figure 7) (in billions)
Fiscal Year 2015 Report 2014 Report
Historical data: 2000 $206.2 $206.2 2001 229.0 229.0 2002 258.2 258.2 2003 276.2 276.2 2004 296.3 296.3 2005 315.9 315.9 2006 315.1 315.1 2007 332.2 332.2 2008 351.9 351.9 2009 378.6 378.6 2010 401.5 401.5 2011 427.4 427.4 2012 431.2 431.0 2013 455.6 456.1 2014 494.5 498.9
Projections: 2015 554.3 529.0 2016 586.0 557.6 2017 612.7 592.3 2018 647.5 623.6 2019 686.9 661.1 2020 728.2 700.6 2021 772.3 742.3 2022 818.7 786.6 2023 868.0 835.0 2024 920.5 n/a

66
Table 21—Past and Projected Medicaid Expenditures as Share of GDP, Fiscal Years 1966–2024, Selected Years
(Data for Figure 9) (in billions)
Fiscal Year Total
expenditures Expenditures as share of GDP
Historical data: 1966 $0.9 0.1% 1970 5.1 0.5% 1975 13.1 0.8% 1980 25.2 0.9% 1985 41.3 1.0% 1990 72.2 1.2% 1995 159.5 2.1% 2000 206.2 2.0% 2001 229.0 2.2% 2002 258.2 2.4% 2003 276.2 2.4% 2004 296.3 2.5% 2005 315.9 2.5% 2006 315.1 2.3% 2007 332.2 2.3% 2008 351.9 2.4% 2009 378.6 2.6% 2010 401.5 2.7% 2011 427.4 2.8% 2012 431.2 2.7% 2013 455.6 2.7% 2014 494.5 2.9%
Projections: 2015 554.3 3.1% 2016 582.8 3.0% 2017 607.7 3.1% 2018 647.5 3.1% 2019 686.9 3.1% 2020 728.2 3.1% 2021 772.3 3.1% 2022 818.7 3.2% 2023 868.0 3.2% 2024 920.5 3.3%

67
E. FINANCIAL MANAGEMENT REPORT DATA
Table 22—CMS-64 Financial Management Report, Net Services, Medical Assistance Payments, Fiscal Year 2014
Service Category Total Federal State
Inpatient Hospital - Reg. Payments $35,635,063,023 $21,072,567,455 $14,562,495,568
Inpatient Hospital - DSH 15,205,839,863 8,601,299,986 6,604,539,877
Inpatient Hospital - Sup. Payments 14,306,712,890 8,305,375,607 6,001,337,283
Inpatient Hospital - GME Payments 1,601,515,139 950,183,614 651,331,525
Mental Health Facility Services - Reg. Payments 2,577,475,151 1,482,931,747 1,094,543,404
Mental Health Facility - DSH 2,889,817,305 1,626,163,035 1,263,654,270
Nursing Facility Services - Reg. Payments 46,985,422,598 26,713,524,897 20,271,897,701
Nursing Facility Services - Sup. Payments 2,855,702,888 1,684,476,756 1,171,226,132
Intermediate Care Facility - Public 5,321,330,687 3,040,289,422 2,281,041,265
Intermediate Care Facility - Private 5,008,975,273 2,839,507,018 2,169,468,255
Intermediate Care Facility: Supplemental Payments 142,161,168 64,159,169 78,001,999
Physician & Surgical Services - Reg. Payments 10,187,795,101 6,320,326,606 3,867,468,495
Physician & Surgical Services - Sup. Payments 1,534,590,204 926,205,913 608,384,291
Physician & Surgical Services - Evaluation and Management 2,189,247,194 2,189,223,251 23,943
Physician & Surgical Services - Vaccine codes 162,320,957 162,320,588 369
Outpatient Hospital Services - Reg. Payments 12,518,289,358 7,914,932,846 4,603,356,512
Outpatient Hospital Services - Sup. Payments 3,468,083,576 1,935,111,863 1,532,971,713
Prescribed Drugs 21,394,306,794 13,289,542,197 8,104,764,597
Drug Rebate Offset - National −11,779,987,492 −6,923,288,533 −4,856,698,959
Drug Rebate Offset - State Sidebar Agreement −830,042,652 −506,661,111 −323,381,541
MCO - National Agreement −6,125,641,045 −3,532,352,791 −2,593,288,254
MCO - State Sidebar Agreement −121,148,946 −74,395,800 −46,753,146
Increased ACA OFFSET - Fee for Service −718,818,356 −718,818,356 0
Increased ACA OFFSET - MCO −373,934,776 −373,934,776 0
Dental Services 3,962,641,303 2,317,427,404 1,645,213,899
Other Practitioners Services - Reg. Payments 1,393,574,172 810,234,251 583,339,921
Other Practitioners Services - Sup. Payments 18,466,131 9,525,428 8,940,703
Clinic Services 5,335,558,416 3,348,094,328 1,987,464,088
Laboratory/Radiological 1,657,289,085 1,064,005,905 593,283,180
Home Health Services 3,737,046,635 2,164,754,090 1,572,292,545
Sterilizations 93,407,088 75,352,746 18,054,342
Abortions 79,150 42,094 37,056
EPSDT Screening 1,068,110,768 666,927,918 401,182,850
Rural Health 911,279,803 552,484,965 358,794,838
Medicare - Part A 3,045,585,111 1,649,342,250 1,396,242,861
Medicare - Part B 10,279,407,148 5,945,145,707 4,334,261,441
120% - 134% Of Poverty 702,405,775 702,405,775 0
Coinsurance 1,061,031,143 627,553,901 433,477,242
Medicaid - MCO 166,370,528,950 103,233,498,135 63,137,030,815
Medicaid MCO - Evaluation and Management 3,812,659,150 3,831,215,494 −18,556,344
Medicaid MCO - Vaccine codes 212,633,661 213,284,375 −650,714
Medicaid MCO - Community First Choice 17,035,317 12,321,646 4,713,671
Medicaid MCO - Preventive Services Grade A OR B, ACIP Vaccines 20,622 12,483 8,139
Prepaid Ambulatory Health Plan 677,124,781 449,920,888 227,203,893
MCO PAHP - Evaluation and Management 2,150,500 2,150,500 0
MCO PAHP - Vaccine codes 4,926 4,926 0
MCO PAHP - Community First Choice 0 0 0
MCO PAHP - Preventive Services Grade A OR B, ACIP Vaccines 0 0 0
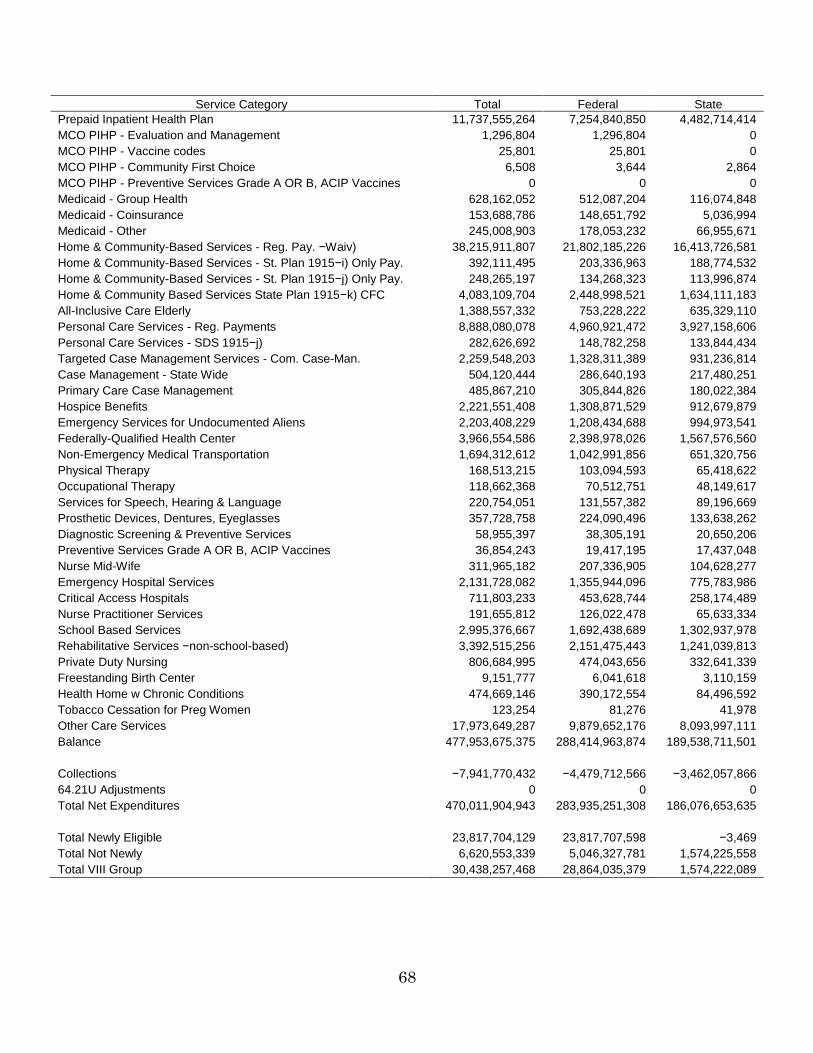
68
Service Category Total Federal State
Prepaid Inpatient Health Plan 11,737,555,264 7,254,840,850 4,482,714,414
MCO PIHP - Evaluation and Management 1,296,804 1,296,804 0
MCO PIHP - Vaccine codes 25,801 25,801 0
MCO PIHP - Community First Choice 6,508 3,644 2,864
MCO PIHP - Preventive Services Grade A OR B, ACIP Vaccines 0 0 0
Medicaid - Group Health 628,162,052 512,087,204 116,074,848
Medicaid - Coinsurance 153,688,786 148,651,792 5,036,994
Medicaid - Other 245,008,903 178,053,232 66,955,671
Home & Community-Based Services - Reg. Pay. −Waiv) 38,215,911,807 21,802,185,226 16,413,726,581
Home & Community-Based Services - St. Plan 1915−i) Only Pay. 392,111,495 203,336,963 188,774,532
Home & Community-Based Services - St. Plan 1915−j) Only Pay. 248,265,197 134,268,323 113,996,874
Home & Community Based Services State Plan 1915−k) CFC 4,083,109,704 2,448,998,521 1,634,111,183
All-Inclusive Care Elderly 1,388,557,332 753,228,222 635,329,110
Personal Care Services - Reg. Payments 8,888,080,078 4,960,921,472 3,927,158,606
Personal Care Services - SDS 1915−j) 282,626,692 148,782,258 133,844,434
Targeted Case Management Services - Com. Case-Man. 2,259,548,203 1,328,311,389 931,236,814
Case Management - State Wide 504,120,444 286,640,193 217,480,251
Primary Care Case Management 485,867,210 305,844,826 180,022,384
Hospice Benefits 2,221,551,408 1,308,871,529 912,679,879
Emergency Services for Undocumented Aliens 2,203,408,229 1,208,434,688 994,973,541
Federally-Qualified Health Center 3,966,554,586 2,398,978,026 1,567,576,560
Non-Emergency Medical Transportation 1,694,312,612 1,042,991,856 651,320,756
Physical Therapy 168,513,215 103,094,593 65,418,622
Occupational Therapy 118,662,368 70,512,751 48,149,617
Services for Speech, Hearing & Language 220,754,051 131,557,382 89,196,669
Prosthetic Devices, Dentures, Eyeglasses 357,728,758 224,090,496 133,638,262
Diagnostic Screening & Preventive Services 58,955,397 38,305,191 20,650,206
Preventive Services Grade A OR B, ACIP Vaccines 36,854,243 19,417,195 17,437,048
Nurse Mid-Wife 311,965,182 207,336,905 104,628,277
Emergency Hospital Services 2,131,728,082 1,355,944,096 775,783,986
Critical Access Hospitals 711,803,233 453,628,744 258,174,489
Nurse Practitioner Services 191,655,812 126,022,478 65,633,334
School Based Services 2,995,376,667 1,692,438,689 1,302,937,978
Rehabilitative Services −non-school-based) 3,392,515,256 2,151,475,443 1,241,039,813
Private Duty Nursing 806,684,995 474,043,656 332,641,339
Freestanding Birth Center 9,151,777 6,041,618 3,110,159
Health Home w Chronic Conditions 474,669,146 390,172,554 84,496,592
Tobacco Cessation for Preg Women 123,254 81,276 41,978
Other Care Services 17,973,649,287 9,879,652,176 8,093,997,111
Balance 477,953,675,375 288,414,963,874 189,538,711,501
Collections −7,941,770,432 −4,479,712,566 −3,462,057,866
64.21U Adjustments 0 0 0
Total Net Expenditures 470,011,904,943 283,935,251,308 186,076,653,635
Total Newly Eligible 23,817,704,129 23,817,707,598 −3,469
Total Not Newly 6,620,553,339 5,046,327,781 1,574,225,558
Total VIII Group 30,438,257,468 28,864,035,379 1,574,222,089

69
Table 23—CMS-64 Financial Management Report, Net Services, Administration Costs, Fiscal Year 2014
Service Category Total Federal State
Family Planning 33,852,201 30,466,987 3,385,214
MMIS - Inhouse Activities 115,070,284 100,966,123 14,104,161
MMIS - Private Sector 687,298,118 560,262,663 127,035,455
Skilled Professional Medical Personnel - Single State Agency 300,172,195 224,943,687 75,228,508
Skilled Professional Medical Personnel - Other Agency 349,844,160 262,383,132 87,461,028
Approved MMIS: Inhouse 534,492,655 400,860,046 133,632,609
Approved MMIS: Private 1,568,802,329 1,167,477,923 401,324,406
Mechanized Systems - In-House 2,688,870 1,388,893 1,299,977
Mechanized Systems: Private Sector 147,041,713 73,854,163 73,187,550
Mechanized Systems - Not Approved under MMIS Procedures 18,878,402 9,439,204 9,439,198
Peer Review Organizations 242,691,397 182,018,563 60,672,834
TPL − Recovery 1,955,783 977,905 977,878
TPL - Assignment Of Rights 1,529,192 764,609 764,583
Immigration Status 2,757,755 2,757,755 0
Nurse Aide Training Costs 19,880,638 9,940,374 9,940,264
Preadmission Screening 112,427,559 84,320,764 28,106,795
Resident Review 17,150,042 12,862,562 4,287,480
Drug Use Review 9,004,610 5,093,869 3,910,741
Outstationed Eligibility 92,995,052 46,497,552 46,497,500
TANF Base 407,061 366,355 40,706
TANF Secondary 90% 0 0 0
TANF Secondary 75% 55,535 41,652 13,883
External Review 28,266,094 21,199,613 7,066,481
Enrollment Brokers 193,024,218 96,512,138 96,512,080
School Based Administration 1,041,676,503 520,838,293 520,838,210
Program Integrity/Fraud, Waste, and Abuse Activities 42,073,675 21,036,883 21,036,792
County/Local ADM Costs 3,273,938,091 1,636,969,074 1,636,969,017
Interagency Costs −State Level) 3,440,348,767 1,720,174,476 1,720,174,291
Translation and Interpretation 22,519,203 16,889,412 5,629,791
Health Insurance Technology Administration 0 0 0
HIT: Planning: Cost of In-house Activities −1 −1 0
HIT: Planning: Cost of Private Contractors 17,400 15,660 1,740
HIT: Implementation and Operation: Cost of In-house Activities 35,285,589 31,757,037 3,528,552
HIT: Implementation and Operation: Cost of Private Contractors 83,977,431 75,579,699 8,397,732
HIT Incentive Payments: Eligible Professionals 938,357,417 938,357,417 0
HIT Incentive Payments: Eligible Hospitals 1,365,463,430 1,365,463,430 0
Citizenship Verification Technology CHIPRA 0 0 0
CVT Development CHIPRA 0 0 0
CVT Operation CHIPRA 0 0 0
Planning for Health Home for Enrollees with Chronic Conditions 877,003 545,371 331,632
Recovery Audit Contractors Contigency Fee 0 0 0
Recovery Audit Contractors State Administration 6,460,359 3,230,190 3,230,169
Design Development/Installation of Medicaid Elig. Determ. Sys. − Cost of In-house Activities
363,637,203 324,308,299 39,328,904
Design Development/Installation of Medicaid Elig. Determ. Sys. − Cost of Private Sec. Contractors
917,936,962 830,502,555 87,434,407
Operation of an Approved Medicaid Eligibility Determination Systems − Cost of In-house Activities
43,070,562 32,302,933 10,767,629
Operation of an Approved Medicaid Eligibility Determination Sys. − Cost of Private Sec. Contractors
140,467,682 105,350,769 35,116,913
Eligibility Determination Staff − Cost of In-house Activities 526,007,983 394,506,003 131,501,980

70
Service Category Total Federal State
Eligibility Determination Staff − Cost of Private Sector Contractors 127,544,572 95,658,443 31,886,129
Eligibility Determination Staff − Cost of In-house Activities − 50% FFP
137,065,660 68,532,843 68,532,817
Eligibility Determination Staff − Cost of Private Sector Contractors − 50% FFP
−24,956,885 −12,478,438 −12,478,447
Non-Emergency Medical Transportation 197,346,879 98,673,450 98,673,429
Other Financial Participation 7,249,323,347 3,624,661,877 3,624,661,470
Balance 24,408,724,695 15,188,272,207 9,220,452,488
Collections −9,257,868 −6,847,615 −2,410,253
Total Net Expenditures 24,399,466,827 15,181,424,592 9,218,042,235