financial and actuarial data
TRANSCRIPT

FINANCIAL AND ACTUARIAL DATA
DEFINED BENEFIT SYSTEMS
Summary of Defined Benefit Systems ....................................................................... 3 State Systems
Judges’ Retirement System I ...................................................................................... 9 Judges’ Retirement System II ..................................................................................... 12 Legislators’ Retirement System ................................................................................. 14 Public Employees’ Retirement Fund .......................................................................... 17 State Teachers’ Retirement System ............................................................................ 20 University of California Retirement System .............................................................. 23
County Systems Alameda County Employees’ Retirement Association .............................................. 27 Contra Costa County Employees’ Retirement Association ....................................... 30 Fresno County Employees’ Retirement Association .................................................. 33 Imperial County Employees’ Retirement System ...................................................... 36 Kern County Employees’ Retirement Association .................................................... 38 Los Angeles County Employees’ Retirement Association ........................................ 41 Marin County Employees’ Retirement Association ................................................... 44 Mendocino County Employees’ Retirement Association .......................................... 46 Merced County Employees’ Retirement Association ................................................. 49 Orange County Employees’ Retirement System ........................................................ 51 Sacramento County Employees’ Retirement System ................................................. 54 San Bernardino County Employees’ Retirement Association .................................... 57 San Diego County Employees’ Retirement Association ............................................ 60 San Joaquin County Employees’ Retirement Association.......................................... 63 San Luis Obispo County Pension Trust ...................................................................... 65 San Mateo County Employees’ Retirement Association ............................................ 68 Santa Barbara County Employees’ Retirement System.............................................. 71 Sonoma County Employees’ Retirement Association ................................................ 74 Stanislaus County Employees’ Retirement Association ............................................. 76 Tulare County Employees’ Retirement Association................................................... 79 Ventura County Employees’ Retirement Association ................................................ 81
City Systems Alameda Police and Fire Pension Plans 1079 and 1082 ............................................. 85 Albany Police and Fire Relief Pension Fund .............................................................. 87 Bakersfield Firemens’ Disability and Retirement System .......................................... 89 Berkeley Safety Members’ Pension Fund................................................................... 91 Concord Retirement System ....................................................................................... 93 Delano Employee Pension Plan .................................................................................. 95 El Cerrito Employees’ Pension Trust Fund ................................................................ 97

Emeryville Pension Plan ............................................................................................. 99 Eureka Fire and Police Retirement System ................................................................ 101 Fresno Employees’ Retirement System ...................................................................... 103 Fresno Fire and Police Retirement System ................................................................. 105 Irvine Safety Defined Benefit Pension Plan ............................................................... 107 Los Angeles Fire and Police Employees’ Pension System ......................................... 109 Los Angeles Water and Power Employees’ Retirement Plan ..................................... 112 Manhattan Beach Single Highest Year Retirement Plan ............................................ 114 Manhattan Beach Supplemental Retirement Plan ....................................................... 116 Oakland Fire and Police Retirement System .............................................................. 118 Oakland Municipal Employees’ Retirement System .................................................. 120 Pasadena Fire and Police Employees’ Retirement System ......................................... 122 Piedmont Police and Fire Pension Plan ...................................................................... 125 Pittsburg Miscellaneous Employees’ Retirement System of 1962 ............................. 127 Richmond Garfield Pension Plan ................................................................................ 129 Richmond General Pension Plan ................................................................................ 131 Richmond Police and Firemen’s Pension Plan ........................................................... 133 Sacramento City Employees’ Retirement System ...................................................... 135 San Clemente Restated Employees’ Retirement Plan ................................................ 137 San Jose Federated City Employees’ Retirement System .......................................... 139 San Jose Police and Fire Retirement Plan................................................................... 141 Santa Barbara Police and Fire Pension Fund .............................................................. 144 Los Angeles City Employees’ Retirement System ..................................................... 146 San Diego City Employees’ Retirement System ........................................................ 148 San Francisco City and County Employees’ Retirement System ............................... 151
Special District Systems
Alameda-Contra Costa Transit District Pension Fund.................................................. 157 Antelope Valley Hospital Medical Center Retirement Plan ......................................... 160 Contra Costa Water District Retirement Plan ............................................................... 162 Desert Hospital Retirement Protection Plan ................................................................. 164 East Bay Municipal Utility District Retirement System ............................................... 166 Golden Gate Transit District Amalgamated Retirement Plan....................................... 168 Kaweah Delta Hospital District Employees’ Retirement Plan ..................................... 170 Long Beach Public Transportation Company Contract Employees’ Retirement Plan .........................................................................................................
172
Long Beach Public Transportation Company Salaried Employees’ Retirement Plan .........................................................................................................
174
Los Angeles County Transportation Authority AFSCME Employees’ Retirement Income Plan ............................................................................................
176
Los Angeles County Transportation Authority Maintenance Employees’ Retirement System ....................................................................................................
178
Los Angeles County Transportation Authority Non-Contract Employees’ Retirement System ....................................................................................................
181

Los Angeles County Transportation Authority Transportation Communication Union Employees’ Retirement System ..........................................
183
Los Angeles County Transportation Authority United Transportation Union Employees’ Retirement System .....................................................................
186
Modesto Irrigation District Basic Retirement Plan ....................................................... 189 Palm Springs Aerial Tramway Restated Pension Plan ................................................. 191 Sacramento Regional Transit District Contract Employees’ Retirement Plan ............. 193 Sacramento Regional Transit District Salaried Employees’ Retirement Plan .............. 195 San Diego Transit Corporation Employees’ Retirement Plan ...................................... 197 San Joaquin Regional Transit District Contract Employees’ Retirement Plan ............. 199 Santa Clara Valley Transportation Authority Amalgamated Transit Union Pension Plan ..................................................................................................................
201
Sunline Transit Retirement Income Plan – Bargaining Unit Personnel ....................... 203 Sunline Transit Retirement Income Plan – Non-Bargaining Unit Personnel ............... 205 Turlock Irrigation District Pension Plan ....................................................................... 207 West Contra Costa Healthcare District Successor Retirement Plan ............................. 209
School District Systems
Self-Insured Schools of California Defined Benefit Plan ....................................... 213
Other Systems Public Agency Retirement System (PARS) Defined Benefit Plans ........................ 217
DEFINED CONTRIBUTION SYSTEMS
State Systems State Peace Officers and Firefighters’ Defined Contribution Plan .............................. 223 University of California Defined Contribution Plan and 403(B) Plan ........................ 224
City Systems Irvine Defined Contribution Pension Plan ................................................................... 227 Ripon Money Purchase Thrift Pension Plan ................................................................ 228 San Diego Supplemental Pension Savings Plan .......................................................... 229
Special District Systems Arvin Edison Water Storage District Employees’ Pension Plan ................................. 233 Centre City Development Corporation Deferred Annuity Plan ................................... 234 Centre City Development Corporation Money Purchase Pension Plan....................... 235 Corcoran Irrigation District Money Purchase Pension Plan ........................................ 236 Eastern Sierra Community Service District Money Purchase Pension Plan ............... 237 Exeter Irrigation District Employees’ Money Purchase Pension Plan ........................ 238 Fresno Irrigation District Employee Money Purchase Plan ........................................ 239 Fresno Metropolitan Flood Control District Money Purchase Pension Plan ............... 240 Glenn-Colusa Irrigation District Pension Plan ............................................................ 241 Home Gardens Sanitary District Pension Plan ............................................................ 242 Imperial Irrigation District Employee Pension Plan (DCP) ........................................ 243

La Canada Irrigation District Employees’ Pension Plan ............................................. 244 Lakeside Irrigation Water District Money Purchase Pension Plan and Trust ............. 245 Liberty Rural County Fire Protection District Pension Plan and Trust ....................... 246 Lindmore Irrigation District Employee Pension Plan .................................................. 247 Madera Irrigation District 401(k) Pension Plan ........................................................... 248 Modesto Irrigation District Supplemental Retirement Plan ......................................... 249 North Tahoe Public Utility District Money Purchase Pension Plan ............................ 250 Orange County Water District Money Purchase and Cash Balance
Retirement Plans ......................................................................................................
251 San Diego Convention Center Corporation Money Purchase Pension Plan................ 252 San Diego Data Processing Corporation Money Purchase Plan .................................. 253 Saucelito Irrigation District Employees’ Money Purchase Pension Plan ................... 254 Semitropic Water Storage District 401(K) Plan .......................................................... 255 Southeastern Economic Development Corporation 403(b) Tax Sheltered Plan .......... 256 Southgate Recreation and Park District Retirement System........................................ 257 Tranquillity Irrigation District Money Purchase Thrift Plan ....................................... 258 Truckee-Donner Recreation and Park District Money Purchase Pension Plan ........... 259 Tulare Lake Basin Water Storage District Pension Trust Fund ................................... 260 Valley Sanitary District Money Purchase Pension Plan .............................................. 261 West Valley Mosquito Vector Control District Money Purchase Pension Plan .......... 262
School District Systems Grossmont-Cuyamaca Community College District Pension Eligible
Alternative Plan .......................................................................................................
265 Leadership Public Schools 401(a) Retirement Plan..................................................... 266 San Diego Community College District A.P.P.L.E. Program ..................................... 267
Other Systems County of San Diego IHSS Public Authority Pension Plan ........................................ 271 Housing Authority of the County of Tulare Defined Contribution Pension Plan........ 272 Public Agency Retirement System (PARS) Participant Directed Investment Program Trust ..............................................................................................................
273
Public Agency Retirement System (PARS) Defined Contribution Plan ..................... 274 San Diego Housing Commission Money Purchase Pension Plan ............................... 275 San Diego Housing Commission Pension Plan ........................................................... 276
CalPERS SUPPLEMENT
1. Actuarial Position by Member Category .................................................................... 279 2. State Employer Contribution Rates ............................................................................ 279 3. State Employee Contribution Rates ............................................................................ 280 4. Funding Position of Contracting Agencies – Non-Risk Pools ................................... 281
4.1. Funding Position of Contracting Agencies – Risk Pools ............................................ 289 5. Summary of Contracting Agency’s Benefits .............................................................. 304

Financial And Actuarial Data
DEFINED BENEFIT SYSTEMS
Summary

This Page Intentionally Left Blank

Summary of Defined Benefit Systems
Employer Contribution RatesRatio of
Funded Miscellaneous Safety Interest Per Assets Per Retired toRatio IIII II I II Assumption Beneficiary Member TotalSystem Name
IIIIV V VI
Benefits
Public Retirement Systems Annual Report — Fiscal Year 2011-12
State Plans
4.25 98,423 31,653 81%Judges' Retirement System I 1.6 8.0
7.00 95,568 531,424 3%Judges' Retirement System II 92.0 23.4
5.75 31,519 465,693 89%Legislators' Retirement System 115.6
17.0 14.9 31.3 16.4 7.50 28,244 150,102 33%27.414.9 10.9Public Employees' Retirement Fund 82.6 18.2
8.0 4.0 7.50 35,130 121,419 21%State Teachers' Retirement System 69.3 8.3
23.7 7.50 36,975 232,882 28%University of California Retirement System 82.5 23.3
County Plans
Alameda County Employees' Retirement Association
77.5 17.6 16.4 22.7 17.9 16.6 24.7 53.7 41.3 41.1 7.90 37,418 241,277 39%
Contra Costa County Employees' Retirement Association
80.3 24.5 23.7 32.2 32.5 52.4 45.9 7.80 39,616 313,525 43%
Fresno County Employees' Retirement Association
72.9 41.0 38.8 37.4 61.3 60.3 7.75 31,479 249,033 43%
17.9 7.75 26,880 178,999 30%Imperial County Employees' Retirement System
89.8 12.6
Kern County Employees' Retirement Association
60.8 37.0 22.8 34.8 34.3 35.9 36.4 51.3 7.75 31,761 195,033 43%
Los Angeles County Employees' Retirement Association
80.6 21.6 15.0 14.5 14.8 15.3 30.4 24.1 7.70 41,813 263,195 36%
Marin County Employees' Retirement Association
72.1 39.0 20.5 21.1 14.6 17.9 31.3 7.50 36,055 292,049 48%
Mendocino County Employees' Retirement Association
74.1 12.1 16.1 16.1 14.8 16.1 44.5 39.2 7.75 19,869 129,877 46%
Merced County Employees' Retirement Association
56.1 37.6 33.6 47.7 42.3 7.75 27,220 131,315 47%
27.1 20.4 46.4 48.5 7.75 36,422 246,470 34%34.125.7 26.5 19.6Orange County Employees' Retirement System
67.0 19.1
Sacramento County Employees' Retirement System
83.3 20.8 18.3 21.2 16.3 41.9 37.0 35.6 7.50 32,337 283,970 38%
San Bernardino County Employees' Retirement Association
78.9 22.4 14.5 19.3 16.9 46.9 30.9 7.75 33,930 202,487 30%
San Diego County Employees' Retirement Association
78.7 24.1 24.1 24.1 37.2 8.00 32,722 236,672 41%
San Joaquin County Employees' Retirement Association
72.7 27.8 49.9 7.75 28,099 181,131 41%
17.5 25.0 15.1 7.25 24,924 190,312 41%San Luis Obispo County Pension Trust 76.7 17.6
San Mateo County Employees' Retirement Association
72.0 29.4 29.3 26.2 28.2 27.4 74.2 47.2 54.0 8.00 32,563 255,823 40%
Santa Barbara County Employees' Retirement System
71.2 18.9 29.8 34.3 31.5 46.3 7.75 33,361 264,036 39%
Sonoma County Employees' Retirement Association
84.1 11.6 18.9 7.75 28,103 245,432 49%
Stanislaus County Employees' Retirement Association
76.3 3.9 9.6 6.4 9.7 10.7 17.6 8.00 25,667 193,266 39%
Tulare County Employees' Retirement Association
91.6 10.7 9.5 28.8 21.8 7.90 22,415 128,964 29%
Ventura County Employees' Retirement Association
77.7 114.3 10.2 43.9 7.75 33,816 213,063 36%
City Plans
City of Alameda Police and Fire Pension Plans 1079 and 1082
— 6.50 64,738 31 100%
City of Albany Police and Fire Relief Pension Fund
93.8 6.75 56,635 391,863 100%
City of Bakersfield Firemens' Disability and Retirement System
101.1 4.10 19,919 225,791 100%
City of Berkeley Safety Members' Pension Fund
38.1 8.00 60,573 88,514 100%
6.50 23,632 138,262 81%City of Concord Retirement System 66.8
7.75 18,769 63,944 21%City of Delano Employee Pension Plan 65.2 23.6
City of El Cerrito Employees' Pension Trust Fund
— 9.50 46,972 — 100%
4.50 9,913 136,789 100%City of Emeryville Pension Plan 80.2
City of Eureka Fire and Police Retirement System
1.3 6.00 33,652 3,709 100%
8.00 25,772 286,278 44%City of Fresno Employees' Retirement System
116.8 10.7
3

Summary of Defined Benefit Systems
Employer Contribution RatesRatio of
Funded Miscellaneous Safety Interest Per Assets Per Retired toRatio IIII II I II Assumption Beneficiary Member TotalSystem Name
IIIIV V VI
Benefits
Public Retirement Systems Annual Report — Fiscal Year 2011-12
City of Fresno Fire and Police Retirement System
111.4 26.6 19.8 8.00 53,913 610,911 46%
City of Irvine Safety Defined Benefit Pension Plan
93.5 104.1 5.50 35,728 502,276 83%
City of Los Angeles Fire and Police Employees' Pension System
83.7 24.9 26.0 7.75 67,140 578,037 48%
City of Los Angeles Water and Power Employees' Retirement Plan
78.1 41.8 7.75 47,171 437,750 47%
City of Manhattan Beach Single Highest Year Retirement Plan
94.6 5.00 6,851 50,477 100%
City of Manhattan Beach Supplemental Retirement Plan
100.4 5.00 3,867 26,731 100%
City of Oakland Fire and Police Retirement System
37.5 6.74 58,531 270,421 100%
City of Oakland Municipal Employees' Retirement System
86.4 6.50 15,536 160,375 100%
City of Pasadena Fire and Police Employees' Retirement System
78.2 6.00 54,000 531,151 100%
City of Piedmont Police and Fire Pension Plan
289.3 3.95 17,102 564,846 100%
City of Pittsburg Miscellaneous Employees' Retirement System of 1962
105.9 4.25 5,274 14,050 100%
4.50 83,756 252,267 100%City of Richmond - Garfield Pension Plan 39.2
4.50 26,948 43,386 100%City of Richmond General Pension Plan 29.5
City of Richmond Police and Firemen's Pension Plan
62.4 6.00 62,095 255,315 100%
City of Sacramento City Employees' Retirement System
75.6 6.50 26,427 248,876 95%
City of San Clemente Restated Employees' Retirement Plan
68.5 17.1 7.25 7,030 98,118 26%
City of San Jose Federated City Employees' Retirement System
64.6 28.3 7.50 37,525 217,073 47%
City of San Jose Police and Fire Retirement Plan
84.0 51.5 49.8 7.50 78,426 746,591 50%
City of Santa Barbara Police and Fire PensionFund
54.7 7.00 13,295 40,318 100%
Los Angeles City Employees' Retirement System
69.0 18.0 7.75 38,589 229,987 39%
32.4 14.5 53.5 34.7 7.50 41,373 282,963 43%San Diego City Employees' Retirement System
69.1 36.0
San Francisco City and County Employees' Retirement System
87.7 18.1 18.1 18.1 18.1 18.1 18.1 7.66 38,449 284,088 43%
Special District Plans
Alameda-Contra Costa Transit District Pension Fund
61.9 30.8 7.50 23,419 116,183 43%
Antelope Valley Hospital Medical Center Retirement Plan
64.8 5.5 8.00 9,276 29,537 14%
8.00 25,028 174,552 39%Contra Costa Water District Retirement Plan 75.9 13.2
7.50 14,310 9,916 10%Desert Hospital Retirement Protection Plan 44.5
East Bay Municipal Utility District Retirement System
66.0 32.9 8.00 43,868 331,333 41%
Golden Gate Transit District Amalgamated Retirement Plan
68.4 17.2 8.00 26,182 154,799 57%
Kaweah Delta Hospital District Employees' Retirement Plan
76.1 8.00 12,987 59,350 20%
Long Beach Public Transportation Company Contract Employees' Retirement Plan
74.8 7.3 7.50 25,595 53,816 15%
Long Beach Public Transportation Company Salaried Employees' Retirement Plan
59.9 13.9 7.50 79,109 64,871 17%
Los Angeles County Transportation Authority AFSCME Employees Retirement Income Plan
78.1 24.3 7.00 23,191 195,242 49%
Los Angeles County Transportation Authority Maintenance Employees' Retirement System
66.0 14.8 7.50 14,182 97,488 31%
Los Angeles County Transportation Authority Non-Contract Employees' Retirement System
71.5 54.7 7.00 8,588 73,895 65%
4

Summary of Defined Benefit Systems
Employer Contribution RatesRatio of
Funded Miscellaneous Safety Interest Per Assets Per Retired toRatio IIII II I II Assumption Beneficiary Member TotalSystem Name
IIIIV V VI
Benefits
Public Retirement Systems Annual Report — Fiscal Year 2011-12
39%79,18110,2467.0015.764.4Los Angeles County Transportation Authority Transportation Communication Union Employees' Retirement System
35%75,73916,2787.0011.265.9Los Angeles County Transportation Authority United Transportation Union Employees' Retirement System
Modesto Irrigation District Basic Retirement Plan
71.2 43.3 14.6 7.75 30,193 201,477 42%
Palm Springs Aerial Tramway Restated Pension Plan
81.5 13.1 7.50 4,895 33,118 19%
Sacramento Regional Transit District ContractEmployees' Retirement Plan
68.0 22.6 7.75 25,119 118,594 39%
Sacramento Regional Transit District Salaried Employees' Retirement Plan
54.1 23.2 7.75 24,053 107,287 42%
San Diego Transit Corporation Employees' Retirement Plan
63.8 28.1 7.50 16,748 77,059 45%
San Joaquin Regional Transit District Contract Employees' Retirement Plan
61.6 15.2 7.75 20,414 83,353 34%
Santa Clara Valley Transportation Authority Amalgamated Transit Union Pension Plan
72.2 18.4 8.00 23,433 144,372 41%
Sunline Transit Retirement Income Plan - Bargaining Unit Personnel
93.4 15.8 6.00 5,535 38,537 14%
Sunline Transit Retirement Income Plan - Non-Bargaining Unit Personnel
92.0 27.5 6.00 13,940 82,731 18%
34.1 0 8.50 31,453 157,204 39%Turlock Irrigation District Pension Plan 62.7 33.1
West Contra Costa Healthcare District Successor Retirement Plan
50.5 7.50 6,775 22,054 51%
School Plans
Self-Insured Schools of California Defined Benefit Plan
85.1 4.1 7.00 51,161 328 0%
Other Plans
Public Agency Retirement System (PARS) Defined Benefit Plans
56.9 0 6.80 7,094 20,028 34%
5

This Page Intentionally Left Blank

DEFINED BENEFIT SYSTEMS
State Systems

This Page Intentionally Left Blank

Public Retirement Systems Annual Report — Fiscal Year 2011-12Judges' Retirement System I
Agent Multiple-Employer Plan
SurvivorsNon-ServiceServiceRetiredVested MembersNon-VestedVestedMembershipActive Inactive Service Disabled
Total Status
431 — — 1,210 — 46 628General - Tier 1 2,315 Closed
431Totals — — 1,210 — 46 628 2,315
Contributions
AssetsCash and Short-Term InvestmentsReceivables
InvestmentsOther
Investments, at Fair ValueU.S. Government ObligationsInternational BondsMunicipal BondsDomestic Corporate BondsDomestic Stocks
Total Assets
Mortgages
Accounts PayableInvestment Purchases PayableAccrued ExpensesOther Current Liabilities
Total Liabilities
International Stocks
Net Assets Available for Benefits
Statement of Plan Net Assets
LiabilitiesTotal Additions
InterestDividends
Net Appreciation (Depreciation)
Other Investment Revenues in Fair Value of Investments
Statement of Changes in Plan Net Assets
$ 73,276,000
Real EstateVenture CapitalOther
Investments
$ 583,000
$ 72,693,000
$ 70,796,000
$ 205,155,000
Administration ExpensesOther Expenses
Total Deductions
Net Increase (Decrease) In Plan Assets
Beginning of the Year Net Assets Held
$ 186,608,000
$ 18,547,000
as of June 30, 2012 for Period Ending June 30, 2012
$ 72,693,000
——————————
2,155,00024,000
301,000
$ ———
583,000
91,000—
——
Other Revenues 2,877,000
1,163,000—
$ 54,146,000
Fixed Assets Net of Accumulated DepreciationOther Assets
——
in Trust for Pension Benefits
End of the Year Net Assets Heldin Trust for Pension Benefits
Investment Expenses
Adjustments —
Actuarial Cost Method: (1)
Total UAAL Amortization Method: (2)
Total UAAL Amortization Period: 2—Years Remaining in Total UAAL Amortization Period:
AdditionsContributions
Employer -
Employee -
Other -
GeneralSafetyCombined
CombinedSafetyGeneral
CombinedSafetyGeneral
$ 196,402,000——
—
—
5,796,000—
——
DeductionsBenefit Payments
Service Retirement -
Disability -
Other -
Member Refunds -
General
CombinedSafetyGeneralCombinedSafety
CombinedSafetyGeneral
CombinedSafetyGeneral
$ 145,530,000——
5,414,000——
34,484,000——
17,000——Entry Age
—Year in Which the Total Unfunded Actuarial Liability is Expected to be Fully Amortized:
)(11,000
Level Dollar Amount
Funded
Unfunded
Actuarial ValueActuarial
SalaryInterestValuation
Actuary: CalPERS Actuarial OfficeSummary of Funding Position
of AssetsDate Rate Scale Liability Liability RatioAccrued
ActuarialAccruedFiscal
Year$ 3,243,000,000 1.6%4.25% 3.00% 6/30/2011 $ 3,297,000,000 $ 54,000,0002012
3,365,000,000 1.9%4.50% 3.25%6/30/2010 3,429,000,000 64,000,00020113,541,602,000 1.2%4.50% 3.25%6/30/2009 3,582,992,000 41,390,00020103,587,556,000 0.5%4.50% 3.25%6/30/2008 3,606,845,000 19,289,00020092,701,968,000 0.4%7.00% 3.25%6/30/2007 2,713,640,000 11,672,0002008
— — %7.00% 3.25%6/30/2006 — —2007
Summary of Employer Contributions
UAAL as aPercentage of ARCAnnual RequiredRecognizedFiscal Year Contributions (ARC) Made Percentage of ACP
Contribution Annual CoveredPayroll (ACP)
2012 $ 1,366,702,000 $ 196,402,000 14 $ 76,000,000 4,267% %2011 1,262,447,000 167,302,000 13 86,000,000 3,913% %2010 1,167,007,000 185,389,000 16 97,000,000 3,651% %2009 790,900,000 190,510,000 24 111,000,000 3,232% %2008 623,500,000 163,206,000 26 119,274,000 2,265% %2007 200,115,730 131,372,000 66 114,962,265 —% %
9

Public Retirement Systems Annual Report — Fiscal Year 2011-12Judges' Retirement System I — (Continued)
Contribution Rates as a Percentage of Covered PayrollGeneral
I IISafety
I IIIII IV V VIEmployer - Recommended by Actuary: III
Normal CostUAAL AmortizationTotal Rates Recommended by Actuary
Total Rates Adopted by BoardPrior Year Rates
Employee Rates Adopted by Board:Age 25Age 35Age 45Single Rate
8.00
8.00
—
—
—
—
—
—
% % % %
%
%
% % %
%
% % % %
% % % %— — — —
— — — —
%
%—
—
8.00—
— —
— —
— — —
8.00
— — — —
— — — —
— —
— — — —
— —
— — — —
— —
— — — —
— —
— — — —
— —
— — — —
— —
— — — —
%%%%%
6/30/2011 8.00 — — — — — — — — 6/30/2010 8.00 — — — — — — — — 6/30/2009 8.00 — — — — — — — — 6/30/2008 8.00 — — — — — — — — 6/30/2007 8.00 — — — — — — — —
(3)
% % % % % % % % %
Retirement Benefit PoliciesGeneral
I IISafety
I IIIII IV V VI III
6020
Eligibility:AgeYears of ServiceAge
Age
Age
Years of Service
Years of Service
Years of Service
Years of Service Regardless of AgeAge Regardless of Service
7010
Final Average Salary:Position Last HeldHighest Year(s) AverageFinal Year(s) Average
Y——
——
——
——
——
——
——
——
——
Compensation at Time of Retirement
OtherNoneMaximum Annual IncreaseIndex to Consumer Price Index
YIndex to Active Member IncreaseGranted Position Last HeldCost of Living:
Percent Per Year of Service: Age50556065
— — — —
— — — —
— — — —
— — — —
— — — —
— — — —
— — — —
— — — —
— — — —
(4)
NSocial Security Coverage:
Members with 20 years of service get 75% of last position held while those with less than 20 years receive 65%.Benefit Comments:
Non-Service Disability - Per Year - Maximum
Service Disability - Per Year - Maximum
Disability Benefits as a Percentage of Final Average Salary (FAS):
— 75 %
— —
— —
— —
— —
— —
— —
— —
— —
— 75 %
— —
— —
— —
— —
— —
— —
— —
— —
Comments:The Judges' Retirement Fund was established in 1937. The membership consists of justices of the Supreme Court, Courts of Appeal, Superior Courts, Municipal Courts, and Justice Courts appointed or elected prior to November 9, 1994.
The California law that states that on and after January 1, 2004, the Judges' Retirement Fund shall be funded and actuarially sound was amended in conjunction with the adoption of the Judges' Retirement System II law, which, among other provisions, eliminated the requirement that the Judges' Retirement Fund be funded and actuarially sound.
The system is funded on a pay-as-you-go basis, where short-term investments, contributions received during the year, and a State General Fund augmentation are used to provide funding for the benefit payments.
10

Public Retirement Systems Annual Report — Fiscal Year 2011-12Judges' Retirement System I — (Continued)
Footnote:
(1) CalPERs is complying with GASB Statement 50, which requires the funding progress to be disclosed using the Entry Age method. However, for funding purposes and the calculation of ARC contributions, the Aggregate Cost Method is used.
(2) The State currently funds the system using a pay-as-you-go approach, as the 8% of payroll contributions made by the State and members are not adequate to meet the system's current benefit payouts.
(3) The employer contribution rate for the system is set by state statute and equals 8% of payroll.
(4) Members retiring after age 60 with at least 20 years service receive 75% of pay of the last judicial office held. With less than 20 years of service, the benefit percentage is 65%.
11

Public Retirement Systems Annual Report — Fiscal Year 2011-12Judges' Retirement System II
Agent Multiple-Employer Plan
SurvivorsNon-ServiceServiceRetiredVested MembersNon-VestedVestedMembershipActive Inactive Service Disabled
Total Status
1,272 — — 20 — 9 8General - Tier 1 1,309 Open
1,272Totals — — 20 — 9 8 1,309
Contributions
AssetsCash and Short-Term InvestmentsReceivables
InvestmentsOther
Investments, at Fair ValueU.S. Government ObligationsInternational BondsMunicipal BondsDomestic Corporate BondsDomestic Stocks
Total Assets
Mortgages
Accounts PayableInvestment Purchases PayableAccrued ExpensesOther Current Liabilities
Total Liabilities
International Stocks
Net Assets Available for Benefits
Statement of Plan Net Assets
LiabilitiesTotal Additions
InterestDividends
Net Appreciation (Depreciation)
Other Investment Revenues in Fair Value of Investments
Statement of Changes in Plan Net Assets
$ 695,634,000
Real EstateVenture CapitalOther
Investments
$ 40,251,000
$ 655,383,000
$ 6,717,000
$ 86,415,000
Administration ExpensesOther Expenses
Total Deductions
Net Increase (Decrease) In Plan Assets
Beginning of the Year Net Assets Held
$ 6,865,000
$ 79,550,000
as of June 30, 2012 for Period Ending June 30, 2012
$ 655,383,000
57,885,000——
125,773,000229,948,000176,595,000
—52,189,000
—40,714,000
5,704,00072,00037,000
$ —13,000
—40,238,000
27,000—
13,449,000677,000
Other Revenues —
725,000—
$ 575,833,000
Fixed Assets Net of Accumulated DepreciationOther Assets
——
in Trust for Pension Benefits
End of the Year Net Assets Heldin Trust for Pension Benefits
Investment Expenses
Adjustments —
Actuarial Cost Method: (1)
Total UAAL Amortization Method: (2)
Total UAAL Amortization Period: 3020Years Remaining in Total UAAL Amortization Period:
AdditionsContributions
Employer -
Employee -
Other -
GeneralSafetyCombined
CombinedSafetyGeneral
CombinedSafetyGeneral
$ 53,711,000——
—
—
18,757,000—
——
DeductionsBenefit Payments
Service Retirement -
Disability -
Other -
Member Refunds -
General
CombinedSafetyGeneralCombinedSafety
CombinedSafetyGeneral
CombinedSafetyGeneral
$ 1,211,000——
1,156,000——
1,169,000——
2,604,000——Entry Age
—Year in Which the Total Unfunded Actuarial Liability is Expected to be Fully Amortized:
)(206,000
Level Percentage of Projected Covered Payroll
Funded
Unfunded
Actuarial ValueActuarial
SalaryInterestValuationActuary: CalPERS Actuarial Office
Summary of Funding Position
of AssetsDate Rate Scale Liability Liability RatioAccrued
ActuarialAccruedFiscal
Year$ 49,000,000 92.0%7.00% 3.00% 6/30/2011 $ 610,000,000 $ 561,000,0002012
60,000,000 88.5%7.25% 3.25%6/30/2010 521,000,000 461,000,000201172,000,000 84.0%7.25% 3.25%6/30/2009 451,000,000 379,000,000201032,000,000 91.3%7.25% 3.25%6/30/2008 367,000,000 335,000,000200927,378,000 90.7%7.25% 3.25%6/30/2007 294,982,000 267,604,0002008
7,231,000 96.7%7.25% 3.25%6/30/2006 220,135,000 212,904,0002007
Summary of Employer Contributions
UAAL as aPercentage of ARCAnnual RequiredRecognizedFiscal Year Contributions (ARC) Made Percentage of ACP
Contribution Annual CoveredPayroll (ACP)
2012 $ 53,144,000 $ 53,711,000 101 $ 230,000,000 21% %2011 50,949,000 53,863,000 106 213,000,000 28% %2010 44,759,000 42,589,000 95 199,000,000 36% %2009 42,900,000 39,514,000 92 175,000,000 18% %2008 31,700,000 36,761,000 116 156,300,000 18% %2007 28,506,000 27,062,000 95 125,318,592 6% %
12

Public Retirement Systems Annual Report — Fiscal Year 2011-12Judges' Retirement System II — (Continued)
Contribution Rates as a Percentage of Covered PayrollGeneral
I IISafety
I IIIII IV V VIEmployer - Recommended by Actuary: III
Normal CostUAAL AmortizationTotal Rates Recommended by Actuary
Total Rates Adopted by BoardPrior Year Rates
Employee Rates Adopted by Board:Age 25Age 35Age 45Single Rate
23.44
23.44
—
—
—
—
—
—
% % % %
%
%
% % %
%
% % % %
% % % %— — — —
— — — —
%
%—
—
21.681.76
— —
— —
— — —
8.00
— — — —
— — — —
— —
— — — —
— —
— — — —
— —
— — — —
— —
— — — —
— —
— — — —
— —
— — — —
%%%%%
6/30/2011 24.04 — — — — — — — — 6/30/2010 20.36 — — — — — — — — 6/30/2009 20.23 — — — — — — — — 6/30/2008 19.92 — — — — — — — — 6/30/2007 19.92 — — — — — — — —
% % % % % % % % %
Retirement Benefit PoliciesGeneral
I IISafety
I IIIII IV V VI III
6520
Eligibility:AgeYears of ServiceAge
Age
Age
Years of Service
Years of Service
Years of Service
Years of Service Regardless of AgeAge Regardless of Service
705
5
Final Average Salary:Position Last HeldHighest Year(s) AverageFinal Year(s) Average
1—
——
——
——
——
——
——
——
——
Compensation at Time of Retirement
OtherNone
3%Maximum Annual IncreaseYIndex to Consumer Price Index
Index to Active Member IncreaseGranted Position Last HeldCost of Living:
Percent Per Year of Service: Age50556065
— — —
3.75
— — — —
— — — —
— — — —
— — — —
— — — —
— — — —
— — — —
— — — —
NSocial Security Coverage:
The "defined benefit" option provides for 3.75% of the highest 12-month average salary per year of service for judges reaching age 65 with 20 years of service to a maximum of 75% of final average salary.
Benefit Comments:
Non-Service Disability - Per Year - Maximum
Service Disability - Per Year - Maximum
Disability Benefits as a Percentage of Final Average Salary (FAS):
4 %65 %
— —
— —
— —
— —
— —
— —
— —
— —
— 65 %
— —
— —
— —
— —
— —
— —
— —
— —
Comments:The Judges' Retirement Fund II was established in 1994. The membership consists of justices of the Supreme Court, Courts of Appeal, Superior Courts, Municipal Courts, and Justice Courts appointed or elected on or subsequent to November 9, 1994.
Footnote:
(1) The Judges' Retirement System II uses a modification of the Entry Age Normal Actuarial Cost Method, which is a projected benefit cost method and is modified by CalPERS so that the employer's total normal cost is expressed as a level percentage of payroll.
(2) Generally, the unfunded liability is amortized over different periods of time as a level percentage of payroll. If the use of this method results in inconsistencies, the "fresh start" approach is used. In the fresh start approach, the current unfunded actuarial liability is projected and amortized over a set number of years.
13

Public Retirement Systems Annual Report — Fiscal Year 2011-12Legislators' Retirement System
Single-Employer Plan
SurvivorsNon-ServiceServiceRetiredVested MembersNon-VestedVestedMembershipActive Inactive Service Disabled
Total Status
14 — 17 118 2 — 123General - Tier 1 274 Closed
14Totals — 17 118 2 — 123 274
Contributions
AssetsCash and Short-Term InvestmentsReceivables
InvestmentsOther
Investments, at Fair ValueU.S. Government ObligationsInternational BondsMunicipal BondsDomestic Corporate BondsDomestic Stocks
Total Assets
Mortgages
Accounts PayableInvestment Purchases PayableAccrued ExpensesOther Current Liabilities
Total Liabilities
International Stocks
Net Assets Available for Benefits
Statement of Plan Net Assets
LiabilitiesTotal Additions
InterestDividends
Net Appreciation (Depreciation)
Other Investment Revenues in Fair Value of Investments
Statement of Changes in Plan Net Assets
$ 127,600,000
Real EstateVenture CapitalOther
Investments
$ 4,571,000
$ 123,029,000
$ 691,000
$ 7,761,000
Administration ExpensesOther Expenses
Total Deductions
Net Increase (Decrease) In Plan Assets
Beginning of the Year Net Assets Held
$ 8,208,000
$ )(447,000
as of June 30, 2012 for Period Ending June 30, 2012
$ 123,029,000
21,984,000——
50,715,00022,432,00017,228,000
—10,022,000
—4,319,000
184,0007,000
18,000
$ 164,0001,000
—4,406,000
——
7,710,00086,000
Other Revenues —
347,000—
$ 123,476,000
Fixed Assets Net of Accumulated DepreciationOther Assets
——
in Trust for Pension Benefits
End of the Year Net Assets Heldin Trust for Pension Benefits
Investment Expenses
Adjustments —
Actuarial Cost Method: (1)
Total UAAL Amortization Method: (2)
Total UAAL Amortization Period: —31Years Remaining in Total UAAL Amortization Period:
AdditionsContributions
Employer -
Employee -
Other -
GeneralSafetyCombined
CombinedSafetyGeneral
CombinedSafetyGeneral
$ ———
—
—
——
——
DeductionsBenefit Payments
Service Retirement -
Disability -
Other -
Member Refunds -
General
CombinedSafetyGeneralCombinedSafety
CombinedSafetyGeneral
CombinedSafetyGeneral
$ 7,373,000——
156,000——
130,000——
202,000——Entry Age
—Year in Which the Total Unfunded Actuarial Liability is Expected to be Fully Amortized:
)(35,000
Level Percentage of Projected Covered Payroll
Funded
Unfunded
Actuarial ValueActuarial
SalaryInterestValuationActuary: CalPERS Actuarial Office
Summary of Funding Position
of AssetsDate Rate Scale Liability Liability RatioAccrued
ActuarialAccruedFiscal
Year$ )(17,000,000 115.6%5.75% 3.00% 6/30/2011 $ 109,000,000 $ 126,000,0002012
)(15,000,000 113.4%6.00% 3.25%6/30/2010 112,000,000 127,000,0002011)(22,000,000 119.6%7.00% 3.25%6/30/2009 112,000,000 134,000,0002010)(39,000,000 137.9%7.00% 3.25%6/30/2008 103,000,000 142,000,0002009)(40,032,000 139.4%7.00% 3.25%6/30/2007 101,571,000 141,603,0002008
— — %7.00% 3.25%6/30/2006 — —2007
Summary of Employer Contributions
UAAL as aPercentage of ARCAnnual RequiredRecognizedFiscal Year Contributions (ARC) Made Percentage of ACP
Contribution Annual CoveredPayroll (ACP)
2012 $ — $ — — $ 2,000,000 -850 %2011 — 2,000,000 -750% %2010 — 2,000,000 -1,100% %2009 — 2,000,000 -1,950% %2008 — — 2,106,000 -1,901% %2007 — — 1,802,963 —% %
14
Public Retirement Systems Annual Report — Fiscal Year 2011-12Legislators' Retirement System — (Continued)
Contribution Rates as a Percentage of Covered PayrollGeneral
I IISafety
I IIIII IV V VIEmployer - Recommended by Actuary: III
Normal CostUAAL AmortizationTotal Rates Recommended by Actuary
Total Rates Adopted by BoardPrior Year Rates
Employee Rates Adopted by Board:Age 25Age 35Age 45Single Rate
—
—
—
—
—
—
—
—
% % % %
% % % %
% % % %
% % % %— — — —
— — — —
%
%—
—
— —
— —
— —
— — — —
— — — —
— — — —
— —
— — — —
— —
— — — —
— —
— — — —
— —
— — — —
— —
— — — —
— —
— — — —
6/30/2011 — — — — — — — — — 6/30/2010 — — — — — — — — — 6/30/2009 — — — — — — — — — 6/30/2008 — — — — — — — — — 6/30/2007 — — — — — — — — —
(3)
% % % % % % % % %
Retirement Benefit PoliciesGeneral
I IISafety
I IIIII IV V VI III
604
Eligibility:AgeYears of ServiceAge
Age
Age
Years of Service
Years of Service
Years of Service
Years of Service Regardless of AgeAge Regardless of Service
20
Final Average Salary:Position Last HeldHighest Year(s) AverageFinal Year(s) Average
——Y
——
——
——
——
——
——
——
——
Compensation at Time of Retirement
OtherNoneMaximum Annual Increase
YIndex to Consumer Price IndexIndex to Active Member IncreaseGranted Position Last HeldCost of Living:
Percent Per Year of Service: Age50556065
— —
3.00—
— — — —
— — — —
— — — —
— — — —
— — — —
— — — —
— — — —
— — — —
NSocial Security Coverage:
All members are eligible for a disability retirement allowance without any age or service requirements. The disability allowance is the same as the normal retirement benefit.
Benefit Comments:
Non-Service Disability - Per Year - Maximum
Service Disability - Per Year - Maximum
Disability Benefits as a Percentage of Final Average Salary (FAS):
— —
— —
— —
— —
— —
— —
— —
— —
— —
— —
— —
— —
— —
— —
— —
— —
— —
— —
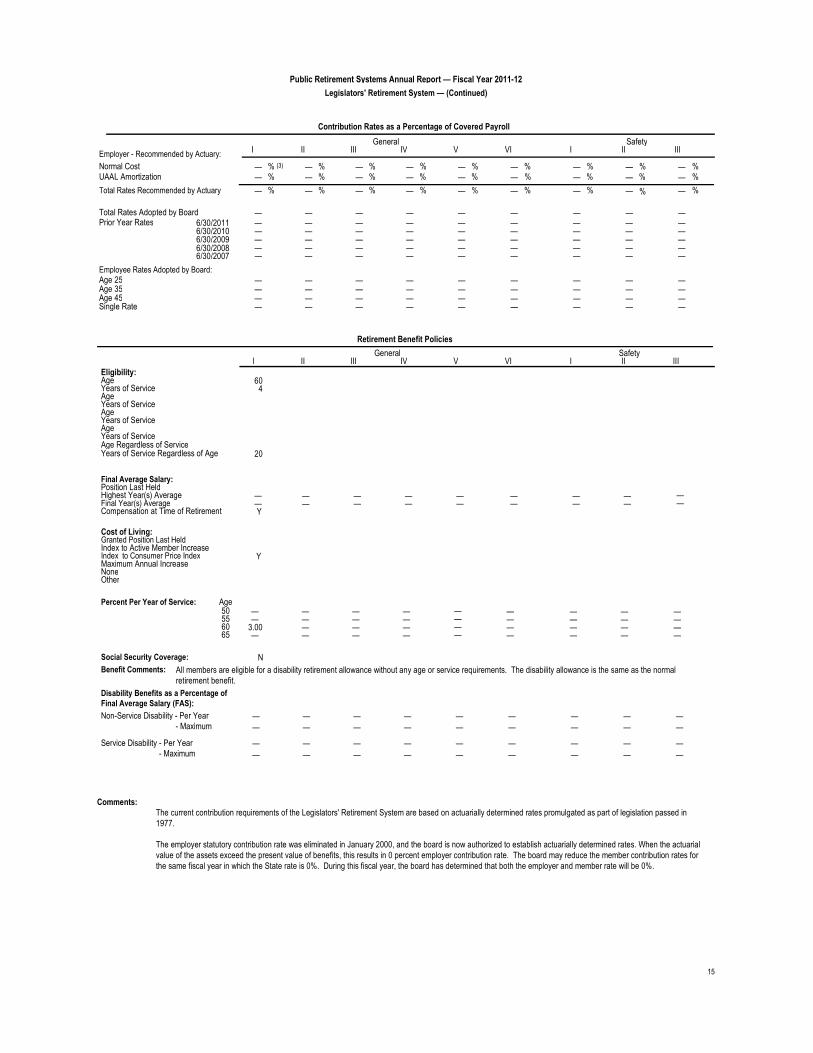
Comments:The current contribution requirements of the Legislators' Retirement System are based on actuarially determined rates promulgated as part of legislation passed in 1977.
The employer statutory contribution rate was eliminated in January 2000, and the board is now authorized to establish actuarially determined rates. When the actuarial value of the assets exceed the present value of benefits, this results in 0 percent employer contribution rate. The board may reduce the member contribution rates for the same fiscal year in which the State rate is 0%. During this fiscal year, the board has determined that both the employer and member rate will be 0%.
15

Public Retirement Systems Annual Report — Fiscal Year 2011-12Legislators' Retirement System — (Continued)
Footnote:
(1) CalPERs is complying with GASB Statement 50, which requires the funding progress to be disclosed using the Entry Age method. However, for funding purposes and the calculation of ARC contributions, the Aggregate Cost Method is used.
(2) In the prior years, CalPERS used the aggregate method, which does not identify or separately amortized unfunded actuarial liabilities. However, per GASB statement 50 compliance, with the funding progress disclosed using the Entry Age method, the amortization period is now based on Level Percent of Payroll with 31 years remaining in the Amortization period.
(3) The annual required contributions for fiscal years 1999-00 through 2010-11 were $0 based on the June 30, 1998 through June 30, 2009 actuarial valuations.
16

Public Retirement Systems Annual Report — Fiscal Year 2011-12Public Employees' Retirement Fund
Agent Multiple-Employer Plan
SurvivorsNon-ServiceServiceRetiredVested MembersNon-VestedVestedMembershipActive Inactive Service Disabled
Total Status
146,763 7,498 53,943 98,538 8,821 10,842 20,600General - Tier 1 347,005 Open
7,275 — 290 5,254 470 578 1,029Safety - Tier 1 14,896 Open
7,145 — 22,854 2,265 203 249 5422 33,258 Open
23,777 — 5,158 27,868 2,482 3,050 3,489 65,824 Open
10,273 — 1,775 4,057 363 446 6093 17,523 Open
40,737 — 6,425 3,339 297 366 279 51,443 Open
703 — 983 141 13 15 194 1,874 Open
302,422 — 125,695 130,436 11,677 14,351 20,7375 605,318 Open
239,993 — 98,731 126,387 11,314 13,906 18,6906 509,021 Open
779,088Totals 7,498 315,854 398,285 35,640 43,803 65,994 1,646,162
Contributions
AssetsCash and Short-Term InvestmentsReceivables
InvestmentsOther
Investments, at Fair ValueU.S. Government ObligationsInternational BondsMunicipal BondsDomestic Corporate BondsDomestic Stocks
Total Assets
Mortgages
Accounts PayableInvestment Purchases PayableAccrued ExpensesOther Current Liabilities
Total Liabilities
International Stocks
Net Assets Available for Benefits
Statement of Plan Net Assets
LiabilitiesTotal Additions
InterestDividends
Net Appreciation (Depreciation)
Other Investment Revenues in Fair Value of Investments
Statement of Changes in Plan Net Assets
$ 247,092,785,000
Real EstateVenture CapitalOther
Investments
$ 10,110,840,000
$ 236,981,945,000
$ 5,326,467,000
$ 11,175,336,000
Administration ExpensesOther Expenses
Total Deductions
Net Increase (Decrease) In Plan Assets
Beginning of the Year Net Assets Held
$ 15,955,182,000
$ )(4,779,846,000
as of June 30, 2012 for Period Ending June 30, 2012
$ 236,981,945,000
12,378,209,0003,432,471,000
—40,991,548,00058,904,388,00054,710,080,000
217,115,00024,675,857,00034,176,146,000
9,325,426,000
1,789,776,000415,102,000
34,289,000
$ 281,571,000432,834,000
—9,396,435,000
369,977,0001,006,676,000
)(1,596,030,0002,805,465,000
Other Revenues 7,070,000
380,404,000—
$ 241,761,791,000
Fixed Assets Net of Accumulated DepreciationOther Assets
715,911,000—
in Trust for Pension Benefits
End of the Year Net Assets Heldin Trust for Pension Benefits
Investment Expenses
Adjustments —
Actuarial Cost Method:
Total UAAL Amortization Method: (1)
Total UAAL Amortization Period: ——Years Remaining in Total UAAL Amortization Period:
AdditionsContributions
Employer -
Employee -
Other -
GeneralSafetyCombined
CombinedSafetyGeneral
CombinedSafetyGeneral
$ ——
7,772,913,000
3,598,437,000
—
——
——
DeductionsBenefit Payments
Service Retirement -
Disability -
Other -
Member Refunds -
General
CombinedSafetyGeneralCombinedSafety
CombinedSafetyGeneral
CombinedSafetyGeneral
$ ——
13,100,533,000——
1,992,341,000——
263,822,000——
218,082,000Entry Age
—Year in Which the Total Unfunded Actuarial Liability is Expected to be Fully Amortized:
)(2,789,172,000
Level Percentage of Projected Covered Payroll
Funded
Unfunded
Actuarial ValueActuarial
SalaryInterestValuationActuary: CalPERS Actuarial & Employer Services Branch
Summary of Funding Position
of AssetsDate Rate Scale Liability Liability RatioAccrued
ActuarialAccruedFiscal
Year$ 57,178,000,000 82.6%7.50% 3.00% (2) 6/30/2011 $ 328,567,000,000 $ 271,389,000,0002012
51,273,000,000 83.4%7.75% 3.25%6/30/2010 308,343,000,000 257,070,000,000201149,078,000,000 83.3%7.75% 3.25%6/30/2009 294,042,000,000 244,964,000,000201035,052,000,000 86.9%7.75% 3.25%6/30/2008 268,324,000,000 233,272,000,000200931,740,000,000 87.2%7.75% 3.00%6/30/2007 248,224,000,000 216,484,000,000200829,098,000,000 87.2%7.75% 3.00%6/30/2006 228,131,000,000 199,033,000,0002007
17

Public Retirement Systems Annual Report — Fiscal Year 2011-12Public Employees' Retirement Fund — (Continued)
Summary of Employer Contributions
UAAL as aPercentage of ARCAnnual RequiredRecognizedFiscal Year Contributions (ARC) Made Percentage of ACP
Contribution Annual CoveredPayroll (ACP)
2012 $ 7,772,913,000 $ 7,772,913,000 100 $ 43,901,000,000 130% %2011 7,465,397,000 7,465,397,000 100 44,984,000,000 114% %2010 6,955,049,000 6,955,049,000 100 45,100,000,000 109% %2009 6,912,377,000 6,912,376,000 100 44,236,000,000 79% %2008 7,242,802,000 7,242,802,000 100 40,864,000,000 78% %2007 6,442,384,000 6,442,384,000 100 38,047,000,000 76% %
Contribution Rates as a Percentage of Covered PayrollGeneral
I IISafety
I IIIII IV V VIEmployer - Recommended by Actuary: III
Normal CostUAAL AmortizationTotal Rates Recommended by Actuary
Total Rates Adopted by BoardPrior Year Rates
Employee Rates Adopted by Board:Age 25Age 35Age 45Single Rate
18.17
18.17
17.02
17.02
31.26
31.26
16.43
16.43
% % % %
%
%
%
%
%
%
%
%
% % % %
%
%
%
%
% %
%
14.93 14.93 10.92 —
14.93 14.93 10.92 —
%
%
%
27.41
27.41
7.8410.33
6.6910.33
10.704.23
— — — —
— — — —
— — — —
10.704.23
— — — —
7.133.79
— — — —
— —
— — — —
13.5317.73
— — — —
12.463.97
— — — —
16.2011.21
— — — —
%%%%%
%%%%%
%%%%%
%%%%%
%%%%%
%%%%%
%%%%%
%%%%%
6/30/2011 19.92 19.62 18.18 18.18 10.70 — 32.63 20.67 28.896/30/2010 16.92 16.74 17.25 17.25 9.71 — 28.44 18.10 25.856/30/2009 16.58 16.47 17.24 17.24 9.42 — 32.15 18.41 26.076/30/2008 16.63 16.57 17.32 17.32 9.31 — 32.12 18.84 25.556/30/2007 17.00 16.78 17.87 17.87 9.12 — 31.46 19.29 24.51
% % % % % % % % %
Retirement Benefit PoliciesGeneral
I IISafety
I IIIII IV V VI III
505
Eligibility:AgeYears of ServiceAge
Age
Age
Years of Service
Years of Service
Years of Service
Years of Service Regardless of AgeAge Regardless of Service
5510
505
5510
505
505
505
505
Final Average Salary:Position Last HeldHighest Year(s) AverageFinal Year(s) Average
1—
1—
1—
1—
1—
——
1—
1—
1—
(3)
Compensation at Time of Retirement
OtherNone
2%3%2% 2%2%2%2%Maximum Annual IncreaseIndex to Consumer Price Index
3%
Index to Active Member IncreaseGranted Position Last HeldCost of Living:
Percent Per Year of Service: Age50556065
1.102.002.312.50
0.500.751.001.25
1.102.002.312.50
0.500.751.001.25
1.102.002.312.50
— — — —
2.403.003.003.00
1.702.502.502.50
1.702.502.502.50
(4)
I IS NI NSocial Security Coverage: NI
Disability - A monthly allowance of 1.8% of FAS for each year of service up to 33% of FAS. Service Disability - A monthly allowance of 50% of FAS for most members.
Benefit Comments:
Non-Service Disability - Per Year - Maximum
Service Disability - Per Year - Maximum
Disability Benefits as a Percentage of Final Average Salary (FAS):
2 %33 %
1 %33 %
2 %33 %
1 %33 %
2 %33 %
— —
2 %33 %
2 %33 %
2 %33 %
— —
— —
— 50 %
— 50 %
— —
— —
— 50 %
— 50 %
— 50 %
18

Public Retirement Systems Annual Report — Fiscal Year 2011-12Public Employees' Retirement Fund — (Continued)
Comments:The Public Employees' Retirement Fund (PERF) was established in 1932. Its membership includes the following categories: General, State Industrial, Schools, and Safety.
(1) General members are collectively reported under the following categories: General Tier I - State Miscellaneous Tier 1 and University of California; General Tier II - State Miscellaneous Tier 2; General Tier III - State Industrial Tier 1; General Tier IV - State Industrial Tier 2; General Tier V - Schools; and General Tier VI - Public Agency Employees.
(2) Safety members are reported as follows: Safety Tier I - California Highway Patrol; Safety Tier II - State Safety; and Safety Tier III - State Police Officers and Fire Fighters (SPOFF).
Footnote:
(1) Generally, the unfunded liability is amortized over different periods of time as a level percentage of payroll. If the use of this method results in inconsistencies, the "fresh start" approach is used. In the fresh start approach, the current unfunded actuarial liability is projected and amortized over a set number of years.
(2) The Unfunded Actuarial Accrued Liability (UAAL) of the Public Employees' Retirement Fund by major employer group from the June 30, 2011 valuation is as follows: a) $27,229,000,000 for the State of California, b) $6,766,000,000 for Schools, and c) $23,183,000,000 for public agencies.
(3) For some new members hired after July 1, 2006, and all new members hired on or after January 15, 2011, financial compensation is based on the monthly average of the member's highest 36 consecutive months' full-time equivalent monthly pay.
(4) All new members hired on or after January 15, 2011, are subject to the 2% at 60 benefit factor table, depending on the age of retirement.
19

Public Retirement Systems Annual Report — Fiscal Year 2011-12State Teachers' Retirement System
Cost-Sharing Multiple-Employer Plan
SurvivorsNon-ServiceServiceRetiredVested MembersNon-VestedVestedMembershipActive Inactive Service Disabled
Total Status
323,586 97,913 178,655 230,278 — 9,036 22,724General - Tier 1 862,192 Open
403,117 — 127,763 40,493 — 747 —2 572,120 Open
9,273 — 21,064 650 — — —3 30,987 Open
735,976Totals 97,913 327,482 271,421 — 9,783 22,724 1,465,299 (1)
Contributions
AssetsCash and Short-Term InvestmentsReceivables
InvestmentsOther
Investments, at Fair ValueU.S. Government ObligationsInternational BondsMunicipal BondsDomestic Corporate BondsDomestic Stocks
Total Assets
Mortgages
Accounts PayableInvestment Purchases PayableAccrued ExpensesOther Current Liabilities
Total Liabilities
International Stocks
Net Assets Available for Benefits
Statement of Plan Net Assets
LiabilitiesTotal Additions
InterestDividends
Net Appreciation (Depreciation)
Other Investment Revenues in Fair Value of Investments
Statement of Changes in Plan Net Assets
$ 177,915,702,655
Real EstateVenture CapitalOther
Investments
$ 26,597,646,143
$ 151,318,056,512
$ 3,005,741,576
$ 6,895,898,859
Administration ExpensesOther Expenses
Total Deductions
Net Increase (Decrease) In Plan Assets
Beginning of the Year Net Assets Held
$ 10,923,656,891
$ )(4,027,758,032
as of June 30, 2012 for Period Ending June 30, 2012
$ 151,318,056,512
18,515,362,3422,989,939,944
192,604,9537,169,269,920
52,567,499,71920,876,937,749
1,540,971,94122,691,549,65722,513,367,15223,911,465,874
520,241,8341,063,677,689
112,565,484
$ 238,044,3932,573,854,622
51,137,72123,734,609,407
1,285,518,1341,959,389,034
)(2,588,803,914937,577,893
Other Revenues 4,114,889
138,411,095—
$ 155,345,814,544
Fixed Assets Net of Accumulated DepreciationOther Assets
244,506,821—
in Trust for Pension Benefits
End of the Year Net Assets Heldin Trust for Pension Benefits
Investment Expenses
Adjustments —
Actuarial Cost Method: (2)
Total UAAL Amortization Method:
Total UAAL Amortization Period: 3030Years Remaining in Total UAAL Amortization Period:
AdditionsContributions
Employer -
Employee -
Other -
GeneralSafetyCombined
CombinedSafetyGeneral
CombinedSafetyGeneral
$ 2,237,983,394——
—
—
2,279,900,161—
1,302,580,425—
DeductionsBenefit Payments
Service Retirement -
Disability -
Other -
Member Refunds -
General
CombinedSafetyGeneralCombinedSafety
CombinedSafetyGeneral
CombinedSafetyGeneral
$ 10,383,188,704——
204,866,832——
89,079,490——
108,110,770——Entry Age
—Year in Which the Total Unfunded Actuarial Liability is Expected to be Fully Amortized:
)(522,361,157
Level Percentage of Projected Covered Payroll
Funded
Unfunded
Actuarial ValueActuarial
SalaryInterestValuationActuary: Milliman
Summary of Funding Position
of AssetsDate Rate Scale Liability Liability RatioAccrued
ActuarialAccruedFiscal
Year$ 63,840,000,000 69.3%7.50% 3.75% 6/30/2011 $ 207,770,000,000 $ 143,930,000,0002012
56,024,000,000 71.5%7.75% 4.00%6/30/2010 196,315,000,000 140,291,000,000201140,541,000,000 78.2%8.00% 4.25%6/30/2009 185,683,000,000 145,142,000,000201022,509,000,000 87.7%8.00% 4.25%6/30/2008 183,459,000,000 160,950,000,000200917,929,000,000 89.6%8.00% 4.25%6/30/2007 171,831,000,000 153,902,000,000200819,294,000,000 87.5%8.00% 4.25%6/30/2006 154,551,000,000 135,257,000,0002007
Summary of Employer Contributions
UAAL as aPercentage of ARCAnnual RequiredRecognizedFiscal Year Contributions (ARC) Made Percentage of ACP
Contribution Annual CoveredPayroll (ACP)
2012 $ 6,278,000,000 $ 3,540,563,819 56 $ 54,416,000,000 117% %2011 6,114,000,000 3,503,614,708 57 26,438,000,000 212% %2010 5,153,910,000 3,507,894,069 68 27,509,030,000 147% %2009 4,737,440,000 3,712,112,605 78 27,299,104,000 82% %2008 4,446,800,000 4,082,903,344 92 27,220,973,044 66% %2007 4,682,610,000 3,370,115,089 72 26,196,997,274 74% %
20

Public Retirement Systems Annual Report — Fiscal Year 2011-12State Teachers' Retirement System — (Continued)
Contribution Rates as a Percentage of Covered PayrollGeneral
I IISafety
I IIIII IV V VIEmployer - Recommended by Actuary: III
Normal CostUAAL AmortizationTotal Rates Recommended by Actuary
Total Rates Adopted by BoardPrior Year Rates
Employee Rates Adopted by Board:Age 25Age 35Age 45Single Rate
8.25
8.25
8.00
8.00
—
—
—
—
% % % %
%
%
%
%
% %
% %
% % % %
%
%
%
% % %4.00 — — —
4.00 — — —
%
%—
—
8.25—
8.00—
4.00—
— — —
8.00
— — —
8.00
— — —
4.00
— —
— — — —
— —
— — — —
— —
— — — —
— —
— — — —
— —
— — — —
— —
— — — —
%%%%%
%%%%%
%%%%%
6/30/2011 8.25 8.00 4.00 — — — — — — 6/30/2010 8.25 8.00 4.00 — — — — — — 6/30/2009 8.25 8.00 4.00 — — — — — — 6/30/2008 8.25 8.00 4.00 — — — — — — 6/30/2007 8.25 8.00 4.00 — — — — — —
(3)
% % % % % % % % %
Retirement Benefit PoliciesGeneral
I IISafety
I IIIII IV V VI III
605
Eligibility:AgeYears of ServiceAge
Age
Age
Years of Service
Years of Service
Years of Service
Years of Service Regardless of AgeAge Regardless of Service
555
5030
55 55
Final Average Salary:Position Last HeldHighest Year(s) AverageFinal Year(s) Average
3—
——
——
——
——
——
——
——
——
Compensation at Time of Retirement
OtherNone
2%Maximum Annual IncreaseIndex to Consumer Price IndexIndex to Active Member IncreaseGranted Position Last HeldCost of Living:
Percent Per Year of Service: Age50556065
1.101.402.002.40
— — — —
— — — —
— — — —
— — — —
— — — —
— — — —
— — — —
— — — —
NSocial Security Coverage:
Defined Benefit (DB): One year FAS with 25 years of service; DB Supplement: Service retirement benefit equals balance of credits in member's account; Cash Balance Benefit: Service retirement benefit equals balance of credit in participant's account.
Benefit Comments:
Non-Service Disability - Per Year - Maximum
Service Disability - Per Year - Maximum
Disability Benefits as a Percentage of Final Average Salary (FAS):
— 50 %
— —
— —
— —
— —
— —
— —
— —
— —
— 50 %
— —
— —
— —
— —
— —
— —
— —
— —
21

Public Retirement Systems Annual Report — Fiscal Year 2011-12State Teachers' Retirement System — (Continued)
Comments:All of the figures in this plan include data from both the Defined Benefit Plan and the Cash Balance Plan. Program information is presented as follows: General Tier I - Defined Benefit Program, General Tier II - Defined Benefit Supplement, and General Tier III - Cash Balance Program.
Actual member and employer rates are set by the State Teachers' Retirement Law, which assigns the authority to establish and amend contribution requirements to the State Legislature.
Defined Benefit Program (DB Program)State of California - Beginning July 1, 1999, under Education Code Section 22955, the General Fund transferred annually to the DB Program an amount equal to 3.102% of total creditable earnings of the immediately preceding calendar year to fund certain benefit enhancements effective January 1, 1999. The enactment of Chapter 1021, Statutes of 2000 (AB 2700), provided for a reduction in such funding from the General Fund to a factor of 2.5385% beginning July 1, 2000. Beginning July 1 2003, the rate was changed to 2.017% of the member's creditable earnings from the fiscal year ending in the prior calendar year.
Beginning October 1, 1998, a statutory contribution rate of 0.524%, adjustable annually in 0.25% increments up to a maximum of 1.505%, of the creditable earnings of the immediately preceding calendar year was established under Education Code Section 22955. This contribution is reduced to zero if there is no unfunded actuarial obligation and no normal cost deficit for benefit plans in place as of July 1, 1990. Based on the most recent actuarial valuation, as of June 30, 2010, there is no normal cost deficit but there was an unfunded obligation for benefits in place as of July 1, 1990. As a result, the General Fund is required to contribute additional quarterly payments starting October 1, 2011, at an additioanl cointriubtion rate of 0.524%.
Cash Balance Benefit Program (CBB Program)The CBB Program, established under Part 14 of the California Education Code (Section 26000 et seq.) and subsequently amended by Assembly Bill (AB) 2673, is a separate defined benefit plan that operates under the IRC within the California State Teachers Retirement Plan (STRP) designed for California's public school employees who are hired to perform creditable service for less than 50% of the full-time equivalent for the position.
STRP Replacement Benefit Program Fund (RBPF) As of June 30, 2010, the California STRP RBPF is reported combined with the STRP plan. The financial information included for the RBPF has no effect on the funding position and UAAL of the STRP plan. The RBPF is an excess-benefits arrangement for DB Program members that is administered as a qualified excess benefit arrangement through a separate pension trust apart from the other three STRP programs; the RBPF was established in accordance with the IRC Section 415(m). The program is funded as needed. During the June 30, 2012 fiscal year, there were 272 retirees participating in the RBPF.
Footnote:
(1) An employee can be a member of multiple tiers. As listed, each tier includes the number of employees participating in that tier. Therefore, the same employee can be counted more than once. The actual total membership is 862,192.
(2) The Cash Balance Benefit and Defined Benefit Supplement Programs of the State Teacher's Retirement System use the Traditional Unit Credit Cost Method.
(3) Education Code Section 22901 provides that the State will contribute 8.25%. If it is needed, 0.25% of additional funding is available from the State, per Education Code 22955.
22

Public Retirement Systems Annual Report — Fiscal Year 2011-12University of California Retirement System
Single-Employer Plan
SurvivorsNon-ServiceServiceRetiredVested MembersNon-VestedVestedMembershipActive Inactive Service Disabled
Total Status
72,321 44,171 32,701 49,387 1,897 — 7,194General - Tier 1 207,671 Open
275 121 172 288 103 — 65Safety - Tier 1 1,024 Open
72,596Totals 44,292 32,873 49,675 2,000 — 7,259 208,695
Contributions
AssetsCash and Short-Term InvestmentsReceivables
InvestmentsOther
Investments, at Fair ValueU.S. Government ObligationsInternational BondsMunicipal BondsDomestic Corporate BondsDomestic Stocks
Total Assets
Mortgages
Accounts PayableInvestment Purchases PayableAccrued ExpensesOther Current Liabilities
Total Liabilities
International Stocks
Net Assets Available for Benefits
Statement of Plan Net Assets
LiabilitiesTotal Additions
InterestDividends
Net Appreciation (Depreciation)
Other Investment Revenues in Fair Value of Investments
Statement of Changes in Plan Net Assets
$ 48,601,376,785
Real EstateVenture CapitalOther
Investments
$ 6,794,890,210
$ 41,806,486,575
$ 235,689,094
$ 2,239,743,506
Administration ExpensesOther Expenses
Total Deductions
Net Increase (Decrease) In Plan Assets
Beginning of the Year Net Assets Held
$ 2,305,911,200
$ )(66,167,694
as of June 30, 2012 for Period Ending June 30, 2012
$ 41,806,486,575
3,375,649,000198,860,000
—5,990,275,000
12,586,310,0007,123,502,000
—2,257,061,000
—15,708,619,840
354,975,80065,578,844
704,856,207
$ 41,549,8221,345,656,751
—5,407,683,637
3,652,264858,801,684
)(783,529,06545,487,719
Other Revenues —
28,761,9104,076,843
$ 41,872,654,269
Fixed Assets Net of Accumulated DepreciationOther Assets
——
in Trust for Pension Benefits
End of the Year Net Assets Heldin Trust for Pension Benefits
Investment Expenses
Adjustments —
Actuarial Cost Method:
Total UAAL Amortization Method:
Total UAAL Amortization Period: —24Years Remaining in Total UAAL Amortization Period:
AdditionsContributions
Employer -
Employee -
Other -
GeneralSafetyCombined
CombinedSafetyGeneral
CombinedSafetyGeneral
$ ——
1,851,459,524
272,420,297
—
——
——
DeductionsBenefit Payments
Service Retirement -
Disability -
Other -
Member Refunds -
General
CombinedSafetyGeneralCombinedSafety
CombinedSafetyGeneral
CombinedSafetyGeneral
$ ——
2,096,630,713——
35,188,859——
47,261,483——
93,991,392Entry Age
—Year in Which the Total Unfunded Actuarial Liability is Expected to be Fully Amortized:
)(8,548,917
Level Dollar Amount
Funded
Unfunded
Actuarial ValueActuarial
SalaryInterestValuationActuary: The Segal Company
Summary of Funding Position
of AssetsDate Rate Scale Liability Liability RatioAccrued
ActuarialAccruedFiscal
Year$ 9,074,000,000 82.5%7.50% 5.00% (1) 7/1/2011 $ 51,831,000,000 $ 42,757,000,0002012
6,308,991,000 86.7%7.50% 4.00%7/1/2010 47,504,309,000 41,195,318,00020112,361,752,000 94.8%7.50% 5.50%7/1/2009 45,160,525,000 42,798,773,0002010
)(1,263,450,000 103.0%7.50% 5.50%7/1/2008 42,576,822,000 43,840,272,0002009)(1,997,360,000 104.8%7.50% 5.50%7/1/2007 41,436,576,000 43,433,936,0002008)(1,997,360,000 104.8%7.50% 5.50%7/1/2007 41,436,576,000 43,433,936,0002007
Summary of Employer Contributions
UAAL as aPercentage of ARCAnnual RequiredRecognizedFiscal Year Contributions (ARC) Made Percentage of ACP
Contribution Annual CoveredPayroll (ACP)
2012 $ 2,062,022,000 $ 1,851,459,524 90 $ 9,542,340,029 95% %2011 1,812,546,000 1,677,920,951 93 8,869,265,277 71% %2010 1,669,257,000 148,446,000 9 8,739,433,283 27% %2009 454,000 454,037 100 8,288,553,643 -15% %2008 2,656,530 100 8,288,553,643 -24% %2007 — 23,934,036 2,393,403,600 7,612,700,000 -26% %
23

Public Retirement Systems Annual Report — Fiscal Year 2011-12University of California Retirement System — (Continued)
Contribution Rates as a Percentage of Covered PayrollGeneral
I IISafety
I IIIII IV V VIEmployer - Recommended by Actuary: III
Normal CostUAAL AmortizationTotal Rates Recommended by Actuary
Total Rates Adopted by BoardPrior Year Rates
Employee Rates Adopted by Board:Age 25Age 35Age 45Single Rate
23.25
23.25
—
—
23.66
23.66
—
—
% % % %
%
%
% %
%
%
% % % %
% % % %— — — —
— — — —
%
%—
—
17.775.48
— —
— —
— — — —
— — — —
— — — —
— —
— — — —
— —
— — — —
— —
— — — —
23.66—
— — — —
— —
— — — —
— —
— — — —
%%
%%
6/30/2011 20.40 — — — — — 22.48 — — 6/30/2010 20.40 — — — — — 21.99 — — 6/30/2009 — — — — — — — — — 6/30/2008 — — — — — — — — — 6/30/2007 — — — — — — — — —
% % % % % % % % %
Retirement Benefit PoliciesGeneral
I IISafety
I IIIII IV V VI III
505
Eligibility:AgeYears of ServiceAge
Age
Age
Years of Service
Years of Service
Years of Service
Years of Service Regardless of AgeAge Regardless of Service
62
505
62
Final Average Salary:Position Last HeldHighest Year(s) AverageFinal Year(s) Average
3—
——
——
——
——
——
3—
——
——
Compensation at Time of Retirement
OtherNone
2%2%Maximum Annual IncreaseYYIndex to Consumer Price Index
Index to Active Member IncreaseGranted Position Last HeldCost of Living:
Percent Per Year of Service: Age50556065
1.101.802.502.50
— — — —
— — — —
— — — —
— — — —
— — — —
3.003.003.003.00
— — — —
— — — —
NSocial Security Coverage: N
General with no SS and Safety Non-service - 25% of FAS plus 5% of FAS per year of service credit with maximum of 40% of FAS. General with SS - 15% of FAS plus 2.5% of FAS per year of service credit with maximum of 40%.
Benefit Comments:
Non-Service Disability - Per Year - Maximum
Service Disability - Per Year - Maximum
Disability Benefits as a Percentage of Final Average Salary (FAS):
5 %40 %
— —
— —
— —
— —
— —
5 %40 %
— —
— —
5 %40 %
— —
— —
— —
— —
— —
5 %50 %
— —
— —
Footnote:
(1) The July 1, 2010 amortization bases were combined into a single amortization base and amortized over 30 years. Any changes in UAAL due to actuarial experience gains or losses after July 1, 2010 will be separately amortized over a fixed (closed) 30-year period effective with that valuation. Any changes in UAAL due to a change in actuarial assumptions or plan provisions will be separately amortized over a fixed (closed) 15-year period.
24

DEFINED BENEFIT SYSTEMS
County Systems

This Page Intentionally Left Blank

Public Retirement Systems Annual Report — Fiscal Year 2011-12Alameda County Employees' Retirement Association
Cost-Sharing Multiple-Employer Plan
SurvivorsNon-ServiceServiceRetiredVested MembersNon-VestedVestedMembershipActive Inactive Service Disabled
Total Status
404 — 105 3,254 127 62 757General - Tier 1 4,709 Closed
26 — 21 685 108 — 153Safety - Tier 1 993 Closed
4,302 1,655 1,048 1,127 220 76 1092 8,537 Open
1,089 283 137 257 96 9 44 1,915 Open
50 28 21 243 42 5 163 405 Open
4 39 — — — — — 43 Open
126 — 4 177 5 — 64 318 Closed
1,880 789 454 247 43 18 105 3,441 Open
34 15 6 10 — — —6 65 Open
7,915Totals 2,809 1,796 6,000 641 170 1,095 20,426
Other Investment Revenues
Contributions
AssetsCash and Short-Term InvestmentsReceivables
InvestmentsOther
Investments, at Fair ValueU.S. Government ObligationsInternational BondsMunicipal BondsDomestic Corporate BondsDomestic Stocks
Total Assets
Mortgages
Accounts PayableInvestment Purchases PayableAccrued ExpensesOther Current Liabilities
Total Liabilities
International Stocks
Statement of Plan Net Assets
Net Assets Available for Benefits
LiabilitiesTotal Additions
InterestDividends
Net Appreciation (Depreciation)in Fair Value of Investments
$ 4,928,333,000
Real EstateVenture CapitalOther
Investments
$ 468,302,000
$ 4,460,031,000
$ 145,452,000
$ 185,648,000
Administration ExpensesOther Expenses
Total Deductions
Net Increase (Decrease) In Plan Assets
Beginning of the Year Net Assets Held
$ 315,000,000
$ )(129,352,000
as of December 31, 2011 for Period Ending December 31, 2011
$ 4,460,031,000
142,899,000269,343,000
9,268,000374,064,000
1,194,408,000987,022,000269,881,000
96,828,00029,466,000
1,974,460,000
14,217,00028,273,000
302,000
$ 2,305,00024,583,000
2,064,000439,350,000
64,201,00059,574,000
)(155,274,00019,959,000
Other Revenues )(14,516,000
10,137,0003,631,000
$ 4,589,383,000
Fixed Assets Net of Accumulated DepreciationOther Assets
6,274,000)(613,824,000
(1)
in Trust for Pension Benefits
End of the Year Net Assets Heldin Trust for Pension Benefits
Investment Expenses
Adjustments —
Actuarial Cost Method:
Total UAAL Amortization Method:
Total UAAL Amortization Period: 30
22Years Remaining in Total UAAL Amortization Period:
AdditionsContributions
Employer -
Employee -
Other -
GeneralSafetyCombined
CombinedSafetyGeneral
CombinedSafetyGeneral
$ ——
162,879,000
77,991,000
—
——
——
DeductionsBenefit Payments
Service Retirement -
Disability -
Other -
Member Refunds -
General
CombinedSafetyGeneralCombinedSafety
CombinedSafetyGeneral
CombinedSafetyGeneral
$ ——
263,520,000——
26,475,000——
5,831,000——
5,406,000
Entry Age
2032Year in Which the Total Unfunded Actuarial Liability is Expected to be Fully Amortized:
)(29,166,000
Level Percentage of Projected Covered Payroll
Statement of Changes in Plan Net Assets
Funded
Unfunded
Actuarial ValueActuarial
SalaryInterestValuationActuary: The Segal Company
Summary of Funding Position
of AssetsDate Rate Scale Liability Liability RatioAccrued
ActuarialAccruedFiscal
Year$ 1,386,612,000 77.5%7.90% 5.25% (2) 12/31/2010 $ 6,162,740,000 $ 4,776,128,0002012
1,110,311,000 81.2%7.90% 5.25%12/31/2009 5,899,311,000 4,789,000,0002011893,909,000 83.9%8.00% 5.40%12/31/2008 5,537,919,000 4,644,010,0002010552,190,000 89.2%8.00% 5.40%12/31/2007 5,112,403,000 4,560,213,0002009552,190,000 89.2%8.00% 5.40%12/31/2007 5,112,403,000 4,560,213,0002008697,316,000 85.5%8.00% 5.40%12/31/2006 4,825,157,000 4,127,841,0002007
27

Public Retirement Systems Annual Report — Fiscal Year 2011-12Alameda County Employees' Retirement Association — (Continued)
Summary of Employer Contributions
UAAL as aPercentage of ARCAnnual RequiredRecognizedFiscal Year Contributions (ARC) Made Percentage of ACP
Contribution Annual CoveredPayroll (ACP)
2012 $ 162,879,000 $ 162,879,000 100 $ 898,342,000 154% %2011 147,543,000 147,543,000 100 882,606,000 126% %2010 132,198,000 132,198,000 100 864,260,000 103% %2009 129,660,000 129,660,000 100 793,558,000 70% %2008 130,040,000 130,040,000 100 793,558,000 70% %2007 127,096,000 127,096,000 100 762,139,242 91% %
Contribution Rates as a Percentage of Covered Payroll
GeneralI II
SafetyI IIIII IV V VI IIIEmployer - Recommended by Actuary:
Normal CostUAAL AmortizationTotal Rates Recommended by Actuary
Total Rates Adopted by BoardPrior Year Rates
Employee Rates Adopted by Board:Age 25Age 35Age 45Single Rate
17.61
17.61
16.35
16.35
53.65
53.65
41.32
41.32
% % % %
%
%
%
%
%
%
%
%
%%%
%%%
%%%
%%%
% % % %
%
%
%%%
%
%
%%%
% %
% %
% %% %% %
22.74 17.86 16.60 24.66
22.74 17.86 16.60 24.66
%
%
%%%
%
41.14
41.14
10.397.22
9.137.22
10.3912.35
9.9010.8112.18
—
6.727.348.27—
9.9010.8112.18
—
10.397.47
9.9010.8112.18
—
9.137.47
6.727.348.27—
14.5810.08
11.5512.5213.98
—
27.7525.90
17.9219.0120.74
—
15.4225.90
14.6015.4616.74
—
15.2425.90
11.1912.0213.26
—
%%%%%
%%%%%
%%%%%
%%%%
%%%%
%%%
%%%%%
%%%%%
%12/31/2010 15.78 14.47 20.79 15.98 14.67 24.12 48.72 37.14 36.3712/31/2009 14.60 13.05 19.50 14.74 13.19 22.65 43.51 33.51 — 12/31/2008 13.81 11.89 18.89 13.92 12.00 22.11 34.90 27.46 — 12/31/2007 14.36 13.19 19.38 14.43 13.26 — 35.95 28.98 — 12/31/2006 16.46 14.30 21.53 — — — 37.05 29.84 —
(3)
(4)
% % % % % % % % %
Retirement Benefit Policies
GeneralI II
SafetyI IIIII IV V VI III
5010
Eligibility:AgeYears of ServiceAge
Age
Age
Years of Service
Years of Service
Years of Service
Years of Service Regardless of AgeAge Regardless of Service 70
30
5010
70
5010
70
5010
70
5010
70
10
7030 30 30 30 30
5010
70
5010
70
5010
7020 20 20
50
Final Average Salary:Position Last HeldHighest Year(s) AverageFinal Year(s) Average
1—
3—
1—
1—
3—
1—
1—
3—
3—
Compensation at Time of Retirement
OtherNone
3%2%3%3% 2%2%3%3%Maximum Annual IncreaseYYYYYYYYYIndex to Consumer Price Index
2%
Index to Active Member IncreaseGranted Position Last HeldCost of Living:
Percent Per Year of Service: Age50556065
1.341.772.342.62
1.181.491.922.43
1.341.772.342.62
1.341.772.342.62
1.181.491.922.43
2.002.502.502.50
3.003.003.003.00
3.003.003.003.00
3.003.003.003.00
I NII NI NSocial Security Coverage: NI
(1) Non-Service Connected Disability - Eligibility limited to members with at least 5 years of service, regardless of age. (2) Service Connected Disability - Any member is eligible, regardless of length of service.
Benefit Comments:
Non-Service Disability - Per Year - Maximum
Service Disability - Per Year - Maximum
Disability Benefits as a Percentage ofFinal Average Salary (FAS):
— 33 %
— 33 %
— 33 %
— 33 %
— 33 %
— 33 %
— 33 %
— 33 %
— 33 %
— 50 %
— 50 %
— 50 %
— 50 %
— 50 %
— 50 %
— 50 %
— 50 %
— 50 %
28

Public Retirement Systems Annual Report — Fiscal Year 2011-12Alameda County Employees' Retirement Association — (Continued)
Comments:In 1995 and 1996 Alameda County, the primary Alameda County Employee's Retirement Association (ACERA) sponsor, issued pension obligation bonds and contributed the net bond proceeds to the ACERA Pension plan. ACERA receive aggregate net proceeds of $591 million in these transactions. These contributions allow ACERA to provide "pension obligation bond credits" to the county (thus reducing contributions otherwise payable) over the period of time used by ACERA to amortized its unfunded actuarial accrued liability. The county receive pension obligation bond credits of approximately $42.7 million in the year ended December 31, 2010.
For fiscal year ending 12/31/11, the reported tier structure is as follows:General Tier I = County members hired on or before June 30, 1983. General Tier II = County members hired after June 30, 1983. General Tier III = Housing Authority of the County of Alameda, Livermore Area Recreation and Park District (Tier I), Office of EducationGeneral Tier IV = Alameda County Medical Center (ACMC), Courts & First 5 for Tier members hired on or before June 30, 1983.General Tier V = ACMC, Court & First 5 for Tier II members hired after June 30, 1983. General Tier VI = Livermore Area Recreation and Park District (Tier III)Safety Tier I = County safety members hired on or before June 30, 1983. Safety Tier II = County safety members hired after June 30, 1983. Safety Tier III = Safety Tiers 2C and 2D
Footnote:
(1) Other Revenues consist of ($19,583,000) Earnings Allocated to SRBR Reserves, $664,000 in Miscellaneous Income, and $4,403,000 Transfer to Employers' Advance Reserve from SRBR for implicit Subsidy.
(2) Includes $4,500,000 in reimbursement of implicit retiree health benefit subsidy paid by the County for 2010.
(3) The employer recommended rate by actuary and adopted rate by governing body shown is for Safety 2C members. The rates for Safety 2D is Normal Cost = 14.60, UAAL = 25.90, Total Rate = 40.50
(4) The employee recommended rate by actuary and adopted rate by governing body shown is for Safety 2C members. The rates for Safety 2D is Age 25 = 16.51, Age 35 = 17.37.
29

Public Retirement Systems Annual Report — Fiscal Year 2011-12Contra Costa County Employees' Retirement Association
Cost-Sharing Multiple-Employer Plan
SurvivorsNon-ServiceServiceRetiredVested MembersNon-VestedVestedMembershipActive Inactive Service Disabled
Total Status
597 129 279 2,719 232 82 705General - Tier 1 4,743 Open
1,121 325 302 1,079 463 20 315Safety - Tier 1 3,625 Open
— — 276 432 26 24 932 851 Open
4,522 1,935 1,357 1,730 23 50 923 9,709 Open
6,240Totals 2,389 2,214 5,960 744 176 1,205 18,928
Other Investment Revenues
Contributions
AssetsCash and Short-Term InvestmentsReceivables
InvestmentsOther
Investments, at Fair ValueU.S. Government ObligationsInternational BondsMunicipal BondsDomestic Corporate BondsDomestic Stocks
Total Assets
Mortgages
Accounts PayableInvestment Purchases PayableAccrued ExpensesOther Current Liabilities
Total Liabilities
International Stocks
Statement of Plan Net Assets
Net Assets Available for Benefits
LiabilitiesTotal Additions
InterestDividends
Net Appreciation (Depreciation)in Fair Value of Investments
$ 5,934,408,524
Real EstateVenture CapitalOther
Investments
$ 882,119,067
$ 5,052,289,457
$ 538,622,465
$ 363,278,067
Administration ExpensesOther Expenses
Total Deductions
Net Increase (Decrease) In Plan Assets
Beginning of the Year Net Assets Held
$ 338,145,809
$ 25,132,258
as of December 31, 2011 for Period Ending December 31, 2011
$ 5,052,289,457
144,577,420298,259,500
—1,117,105,4131,254,576,087
931,306,700266,891,833588,704,762
—367,414,250
7,069,451380,827,659
37,340,657
$ 6,413,443482,507,139
5,453,919387,744,566
88,297,05335,744,692
)(18,149,39221,505,504
Other Revenues 4,609,440
6,289,6847,649,185
$ 5,027,157,199
Fixed Assets Net of Accumulated DepreciationOther Assets
997,165715,162
(2)
in Trust for Pension Benefits
End of the Year Net Assets Heldin Trust for Pension Benefits
Investment Expenses
Adjustments —
Actuarial Cost Method:
Total UAAL Amortization Method: (1)
Total UAAL Amortization Period: 18
18Years Remaining in Total UAAL Amortization Period:
AdditionsContributions
Employer -
Employee -
Other -
GeneralSafetyCombined
CombinedSafetyGeneral
CombinedSafetyGeneral
$ 138,376,24162,012,753
—
—
—
35,111,75426,463,622
——
DeductionsBenefit Payments
Service Retirement -
Disability -
Other -
Member Refunds -
General
CombinedSafetyGeneralCombinedSafety
CombinedSafetyGeneral
CombinedSafetyGeneral
$ 199,438,835120,858,983
———————
2,360,5291,548,593
—
Entry Age
—Year in Which the Total Unfunded Actuarial Liability is Expected to be Fully Amortized:
)(30,693,600
LayeredOther
Statement of Changes in Plan Net Assets
Funded
Unfunded
Actuarial ValueActuarial
SalaryInterestValuationActuary: The Segal Company
Summary of Funding Position
of AssetsDate Rate Scale Liability Liability RatioAccrued
ActuarialAccruedFiscal
Year$ 1,312,215,090 80.3%7.80% 6.66% 12/31/2010 $ 6,654,036,801 $ 5,341,821,7112012
1,024,673,085 83.8%7.80% 6.66%12/31/2009 6,314,787,187 5,290,114,1022011689,965,915 88.4%7.80% 6.66%12/31/2008 5,972,471,074 5,282,505,1592010564,911,690 89.9%7.80% 6.66%12/31/2007 5,581,048,225 5,016,136,5352009833,105,977 84.3%7.80% 6.66%12/31/2006 5,293,977,010 4,460,871,0332008730,370,881 84.8%7.90% 6.66%12/31/2005 4,792,428,024 4,062,057,1432007
Summary of Employer Contributions
UAAL as aPercentage of ARCAnnual RequiredRecognizedFiscal Year Contributions (ARC) Made Percentage of ACP
Contribution Annual CoveredPayroll (ACP)
2012 $ 200,388,994 $ 200,388,994 100 $ 687,443,206 191% %2011 183,950,930 183,950,930 100 694,443,999 148% %2010 195,613,673 195,613,673 100 704,947,668 98% %2009 196,929,570 206,518,693 105 671,617,932 84% %2008 196,929,570 196,929,570 100 653,953,163 127% %2007 191,448,711 191,448,711 100 627,546,408 116% %
30

Public Retirement Systems Annual Report — Fiscal Year 2011-12Contra Costa County Employees' Retirement Association — (Continued)
Contribution Rates as a Percentage of Covered Payroll
GeneralI II
SafetyI IIIII IV V VI IIIEmployer - Recommended by Actuary:
Normal CostUAAL AmortizationTotal Rates Recommended by Actuary
Total Rates Adopted by BoardPrior Year Rates
Employee Rates Adopted by Board:Age 25Age 35Age 45Single Rate
24.48
24.48
—
—
52.39
52.39
—
—
% % % %
%
%
% %
%
%
%%%
%%%
% % % %
%
%
%%%
%
%
%%%
% %
%
%%%
23.71 32.23 — 32.45
23.71 32.23 — 32.45
%
%
%%%
%
45.88
45.88
15.149.34
— —
14.379.34
6.047.038.18—
— — — —
5.536.427.48—
15.8116.42
6.047.038.18—
— —
— — — —
14.3718.08
5.536.427.48—
27.9824.41
14.9317.3820.90
—
— —
— — — —
22.2123.67
11.3513.2115.40
—
%%%%%
%%%%%
%%%%%
%%%%%
%%%%%
%
%%%
12/31/2010 23.21 — 20.90 30.94 — 29.10 42.80 — 36.7212/31/2009 21.90 — 19.84 29.84 — 28.28 40.81 — 34.7612/31/2008 24.64 — 22.80 32.33 — 31.00 45.78 — 39.2912/31/2007 25.26 — 23.01 33.28 — 31.56 45.62 38.43 — 12/31/2006 24.34 — 22.05 31.73 — 29.99 43.82 — —
(3)
% % % % % % % % %
Retirement Benefit Policies
GeneralI II
SafetyI IIIII IV V VI III
5010
Eligibility:AgeYears of ServiceAge
Age
Age
Years of Service
Years of Service
Years of Service
Years of Service Regardless of AgeAge Regardless of Service 70
30
5010
70
5010
70
5010
70
10
7030 30 30 30
5010
20
50
Final Average Salary:Position Last HeldHighest Year(s) AverageFinal Year(s) Average
—1
—3
—1
—1
——
—1
—1
——
——
Compensation at Time of Retirement
OtherNone
3%3%3% 3%3%Maximum Annual IncreaseYYYYYYIndex to Consumer Price Index
4%
Index to Active Member IncreaseGranted Position Last HeldCost of Living:
Percent Per Year of Service: Age50556065
1.432.002.262.42
0.831.131.431.73
1.432.002.262.42
1.432.002.262.42
— — — —
1.432.002.262.42
3.003.003.003.00
— — — —
— — — —
I IIISocial Security Coverage: NI
Benefit Comments:
Non-Service Disability - Per Year - Maximum
Service Disability - Per Year - Maximum
Disability Benefits as a Percentage ofFinal Average Salary (FAS):
— 33 %
— 40 %
— 40 %
— 33 %
— —
— 40 %
— 33 %
— —
— 33 %
— 50 %
— 40 %
— 40 %
— 50 %
— —
— 40 %
— 50 %
— —
— 50 %
Comments:General Tier I includes members not mandated to be in Tier II or Tier III and reciprocal members who elected Tier I membership. As of December 31, 2011, there are no active Tier II member accounts.
Safety Tier I is used for Safety Tier A. Effective January 1, 2007, Safety Tier C was adopted for sworn employees hired after December 31, 2006. Safety Tier III is used for Safety Tier C. However, as of December 31, 2011, the plan membership for Safety Tier C is included in Safety Tier I.
Contribution Rate Tiers are set up differently than membership. General Tier l is used for county members enrolled in Tier l and General Tier IV is used for district members enrolled in Tier l. General Tier lll is used for county members in Tier lll and General Tier VI is used for district members enrolled in Tier lll.
31

Public Retirement Systems Annual Report — Fiscal Year 2011-12Contra Costa County Employees' Retirement Association — (Continued)
Footnote:
(1) The amortization method is based on a Level of percent of payroll for the total unfunded liability. However, the agency uses a layered unfunded actuarial accrued liability (UAAL), in which the remaining balance of the December 31, 2007 UAAL is amortized over a fixed decreasing or closed period with 13 years remaining as of December 31, 2009. Any changes in UAAL after December 31, 2007 will be separately amortized over a fixed 18-year period effective with that specific valuation.
(2) The plan's current accounting software is unable to break out disability payments from the service retirement benefit payments.
(3) The county is now paying 50% of the members' basic contributions on a nonrefundable basis. Districts pay varying portions, up to 100% of the members' basic contributions on a nonrefundable basis.
32

Public Retirement Systems Annual Report — Fiscal Year 2011-12Fresno County Employees' Retirement Association
Cost-Sharing Multiple-Employer Plan
SurvivorsNon-ServiceServiceRetiredVested MembersNon-VestedVestedMembershipActive Inactive Service Disabled
Total Status
4,383 223 1,273 5,033 114 129 78General - Tier 1 11,233 Open
695 6 121 611 155 6 22Safety - Tier 1 1,616 Open
47 167 10 — — — —2 224 Open
14 55 5 — — — — 74 Open
174 819 6 — — — —3 999 Open
1 50 — — — — —4 51 Open
— 10 — — — — — 10 Open
5,314Totals 1,330 1,415 5,644 269 135 100 14,207
Other Investment Revenues
Contributions
AssetsCash and Short-Term InvestmentsReceivables
InvestmentsOther
Investments, at Fair ValueU.S. Government ObligationsInternational BondsMunicipal BondsDomestic Corporate BondsDomestic Stocks
Total Assets
Mortgages
Accounts PayableInvestment Purchases PayableAccrued ExpensesOther Current Liabilities
Total Liabilities
International Stocks
Statement of Plan Net Assets
Net Assets Available for Benefits
LiabilitiesTotal Additions
InterestDividends
Net Appreciation (Depreciation)in Fair Value of Investments
$ 3,538,012,794
Real EstateVenture CapitalOther
Investments
$ 389,500,132
$ 3,148,512,662
$ 109,955,215
$ 180,254,659
Administration ExpensesOther Expenses
Total Deductions
Net Increase (Decrease) In Plan Assets
Beginning of the Year Net Assets Held
$ 198,918,706
$ )(18,664,047
as of June 30, 2012 for Period Ending June 30, 2012
$ 3,148,512,662
380,936,63498,054,481
—517,308,833940,467,705731,088,809
30,176,556176,768,455392,038,584
—
10,139,919121,333,234
9,647,599
$ 2,933,157158,550,634227,952,164
64,177
26,807,38132,147,867
)(98,040,36643,503,085
Other Revenues 157,354
3,597,723—
$ 3,167,176,709
Fixed Assets Net of Accumulated DepreciationOther Assets
3,800,63716,296,133
in Trust for Pension Benefits
End of the Year Net Assets Heldin Trust for Pension Benefits
Investment Expenses
Adjustments —
Actuarial Cost Method:
Total UAAL Amortization Method: (1)
Total UAAL Amortization Period: 30
23Years Remaining in Total UAAL Amortization Period:
AdditionsContributions
Employer -
Employee -
Other -
GeneralSafetyCombined
CombinedSafetyGeneral
CombinedSafetyGeneral
$ ——
157,869,172
32,627,149
—
——
——
DeductionsBenefit Payments
Service Retirement -
Disability -
Other -
Member Refunds -
General
CombinedSafetyGeneralCombinedSafety
CombinedSafetyGeneral
CombinedSafetyGeneral
$ ——
170,679,3865,394,8816,442,104
———
11,018,8641,720,626
65,122—
Entry Age
2033Year in Which the Total Unfunded Actuarial Liability is Expected to be Fully Amortized:
)(14,816,983
Level Percentage of Projected Covered Payroll
Statement of Changes in Plan Net Assets
Funded
Unfunded
Actuarial ValueActuarial
SalaryInterestValuationActuary: The Segal Company
Summary of Funding Position
of AssetsDate Rate Scale Liability Liability RatioAccrued
ActuarialAccruedFiscal
Year$ 1,109,420,000 72.9%7.75% 7.75% 6/30/2010 $ 4,092,464,000 $ 2,983,044,0002012
779,787,000 78.6%8.00% 8.00%6/30/2009 3,644,743,000 2,864,956,0002011617,567,000 82.0%8.00% 8.00%6/30/2008 3,429,990,000 2,812,423,0002010539,301,000 82.9%8.00% 8.00%6/30/2007 3,149,570,000 2,610,269,0002009405,536,000 85.5%8.16% 8.00%6/30/2006 2,803,990,000 2,398,454,0002008405,535,593 85.5%8.00% 8.00%6/30/2006 2,803,990,000 2,398,454,4072007
33

Public Retirement Systems Annual Report — Fiscal Year 2011-12Fresno County Employees' Retirement Association — (Continued)
Summary of Employer Contributions
UAAL as aPercentage of ARCAnnual RequiredRecognizedFiscal Year Contributions (ARC) Made Percentage of ACP
Contribution Annual CoveredPayroll (ACP)
2012 $ 157,869,172 $ 157,869,172 100 $ 408,861,000 271% %2011 130,289,781 130,289,781 100 422,519,000 185% %2010 126,138,168 126,138,168 100 424,083,302 146% %2009 113,959,034 113,959,034 100 404,277,000 133% %2008 97,305,345 97,305,345 100 376,270,000 108% %2007 69,996,591 69,996,591 100 376,270,081 108% %
Contribution Rates as a Percentage of Covered Payroll
GeneralI II
SafetyI IIIII IV V VI IIIEmployer - Recommended by Actuary:
Normal CostUAAL AmortizationTotal Rates Recommended by Actuary
Total Rates Adopted by BoardPrior Year Rates
Employee Rates Adopted by Board:Age 25Age 35Age 45Single Rate
41.03
41.03
38.78
38.78
61.25
61.25
60.26
60.26
% % % %
%
%
%
%
%
%
%
%
%%%
%%%
%%%
%%%
% % % %
%
%
%%%
% % %37.42 — — —
37.42 — — —
%
%—
—
18.5722.46
16.3222.46
14.9622.46
7.749.01
10.67—
5.115.966.97—
6.107.118.42—
— —
— — — —
— —
— — — —
— —
— — — —
26.9134.34
10.8412.4214.02
—
25.9234.34
9.3910.7612.14
—
— —
— — — —
%%%%%
%%%%%
%%%%
%%%%%
%%%%%
6/30/2011 31.47 29.48 28.08 — — — 47.40 46.24 — 6/30/2010 27.82 25.64 24.36 — — — 42.19 41.21 — 6/30/2009 26.71 24.86 22.86 — — — 38.56 35.84 — 6/30/2008 23.37 21.15 21.80 — — — 31.34 29.37 — 6/30/2007 18.37 18.37 — — — — 20.76 20.76 —
% % % % % % % % %
Retirement Benefit Policies
GeneralI II
SafetyI IIIII IV V VI III
5010
Eligibility:AgeYears of ServiceAge
Age
Age
Years of Service
Years of Service
Years of Service
Years of Service Regardless of AgeAge Regardless of Service 70
30
5010
70
5010
7030 30
5010
70
5010
7020 20
Final Average Salary:Position Last HeldHighest Year(s) AverageFinal Year(s) Average
1—
1—
3—
——
——
——
1—
1—
——
Compensation at Time of Retirement
OtherNone
3% 3%3%3%Maximum Annual IncreaseYYYYYIndex to Consumer Price Index
3%
Index to Active Member IncreaseGranted Position Last HeldCost of Living:
Percent Per Year of Service: Age50556065
1.862.503.273.27
1.432.002.262.42
1.492.002.623.13
— — — —
— — — —
— — — —
2.503.273.273.27
2.293.003.003.00
— — — —
(2)
(6)
(4)
(5)
I I ISocial Security Coverage: II
Benefit Comments:
Non-Service Disability - Per Year - Maximum
Service Disability - Per Year - Maximum
Disability Benefits as a Percentage ofFinal Average Salary (FAS):
— 33 %
— 33 %
— 33 %
— —
— —
— —
— 33 %
— 33 %
— —
— 50 %
— 50 %
— 50 %
— —
— —
— —
— 50 %
— 50 %
— —
34

Public Retirement Systems Annual Report — Fiscal Year 2011-12Fresno County Employees' Retirement Association — (Continued)
Comments:On March 19, 1998, the County of Fresno issued $184,910,000 in Pension Obligation Bonds, of which $183,632,000 was transferred to the Association to fund the unfunded actuarial accrued liability (UAAL). On March 23, 2004, the County of Fresno issued $402,898,000 in POBs, of which $398,141,000 was transferred to the Association to fund the UAAL.
General Tier IV and Safety Tier IV were adopted by the Fresno County Board of Supervisors on March 6, 2012.Footnote:
(1) The UAAL established as of the June 30, 2003 valuation is being amortized over a declining 30-year period, with 24 years remaining. Any new UAAL established on each subsequent valuation after June 30, 2003 as a result of actuarial gains or losses and changes in actuarial assumptions has been amortized over separate 15-year declining periods. The increase in UAAL due to benefit improvement is amortized over 30 years.
(2) For General Tier I, the retirement benefit is 2.5% of final average salary (FAS) per year of service multiplied by a Retirement Age Factor, ranging from 0.7456 to 1.309, for age 50 to 60.
(3) For General Tier II, retirement benefit is 2% of FAS per year of service multiplied by a Retirement Age Factor, ranging from 0.713 to 1.209 for age 50 to 63 and over.
(4) For General Tier III, retirement benefit is 2% of FAS per year of service multiplied by a Retirement Age Factor, ranging from 0.7454 to 1.5668 for age 50 to 65 and over.
(5) For Safety Tier I, the retirement benefit is 2.5% of FAS per year of service multiplied by a Retirement Age Factor, ranging from 1.0 to 1.3099 for age 50 to 55 and over.
(6) For Safety Tier II, the retirement benefit is a maximum 3% of FAS per year of service multiplied by a Retirement Age Factor, ranging from 0.7634 to 1.00 for age 50 to 55 and over.
35

Public Retirement Systems Annual Report — Fiscal Year 2011-12Imperial County Employees' Retirement System
Single-Employer Plan
SurvivorsNon-ServiceServiceRetiredVested MembersNon-VestedVestedMembershipActive Inactive Service Disabled
Total Status
1,113 498 285 574 49 26 123General - Tier 1 2,668 Open
220 90 47 126 46 7 26Safety - Tier 1 562 Open
1,333Totals 588 332 700 95 33 149 3,230
Other Investment Revenues
Contributions
AssetsCash and Short-Term InvestmentsReceivables
InvestmentsOther
Investments, at Fair ValueU.S. Government ObligationsInternational BondsMunicipal BondsDomestic Corporate BondsDomestic Stocks
Total Assets
Mortgages
Accounts PayableInvestment Purchases PayableAccrued ExpensesOther Current Liabilities
Total Liabilities
International Stocks
Statement of Plan Net Assets
Net Assets Available for Benefits
LiabilitiesTotal Additions
InterestDividends
Net Appreciation (Depreciation)in Fair Value of Investments
$ 578,167,766
Real EstateVenture CapitalOther
Investments
$ 33,506,784
$ 544,660,982
$ 5,811,525
$ 20,306,218
Administration ExpensesOther Expenses
Total Deductions
Net Increase (Decrease) In Plan Assets
Beginning of the Year Net Assets Held
$ 27,852,426
$ )(7,546,208
as of June 30, 2012 for Period Ending June 30, 2012
$ 544,660,982
18,887,0503,991,796
—127,479,015190,490,953
98,493,79520,774,34231,224,93942,217,104
—
1,016,15434,012,324
11,203
$ 760,7538,568,163
—24,177,868
3,636,4716,322,914
)(13,084,1575,451,503
Other Revenues 29,612
1,025,809—
$ 552,207,190
Fixed Assets Net of Accumulated DepreciationOther Assets
3,757,566—
in Trust for Pension Benefits
End of the Year Net Assets Heldin Trust for Pension Benefits
Investment Expenses
Adjustments —
Actuarial Cost Method:
Total UAAL Amortization Method:
Total UAAL Amortization Period: 20
19Years Remaining in Total UAAL Amortization Period:
AdditionsContributions
Employer -
Employee -
Other -
GeneralSafetyCombined
CombinedSafetyGeneral
CombinedSafetyGeneral
$ 9,541,7913,131,446
—
—
—
5,424,0882,873,540
——
DeductionsBenefit Payments
Service Retirement -
Disability -
Other -
Member Refunds -
General
CombinedSafetyGeneralCombinedSafety
CombinedSafetyGeneral
CombinedSafetyGeneral
$ 16,524,6215,815,155
—1,782,7021,876,220
———
263,065——
564,854
Entry Age
2031Year in Which the Total Unfunded Actuarial Liability is Expected to be Fully Amortized:
)(3,020,990
Level Percentage of Projected Covered Payroll
Statement of Changes in Plan Net Assets
Funded
Unfunded
Actuarial ValueActuarial
SalaryInterestValuationActuary: The Segal Company
Summary of Funding Position
of AssetsDate Rate Scale Liability Liability RatioAccrued
ActuarialAccruedFiscal
Year$ 65,569,000 89.8%7.75% 6.00% 6/30/2012 $ 643,322,000 $ 577,753,0002012
61,375,000 90.0%7.75% 6.00%6/30/2011 613,584,000 552,209,000201121,820,000 96.0%7.90% 6.00%6/30/2010 546,342,000 524,522,000201020,220,000 96.0%7.75% 6.75%6/30/2009 507,631,000 487,411,000200916,878,000 96.1%7.75% 6.75%6/30/2007 437,816,000 420,938,000200813,760,619 96.6%7.75% 6.70%6/30/2006 401,985,292 388,224,6732007
Summary of Employer Contributions
UAAL as aPercentage of ARCAnnual RequiredRecognizedFiscal Year Contributions (ARC) Made Percentage of ACP
Contribution Annual CoveredPayroll (ACP)
2012 $ 17,831,000 $ 12,673,237 71 $ 100,356,000 65% %2011 12,835,000 12,982,633 101 101,610,000 60% %2010 12,406,000 12,362,022 100 98,085 22,246% %2009 10,995,667 11,106,157 101 93,493,000 22% %2008 8,357,742 9,044,902 108 77,886,078 22% %2007 8,357,742 8,409,794 101 71,730,897 19% %
36

Public Retirement Systems Annual Report — Fiscal Year 2011-12Imperial County Employees' Retirement System — (Continued)
Contribution Rates as a Percentage of Covered Payroll
GeneralI II
SafetyI IIIII IV V VI IIIEmployer - Recommended by Actuary:
Normal CostUAAL AmortizationTotal Rates Recommended by Actuary
Total Rates Adopted by BoardPrior Year Rates
Employee Rates Adopted by Board:Age 25Age 35Age 45Single Rate
12.60
12.60
—
—
17.92
17.92
—
—
% % % %
%
%
% %
%
%
%%%
%%%
% % % %
% % % %— — — —
— — — —
%
%—
—
11.790.81
— —
— —
5.827.648.93—
— — — —
— — — —
— —
— — — —
— —
— — — —
— —
— — — —
16.261.66
16.0618.5620.27
—
— —
— — — —
— —
— — — —
%%%%%
%%%%%
6/30/2011 12.64 — — — — — 18.83 — — 6/30/2010 12.98 — — — — — 21.30 — — 6/30/2009 11.68 — — — — — 18.05 — — 6/30/2008 10.54 — — — — — 15.36 — — 6/30/2007 11.62 — — — — — 12.86 — —
(1)
(2)
% % % % % % % % %
Retirement Benefit Policies
GeneralI II
SafetyI IIIII IV V VI III
5010
Eligibility:AgeYears of ServiceAge
Age
Age
Years of Service
Years of Service
Years of Service
Years of Service Regardless of AgeAge Regardless of Service 70
30
5010
6020
Final Average Salary:Position Last HeldHighest Year(s) AverageFinal Year(s) Average
1—
——
——
——
——
——
1—
——
——
Compensation at Time of Retirement
OtherNone
2%2%Maximum Annual IncreaseYYIndex to Consumer Price Index
Index to Active Member IncreaseGranted Position Last HeldCost of Living:
Percent Per Year of Service: Age50556065
1.481.952.442.61
— — — —
— — — —
— — — —
— — — —
— — — —
3.003.003.003.00
— — — —
— — — —
NSocial Security Coverage: N
Benefit Comments:
Non-Service Disability - Per Year - Maximum
Service Disability - Per Year - Maximum
Disability Benefits as a Percentage ofFinal Average Salary (FAS):
— 40 %
— —
— —
— —
— —
— —
— 40 %
— —
— —
— 50 %
— —
— —
— —
— —
— —
— 50 %
— —
— —
Comments:In September 2002, the County of Imperial issued pension obligation bonds in the amount of $33,265,000, with the final payment on the bonds due August 15, 2031. The bond proceeds were used to pay the county's unfunded actuarial accrued liability (UAAL).
On November 4, 1997, the Imperial County Board of Supervisors adopted Resolution #97-120, which authorized the issuance of pension funding bonds. The bonds were subsequently issued in December 1997 in the amount of $35,175,000, with the final payment on the bonds due August 15, 2020. The bond proceeds were used to pay the retirement system for the county's UAAL.
Footnote:
(1) The employer rate includes an additional contribution to the system at a rate of 3% of the employees' earnable compensation.
(2) The employee rates include 3% pick up by the employer.
37

Public Retirement Systems Annual Report — Fiscal Year 2011-12Kern County Employees' Retirement Association
Cost-Sharing Multiple-Employer Plan
SurvivorsNon-ServiceServiceRetiredVested MembersNon-VestedVestedMembershipActive Inactive Service Disabled
Total Status
3,882 306 705 3,584 324 161 655General - Tier 1 9,617 Open
1,279 439 145 952 431 19 310Safety - Tier 1 3,575 Open
1 1,443 10 — — — —2 1,454 Open
1 43 — — — — — 44 Open
328 115 49 195 30 9 173 743 Open
191 96 105 72 2 4 64 476 Open
45 30 11 47 4 2 125 151 Open
48 13 8 49 2 — 106 130 Open
5,775Totals 2,485 1,033 4,899 793 195 1,010 16,190
Other Investment Revenues
Contributions
AssetsCash and Short-Term InvestmentsReceivables
InvestmentsOther
Investments, at Fair ValueU.S. Government ObligationsInternational BondsMunicipal BondsDomestic Corporate BondsDomestic Stocks
Total Assets
Mortgages
Accounts PayableInvestment Purchases PayableAccrued ExpensesOther Current Liabilities
Total Liabilities
International Stocks
Statement of Plan Net Assets
Net Assets Available for Benefits
LiabilitiesTotal Additions
InterestDividends
Net Appreciation (Depreciation)in Fair Value of Investments
$ 3,157,586,000
Real EstateVenture CapitalOther
Investments
$ 357,562,000
$ 2,800,024,000
$ 25,722,000
$ 229,707,000
Administration ExpensesOther Expenses
Total Deductions
Net Increase (Decrease) In Plan Assets
Beginning of the Year Net Assets Held
$ 225,609,000
$ 4,098,000
as of June 30, 2012 for Period Ending June 30, 2012
$ 2,800,024,000
148,278,00047,505,00014,441,000
192,844,000502,619,000254,496,000163,589,000
4,877,000—
1,687,746,000
1,173,000110,045,000
65,000
$ 5,000110,879,000
2,161,000244,517,000
22,176,00019,493,000
)(13,933,0002,459,000
Other Revenues —
3,469,000—
$ 2,795,926,000
Fixed Assets Net of Accumulated DepreciationOther Assets
4,186,000—
in Trust for Pension Benefits
End of the Year Net Assets Heldin Trust for Pension Benefits
Investment Expenses
Adjustments —
Actuarial Cost Method:
Total UAAL Amortization Method:
Total UAAL Amortization Period: 30
24Years Remaining in Total UAAL Amortization Period:
AdditionsContributions
Employer -
Employee -
Other -
GeneralSafetyCombined
CombinedSafetyGeneral
CombinedSafetyGeneral
$ 127,340,00062,497,000
—
—
—
14,198,0004,522,000
——
DeductionsBenefit Payments
Service Retirement -
Disability -
Other -
Member Refunds -
General
CombinedSafetyGeneralCombinedSafety
CombinedSafetyGeneral
CombinedSafetyGeneral
$ 117,270,00062,497,000
—9,289,000
18,156,000—
6,607,0005,239,000
—2,408,000
674,000—
Entry Age
2035Year in Which the Total Unfunded Actuarial Liability is Expected to be Fully Amortized:
)(9,045,000
Level percent of payroll, closedOther
Statement of Changes in Plan Net Assets
Funded
Unfunded
Actuarial ValueActuarial
SalaryInterestValuationActuary: Segal Company, Inc.
Summary of Funding Position
of AssetsDate Rate Scale Liability Liability RatioAccrued
ActuarialAccruedFiscal
Year$ 1,832,601,000 60.8%7.75% 4.00% 6/30/2011 $ 4,672,348,000 $ 2,839,747,0002012
1,662,394,000 62.7%7.75% 4.00%6/30/2010 4,457,038,000 2,794,644,00020111,424,985,000 66.1%7.75% 4.00%6/30/2009 4,205,200,000 2,780,215,00020101,017,155,000 72.3%7.75% 3.25%6/30/2008 3,671,460,000 2,654,305,0002009
765,937,000 77.2%8.00% 3.50%12/31/2007 3,355,755,000 2,589,818,0002008757,010,000 75.7%8.00% 3.50%12/31/2006 3,109,038,000 2,352,028,0002007
38

Public Retirement Systems Annual Report — Fiscal Year 2011-12Kern County Employees' Retirement Association — (Continued)
Summary of Employer Contributions
UAAL as aPercentage of ARCAnnual RequiredRecognizedFiscal Year Contributions (ARC) Made Percentage of ACP
Contribution Annual CoveredPayroll (ACP)
2012 $ 189,837,000 $ 189,837,000 100 $ 539,836,000 339% %2011 177,444,000 177,444,000 100 559,380,250 297% %2010 151,127,000 151,127,000 100 559,872,040 255% %2009 138,814,789 138,814,789 100 482,878,757 211% %2008 137,263,637 137,263,673 100 453,412,000 169% %2007 128,134,672 128,134,672 100 417,350,994 181% %
Contribution Rates as a Percentage of Covered Payroll
GeneralI II
SafetyI IIIII IV V VI IIIEmployer - Recommended by Actuary:
Normal CostUAAL AmortizationTotal Rates Recommended by Actuary
Total Rates Adopted by BoardPrior Year Rates
Employee Rates Adopted by Board:Age 25Age 35Age 45Single Rate
36.95
36.95
22.81
22.81
51.30
51.30
—
—
% % % %
%
%
%
%
%
%
%
%%%
%%%
%%%%
% % % %
%
%
%%%
%
%
%%%
% %
% %
% %% %% %
34.83 34.28 35.86 36.36
34.83 34.28 35.86 36.36
%
%—
—
20.7816.17
6.6416.17
18.6616.17
7.218.68
10.45—
5.146.187.47—
9.7111.1812.95
—
19.1015.18
3.614.345.23—
20.6815.18
7.218.68
10.45—
21.1815.18
7.218.68
10.45—
27.9523.35
12.5114.8317.2212.30
— —
— — — —
— —
— — — —
%%%%%
%%%%
%%%%
%%%%
%%%%
%%%%
%%%%%
%
6/30/2011 33.07 33.07 32.02 32.84 34.71 35.07 46.69 — — 6/30/2010 27.98 27.98 26.03 28.23 30.32 30.98 35.68 — — 6/30/2009 29.13 29.13 26.40 30.91 33.40 33.57 37.75 37.75 — 6/30/2008 30.08 30.08 27.28 31.81 34.65 35.00 39.23 — — 6/30/2007 30.00 — — — — — 37.69 — —
(1)
(2) (3)
% % % % % % % % %
Retirement Benefit Policies
GeneralI II
SafetyI IIIII IV V VI III
5010
Eligibility:AgeYears of ServiceAge
Age
Age
Years of Service
Years of Service
Years of Service
Years of Service Regardless of AgeAge Regardless of Service 70
30
5010
70
5010
70
5010
70
5010
70
10
7030 30 30 30 30
5010
70
5010
7020 20
50
Final Average Salary:Position Last HeldHighest Year(s) AverageFinal Year(s) Average
1—
1—
1—
1—
1—
1—
1—
1—
——
Compensation at Time of Retirement
OtherNone
3%3%3%3% 3%3%3%Maximum Annual IncreaseYYYYYYYYIndex to Consumer Price Index
3%
Index to Active Member IncreaseGranted Position Last HeldCost of Living:
Percent Per Year of Service: Age50556065
2.002.503.003.00
0.790.991.281.62
2.002.503.003.00
2.002.503.003.00
2.002.503.003.00
2.002.503.003.00
3.003.003.003.00
2.002.002.002.00
— — — —
I IINI ISocial Security Coverage: II
For general members, benefits based on the first $350 of monthly FAS are reduced by 1/3. Some district general members are not integrated with Social Security. Disability benefits are 20% of FAS, plus 2% per year of service over five years.
Benefit Comments:
Non-Service Disability - Per Year - Maximum
Service Disability - Per Year - Maximum
Disability Benefits as a Percentage ofFinal Average Salary (FAS):
— 40 %
— 40 %
— 40 %
— 40 %
— 40 %
— 40 %
— 40 %
— —
— —
— 50 %
— 50 %
— 50 %
— 50 %
— 50 %
— 50 %
— 50 %
— —
— —
39

Public Retirement Systems Annual Report — Fiscal Year 2011-12Kern County Employees' Retirement Association — (Continued)
Comments:Kern County Employees' Retirement Association (KCERA) tier structure for the fiscal year ending June 30, 2012, is as follows:
General Tier I: County Tier IGeneral Tier II: County Tier IIGeneral Tier III: County CourtsGeneral Tier IV: District category IIIGeneral Tier V: District categories II, IV, and VGeneral Tier VI: District category ISafety Tier I: Safety
KCERA previously adopted California Government Code section 31618, which provides for the establishment of the Supplemental Retiree Benefit Reserve (SRBR). The supplemental benefit is not a guaranteed benefit. SRBR currently provides retirees with 80% purchasing power protection and a $3,000 death benefit.
Footnote:
(1) General Tier V Includes district categories II, IV, and V. The rates shown are for category II. Employer rates for category IV and V are 32.96% and 33.06%, respectively.
(2) Some members received an employer "pick up" of their contributions as a result of prior negotiations. General members hired prior to the Memorandum Of Understanding (MOU) specified dates in 2004 or 2005 are eligible to receive the "five-year stop" upon attaining five years of service.
(3) Safety members also received employer "pick up" of their contributions as a result of prior negotiations. Safety members hired before MOU specified dates in 2007 are eligible to receive the five-year stop upon attaining five years of services. Effective January 1, 2010, probation managers hired prior to April 7, 2004, who have not attained five years of service will pay 100% of employees contribution until attaining 10 years of service. Probation officers hired prior to September 18, 2007, who have not attained five years of service will pay 100% of employee contributions until attaining seven years of service. Effective June 5, 2010, all firefighters eligible for the five-year stop will contribute a flat 1% of pensionable earnings.
40

Public Retirement Systems Annual Report — Fiscal Year 2011-12Los Angeles County Employees' Retirement Association
Cost-Sharing Multiple-Employer Plan
SurvivorsNon-ServiceServiceRetiredVested MembersNon-VestedVestedMembershipActive Inactive Service Disabled
Total Status
833 — 150 20,153 1,790 380 5,003General - Tier 1 28,309 Closed
64 — 4 2,864 3,599 61 1,468Safety - Tier 1 8,060 Closed
196 — 30 556 53 13 492 897 Closed
10,599 1,822 476 1,112 1,541 51 174 15,775 Open
183 — 17 315 39 13 463 613 Closed
41,516 10,675 3,261 6,519 1,067 324 7274 64,089 Open
18,705 7,359 3,921 8,219 — — 6165 38,820 Open
72,096Totals 19,856 7,859 39,738 8,089 842 8,083 156,563
Other Investment Revenues
Contributions
AssetsCash and Short-Term InvestmentsReceivables
InvestmentsOther
Investments, at Fair ValueU.S. Government ObligationsInternational BondsMunicipal BondsDomestic Corporate BondsDomestic Stocks
Total Assets
Mortgages
Accounts PayableInvestment Purchases PayableAccrued ExpensesOther Current Liabilities
Total Liabilities
International Stocks
Statement of Plan Net Assets
Net Assets Available for Benefits
LiabilitiesTotal Additions
InterestDividends
Net Appreciation (Depreciation)in Fair Value of Investments
$ 41,206,623,608
Real EstateVenture CapitalOther
Investments
$ 2,899,867,337
$ 38,306,756,271
$ 1,266,030,405
$ 1,295,682,035
Administration ExpensesOther Expenses
Total Deductions
Net Increase (Decrease) In Plan Assets
Beginning of the Year Net Assets Held
$ 2,440,937,123
$ )(1,145,255,088
as of June 30, 2012 for Period Ending June 30, 2012
$ 38,306,756,271
3,344,109,24961,191,130
147,521,9865,917,328,2719,017,867,9799,991,124,772
144,185,2813,899,086,5073,789,891,2722,650,723,391
60,835,533869,412,653
47,315,179
$ 38,371,5651,367,869,074
24,116,4571,469,510,241
821,703,847107,981,606
)(1,432,804,332287,325,931
Other Revenues 1,003,667
50,218,264120,885
$ 39,452,011,359
Fixed Assets Net of Accumulated DepreciationOther Assets
——
in Trust for Pension Benefits
End of the Year Net Assets Heldin Trust for Pension Benefits
Investment Expenses
Adjustments —
Actuarial Cost Method:
Total UAAL Amortization Method:
Total UAAL Amortization Period: 30
30Years Remaining in Total UAAL Amortization Period:
AdditionsContributions
Employer -
Employee -
Other -
GeneralSafetyCombined
CombinedSafetyGeneral
CombinedSafetyGeneral
$ 773,988,527304,940,920
—
—
—
384,432,917122,325,064
——
DeductionsBenefit Payments
Service Retirement -
Disability -
Other -
Member Refunds -
General
CombinedSafetyGeneralCombinedSafety
CombinedSafetyGeneral
CombinedSafetyGeneral
$ 1,465,202,559340,192,737
—152,697,694413,299,705
—1,505,399
79,032—
14,522,7573,098,091
—
Entry Age
—Year in Which the Total Unfunded Actuarial Liability is Expected to be Fully Amortized:
)(75,216,112
30-Year Layered Amortization MethodOther
Statement of Changes in Plan Net Assets
Funded
Unfunded
Actuarial ValueActuarial
SalaryInterestValuationActuary: Milliman
Summary of Funding Position
of AssetsDate Rate Scale Liability Liability RatioAccrued
ActuarialAccruedFiscal
Year$ 9,404,539,000 80.6%7.70% 5.15%6/30/2011 $ 48,598,166,000 $ 39,193,627,0002012
7,807,446,000 83.3%7.75% 7.50%6/30/2010 46,646,838,000 38,839,392,00020114,926,771,000 88.9%7.75% 5.20%6/30/2009 44,468,636,000 39,541,865,00020102,313,270,000 94.5%7.75% 5.20%6/30/2008 41,975,631,000 39,662,361,00020092,460,624,000 93.8%7.75% 5.20%6/30/2007 39,502,456,000 37,041,832,00020083,439,204,000 90.5%7.75% 4.94%6/30/2006 36,258,929,000 32,819,725,0002007
41

Public Retirement Systems Annual Report — Fiscal Year 2011-12Los Angeles County Employees' Retirement Association — (Continued)
Summary of Employer Contributions
UAAL as aPercentage of ARCAnnual RequiredRecognizedFiscal Year Contributions (ARC) Made Percentage of ACP
Contribution Annual CoveredPayroll (ACP)
2012 $ 1,078,929,447 $ 1,078,929,447 100 $ 6,650,673,594 141% %2011 944,174,184 944,174,184 100 6,695,439,009 117% %2010 843,703,699 843,703,671 100 6,547,616,006 75% %2009 847,171,799 831,671,334 98 6,123,888,444 38% %2008 827,911,046 788,029,042 95 5,615,735,825 44% %2007 863,626,040 751,928,265 87 5,205,804,303 66% %
Contribution Rates as a Percentage of Covered Payroll
GeneralI II
SafetyI IIIII IV V VI IIIEmployer - Recommended by Actuary:
Normal CostUAAL AmortizationTotal Rates Recommended by Actuary
Total Rates Adopted by BoardPrior Year Rates
Employee Rates Adopted by Board:Age 25Age 35Age 45Single Rate
21.01
21.59
15.00
15.00
30.38
30.38
21.14
24.10
% % % %
%
%
%
%
%
%
%
%
%%%
%%%
%%%
%%%
% % % %
%
%
%%%
%
%
%%%
% %
%
14.51 14.80 15.30 —
14.51 14.80 15.30 —
%
%—
—
14.546.47
8.536.47
8.046.47
4.475.657.50—
7.118.74
10.60—
6.117.499.22—
8.336.47
6.007.369.06—
8.836.47
— — — —
— —
— — — —
23.916.47
8.039.92
11.61—
14.676.47
7.689.95
12.10—
— —
— — — —
%%%%%
%%%%%
%%%%%
%%%%%
%%%%%
%%%%%
%%%%%
6/30/2011 19.40 12.74 12.23 12.65 12.67 — 29.46 22.69 — 6/30/2010 16.65 10.62 9.88 10.48 10.45 — 27.73 17.41 — 6/30/2009 17.01 10.79 10.22 10.79 10.67 — 28.06 17.60 — 6/30/2008 18.14 11.44 11.14 11.33 11.29 — 26.89 20.93 — 6/30/2007 20.17 13.31 13.02 13.16 13.32 — 28.05 22.70 —
% % % % % % % % %
Retirement Benefit Policies
GeneralI II
SafetyI IIIII IV V VI III
5010
Eligibility:AgeYears of ServiceAge
Age
Age
Years of Service
Years of Service
Years of Service
Years of Service Regardless of AgeAge Regardless of Service 70
30
5010
70
5010
70
5010
70
65105510
30 30 30
5010
60
5010
6020 20
Final Average Salary:Position Last HeldHighest Year(s) AverageFinal Year(s) Average
—1
—1
—1
—1
3—
——
—1
—1
——
Compensation at Time of Retirement
OtherNone
2%2%2% 2%3%3%Maximum Annual IncreaseYYYYYYYIndex to Consumer Price Index
2%
Index to Active Member IncreaseGranted Position Last HeldCost of Living:
Percent Per Year of Service: Age50556065
1.481.952.442.61
1.241.672.182.61
1.181.491.922.43
1.181.491.922.43
— 0.751.202.00
— — — —
2.002.622.622.62
2.002.622.622.62
— — — —
I III NSocial Security Coverage: NI
For non-service connected disability, a member may be of any age with five year of service. For service connected disability, a member may be of any age or have any number of years service.
Benefit Comments:
Non-Service Disability - Per Year - Maximum
Service Disability - Per Year - Maximum
Disability Benefits as a Percentage ofFinal Average Salary (FAS):
— 33 %
— 33 %
— 33 %
— 33 %
— —
— —
— 33 %
— 33 %
— —
— 50 %
— 50 %
— 50 %
— 50 %
— —
— —
— 50 %
— 50 %
— —
42

Public Retirement Systems Annual Report — Fiscal Year 2011-12Los Angeles County Employees' Retirement Association — (Continued)
Comments:From 1995 to 2001, no unfunded actuarial accrued liability contributions were required, and the county contributed only its portion of the normal cost contributions. Under the 2002 Retirement Benefits Enhancement Agreement, the county also must pay its portion of the normal cost contributions adjusted for either a positive UAAL or a positive funding surplus.
Due to collective bargaining, member rates for various plans have been reduced through a surcharge rate, in which the employer picks up the a portion of the employee's contribution.
43

Public Retirement Systems Annual Report — Fiscal Year 2011-12Marin County Employees' Retirement Association
Agent Multiple-Employer Plan
SurvivorsNon-ServiceServiceRetiredVested MembersNon-VestedVestedMembershipActive Inactive Service Disabled
Total Status
252 71 63 882 45 19 215General - Tier 1 1,547 Open
186 51 45 334 164 2 94Safety - Tier 1 876 Open
82 — 8 247 32 11 292 409 Open
271 70 43 77 41 5 7 514 Open
1,187 261 261 397 30 7 243 2,167 Open
3 55 — — — — —4 58 Open
1,981Totals 508 420 1,937 312 44 369 5,571
Other Investment Revenues
Contributions
AssetsCash and Short-Term InvestmentsReceivables
InvestmentsOther
Investments, at Fair ValueU.S. Government ObligationsInternational BondsMunicipal BondsDomestic Corporate BondsDomestic Stocks
Total Assets
Mortgages
Accounts PayableInvestment Purchases PayableAccrued ExpensesOther Current Liabilities
Total Liabilities
International Stocks
Statement of Plan Net Assets
Net Assets Available for Benefits
LiabilitiesTotal Additions
InterestDividends
Net Appreciation (Depreciation)in Fair Value of Investments
$ 1,627,007,542
Real EstateVenture CapitalOther
Investments
$ 131,565,860
$ 1,495,441,682
$ 181,238,778
$ 110,438,382
Administration ExpensesOther Expenses
Total Deductions
Net Increase (Decrease) In Plan Assets
Beginning of the Year Net Assets Held
$ 101,055,025
$ 9,383,357
as of June 30, 2012 for Period Ending June 30, 2012
$ 1,495,441,682
—20,913,118
—196,277,047709,762,426329,410,080
—116,157,327
—49,965,859
4,128,3719,654,105
645,752
$ 1,615,29137,423,806
—92,526,763
7,935,6258,596,165
14,343,5316,121,384
Other Revenues —
3,013,9171,245,638
$ 1,486,058,325
Fixed Assets Net of Accumulated DepreciationOther Assets
7,826,7811,027,898
in Trust for Pension Benefits
End of the Year Net Assets Heldin Trust for Pension Benefits
Investment Expenses
Adjustments —
Actuarial Cost Method:
Total UAAL Amortization Method: (2)
Total UAAL Amortization Period: 17
17Years Remaining in Total UAAL Amortization Period:
AdditionsContributions
Employer -
Employee -
Other -
GeneralSafetyCombined
CombinedSafetyGeneral
CombinedSafetyGeneral
$ ——
66,189,220
15,874,624
—
——
——
DeductionsBenefit Payments
Service Retirement -
Disability -
Other -
Member Refunds -
General
CombinedSafetyGeneralCombinedSafety
CombinedSafetyGeneral
CombinedSafetyGeneral
$ ——
95,977,096————————
818,374
Entry Age
2027Year in Which the Total Unfunded Actuarial Liability is Expected to be Fully Amortized:
(1)
)(8,622,167
Level Percentage of Projected Covered Payroll
Statement of Changes in Plan Net Assets
Funded
Unfunded
Actuarial ValueActuarial
SalaryInterestValuationActuary: EFI Actuaries
Summary of Funding Position
of AssetsDate Rate Scale Liability Liability RatioAccrued
ActuarialAccruedFiscal
Year$ 554,819,448 72.1%7.50% 3.50% 6/30/2011 $ 1,985,099,435 $ 1,430,279,9872012
560,961,000 70.9%7.75% 4.00%6/30/2010 1,929,666,000 1,368,705,0002011519,181,000 72.1%7.75% 4.00%6/30/2009 1,862,434,000 1,343,253,0002010283,702,000 84.0%8.00% 4.50%6/30/2008 1,769,620,000 1,485,918,0002009230,972,000 85.4%8.00% 4.50%6/30/2007 1,582,929,000 1,351,957,0002008290,759,000 80.6%8.00% 4.25%6/30/2006 1,501,701,000 1,210,942,0002007
Summary of Employer Contributions
UAAL as aPercentage of ARCAnnual RequiredRecognizedFiscal Year Contributions (ARC) Made Percentage of ACP
Contribution Annual CoveredPayroll (ACP)
2012 $ 66,189,220 $ 66,189,220 100 $ 215,756,977 257% %2011 66,256,762 66,256,762 100 220,827,549 254% %2010 56,270,346 56,270,346 100 221,815,166 234% %2009 58,090,000 54,555,518 94 224,369,071 126% %2008 50,117,000 58,089,688 116 197,238,061 117% %2007 50,117,033 50,117,033 100 186,123,000 156% %
44

Public Retirement Systems Annual Report — Fiscal Year 2011-12Marin County Employees' Retirement Association — (Continued)
Contribution Rates as a Percentage of Covered Payroll
GeneralI II
SafetyI IIIII IV V VI IIIEmployer - Recommended by Actuary:
Normal CostUAAL AmortizationTotal Rates Recommended by Actuary
Total Rates Adopted by BoardPrior Year Rates
Employee Rates Adopted by Board:Age 25Age 35Age 45Single Rate
38.96
38.96
20.50
20.50
17.89
17.89
31.26
31.26
% % % %
%
%
%
%
%
%
%
%
%%%
%%%
%%%
%%%
% % % %
%
%
%%%
%
%
%%%
% %21.12 14.64 — —
21.12 14.64 — —
%
%—
—
4.6634.30
5.0715.43
7.4313.69
6.507.168.42—
5.366.448.04—
6.617.719.30—
13.221.42
6.617.719.30—
— —
— — — —
— —
— — — —
8.279.62
14.4215.9817.93
—
8.1023.16
12.8115.2117.44
—
— —
— — — —
%%%%%
%%%%%
%%%%%
%%%%%
%%%%%
%%%%%
6/30/2011 23.69 40.78 21.09 — — — 26.90 61.27 35.956/30/2010 17.27 26.71 17.90 — — — 15.99 54.81 43.726/30/2009 21.93 27.19 16.23 — — — 27.02 57.55 40.886/30/2008 25.36 29.70 16.70 — — — 30.64 58.07 44.336/30/2007 25.06 28.20 16.79 — — — 31.60 45.65 39.48
% % % % % % % % %
Retirement Benefit Policies
GeneralI II
SafetyI IIIII IV V VI III
5010
Eligibility:AgeYears of ServiceAge
Age
Age
Years of Service
Years of Service
Years of Service
Years of Service Regardless of AgeAge Regardless of Service
5510
7030
50105510
70
50105510
70
55106110
7030 30 30
5010
70
5010
7020 20
Final Average Salary:Position Last HeldHighest Year(s) AverageFinal Year(s) Average
Y1
—
Y3
—
Y3
—
Y3
———
——
Y1
—
Y3
———
Compensation at Time of Retirement
OtherNone
2%2% 2%4%4%Maximum Annual IncreaseYYYYYYIndex to Consumer Price Index
2%
Index to Active Member IncreaseGranted Position Last HeldCost of Living:
Percent Per Year of Service: Age50556065
1.481.952.442.61
1.181.491.922.43
1.432.002.262.42
1.432.002.262.42
— — — —
— — — —
3.003.003.003.00
2.293.003.003.00
— — — —
N NN NSocial Security Coverage: NN
Retirement benefits are equal to the member's final compensation multiplied by credited serivce, the benefit factors (ranging from 1.18% to 3.0%) and age factors (ranging rom 0.71 to 1.35).
Benefit Comments:
Non-Service Disability - Per Year - Maximum
Service Disability - Per Year - Maximum
Disability Benefits as a Percentage ofFinal Average Salary (FAS):
— 33 %
— 33 %
— 33 %
— 33 %
— —
— —
— 33 %
— 33 %
— —
— 50 %
— 50 %
— 50 %
— 50 %
— —
— —
— 50 %
— 50 %
— —
Comments:Marin County is an agent multiple-employer plan that includes the County of Marin, City of San Rafael, Local Agency Formation Commission (LAFCO), Marin City Community Services District, Marin County Courts, Marin/Sonoma Mosquito and Vector Control District, Novato Fire Protection District, Southern Marin Fire Protection District, and Tamalpais Community Services District.
Footnote:
(1) Marin County Employees' Retirement Association is unable to separate disability benefits from retirement benefits.
(2) The unfunded actuarial accrued liability (UAAL) will be amortized over 17 years, with it staying the same for the next five years. After five years, the UAAL will decrease by one year with each valuation until the minimum period of 10 years is reached.
45

Public Retirement Systems Annual Report — Fiscal Year 2011-12Mendocino County Employees' Retirement Association
Agent Multiple-Employer Plan
SurvivorsNon-ServiceServiceRetiredVested MembersNon-VestedVestedMembershipActive Inactive Service Disabled
Total Status
28 — 11 368 22 15 89General - Tier 1 533 Closed
1 — — 35 34 2 23Safety - Tier 1 95 Closed
1 — — 1 1 — —2 3 Closed
101 18 45 19 17 1 4 205 Open
659 207 293 453 41 35 243 1,712 Open
1 — — 5 — — —4 6 Closed
38 15 7 24 1 1 25 88 Open
829Totals 240 356 905 116 54 142 2,642
Other Investment Revenues
Contributions
AssetsCash and Short-Term InvestmentsReceivables
InvestmentsOther
Investments, at Fair ValueU.S. Government ObligationsInternational BondsMunicipal BondsDomestic Corporate BondsDomestic Stocks
Total Assets
Mortgages
Accounts PayableInvestment Purchases PayableAccrued ExpensesOther Current Liabilities
Total Liabilities
International Stocks
Statement of Plan Net Assets
Net Assets Available for Benefits
LiabilitiesTotal Additions
InterestDividends
Net Appreciation (Depreciation)in Fair Value of Investments
$ 343,136,215
Real EstateVenture CapitalOther
Investments
$ 399,403
$ 342,736,812
$ 2,354,860
$ 12,572,862
Administration ExpensesOther Expenses
Total Deductions
Net Increase (Decrease) In Plan Assets
Beginning of the Year Net Assets Held
$ 24,878,573
$ )(12,305,711
as of June 30, 2012 for Period Ending June 30, 2012
$ 342,736,812
———————
738,992—
339,758,915
279,662——
$ 142,052—
257,351—
64,3847,260,965
)(11,133,20845,644
Other Revenues —
698,463—
$ 355,042,523
Fixed Assets Net of Accumulated DepreciationOther Assets
3,786—
(1)
in Trust for Pension Benefits
End of the Year Net Assets Heldin Trust for Pension Benefits
Investment Expenses
Adjustments —
Actuarial Cost Method:
Total UAAL Amortization Method:
Total UAAL Amortization Period: 30
27Years Remaining in Total UAAL Amortization Period:
AdditionsContributions
Employer -
Employee -
Other -
GeneralSafetyCombined
CombinedSafetyGeneral
CombinedSafetyGeneral
$ ——
11,811,076
4,840,275
—
——
——
DeductionsBenefit Payments
Service Retirement -
Disability -
Other -
Member Refunds -
General
CombinedSafetyGeneralCombinedSafety
CombinedSafetyGeneral
CombinedSafetyGeneral
$ ——
24,180,110—————————
Entry Age
2040Year in Which the Total Unfunded Actuarial Liability is Expected to be Fully Amortized:
)(316,274
Level Percentage of Projected Covered Payroll
Statement of Changes in Plan Net Assets
Funded
Unfunded
Actuarial ValueActuarial
SalaryInterestValuationActuary: the Segal Group
Summary of Funding Position
of AssetsDate Rate Scale Liability Liability RatioAccrued
ActuarialAccruedFiscal
Year$ 126,527,019 74.1%7.75% 4.00% 6/30/2012 $ 489,014,364 $ 362,487,3452012
124,912,676 73.6%7.75% 4.00%6/30/2011 472,644,283 347,731,607201191,785,000 78.9%8.00% 4.00%6/30/2010 434,987,000 343,202,000201066,933,000 83.4%8.00% 5.75%6/30/2009 403,196,000 336,263,000200920,411,286 94.5%8.00% 5.75%6/30/2008 373,832,000 353,420,714200840,322,000 88.7%8.00% 5.75%6/30/2007 358,259,000 317,937,0002007
46

Public Retirement Systems Annual Report — Fiscal Year 2011-12Mendocino County Employees' Retirement Association — (Continued)
Summary of Employer Contributions
UAAL as aPercentage of ARCAnnual RequiredRecognizedFiscal Year Contributions (ARC) Made Percentage of ACP
Contribution Annual CoveredPayroll (ACP)
2012 $ 11,811,076 $ 11,811,076 100 $ 56,596,088 224% %2011 9,553,955 9,553,955 100 64,143,765 195% %2010 9,571,000 8,238,310 86 69,004,002 133% %2009 6,046,000 8,561,368 142 72,235,097 93% %2008 7,232,000 7,269,154 101 70,880,333 29% %2007 7,533,000 7,231,002 96 65,898,590 61% %
Contribution Rates as a Percentage of Covered Payroll
GeneralI II
SafetyI IIIII IV V VI IIIEmployer - Recommended by Actuary:
Normal CostUAAL AmortizationTotal Rates Recommended by Actuary
Total Rates Adopted by BoardPrior Year Rates
Employee Rates Adopted by Board:Age 25Age 35Age 45Single Rate
12.07
12.07
16.13
16.13
44.50
44.50
39.15
39.15
% % % %
%
%
%
%
%
%
%
%
%%%
%%%
%%%
%%%
% % % %
%
%
%%%
%
%
%%%
% %
%
%%%
16.13 14.82 16.10 —
16.13 14.82 16.10 —
%
%—
—
5.586.49
9.646.49
9.646.49
8.429.40
10.79—
8.008.93
10.26—
8.008.93
10.26—
14.360.46
11.7813.1715.05
—
15.640.46
11.1912.5114.31
—
— —
— — — —
24.8119.69
11.1112.6214.65
—
19.4619.69
10.4811.9013.84
—
— —
— — — —
%%%%%
%%%%%
%%%%%
%%
%%%%%
%%%%%
%%
%%
6/30/2011 6.44 10.78 10.78 — — — 30.70 29.21 18.526/30/2010 4.32 9.27 9.27 — — — 16.69 18.01 11.296/30/2009 4.32 9.27 9.27 — — — 24.76 18.01 — 6/30/2008 3.38 8.91 8.91 19.48 — — 19.42 17.09 19.486/30/2007 4.88 9.82 9.82 16.49 — — 20.24 17.95 20.57
% % % % % % % % %
Retirement Benefit Policies
GeneralI II
SafetyI IIIII IV V VI III
5010
Eligibility:AgeYears of ServiceAge
Age
Age
Years of Service
Years of Service
Years of Service
Years of Service Regardless of AgeAge Regardless of Service
551057
5
30
5010551057
5
5010551057
5
505
505
30 30 20 20
501055
5
501055
5
20 20
Final Average Salary:Position Last HeldHighest Year(s) AverageFinal Year(s) Average
1—
3—
3—
1—
3—
——
1—
3—
——
Compensation at Time of Retirement
OtherNone
3%3%3% 3%3%3%Maximum Annual IncreaseIndex to Consumer Price Index
3%
Index to Active Member IncreaseGranted Position Last HeldCost of Living:
Percent Per Year of Service: Age50556065
1.341.772.342.62
1.341.772.342.62
1.341.772.342.62
2.002.622.622.62
2.002.622.622.62
— — — —
2.293.003.003.00
2.293.003.003.00
— — — —
I III ISocial Security Coverage: II
Benefit Comments:
Non-Service Disability - Per Year - Maximum
Service Disability - Per Year - Maximum
Disability Benefits as a Percentage ofFinal Average Salary (FAS):
— 33 %
— 33 %
— 33 %
— 33 %
— 33 %
— —
— 33 %
— 33 %
— —
— 50 %
— 50 %
— 50 %
— 50 %
— 50 %
— —
— 50 %
— 50 %
— —
47

Public Retirement Systems Annual Report — Fiscal Year 2011-12Mendocino County Employees' Retirement Association — (Continued)
Comments:The proceeds from the 2002 pension obligation bonds reduced the unfunded pension liability to less than 10% of the actuarially accrued liability at June 30, 2004. The funding agreement in effect prior to July 1, 2009, indicated that the county was not required to fund the UAAL if it does not exceed 10% of the total pension liability. In November 2009, that funding agreement was voided by mutual agreement between the Association Board of Retirement and the Mendocino County Board of Supervisors. Subsequent to the funding agreement, the Board of Retirement stipulated that the County of Mendocino must amortize the UAAL over a 30-year period from June 2009.
Footnote:
(1) The Counties Employees Retirement Law limits MCERA's annual administrative expenses, excluding the costs of administration for computer softward and hardware and computer technology consulting services (IT costs) to 0.21% of MCERA's actuarial accrued liability or $2 million, which ever is greater. Previously, the limit was 0.18% of MCERA's total assets. MCERA's administrative expense of $698,463, excluding IT costs of $210,118, represented 0.14% of MCERA's actuarial accrued liability, or 34.92% of the $2 million statutory cap.
48

Public Retirement Systems Annual Report — Fiscal Year 2011-12Merced County Employees' Retirement Association
Single-Employer Plan
SurvivorsNon-ServiceServiceRetiredVested MembersNon-VestedVestedMembershipActive Inactive Service Disabled
Total Status
216 5 92 1,256 62 59 16General - Tier 1 1,706 Open
50 1 5 176 81 5 4Safety - Tier 1 322 Open
993 381 91 134 7 11 42 1,621 Open
168 87 10 4 11 — 1 281 Open
1,427Totals 474 198 1,570 161 75 25 3,930
Other Investment Revenues
Contributions
AssetsCash and Short-Term InvestmentsReceivables
InvestmentsOther
Investments, at Fair ValueU.S. Government ObligationsInternational BondsMunicipal BondsDomestic Corporate BondsDomestic Stocks
Total Assets
Mortgages
Accounts PayableInvestment Purchases PayableAccrued ExpensesOther Current Liabilities
Total Liabilities
International Stocks
Statement of Plan Net Assets
Net Assets Available for Benefits
LiabilitiesTotal Additions
InterestDividends
Net Appreciation (Depreciation)in Fair Value of Investments
$ 516,069,729
Real EstateVenture CapitalOther
Investments
$ 10,937,130
$ 505,132,599
$ 25,188,295
$ 43,639,906
Administration ExpensesOther Expenses
Total Deductions
Net Increase (Decrease) In Plan Assets
Beginning of the Year Net Assets Held
$ 52,868,164
$ )(9,228,258
as of June 30, 2012 for Period Ending June 30, 2012
$ 505,132,599
65,234,069——
81,128,495143,675,847130,298,562
—36,004,79927,276,452
—
2,072,5002,237,9821,707,356
$ 498,7952,257,2648,147,698
33,373
8,280,8953,465,842
)(31,385,34914,641,594
Other Revenues 135,575
1,180,083796,902
$ 514,360,857
Fixed Assets Net of Accumulated DepreciationOther Assets
1,242,7582,614
(1)(2)
in Trust for Pension Benefits
End of the Year Net Assets Heldin Trust for Pension Benefits
Investment Expenses
Adjustments —
Actuarial Cost Method:
Total UAAL Amortization Method:
Total UAAL Amortization Period: 18
18Years Remaining in Total UAAL Amortization Period:
AdditionsContributions
Employer -
Employee -
Other -
GeneralSafetyCombined
CombinedSafetyGeneral
CombinedSafetyGeneral
$ ——
40,262,881
10,416,301
—
——
——
DeductionsBenefit Payments
Service Retirement -
Disability -
Other -
Member Refunds -
General
CombinedSafetyGeneralCombinedSafety
CombinedSafetyGeneral
CombinedSafetyGeneral
$ 35,896,8426,209,053
—2,229,9182,738,223
—2,177,344
588,272—
861,300190,227
—
Entry Age
2029Year in Which the Total Unfunded Actuarial Liability is Expected to be Fully Amortized:
)(2,177,833
Level Percentage of Projected Covered Payroll
Statement of Changes in Plan Net Assets
Funded
Unfunded
Actuarial ValueActuarial
SalaryInterestValuationActuary: EFI Actuaries
Summary of Funding Position
of AssetsDate Rate Scale Liability Liability RatioAccrued
ActuarialAccruedFiscal
Year$ 409,936,251 56.1%7.75% 3.75% 6/30/2011 $ 933,916,683 $ 523,980,4322012
421,270,670 54.7%7.50% 3.75%6/30/2010 930,832,065 509,561,3952011326,535,834 59.7%8.00% 4.50%6/30/2009 809,680,590 483,144,7562010203,905,703 70.5%8.00% 5.50%6/30/2008 692,252,217 488,346,5142009171,965,000 73.8%8.00% 5.50%6/30/2007 656,415,000 484,450,0002008180,334,649 71.1%8.00% 5.50%6/30/2006 624,333,431 443,998,7822007
Summary of Employer Contributions
UAAL as aPercentage of ARCAnnual RequiredRecognizedFiscal Year Contributions (ARC) Made Percentage of ACP
Contribution Annual CoveredPayroll (ACP)
2012 $ 36,662,000 $ 40,262,881 110 $ 114,746,286 357% %2011 29,137,000 36,662,122 126 114,607,909 368% %2010 27,883,000 29,136,704 104 118,629,922 275% %2009 23,751,000 27,882,650 117 109,253,000 187% %2008 23,232,000 23,751,437 102 100,589,000 171% %2007 14,750,000 23,232,099 158 101,138,000 178% %
49

Public Retirement Systems Annual Report — Fiscal Year 2011-12Merced County Employees' Retirement Association — (Continued)
Contribution Rates as a Percentage of Covered Payroll
GeneralI II
SafetyI IIIII IV V VI IIIEmployer - Recommended by Actuary:
Normal CostUAAL AmortizationTotal Rates Recommended by Actuary
Total Rates Adopted by BoardPrior Year Rates
Employee Rates Adopted by Board:Age 25Age 35Age 45Single Rate
37.59
37.59
33.56
33.56
47.71
47.71
42.34
42.34
% % % %
%
%
%
%
%
%
%
%
%%%%
%%%%
%%%%
%%%%
% % % %
% % % %— — — —
— — — —
%
%—
—
9.9227.67
5.8927.67
— —
9.6012.2914.0411.23
6.908.799.969.92
— — — —
— —
— — — —
— —
— — — —
— —
— — — —
18.3229.39
13.1815.5216.9513.42
12.9529.39
8.2110.0511.03
8.84
— —
— — — —
%%%%%
%%%%%
%%%%%
%%%%%
6/30/2011 32.91 28.01 — — — — 39.73 32.95 — 6/30/2010 22.86 22.65 — — — — 28.15 24.68 — 6/30/2009 21.01 20.84 — — — — 27.30 23.35 — 6/30/2008 19.98 20.38 — — — — 30.05 25.91 — 6/30/2007 18.51 19.11 — — — — 28.97 24.89 —
% % % % % % % % %
Retirement Benefit Policies
GeneralI II
SafetyI IIIII IV V VI III
5010
Eligibility:AgeYears of ServiceAge
Age
Age
Years of Service
Years of Service
Years of Service
Years of Service Regardless of AgeAge Regardless of Service 70
30
5510
7030
5010
5010
20 20
Final Average Salary:Position Last HeldHighest Year(s) AverageFinal Year(s) Average
1—
3—
——
——
——
——
1—
3—
——
Compensation at Time of Retirement
OtherYYNone
3%3%Maximum Annual IncreaseYYIndex to Consumer Price Index
Index to Active Member IncreaseYYGranted Position Last Held
Cost of Living:
Percent Per Year of Service: Age50556065
2.002.503.003.00
— 2.503.003.00
— — — —
— — — —
— — — —
— — — —
3.003.003.003.00
3.003.003.003.00
— — — —
I ISocial Security Coverage: II
Benefit Comments:
Non-Service Disability - Per Year - Maximum
Service Disability - Per Year - Maximum
Disability Benefits as a Percentage ofFinal Average Salary (FAS):
— 33 %
— 33 %
— —
— —
— —
— —
— 33 %
— 33 %
— —
— 50 %
— 50 %
— —
— —
— —
— —
— 50 %
— 50 %
— —
Footnote:
(1) Government Code section 31580.3 provides that, if during any year the administrative expense of a retirement system includes expenditures for software, hardware, and computer technology consulting service in support of that software, the administrative expense is limited to 0.21% of total assets plus $1 million. As a result, the county's administrative expense is still within the limit even though it is 0.22% of total assets.
(2) This includes $733,590 in 401(h) distribution from the retirement plan to the county.
50

Public Retirement Systems Annual Report — Fiscal Year 2011-12Orange County Employees' Retirement System
Cost-Sharing Multiple-Employer Plan
SurvivorsNon-ServiceServiceRetiredVested MembersNon-VestedVestedMembershipActive Inactive Service Disabled
Total Status
957 275 290 559 19 14 80General - Tier 1 2,194 Open
1,573 250 172 916 298 15 233Safety - Tier 1 3,457 Open
11,393 2,578 2,994 7,267 384 179 1,2422 26,037 Open
820 176 30 274 107 47 — 1,454 Open
1,390 159 507 609 190 43 1343 3,032 Open
854 31 206 205 16 2 15 1,329 Open
491 125 77 245 10 4 504 1,002 Open
207 41 88 88 8 2 45 438 Open
72 29 42 26 — — 46 173 Open
17,757Totals 3,664 4,406 10,189 1,032 306 1,762 39,116
Other Investment Revenues
Contributions
AssetsCash and Short-Term InvestmentsReceivables
InvestmentsOther
Investments, at Fair ValueU.S. Government ObligationsInternational BondsMunicipal BondsDomestic Corporate BondsDomestic Stocks
Total Assets
Mortgages
Accounts PayableInvestment Purchases PayableAccrued ExpensesOther Current Liabilities
Total Liabilities
International Stocks
Statement of Plan Net Assets
Net Assets Available for Benefits
LiabilitiesTotal Additions
InterestDividends
Net Appreciation (Depreciation)in Fair Value of Investments
$ 9,640,918,000
Real EstateVenture CapitalOther
Investments
$ 1,055,510,000
$ 8,585,408,000
$ 414,119,000
$ 621,861,000
Administration ExpensesOther Expenses
Total Deductions
Net Increase (Decrease) In Plan Assets
Beginning of the Year Net Assets Held
$ 506,577,000
$ 115,284,000
as of December 31, 2011 for Period Ending December 31, 2011
$ 8,585,408,000
662,234,000650,866,000
39,207,0001,597,856,0001,431,041,0001,970,308,000
102,189,000825,492,000258,247,000958,015,000
10,692,000712,518,000
1,272,000
$ 41,303,000432,938,000
9,726,000571,543,000
81,290,00096,751,000
)(163,768,00075,315,000
Other Revenues —
12,828,000—
$ 8,470,123,549
Fixed Assets Net of Accumulated DepreciationOther Assets
6,862,000—
in Trust for Pension Benefits
End of the Year Net Assets Heldin Trust for Pension Benefits
Investment Expenses
Adjustments 451
Actuarial Cost Method:
Total UAAL Amortization Method: (1)
Total UAAL Amortization Period: 30
23Years Remaining in Total UAAL Amortization Period:
AdditionsContributions
Employer -
Employee -
Other -
GeneralSafetyCombined
CombinedSafetyGeneral
CombinedSafetyGeneral
$ ——
387,585,000
183,820,000
—
——
——
DeductionsBenefit Payments
Service Retirement -
Disability -
Other -
Member Refunds -
General
CombinedSafetyGeneralCombinedSafety
CombinedSafetyGeneral
CombinedSafetyGeneral
$ ——
407,025,000——
46,323,000——
30,664,000——
9,737,000
Entry Age
2033Year in Which the Total Unfunded Actuarial Liability is Expected to be Fully Amortized:
)(39,132,000
Level Percentage of Projected Covered Payroll
Statement of Changes in Plan Net Assets
Funded
Unfunded
Actuarial ValueActuarial
SalaryInterestValuationActuary: The Segal Group
Summary of Funding Position
of AssetsDate Rate Scale Liability Liability RatioAccrued
ActuarialAccruedFiscal
Year$ 4,458,623,000 67.0%7.75% 3.50% 12/31/2011 $ 13,522,978,000 $ 9,064,355,0002012
3,753,281,000 69.8%7.75% 3.50%12/31/2010 12,425,873,000 8,672,592,00020113,703,891,000 68.8%11.25% 3.50%12/31/2009 11,858,578,000 8,154,687,00020103,112,335,000 71.3%11.25% 3.50%12/31/2008 10,860,715,000 7,748,380,00020092,707,311,000 72.9%11.25% 3.50%12/31/2007 9,996,211,000 7,288,900,00020082,298,960,000 73.8%7.75% 3.50%12/31/2006 8,765,045,000 6,466,085,0002007
51

Public Retirement Systems Annual Report — Fiscal Year 2011-12Orange County Employees' Retirement System — (Continued)
Summary of Employer Contributions
UAAL as aPercentage of ARCAnnual RequiredRecognizedFiscal Year Contributions (ARC) Made Percentage of ACP
Contribution Annual CoveredPayroll (ACP)
2012 $ 387,585,000 $ 387,585,000 100 $ 1,619,474,479 275% %2011 372,437,106 372,437,106 100 1,579,238,835 238% %2010 338,386,973 338,386,973 100 1,618,492,859 229% %2009 360,209,434 360,209,434 100 1,569,764,569 198% %2008 326,736,000 326,736,357 100 1,457,159,000 186% %2007 277,368,000 277,368,459 100 1,322,952,280 174% %
Contribution Rates as a Percentage of Covered Payroll
GeneralI II
SafetyI IIIII IV V VI IIIEmployer - Recommended by Actuary:
Normal CostUAAL AmortizationTotal Rates Recommended by Actuary
Total Rates Adopted by BoardPrior Year Rates
Employee Rates Adopted by Board:Age 25Age 35Age 45Single Rate
19.12
19.12
27.11
27.11
46.39
46.39
48.53
48.53
% % % %
%
%
%
%
%
%
%
%
%%%
%%%
%%%
%%%
% % % %
%
%
%%%
%
%
%%%
% %
% %
% %% %% %
20.39 25.68 26.53 19.64
20.39 25.68 26.53 19.64
%
%
%%%
%
34.07
34.07
8.6910.43
11.6115.50
11.119.28
4.725.696.87—
9.5411.5113.97
—
4.986.007.25—
10.9314.75
9.4411.3913.82
—
11.9814.55
9.6011.5814.05
—
12.597.05
7.088.54
10.32—
21.1325.26
9.2611.2213.71
—
21.3127.22
9.2511.2113.69
—
20.1713.90
8.6410.4712.79
—
%%%%%
%%%%%
%%%%%
%%%%%
%%%%%
%%%%%
%%%%%
%%%%%
%%%%%
12/31/2010 16.05 24.79 17.26 24.20 24.62 18.74 43.34 43.10 32.1812/31/2009 14.17 21.83 15.02 21.95 23.01 18.73 39.52 38.24 31.3912/31/2008 14.50 22.20 16.02 21.34 24.24 18.04 36.05 33.43 32.2512/31/2007 14.33 22.56 14.96 20.87 22.56 17.36 37.33 34.02 31.9412/31/2006 15.63 22.23 13.10 20.15 22.23 18.54 37.65 33.85 33.41
(2) (3) (4)
(5) (6) (7) (8) (9) (10) (11) (12) (13)
% % % % % % % % %
Retirement Benefit Policies
GeneralI II
SafetyI IIIII IV V VI III
5010
Eligibility:AgeYears of ServiceAge
Age
Age
Years of Service
Years of Service
Years of Service
Years of Service Regardless of AgeAge Regardless of Service 70
30
5010
70
5010
70
5010
70
5010
70
10
7030 30 30 30 30
5010
70
5010
70
5010
7020 20 20
50
Final Average Salary:Position Last HeldHighest Year(s) AverageFinal Year(s) Average
Y3
—
Y3
—
Y3
—
Y3
—
Y3
—
Y3
—
Y3
—
Y3
—
Y3
—
Compensation at Time of Retirement
OtherNone
3%3%3%3% 3%3%3%3%Maximum Annual IncreaseYYYYYYYYYIndex to Consumer Price Index
3%
Index to Active Member IncreaseGranted Position Last HeldCost of Living:
Percent Per Year of Service: Age50556065
1.181.491.922.43
2.002.702.702.70
1.181.491.922.43
2.002.502.502.50
2.002.702.702.70
1.432.002.262.43
3.003.003.00—
3.003.003.00—
3.003.003.00—
N NNNN SSocial Security Coverage: NN
Service Disability - 50% of the final average compensation, or 100% of service retirement benefit, if greater.Benefit Comments:
Non-Service Disability - Per Year - Maximum
Service Disability - Per Year - Maximum
Disability Benefits as a Percentage ofFinal Average Salary (FAS):
2 %33 %
2 %33 %
2 %33 %
2 %33 %
2 %33 %
2 %33 %
2 %33 %
2 %33 %
2 %33 %
— 50 %
— 50 %
— 50 %
— 50 %
— 50 %
— 50 %
— 50 %
— 50 %
— 50 %
52

Public Retirement Systems Annual Report — Fiscal Year 2011-12Orange County Employees' Retirement System — (Continued)
Comments:Orange County Employee's Retirement System (OCERS) tier structure for fiscal year ending December 31, 2011 is as follows:
General Tier I = Plan A&B (non Orange County Transportation Authority (OCTA)) and Rancho Santa MargaritaGeneral Tier II = Plan I&J and Plan O&P (2.7% @ 55 - non Orange County Fire Authority (OCFA)) General Tier III = Plan A&B OCTAGeneral Tier IV = Plan G&H (2.5% @ 55) General Tier V = Plan I&J OCFAGeneral Tier VI = Plan M&N (2% @ 55 Transportation Corridor Agencies (TSA) and Cemetery)Safety Tier I = Plan E&F and Plan Q&R Law Enforcement Safety Tier II = Plan E&F Fire AuthoritySafety Tier III = Plan E&F Probation Officers
The County also has Safety Tiers 1 and 2 for the Law Enforcement, Fire Authority, and Probation Officers, but it is combined in the State Controller's Office Financial Report.
The employer can pick up the member's contribution. For every dollar of member contributions picked up by the employer and not deposited in the member's contribution account, the employer can contribute less than a dollar. The pick up amount is not deposited in the member's contribution account and is not payable to a member who withdraws his or her contribution following termination of employment and is not payable as an additional death benefit.
In September 1994, Orange County issued $320 million in pension obligation bonds (POB). The remaining proceeds are used, in accordance with a long standing agreement between OCERS and the County of Orange, to offset a portion of the annual actuarially-determined contribution rate for the County of Orange. In 2011, $11 million of the remaining proceeds were used to offset the actuarially determined contributions for the County of Orange.
Footnote:
(1) Any increase or decrease in unfunded actuarial accrued liability that arise in the future years due to actuarial gains or losses will be amortized over separated 15-year periods, and changes due to actuarial assumption will be amortized over separate 30-year periods.
(2) The employer rate shown is for Plan I&J. The employer recommended and adopted rate for Plan O&P is Normal Cost = 3.69, UAAL = 15.5 Total Rate = 19.19.
(3) The employer rate shown is for Plan TCA. The employer recommended and adopted rate for Plan Cemetery is Normal Cost = 11.24 UAAL = 6.92. Total Rate = 18.16.
(4) The employer rate shown is for Plan E&F. The employer recommended and adopted rate for Plan Q&R is Normal Cost = 20.38, UAAL = 25.26 Total Rate = 45.64.
(5) The employee rate shown is for Plan A. The employee recommended and adopted rates for Plan B is Age 25 = 6.44, Age 35 = 7.76, Age 45 = 9.36.
(6) The employee rate shown is for Plan I. The employee recommended and adopted rates for Plan J is Age 25 = 9.14, Age 35 = 11.03, Age 45 = 13.31.
(7) The employee rate shown is for Plan A. The employee recommended and adopted rates for Plan B is Age 25 = 6.69, Age 35 = 8.06, Age 45 = 9.72.
(8) The employee rate shown is for Plan G. The employee recommended and adopted rates for Plan H is Age 25 = 9.04, Age 35 = 10.91, Age 45 = 13.16.
(9) The employee rate shown is for Plan I. The employee recommended and adopted rates for Plan J is Age 25 = 9.19, Age 35 = 11.09, Age 45 = 13.38.
(10) The employee rate shown is for Plan M (TCA and Cemetery). The employee recommended and adopted rates for Plan N (TCA and Cemetery) is Age 25 = 6.78, Age 35 = 8.17, Age 45 = 9.86.
(11) The employee rate shown is for Plan E&F Law Enforcement, Tier I. The employee recommended and adopted rates for Tier II is Age 25 = 12.75, Age 35 = 15.46, Age 45 = 18.01.
(12) The employee rate shown is for Plan E&F Fire Authority, Tier I. The employee recommended and adopted rates for Tier II is Age 25 = 12.74, Age 35 = 15.44, Age 45 = 18.00.
(13) The employee rate shown is for Plan E&F Probation, Tier I. The employee recommended and adopted rates for Tier II is Age 25 = 12.16, Age 35 = 14.73, Age 45 = 17.17.
53

Public Retirement Systems Annual Report — Fiscal Year 2011-12Sacramento County Employees' Retirement System
Cost-Sharing Multiple-Employer Plan
SurvivorsNon-ServiceServiceRetiredVested MembersNon-VestedVestedMembershipActive Inactive Service Disabled
Total Status
238 — 101 3,174 99 125 752General - Tier 1 4,489 Closed
438 — 129 1,058 194 15 269Safety - Tier 1 2,103 Closed
87 — 229 275 12 22 372 662 Closed
1,315 109 322 213 34 5 24 2,022 Closed
8,411 1,398 2,067 2,491 69 146 2253 14,807 Closed
1 36 — — — — — 37 Open
1 121 3 — — — —4 125 Open
10,491Totals 1,664 2,851 7,211 408 313 1,307 24,245
Other Investment Revenues
Contributions
AssetsCash and Short-Term InvestmentsReceivables
InvestmentsOther
Investments, at Fair ValueU.S. Government ObligationsInternational BondsMunicipal BondsDomestic Corporate BondsDomestic Stocks
Total Assets
Mortgages
Accounts PayableInvestment Purchases PayableAccrued ExpensesOther Current Liabilities
Total Liabilities
International Stocks
Statement of Plan Net Assets
Net Assets Available for Benefits
LiabilitiesTotal Additions
InterestDividends
Net Appreciation (Depreciation)in Fair Value of Investments
$ 6,884,852,000
Real EstateVenture CapitalOther
Investments
$ 810,926,000
$ 6,073,926,000
$ 779,834,000
$ 241,374,000
Administration ExpensesOther Expenses
Total Deductions
Net Increase (Decrease) In Plan Assets
Beginning of the Year Net Assets Held
$ 308,092,000
$ )(66,718,000
as of June 30, 2012 for Period Ending June 30, 2012
$ 6,073,926,000
522,883,00055,454,000
—494,744,000
2,115,213,0001,326,577,000
—663,128,000
—833,756,000
6,587,00083,325,000
—
$ 31,355,000105,402,000
—674,169,000
45,506,00071,121,000
)(119,251,00028,520,000
Other Revenues —
6,288,000—
$ 6,140,644,000
Fixed Assets Net of Accumulated DepreciationOther Assets
—3,351,000
in Trust for Pension Benefits
End of the Year Net Assets Heldin Trust for Pension Benefits
Investment Expenses
Adjustments —
Actuarial Cost Method:
Total UAAL Amortization Method:
Total UAAL Amortization Period: 25
23Years Remaining in Total UAAL Amortization Period:
AdditionsContributions
Employer -
Employee -
Other -
GeneralSafetyCombined
CombinedSafetyGeneral
CombinedSafetyGeneral
$ 122,407,00056,692,000
—
—
—
41,743,00023,947,000
——
DeductionsBenefit Payments
Service Retirement -
Disability -
Other -
Member Refunds -
General
CombinedSafetyGeneralCombinedSafety
CombinedSafetyGeneral
CombinedSafetyGeneral
$ ——
254,382,000——
20,455,000——
23,927,0002,786,000
254,000—
Entry Age
2035Year in Which the Total Unfunded Actuarial Liability is Expected to be Fully Amortized:
)(29,311,000
Level Percentage of Projected Covered Payroll
Statement of Changes in Plan Net Assets
Funded
Unfunded
Actuarial ValueActuarial
SalaryInterestValuationActuary: The Segal Company
Summary of Funding Position
of AssetsDate Rate Scale Liability Liability RatioAccrued
ActuarialAccruedFiscal
Year$ 1,308,328,000 83.3%7.50% 5.40%6/30/2012 $ 7,838,223,000 $ 6,529,895,0002012
962,073,000 87.0%7.75% 5.65%6/30/2011 7,382,897,000 6,420,824,0002011928,732,000 87.0%7.75% 5.65%6/30/2010 7,145,726,000 6,216,994,0002010931,778,000 86.0%7.88% 5.65%6/30/2009 6,661,993,000 5,730,215,0002009432,597,000 93.2%7.88% 5.65%6/30/2008 6,363,355,000 5,930,758,0002008381,875,000 93.4%7.88% 5.65%6/30/2007 5,788,336,000 5,406,461,0002007
54

Public Retirement Systems Annual Report — Fiscal Year 2011-12Sacramento County Employees' Retirement System — (Continued)
Summary of Employer Contributions
UAAL as aPercentage of ARCAnnual RequiredRecognizedFiscal Year Contributions (ARC) Made Percentage of ACP
Contribution Annual CoveredPayroll (ACP)
2012 $ 179,099,000 $ 179,099,000 100 $ 875,671,752 149% %2011 182,921,000 182,921,000 100 880,765,606 109% %2010 167,142,000 167,142,000 100 912,728,578 102% %2009 177,011,000 177,011,000 100 968,129,529 96% %2008 167,055,000 167,055,000 100 902,970,959 48% %2007 156,805,000 156,805,000 100 832,483,736 46% %
Contribution Rates as a Percentage of Covered Payroll
GeneralI II
SafetyI IIIII IV V VI IIIEmployer - Recommended by Actuary:
Normal CostUAAL AmortizationTotal Rates Recommended by Actuary
Total Rates Adopted by BoardPrior Year Rates
Employee Rates Adopted by Board:Age 25Age 35Age 45Single Rate
20.83
20.83
18.28
18.28
41.85
41.85
37.00
37.00
% % % %
%
%
%
%
%
%
%
%
%%%%
% %%%%
%
% % % %
%
%
%
%
%
%
% %21.18 16.33 — —
21.18 16.33 — —
%
%
%
%
35.55
35.55
13.846.99
11.336.95
14.276.91
5.105.345.775.38
— — —
3.82
— — —
5.18
9.366.97
— — —
7.82
— —
— — — —
— —
— — — —
25.0516.80
14.3415.1016.5714.52
20.3216.68
— — —
11.99
18.8416.71
— — —
11.86
%%%%%
%%%%%
%%%%%
%%%%%
%%%%%
6/30/2011 18.15 15.75 18.60 — — — 38.95 34.66 — 6/30/2010 15.46 13.07 15.88 — — — 33.65 29.53 — 6/30/2009 15.04 12.58 15.43 — — — 34.71 30.61 — 6/30/2008 15.89 12.95 15.73 — — — 36.01 31.67 — 6/30/2007 16.10 13.14 15.88 — — — 35.18 30.84 —
% % % % % % % % %
Retirement Benefit Policies
GeneralI II
SafetyI IIIII IV V VI III
5010
Eligibility:AgeYears of ServiceAge
Age
Age
Years of Service
Years of Service
Years of Service
Years of Service Regardless of AgeAge Regardless of Service 70
30
5010
70
5010
70
5010
7030 30 30
5010
5010
5010
20 20 20
Final Average Salary:Position Last HeldHighest Year(s) AverageFinal Year(s) Average
1—
3—
3—
3—
——
——
1—
3—
3—
Compensation at Time of Retirement
OtherYNone
2%2% 2%2%4%4%Maximum Annual IncreaseYYYYYYIndex to Consumer Price Index
Index to Active Member IncreaseGranted Position Last HeldCost of Living:
Percent Per Year of Service: Age50556065
1.481.952.442.61
1.481.952.442.61
1.481.952.442.61
1.181.491.922.43
— — — —
— — — —
3.003.003.003.00
3.003.003.003.00
3.003.003.003.00
I I II ISocial Security Coverage: II
Service Retirement Eligibility:General: Age 50 with 10 years of service, or age 70 regardless of service, or after 30 years of service regardless of age.Safety: Age 50 with 10 years of service, or after 20 years of Safety service regardless of age.
Benefit Comments:
Non-Service Disability - Per Year - Maximum
Service Disability - Per Year - Maximum
Disability Benefits as a Percentage ofFinal Average Salary (FAS):
2 %33 %
2 %40 %
2 %40 %
2 %40 %
— —
— —
2 %33 %
2 %40 %
2 %40 %
— 50 %
— 50 %
— 50 %
— 50 %
— —
— —
— 50 %
— 50 %
— 50 %
55

Public Retirement Systems Annual Report — Fiscal Year 2011-12Sacramento County Employees' Retirement System — (Continued)
Comments:General Tier IV and Safety Tier III are for new memberships starting on or after January 1, 2012.
56

Public Retirement Systems Annual Report — Fiscal Year 2011-12San Bernardino County Employees' Retirement Association
Cost-Sharing Multiple-Employer Plan
SurvivorsNon-ServiceServiceRetiredVested MembersNon-VestedVestedMembershipActive Inactive Service Disabled
Total Status
338 141 167 188 — 13 17General - Tier 1 864 Open
10,604 4,341 3,220 5,563 — 730 1,0722 25,530 Open
53 11 24 22 — 15 3 128 Open
608 132 104 373 — 31 623 1,310 Open
1,742 345 140 648 — 591 220 3,686 Open
752 239 102 148 — 17 74 1,265 Open
— — 25 15 — — 15 41 Open (2)
14,097Totals 5,209 3,782 6,957 — 1,397 1,382 32,824
Other Investment Revenues
Contributions
AssetsCash and Short-Term InvestmentsReceivables
InvestmentsOther
Investments, at Fair ValueU.S. Government ObligationsInternational BondsMunicipal BondsDomestic Corporate BondsDomestic Stocks
Total Assets
Mortgages
Accounts PayableInvestment Purchases PayableAccrued ExpensesOther Current Liabilities
Total Liabilities
International Stocks
Statement of Plan Net Assets
Net Assets Available for Benefits
LiabilitiesTotal Additions
InterestDividends
Net Appreciation (Depreciation)in Fair Value of Investments
$ 6,646,439,000
Real EstateVenture CapitalOther
Investments
$ 473,105,000
$ 6,173,334,000
$ 747,946,000
$ 386,507,000
Administration ExpensesOther Expenses
Total Deductions
Net Increase (Decrease) In Plan Assets
Beginning of the Year Net Assets Held
$ 349,747,000
$ 36,760,000
as of June 30, 2012 for Period Ending June 30, 2012
$ 6,173,334,000
112,734,00048,841,000
65,00015,456,000
379,763,000259,631,000
—534,807,000
3,087,403,0001,298,310,000
13,877,000142,095,000
3,355,000
$ 24,888,000110,535,000
8,877,000328,805,000
5,218,0006,611,000
87,620,00020,287,000
Other Revenues —
6,205,0001,814,000
$ 6,136,574,000
Fixed Assets Net of Accumulated DepreciationOther Assets
2,156,000—
in Trust for Pension Benefits
End of the Year Net Assets Heldin Trust for Pension Benefits
Investment Expenses
Adjustments —
Actuarial Cost Method:
Total UAAL Amortization Method: (1)
Total UAAL Amortization Period: 20
20Years Remaining in Total UAAL Amortization Period:
AdditionsContributions
Employer -
Employee -
Other -
GeneralSafetyCombined
CombinedSafetyGeneral
CombinedSafetyGeneral
$ 210,983,00067,108,000
—
—
—
50,959,00017,671,000
——
DeductionsBenefit Payments
Service Retirement -
Disability -
Other -
Member Refunds -
General
CombinedSafetyGeneralCombinedSafety
CombinedSafetyGeneral
CombinedSafetyGeneral
$ ——
323,984,0001,213,000
————
5,147,000——
11,384,000
Entry Age
—Year in Which the Total Unfunded Actuarial Liability is Expected to be Fully Amortized:
)(79,950,000
Level Percentage of Projected Covered Payroll
Statement of Changes in Plan Net Assets
Funded
Unfunded
Actuarial ValueActuarial
SalaryInterestValuationActuary: The Segal Company
Summary of Funding Position
of AssetsDate Rate Scale Liability Liability RatioAccrued
ActuarialAccruedFiscal
Year$ 1,817,085,000 78.9%7.75% 4.00% 6/30/2012 $ 8,606,577,000 $ 6,789,492,0002012
1,705,139,333 79.2%7.75% 4.25%6/30/2011 8,189,645,890 6,484,506,55720111,077,753,861 85.5%8.00% 4.25%6/30/2010 7,444,986,223 6,367,232,3622010
630,145,913 91.0%8.00% 4.25%6/30/2009 7,013,534,026 6,383,388,1132009432,098,000 93.6%8.00% 4.25%6/30/2008 6,773,629,000 6,341,531,0002008429,613,000 93.1%8.00% 4.25%6/30/2007 6,227,013,000 5,797,400,0002007
57

Public Retirement Systems Annual Report — Fiscal Year 2011-12San Bernardino County Employees' Retirement Association — (Continued)
Summary of Employer Contributions
UAAL as aPercentage of ARCAnnual RequiredRecognizedFiscal Year Contributions (ARC) Made Percentage of ACP
Contribution Annual CoveredPayroll (ACP)
2012 $ 278,091,000 $ 278,091,000 100 $ 1,260,309,037 144% %2011 258,128,000 258,128,000 100 1,244,554,740 137% %2010 243,773,000 243,773,000 100 1,250,192,961 86% %2009 246,232,000 246,232,000 100 1,226,431,276 51% %2008 241,721,000 241,721,000 100 1,219,561,653 35% %2007 239,857,000 239,857,000 100 1,102,150,627 39% %
Contribution Rates as a Percentage of Covered Payroll
GeneralI II
SafetyI IIIII IV V VI IIIEmployer - Recommended by Actuary:
Normal CostUAAL AmortizationTotal Rates Recommended by Actuary
Total Rates Adopted by BoardPrior Year Rates
Employee Rates Adopted by Board:Age 25Age 35Age 45Single Rate
22.51
22.38
14.72
14.50
—
—
47.14
46.91
% % % %
%
%
%
%
% %
%
%%%
%%%
%%%
% % % %
%
%
%%%
%
%
%%%
% %19.58 17.02 — —
19.33 16.88 — —
%
%
%%%
%
31.23
30.89
10.5711.94
9.275.45
9.729.86
8.6310.2012.26
—
8.6310.2012.26
—
8.6310.2012.26
—
9.277.75
8.6310.2012.26
—
— —
— — — —
— —
— — — —
— —
— — — —
20.2426.90
11.0913.1615.54
—
19.1612.07
11.0913.1615.54
—
%%%%%
%%%%%
%%%%%
%%%%% %
%%%%%
%%%%%
6/30/2011 20.39 12.32 16.08 15.54 — — — 44.70 26.826/30/2010 19.42 11.25 15.18 14.84 — — — 24.46 40.986/30/2009 19.97 11.67 13.91 15.39 — — — 24.90 42.526/30/2008 20.25 12.03 13.70 15.24 — — — 24.84 42.726/30/2007 20.25 12.03 15.24 12.60 — — 24.84 42.72 47.40
% % % % % % % % %
Retirement Benefit Policies
GeneralI II
SafetyI IIIII IV V VI III
5010
Eligibility:AgeYears of ServiceAge
Age
Age
Years of Service
Years of Service
Years of Service
Years of Service Regardless of AgeAge Regardless of Service 70
30
5010
70
5010
70
5010
7030 30 30
5010
70
5010
7020 20
Final Average Salary:Position Last HeldHighest Year(s) AverageFinal Year(s) Average
1—
1—
1—
1—
——
——
——
1—
1—
Compensation at Time of Retirement
OtherNone
2%2% 2%2%2%Maximum Annual IncreaseYYYYYYIndex to Consumer Price Index
2%
Index to Active Member IncreaseGranted Position Last HeldCost of Living:
Percent Per Year of Service: Age50556065
1.492.002.623.13
1.492.002.623.13
1.492.002.623.13
1.492.002.623.13
— — — —
— — — —
— — — —
3.003.003.003.00
3.003.003.003.00
N N NN NSocial Security Coverage: N
General: Age Factor x rate (0.0149 to 0.0313) x service credit x final compensation. Safety: Age factor x (0.03) x service credit x final compensation. Non-Service disability benefit requires 5 years service; benefit is 20% plus 2% each additional year with a maximum of 40%. Service-connected disability benefit is 50%.
Benefit Comments:
Non-Service Disability - Per Year - Maximum
Service Disability - Per Year - Maximum
Disability Benefits as a Percentage ofFinal Average Salary (FAS):
2 %40 %
2 %40 %
2 %40 %
2 %40 %
— —
— —
— —
2 %40 %
2 %40 %
50 %50 %
50 %50 %
50 %50 %
50 %50 %
— —
— —
— —
50 %50 %
50 %50 %
58

Public Retirement Systems Annual Report — Fiscal Year 2011-12San Bernardino County Employees' Retirement Association — (Continued)
Comments:San Bernardino County Employees' Retirement Association tier structure for the fiscal year ending June 30, 2012 is as follows:
General Tier I = all other participating agencies except the South Coast Air Quality Management District (SCAQMD) and the County of San Bernardino
General Tier II = the County of San Bernardino
General Tier III = SCAQMD
General Tier IV = Superior CourtSafety Tier II = all other participating agencies
Safety Tier III = County of San Bernardino
On November 11, 2006, Safety Tier I members went to Safety Tier III. On June 24, 2004, the San Bernardino County Employees' Retirement Association received pension obligation bonds proceeds of $506,090,000 from the County of San Bernardino and South Coast Air Quality Management District.
Footnote:
(1) The amortization method is 20 years for all unfunded actuarial accrued liability (UAAL) prior to June 30, 2002. Any changes in the UAAL after that date, will be amortized over a 20-year closed period effective with each valuation.
(2) Two agencies terminated from the system effective July 2012. These agencies' member information were shown as General Tier V.
59

Public Retirement Systems Annual Report — Fiscal Year 2011-12San Diego County Employees' Retirement Association
Cost-Sharing Multiple-Employer Plan
SurvivorsNon-ServiceServiceRetiredVested MembersNon-VestedVestedMembershipActive Inactive Service Disabled
Total Status
31 — 1,832 4,226 449 120 499General - Tier 1 7,157 Closed
— — — 400 42 11 47Safety - Tier 1 500 Closed
— — — 1,367 145 39 1622 1,713 Closed
— — — 236 25 7 28 296 Closed
10,252 1,498 2,505 4,697 499 134 5553 20,140 Closed
2,563 698 591 1,177 125 34 139 5,327 Closed
— 1,415 111 3 — — —4 1,529 Open
12,846Totals 3,611 5,039 12,106 1,285 345 1,430 36,662
Other Investment Revenues
Contributions
AssetsCash and Short-Term InvestmentsReceivables
InvestmentsOther
Investments, at Fair ValueU.S. Government ObligationsInternational BondsMunicipal BondsDomestic Corporate BondsDomestic Stocks
Total Assets
Mortgages
Accounts PayableInvestment Purchases PayableAccrued ExpensesOther Current Liabilities
Total Liabilities
International Stocks
Statement of Plan Net Assets
Net Assets Available for Benefits
LiabilitiesTotal Additions
InterestDividends
Net Appreciation (Depreciation)in Fair Value of Investments
$ 8,676,866,219
Real EstateVenture CapitalOther
Investments
$ 161,427,339
$ 8,515,438,880
$ 2,167,851,253
$ 849,218,230
Administration ExpensesOther Expenses
Total Deductions
Net Increase (Decrease) In Plan Assets
Beginning of the Year Net Assets Held
$ 510,614,744
$ 338,603,486
as of June 30, 2012 for Period Ending June 30, 2012
$ 8,515,438,880
1,037,267,020813,757,674
—507,659,877494,173,507415,877,694
—900,303,656336,919,254
1,867,326,058
3,775,213119,936,809
—
$ 276,50029,385,26615,870,281
115,895,292
61,523,23068,114,944
379,453,41030,780,932
Other Revenues 811,158
10,866,053117,261
$ 8,176,835,394
Fixed Assets Net of Accumulated DepreciationOther Assets
12,018,204—
in Trust for Pension Benefits
End of the Year Net Assets Heldin Trust for Pension Benefits
Investment Expenses
Adjustments —
Actuarial Cost Method:
Total UAAL Amortization Method: (2)
Total UAAL Amortization Period: 20
11Years Remaining in Total UAAL Amortization Period:
AdditionsContributions
Employer -
Employee -
Other -
GeneralSafetyCombined
CombinedSafetyGeneral
CombinedSafetyGeneral
$ ——
334,810,375
59,777,636
—
——
——
DeductionsBenefit Payments
Service Retirement -
Disability -
Other -
Member Refunds -
General
CombinedSafetyGeneralCombinedSafety
CombinedSafetyGeneral
CombinedSafetyGeneral
$ ——
443,474,645——
51,200,000——
1,590,312——
3,366,473
Entry Age
2024Year in Which the Total Unfunded Actuarial Liability is Expected to be Fully Amortized:
(1)
)(86,053,455
Level Percentage of Projected Covered Payroll
Statement of Changes in Plan Net Assets
Funded
Unfunded
Actuarial ValueActuarial
SalaryInterestValuationActuary: The Segal Company
Summary of Funding Position
of AssetsDate Rate Scale Liability Liability RatioAccrued
ActuarialAccruedFiscal
Year$ 2,335,689,000 78.7%8.00% 5.00% 6/30/2012 $ 10,943,172,000 $ 8,607,483,0002012
1,940,366,000 81.5%8.00% 5.00%6/30/2011 10,482,657,000 8,542,291,00020111,565,851,000 84.3%8.00% 5.00%6/30/2010 9,999,161,000 8,433,310,0002010
785,571,000 91.5%8.25% 5.25%6/30/2009 9,198,636,000 8,413,065,0002009485,368,000 94.4%8.25% 5.25%6/20/2008 8,722,294,000 8,236,926,0002008832,113,000 89.7%8.25% 5.25%6/30/2007 8,082,517,000 7,250,404,0002007
60

Public Retirement Systems Annual Report — Fiscal Year 2011-12San Diego County Employees' Retirement Association — (Continued)
Summary of Employer Contributions
UAAL as aPercentage of ARCAnnual RequiredRecognizedFiscal Year Contributions (ARC) Made Percentage of ACP
Contribution Annual CoveredPayroll (ACP)
2012 $ 274,106,000 $ 334,810,375 122 $ 1,052,366,000 222% %2011 205,799,000 303,809,437 148 1,090,413,000 178% %2010 188,414,000 257,896,481 137 1,095,576,622 143% %2009 219,635,000 291,247,665 133 1,129,170,565 70% %2008 236,763,000 305,478,409 129 1,135,431,988 43% %2007 231,300,000 278,933,228 121 1,062,396,029 78% %
Contribution Rates as a Percentage of Covered Payroll
GeneralI II
SafetyI IIIII IV V VI IIIEmployer - Recommended by Actuary:
Normal CostUAAL AmortizationTotal Rates Recommended by Actuary
Total Rates Adopted by BoardPrior Year Rates
Employee Rates Adopted by Board:Age 25Age 35Age 45Single Rate
24.11
24.11
—
—
—
—
—
—
% % % %
%
%
% % %
%%%
% % % %
%
%
%%%
%
%
%%%
% %24.11 24.11 — —
24.11 24.11 — —
%
%
%%%
%
37.17
37.17
13.0611.05
— —
13.0611.05
8.169.61
11.30—
— — — —
9.7611.4913.57
—
13.0611.05
6.938.169.60—
— —
— — — —
— —
— — — —
— —
— — — —
— —
— — — —
20.9216.25
13.3115.3118.04
—
%%%%%
%%%
%%%%%
%% %
%
%%%%%
6/30/2011 18.55 — 18.55 18.55 — — — — 27.226/30/2010 16.45 — 16.45 16.45 — — 24.64 24.64 24.646/30/2009 18.70 18.70 18.70 — — — — — 27.556/30/2008 21.49 21.49 21.49 — — — — — 29.876/30/2007 22.99 22.99 22.99 — — — 30.68 — —
% % % % % % % % %
Retirement Benefit Policies
GeneralI II
SafetyI IIIII IV V VI III
5010
Eligibility:AgeYears of ServiceAge
Age
Age
Years of Service
Years of Service
Years of Service
Years of Service Regardless of AgeAge Regardless of Service 70
30
5510
70
5010
70
5510
7030 30 30
5010
7020
(3)
Final Average Salary:Position Last HeldHighest Year(s) AverageFinal Year(s) Average
1—
——
1—
3—
——
——
——
——
——
Compensation at Time of Retirement
(5)
OtherNone
2%3%3%Maximum Annual IncreaseYYYIndex to Consumer Price Index
Index to Active Member IncreaseGranted Position Last HeldCost of Living:
(4)
Percent Per Year of Service: Age50556065
1.341.772.342.62
— — — —
2.002.503.003.00
1.341.772.342.62
— — — —
— — — —
— — — —
— — — —
— — — —
(6)
I I NISocial Security Coverage:
Non-Service Connected Disability - Generally, 1.8% of average compensation for Tier I, Tier III and Safety members per year of service and 1.5% for General Tier II members.
Benefit Comments:
Non-Service Disability - Per Year - Maximum
Service Disability - Per Year - Maximum
Disability Benefits as a Percentage ofFinal Average Salary (FAS):
2 %33 %
2 %33 %
2 %33 %
2 %33 %
— —
— —
— —
— —
2 %33 %
— 50 %
— 50 %
— 50 %
— 50 %
— —
— —
— —
— —
— 50 %
61

Public Retirement Systems Annual Report — Fiscal Year 2011-12San Diego County Employees' Retirement Association — (Continued)
Comments:In June 2004, the County of San Diego issued pension obligation bonds (POB) in the amount of $454.1 million and transferred $450 million to the retirement fund for investment.
On October 3, 2002, the San Diego County Employees' Retirement Association (SDCERA) received $550 million from the county related to its sale of taxable POBs to help fund the increased actuarial accrued liability resulting primarily from benefit enhancements.
For the fiscal year ending June 30, 2012, the tier structure is as follows: General Tier III and IV represent General Tiers A and B, respectively. Safety Tier III represents Safety Tiers A and B.
On July 21, 2009, the Board closed Tier A to new entrants and approved a Tier B for General and Safety members hired on or after August 28, 2009. Footnote:
(1) The employers have negotiated to pay all or a portion of most member contributions. In some cases, the portion is phased in over a five-year period. During the year, employee contributions that are paid by the county amount to $60,704,471.
(2) Effective with the June 30, 2004 actuarial valuation, the Association's UAAL is amortized over 20-year fixed layered amortization periods.
(3) The terms for Safety Tier B is the same as that of Safety Tier A.
(4) The maximum annual increase for Safety Tier B is 2%.
(5) The highest year average for Safety Tier B is three years.
(6) The percent per year of service for Safety Tier B at age 50 is 2.29%.
62

Public Retirement Systems Annual Report — Fiscal Year 2011-12San Joaquin County Employees' Retirement Association
Cost-Sharing Multiple-Employer Plan
SurvivorsNon-ServiceServiceRetiredVested MembersNon-VestedVestedMembershipActive Inactive Service Disabled
Total Status
4,441 — 1,257 2,946 218 163 544General - Tier 1 9,569 Open
813 — 161 485 177 13 139Safety - Tier 1 1,788 Open
5,254Totals — 1,418 3,431 395 176 683 11,357
Other Investment Revenues
Contributions
AssetsCash and Short-Term InvestmentsReceivables
InvestmentsOther
Investments, at Fair ValueU.S. Government ObligationsInternational BondsMunicipal BondsDomestic Corporate BondsDomestic Stocks
Total Assets
Mortgages
Accounts PayableInvestment Purchases PayableAccrued ExpensesOther Current Liabilities
Total Liabilities
International Stocks
Statement of Plan Net Assets
Net Assets Available for Benefits
LiabilitiesTotal Additions
InterestDividends
Net Appreciation (Depreciation)in Fair Value of Investments
$ 2,057,109,892
Real EstateVenture CapitalOther
Investments
$ 107,164,518
$ 1,949,945,374
$ 195,648,229
$ 156,417,044
Administration ExpensesOther Expenses
Total Deductions
Net Increase (Decrease) In Plan Assets
Beginning of the Year Net Assets Held
$ 136,458,221
$ 19,958,823
as of December 31, 2011 for Period Ending December 31, 2011
$ 1,949,945,374
20,402,248—
18,854,347190,129,570323,326,752316,246,136125,901,712378,273,891
—478,077,009
4,986,6844,581,440
18,917
$ —1,454,5161,018,634
104,691,368
29,172,6594,014,690
4,552,5545,721,441
Other Revenues 222,339
3,292,734456,214
$ 1,929,986,551
Fixed Assets Net of Accumulated DepreciationOther Assets
572,05790,900
(2)
in Trust for Pension Benefits
End of the Year Net Assets Heldin Trust for Pension Benefits
Investment Expenses
Adjustments —
Actuarial Cost Method:
Total UAAL Amortization Method: (1)
Total UAAL Amortization Period: 20
20Years Remaining in Total UAAL Amortization Period:
AdditionsContributions
Employer -
Employee -
Other -
GeneralSafetyCombined
CombinedSafetyGeneral
CombinedSafetyGeneral
$ 80,945,71731,945,984
—
—
—
10,964,3163,076,457
——
DeductionsBenefit Payments
Service Retirement -
Disability -
Other -
Member Refunds -
General
CombinedSafetyGeneralCombinedSafety
CombinedSafetyGeneral
CombinedSafetyGeneral
$ 83,434,70628,799,178
—9,125,5819,710,067
—572,007
——
1,016,66151,073
—
Entry Age
—Year in Which the Total Unfunded Actuarial Liability is Expected to be Fully Amortized:
)(14,199,113
Level Percentage of Projected Covered Payroll
Statement of Changes in Plan Net Assets
Funded
Unfunded
Actuarial ValueActuarial
SalaryInterestValuationActuary: EFI Actuaries
Summary of Funding Position
of AssetsDate Rate Scale Liability Liability RatioAccrued
ActuarialAccruedFiscal
Year$ 797,303,776 72.7%7.75% 3.50% 1/1/2011 $ 2,917,687,959 $ 2,120,384,1832012
820,600,046 70.4%7.75% 3.50%1/1/2010 2,769,611,544 1,949,011,4982011689,568,000 72.5%8.16% 3.75%1/1/2009 2,510,925,000 1,821,357,0002010304,572,000 87.0%8.16% 3.75%1/1/2008 2,334,521,000 2,029,949,0002009280,221,212 87.0%8.16% 3.75%1/1/2007 2,149,937,792 1,869,716,5802008208,785,000 89.2%8.00% 4.25%12/31/2005 1,935,818,000 1,727,033,0002007
Summary of Employer Contributions
UAAL as aPercentage of ARCAnnual RequiredRecognizedFiscal Year Contributions (ARC) Made Percentage of ACP
Contribution Annual CoveredPayroll (ACP)
2012 $ 112,891,701 $ 112,891,701 100 $ 367,344,479 217% %2011 104,451,673 104,451,673 100 385,441,510 213% %2010 97,805,585 97,805,585 100 377,559,000 183% %2009 94,162,866 94,162,866 100 367,361,000 83% %2008 85,686,698 85,868,698 100 340,828,000 82% %2007 73,611,841 73,611,841 100 309,692,000 67% %
63

Public Retirement Systems Annual Report — Fiscal Year 2011-12San Joaquin County Employees' Retirement Association — (Continued)
Contribution Rates as a Percentage of Covered Payroll
GeneralI II
SafetyI IIIII IV V VI IIIEmployer - Recommended by Actuary:
Normal CostUAAL AmortizationTotal Rates Recommended by Actuary
Total Rates Adopted by BoardPrior Year Rates
Employee Rates Adopted by Board:Age 25Age 35Age 45Single Rate
27.79
27.79
—
—
49.92
49.92
—
—
% % % %
%
%
% %
%
%
%%%
%%%
% % % %
% % % %— — — —
— — — —
%
%—
—
15.7912.00
— —
— —
2.903.474.17—
— — — —
— — — —
— —
— — — —
— —
— — — —
— —
— — — —
28.2421.68
4.485.075.80—
— —
— — — —
— —
— — — —
%%%%%
%%%%%
12/31/2010 24.87 — — — — — 47.54 — — 12/31/2009 22.91 — — — — — 45.43 — — 12/31/2008 23.04 — — — — — 44.51 — — 12/31/2007 22.74 — — — — — 41.37 — — 12/31/2006 20.70 — — — — — 39.56 — —
% % % % % % % % %
Retirement Benefit Policies
GeneralI II
SafetyI IIIII IV V VI III
5010
Eligibility:AgeYears of ServiceAge
Age
Age
Years of Service
Years of Service
Years of Service
Years of Service Regardless of AgeAge Regardless of Service 70
30
5010
7020
Final Average Salary:Position Last HeldHighest Year(s) AverageFinal Year(s) Average
1—
——
——
——
——
——
1—
——
——
Compensation at Time of Retirement
OtherNone
3%3%Maximum Annual IncreaseYYIndex to Consumer Price Index
Index to Active Member IncreaseGranted Position Last HeldCost of Living:
Percent Per Year of Service: Age50556065
1.471.952.442.61
— — — —
— — — —
— — — —
— — — —
— — — —
3.003.003.003.00
— — — —
— — — —
ISocial Security Coverage: N
Benefit Comments:
Non-Service Disability - Per Year - Maximum
Service Disability - Per Year - Maximum
Disability Benefits as a Percentage ofFinal Average Salary (FAS):
2 %33 %
— —
— —
— —
— —
— —
2 %33 %
— —
— —
— 50 %
— —
— —
— —
— —
— —
— 50 %
— —
— —
Footnote:
(1) Due to the unprecedented market decline in 2008, half of the loss in 2008 is deemed to be extraordinary actuarial loss. Thus, 50% of the loss will be separately amortized as a level percentage of pay over a closed 30-year period. Currently, 28 years remain in this closed period. The remaining unfunded actuarial accrued liability is being amortized on a 20-year open period until January 1, 2014. After that date, the liability will be decreased by one year in each valuation report until a 12-year amortization period is reached.
(2) Includes $154,232 in transfer from the Post-Employment Healthcare Fund.
64

Public Retirement Systems Annual Report — Fiscal Year 2011-12San Luis Obispo County Pension Trust
Single-Employer Plan
SurvivorsNon-ServiceServiceRetiredVested MembersNon-VestedVestedMembershipActive Inactive Service Disabled
Total Status
1,609 400 406 1,541 — 85 158General - Tier 1 4,199 Open
222 36 35 150 — 39 21Safety - Tier 1 503 Open
— 81 — — — — —2 81 Open (1)
77 21 8 38 — 5 3 152 Open
1,908Totals 538 449 1,729 — 129 182 4,935
Other Investment Revenues
Contributions
AssetsCash and Short-Term InvestmentsReceivables
InvestmentsOther
Investments, at Fair ValueU.S. Government ObligationsInternational BondsMunicipal BondsDomestic Corporate BondsDomestic Stocks
Total Assets
Mortgages
Accounts PayableInvestment Purchases PayableAccrued ExpensesOther Current Liabilities
Total Liabilities
International Stocks
Statement of Plan Net Assets
Net Assets Available for Benefits
LiabilitiesTotal Additions
InterestDividends
Net Appreciation (Depreciation)in Fair Value of Investments
$ 939,191,380
Real EstateVenture CapitalOther
Investments
$ 32,841,000
$ 906,350,380
$ 44,698,745
$ 79,811,117
Administration ExpensesOther Expenses
Total Deductions
Net Increase (Decrease) In Plan Assets
Beginning of the Year Net Assets Held
$ 54,414,151
$ 25,396,966
as of December 31, 2011 for Period Ending December 31, 2011
$ 906,350,380
102,591,25357,319,93210,456,59786,624,389
293,628,642183,910,820
22,965,32766,708,41417,022,73937,492,395
1,066,72213,315,330
2,740
$ 907,03631,933,964
——
7,718,95412,280,441
6,422,0141,488,738
Other Revenues —
1,909,983—
$ 880,953,414
Fixed Assets Net of Accumulated DepreciationOther Assets
1,222,218165,117
in Trust for Pension Benefits
End of the Year Net Assets Heldin Trust for Pension Benefits
Investment Expenses
Adjustments —
Actuarial Cost Method:
Total UAAL Amortization Method:
Total UAAL Amortization Period: 30
28Years Remaining in Total UAAL Amortization Period:
AdditionsContributions
Employer -
Employee -
Other -
GeneralSafetyCombined
CombinedSafetyGeneral
CombinedSafetyGeneral
$ ——
30,435,940
25,262,362
—
——
——
DeductionsBenefit Payments
Service Retirement -
Disability -
Other -
Member Refunds -
General
CombinedSafetyGeneralCombinedSafety
CombinedSafetyGeneral
CombinedSafetyGeneral
$ ——
47,750,044——
2,665,088——
430,358——
1,658,678
Entry Age
2040Year in Which the Total Unfunded Actuarial Liability is Expected to be Fully Amortized:
)(3,797,332
Level Percentage of Projected Covered Payroll
Statement of Changes in Plan Net Assets
Funded
Unfunded
Actuarial ValueActuarial
SalaryInterestValuationActuary: Gabriel Roeder Smith & Co.
Summary of Funding Position
of AssetsDate Rate Scale Liability Liability RatioAccrued
ActuarialAccruedFiscal
Year$ 320,627,000 76.7%7.25% 3.25% 1/1/2012 $ 1,378,549,000 $ 1,057,922,0002012
281,889,000 78.0%7.75% 5.50%1/1/2011 1,282,058,000 1,000,169,0002011274,612,000 76.1%7.75% 5.50%1/1/2009 1,150,214,000 875,602,0002010227,360,000 78.5%7.75% 5.50%1/1/2008 1,057,124,000 829,764,0002009235,103,000 76.4%7.75% 4.50%1/1/2007 994,861,000 759,758,0002008131,229,996 84.2%7.75% 4.50%1/1/2006 831,289,996 700,060,0002007
Summary of Employer Contributions
UAAL as aPercentage of ARCAnnual RequiredRecognizedFiscal Year Contributions (ARC) Made Percentage of ACP
Contribution Annual CoveredPayroll (ACP)
2012 $ 30,051,687 $ 30,435,940 101 $ 161,054,639 199% %2011 30,278,179 32,148,424 106 161,783,273 174% %2010 34,933,644 31,427,297 90 168,677,088 163% %2009 33,840,580 30,860,282 91 162,435,796 140% %2008 22,017,780 24,014,202 109 152,116,782 155% %2007 19,177,491 19,177,491 100 143,902,100 91% %
65

Public Retirement Systems Annual Report — Fiscal Year 2011-12San Luis Obispo County Pension Trust — (Continued)
Contribution Rates as a Percentage of Covered Payroll
GeneralI II
SafetyI IIIII IV V VI IIIEmployer - Recommended by Actuary:
Normal CostUAAL AmortizationTotal Rates Recommended by Actuary
Total Rates Adopted by BoardPrior Year Rates
Employee Rates Adopted by Board:Age 25Age 35Age 45Single Rate
18.88
17.59
18.68
17.49
23.94
25.02
15.78
15.10
% % % %
%
%
%
%
%
%
%
%
%%%
%%%
%%%
%%%
% % % %
% % % %— — — —
— — — —
%
%—
—
8.5210.36
8.3210.36
— —
13.6214.3815.62
—
5.817.859.58—
— — — —
— —
— — — —
— —
— — — —
— —
— — — —
9.5414.40
18.1519.3719.37
—
5.959.83
16.4117.2518.62
—
— —
— — — —
%%%%%
%%%%%
%%%%%
12/31/2010 19.44 — — — — — 25.22 15.21 — 12/31/2009 20.11 — — — — — 32.02 17.17 — 12/31/2008 19.49 — — — — — 28.83 16.72 — 12/31/2007 23.87 — — — — — 30.78 18.45 — 12/31/2006 16.77 — — — — — 23.03 11.88 —
% % % % % % % % %
Retirement Benefit Policies
GeneralI II
SafetyI IIIII IV V VI III
505
Eligibility:AgeYears of ServiceAge
Age
Age
Years of Service
Years of Service
Years of Service
Years of Service Regardless of AgeAge Regardless of Service
505
505
505
Final Average Salary:Position Last HeldHighest Year(s) AverageFinal Year(s) Average
1—
3—
——
——
——
——
1—
1—
——
Compensation at Time of Retirement
OtherNone
2%3%3%Maximum Annual IncreaseYYYYIndex to Consumer Price Index
2%
Index to Active Member IncreaseGranted Position Last HeldCost of Living:
Percent Per Year of Service: Age50556065
1.432.002.583.16
1.091.462.002.50
— — — —
— — — —
— — — —
— — — —
2.303.003.003.00
2.303.003.003.00
— — — —
S SSocial Security Coverage: SS
For General Tier I, Safety Tier I, Safety Tier II (applies to the Probation member classification) = Retirement benefit is 1 yr Final Compensation (FC) x Credited Service (CS) x Retirement Age Factors ranging from 1.43%-3.00%.
Benefit Comments:
Non-Service Disability - Per Year - Maximum
Service Disability - Per Year - Maximum
Disability Benefits as a Percentage ofFinal Average Salary (FAS):
2 %33 %
2 %33 %
— —
— —
— —
— —
2 %33 %
2 %33 %
— —
— —
— —
— —
— —
— —
— —
— 50 %
— 50 %
— —
Comments:In July 2003, the plan sponsor issued a pension obligation bond for $135 million to pay off the unfunded liability of the San Luis Obispo County Pension Trust (SLOCPT).
The information shown as General Tier I pertains to Miscellaneous SLOCPT members only; Safety Tier I pertains to Safety members and Safety Tier II pertains to probation officers.
Members may elect to participate in the system's Deferred Retirement Option Program (DROP). An amount equal to the amount that would have been paid had the member retired is deposited into a DROP account. Upon actual retirement, members may received the DROP account balance in lump sum or annuity payments.
All or part of the employee contributions rate is subject to potential pick up by the employer. Pick ups and related interest are subjected to refunds. The pick-up rate ranges from 7.74% to 13.59%, depending on bargaining unit.
66

Public Retirement Systems Annual Report — Fiscal Year 2011-12San Luis Obispo County Pension Trust — (Continued)
Footnote:
(1) During 2011, a new Tier II for Miscellaneous members (new hires only) was added to the plan.
67

Public Retirement Systems Annual Report — Fiscal Year 2011-12San Mateo County Employees' Retirement Association
Cost-Sharing Multiple-Employer Plan
SurvivorsNon-ServiceServiceRetiredVested MembersNon-VestedVestedMembershipActive Inactive Service Disabled
Total Status
49 — 26 1,475 46 36 353General - Tier 1 1,985 Closed
118 — 31 264 83 3 61Safety - Tier 1 560 Closed
994 1 449 1,218 101 61 1092 2,933 Closed
71 — 20 109 2 2 5 209 Closed
72 67 117 103 — — 73 366 Open
421 124 61 19 6 — 2 633 Open
2,207 817 508 167 27 7 94 3,742 Open
— 154 — — — — —5 154 Open
3,932Totals 1,163 1,212 3,355 265 109 546 10,582
Other Investment Revenues
Contributions
AssetsCash and Short-Term InvestmentsReceivables
InvestmentsOther
Investments, at Fair ValueU.S. Government ObligationsInternational BondsMunicipal BondsDomestic Corporate BondsDomestic Stocks
Total Assets
Mortgages
Accounts PayableInvestment Purchases PayableAccrued ExpensesOther Current Liabilities
Total Liabilities
International Stocks
Statement of Plan Net Assets
Net Assets Available for Benefits
LiabilitiesTotal Additions
InterestDividends
Net Appreciation (Depreciation)in Fair Value of Investments
$ 2,707,123,527
Real EstateVenture CapitalOther
Investments
$ 346,819,873
$ 2,360,303,654
$ 249,113,735
$ 190,362,623
Administration ExpensesOther Expenses
Total Deductions
Net Increase (Decrease) In Plan Assets
Beginning of the Year Net Assets Held
$ 147,834,798
$ 42,527,825
as of June 30, 2012 for Period Ending June 30, 2012
$ 2,360,303,654
157,472,910——
397,031,496902,422,401408,832,756
—146,917,122
—310,931,079
3,702,233130,578,630
113,496
$ 2,533,960340,868,184
—3,417,729
26,692,74134,961,210
)(51,737,514—
Other Revenues 750,244
5,033,047)(33,331
$ 2,317,775,829
Fixed Assets Net of Accumulated DepreciationOther Assets
—7,669
in Trust for Pension Benefits
End of the Year Net Assets Heldin Trust for Pension Benefits
Investment Expenses
Adjustments —
Actuarial Cost Method:
Total UAAL Amortization Method:
Total UAAL Amortization Period: 15
15Years Remaining in Total UAAL Amortization Period:
AdditionsContributions
Employer -
Employee -
Other -
GeneralSafetyCombined
CombinedSafetyGeneral
CombinedSafetyGeneral
$ ——
150,949,761
49,687,136
—
——
——
DeductionsBenefit Payments
Service Retirement -
Disability -
Other -
Member Refunds -
General
CombinedSafetyGeneralCombinedSafety
CombinedSafetyGeneral
CombinedSafetyGeneral
$ ——
122,541,648——
15,532,365——
1,133,577——
3,627,492
Entry Age
—Year in Which the Total Unfunded Actuarial Liability is Expected to be Fully Amortized:
)(20,940,955
Level Percentage of Projected Covered Payroll
Statement of Changes in Plan Net Assets
Funded
Unfunded
Actuarial ValueActuarial
SalaryInterestValuationActuary: Milliman
Summary of Funding Position
of AssetsDate Rate Scale Liability Liability RatioAccrued
ActuarialAccruedFiscal
Year$ 962,282,000 72.0%8.00% 4.95% 6/30/2012 $ 3,442,553,000 $ 2,480,271,0002012
841,587,000 74.1%7.75% 4.70%6/30/2011 3,246,727,000 2,405,140,0002011919,377,000 70.3%7.75% 5.20%6/30/2010 3,098,453,000 2,179,076,0002010
1,078,033,000 63.9%7.75% 5.20%6/30/2009 2,987,712,000 1,909,679,0002009587,285,000 79.1%7.75% 5.20%6/30/2008 2,806,222,000 2,218,937,0002008578,773,000 77.4%7.75% 5.20%6/30/2007 2,555,504,000 1,976,731,0002007
68

Public Retirement Systems Annual Report — Fiscal Year 2011-12San Mateo County Employees' Retirement Association — (Continued)
Summary of Employer Contributions
UAAL as aPercentage of ARCAnnual RequiredRecognizedFiscal Year Contributions (ARC) Made Percentage of ACP
Contribution Annual CoveredPayroll (ACP)
2012 $ 150,949,761 $ 150,949,761 100 $ 427,649,539 225% %2011 150,474,872 150,474,872 100 432,540,974 195% %2010 106,265,329 106,265,329 100 437,130,219 210% %2009 106,123,055 106,123,055 100 445,151,712 242% %2008 105,339,570 105,339,570 100 424,586,435 138% %2007 100,549,570 100,549,570 100 416,069,697 139% %
Contribution Rates as a Percentage of Covered Payroll
GeneralI II
SafetyI IIIII IV V VI IIIEmployer - Recommended by Actuary:
Normal CostUAAL AmortizationTotal Rates Recommended by Actuary
Total Rates Adopted by BoardPrior Year Rates
Employee Rates Adopted by Board:Age 25Age 35Age 45Single Rate
29.44
29.44
29.34
29.34
74.23
74.23
47.18
47.18
% % % %
%
%
%
%
%
%
%
%
%%%
%%%
%%%
%%%
% % % %
%
%
%
%
%%%
% %
%
%%%
26.20 28.21 27.38 —
26.20 28.21 27.38 —
%
%
%%%
%
53.96
53.96
11.1818.26
10.8318.51
7.8118.39
6.037.228.67—
6.037.228.67—
— — — —
9.7918.42
5.786.918.26—
8.9618.42
6.067.268.71—
— —
— — — —
22.9351.30
8.169.78
11.52—
23.2523.93
6.537.839.21—
16.0137.95
8.5210.2211.80
—
%%%%%
%%%%%
%%%%%
%%%%%
%%%%%
%%%%%
%%%%%
%%%%%
%%%%%
6/30/2011 29.44 29.34 26.20 28.20 48.31 46.03 76.20 72.25 70.096/30/2010 20.51 20.82 17.56 19.63 37.68 35.03 50.30 47.77 45.486/30/2009 20.04 20.50 17.04 19.24 41.42 37.01 52.55 50.46 48.046/30/2008 21.06 21.46 17.63 19.88 48.36 38.59 53.53 51.68 49.426/30/2007 21.30 21.56 17.97 20.16 42.00 39.35 55.34 53.38 43.39
(1)
% % % % % % % % %
Retirement Benefit Policies
GeneralI II
SafetyI IIIII IV V VI III
5010
Eligibility:AgeYears of ServiceAge
Age
Age
Years of Service
Years of Service
Years of Service
Years of Service Regardless of AgeAge Regardless of Service 70
30
5010
70
55106510
5010
70
5010
7030 30 30
5010
5010
5010
20 20 20
Final Average Salary:Position Last HeldHighest Year(s) AverageFinal Year(s) Average
1—
1—
3—
3—
3—
——
1—
1—
1—
Compensation at Time of Retirement
OtherNone
2%2% 3%3%4%5%Maximum Annual IncreaseYYYYYYYIndex to Consumer Price Index
3%
Index to Active Member IncreaseGranted Position Last HeldCost of Living:
Percent Per Year of Service: Age50556065
1.481.952.442.61
1.481.952.442.61
— 0.781.222.00
1.481.952.442.61
1.181.491.922.43
— — — —
3.003.003.003.00
3.003.003.003.00
3.003.003.003.00
S SS SI SSocial Security Coverage: SS
Non-Service Disability - Per year (%) and Maximum - Based on formula if years of service are greater than 24 years. Service Disability - Maximum (%) - Service Retirement would be higher.
Benefit Comments:
Non-Service Disability - Per Year - Maximum
Service Disability - Per Year - Maximum
Disability Benefits as a Percentage ofFinal Average Salary (FAS):
— 33 %
— 33 %
— —
— 33 %
— 33 %
— —
— 33 %
— 33 %
— 33 %
— 50 %
— 50 %
— —
— 50 %
— 50 %
— —
— 50 %
— 50 %
— 50 %
69

Public Retirement Systems Annual Report — Fiscal Year 2011-12San Mateo County Employees' Retirement Association — (Continued)
Comments:The county updated reporting structure for the membership. General Tier V is for General Plan 5. Safety Tier I consists of Safety 1 and Safety 2. Safety Tier II consists of Probation 1 and Probation 2. Safety Tier III is a combination of Safety 4, 5 , 6 and Probation 4, 5, and 6.
Footnote:
(1) In addition to basic employee rates, employees also make additional cost-sharing contributions.
A portion of some of the member contributions rates is picked up by the county and may or may not be considered part of the member's contribution account for refund purposes.
70

Public Retirement Systems Annual Report — Fiscal Year 2011-12Santa Barbara County Employees' Retirement System
Cost-Sharing Multiple-Employer Plan
SurvivorsNon-ServiceServiceRetiredVested MembersNon-VestedVestedMembershipActive Inactive Service Disabled
Total Status
23 — 41 1,007 36 24 28General - Tier 1 1,159 Closed
22 — 12 237 79 6 12Safety - Tier 1 368 Closed
20 — 17 49 — — —2 86 Closed
2 — 1 23 1 — 1 28 Closed
2,686 764 633 1,281 34 33 243 5,455 Open
803 152 87 445 33 4 8 1,532 Open
22 — 8 31 — — 14 62 Open
29 — 4 6 — — —5 39 Open
3,607Totals 916 803 3,079 183 67 74 8,729
Other Investment Revenues
Contributions
AssetsCash and Short-Term InvestmentsReceivables
InvestmentsOther
Investments, at Fair ValueU.S. Government ObligationsInternational BondsMunicipal BondsDomestic Corporate BondsDomestic Stocks
Total Assets
Mortgages
Accounts PayableInvestment Purchases PayableAccrued ExpensesOther Current Liabilities
Total Liabilities
International Stocks
Statement of Plan Net Assets
Net Assets Available for Benefits
LiabilitiesTotal Additions
InterestDividends
Net Appreciation (Depreciation)in Fair Value of Investments
$ 2,304,771,581
Real EstateVenture CapitalOther
Investments
$ 289,621,316
$ 2,015,150,265
$ 54,953,317
$ 161,868,246
Administration ExpensesOther Expenses
Total Deductions
Net Increase (Decrease) In Plan Assets
Beginning of the Year Net Assets Held
$ 118,620,901
$ 43,247,345
as of June 30, 2012 for Period Ending June 30, 2012
$ 2,015,150,265
83,172,638149,789,382
4,610,356466,792,497666,458,319239,038,403
—258,032,147119,762,537196,897,719
6,419,67058,829,193
15,403
$ 517,28792,206,310
—196,897,719
25,398,97419,100,099
)(441,462360,526
Other Revenues 223,470
4,023,062—
$ 1,971,902,920
Fixed Assets Net of Accumulated DepreciationOther Assets
——
in Trust for Pension Benefits
End of the Year Net Assets Heldin Trust for Pension Benefits
Investment Expenses
Adjustments —
Actuarial Cost Method:
Total UAAL Amortization Method:
Total UAAL Amortization Period: 17
17Years Remaining in Total UAAL Amortization Period:
AdditionsContributions
Employer -
Employee -
Other -
GeneralSafetyCombined
CombinedSafetyGeneral
CombinedSafetyGeneral
$ 69,143,08839,621,006
—
—
—
11,273,4113,251,216
——
DeductionsBenefit Payments
Service Retirement -
Disability -
Other -
Member Refunds -
General
CombinedSafetyGeneralCombinedSafety
CombinedSafetyGeneral
CombinedSafetyGeneral
$ ——
105,977,455——
7,548,534—————
1,071,850
Entry Age
—Year in Which the Total Unfunded Actuarial Liability is Expected to be Fully Amortized:
)(6,062,082
Level Percentage of Projected Covered Payroll
Statement of Changes in Plan Net Assets
Funded
Unfunded
Actuarial ValueActuarial
SalaryInterestValuationActuary: Milliman
Summary of Funding Position
of AssetsDate Rate Scale Liability Liability RatioAccrued
ActuarialAccruedFiscal
Year$ 827,743,000 71.2%7.75% 7.25% 6/30/2012 $ 2,874,384,000 $ 2,046,641,0002012
741,954,146 73.0%7.75% 7.25%6/30/2011 2,749,813,302 2,007,859,1562011688,917,681 73.7%7.75% 7.25%6/30/2010 2,616,146,856 1,927,229,1752010558,129,299 75.3%8.16% 4.50%6/30/2009 2,263,862,319 1,705,733,0202009244,400,000 88.6%8.16% 4.50%6/30/2008 2,135,900,000 1,891,500,0002008336,496,000 82.8%8.16% 4.50%6/30/2007 1,956,834,000 1,620,338,0002007
71

Public Retirement Systems Annual Report — Fiscal Year 2011-12Santa Barbara County Employees' Retirement System — (Continued)
Summary of Employer Contributions
UAAL as aPercentage of ARCAnnual RequiredRecognizedFiscal Year Contributions (ARC) Made Percentage of ACP
Contribution Annual CoveredPayroll (ACP)
2012 $ 108,764,094 $ 108,764,094 100 $ 302,876,753 273% %2011 94,436,686 94,436,686 100 306,528,285 242% %2010 84,647,133 84,647,133 100 307,506,129 224% %2009 75,827,000 75,902,140 100 307,381,758 182% %2008 69,460,616 69,460,616 100 307,263,504 80% %2007 63,395,296 63,395,296 100 294,163,067 114% %
Contribution Rates as a Percentage of Covered Payroll
GeneralI II
SafetyI IIIII IV V VI IIIEmployer - Recommended by Actuary:
Normal CostUAAL AmortizationTotal Rates Recommended by Actuary
Total Rates Adopted by BoardPrior Year Rates
Employee Rates Adopted by Board:Age 25Age 35Age 45Single Rate
—
—
18.93
18.93
—
—
—
—
% % % %
% %
%
% %
% % % %
%
%
%%%
%
%
%%%
% %
%
%%%
29.48 34.27 31.46 —
29.76 34.27 31.46 —
%
%
%%%
%
46.76
46.32
— —
2.8416.09
13.3916.09
— — — —
— — — —
2.903.604.40—
15.8618.41
3.434.225.12—
13.0518.41
6.868.45
10.23—
— —
— — — —
— —
— — — —
— —
— — — —
23.8122.95
5.356.487.75—
%%%%%
%%%%%
%%%%%
%%%%%
%%%%%
6/30/2011 — 15.70 24.93 30.39 28.86 — — — 38.636/30/2010 — 11.74 21.06 25.82 24.59 — — — 26.756/30/2009 — 13.58 22.55 27.23 26.04 — — — 31.766/30/2008 — 10.81 17.26 19.93 20.45 — — — 34.046/30/2007 — 8.99 15.51 18.36 18.27 — — — 33.73
(1) (2)
(3) (4)
% % % % % % % % %
Retirement Benefit Policies
GeneralI II
SafetyI IIIII IV V VI III
Eligibility:AgeYears of ServiceAge
Age
Age
Years of Service
Years of Service
Years of Service
Years of Service Regardless of AgeAge Regardless of Service
5510
5010
70
5010
70
5010
7030 30 30
Final Average Salary:Position Last HeldHighest Year(s) AverageFinal Year(s) Average
——
——
—1
—1
—1
——
——
——
——
Compensation at Time of Retirement
OtherYNone
3%3%3%Maximum Annual IncreaseYYYIndex to Consumer Price IndexNNNIndex to Active Member IncreaseNNNGranted Position Last Held
Cost of Living:
Percent Per Year of Service: Age50556065
— — — —
— — — —
0.010.010.020.02
0.010.010.020.02
0.010.010.020.02
— — — —
— — — —
— — — —
— — — —
SSSSocial Security Coverage: I
Benefit Comments:
Non-Service Disability - Per Year - Maximum
Service Disability - Per Year - Maximum
Disability Benefits as a Percentage ofFinal Average Salary (FAS):
— —
33 %100 %
33 %100 %
33 %100 %
33 %100 %
— —
— —
— —
33 %100 %
— —
50 %100 %
50 %100 %
50 %100 %
50 %100 %
— —
— —
— —
50 %100 %
72

Public Retirement Systems Annual Report — Fiscal Year 2011-12Santa Barbara County Employees' Retirement System — (Continued)
Comments:The Santa Barbara County Employees' Retirement System has 15 retirement plans. Current year data will be reflected as follows: General Tier I = General Plan (GP) 1General Tier II = GP2General Tier III = GP5A through GP5CGeneral Tier IV = Air Pollution Control District (APCD) Plan 1General Tier V = APCD Plan 2Safety Tier I = Safety Plan (SP) 1Safety Tier II = SP2Safety Tier III = SP4A through SP4D, SP6A and SP6B
Footnote:
(1) General Tier III Includes GP5A through GP5C. The rates shown are for GP5A. Employer rates for GP5B and GP5C are 29.27% and 30.54%, respectively.
(2) Safety Tier III includes SP4A through SP4D, SP6A and SP6B. The rates shown are for SP4A. Employer rates for SP4B, SP4C, SP6A, and SP6B are 41.93%, 45.68%, 48.39%, and 48.84%, respectively.
(3) General Tier III Includes GP5A through GP5C. The rates shown are for GP5A. Employee rates for GP5B are 5.80% for age 25, 7.20% for age 35, and 8.80% for age 45. Employee rates for GP5C are 2.79% for age 25, 3.46% for age 35, and 4.22% for age 45.
(4) Safety Tier III includes SP4A through SP4D, SP6A and SP6B. The rates shown are for SP4A and SP6A. Employee rates for SP4B are 10.69% for age 25, 12.96% for age 35, and 15.51% for age 45. Employee rates for SP4C and SP6B are 5.13% for age 25, 6.20% for age 35, and 7.39% for age 45.
73

Public Retirement Systems Annual Report — Fiscal Year 2011-12Sonoma County Employees' Retirement Association
Cost-Sharing Multiple-Employer Plan
SurvivorsNon-ServiceServiceRetiredVested MembersNon-VestedVestedMembershipActive Inactive Service Disabled
Total Status
2,154 746 435 2,624 256 102 372General - Tier 1 6,689 Open
550 137 100 348 232 14 73Safety - Tier 1 1,454 Open
2,704Totals 883 535 2,972 488 116 445 8,143
Other Investment Revenues
Contributions
AssetsCash and Short-Term InvestmentsReceivables
InvestmentsOther
Investments, at Fair ValueU.S. Government ObligationsInternational BondsMunicipal BondsDomestic Corporate BondsDomestic Stocks
Total Assets
Mortgages
Accounts PayableInvestment Purchases PayableAccrued ExpensesOther Current Liabilities
Total Liabilities
International Stocks
Statement of Plan Net Assets
Net Assets Available for Benefits
LiabilitiesTotal Additions
InterestDividends
Net Appreciation (Depreciation)in Fair Value of Investments
$ 1,998,554,728
Real EstateVenture CapitalOther
Investments
$ 288,769,383
$ 1,709,785,345
$ 92,205,566
$ 75,561,283
Administration ExpensesOther Expenses
Total Deductions
Net Increase (Decrease) In Plan Assets
Beginning of the Year Net Assets Held
$ 118,594,324
$ )(43,033,041
as of December 31, 2011 for Period Ending December 31, 2011
$ 1,709,785,345
176,652,33533,901,751
—175,509,272596,506,978454,481,452
—288,235,894
—101,544,631
236,54474,585,541
—
$ 3,771,688224,467,212
—60,530,483
12,104,15822,883,587
)(23,140,3137,352,581
Other Revenues —
2,880,484794,712
$ 1,752,818,386
Fixed Assets Net of Accumulated DepreciationOther Assets
4,602,47092,294
in Trust for Pension Benefits
End of the Year Net Assets Heldin Trust for Pension Benefits
Investment Expenses
Adjustments —
Actuarial Cost Method:
Total UAAL Amortization Method: (1)
Total UAAL Amortization Period: —
—Years Remaining in Total UAAL Amortization Period:
AdditionsContributions
Employer -
Employee -
Other -
GeneralSafetyCombined
CombinedSafetyGeneral
CombinedSafetyGeneral
$ 23,780,68411,929,972
—
—
—
27,827,3888,116,434
——
DeductionsBenefit Payments
Service Retirement -
Disability -
Other -
Member Refunds -
General
CombinedSafetyGeneralCombinedSafety
CombinedSafetyGeneral
CombinedSafetyGeneral
$ 78,889,37918,554,953
—7,269,0008,253,000
—33,914
——
1,422,563496,319
—
Entry Age
—Year in Which the Total Unfunded Actuarial Liability is Expected to be Fully Amortized:
)(15,293,208
20 years layeredOther
Statement of Changes in Plan Net Assets
Funded
Unfunded
Actuarial ValueActuarial
SalaryInterestValuationActuary: The Segal Company
Summary of Funding Position
of AssetsDate Rate Scale Liability Liability RatioAccrued
ActuarialAccruedFiscal
Year$ 353,403,000 84.1%7.75% 4.75% 12/31/2011 $ 2,220,520,000 $ 1,867,117,0002012
248,586,000 88.4%7.75% 4.75%12/31/2010 2,139,460,000 1,890,874,0002011402,088,000 79.6%8.00% 5.25%12/31/2009 1,967,058,000 1,564,970,0002010301,943,000 83.6%8.00% 5.25%12/31/2008 1,842,404,000 1,540,461,0002009177,351,000 89.3%8.00% 5.25%12/31/2007 1,653,847,000 1,476,496,0002008139,414,000 90.8%8.00% 5.25%12/31/2006 1,509,083,000 1,369,669,0002007
Summary of Employer Contributions
UAAL as aPercentage of ARCAnnual RequiredRecognizedFiscal Year Contributions (ARC) Made Percentage of ACP
Contribution Annual CoveredPayroll (ACP)
2012 $ 35,710,656 $ 35,710,656 100 $ 308,643,667 115% %2011 48,426,000 337,760,770 697 323,600,808 77% %2010 47,577,000 47,576,576 100 322,483,489 125% %2009 38,553,000 38,552,971 100 334,390,573 90% %2008 34,283,000 34,282,865 100 292,771,517 61% %2007 29,391,000 29,390,771 100 273,548,409 51% %
74

Public Retirement Systems Annual Report — Fiscal Year 2011-12Sonoma County Employees' Retirement Association — (Continued)
Contribution Rates as a Percentage of Covered Payroll
GeneralI II
SafetyI IIIII IV V VI IIIEmployer - Recommended by Actuary:
Normal CostUAAL AmortizationTotal Rates Recommended by Actuary
Total Rates Adopted by BoardPrior Year Rates
Employee Rates Adopted by Board:Age 25Age 35Age 45Single Rate
11.92
11.57
—
—
18.79
18.89
—
—
% % % %
%
%
% %
%
%
%%%
%%%
% % % %
% % % %— — — —
— — — —
%
%—
—
9.392.53
— —
— —
10.1011.4713.14
—
— — — —
— — — —
— —
— — — —
— —
— — — —
— —
— — — —
15.783.01
11.2912.7014.59
—
— —
— — — —
— —
— — — —
%%%%%
%%%%%
12/31/2010 15.57 — — — — — 23.89 — — 12/31/2009 14.15 — — — — — 23.18 — — 12/31/2008 11.52 — — — — — 20.12 — — 12/31/2007 10.54 — — — — — 19.14 — — 12/31/2006 9.45 — — — — — 18.03 — —
% % % % % % % % %
Retirement Benefit Policies
GeneralI II
SafetyI IIIII IV V VI III
5010
Eligibility:AgeYears of ServiceAge
Age
Age
Years of Service
Years of Service
Years of Service
Years of Service Regardless of AgeAge Regardless of Service 70
30
5010
7020
Final Average Salary:Position Last HeldHighest Year(s) AverageFinal Year(s) Average
1—Y
——
——
——
——
——
1—Y
——
——
Compensation at Time of Retirement
OtherYYNone
Maximum Annual IncreaseIndex to Consumer Price IndexIndex to Active Member IncreaseGranted Position Last HeldCost of Living:
Percent Per Year of Service: Age50556065
2.002.503.003.00
— — — —
— — — —
— — — —
— — — —
— — — —
3.003.003.003.00
— — — —
— — — —
ISocial Security Coverage: I
General members retire under the 3% at 60 benefit forumla; Safety members retire under the 3% at 50 benefit formulaBenefit Comments:
Non-Service Disability - Per Year - Maximum
Service Disability - Per Year - Maximum
Disability Benefits as a Percentage ofFinal Average Salary (FAS):
— 33 %
— —
— —
— —
— —
— —
— 33 %
— —
— —
— 50 %
— —
— —
— —
— —
— —
— 50 %
— —
— —
Footnote:
(1) The outstanding balance of the December 31, 2007 unfunded actuarial accrued liablity (UAAL) and any new UAAL established on each subsequent actuarial valuation after the December 31, 2007 valuation is amortized over separate 20-year declining periods. The UAAL established as a result of including as pensionable salary a cash allowance is amortized over a 20-year declining period with 16 years remaining as of the December 31, 2011.
75

Public Retirement Systems Annual Report — Fiscal Year 2011-12Stanislaus County Employees' Retirement Association
Cost-Sharing Multiple-Employer Plan
SurvivorsNon-ServiceServiceRetiredVested MembersNon-VestedVestedMembershipActive Inactive Service Disabled
Total Status
1 — 53 934 85 — 12General - Tier 1 1,085 Closed
39 — 47 156 104 — 5Safety - Tier 1 351 Closed
248 — 248 290 92 — 82 886 Open
3 — 1 73 6 — — 83 Closed
18 — 29 37 2 — —3 86 Closed
613 — 121 110 38 — 4 886 Closed
78 — 5 360 4 — 44 451 Closed
2,868 — 528 737 50 — 125 4,195 Closed
3,868Totals — 1,032 2,697 381 — 45 8,023
Other Investment Revenues
Contributions
AssetsCash and Short-Term InvestmentsReceivables
InvestmentsOther
Investments, at Fair ValueU.S. Government ObligationsInternational BondsMunicipal BondsDomestic Corporate BondsDomestic Stocks
Total Assets
Mortgages
Accounts PayableInvestment Purchases PayableAccrued ExpensesOther Current Liabilities
Total Liabilities
International Stocks
Statement of Plan Net Assets
Net Assets Available for Benefits
LiabilitiesTotal Additions
InterestDividends
Net Appreciation (Depreciation)in Fair Value of Investments
$ 1,550,576,831
Real EstateVenture CapitalOther
Investments
$ 164,401,585
$ 1,386,175,246
$ 39,960,025
$ 51,564,081
Administration ExpensesOther Expenses
Total Deductions
Net Increase (Decrease) In Plan Assets
Beginning of the Year Net Assets Held
$ 84,134,781
$ )(32,570,700
as of June 30, 2012 for Period Ending June 30, 2012
$ 1,386,175,246
268,902,8994,448,172
31,022,263211,121,622586,541,102224,687,670
—19,736,261
—112,214,531
1,814,17646,362,051
5,220
$ 8,241,98839,036,066
—117,123,531
24,194,80013,239,250
)(29,308,903751,128
Other Revenues —
2,144,748—
$ 1,418,745,946
Fixed Assets Net of Accumulated DepreciationOther Assets
3,760,839—
in Trust for Pension Benefits
End of the Year Net Assets Heldin Trust for Pension Benefits
Investment Expenses
Adjustments —
Actuarial Cost Method:
Total UAAL Amortization Method:
Total UAAL Amortization Period: 25
25Years Remaining in Total UAAL Amortization Period:
AdditionsContributions
Employer -
Employee -
Other -
GeneralSafetyCombined
CombinedSafetyGeneral
CombinedSafetyGeneral
$ ——
27,314,032
20,525,295
—
——
——
DeductionsBenefit Payments
Service Retirement -
Disability -
Other -
Member Refunds -
General
CombinedSafetyGeneralCombinedSafety
CombinedSafetyGeneral
CombinedSafetyGeneral
$ ——
70,618,709——
7,019,901——
2,518,612——
1,832,811
Entry Age
—Year in Which the Total Unfunded Actuarial Liability is Expected to be Fully Amortized:
)(5,151,521
Level Percentage of Projected Covered Payroll
Statement of Changes in Plan Net Assets
Funded
Unfunded
Actuarial ValueActuarial
SalaryInterestValuationActuary: EFI Actuaries
Summary of Funding Position
of AssetsDate Rate Scale Liability Liability RatioAccrued
ActuarialAccruedFiscal
Year$ 412,022,565 76.3%8.00% 4.50%6/30/2010 $ 1,737,823,813 $ 1,325,801,2482012
412,023,000 76.3%8.00% 4.50%6/30/2010 1,737,824,000 1,325,801,0002011481,949,000 70.9%8.00% 5.00%6/30/2009 1,653,716,000 1,171,767,0002010231,657,000 85.0%8.00% 5.00%6/30/2008 1,548,824,000 1,317,167,0002009
40,856,000 96.6%8.00% 5.00%6/30/2006 1,194,904,000 1,154,048,000200840,856,000 96.6%8.00% 5.00%6/30/2006 1,194,904,000 1,154,048,0002007
76

Public Retirement Systems Annual Report — Fiscal Year 2011-12Stanislaus County Employees' Retirement Association — (Continued)
Summary of Employer Contributions
UAAL as aPercentage of ARCAnnual RequiredRecognizedFiscal Year Contributions (ARC) Made Percentage of ACP
Contribution Annual CoveredPayroll (ACP)
2012 $ 47,657,000 $ 27,314,032 57 $ 231,538,198 178% %2011 31,814,194 26,256,729 83 231,538,198 178% %2010 21,814,194 21,814,194 100 248,316,424 194% %2009 22,555,000 23,410,965 104 242,009,399 96% %2008 24,421,977 22,555,416 92 219,768,000 19% %2007 24,421,977 32,562,514 133 219,768,000 19% %
Contribution Rates as a Percentage of Covered Payroll
GeneralI II
SafetyI IIIII IV V VI IIIEmployer - Recommended by Actuary:
Normal CostUAAL AmortizationTotal Rates Recommended by Actuary
Total Rates Adopted by BoardPrior Year Rates
Employee Rates Adopted by Board:Age 25Age 35Age 45Single Rate
3.90
3.90
9.63
9.63
—
—
17.63
17.63
% % % %
%
%
%
%
% %
%
%%%
%%%
%%%
% % % %
%
%
%
%
%%%
% %
%
%%%
6.44 9.70 10.74 —
6.44 9.70 10.74 —
%
%—
—
0.393.51
5.464.17
2.274.17
4.845.606.65—
6.327.278.76—
— — — —
5.534.17
4.645.676.64—
6.574.17
7.549.28
10.86—
— —
— — — —
— —
— — — —
7.809.83
10.5012.6014.58
—
— —
— — — —
%%%%%
%%%%%
%%%%%
%%%%%
%%%%%
% %%%%%
%%%%%
6/30/2011 4.20 6.68 5.88 9.47 10.09 — 15.36 6.13 18.856/30/2010 10.73 10.70 7.07 10.73 11.12 — — 9.00 20.476/30/2009 7.52 7.20 3.94 7.52 7.20 — — 19.41 17.326/30/2008 7.52 7.20 3.94 7.52 7.20 — — 19.41 17.326/30/2007 8.72 9.10 5.47 8.72 9.10 — — 22.52 20.52
% % % % % % % % %
Retirement Benefit Policies
GeneralI II
SafetyI IIIII IV V VI III
505
Eligibility:AgeYears of ServiceAge
Age
Age
Years of Service
Years of Service
Years of Service
Years of Service Regardless of AgeAge Regardless of Service 70
30
505
70
505
70
505
7030 30 30
505
70
505
7020 20
Final Average Salary:Position Last HeldHighest Year(s) AverageFinal Year(s) Average
1—
3—
——
1—
1—
——
1—
3—
——
Compensation at Time of Retirement
OtherNone
3%3% 3%3%3%Maximum Annual IncreaseYYYYYYIndex to Consumer Price Index
3%
Index to Active Member IncreaseGranted Position Last HeldCost of Living:
Percent Per Year of Service: Age50556065
1.341.772.342.62
1.181.491.922.43
— — — —
1.481.952.442.62
1.481.952.442.62
— — — —
2.002.622.62—
2.002.622.62—
— — — —
I II ISocial Security Coverage: II
For members integrated with Social Security, the benefit is reduced by 1/3 of the Percent Per Year of Service times the first $350 of monthly final average salary per year of service credited after January 1, 1956.Members with 5 yrs. of service, regardless of age, are eligible for non-service connected disability. The benefit is usually 1/3 of final average salary (FAS) and for service connected 50% of FAS (except plan 3 for both)
Benefit Comments:
Non-Service Disability - Per Year - Maximum
Service Disability - Per Year - Maximum
Disability Benefits as a Percentage ofFinal Average Salary (FAS):
— 33 %
— 33 %
— —
— 33 %
— 33 %
— —
— 33 %
— 33 %
— —
— 50 %
— 50 %
— —
— 50 %
— 50 %
— —
— 50 %
— 50 %
— —
77

Public Retirement Systems Annual Report — Fiscal Year 2011-12Stanislaus County Employees' Retirement Association — (Continued)
Comments:Stanislaus has nine tier plans. General plans 1, 2, 3, 4, 5 is reflected in General Tiers I, II, III, IV, V, respectively. Safety Plan 1 and 2 are combined in Safety Tier I. Safety Plan 4 is shown in Safety Tier II and Safety Plan 5 is shown in Safety Tier III.
Effective January 1, 2011, General Tier 5 was closed and General Tier 2 was re-opened for all new hires for Stanislaus County.
78

Public Retirement Systems Annual Report — Fiscal Year 2011-12Tulare County Employees' Retirement Association
Agent Multiple-Employer Plan
SurvivorsNon-ServiceServiceRetiredVested MembersNon-VestedVestedMembershipActive Inactive Service Disabled
Total Status
68 — 26 790 18 13 185General - Tier 1 1,100 Open
6 — 2 142 31 — 36Safety - Tier 1 217 Open
2,231 1,143 1,507 840 56 76 802 5,933 Open
572 271 207 83 50 9 15 1,207 Open
2,877Totals 1,414 1,742 1,855 155 98 316 8,457
Other Investment Revenues
Contributions
AssetsCash and Short-Term InvestmentsReceivables
InvestmentsOther
Investments, at Fair ValueU.S. Government ObligationsInternational BondsMunicipal BondsDomestic Corporate BondsDomestic Stocks
Total Assets
Mortgages
Accounts PayableInvestment Purchases PayableAccrued ExpensesOther Current Liabilities
Total Liabilities
International Stocks
Statement of Plan Net Assets
Net Assets Available for Benefits
LiabilitiesTotal Additions
InterestDividends
Net Appreciation (Depreciation)in Fair Value of Investments
$ 1,090,649,681
Real EstateVenture CapitalOther
Investments
$ 119,054,194
$ 971,595,487
$ 62,615,626
$ 29,628,223
Administration ExpensesOther Expenses
Total Deductions
Net Increase (Decrease) In Plan Assets
Beginning of the Year Net Assets Held
$ 60,409,351
$ )(30,781,128
as of June 30, 2012 for Period Ending June 30, 2012
$ 971,595,487
121,663,80241,380,795
2,130,729102,996,367264,948,040232,428,022
—67,852,764
—158,612,840
754,77532,335,407
63
$ 2,700,08664,073,484
—52,280,624
8,916,0186,276,799
)(28,684,6957,127,992
Other Revenues 55,315
1,720,190—
$ 1,002,376,615
Fixed Assets Net of Accumulated DepreciationOther Assets
1,050,5551,879,896
in Trust for Pension Benefits
End of the Year Net Assets Heldin Trust for Pension Benefits
Investment Expenses
Adjustments —
Actuarial Cost Method:
Total UAAL Amortization Method: (1)
Total UAAL Amortization Period: 15
15Years Remaining in Total UAAL Amortization Period:
AdditionsContributions
Employer -
Employee -
Other -
GeneralSafetyCombined
CombinedSafetyGeneral
CombinedSafetyGeneral
$ ——
25,257,124
16,470,845
—
——
——
DeductionsBenefit Payments
Service Retirement -
Disability -
Other -
Member Refunds -
General
CombinedSafetyGeneralCombinedSafety
CombinedSafetyGeneral
CombinedSafetyGeneral
$ 32,284,6768,605,273
—3,739,7822,690,182
—5,767,2101,247,851
———
4,354,187
Entry Age
—Year in Which the Total Unfunded Actuarial Liability is Expected to be Fully Amortized:
)(5,791,175
Level Percentage of Projected Covered Payroll
Statement of Changes in Plan Net Assets
Funded
Unfunded
Actuarial ValueActuarial
SalaryInterestValuationActuary: Buck Consultants
Summary of Funding Position
of AssetsDate Rate Scale Liability Liability RatioAccrued
ActuarialAccruedFiscal
Year$ 86,570,284 91.6%7.90% 5.50% 6/30/2010 $ 1,033,210,615 $ 946,640,3312012
77,568,108 92.2%7.90% 5.50%6/30/2009 996,746,659 919,178,551201167,363,370 92.9%7.90% 5.50%6/30/2008 946,414,313 879,050,943201045,062,261 94.7%7.90% 5.50%6/30/2007 846,029,756 800,967,495200962,945,061 92.1%7.90% 5.50%6/30/2006 792,843,643 729,898,582200862,945,061 92.1%7.90% 5.50%6/30/2006 792,843,643 729,898,5822007
Summary of Employer Contributions
UAAL as aPercentage of ARCAnnual RequiredRecognizedFiscal Year Contributions (ARC) Made Percentage of ACP
Contribution Annual CoveredPayroll (ACP)
2012 $ 25,257,124 $ 25,257,124 100 $ 217,811,354 40% %2011 23,434,239 23,434,239 100 227,305,938 34% %2010 25,339,346 25,339,346 100 226,836,534 30% %2009 22,430,788 22,430,788 100 204,802,798 22% %2008 22,691,963 22,691,963 100 186,948,702 34% %2007 17,975,005 17,975,005 100 186,948,702 34% %
79

Public Retirement Systems Annual Report — Fiscal Year 2011-12Tulare County Employees' Retirement Association — (Continued)
Contribution Rates as a Percentage of Covered Payroll
GeneralI II
SafetyI IIIII IV V VI IIIEmployer - Recommended by Actuary:
Normal CostUAAL AmortizationTotal Rates Recommended by Actuary
Total Rates Adopted by BoardPrior Year Rates
Employee Rates Adopted by Board:Age 25Age 35Age 45Single Rate
10.70
10.70
9.45
9.45
28.77
28.77
21.80
21.80
% % % %
%
%
%
%
%
%
%
%
%%%
%%%
%%%
%%%
% % % %
% % % %— — — —
— — — —
%
%—
—
7.752.95
6.502.95
— —
3.904.785.79—
6.387.829.35—
— — — —
— —
— — — —
— —
— — — —
— —
— — — —
20.468.31
5.456.286.79—
13.498.31
8.9210.1110.94
—
— —
— — — —
%%%%%
%%%%%
%%%%%
%%%%%
6/30/2011 8.82 9.38 — — — — 23.15 14.98 — 6/30/2010 8.47 9.47 — — — — 25.31 18.37 — 6/30/2009 9.44 8.94 — — — — 20.22 14.50 — 6/30/2008 10.22 9.61 — — — — 23.36 16.98 — 6/30/2007 9.20 8.73 — — — — 22.22 15.50 —
% % % % % % % % %
Retirement Benefit Policies
GeneralI II
SafetyI IIIII IV V VI III
5010
Eligibility:AgeYears of ServiceAge
Age
Age
Years of Service
Years of Service
Years of Service
Years of Service Regardless of AgeAge Regardless of Service 70
30
5010
7030
5010
70
5010
7020 20
Final Average Salary:Position Last HeldHighest Year(s) AverageFinal Year(s) Average
1—
3—
——
——
——
——
1—
3—
——
Compensation at Time of Retirement
OtherNone
2%3%3%Maximum Annual IncreaseYYYYIndex to Consumer Price Index
2%
Index to Active Member IncreaseGranted Position Last HeldCost of Living:
Percent Per Year of Service: Age50556065
1.341.772.342.62
1.341.772.342.62
— — — —
— — — —
— — — —
— — — —
2.002.622.622.62
2.002.622.622.62
— — — —
I ISocial Security Coverage: II
Defined BenefitNon-Service disability is 20% of Final Average Salary (FAS), plus an additional 2% of FAS for each full year of service in excess of 5 years to a maximum of 40%.
Service Disability is 50% of Final Compensation.
Benefit Comments:
Non-Service Disability - Per Year - Maximum
Service Disability - Per Year - Maximum
Disability Benefits as a Percentage ofFinal Average Salary (FAS):
— 40 %
— 40 %
— —
— —
— —
— —
— 40 %
— 40 %
— —
— 50 %
— 50 %
— —
— —
— —
— —
— 50 %
— 50 %
— —
Footnote:
(1) The UAAL is amortized over 15 equal installments on a rolling, level percentage of pay.
80

Public Retirement Systems Annual Report — Fiscal Year 2011-12Ventura County Employees' Retirement Association
Cost-Sharing Multiple-Employer Plan
SurvivorsNon-ServiceServiceRetiredVested MembersNon-VestedVestedMembershipActive Inactive Service Disabled
Total Status
134 19 63 1,558 64 63 366General - Tier 1 2,267 Closed
1,221 269 270 615 354 24 197Safety - Tier 1 2,950 Open
4,382 1,994 1,828 1,883 170 153 2112 10,621 Open
5,737Totals 2,282 2,161 4,056 588 240 774 15,838
Other Investment Revenues
Contributions
AssetsCash and Short-Term InvestmentsReceivables
InvestmentsOther
Investments, at Fair ValueU.S. Government ObligationsInternational BondsMunicipal BondsDomestic Corporate BondsDomestic Stocks
Total Assets
Mortgages
Accounts PayableInvestment Purchases PayableAccrued ExpensesOther Current Liabilities
Total Liabilities
International Stocks
Statement of Plan Net Assets
Net Assets Available for Benefits
LiabilitiesTotal Additions
InterestDividends
Net Appreciation (Depreciation)in Fair Value of Investments
$ 3,374,487,742
Real EstateVenture CapitalOther
Investments
$ 164,870,536
$ 3,209,617,206
$ 118,800,271
$ 235,942,644
Administration ExpensesOther Expenses
Total Deductions
Net Increase (Decrease) In Plan Assets
Beginning of the Year Net Assets Held
$ 198,650,501
$ 37,292,143
as of June 30, 2012 for Period Ending June 30, 2012
$ 3,209,617,206
187,309,09327,030,191
—399,394,828
1,322,170,226648,947,522226,861,926283,239,366
—26,930,163
3,754,11534,706,649
21,685
$ 54,82268,472,851
1,708,04494,634,819
24,446,1774,483,161
17,880,63512,976,070
Other Revenues —
3,535,807—
$ 3,172,325,063
Fixed Assets Net of Accumulated DepreciationOther Assets
686,88694,634,821
in Trust for Pension Benefits
End of the Year Net Assets Heldin Trust for Pension Benefits
Investment Expenses
Adjustments —
Actuarial Cost Method:
Total UAAL Amortization Method: (1)
Total UAAL Amortization Period: 15
15Years Remaining in Total UAAL Amortization Period:
AdditionsContributions
Employer -
Employee -
Other -
GeneralSafetyCombined
CombinedSafetyGeneral
CombinedSafetyGeneral
$ 65,058,38975,714,336
—
—
—
32,277,14512,209,604
——
DeductionsBenefit Payments
Service Retirement -
Disability -
Other -
Member Refunds -
General
CombinedSafetyGeneralCombinedSafety
CombinedSafetyGeneral
CombinedSafetyGeneral
$ 96,889,19249,705,780
—9,584,572
21,807,931—
8,016,6235,327,820
—3,378,753
404,023—
Entry Age
2027Year in Which the Total Unfunded Actuarial Liability is Expected to be Fully Amortized:
)(9,102,873
Level Percentage of Projected Covered Payroll
Statement of Changes in Plan Net Assets
Funded
Unfunded
Actuarial ValueActuarial
SalaryInterestValuationActuary: Paul Angelo/The Segal Company
Summary of Funding Position
of AssetsDate Rate Scale Liability Liability RatioAccrued
ActuarialAccruedFiscal
Year$ 975,867,000 77.7%7.75% 4.50% 6/30/2012 $ 4,373,227,000 $ 3,397,360,0002012
774,964,000 80.6%8.00% 5.00%6/30/2011 3,995,352,000 3,220,388,0002011761,459,000 80.4%8.00% 5.00%6/30/2010 3,877,443,000 3,115,984,0002010573,553,000 84.3%8.00% 5.00%6/30/2009 3,663,701,000 3,090,148,0002009290,048,000 91.3%8.00% 5.00%6/30/2008 3,345,804,000 3,055,756,0002008376,025,000 87.9%8.00% 5.00%6/30/2007 3,112,583,000 2,736,558,0002007
Summary of Employer Contributions
UAAL as aPercentage of ARCAnnual RequiredRecognizedFiscal Year Contributions (ARC) Made Percentage of ACP
Contribution Annual CoveredPayroll (ACP)
2012 $ 132,385,968 $ 140,772,725 106 $ 633,847,360 154% %2011 111,585,000 120,053,545 108 637,037,380 122% %2010 97,324,000 105,702,929 109 654,828,221 116% %2009 105,277,544 113,915,784 108 634,777,892 90% %2008 104,428,648 112,797,726 108 599,173,118 48% %2007 86,454,684 94,327,697 109 551,968,099 68% %
81

Public Retirement Systems Annual Report — Fiscal Year 2011-12Ventura County Employees' Retirement Association — (Continued)
Contribution Rates as a Percentage of Covered Payroll
GeneralI II
SafetyI IIIII IV V VI IIIEmployer - Recommended by Actuary:
Normal CostUAAL AmortizationTotal Rates Recommended by Actuary
Total Rates Adopted by BoardPrior Year Rates
Employee Rates Adopted by Board:Age 25Age 35Age 45Single Rate
114.29
114.29
10.16
10.16
43.86
43.86
—
—
% % % %
%
%
%
%
%
%
%
% % %
% % % %
% % % %— — — —
— — — —
%
%—
—
9.03105.26
7.372.79
— —
— — —
9.34
— — —
5.73
— — — —
— —
— — — —
— —
— — — —
— —
— — — —
16.9926.87
— — —
12.71
— —
— — — —
— —
— — — —
%%%%%
%%%%%
%%%%%
6/30/2011 79.92 8.82 — — — — 37.94 — — 6/30/2010 46.89 7.70 — — — — 31.06 — — 6/30/2009 49.29 8.47 — — — — 32.78 — — 6/30/2008 50.69 9.61 — — — — 35.25 — — 6/30/2007 32.75 9.09 — — — — 32.01 — —
(2)
% % % % % % % % %
Retirement Benefit Policies
GeneralI II
SafetyI IIIII IV V VI III
5010
Eligibility:AgeYears of ServiceAge
Age
Age
Years of Service
Years of Service
Years of Service
Years of Service Regardless of AgeAge Regardless of Service 70
30
5010
7030
5010
7020
Final Average Salary:Position Last HeldHighest Year(s) AverageFinal Year(s) Average
1—
3—
——
——
——
——
1—
——
——
Compensation at Time of Retirement
OtherNone
3%3%Maximum Annual IncreaseYNYIndex to Consumer Price Index
2%
Index to Active Member IncreaseGranted Position Last HeldCost of Living:
Percent Per Year of Service: Age50556065
1.241.672.182.61
1.181.491.922.43
— — — —
— — — —
— — — —
— — — —
2.002.622.62—
— — — —
— — — —
ISocial Security Coverage: NI
Non-service Disability - After 5 years of service, 1.5% per year of service (General) and 1.8% per year of service (Safety). Service Disability - The larger of 50% of final compensation or 100% of service retirement benefit.
Benefit Comments:
Non-Service Disability - Per Year - Maximum
Service Disability - Per Year - Maximum
Disability Benefits as a Percentage ofFinal Average Salary (FAS):
— 33 %
— 33 %
— —
— —
— —
— —
— 33 %
— —
— —
— 50 %
— 50 %
— —
— —
— —
— —
— 50 %
— —
— —
Comments:In addition to actuarially determined employer contributions, the Ventura County Employees' Retirement Association's (VCERA) employers contribute, pursuant to Government Code No. 31581.1, a portion of the required member contributions. These contributions do not become part of the member's accumulated contributions; instead, the contributions vest, pursuant to the law, in the employer advance reserves.
Footnote:
(1) The unfunded actuarial accrued liablity is being recognized over a 15-year rolling period effective June 30, 2004.
(2) The contribution rate increased in the current year because General Tier I has been a closed plan since 2001. As a result, the effects of investment losses or actuarial losses due to demographic data is allocated over a smaller number of members and payroll, resulting in significant variations.
82

DEFINED BENEFIT SYSTEMS
City Systems

This Page Intentionally Left Blank

Public Retirement Systems Annual Report — Fiscal Year 2011-12City of Alameda Police and Fire Pension Plans 1079 and 1082
Single-Employer Plan
SurvivorsNon-ServiceServiceRetiredVested MembersNon-VestedVestedMembershipActive Inactive Service Disabled
Total Status
— — — 7 5 — 18Safety - Tier 1 30 Closed
—Totals — — 7 5 — 18 30
Contributions
AssetsCash and Short-Term InvestmentsReceivables
InvestmentsOther
Investments, at Fair ValueU.S. Government ObligationsInternational BondsMunicipal BondsDomestic Corporate BondsDomestic Stocks
Total Assets
Mortgages
Accounts PayableInvestment Purchases PayableAccrued ExpensesOther Current Liabilities
Total Liabilities
International Stocks
Net Assets Available for Benefits
Liabilities
Total Additions
InterestDividends
Net Appreciation (Depreciation)
Other Investment Revenues in Fair Value of Investments
Statement of Changes in Plan Net Assets
$ 917
Real EstateVenture CapitalOther
$ —
$ 917
$ 917
$ 1,958,576
Administration ExpensesOther Expenses
Total Deductions
Net Increase (Decrease) In Plan Assets
Beginning of the Year Net Assets Held
$ 1,958,136
$ 440
as of June 30, 2012 for Period Ending June 30, 2012
$ 917
——————————
———
$ ————
——
——
Other Revenues —
15,997—
$ 477
Fixed Assets Net of Accumulated DepreciationOther Assets
——
in Trust for Pension Benefits
End of the Year Net Assets Heldin Trust for Pension Benefits
Investment Expenses
Adjustments —
Actuarial Cost Method:
Total UAAL Amortization Method:
Total UAAL Amortization Period: —
—Years Remaining in Total UAAL Amortization Period:
AdditionsContributions
Employer -
Employee -
Other -
GeneralSafetyCombined
CombinedSafetyGeneral
CombinedSafetyGeneral
$ —1,958,576
—
—
—
——
——
DeductionsBenefit Payments
Service Retirement -
Disability -
Other -
Member Refunds -
General
CombinedSafetyGeneralCombinedSafety
CombinedSafetyGeneral
CombinedSafetyGeneral
$ —1,753,740
——
188,399———————
Pay-as-you-go
Projected Unit Credit
—Year in Which the Total Unfunded Actuarial Liability is Expected to be Fully Amortized:
—
Other
Statement of Plan Net Assets
Funded
Unfunded
Actuarial ValueActuarial
SalaryInterestValuationActuary: Bartel Associates, LLC
Summary of Funding Position
of AssetsDate Rate Scale Liability Liability RatioAccrued
ActuarialAccruedFiscal
Year$ 14,953,000 0.0%6.50% 2.00%1/1/2011 $ 14,953,000 $ —2012
22,273,000 0.0%7.50% 3.00%1/1/2009 22,273,000 —201122,273,000 0.0%7.50% 3.00%1/1/2009 22,273,000 —201022,273,000 0.0%7.50% 3.00%1/1/2009 22,273,000 —200927,131,000 0.0%7.50% 4.00%6/30/2007 27,131,000 —200831,682,000 0.0%7.00% 4.00%1/1/2005 31,682,000 —2007
Summary of Employer Contributions
UAAL as aPercentage of ARCAnnual RequiredRecognizedFiscal Year Contributions (ARC) Made Percentage of ACP
Contribution Annual CoveredPayroll (ACP)
2012 $ 1,906,200 $ 1,958,576 103 $ — —% %2011 2,070,000 2,076,650 100 — —% %2010 2,248,000 2,120,764 94 — —% %2009 2,534,000 2,506,398 99 — —% %2008 2,758,000 2,780,297 101 — —% %2007 2,794,000 3,062,594 110 — —% %
85

Public Retirement Systems Annual Report — Fiscal Year 2011-12City of Alameda Police and Fire Pension Plans 1079 and 1082 — (Continued)
Contribution Rates as a Percentage of Covered Payroll
GeneralI II
SafetyI IIIII IV V VI IIIEmployer - Recommended by Actuary:
Normal CostUAAL Amortization
Total Rates Recommended by Actuary
Total Rates Adopted by BoardPrior Year Rates
Employee Rates Adopted by Board:Age 25Age 35Age 45Single Rate
—
—
—
—
—
—
—
—
% % % %
% % % %
% % % %
% % % %— — — —
— — — —
%
%—
—
— —
— —
— —
— — — —
— — — —
— — — —
— —
— — — —
— —
— — — —
— —
— — — —
— —
— — — —
— —
— — — —
— —
— — — —
6/30/2011 — — — — — — — — — 6/30/2010 — — — — — — — — — 6/30/2009 — — — — — — — — — 6/30/2008 — — — — — — — — — 6/30/2007 — — — — — — — — —
% % % % % % % % %
Retirement Benefit PoliciesGeneral
I IISafety
I IIIII IV V VI IIIEligibility:AgeYears of ServiceAge
Age
Age
Years of ServiceYears of Service
Years of Service
Years of Service Regardless of AgeAge Regardless of Service
5010
6025
Final Average Salary:Position Last HeldHighest Year(s) AverageFinal Year(s) Average
——
——
——
——
——
——
Y——
——
——
Compensation at Time of Retirement
OtherNone
2%Maximum Annual IncreaseIndex to Consumer Price Index
YIndex to Active Member IncreaseGranted Position Last HeldCost of Living:
Percent Per Year of Service: Age50556065
— — — —
— — — —
— — — —
— — — —
— — — —
— — — —
— — — —
— — — —
— — — —
Social Security Coverage: N
Benefit Comments:
Non-Service Disability - Per Year - Maximum
Service Disability - Per Year - Maximum
Disability Benefits as a Percentage ofFinal Average Salary (FAS):
— —
— —
— —
— —
— —
— —
— —
— —
— —
— —
— —
— —
— —
— —
— —
— 50 %
— —
— —
Comments:
Plan 1079 is for Police and Fire employees who entered service before 1953. It is a closed plan consisting of 30 participants, all of whom are retired employees or beneficiaries currently receiving benefits.
Plan 1082 is a closed plan and, effective December 31, 1990, all but two participants and their related plan assets were transferred to PERS. Plan 1082 has now been released from all future pension obligations for transferring members. Plan 1082 is obligated to pay supplementary Medicare and dental coverage expenses, which are funded on a pay-as-you-go basis.
The City of Alameda makes benefit contributions on a pay-as-you-go basis for both plans. The plans' annual required contribution is based on the greater of the following: 15-year amortization of the unfunded actuarial accrued liability or actual benefits paid during the year.
86

Public Retirement Systems Annual Report — Fiscal Year 2011-12City of Albany Police and Fire Relief Pension Fund
Single-Employer Plan
SurvivorsNon-ServiceServiceRetiredVested MembersNon-VestedVestedMembershipActive Inactive Service Disabled
Total Status
— — — 12 9 4 —Safety - Tier 1 25 Closed
—Totals — — 12 9 4 — 25
Contributions
AssetsCash and Short-Term InvestmentsReceivables
InvestmentsOther
Investments, at Fair ValueU.S. Government ObligationsInternational BondsMunicipal BondsDomestic Corporate BondsDomestic Stocks
Total Assets
Mortgages
Accounts PayableInvestment Purchases PayableAccrued ExpensesOther Current Liabilities
Total Liabilities
International Stocks
Net Assets Available for Benefits
Liabilities
Total Additions
InterestDividends
Net Appreciation (Depreciation)
Other Investment Revenues in Fair Value of Investments
Statement of Changes in Plan Net Assets
$ 9,796,565
Real EstateVenture CapitalOther
$ —
$ 9,796,565
$ 9,447
$ 293,693
Administration ExpensesOther Expenses
Total Deductions
Net Increase (Decrease) In Plan Assets
Beginning of the Year Net Assets Held
$ 1,415,881
$ )(1,122,188
as of June 30, 2012 for Period Ending June 30, 2012
$ 9,796,565
—————————
9,486,535
300,583——
$ ————
2,100327,481
)(288,454—
Other Revenues —
——
$ 10,918,753
Fixed Assets Net of Accumulated DepreciationOther Assets
——
in Trust for Pension Benefits
End of the Year Net Assets Heldin Trust for Pension Benefits
Investment Expenses
Adjustments —
Actuarial Cost Method:
Total UAAL Amortization Method:
Total UAAL Amortization Period: 15
15Years Remaining in Total UAAL Amortization Period:
AdditionsContributions
Employer -
Employee -
Other -
GeneralSafetyCombined
CombinedSafetyGeneral
CombinedSafetyGeneral
$ —300,000
—
—
—
——
——
DeductionsBenefit Payments
Service Retirement -
Disability -
Other -
Member Refunds -
General
CombinedSafetyGeneralCombinedSafety
CombinedSafetyGeneral
CombinedSafetyGeneral
$ —784,812
——
545,618——
85,451————
Entry Age
2027Year in Which the Total Unfunded Actuarial Liability is Expected to be Fully Amortized:
)(47,434
Level Dollar Amount
Statement of Plan Net Assets
Funded
Unfunded
Actuarial ValueActuarial
SalaryInterestValuationActuary: Buck Consultants
Summary of Funding Position
of AssetsDate Rate Scale Liability Liability RatioAccrued
ActuarialAccruedFiscal
Year$ 787,808 93.8%6.75% 2.50%6/30/2012 $ 12,710,552 $ 11,922,7442012
1,886,363 87.1%6.75% 4.00%6/30/2009 14,570,549 12,684,18620111,886,363 87.1%9.12% 4.00%6/30/2009 14,570,549 12,684,18620101,886,363 87.1%6.75% 4.00%6/30/2009 14,570,549 12,684,18620091,319,000 89.2%7.50% 4.50%9/30/2008 12,258,000 10,939,0002008
)(403,939 102.9%7.50% 4.50%6/30/2006 14,075,219 14,479,1582007
Summary of Employer Contributions
UAAL as aPercentage of ARCAnnual RequiredRecognizedFiscal Year Contributions (ARC) Made Percentage of ACP
Contribution Annual CoveredPayroll (ACP)
2012 $ 300,000 $ — — %2011 — 300,000 — — %2010 — 300,000 — — %2009 — — — %2008 — — — — %2007 — — — — %
87

Public Retirement Systems Annual Report — Fiscal Year 2011-12City of Albany Police and Fire Relief Pension Fund — (Continued)
Contribution Rates as a Percentage of Covered Payroll
GeneralI II
SafetyI IIIII IV V VI IIIEmployer - Recommended by Actuary:
Normal CostUAAL Amortization
Total Rates Recommended by Actuary
Total Rates Adopted by BoardPrior Year Rates
Employee Rates Adopted by Board:Age 25Age 35Age 45Single Rate
—
—
—
—
—
—
—
—
% % % %
% % % %
% % % %
% % % %— — — —
— — — —
%
%—
—
— —
— —
— —
— — — —
— — — —
— — — —
— —
— — — —
— —
— — — —
— —
— — — —
— —
— — — —
— —
— — — —
— —
— — — —
%
6/30/2011 — — — — — — — — — 6/30/2010 — — — — — — — — — 6/30/2009 — — — — — — — — — 6/30/2008 — — — — — — — — — 6/30/2007 — — — — — — 18.00 — —
% % % % % % % % %
Retirement Benefit PoliciesGeneral
I IISafety
I IIIII IV V VI IIIEligibility:AgeYears of ServiceAge
Age
Age
Years of ServiceYears of Service
Years of Service
Years of Service Regardless of AgeAge Regardless of Service
5025
30
Final Average Salary:Position Last HeldHighest Year(s) AverageFinal Year(s) Average
——
——
——
——
——
——
—3
——
——
Compensation at Time of Retirement
OtherNoneMaximum Annual IncreaseIndex to Consumer Price Index
YIndex to Active Member IncreaseGranted Position Last HeldCost of Living:
Percent Per Year of Service: Age50556065
— — — —
— — — —
— — — —
— — — —
— — — —
— — — —
50.0066.6766.6766.67
— — — —
— — — —
Social Security Coverage: N
Benefit Comments:
Non-Service Disability - Per Year - Maximum
Service Disability - Per Year - Maximum
Disability Benefits as a Percentage ofFinal Average Salary (FAS):
— —
— —
— —
— —
— —
— —
— 33 %
— —
— —
— —
— —
— —
— —
— —
— —
— 50 %
— —
— —
Comments:Contribution rates are based on the city charter, which requires the City of Albany to contribute 18% of gross wages of active fund participants. However, no active plan participants existed as of June 30, 2012, and the plan is closed to new participants.
Contributions were previously not required. The actuarial valuation performed as of June 30, 2012 determined the unfunded liability to be $787,808. The city chose to make employer's contributions of $300,000 in the 2011-2012 fiscal year. The funding policy of the Board of Trustees is to make a minimum contribution upon completion of the actuarial valuation, as required to amortize any unfunded liability over the expected life of the fund.
88

Public Retirement Systems Annual Report — Fiscal Year 2011-12City of Bakersfield Firemens' Disability and Retirement System
Single-Employer Plan
SurvivorsNon-ServiceServiceRetiredVested MembersNon-VestedVestedMembershipActive Inactive Service Disabled
Total Status
— — — — 2 — 4Safety - Tier 1 6 Closed
—Totals — — — 2 — 4 6
Contributions
AssetsCash and Short-Term InvestmentsReceivables
InvestmentsOther
Investments, at Fair ValueU.S. Government ObligationsInternational BondsMunicipal BondsDomestic Corporate BondsDomestic Stocks
Total Assets
Mortgages
Accounts PayableInvestment Purchases PayableAccrued ExpensesOther Current Liabilities
Total Liabilities
International Stocks
Net Assets Available for Benefits
Liabilities
Total Additions
InterestDividends
Net Appreciation (Depreciation)
Other Investment Revenues in Fair Value of Investments
Statement of Changes in Plan Net Assets
$ 1,354,745
Real EstateVenture CapitalOther
$ —
$ 1,354,745
$ 315,394
$ 7,254
Administration ExpensesOther Expenses
Total Deductions
Net Increase (Decrease) In Plan Assets
Beginning of the Year Net Assets Held
$ 119,514
$ )(112,260
as of June 30, 2012 for Period Ending June 30, 2012
$ 1,354,745
1,026,520—————————
—12,831
—
$ ————
42,384—
)(35,130—
Other Revenues —
——
$ 1,467,005
Fixed Assets Net of Accumulated DepreciationOther Assets
——
in Trust for Pension Benefits
End of the Year Net Assets Heldin Trust for Pension Benefits
Investment Expenses
Adjustments —
Actuarial Cost Method:
Total UAAL Amortization Method:
Total UAAL Amortization Period: —
—Years Remaining in Total UAAL Amortization Period:
AdditionsContributions
Employer -
Employee -
Other -
GeneralSafetyCombined
CombinedSafetyGeneral
CombinedSafetyGeneral
$ ———
—
—
——
——
DeductionsBenefit Payments
Service Retirement -
Disability -
Other -
Member Refunds -
General
CombinedSafetyGeneralCombinedSafety
CombinedSafetyGeneral
CombinedSafetyGeneral
$ ————
119,514———————
Average expected future lifetimes of plan participant
Projected Unit Credit
—Year in Which the Total Unfunded Actuarial Liability is Expected to be Fully Amortized:
—
Other
Statement of Plan Net Assets
Funded
Unfunded
Actuarial ValueActuarial
SalaryInterestValuationActuary: Aon Consulting
Summary of Funding Position
of AssetsDate Rate Scale Liability Liability RatioAccrued
ActuarialAccruedFiscal
Year$ )(14,630 101.1%4.10% — %6/30/2012 $ 1,327,284 $ 1,341,9142012
)(300,786 126.2%4.00% 3.50%6/30/2010 1,146,478 1,447,2642011)(300,786 126.2%3.51% — %6/30/2010 1,146,478 1,447,2642010)(326,394 126.5%5.25% — %6/30/2008 1,233,149 1,559,5432009)(326,394 126.5%5.25% — %6/30/2008 1,233,149 1,559,5432008)(193,539 113.0%5.35% — %6/30/2006 1,493,173 1,686,7122007
Summary of Employer Contributions
UAAL as aPercentage of ARCAnnual RequiredRecognizedFiscal Year Contributions (ARC) Made Percentage of ACP
Contribution Annual CoveredPayroll (ACP)
2012 $ — $ — $ — — %2011 — — — — %2010 — — — — %2009 — — — — %2008 — — — — %2007 — — — — %
89

Public Retirement Systems Annual Report — Fiscal Year 2011-12City of Bakersfield Firemens' Disability and Retirement System — (Continued)
Contribution Rates as a Percentage of Covered Payroll
GeneralI II
SafetyI IIIII IV V VI IIIEmployer - Recommended by Actuary:
Normal CostUAAL Amortization
Total Rates Recommended by Actuary
Total Rates Adopted by BoardPrior Year Rates
Employee Rates Adopted by Board:Age 25Age 35Age 45Single Rate
—
—
—
—
—
—
—
—
% % % %
% % % %
% % % %
% % % %— — — —
— — — —
%
%—
—
— —
— —
— —
— — — —
— — — —
— — — —
— —
— — — —
— —
— — — —
— —
— — — —
— —
— — — —
— —
— — — —
— —
— — — —
6/30/2011 — — — — — — — — — 6/30/2010 — — — — — — — — — 6/30/2009 — — — — — — — — — 6/30/2008 — — — — — — — — — 6/30/2007 — — — — — — — — —
% % % % % % % % %
Retirement Benefit PoliciesGeneral
I IISafety
I IIIII IV V VI IIIEligibility:AgeYears of ServiceAge
Age
Age
Years of ServiceYears of Service
Years of Service
Years of Service Regardless of AgeAge Regardless of Service
505
5510
65
Final Average Salary:Position Last HeldHighest Year(s) AverageFinal Year(s) Average
——
——
——
——
——
——
3—
——
——
Compensation at Time of Retirement
OtherNone
4%Maximum Annual IncreaseIndex to Consumer Price IndexIndex to Active Member IncreaseGranted Position Last HeldCost of Living:
Percent Per Year of Service: Age50556065
— — — —
— — — —
— — — —
— — — —
— — — —
— — — —
1.201.501.801.96
— — — —
— — — —
Social Security Coverage: N
Benefit Comments:
Non-Service Disability - Per Year - Maximum
Service Disability - Per Year - Maximum
Disability Benefits as a Percentage ofFinal Average Salary (FAS):
— —
— —
— —
— —
— —
— —
— 25 %
— —
— —
— —
— —
— —
— —
— —
— —
— 50 %
— —
— —
Comments:This plan accounts for Fire Department personnel who retired prior to June 26, 1972. No employer or employee contributions were made to this plan after June 26, 1972. The only activity in the plan is the receipt of income on invested assets and the payment of vested benefits.
90

Public Retirement Systems Annual Report — Fiscal Year 2011-12City of Berkeley Safety Members' Pension Fund
Single-Employer Plan
SurvivorsNon-ServiceServiceRetiredVested MembersNon-VestedVestedMembershipActive Inactive Service Disabled
Total Status
— — — 4 2 — 16Safety - Tier 1 22 Closed
—Totals — — 4 2 — 16 22
Contributions
AssetsCash and Short-Term InvestmentsReceivables
InvestmentsOther
Investments, at Fair ValueU.S. Government ObligationsInternational BondsMunicipal BondsDomestic Corporate BondsDomestic Stocks
Total Assets
Mortgages
Accounts PayableInvestment Purchases PayableAccrued ExpensesOther Current Liabilities
Total Liabilities
International Stocks
Net Assets Available for Benefits
Liabilities
Total Additions
InterestDividends
Net Appreciation (Depreciation)
Other Investment Revenues in Fair Value of Investments
Statement of Changes in Plan Net Assets
$ 1,947,302
Real EstateVenture CapitalOther
$ 51,044
$ 1,896,258
$ 1,896,258
$ 983,902
Administration ExpensesOther Expenses
Total Deductions
Net Increase (Decrease) In Plan Assets
Beginning of the Year Net Assets Held
$ 1,338,800
$ )(354,898
as of June 30, 2012 for Period Ending June 30, 2012
$ 1,896,258
——————————
——
51,044
$ ——
51,044—
184,102—
——
Other Revenues —
6,200—
$ 2,251,156
Fixed Assets Net of Accumulated DepreciationOther Assets
——
in Trust for Pension Benefits
End of the Year Net Assets Heldin Trust for Pension Benefits
Investment Expenses
Adjustments —
Actuarial Cost Method:
Total UAAL Amortization Method:
Total UAAL Amortization Period: 20
5Years Remaining in Total UAAL Amortization Period:
AdditionsContributions
Employer -
Employee -
Other -
GeneralSafetyCombined
CombinedSafetyGeneral
CombinedSafetyGeneral
$ —799,800
—
—
—
——
——
DeductionsBenefit Payments
Service Retirement -
Disability -
Other -
Member Refunds -
General
CombinedSafetyGeneralCombinedSafety
CombinedSafetyGeneral
CombinedSafetyGeneral
$ —908,958
——
423,642———————
reamining life of the participants
Projected Unit Credit
2017Year in Which the Total Unfunded Actuarial Liability is Expected to be Fully Amortized:
—
Other
Statement of Plan Net Assets
Funded
Unfunded
Actuarial ValueActuarial
SalaryInterestValuationActuary: AON consulting
Summary of Funding Position
of AssetsDate Rate Scale Liability Liability RatioAccrued
ActuarialAccruedFiscal
Year$ 3,660,914 38.1%8.00% 3.00%7/1/2011 $ 5,912,070 $ 2,251,1562012
3,660,914 38.1%8.00% 3.00%7/1/2011 5,912,070 2,251,15620114,265,004 38.1%8.00% 3.00%7/1/2010 6,895,254 2,630,25020104,569,211 40.0%8.00% 3.00%7/1/2009 7,611,896 3,042,68520094,656,504 42.9%8.00% 3.00%7/1/2008 8,153,217 3,496,71320084,754,085 45.7%8.00% 3.00%7/1/2007 8,748,286 3,994,2012007
Summary of Employer Contributions
UAAL as aPercentage of ARCAnnual RequiredRecognizedFiscal Year Contributions (ARC) Made Percentage of ACP
Contribution Annual CoveredPayroll (ACP)
2012 $ 1,554,836 $ 799,800 51 $ — —% %2011 1,554,836 958,837 62 — —% %2010 1,665,559 1,001,391 60 — —% %2009 1,736,185 990,809 57 — —% %2008 1,783,940 951,940 53 — —% %2007 1,816,236 889,236 49 — —% %
91

Public Retirement Systems Annual Report — Fiscal Year 2011-12City of Berkeley Safety Members' Pension Fund — (Continued)
Contribution Rates as a Percentage of Covered Payroll
GeneralI II
SafetyI IIIII IV V VI IIIEmployer - Recommended by Actuary:
Normal CostUAAL Amortization
Total Rates Recommended by Actuary
Total Rates Adopted by BoardPrior Year Rates
Employee Rates Adopted by Board:Age 25Age 35Age 45Single Rate
—
—
—
—
—
—
—
—
% % % %
% % % %
% % % %
% % % %— — — —
— — — —
%
%—
—
— —
— —
— —
— — — —
— — — —
— — — —
— —
— — — —
— —
— — — —
— —
— — — —
— —
— — — —
— —
— — — —
— —
— — — —
6/30/2011 — — — — — — — — — 6/30/2010 — — — — — — — — — 6/30/2009 — — — — — — — — — 6/30/2008 — — — — — — — — — 6/30/2007 — — — — — — — — —
% % % % % % % % %
Retirement Benefit PoliciesGeneral
I IISafety
I IIIII IV V VI IIIEligibility:AgeYears of ServiceAge
Age
Age
Years of ServiceYears of Service
Years of Service
Years of Service Regardless of AgeAge Regardless of Service
55256020
30
Final Average Salary:Position Last HeldHighest Year(s) AverageFinal Year(s) Average
——
——
——
——
——
——
Y——
——
——
Compensation at Time of Retirement
OtherNone
3%Maximum Annual IncreaseYIndex to Consumer Price Index
Index to Active Member IncreaseGranted Position Last HeldCost of Living:
Percent Per Year of Service: Age50556065
— — — —
— — — —
— — — —
— — — —
— — — —
— — — —
— — — —
— — — —
— — — —
Social Security Coverage:
Benefit Comments:
Non-Service Disability - Per Year - Maximum
Service Disability - Per Year - Maximum
Disability Benefits as a Percentage ofFinal Average Salary (FAS):
— —
— —
— —
— —
— —
— —
— 50 %
— —
— —
— —
— —
— —
— —
— —
— —
— 50 %
— —
— —
Comments:The City of Berkeley pays the Safety Members' Pension Fund primarily on a rolling pay-as-you-go basis. In February 1989, the Berkeley Civic Improvement Corporation purchased, on behalf of the city, a Guaranteed Income Contract (GIC). The GIC provides annual payments through 2018 and an annual guaranteed 9.68% rate of return (net of expenses). The city pays from the general fund the difference between actual benefit payments and contract-provided annual payments.
The city's annual required contribution (ARC) is the greater of (a) a 20-year amortization of the unfunded actuarial liability, or (b) actual benefit payments made for the year. For the fiscal year ended June 30, 2012, the city's ARC was $1,554,836 and was equal to the benefits during the year. The city contributed this amount through a $596,000 payment from the GIC plus $958,836 paid from the General Fund.
92

Public Retirement Systems Annual Report — Fiscal Year 2011-12City of Concord Retirement System
Single-Employer Plan
SurvivorsNon-ServiceServiceRetiredVested MembersNon-VestedVestedMembershipActive Inactive Service Disabled
Total Status
— — 49 150 — 13 —General - Tier 1 212 Closed
— — 5 59 12 — —Safety - Tier 1 76 Closed
—Totals — 54 209 12 13 — 288
Contributions
AssetsCash and Short-Term InvestmentsReceivables
InvestmentsOther
Investments, at Fair ValueU.S. Government ObligationsInternational BondsMunicipal BondsDomestic Corporate BondsDomestic Stocks
Total Assets
Mortgages
Accounts PayableInvestment Purchases PayableAccrued ExpensesOther Current Liabilities
Total Liabilities
International Stocks
Net Assets Available for Benefits
Liabilities
Total Additions
InterestDividends
Net Appreciation (Depreciation)
Other Investment Revenues in Fair Value of Investments
Statement of Changes in Plan Net Assets
$ 39,819,517
Real EstateVenture CapitalOther
$ —
$ 39,819,517
$ 3,129,677
$ 2,649,985
Administration ExpensesOther Expenses
Total Deductions
Net Increase (Decrease) In Plan Assets
Beginning of the Year Net Assets Held
$ 5,529,920
$ )(2,879,935
as of June 30, 2012 for Period Ending June 30, 2012
$ 39,819,517
—————————
36,688,667
—1,173
—
$ ————
1,992,997—
)(3,766—
Other Revenues —
——
$ 42,699,452
Fixed Assets Net of Accumulated DepreciationOther Assets
——
(1)
in Trust for Pension Benefits
End of the Year Net Assets Heldin Trust for Pension Benefits
Investment Expenses
Adjustments —
Actuarial Cost Method:
Total UAAL Amortization Method:
Total UAAL Amortization Period: 20
16Years Remaining in Total UAAL Amortization Period:
AdditionsContributions
Employer -
Employee -
Other -
GeneralSafetyCombined
CombinedSafetyGeneral
CombinedSafetyGeneral
$ 797,63965,971
—
—
—
——
——
DeductionsBenefit Payments
Service Retirement -
Disability -
Other -
Member Refunds -
General
CombinedSafetyGeneralCombinedSafety
CombinedSafetyGeneral
CombinedSafetyGeneral
$ ——
5,529,920—————————
Entry Age
2027Year in Which the Total Unfunded Actuarial Liability is Expected to be Fully Amortized:
)(202,856
Level Percentage of Projected Covered Payroll
Statement of Plan Net Assets
Funded
Unfunded
Actuarial ValueActuarial
SalaryInterestValuationActuary: Milliman
Summary of Funding Position
of AssetsDate Rate Scale Liability Liability RatioAccrued
ActuarialAccruedFiscal
Year$ 21,676,000 66.8%6.50% 3.50% 6/30/2010 $ 65,272,000 $ 43,596,0002012
21,676,000 66.8%6.50% 3.50%6/30/2010 65,272,000 43,596,000201117,789,000 74.2%6.50% 3.50%6/30/2007 68,988,000 51,199,000201017,789,000 74.2%6.50% 3.50%6/30/2007 68,988,000 51,199,000200917,789,000 74.2%6.50% 3.50%6/30/2007 68,988,000 51,199,000200810,532,000 84.8%6.20% — %6/30/2005 69,185,000 58,653,0002007
Summary of Employer Contributions
UAAL as aPercentage of ARCAnnual RequiredRecognizedFiscal Year Contributions (ARC) Made Percentage of ACP
Contribution Annual CoveredPayroll (ACP)
2012 $ 1,810,295 $ 863,610 48 $ — —% %2011 1,810,295 287,624 16 — —% %2010 2,416,000 1,312,385 54 — —% %2009 1,397,072 539,895 39 — —% %2008 1,345,407 1,345,407 100 — —% %2007 1,329,458 1,329,458 100 — —% %
93

Public Retirement Systems Annual Report — Fiscal Year 2011-12City of Concord Retirement System — (Continued)
Contribution Rates as a Percentage of Covered Payroll
GeneralI II
SafetyI IIIII IV V VI IIIEmployer - Recommended by Actuary:
Normal CostUAAL Amortization
Total Rates Recommended by Actuary
Total Rates Adopted by BoardPrior Year Rates
Employee Rates Adopted by Board:Age 25Age 35Age 45Single Rate
1.00
1.00
—
—
1.00
1.00
—
—
% % % %
%
%
% %
%
%
% % % %
% % % %— — — —
— — — —
%
%—
—
— 1.00
— —
— —
— — — —
— — — —
— — — —
— —
— — — —
— —
— — — —
— —
— — — —
— 1.00
— — — —
— —
— — — —
— —
— — — —
%%%%%
%%%%%
6/30/2011 1.00 — — — — — 1.00 — — 6/30/2010 1.00 — — — — — 1.00 — — 6/30/2009 1.00 — — — — — 1.00 — — 6/30/2008 1.00 — — — — — 1.00 — — 6/30/2007 1.00 — — — — — 1.00 — —
% % % % % % % % %
Retirement Benefit PoliciesGeneral
I IISafety
I IIIII IV V VI III
505
Eligibility:AgeYears of ServiceAge
Age
Age
Years of ServiceYears of Service
Years of Service
Years of Service Regardless of AgeAge Regardless of Service
595
50205420
Final Average Salary:Position Last HeldHighest Year(s) AverageFinal Year(s) Average
Y1
———
——
——
——
——
Y1
———
——
Compensation at Time of Retirement
OtherNone
2%2%Maximum Annual IncreaseIndex to Consumer Price IndexIndex to Active Member Increase
YYGranted Position Last HeldCost of Living:
Percent Per Year of Service: Age50556065
— 2.002.002.00
— — — —
— — — —
— — — —
— — — —
— — — —
2.002.002.002.00
— — — —
— — — —
ISocial Security Coverage: I
The maximum benefit payment for police members is 75% of final average salary.Benefit Comments:
Non-Service Disability - Per Year - Maximum
Service Disability - Per Year - Maximum
Disability Benefits as a Percentage ofFinal Average Salary (FAS):
— —
— —
— —
— —
— —
— —
— —
— —
— —
— —
— —
— —
— —
— —
— —
— 50 %
— —
— —
Footnote:
(1) No active members remain in the plan. Effective fiscal year 2001, the City of Concord started collecting 1% of citywide payroll to help pay the unfunded liability.
94

Public Retirement Systems Annual Report — Fiscal Year 2011-12City of Delano Employee Pension Plan
Single-Employer Plan
SurvivorsNon-ServiceServiceRetiredVested MembersNon-VestedVestedMembershipActive Inactive Service Disabled
Total Status
— — 7 9 — — 3Safety - Tier 1 19 Open
125 23 83 42 — — 10General - Tier 1 283 Open
125Totals 23 90 51 — — 13 302
Contributions
AssetsCash and Short-Term InvestmentsReceivables
InvestmentsOther
Investments, at Fair ValueU.S. Government ObligationsInternational BondsMunicipal BondsDomestic Corporate BondsDomestic Stocks
Total Assets
Mortgages
Accounts PayableInvestment Purchases PayableAccrued ExpensesOther Current Liabilities
Total Liabilities
International Stocks
Net Assets Available for Benefits
Liabilities
Total Additions
InterestDividends
Net Appreciation (Depreciation)
Other Investment Revenues in Fair Value of Investments
Statement of Changes in Plan Net Assets
$ 19,311,226
Real EstateVenture CapitalOther
$ 37,295
$ 19,273,931
$ 1,627,482
$ 1,305,336
Administration ExpensesOther Expenses
Total Deductions
Net Increase (Decrease) In Plan Assets
Beginning of the Year Net Assets Held
$ 2,480,636
$ )(1,175,300
as of June 30, 2012 for Period Ending June 30, 2012
$ 19,273,931
————
10,391,5992,255,728
———
4,804,111
123,767—
108,539
$ ———
37,295
175,628—
)(279,107—
Other Revenues —
136,394—
$ 20,449,231
Fixed Assets Net of Accumulated DepreciationOther Assets
——
in Trust for Pension Benefits
End of the Year Net Assets Heldin Trust for Pension Benefits
Investment Expenses
Adjustments —
Actuarial Cost Method:
Total UAAL Amortization Method:
Total UAAL Amortization Period: 20
17Years Remaining in Total UAAL Amortization Period:
AdditionsContributions
Employer -
Employee -
Other -
GeneralSafetyCombined
CombinedSafetyGeneral
CombinedSafetyGeneral
$ 1,359,337——
—
—
131,514—
123,317—
DeductionsBenefit Payments
Service Retirement -
Disability -
Other -
Member Refunds -
General
CombinedSafetyGeneralCombinedSafety
CombinedSafetyGeneral
CombinedSafetyGeneral
$ ——
1,201,187————————
1,143,055
Entry Age
2029Year in Which the Total Unfunded Actuarial Liability is Expected to be Fully Amortized:
)(205,353
Level Percentage of Projected Covered Payroll
Statement of Plan Net Assets
Funded
Unfunded
Actuarial ValueActuarial
SalaryInterestValuationActuary: Prien Associates, Inc.
Summary of Funding Position
of AssetsDate Rate Scale Liability Liability RatioAccrued
ActuarialAccruedFiscal
Year$ 12,220,580 65.2%7.75% 3.00% 6/30/2012 $ 35,090,044 $ 22,869,4642012
10,769,640 68.3%7.75% 3.00%6/30/2011 33,978,297 23,208,657201111,765,311 63.8%7.75% 3.00%6/30/2010 32,480,826 20,715,515201011,557,849 61.3%7.75% 3.00%6/30/2009 29,881,644 18,323,7952009
8,743,498 67.8%7.75% 3.00%6/30/2008 27,169,641 18,426,14320085,312,458 78.6%8.00% 3.00%6/30/2007 24,767,406 19,454,9482007
Summary of Employer Contributions
UAAL as aPercentage of ARCAnnual RequiredRecognizedFiscal Year Contributions (ARC) Made Percentage of ACP
Contribution Annual CoveredPayroll (ACP)
2012 $ 1,626,231 $ 1,482,654 91 $ 6,769,580 181% %2011 1,898,291 1,806,341 95 8,460,797 127% %2010 1,861,238 1,823,123 98 8,585,478 137% %2009 1,608,253 1,662,165 103 7,853,316 147% %2008 1,363,373 1,273,624 93 6,873,360 127% %2007 1,132,465 1,139,803 101 6,402,086 83% %
95

Public Retirement Systems Annual Report — Fiscal Year 2011-12City of Delano Employee Pension Plan — (Continued)
Contribution Rates as a Percentage of Covered Payroll
GeneralI II
SafetyI IIIII IV V VI IIIEmployer - Recommended by Actuary:
Normal CostUAAL Amortization
Total Rates Recommended by Actuary
Total Rates Adopted by BoardPrior Year Rates
Employee Rates Adopted by Board:Age 25Age 35Age 45Single Rate
23.61
23.61
—
—
—
—
—
—
% % % %
%
%
% % %
%
% % % %
% % % %— — — —
— — — —
%
%—
—
8.3415.27
— —
— —
— — —
6.20
— — — —
— — — —
— —
— — — —
— —
— — — —
— —
— — — —
— —
— — — —
— —
— — — —
— —
— — — —
%%%%%
6/30/2011 23.85 — — — — — — — — 6/30/2010 23.61 — — — — — — — — 6/30/2009 23.24 — — — — — — — — 6/30/2008 20.15 — — — — — — — — 6/30/2007 17.82 — — — — — — — —
(1)
% % % % % % % % %
Retirement Benefit PoliciesGeneral
I IISafety
I IIIII IV V VI IIIEligibility:AgeYears of ServiceAge
Age
Age
Years of ServiceYears of Service
Years of Service
Years of Service Regardless of AgeAge Regardless of Service
607
Final Average Salary:Position Last HeldHighest Year(s) AverageFinal Year(s) Average
3—
——
——
——
——
——
——
——
——
Compensation at Time of Retirement
OtherNone
2%Maximum Annual IncreaseIndex to Consumer Price IndexIndex to Active Member IncreaseGranted Position Last HeldCost of Living:
Percent Per Year of Service: Age50556065
2.402.402.40—
— — — —
— — — —
— — — —
— — — —
— — — —
— — — —
— — — —
— — — —
ISocial Security Coverage:
2% x first $833.33 average final monthly covered compensation + 2.4% x average final monthly covered compensation in excess of $833.33. Disability - Members may withdraw their accumulated contributions with interest at 6% compounded annually.
Benefit Comments:
Non-Service Disability - Per Year - Maximum
Service Disability - Per Year - Maximum
Disability Benefits as a Percentage ofFinal Average Salary (FAS):
— —
— —
— —
— —
— —
— —
— —
— —
— —
— —
— —
— —
— —
— —
— —
— —
— —
— —
Comments:Effective February 1, 2011, participant contributions are picked up by the employer and treated as pre-tax contributions.
Footnote:
(1) The city has been contributing 9% for Management (including Police Management), 6.20% for General members, and 7.40% for Police (prior to July 1, 2005) except for the following employee contribution rates based on service, which are deducted from the participant's basic earnings: MISCELLANEOUSYears of Service 0<5 over 5 Contributions Rates 6.20% 0.00% Effective July 1, 2005, the active police officers who are covered under CalPERS, and police management personnel who elected to join CalPERS, have 7.0% of their covered compensation contributed, which exceeds the monthly compensation breakpoint of $133.33, with 3% contributed by the City of Delano and 4.0% contributed by the active police officers for all future years of service with the city.
96

Public Retirement Systems Annual Report — Fiscal Year 2011-12City of El Cerrito Employees' Pension Trust Fund
Single-Employer Plan
SurvivorsNon-ServiceServiceRetiredVested MembersNon-VestedVestedMembershipActive Inactive Service Disabled
Total Status
— — — 2 — — —General - Tier 1 2 Closed
— — — 1 — — —Safety - Tier 1 1 Closed
—Totals — — 3 — — — 3
Contributions
AssetsCash and Short-Term InvestmentsReceivables
InvestmentsOther
Investments, at Fair ValueU.S. Government ObligationsInternational BondsMunicipal BondsDomestic Corporate BondsDomestic Stocks
Total Assets
Mortgages
Accounts PayableInvestment Purchases PayableAccrued ExpensesOther Current Liabilities
Total Liabilities
International Stocks
Net Assets Available for Benefits
Liabilities
Total Additions
InterestDividends
Net Appreciation (Depreciation)
Other Investment Revenues in Fair Value of Investments
Statement of Changes in Plan Net Assets
$ —
Real EstateVenture CapitalOther
$ —
$ —
$ —
$ 141,769
Administration ExpensesOther Expenses
Total Deductions
Net Increase (Decrease) In Plan Assets
Beginning of the Year Net Assets Held
$ 141,769
$ —
as of June 30, 2012 for Period Ending June 30, 2012
$ —
——————————
———
$ ————
——
——
Other Revenues —
852—
$ —
Fixed Assets Net of Accumulated DepreciationOther Assets
——
in Trust for Pension Benefits
End of the Year Net Assets Heldin Trust for Pension Benefits
Investment Expenses
Adjustments —
Actuarial Cost Method: (1)
Total UAAL Amortization Method:
Total UAAL Amortization Period: —
—Years Remaining in Total UAAL Amortization Period:
AdditionsContributions
Employer -
Employee -
Other -
GeneralSafetyCombined
CombinedSafetyGeneral
CombinedSafetyGeneral
$ 62,01379,756
—
—
—
——
——
DeductionsBenefit Payments
Service Retirement -
Disability -
Other -
Member Refunds -
General
CombinedSafetyGeneralCombinedSafety
CombinedSafetyGeneral
CombinedSafetyGeneral
$ 61,65479,263
——————————
Pay-as-you-go
Other
—Year in Which the Total Unfunded Actuarial Liability is Expected to be Fully Amortized:
—
Other
Statement of Plan Net Assets
Funded
Unfunded
Actuarial ValueActuarial
SalaryInterestValuationActuary: Milliman USA
Summary of Funding Position
of AssetsDate Rate Scale Liability Liability RatioAccrued
ActuarialAccruedFiscal
Year$ 947,848 0.0%9.50% 6.00% 7/1/2010 $ 947,848 $ —2012
947,848 0.0%9.50% 6.00%7/1/2010 947,848 —2011947,848 0.0%9.50% 6.00%7/1/2010 947,848 —2010
1,282,150 0.0%9.50% 6.00%7/1/2007 1,282,150 —20091,282,150 0.0%9.50% 6.00%7/1/2007 1,282,150 —20081,282,150 0.0%9.50% 6.00%7/1/2007 1,282,150 —2007
Summary of Employer Contributions
UAAL as aPercentage of ARCAnnual RequiredRecognizedFiscal Year Contributions (ARC) Made Percentage of ACP
Contribution Annual CoveredPayroll (ACP)
2012 $ 141,769 $ 141,769 100 $ — —% %2011 149,466 149,466 100 — —% %2010 148,256 148,256 100 — —% %2009 145,166 145,166 100 — —% %2008 184,919 184,919 100 — —% %2007 183,278 181,873 99 — —% %
97

Public Retirement Systems Annual Report — Fiscal Year 2011-12City of El Cerrito Employees' Pension Trust Fund — (Continued)
Contribution Rates as a Percentage of Covered Payroll
GeneralI II
SafetyI IIIII IV V VI IIIEmployer - Recommended by Actuary:
Normal CostUAAL Amortization
Total Rates Recommended by Actuary
Total Rates Adopted by BoardPrior Year Rates
Employee Rates Adopted by Board:Age 25Age 35Age 45Single Rate
—
—
—
—
—
—
—
—
% % % %
% % % %
% % % %
% % % %— — — —
— — — —
%
%—
—
— —
— —
— —
— — — —
— — — —
— — — —
— —
— — — —
— —
— — — —
— —
— — — —
— —
— — — —
— —
— — — —
— —
— — — —
6/30/2011 — — — — — — — — — 6/30/2010 — — — — — — — — — 6/30/2009 — — — — — — — — — 6/30/2008 — — — — — — — — — 6/30/2007 — — — — — — — — —
% % % % % % % % %
Retirement Benefit PoliciesGeneral
I IISafety
I IIIII IV V VI III
5520
Eligibility:AgeYears of ServiceAge
Age
Age
Years of ServiceYears of Service
Years of Service
Years of Service Regardless of AgeAge Regardless of Service 65
5520
Final Average Salary:Position Last HeldHighest Year(s) AverageFinal Year(s) Average
——Y
——
——
——
——
——
——Y
——
——
Compensation at Time of Retirement
OtherNoneMaximum Annual IncreaseIndex to Consumer Price Index
YYIndex to Active Member IncreaseGranted Position Last HeldCost of Living:
Percent Per Year of Service: Age50556065
— — — —
— — — —
— — — —
— — — —
— — — —
— — — —
— — — —
— — — —
— — — —
ISocial Security Coverage: I
Retirement benefit generally equal to 50% of the annual salary of the plan member at the time of retirement plus 50% of any change in salary after that date.Benefit Comments:
Non-Service Disability - Per Year - Maximum
Service Disability - Per Year - Maximum
Disability Benefits as a Percentage ofFinal Average Salary (FAS):
— —
— —
— —
— —
— —
— —
— —
— —
— —
— 50 %
— —
— —
— —
— —
— —
— 50 %
— —
— —
Comments:The plan's assets were exhausted as of June 30, 2005. Future payments will be made on a pay-as-you-go method basis from the city's general fund.
Footnote:
(1) The three remaining members in the plan are all receiving benefits. The actuarial analysis states that actuarial projections of benefit payment requirements for such a small group are useful for planning but should not be taken as providing an accurate estimate of any set of benefits for many years in the future. The actuaries have recommended a method of funding which, in effect, keeps the city's contribution level as a percent of total expected city revenues, while ensuring that no assets will remain in the plan when it terminates.
98

Public Retirement Systems Annual Report — Fiscal Year 2011-12City of Emeryville Pension Plan
Single-Employer Plan
SurvivorsNon-ServiceServiceRetiredVested MembersNon-VestedVestedMembershipActive Inactive Service Disabled
Total Status
— — — 3 — — —General - Tier 1 3 Closed
—Totals — — 3 — — — 3
Contributions
AssetsCash and Short-Term InvestmentsReceivables
InvestmentsOther
Investments, at Fair ValueU.S. Government ObligationsInternational BondsMunicipal BondsDomestic Corporate BondsDomestic Stocks
Total Assets
Mortgages
Accounts PayableInvestment Purchases PayableAccrued ExpensesOther Current Liabilities
Total Liabilities
International Stocks
Net Assets Available for Benefits
Liabilities
Total Additions
InterestDividends
Net Appreciation (Depreciation)
Other Investment Revenues in Fair Value of Investments
Statement of Changes in Plan Net Assets
$ 410,368
Real EstateVenture CapitalOther
$ —
$ 410,368
$ 410,205
$ 4,358
Administration ExpensesOther Expenses
Total Deductions
Net Increase (Decrease) In Plan Assets
Beginning of the Year Net Assets Held
$ 29,738
$ )(25,380
as of June 30, 2012 for Period Ending June 30, 2012
$ 410,368
——————————
—163
—
$ ————
4,358—
——
Other Revenues —
——
$ 435,748
Fixed Assets Net of Accumulated DepreciationOther Assets
——
in Trust for Pension Benefits
End of the Year Net Assets Heldin Trust for Pension Benefits
Investment Expenses
Adjustments —
Actuarial Cost Method:
Total UAAL Amortization Method: (1)
Total UAAL Amortization Period: —
—Years Remaining in Total UAAL Amortization Period:
AdditionsContributions
Employer -
Employee -
Other -
GeneralSafetyCombined
CombinedSafetyGeneral
CombinedSafetyGeneral
$ ———
—
—
——
——
DeductionsBenefit Payments
Service Retirement -
Disability -
Other -
Member Refunds -
General
CombinedSafetyGeneralCombinedSafety
CombinedSafetyGeneral
CombinedSafetyGeneral
$ 29,738———————————
Pay as you go.
Projected Unit Credit
—Year in Which the Total Unfunded Actuarial Liability is Expected to be Fully Amortized:
—
Other
Statement of Plan Net Assets
Funded
Unfunded
Actuarial ValueActuarial
SalaryInterestValuationActuary: Bartel Associates, LLC
Summary of Funding Position
of AssetsDate Rate Scale Liability Liability RatioAccrued
ActuarialAccruedFiscal
Year$ 101,632 80.2%4.50% 2.00% 6/30/2009 $ 512,000 $ 410,3682012
355,868 30.5%4.50% 2.00%6/30/2009 512,000 156,1322011355,868 30.5%4.50% 2.00%6/30/2009 512,000 156,1322010355,868 30.5%4.50% 2.00%6/30/2009 512,000 156,1322009338,959 39.6%4.50% 2.00%6/30/2006 561,000 222,0412008218,884 61.0%4.50% 2.00%6/30/2006 561,000 342,1162007
Summary of Employer Contributions
UAAL as aPercentage of ARCAnnual RequiredRecognizedFiscal Year Contributions (ARC) Made Percentage of ACP
Contribution Annual CoveredPayroll (ACP)
2012 $ 67,400 $ — — $ — — %2011 67,400 400,000 593 — —% %2010 — — — %2009 — — — %2008 — — — — %2007 — — — — %
99

Public Retirement Systems Annual Report — Fiscal Year 2011-12City of Emeryville Pension Plan — (Continued)
Contribution Rates as a Percentage of Covered Payroll
GeneralI II
SafetyI IIIII IV V VI IIIEmployer - Recommended by Actuary:
Normal CostUAAL Amortization
Total Rates Recommended by Actuary
Total Rates Adopted by BoardPrior Year Rates
Employee Rates Adopted by Board:Age 25Age 35Age 45Single Rate
—
—
—
—
—
—
—
—
% % % %
% % % %
% % % %
% % % %— — — —
— — — —
%
%—
—
— —
— —
— —
— — — —
— — — —
— — — —
— —
— — — —
— —
— — — —
— —
— — — —
— —
— — — —
— —
— — — —
— —
— — — —
6/30/2011 — — — — — — — — — 6/30/2010 — — — — — — — — — 6/30/2009 — — — — — — — — — 6/30/2008 — — — — — — — — — 6/30/2007 — — — — — — — — —
% % % % % % % % %
Retirement Benefit PoliciesGeneral
I IISafety
I IIIII IV V VI III
5520
Eligibility:AgeYears of ServiceAge
Age
Age
Years of ServiceYears of Service
Years of Service
Years of Service Regardless of AgeAge Regardless of Service 65
Final Average Salary:Position Last HeldHighest Year(s) AverageFinal Year(s) Average
—3
——
——
——
——
——
——
——
——
Compensation at Time of Retirement
OtherNone
2%Maximum Annual IncreaseYIndex to Consumer Price Index
Index to Active Member IncreaseGranted Position Last HeldCost of Living:
Percent Per Year of Service: Age50556065
— — — —
— — — —
— — — —
— — — —
— — — —
— — — —
— — — —
— — — —
— — — —
NSocial Security Coverage:
Benefit Comments:
Non-Service Disability - Per Year - Maximum
Service Disability - Per Year - Maximum
Disability Benefits as a Percentage ofFinal Average Salary (FAS):
— 33 %
— —
— —
— —
— —
— —
— —
— —
— —
— 75 %
— —
— —
— —
— —
— —
— —
— —
— —
Comments:The City of Emeryville Miscellaneous Pension Fund was established to support two retirement programs: a) pension stipends for remaining retirees on the city's old retirement system, which existed prior to the city's entry into CalPERS; and b) the unfunded liability for retiree medical, dental, and vision benefits.
Footnote:
(1) The actuary has determined that the City of Emeryville's annual pension cost is the greater of (a) Annual Required Contribution, which is based on the sum of 12-year amortization of the unfunded actuarial accrued liability plus Normal Cost or (b) actual benefit payments made for the year.
100

Public Retirement Systems Annual Report — Fiscal Year 2011-12City of Eureka Fire and Police Retirement System
Single-Employer Plan
SurvivorsNon-ServiceServiceRetiredVested MembersNon-VestedVestedMembershipActive Inactive Service Disabled
Total Status
— — — 3 — — 11Safety - Tier 1 14 Closed
—Totals — — 3 — — 11 14
Contributions
AssetsCash and Short-Term InvestmentsReceivables
InvestmentsOther
Investments, at Fair ValueU.S. Government ObligationsInternational BondsMunicipal BondsDomestic Corporate BondsDomestic Stocks
Total Assets
Mortgages
Accounts PayableInvestment Purchases PayableAccrued ExpensesOther Current Liabilities
Total Liabilities
International Stocks
Net Assets Available for Benefits
Liabilities
Total Additions
InterestDividends
Net Appreciation (Depreciation)
Other Investment Revenues in Fair Value of Investments
Statement of Changes in Plan Net Assets
$ 51,919
Real EstateVenture CapitalOther
$ 19,211
$ 32,708
$ 51,801
$ 500,718
Administration ExpensesOther Expenses
Total Deductions
Net Increase (Decrease) In Plan Assets
Beginning of the Year Net Assets Held
$ 479,787
$ 20,931
as of June 30, 2012 for Period Ending June 30, 2012
$ 32,708
——————————
—118
—
$ 19,211———
——
)(282—
Other Revenues —
8,660—
$ 11,777
Fixed Assets Net of Accumulated DepreciationOther Assets
——
in Trust for Pension Benefits
End of the Year Net Assets Heldin Trust for Pension Benefits
Investment Expenses
Adjustments —
Actuarial Cost Method:
Total UAAL Amortization Method: (1)
Total UAAL Amortization Period: —
—Years Remaining in Total UAAL Amortization Period:
AdditionsContributions
Employer -
Employee -
Other -
GeneralSafetyCombined
CombinedSafetyGeneral
CombinedSafetyGeneral
$ —501,000
—
—
—
——
——
DeductionsBenefit Payments
Service Retirement -
Disability -
Other -
Member Refunds -
General
CombinedSafetyGeneralCombinedSafety
CombinedSafetyGeneral
CombinedSafetyGeneral
$ —471,127
——————————
Straight Line Method Closed
Entry Age
—Year in Which the Total Unfunded Actuarial Liability is Expected to be Fully Amortized:
—
Other
Statement of Plan Net Assets
Funded
Unfunded
Actuarial ValueActuarial
SalaryInterestValuationActuary: Richard D. Kern
Summary of Funding Position
of AssetsDate Rate Scale Liability Liability RatioAccrued
ActuarialAccruedFiscal
Year$ 3,968,121 1.3%6.00% 4.00% 6/30/2012 $ 4,020,040 $ 51,9192012
4,667,337 0.3%6.00% 4.00%6/30/2010 4,682,353 15,01620114,105,199 13.4%6.00% 4.00%6/30/2009 4,740,136 634,93720104,105,199 13.4%6.00% 4.00%6/30/2009 4,740,136 634,93720094,099,342 17.3%6.00% 4.00%6/30/2008 4,959,400 860,05820083,521,824 26.7%6.00% 4.00%6/30/2007 4,806,301 1,284,4772007
Summary of Employer Contributions
UAAL as aPercentage of ARCAnnual RequiredRecognizedFiscal Year Contributions (ARC) Made Percentage of ACP
Contribution Annual CoveredPayroll (ACP)
2012 $ )(24,914 $ 501,000 )(2,011 $ — —% %2011 14,660 200,696 1,369 — —% %2010 )(33,125 225,000 )(679 — —% %2009 )(31,650 266,064 )(841 — —% %2008 — — — %2007 425,000 74 — —% %
101

Public Retirement Systems Annual Report — Fiscal Year 2011-12City of Eureka Fire and Police Retirement System — (Continued)
Contribution Rates as a Percentage of Covered Payroll
GeneralI II
SafetyI IIIII IV V VI IIIEmployer - Recommended by Actuary:
Normal CostUAAL Amortization
Total Rates Recommended by Actuary
Total Rates Adopted by BoardPrior Year Rates
Employee Rates Adopted by Board:Age 25Age 35Age 45Single Rate
—
—
—
—
—
—
—
—
% % % %
% % % %
% % % %
% % % %— — — —
— — — —
%
%—
—
— —
— —
— —
— — — —
— — — —
— — — —
— —
— — — —
— —
— — — —
— —
— — — —
— —
— — — —
— —
— — — —
— —
— — — —
6/30/2011 — — — — — — — — — 6/30/2010 — — — — — — — — — 6/30/2009 — — — — — — — — — 6/30/2008 — — — — — — — — — 6/30/2007 — — — — — — — — —
% % % % % % % % %
Retirement Benefit PoliciesGeneral
I IISafety
I IIIII IV V VI IIIEligibility:AgeYears of ServiceAge
Age
Age
Years of ServiceYears of Service
Years of Service
Years of Service Regardless of AgeAge Regardless of Service 65
25
Final Average Salary:Position Last HeldHighest Year(s) AverageFinal Year(s) Average
——
——
——
——
——
——
Y——Y
——
——
Compensation at Time of Retirement
OtherNone
4%Maximum Annual IncreaseIndex to Consumer Price IndexIndex to Active Member Increase
YGranted Position Last HeldCost of Living:
Percent Per Year of Service: Age50556065
— — — —
— — — —
— — — —
— — — —
— — — —
— — — —
— — — —
— — — —
— — — —
Social Security Coverage: N
Benefit Comments:
Non-Service Disability - Per Year - Maximum
Service Disability - Per Year - Maximum
Disability Benefits as a Percentage ofFinal Average Salary (FAS):
— —
— —
— —
— —
— —
— —
— 50 %
— —
— —
— —
— —
— —
— —
— —
— —
— 75 %
— —
— —
Comments:The plan was terminated on June 30, 1984, when its only remaining participants were retired members and employees who elected not to be covered by CalPERS. During the fiscal years 2009-10, 2010-11, and 2011-12, contributions from the General Fund were made to cover benefits on a "pay as you go" basis.
Footnote:
(1) The plan was initially funded over a 30-year amortization period. However, the city abandoned the 30-year funding approach after a buyout program in the mid-1980, which eliminated the active employees from the program. The city has since been making annual contributions, which was sufficient to prevent the fund from being depleted, but is insufficient to the meet the original 30-year funding goal. The actuary noted that the unfunded benefits under this plan as of June 30, 2012, have decreased about $600k from the unfunded level shown as of June 30, 2010. This decrease was caused primarily by higher mortality among the participants, and lower benefit increases, than projected.
102

Public Retirement Systems Annual Report — Fiscal Year 2011-12City of Fresno Employees' Retirement System
Single-Employer Plan
SurvivorsNon-ServiceServiceRetiredVested MembersNon-VestedVestedMembershipActive Inactive Service Disabled
Total Status
1,638 267 217 1,166 71 67 358General - Tier 1 3,784 Open
1,638Totals 267 217 1,166 71 67 358 3,784
Contributions
AssetsCash and Short-Term InvestmentsReceivables
InvestmentsOther
Investments, at Fair ValueU.S. Government ObligationsInternational BondsMunicipal BondsDomestic Corporate BondsDomestic Stocks
Total Assets
Mortgages
Accounts PayableInvestment Purchases PayableAccrued ExpensesOther Current Liabilities
Total Liabilities
International Stocks
Net Assets Available for Benefits
Liabilities
Total Additions
InterestDividends
Net Appreciation (Depreciation)
Other Investment Revenues in Fair Value of Investments
Statement of Changes in Plan Net Assets
$ 1,083,275,908
Real EstateVenture CapitalOther
$ 152,873,183
$ 930,402,725
$ 30,376,735
$ 11,260,441
Administration ExpensesOther Expenses
Total Deductions
Net Increase (Decrease) In Plan Assets
Beginning of the Year Net Assets Held
$ 45,234,220
$ )(33,973,779
as of June 30, 2012 for Period Ending June 30, 2012
$ 930,402,725
135,096,842——
130,182,472322,738,059206,673,228
—102,835,465
—113,875,862
—39,244,811
2,137,640
$ 1,019,72137,977,600
—113,875,862
12,845,3309,990,325
)(24,578,28751,271
Other Revenues 511,605
1,087,210—
$ 964,376,504
Fixed Assets Net of Accumulated DepreciationOther Assets
46,70668,088
in Trust for Pension Benefits
End of the Year Net Assets Heldin Trust for Pension Benefits
Investment Expenses
Adjustments —
Actuarial Cost Method:
Total UAAL Amortization Method: (1)
Total UAAL Amortization Period: 15
—Years Remaining in Total UAAL Amortization Period:
AdditionsContributions
Employer -
Employee -
Other -
GeneralSafetyCombined
CombinedSafetyGeneral
CombinedSafetyGeneral
$ 11,373,870——
—
—
5,507,139—
——
DeductionsBenefit Payments
Service Retirement -
Disability -
Other -
Member Refunds -
General
CombinedSafetyGeneralCombinedSafety
CombinedSafetyGeneral
CombinedSafetyGeneral
$ 39,555,877——
3,277,841—————
1,313,292——
Projected Unit Credit
—Year in Which the Total Unfunded Actuarial Liability is Expected to be Fully Amortized:
)(4,440,812
Level Percentage of Projected Covered Payroll
Statement of Plan Net Assets
Funded
Unfunded
Actuarial ValueActuarial
SalaryInterestValuationActuary: The Segal Company
Summary of Funding Position
of AssetsDate Rate Scale Liability Liability RatioAccrued
ActuarialAccruedFiscal
Year$ )(132,107,334 116.8%8.00% 4.00% 6/30/2011 $ 788,110,000 $ 920,217,3342012
)(170,112,187 122.5%8.00% 4.00%6/30/2010 756,257,538 926,369,7252011)(242,782,467 133.9%8.25% 4.30%6/30/2009 715,249,679 958,032,1462010)(291,128,410 142.2%8.25% 4.30%6/30/2008 689,832,998 980,961,4082009)(295,220,367 146.8%8.25% 4.25%6/30/2007 631,305,003 926,525,3702008)(233,602,592 138.1%8.25% 8.25%6/30/2006 613,913,079 847,515,6712007
Summary of Employer Contributions
UAAL as aPercentage of ARCAnnual RequiredRecognizedFiscal Year Contributions (ARC) Made Percentage of ACP
Contribution Annual CoveredPayroll (ACP)
2012 $ 11,373,870 $ 11,373,870 100 $ 117,577,340 -112% %2011 8,214,569 8,214,569 100 131,223,821 -130% %2010 3,267,115 3,267,115 100 139,274,148 -174% %2009 1,345,274 1,345,274 100 133,109,913 -219% %2008 354,894 354,894 100 122,231,947 -242% %2007 1,566,215 1,566,215 100 111,378,365 -210% %
103

Public Retirement Systems Annual Report — Fiscal Year 2011-12City of Fresno Employees' Retirement System — (Continued)
Contribution Rates as a Percentage of Covered Payroll
GeneralI II
SafetyI IIIII IV V VI IIIEmployer - Recommended by Actuary:
Normal CostUAAL Amortization
Total Rates Recommended by Actuary
Total Rates Adopted by BoardPrior Year Rates
Employee Rates Adopted by Board:Age 25Age 35Age 45Single Rate
10.70
10.70
—
—
—
—
—
—
% % % %
%
%
% % %
%%%%
% % % %
% % % %— — — —
— — — —
%
%—
—
10.70—
— —
— —
4.095.406.645.53
— — — —
— — — —
— —
— — — —
— —
— — — —
— —
— — — —
— —
— — — —
— —
— — — —
— —
— — — —
%%%%%
6/30/2011 11.09 — — — — — — — — 6/30/2010 10.62 — — — — — — — — 6/30/2009 10.56 — — — — — — — — 6/30/2008 10.93 — — — — — — — — 6/30/2007 10.51 — — — — — — — —
% % % % % % % % %
Retirement Benefit PoliciesGeneral
I IISafety
I IIIII IV V VI III
555
Eligibility:AgeYears of ServiceAge
Age
Age
Years of ServiceYears of Service
Years of Service
Years of Service Regardless of AgeAge Regardless of Service
Final Average Salary:Position Last HeldHighest Year(s) AverageFinal Year(s) Average
3—
——
——
——
——
——
——
——
——
Compensation at Time of Retirement
OtherNone
5%Maximum Annual IncreaseYIndex to Consumer Price Index
Index to Active Member IncreaseGranted Position Last HeldCost of Living:
Percent Per Year of Service: Age50556065
— 2.002.202.60
— — — —
— — — —
— — — —
— — — —
— — — —
— — — —
— — — —
— — — —
NSocial Security Coverage:
Disability benefit is based on the greater of: (1) 1.8% of final compensation for each year of service, (2) 1/3 of final compensation, or (3) service retirement.Benefit Comments:
Non-Service Disability - Per Year - Maximum
Service Disability - Per Year - Maximum
Disability Benefits as a Percentage ofFinal Average Salary (FAS):
— 33 %
— —
— —
— —
— —
— —
— —
— —
— —
— 33 %
— —
— —
— —
— —
— —
— —
— —
— —
Comments:Employees who are age 55 with five years of service may elect for the Deferred Retirement Option Plan (DROP). Retirement amount is calculated and monthly deposits are made to the employee's DROP account while the employee continues to work, up to a maximum of 10 years.
Retirement benefit is 2% multiplied by the number of years of non-DROP service (through the first 25 years), plus 1% of any years in excess of 25, multiplied by 1.0, 1.10, 1.30 for ages 55, 60, and 65, respectively.
Footnote:
(1) The system's actuarial surplus is being amortized on a level percentage of projected payroll over an open 15-year period.
104

Public Retirement Systems Annual Report — Fiscal Year 2011-12City of Fresno Fire and Police Retirement System
Single-Employer Plan
SurvivorsNon-ServiceServiceRetiredVested MembersNon-VestedVestedMembershipActive Inactive Service Disabled
Total Status
791 125 43 13 73 — 52 1,050 Open
146 — 1 348 277 4 233Safety - Tier 1 1,009 Closed
937Totals 125 44 361 350 4 238 2,059
Contributions
AssetsCash and Short-Term InvestmentsReceivables
InvestmentsOther
Investments, at Fair ValueU.S. Government ObligationsInternational BondsMunicipal BondsDomestic Corporate BondsDomestic Stocks
Total Assets
Mortgages
Accounts PayableInvestment Purchases PayableAccrued ExpensesOther Current Liabilities
Total Liabilities
International Stocks
Net Assets Available for Benefits
Liabilities
Total Additions
InterestDividends
Net Appreciation (Depreciation)
Other Investment Revenues in Fair Value of Investments
Statement of Changes in Plan Net Assets
$ 1,257,866,531
Real EstateVenture CapitalOther
$ 177,473,123
$ 1,080,393,408
$ 35,635,788
$ 24,213,690
Administration ExpensesOther Expenses
Total Deductions
Net Increase (Decrease) In Plan Assets
Beginning of the Year Net Assets Held
$ 53,031,858
$ )(28,818,168
as of June 30, 2012 for Period Ending June 30, 2012
$ 1,080,393,408
156,861,647——
151,155,546374,732,842239,969,361
—119,030,496
—132,221,856
—45,598,026
2,546,174
$ 1,154,87044,096,397
—132,221,856
14,850,77911,554,606
)(28,113,55449,347
Other Revenues 594,027
1,117,953—
$ 1,109,211,576
Fixed Assets Net of Accumulated DepreciationOther Assets
46,70668,089
in Trust for Pension Benefits
End of the Year Net Assets Heldin Trust for Pension Benefits
Investment Expenses
Adjustments —
Actuarial Cost Method:
Total UAAL Amortization Method:
Total UAAL Amortization Period: 15
—Years Remaining in Total UAAL Amortization Period:
AdditionsContributions
Employer -
Employee -
Other -
GeneralSafetyCombined
CombinedSafetyGeneral
CombinedSafetyGeneral
$ —22,875,005
—
—
—
—7,540,019
——
DeductionsBenefit Payments
Service Retirement -
Disability -
Other -
Member Refunds -
General
CombinedSafetyGeneralCombinedSafety
CombinedSafetyGeneral
CombinedSafetyGeneral
$ —30,672,642
——
20,706,357—————
534,906—
Entry Age
—Year in Which the Total Unfunded Actuarial Liability is Expected to be Fully Amortized:
)(5,136,539
Level Percentage of Projected Covered Payroll
Statement of Plan Net Assets
Funded
Unfunded
Actuarial ValueActuarial
SalaryInterestValuationActuary: The Segal Company
Summary of Funding Position
of AssetsDate Rate Scale Liability Liability RatioAccrued
ActuarialAccruedFiscal
Year$ )(105,055,168 111.4%8.00% 4.00%6/30/2011 $ 917,940,520 $ 1,022,995,6882012
)(99,319,734 110.8%8.00% 3.50%6/30/2010 919,285,576 1,018,605,3102011)(171,418,655 119.6%8.25% 3.75%6/30/2009 874,355,429 1,045,774,0842010)(236,742,025 128.5%8.25% 4.25%6/30/2008 830,035,820 1,066,777,8452009)(227,725,593 129.5%8.25% 4.25%6/30/2007 773,235,605 1,000,961,1982008)(183,500,609 125.4%8.25% 4.25%6/30/2006 722,722,173 906,222,7822007
Summary of Employer Contributions
UAAL as aPercentage of ARCAnnual RequiredRecognizedFiscal Year Contributions (ARC) Made Percentage of ACP
Contribution Annual CoveredPayroll (ACP)
2012 $ 22,875,005 $ 22,875,005 100 $ 98,999,730 -106% %2011 19,397,178 19,397,178 100 102,686,418 -97% %2010 12,094,355 12,094,355 100 102,354,704 -167% %2009 8,938,488 8,938,488 100 98,912,644 -239% %2008 8,766,066 8,766,066 100 89,516,195 -254% %2007 10,806,791 10,806,791 100 82,492,908 -222% %
105

Public Retirement Systems Annual Report — Fiscal Year 2011-12City of Fresno Fire and Police Retirement System — (Continued)
Contribution Rates as a Percentage of Covered Payroll
GeneralI II
SafetyI IIIII IV V VI IIIEmployer - Recommended by Actuary:
Normal CostUAAL Amortization
Total Rates Recommended by Actuary
Total Rates Adopted by BoardPrior Year Rates
Employee Rates Adopted by Board:Age 25Age 35Age 45Single Rate
—
—
—
—
26.57
26.57
19.77
19.77
% % % %
% % %
%
%
%
%%%
%
% % % %
% % % %— — — —
— — — —
%
%—
—
— —
— —
— —
— — — —
— — — —
— — — —
— —
— — — —
— —
— — — —
— —
— — — —
26.57—
5.246.787.09—
19.77—
— — —
9.00
— —
— — — —
%%%%%
%%%%%
6/30/2011 — — — — — — 26.43 18.60 — 6/30/2010 — — — — — — 26.38 18.49 — 6/30/2009 — — — — — — 25.25 17.34 — 6/30/2008 — — — — — — 25.66 16.28 — 6/30/2007 — — — — — — 25.71 17.43 —
% % % % % % % % %
Retirement Benefit PoliciesGeneral
I IISafety
I IIIII IV V VI IIIEligibility:AgeYears of ServiceAge
Age
Age
Years of ServiceYears of Service
Years of Service
Years of Service Regardless of AgeAge Regardless of Service
5010
65
505
65
Final Average Salary:Position Last HeldHighest Year(s) AverageFinal Year(s) Average
——
——
——
——
——
——
—3
3—
——
Compensation at Time of Retirement
OtherNone
3%5%Maximum Annual IncreaseYIndex to Consumer Price Index
YIndex to Active Member IncreaseGranted Position Last HeldCost of Living:
Percent Per Year of Service: Age50556065
— — — —
— — — —
— — — —
— — — —
— — — —
— — — —
2.752.002.00—
2.002.702.702.70
— — — —
NSocial Security Coverage: N
Benefit Comments:
Non-Service Disability - Per Year - Maximum
Service Disability - Per Year - Maximum
Disability Benefits as a Percentage ofFinal Average Salary (FAS):
— —
— —
— —
— —
— —
— —
— 36 %
— 33 %
— —
— —
— —
— —
— —
— —
— —
— 55 %
— 50 %
— —
Comments:Employees who are age 50 with 10 years of service for Safety Tier I or five years of service for Safety tier II may elect for the Deferred Retirement Option Plan (DROP). The retirement amount is calculated and monthly deposits are made to the employee's DROP account while the employee continues to work, up to a maximum of 10 years.
106

Public Retirement Systems Annual Report — Fiscal Year 2011-12City of Irvine Safety Defined Benefit Pension Plan
Single-Employer Plan
SurvivorsNon-ServiceServiceRetiredVested MembersNon-VestedVestedMembershipActive Inactive Service Disabled
Total Status
3 — 3 6 24 — —Safety - Tier 1 36 Closed
3Totals — 3 6 24 — — 36
Contributions
AssetsCash and Short-Term InvestmentsReceivables
InvestmentsOther
Investments, at Fair ValueU.S. Government ObligationsInternational BondsMunicipal BondsDomestic Corporate BondsDomestic Stocks
Total Assets
Mortgages
Accounts PayableInvestment Purchases PayableAccrued ExpensesOther Current Liabilities
Total Liabilities
International Stocks
Net Assets Available for Benefits
Liabilities
Total Additions
InterestDividends
Net Appreciation (Depreciation)
Other Investment Revenues in Fair Value of Investments
Statement of Changes in Plan Net Assets
$ 18,081,926
Real EstateVenture CapitalOther
$ 26,751
$ 18,055,175
$ 18,081,878
$ 1,160,984
Administration ExpensesOther Expenses
Total Deductions
Net Increase (Decrease) In Plan Assets
Beginning of the Year Net Assets Held
$ 1,076,483
$ 84,501
as of December 31, 2011 for Period Ending December 31, 2011
$ 18,055,175
——————————
—48—
$ ——
26,751—
5,447—
952,376—
Other Revenues —
4,650—
$ 17,970,674
Fixed Assets Net of Accumulated DepreciationOther Assets
——
in Trust for Pension Benefits
End of the Year Net Assets Heldin Trust for Pension Benefits
Investment Expenses
Adjustments —
Actuarial Cost Method:
Total UAAL Amortization Method:
Total UAAL Amortization Period: 10
10Years Remaining in Total UAAL Amortization Period:
AdditionsContributions
Employer -
Employee -
Other -
GeneralSafetyCombined
CombinedSafetyGeneral
CombinedSafetyGeneral
$ —311,663
—
—
—
——
——
DeductionsBenefit Payments
Service Retirement -
Disability -
Other -
Member Refunds -
General
CombinedSafetyGeneralCombinedSafety
CombinedSafetyGeneral
CombinedSafetyGeneral
$ —289,647
——
782,186———————
Entry Age
—Year in Which the Total Unfunded Actuarial Liability is Expected to be Fully Amortized:
)(108,502
Level Percentage of Projected Covered Payroll
Statement of Plan Net Assets
Funded
Unfunded
Actuarial ValueActuarial
SalaryInterestValuationActuary: BRYAN, PENDLETONE, SWATS & MCALLISTER LLC
Summary of Funding Position
of AssetsDate Rate Scale Liability Liability RatioAccrued
ActuarialAccruedFiscal
Year$ 1,257,223 93.5%5.50% 5.00%1/1/2010 $ 19,422,816 $ 18,165,5932012
1,257,223 93.5%5.50% 5.00%1/1/2010 19,422,816 18,165,5932011278,773 98.5%5.50% 5.00%1/1/2008 19,070,867 18,792,0942010278,773 98.5%5.50% 5.00%1/1/2008 19,070,867 18,792,0942009
— 100.0%5.50% 5.00%1/1/2006 17,366,549 17,366,5492008— 100.0%5.50% 5.00%1/1/2006 17,366,549 17,366,5492007
Summary of Employer Contributions
UAAL as aPercentage of ARCAnnual RequiredRecognizedFiscal Year Contributions (ARC) Made Percentage of ACP
Contribution Annual CoveredPayroll (ACP)
2012 $ 303,258 $ 311,663 103 $ 313,265 401% %2011 303,258 236,653 78 313,265 401% %2010 156,819 235,126 150 297,026 94% %2009 156,819 228,424 146 273,538 102% %2008 186,404 230,482 124 334,996 —% %2007 212,488 218,968 103 334,996 —% %
107

Public Retirement Systems Annual Report — Fiscal Year 2011-12City of Irvine Safety Defined Benefit Pension Plan — (Continued)
Contribution Rates as a Percentage of Covered Payroll
GeneralI II
SafetyI IIIII IV V VI IIIEmployer - Recommended by Actuary:
Normal CostUAAL Amortization
Total Rates Recommended by Actuary
Total Rates Adopted by BoardPrior Year Rates
Employee Rates Adopted by Board:Age 25Age 35Age 45Single Rate
—
—
—
—
96.81
104.10
—
—
% % % %
% % %
%
%
% % % %
% % % %— — — —
— — — —
%
%—
—
— —
— —
— —
— — — —
— — — —
— — — —
— —
— — — —
— —
— — — —
— —
— — — —
96.81—
— — — —
— —
— — — —
— —
— — — —
%%%%%
12/31/2010 — — — — — — 79.16 — — 12/31/2009 — — — — — — 79.16 — — 12/31/2008 — — — — — — 79.16 — — 12/31/2007 — — — — — — 79.16 — — 12/31/2006 — — — — — — 63.78 — —
% % % % % % % % %
Retirement Benefit PoliciesGeneral
I IISafety
I IIIII IV V VI IIIEligibility:AgeYears of ServiceAge
Age
Age
Years of ServiceYears of Service
Years of Service
Years of Service Regardless of AgeAge Regardless of Service
505
Final Average Salary:Position Last HeldHighest Year(s) AverageFinal Year(s) Average
——
——
——
——
——
——
1—
——
——
Compensation at Time of Retirement
OtherNone
2%Maximum Annual IncreaseIndex to Consumer Price IndexIndex to Active Member IncreaseGranted Position Last HeldCost of Living:
Percent Per Year of Service: Age50556065
— — — —
— — — —
— — — —
— — — —
— — — —
— — — —
2.503.00— —
— — — —
— — — —
Social Security Coverage:
Benefit Comments:
Non-Service Disability - Per Year - Maximum
Service Disability - Per Year - Maximum
Disability Benefits as a Percentage ofFinal Average Salary (FAS):
— —
— —
— —
— —
— —
— —
— 50 %
— —
— —
— —
— —
— —
— —
— —
— —
— 50 %
— —
— —
108

Public Retirement Systems Annual Report — Fiscal Year 2011-12City of Los Angeles Fire and Police Employees' Pension System
Single-Employer Plan
SurvivorsNon-ServiceServiceRetiredVested MembersNon-VestedVestedMembershipActive Inactive Service Disabled
Total Status
4,514 8,794 62 2,669 395 — 1813 16,615 Open
87 — — 5,048 1,673 — 1,8142 8,622 Closed
— — — 113 115 — 372Safety - Tier 1 600 Closed
4,601Totals 8,794 62 7,830 2,183 — 2,367 25,837
Contributions
AssetsCash and Short-Term InvestmentsReceivables
InvestmentsOther
Investments, at Fair ValueU.S. Government ObligationsInternational BondsMunicipal BondsDomestic Corporate BondsDomestic Stocks
Total Assets
Mortgages
Accounts PayableInvestment Purchases PayableAccrued ExpensesOther Current Liabilities
Total Liabilities
International Stocks
Net Assets Available for Benefits
Liabilities
Total Additions
InterestDividends
Net Appreciation (Depreciation)
Other Investment Revenues in Fair Value of Investments
Statement of Changes in Plan Net Assets
$ 14,934,754,582
Real EstateVenture CapitalOther
$ 1,587,680,206
$ 13,347,074,376
$ 497,820,310
$ 669,026,583
Administration ExpensesOther Expenses
Total Deductions
Net Increase (Decrease) In Plan Assets
Beginning of the Year Net Assets Held
$ 846,140,010
$ )(177,113,427
as of June 30, 2012 for Period Ending June 30, 2012
$ 13,347,074,376
1,682,432,38417,405,729
—1,374,946,3215,003,234,9542,137,109,111
—1,158,264,5411,691,150,7491,202,971,011
5,144,476164,274,996
—
$ 7,570,804165,721,870
17,260,7151,397,126,817
113,081,586169,456,008
)(91,411,39782,952,886
Other Revenues 1,876,735
13,610,954—
$ 13,524,187,803
Fixed Assets Net of Accumulated DepreciationOther Assets
——
in Trust for Pension Benefits
End of the Year Net Assets Heldin Trust for Pension Benefits
Investment Expenses
Adjustments —
Actuarial Cost Method:
Total UAAL Amortization Method:
Total UAAL Amortization Period: 70
24Years Remaining in Total UAAL Amortization Period:
AdditionsContributions
Employer -
Employee -
Other -
GeneralSafetyCombined
CombinedSafetyGeneral
CombinedSafetyGeneral
$ —321,593,433
—
—
—
—120,099,124
——
DeductionsBenefit Payments
Service Retirement -
Disability -
Other -
Member Refunds -
General
CombinedSafetyGeneralCombinedSafety
CombinedSafetyGeneral
CombinedSafetyGeneral
$ —604,219,152
——
116,390,537——
110,580,865——
1,338,502—
Entry Age
2037Year in Which the Total Unfunded Actuarial Liability is Expected to be Fully Amortized:
)(48,621,792
Level Percentage of Projected Covered Payroll
Statement of Plan Net Assets
Funded
Unfunded
Actuarial ValueActuarial
SalaryInterestValuationActuary: The Segal Company
Summary of Funding Position
of AssetsDate Rate Scale Liability Liability RatioAccrued
ActuarialAccruedFiscal
Year$ 2,778,919,652 83.7%7.75% 8.50%6/30/2012 $ 17,030,833,184 $ 14,251,913,5322012
2,278,806,857 86.3%7.75% 9.34%6/30/2011 16,616,476,266 14,337,669,40920111,301,043,651 91.6%7.75% 9.34%6/30/2010 15,520,624,313 14,219,580,6622010
560,535,275 96.2%8.00% 9.59%6/30/2009 14,817,145,691 14,256,610,4162009125,819,620 99.1%8.00% 9.59%6/30/2008 14,279,115,742 14,153,296,1222008108,421,170 99.2%8.00% 9.59%6/30/2007 13,324,089,628 13,215,668,4582007
Summary of Employer Contributions
UAAL as aPercentage of ARCAnnual RequiredRecognizedFiscal Year Contributions (ARC) Made Percentage of ACP
Contribution Annual CoveredPayroll (ACP)
2012 $ 321,593,433 $ 321,593,433 100 $ 1,341,913,740 207% %2011 277,092,251 277,092,251 100 1,343,963,356 170% %2010 250,516,858 250,516,858 100 1,356,986,476 96% %2009 238,697,929 238,697,929 100 1,357,248,936 41% %2008 261,635,491 261,635,491 100 1,206,589,277 10% %2007 224,946,082 224,946,082 100 1,135,591,951 10% %
109

Public Retirement Systems Annual Report — Fiscal Year 2011-12City of Los Angeles Fire and Police Employees' Pension System — (Continued)
Contribution Rates as a Percentage of Covered Payroll
GeneralI II
SafetyI IIIII IV V VI IIIEmployer - Recommended by Actuary:
Normal CostUAAL Amortization
Total Rates Recommended by Actuary
Total Rates Adopted by BoardPrior Year Rates
Employee Rates Adopted by Board:Age 25Age 35Age 45Single Rate
—
—
—
—
—
—
24.85
24.85
% % % %
% % % %
%
%
% % % %
% % % %— — — —
— — — —
%
%
%
%
25.97
25.97
— —
— —
— —
— — — —
— — — —
— — — —
— —
— — — —
— —
— — — —
— —
— — — —
— —
— — — —
25.88-1.03
— — —
7.00
18.207.77
— — —
8.00
%%%%%
%%%%%
6/30/2011 — — — — — — — 20.54 22.126/30/2010 — — — — — — — 20.41 23.006/30/2009 — — — — — — — 19.94 20.816/30/2008 — — — — — — — 19.01 20.326/30/2007 — — — — — — — 48.14 34.13
% % % % % % % % %
Retirement Benefit PoliciesGeneral
I IISafety
I IIIII IV V VI IIIEligibility:AgeYears of ServiceAge
Age
Age
Years of ServiceYears of Service
Years of Service
Years of Service Regardless of AgeAge Regardless of Service
5010
20 20 20
Final Average Salary:Position Last HeldHighest Year(s) AverageFinal Year(s) Average
——
——
——
——
——
——
Y—3Y
—1Y
—1Y
Compensation at Time of Retirement
OtherNoneMaximum Annual Increase
YYYIndex to Consumer Price IndexIndex to Active Member IncreaseGranted Position Last HeldCost of Living:
Percent Per Year of Service: Age50556065
— — — —
— — — —
— — — —
— — — —
— — — —
— — — —
2.002.002.002.00
2.002.002.002.00
2.002.002.002.00
NNSocial Security Coverage: N
Benefit Comments:
Non-Service Disability - Per Year - Maximum
Service Disability - Per Year - Maximum
Disability Benefits as a Percentage ofFinal Average Salary (FAS):
— —
— —
— —
— —
— —
— —
— 40 %
— 40 %
— 50 %
— —
— —
— —
— —
— —
— —
— 90 %
— 90 %
2 %90 %
110

Public Retirement Systems Annual Report — Fiscal Year 2011-12City of Los Angeles Fire and Police Employees' Pension System — (Continued)
Comments:As of June 30, 2012, the City of Los Angeles Fire and Police Employees' Pension System (System) was composed of five tiers. For publication purposes only, Safety Tier III includes Safety members from Tiers 3, 4, 5, and 6. Individual Tier membership is as follows: Safety Tier 3 = 1,448; Safety Tier 4 = 582; Safety Tier 5 = 14,325; Safety Tier 6 = 355.
Tier 6 was established for all Firefighters and Police Officers hired on or after July 1, 2011. It is also the current tier for all Harbor Port Police officers hired on or after July 1, 2011.
Employer contribution rates for Safety Tiers 4 , 5 are as follows:
Tier 4 Tier 5 Normal 16.87% 20.34% UAAL 9.73 % 6.69 %Total 26.6 % 27.03%
Employee Rates: 8.00% 9.00%
Retirement benefits range is as follows: Tier I is given 40% to 66 2/3% of normal pension base (NPB). Tier II is given 2% of NPB per year of service to a maximum of 70% of NPB. Tier III is given 2% of Final Average Salary (FAS) per year of service to a maximum of 70% of FAS. Tier IV is given 40% of FAS to a maximum of 70% FAS. Tier V is given 50% of FAS to a maximum of 90% of FAS.
Effective May 1, 2002, and through April 30, 2007, members of the System have the option to enroll in the Deferred Retirement Option Plan (DROP) under Section 4.2100 of the Administrative Code. Members who enroll in DROP continue to work and receive their active salary for up to five years. Enrolled members continue to contribute to the System until they have completed the maximum number of years required for their tier but cease to earn additional retirement service and pay credits. Monthly pension benefits that would have been paid to enrolled members are credited into their DROP accounts. DROP account balances will earn interest at an annual rate of 5%.
Once the DROP participation period ends, enrolled members must terminate active employment. They then receive proceeds from their DROP accounts and monthly benefits based on their service and salary at the beginning date of the DROP, plus applicable cost-of-living adjustments.
At June 30, 2012, 1,193 pensioners were enrolled in the DROP program, with a total estimated value of all DROP accounts of $237 million.
111

Public Retirement Systems Annual Report — Fiscal Year 2011-12City of Los Angeles Water and Power Employees' Retirement Plan
Single-Employer Plan
SurvivorsNon-ServiceServiceRetiredVested MembersNon-VestedVestedMembershipActive Inactive Service Disabled
Total Status
8,777 319 697 6,686 — — 2,023General - Tier 1 18,502 Open
8,777Totals 319 697 6,686 — — 2,023 18,502
Contributions
AssetsCash and Short-Term InvestmentsReceivables
InvestmentsOther
Investments, at Fair ValueU.S. Government ObligationsInternational BondsMunicipal BondsDomestic Corporate BondsDomestic Stocks
Total Assets
Mortgages
Accounts PayableInvestment Purchases PayableAccrued ExpensesOther Current Liabilities
Total Liabilities
International Stocks
Net Assets Available for Benefits
Liabilities
Total Additions
InterestDividends
Net Appreciation (Depreciation)
Other Investment Revenues in Fair Value of Investments
Statement of Changes in Plan Net Assets
$ 8,099,256,540
Real EstateVenture CapitalOther
$ 715,112,664
$ 7,384,143,876
$ 252,467,958
$ 393,806,154
Administration ExpensesOther Expenses
Total Deductions
Net Increase (Decrease) In Plan Assets
Beginning of the Year Net Assets Held
$ 419,999,200
$ )(26,193,046
as of June 30, 2012 for Period Ending June 30, 2012
$ 7,384,143,876
466,463,0687,917,740
—1,555,627,1383,289,722,6091,144,005,113
—199,990,468
—971,106,492
43,142,660146,890,566
21,922,728
$ 6,028,334213,476,355
5,580,328490,027,647
111,719,55572,539,059
)(166,352,5689,669,366
Other Revenues 4,942,048
3,658,237—
$ 7,410,336,922
Fixed Assets Net of Accumulated DepreciationOther Assets
——
in Trust for Pension Benefits
End of the Year Net Assets Heldin Trust for Pension Benefits
Investment Expenses
Adjustments —
Actuarial Cost Method:
Total UAAL Amortization Method:
Total UAAL Amortization Period: 15
—Years Remaining in Total UAAL Amortization Period:
AdditionsContributions
Employer -
Employee -
Other -
GeneralSafetyCombined
CombinedSafetyGeneral
CombinedSafetyGeneral
$ 321,688,919——
—
—
60,088,614—
——
DeductionsBenefit Payments
Service Retirement -
Disability -
Other -
Member Refunds -
General
CombinedSafetyGeneralCombinedSafety
CombinedSafetyGeneral
CombinedSafetyGeneral
$ 410,814,067————————
5,526,896——
Any changes amortized over separate 15 years
Entry Age
—Year in Which the Total Unfunded Actuarial Liability is Expected to be Fully Amortized:
)(20,488,839
Other
Statement of Plan Net Assets
Funded
Unfunded
Actuarial ValueActuarial
SalaryInterestValuationActuary: The Segal company
Summary of Funding Position
of AssetsDate Rate Scale Liability Liability RatioAccrued
ActuarialAccruedFiscal
Year$ 2,118,717,098 78.1%7.75% 5.35% 7/1/2012 $ 9,692,602,852 $ 7,573,885,7542012
1,832,020,675 80.3%7.75% 5.35%7/1/2011 9,297,204,318 7,465,183,64320111,649,188,744 81.5%8.00% 5.29%7/1/2010 8,893,618,433 7,244,429,6892010
808,339,698 90.0%8.00% 5.29%7/1/2009 8,057,060,950 7,248,721,2522009371,249,702 95.1%8.00% 5.29%7/1/2008 7,619,102,935 7,247,853,2332008598,807,805 91.5%8.00% 5.50%7/1/2006 7,046,571,241 6,447,763,4362007
Summary of Employer Contributions
UAAL as aPercentage of ARCAnnual RequiredRecognizedFiscal Year Contributions (ARC) Made Percentage of ACP
Contribution Annual CoveredPayroll (ACP)
2012 $ 336,874,865 $ 321,688,919 95 $ 886,539,366 239% %2011 304,431,910 286,699,384 94 870,203,423 211% %2010 200,578,728 201,033,238 100 856,089,559 193% %2009 141,291,588 145,941,275 103 805,137,795 100% %2008 144,743,767 141,862,126 98 708,731,840 52% %2007 141,464,198 129,154,539 91 635,728,131 94% %
112

Public Retirement Systems Annual Report — Fiscal Year 2011-12City of Los Angeles Water and Power Employees' Retirement Plan — (Continued)
Contribution Rates as a Percentage of Covered Payroll
GeneralI II
SafetyI IIIII IV V VI IIIEmployer - Recommended by Actuary:
Normal CostUAAL Amortization
Total Rates Recommended by Actuary
Total Rates Adopted by BoardPrior Year Rates
Employee Rates Adopted by Board:Age 25Age 35Age 45Single Rate
41.82
41.82
—
—
—
—
—
—
% % % %
%
%
% % %
%%%%
% % % %
% % % %— — — —
— — — —
%
%—
—
15.0826.74
— —
— —
3.104.165.386.00
— — — —
— — — —
— —
— — — —
— —
— — — —
— —
— — — —
— —
— — — —
— —
— — — —
— —
— — — —
%%%%%
6/30/2011 38.45 — — — — — — — — 6/30/2010 26.12 — — — — — — — — 6/30/2009 20.28 — — — — — — — — 6/30/2008 21.59 — — — — — — — — 6/30/2007 22.25 — — — — — — — —
(1)
% % % % % % % % %
Retirement Benefit PoliciesGeneral
I IISafety
I IIIII IV V VI III
605
Eligibility:AgeYears of ServiceAge
Age
Age
Years of ServiceYears of Service
Years of Service
Years of Service Regardless of AgeAge Regardless of Service
5510
30
Final Average Salary:Position Last HeldHighest Year(s) AverageFinal Year(s) Average
1—
——
——
——
——
——
——
——
——
Compensation at Time of Retirement
OtherNone
3%Maximum Annual IncreaseYIndex to Consumer Price Index
Index to Active Member IncreaseGranted Position Last HeldCost of Living:
Percent Per Year of Service: Age50556065
— — — —
— — — —
— — — —
— — — —
— — — —
— — — —
— — — —
— — — —
— — — —
NSocial Security Coverage:
Retirement benefit is 2.1% multiplied by Years of Service, Average Salary, not to exceed 100% of salary. If retired at 55 with 30 years of service, 2.3% is used. If a member receiving permanent and total disability benefits, a member may elect to retire.
Benefit Comments:
Non-Service Disability - Per Year - Maximum
Service Disability - Per Year - Maximum
Disability Benefits as a Percentage ofFinal Average Salary (FAS):
— —
— —
— —
— —
— —
— —
— —
— —
— —
— —
— —
— —
— —
— —
— —
— —
— —
— —
Footnote:
(1) The single rate applies to employees hired after June 1, 1984.
113
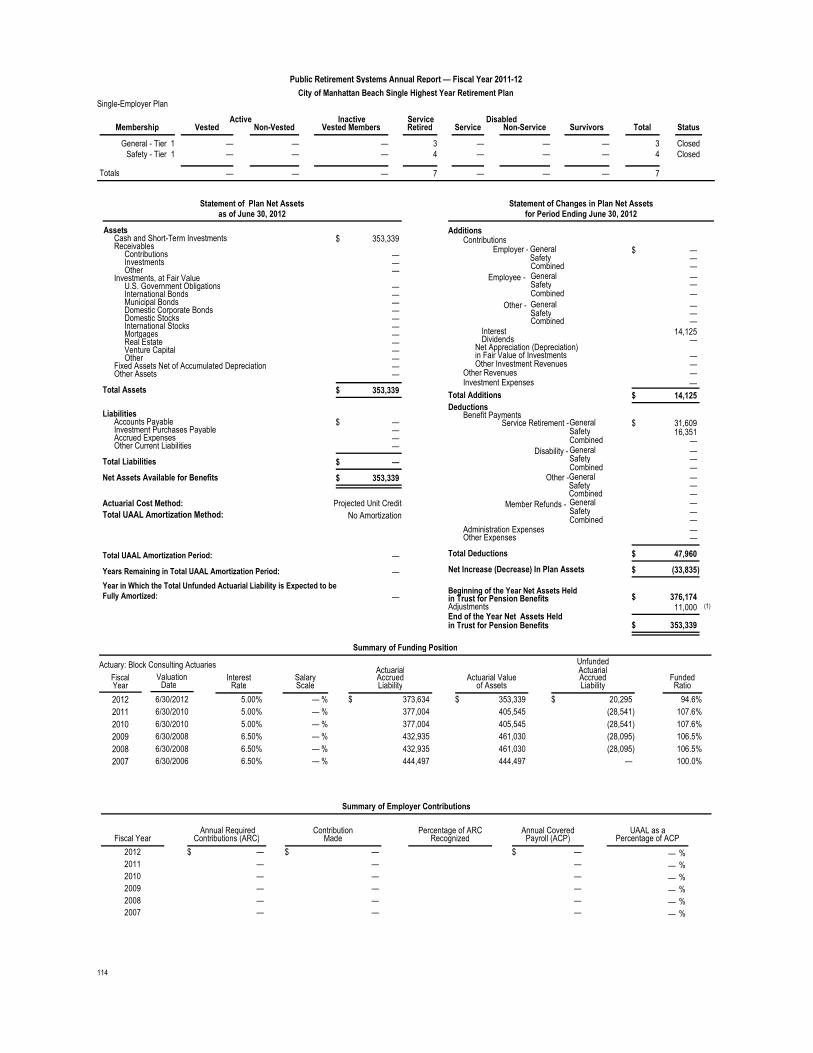
Public Retirement Systems Annual Report — Fiscal Year 2011-12City of Manhattan Beach Single Highest Year Retirement Plan
Single-Employer Plan
SurvivorsNon-ServiceServiceRetiredVested MembersNon-VestedVestedMembershipActive Inactive Service Disabled
Total Status
— — — 3 — — —General - Tier 1 3 Closed
— — — 4 — — —Safety - Tier 1 4 Closed
—Totals — — 7 — — — 7
Contributions
AssetsCash and Short-Term InvestmentsReceivables
InvestmentsOther
Investments, at Fair ValueU.S. Government ObligationsInternational BondsMunicipal BondsDomestic Corporate BondsDomestic Stocks
Total Assets
Mortgages
Accounts PayableInvestment Purchases PayableAccrued ExpensesOther Current Liabilities
Total Liabilities
International Stocks
Net Assets Available for Benefits
Liabilities
Total Additions
InterestDividends
Net Appreciation (Depreciation)
Other Investment Revenues in Fair Value of Investments
Statement of Changes in Plan Net Assets
$ 353,339
Real EstateVenture CapitalOther
$ —
$ 353,339
$ 353,339
$ 14,125
Administration ExpensesOther Expenses
Total Deductions
Net Increase (Decrease) In Plan Assets
Beginning of the Year Net Assets Held
$ 47,960
$ )(33,835
as of June 30, 2012 for Period Ending June 30, 2012
$ 353,339
——————————
———
$ ————
14,125—
——
Other Revenues —
——
$ 376,174
Fixed Assets Net of Accumulated DepreciationOther Assets
——
in Trust for Pension Benefits
End of the Year Net Assets Heldin Trust for Pension Benefits
Investment Expenses
Adjustments 11,000
Actuarial Cost Method:
Total UAAL Amortization Method:
Total UAAL Amortization Period: —
—Years Remaining in Total UAAL Amortization Period:
AdditionsContributions
Employer -
Employee -
Other -
GeneralSafetyCombined
CombinedSafetyGeneral
CombinedSafetyGeneral
$ ———
—
—
——
——
DeductionsBenefit Payments
Service Retirement -
Disability -
Other -
Member Refunds -
General
CombinedSafetyGeneralCombinedSafety
CombinedSafetyGeneral
CombinedSafetyGeneral
$ 31,60916,351
——————————
Projected Unit Credit
—Year in Which the Total Unfunded Actuarial Liability is Expected to be Fully Amortized:
—
(1)
No Amortization
Statement of Plan Net Assets
Funded
Unfunded
Actuarial ValueActuarial
SalaryInterestValuationActuary: Block Consulting Actuaries
Summary of Funding Position
of AssetsDate Rate Scale Liability Liability RatioAccrued
ActuarialAccruedFiscal
Year$ 20,295 94.6%5.00% — % 6/30/2012 $ 373,634 $ 353,3392012
)(28,541 107.6%5.00% — %6/30/2010 377,004 405,5452011)(28,541 107.6%5.00% — %6/30/2010 377,004 405,5452010)(28,095 106.5%6.50% — %6/30/2008 432,935 461,0302009)(28,095 106.5%6.50% — %6/30/2008 432,935 461,0302008
— 100.0%6.50% — %6/30/2006 444,497 444,4972007
Summary of Employer Contributions
UAAL as aPercentage of ARCAnnual RequiredRecognizedFiscal Year Contributions (ARC) Made Percentage of ACP
Contribution Annual CoveredPayroll (ACP)
2012 $ — $ — $ — — %2011 — — — — %2010 — — — — %2009 — — — — %2008 — — — — %2007 — — — — %
114

Public Retirement Systems Annual Report — Fiscal Year 2011-12City of Manhattan Beach Single Highest Year Retirement Plan — (Continued)
Contribution Rates as a Percentage of Covered Payroll
GeneralI II
SafetyI IIIII IV V VI IIIEmployer - Recommended by Actuary:
Normal CostUAAL Amortization
Total Rates Recommended by Actuary
Total Rates Adopted by BoardPrior Year Rates
Employee Rates Adopted by Board:Age 25Age 35Age 45Single Rate
—
—
—
—
—
—
—
—
% % % %
% % % %
% % % %
% % % %— — — —
— — — —
%
%—
—
— —
— —
— —
— — — —
— — — —
— — — —
— —
— — — —
— —
— — — —
— —
— — — —
— —
— — — —
— —
— — — —
— —
— — — —
6/30/2011 — — — — — — — — — 6/30/2010 — — — — — — — — — 6/30/2009 — — — — — — — — — 6/30/2008 — — — — — — — — — 6/30/2007 — — — — — — — — —
% % % % % % % % %
Retirement Benefit PoliciesGeneral
I IISafety
I IIIII IV V VI III
60Eligibility:AgeYears of ServiceAge
Age
Age
Years of ServiceYears of Service
Years of Service
Years of Service Regardless of AgeAge Regardless of Service 60
50
50
Final Average Salary:Position Last HeldHighest Year(s) AverageFinal Year(s) Average
——Y
——
——
——
——
——
——Y
——
——
Compensation at Time of Retirement
OtherNone
2%2%Maximum Annual IncreaseIndex to Consumer Price IndexIndex to Active Member IncreaseGranted Position Last HeldCost of Living:
Percent Per Year of Service: Age50556065
— — — —
— — — —
— — — —
— — — —
— — — —
— — — —
— — — —
— — — —
— — — —
NSocial Security Coverage: N
The only policy is that the cost-of-living increase and payments cease upon death of the member. No disability benefits are provided.Benefit Comments:
Non-Service Disability - Per Year - Maximum
Service Disability - Per Year - Maximum
Disability Benefits as a Percentage ofFinal Average Salary (FAS):
— —
— —
— —
— —
— —
— —
— —
— —
— —
— —
— —
— —
— —
— —
— —
— —
— —
— —
Comments:This plan was adopted effective January 1, 1990; it covers management/confidential employees and non-management/confidential sworn police employees on July 1, 1990, and is for employees who retired prior to May 1993. The plan pays a retiring employee the difference between the pension payable from CalPERS and what the CalPERS pension would be if it were based on the single highest year only. The City of Manhattan Beach has ceded the liabilities of active participants in the plan to CalPERS as of July 1, 1993.
The plan is currently dormant, with payments being made from interest earnings and accumulated balances. Footnote:
(1) Trasnfer of assets from City Supplemental Retirement Plan.
115

Public Retirement Systems Annual Report — Fiscal Year 2011-12City of Manhattan Beach Supplemental Retirement Plan
Single-Employer Plan
SurvivorsNon-ServiceServiceRetiredVested MembersNon-VestedVestedMembershipActive Inactive Service Disabled
Total Status
— — — 5 — — —General - Tier 1 5 Closed
—Totals — — 5 — — — 5
Contributions
AssetsCash and Short-Term InvestmentsReceivables
InvestmentsOther
Investments, at Fair ValueU.S. Government ObligationsInternational BondsMunicipal BondsDomestic Corporate BondsDomestic Stocks
Total Assets
Mortgages
Accounts PayableInvestment Purchases PayableAccrued ExpensesOther Current Liabilities
Total Liabilities
International Stocks
Net Assets Available for Benefits
Liabilities
Total Additions
InterestDividends
Net Appreciation (Depreciation)
Other Investment Revenues in Fair Value of Investments
Statement of Changes in Plan Net Assets
$ 133,653
Real EstateVenture CapitalOther
$ —
$ 133,653
$ 133,653
$ 5,951
Administration ExpensesOther Expenses
Total Deductions
Net Increase (Decrease) In Plan Assets
Beginning of the Year Net Assets Held
$ 19,334
$ )(13,383
as of June 30, 2012 for Period Ending June 30, 2012
$ 133,653
——————————
———
$ ————
5,951—
——
Other Revenues —
——
$ 158,036
Fixed Assets Net of Accumulated DepreciationOther Assets
——
in Trust for Pension Benefits
End of the Year Net Assets Heldin Trust for Pension Benefits
Investment Expenses
Adjustments )(11,000
Actuarial Cost Method:
Total UAAL Amortization Method:
Total UAAL Amortization Period: —
—Years Remaining in Total UAAL Amortization Period:
AdditionsContributions
Employer -
Employee -
Other -
GeneralSafetyCombined
CombinedSafetyGeneral
CombinedSafetyGeneral
$ ———
—
—
——
——
DeductionsBenefit Payments
Service Retirement -
Disability -
Other -
Member Refunds -
General
CombinedSafetyGeneralCombinedSafety
CombinedSafetyGeneral
CombinedSafetyGeneral
$ 19,334———————————
Projected Unit Credit
—Year in Which the Total Unfunded Actuarial Liability is Expected to be Fully Amortized:
—
(1)
No Amortization
Statement of Plan Net Assets
Funded
Unfunded
Actuarial ValueActuarial
SalaryInterestValuationActuary: Block Consulting Actuaries
Summary of Funding Position
of AssetsDate Rate Scale Liability Liability RatioAccrued
ActuarialAccruedFiscal
Year$ )(470 100.4%5.00% — % 6/30/2012 $ 133,183 $ 133,6532012
)(33,394 124.5%5.00% — %6/30/2010 136,197 169,591201113,935 92.6%5.00% — %6/30/2010 189,506 175,5712010
)(4,121 102.2%6.50% — %6/30/2008 189,506 193,6272009)(4,121 102.2%6.50% — %6/30/2008 189,506 193,6272008
— 100.0%6.50% — %6/30/2006 192,805 192,8052007
Summary of Employer Contributions
UAAL as aPercentage of ARCAnnual RequiredRecognizedFiscal Year Contributions (ARC) Made Percentage of ACP
Contribution Annual CoveredPayroll (ACP)
2012 $ — $ — $ — — %2011 — — — — %2010 — — — — %2009 — — — — %2008 — — — — %2007 — — — — %
116
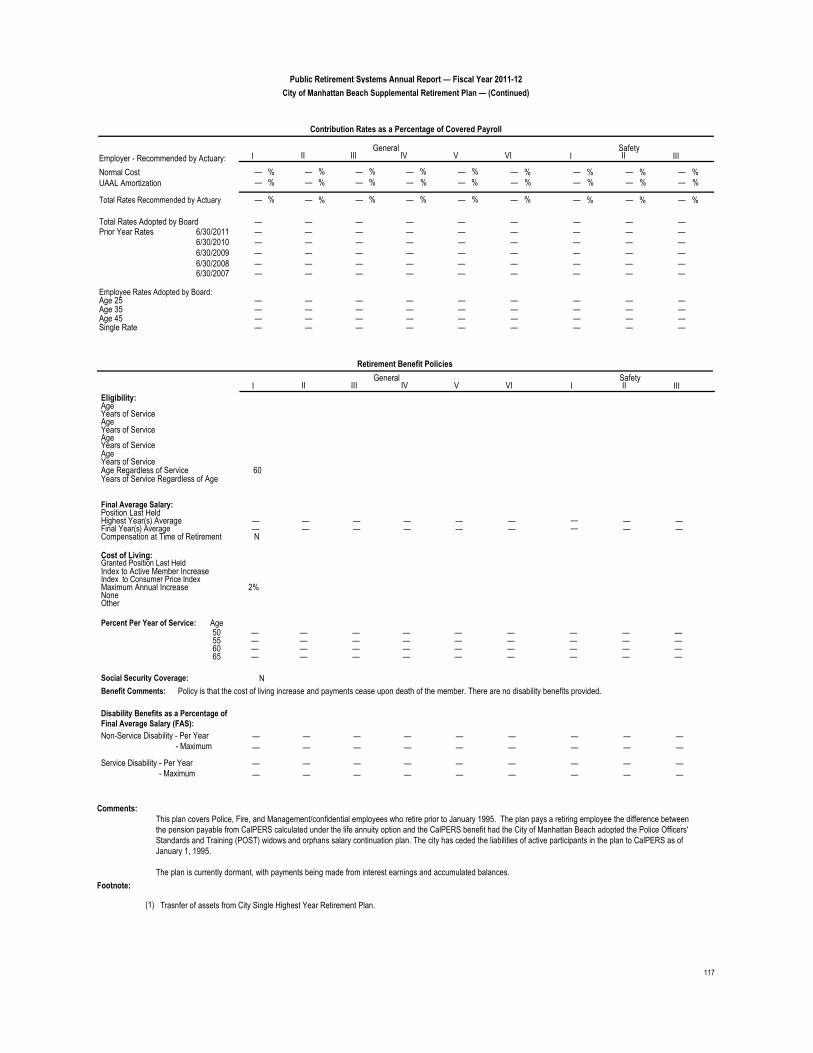
Public Retirement Systems Annual Report — Fiscal Year 2011-12City of Manhattan Beach Supplemental Retirement Plan — (Continued)
Contribution Rates as a Percentage of Covered Payroll
GeneralI II
SafetyI IIIII IV V VI IIIEmployer - Recommended by Actuary:
Normal CostUAAL Amortization
Total Rates Recommended by Actuary
Total Rates Adopted by BoardPrior Year Rates
Employee Rates Adopted by Board:Age 25Age 35Age 45Single Rate
—
—
—
—
—
—
—
—
% % % %
% % % %
% % % %
% % % %— — — —
— — — —
%
%—
—
— —
— —
— —
— — — —
— — — —
— — — —
— —
— — — —
— —
— — — —
— —
— — — —
— —
— — — —
— —
— — — —
— —
— — — —
6/30/2011 — — — — — — — — — 6/30/2010 — — — — — — — — — 6/30/2009 — — — — — — — — — 6/30/2008 — — — — — — — — — 6/30/2007 — — — — — — — — —
% % % % % % % % %
Retirement Benefit PoliciesGeneral
I IISafety
I IIIII IV V VI IIIEligibility:AgeYears of ServiceAge
Age
Age
Years of ServiceYears of Service
Years of Service
Years of Service Regardless of AgeAge Regardless of Service 60
Final Average Salary:Position Last HeldHighest Year(s) AverageFinal Year(s) Average
——N
——
——
——
——
——
——
——
——
Compensation at Time of Retirement
OtherNone
2%Maximum Annual IncreaseIndex to Consumer Price IndexIndex to Active Member IncreaseGranted Position Last HeldCost of Living:
Percent Per Year of Service: Age50556065
— — — —
— — — —
— — — —
— — — —
— — — —
— — — —
— — — —
— — — —
— — — —
NSocial Security Coverage:
Policy is that the cost of living increase and payments cease upon death of the member. There are no disability benefits provided.Benefit Comments:
Non-Service Disability - Per Year - Maximum
Service Disability - Per Year - Maximum
Disability Benefits as a Percentage ofFinal Average Salary (FAS):
— —
— —
— —
— —
— —
— —
— —
— —
— —
— —
— —
— —
— —
— —
— —
— —
— —
— —
Comments:This plan covers Police, Fire, and Management/confidential employees who retire prior to January 1995. The plan pays a retiring employee the difference between the pension payable from CalPERS calculated under the life annuity option and the CalPERS benefit had the City of Manhattan Beach adopted the Police Officers' Standards and Training (POST) widows and orphans salary continuation plan. The city has ceded the liabilities of active participants in the plan to CalPERS as of January 1, 1995.
The plan is currently dormant, with payments being made from interest earnings and accumulated balances. Footnote:
(1) Trasnfer of assets from City Single Highest Year Retirement Plan.
117

Public Retirement Systems Annual Report — Fiscal Year 2011-12City of Oakland Fire and Police Retirement System
Single-Employer Plan
SurvivorsNon-ServiceServiceRetiredVested MembersNon-VestedVestedMembershipActive Inactive Service Disabled
Total Status
1 — — 470 287 — 324Safety - Tier 1 1,082 Closed
1Totals — — 470 287 — 324 1,082
Contributions
AssetsCash and Short-Term InvestmentsReceivables
InvestmentsOther
Investments, at Fair ValueU.S. Government ObligationsInternational BondsMunicipal BondsDomestic Corporate BondsDomestic Stocks
Total Assets
Mortgages
Accounts PayableInvestment Purchases PayableAccrued ExpensesOther Current Liabilities
Total Liabilities
International Stocks
Net Assets Available for Benefits
Liabilities
Total Additions
InterestDividends
Net Appreciation (Depreciation)
Other Investment Revenues in Fair Value of Investments
Statement of Changes in Plan Net Assets
$ 292,596,021
Real EstateVenture CapitalOther
$ 24,121,523
$ 268,474,498
$ 12,633,561
$ 47,847,877
Administration ExpensesOther Expenses
Total Deductions
Net Increase (Decrease) In Plan Assets
Beginning of the Year Net Assets Held
$ 64,255,672
$ )(16,407,795
as of June 30, 2012 for Period Ending June 30, 2012
$ 268,474,498
——
37,989,59939,485,642
142,324,34740,959,004
33,362——
14,125,563
—4,168,829
876,114
$ 5654,528,3875,467,008
14,125,563
2,676,3523,571,102
)(2,625,043—
Other Revenues 216,571
983,603—
$ 284,882,293
Fixed Assets Net of Accumulated DepreciationOther Assets
——
in Trust for Pension Benefits
End of the Year Net Assets Heldin Trust for Pension Benefits
Investment Expenses
Adjustments —
Actuarial Cost Method:
Total UAAL Amortization Method:
Total UAAL Amortization Period: —
—Years Remaining in Total UAAL Amortization Period:
AdditionsContributions
Employer -
Employee -
Other -
GeneralSafetyCombined
CombinedSafetyGeneral
CombinedSafetyGeneral
$ —45,507,996
—
—
—
—6,705
——
DeductionsBenefit Payments
Service Retirement -
Disability -
Other -
Member Refunds -
General
CombinedSafetyGeneralCombinedSafety
CombinedSafetyGeneral
CombinedSafetyGeneral
$ —38,285,404
——
23,090,336——
1,896,329————
Level percentage of projected City total payroll
Aggregate
2026Year in Which the Total Unfunded Actuarial Liability is Expected to be Fully Amortized:
)(1,505,806
Other
Statement of Plan Net Assets
Funded
Unfunded
Actuarial ValueActuarial
SalaryInterestValuationActuary: Bartel Associates, LLC
Summary of Funding Position
of AssetsDate Rate Scale Liability Liability RatioAccrued
ActuarialAccruedFiscal
Year$ 426,768,000 37.5%6.74% 3.97% 7/1/2011 $ 683,162,000 $ 256,394,0002012
494,373,000 37.6%7.00% 3.50%7/1/2010 792,202,000 297,829,0002011494,373,000 37.6%7.00% 3.50%7/1/2010 792,202,000 297,829,0002010435,275,000 44.4%7.50% 4.50%7/1/2009 782,457,000 347,182,0002009
322,096 63.7%8.00% 4.50%7/1/2007 888,136 566,0402008268,711,000 69.6%11.50% 4.50%7/1/2005 883,609,000 614,898,0002007
Summary of Employer Contributions
UAAL as aPercentage of ARCAnnual RequiredRecognizedFiscal Year Contributions (ARC) Made Percentage of ACP
Contribution Annual CoveredPayroll (ACP)
2012 $ 45,100,000 $ 45,507,996 101 $ 144,045,000 296% %2011 41,400,000 — — 144,045,000 343 %2010 37,500,000 — — 100,000 494,373 %2009 32,100,000 — — 137,000 317,719 %2008 28,600,000 — — 163,359 197 %2007 23,600,000 — — 367,191 73,180 %
118

Public Retirement Systems Annual Report — Fiscal Year 2011-12City of Oakland Fire and Police Retirement System — (Continued)
Contribution Rates as a Percentage of Covered Payroll
GeneralI II
SafetyI IIIII IV V VI IIIEmployer - Recommended by Actuary:
Normal CostUAAL Amortization
Total Rates Recommended by Actuary
Total Rates Adopted by BoardPrior Year Rates
Employee Rates Adopted by Board:Age 25Age 35Age 45Single Rate
—
—
—
—
—
—
—
—
% % % %
% % % %
%%
% % % %
% % % %— — — —
— — — —
%
%—
—
— —
— —
— —
— — — —
— — — —
— — — —
— —
— — — —
— —
— — — —
— —
— — — —
— —
5.817.53— —
— —
— — — —
— —
— — — —
6/30/2011 — — — — — — — — — 6/30/2010 — — — — — — — — — 6/30/2009 — — — — — — — — — 6/30/2008 — — — — — — — — — 6/30/2007 — — — — — — — — —
(1)
% % % % % % % % %
Retirement Benefit PoliciesGeneral
I IISafety
I IIIII IV V VI IIIEligibility:AgeYears of ServiceAge
Age
Age
Years of ServiceYears of Service
Years of Service
Years of Service Regardless of AgeAge Regardless of Service
5520
6525
Final Average Salary:Position Last HeldHighest Year(s) AverageFinal Year(s) Average
——
——
——
——
——
——
Y—3Y
——
——
Compensation at Time of Retirement
OtherNone
4%Maximum Annual IncreaseIndex to Consumer Price Index
YIndex to Active Member IncreaseGranted Position Last HeldCost of Living:
Percent Per Year of Service: Age50556065
— — — —
— — — —
— — — —
— — — —
— — — —
— — — —
— — — —
— — — —
— — — —
Social Security Coverage: N
Benefit Comments:
Non-Service Disability - Per Year - Maximum
Service Disability - Per Year - Maximum
Disability Benefits as a Percentage ofFinal Average Salary (FAS):
— —
— —
— —
— —
— —
— —
— —
— —
— —
— —
— —
— —
— —
— —
— —
— 50 %
— —
— —
Comments:Police officers and firefighters hired after June 30, 1976, are members of CalPERS, which is administered by the State of California. The city transferred proceeds of $17,709,888 during the year ended June 30, 2005 from the Oakland Joint Powers Financing Authority Refunding Revenue 2005 Series B Bond to fund a portion of the city's future obligation to the system.
Footnote:
(1) The City of Oakland issued pension obligation bonds in the amount of $417,173,300 to fund the retirement system in 1997. The funds were treated as an advance contribution. As a result, no employer contributions are required through the year ending June 30, 2011. Effective July 1, 2011, the City resumed contributing to the System. The City contributed $45,507,996 in the year ended June 30, 2012.
119

Public Retirement Systems Annual Report — Fiscal Year 2011-12City of Oakland Municipal Employees' Retirement System
Single-Employer Plan
SurvivorsNon-ServiceServiceRetiredVested MembersNon-VestedVestedMembershipActive Inactive Service Disabled
Total Status
— — — 12 1 — 15General - Tier 1 28 Closed
—Totals — — 12 1 — 15 28
Contributions
AssetsCash and Short-Term InvestmentsReceivables
InvestmentsOther
Investments, at Fair ValueU.S. Government ObligationsInternational BondsMunicipal BondsDomestic Corporate BondsDomestic Stocks
Total Assets
Mortgages
Accounts PayableInvestment Purchases PayableAccrued ExpensesOther Current Liabilities
Total Liabilities
International Stocks
Net Assets Available for Benefits
Liabilities
Total Additions
InterestDividends
Net Appreciation (Depreciation)
Other Investment Revenues in Fair Value of Investments
Statement of Changes in Plan Net Assets
$ 4,490,503
Real EstateVenture CapitalOther
$ 42,081
$ 4,448,422
$ 107,452
$ 215,459
Administration ExpensesOther Expenses
Total Deductions
Net Increase (Decrease) In Plan Assets
Beginning of the Year Net Assets Held
$ 640,396
$ )(424,937
as of June 30, 2012 for Period Ending June 30, 2012
$ 4,448,422
———
1,270,8973,105,262
—————
——
6,892
$ 1,407—
40,674—
51,56145,663
142,208—
Other Revenues —
205,393—
$ 4,873,359
Fixed Assets Net of Accumulated DepreciationOther Assets
——
in Trust for Pension Benefits
End of the Year Net Assets Heldin Trust for Pension Benefits
Investment Expenses
Adjustments —
Actuarial Cost Method:
Total UAAL Amortization Method: (1)
Total UAAL Amortization Period: 6
6Years Remaining in Total UAAL Amortization Period:
AdditionsContributions
Employer -
Employee -
Other -
GeneralSafetyCombined
CombinedSafetyGeneral
CombinedSafetyGeneral
$ ———
—
—
——
——
DeductionsBenefit Payments
Service Retirement -
Disability -
Other -
Member Refunds -
General
CombinedSafetyGeneralCombinedSafety
CombinedSafetyGeneral
CombinedSafetyGeneral
$ 364,714——
68,289——
2,000—————
Aggregate
—Year in Which the Total Unfunded Actuarial Liability is Expected to be Fully Amortized:
)(23,973
Level Dollar Amount
Statement of Plan Net Assets
Funded
Unfunded
Actuarial ValueActuarial
SalaryInterestValuationActuary: Bartel Associates, LLC
Summary of Funding Position
of AssetsDate Rate Scale Liability Liability RatioAccrued
ActuarialAccruedFiscal
Year$ 743,000 86.4%6.50% 3.25% 7/1/2010 $ 5,471,000 $ 4,728,0002012
743,000 86.4%6.50% 3.25%7/1/2010 5,471,000 4,728,0002011743,000 86.4%6.50% 3.25%7/1/2010 5,471,000 4,728,0002010
)(1,855,000 124.7%8.00% 3.25%7/1/2007 7,516,000 9,371,0002009)(1,855,000 124.7%8.00% 3.25%7/1/2007 7,516,000 9,371,0002008)(5,317,873 200.8%11.50% 3.50%7/1/2005 5,276,963 10,594,8362007
Summary of Employer Contributions
UAAL as aPercentage of ARCAnnual RequiredRecognizedFiscal Year Contributions (ARC) Made Percentage of ACP
Contribution Annual CoveredPayroll (ACP)
2012 $ — $ — $ — — %2011 — — — — %2010 — — — %2009 — — — — %2008 — — — — %2007 — — — — %
120

Public Retirement Systems Annual Report — Fiscal Year 2011-12City of Oakland Municipal Employees' Retirement System — (Continued)
Contribution Rates as a Percentage of Covered Payroll
GeneralI II
SafetyI IIIII IV V VI IIIEmployer - Recommended by Actuary:
Normal CostUAAL Amortization
Total Rates Recommended by Actuary
Total Rates Adopted by BoardPrior Year Rates
Employee Rates Adopted by Board:Age 25Age 35Age 45Single Rate
—
—
—
—
—
—
—
—
% % % %
% % % %
% % % %
% % % %— — — —
— — — —
%
%—
—
— —
— —
— —
— — — —
— — — —
— — — —
— —
— — — —
— —
— — — —
— —
— — — —
— —
— — — —
— —
— — — —
— —
— — — —
6/30/2011 — — — — — — — — — 6/30/2010 — — — — — — — — — 6/30/2009 — — — — — — — — — 6/30/2008 — — — — — — — — — 6/30/2007 — — — — — — — — —
% % % % % % % % %
Retirement Benefit PoliciesGeneral
I IISafety
I IIIII IV V VI III
5220
Eligibility:AgeYears of ServiceAge
Age
Age
Years of ServiceYears of Service
Years of Service
Years of Service Regardless of AgeAge Regardless of Service
6010
70
Final Average Salary:Position Last HeldHighest Year(s) AverageFinal Year(s) Average
Y3
—Y
——
——
——
——
——
——
——
——
Compensation at Time of Retirement
OtherNone
3%Maximum Annual IncreaseIndex to Consumer Price IndexIndex to Active Member IncreaseGranted Position Last HeldCost of Living:
Percent Per Year of Service: Age50556065
— — — —
— — — —
— — — —
— — — —
— — — —
— — — —
— — — —
— — — —
— — — —
NSocial Security Coverage:
Benefit Comments:
Non-Service Disability - Per Year - Maximum
Service Disability - Per Year - Maximum
Disability Benefits as a Percentage ofFinal Average Salary (FAS):
— 33 %
— —
— —
— —
— —
— —
— —
— —
— —
— 33 %
— —
— —
— —
— —
— —
— —
— —
— —
Comments:The system's funding policy provides for periodic employee and city contributions at actuarially determined amounts sufficient to accumulate the necessary assets to pay benefits when due as specified in the City Charter. The system no longer receives employee contributions, as all members of the system have retired or transferred to CalPERS.
Retirement benefit is 1/60 of final salary times years of service, times a factor ranging from 0.59 to 1.41 for ages 52 through 65 and above, respectively. Disability benefit is 1.5% times year of service times final salary, subject to minimum benefits based on service adjusted by salary under the Labor Code for disability or death arising out of the performance of duty.
Footnote:
(1) The July 1, 2009 unfunded actuarial liability (UAL) is amortized as a level dollar amount over a six -year closed period. Any future increase in the UAL due to actuarial gains and losses, changes in assumption method, and plan changes, are amortized as a level dollar amount over six-year closed periods.
121

Public Retirement Systems Annual Report — Fiscal Year 2011-12City of Pasadena Fire and Police Employees' Retirement System
Single-Employer Plan
SurvivorsNon-ServiceServiceRetiredVested MembersNon-VestedVestedMembershipActive Inactive Service Disabled
Total Status
— — — 109 96 2 55Safety - Tier 1 262 Closed
—Totals — — 109 96 2 55 262
Contributions
AssetsCash and Short-Term InvestmentsReceivables
InvestmentsOther
Investments, at Fair ValueU.S. Government ObligationsInternational BondsMunicipal BondsDomestic Corporate BondsDomestic Stocks
Total Assets
Mortgages
Accounts PayableInvestment Purchases PayableAccrued ExpensesOther Current Liabilities
Total Liabilities
International Stocks
Net Assets Available for Benefits
Liabilities
Total Additions
InterestDividends
Net Appreciation (Depreciation)
Other Investment Revenues in Fair Value of Investments
Statement of Changes in Plan Net Assets
$ 139,161,577
Real EstateVenture CapitalOther
$ 25,497
$ 139,136,080
$ 14,061,635
$ 48,636,348
Administration ExpensesOther Expenses
Total Deductions
Net Increase (Decrease) In Plan Assets
Beginning of the Year Net Assets Held
$ 14,434,665
$ 34,201,683
as of June 30, 2012 for Period Ending June 30, 2012
$ 139,136,080
31,855,5881,049,700
—18,015,45850,182,40812,555,203
—11,185,142
——
256,443——
$ 25,497———
1,556,0371,066,961
)(343,922—
Other Revenues —
286,778—
$ 104,934,397
Fixed Assets Net of Accumulated DepreciationOther Assets
——
in Trust for Pension Benefits
End of the Year Net Assets Heldin Trust for Pension Benefits
Investment Expenses
Adjustments —
Actuarial Cost Method:
Total UAAL Amortization Method:
Total UAAL Amortization Period: 5
—Years Remaining in Total UAAL Amortization Period:
AdditionsContributions
Employer -
Employee -
Other -
GeneralSafetyCombined
CombinedSafetyGeneral
CombinedSafetyGeneral
$ —46,600,000
—
—
—
——
——
DeductionsBenefit Payments
Service Retirement -
Disability -
Other -
Member Refunds -
General
CombinedSafetyGeneralCombinedSafety
CombinedSafetyGeneral
CombinedSafetyGeneral
$ —7,451,940
——
6,533,948——
161,999————
Entry Age
—Year in Which the Total Unfunded Actuarial Liability is Expected to be Fully Amortized:
)(242,728
Level Dollar Amount
Statement of Plan Net Assets
Funded
Unfunded
Actuarial ValueActuarial
SalaryInterestValuationActuary: Bartel Associates
Summary of Funding Position
of AssetsDate Rate Scale Liability Liability RatioAccrued
ActuarialAccruedFiscal
Year$ 37,977,000 78.2%6.00% 3.00%6/30/2012 $ 174,249,000 $ 136,272,0002012
73,473,000 59.0%6.00% 3.00%6/30/2011 179,284,000 105,811,000201156,356,000 66.1%8.00% 7.60%6/30/2010 166,096,000 109,740,000201058,252,120 67.2%8.00% 3.80%6/30/2009 177,803,309 119,551,189200947,426,631 73.5%8.00% 5.50%6/30/2008 178,747,842 131,321,211200851,909,371 71.6%8.00% 5.40%6/30/2007 183,046,073 131,136,7022007
Summary of Employer Contributions
UAAL as aPercentage of ARCAnnual RequiredRecognizedFiscal Year Contributions (ARC) Made Percentage of ACP
Contribution Annual CoveredPayroll (ACP)
2012 $ 16,941,000 $ 46,600,000 275 $ — —% %2011 13,582,000 8,036,000 59 — —% %2010 14,039,000 4,981,704 35 — —% %2009 11,447,482 956,097 8 — —% %2008 12,524,839 3,193,583 25 178,927 26,506% %2007 13,755,207 3,839,128 28 145,786 35,607% %
122

Public Retirement Systems Annual Report — Fiscal Year 2011-12City of Pasadena Fire and Police Employees' Retirement System — (Continued)
Contribution Rates as a Percentage of Covered Payroll
GeneralI II
SafetyI IIIII IV V VI IIIEmployer - Recommended by Actuary:
Normal CostUAAL Amortization
Total Rates Recommended by Actuary
Total Rates Adopted by BoardPrior Year Rates
Employee Rates Adopted by Board:Age 25Age 35Age 45Single Rate
—
—
—
—
—
—
—
—
% % % %
% % % %
% % % %
% % % %— — — —
— — — —
%
%—
—
— —
— —
— —
— — — —
— — — —
— — — —
— —
— — — —
— —
— — — —
— —
— — — —
— —
— — — —
— —
— — — —
— —
— — — —
%%
6/30/2011 — — — — — — — — — 6/30/2010 — — — — — — — — — 6/30/2009 — — — — — — — — — 6/30/2008 — — — — — — 9.45 — — 6/30/2007 — — — — — — 9.63 — —
% % % % % % % % %
Retirement Benefit PoliciesGeneral
I IISafety
I IIIII IV V VI IIIEligibility:AgeYears of ServiceAge
Age
Age
Years of ServiceYears of Service
Years of Service
Years of Service Regardless of AgeAge Regardless of Service
5015
25
Final Average Salary:Position Last HeldHighest Year(s) AverageFinal Year(s) Average
——
——
——
——
——
——
1—Y
——
——
Compensation at Time of Retirement
OtherNoneMaximum Annual Increase
YIndex to Consumer Price IndexIndex to Active Member IncreaseGranted Position Last HeldCost of Living:
Percent Per Year of Service: Age50556065
— — — —
— — — —
— — — —
— — — —
— — — —
— — — —
— — — —
— — — —
— — — —
Social Security Coverage: N
Benefit Comments:
Non-Service Disability - Per Year - Maximum
Service Disability - Per Year - Maximum
Disability Benefits as a Percentage ofFinal Average Salary (FAS):
— —
— —
— —
— —
— —
— —
— 50 %
— —
— —
— —
— —
— —
— —
— —
— —
— 50 %
— —
— —
123

Public Retirement Systems Annual Report — Fiscal Year 2011-12City of Pasadena Fire and Police Employees' Retirement System — (Continued)
Comments:The funding plan was updated on March 18, 1999, when the Pasadena Fire and Police Retirement System entered into Contribution Agreement No. 16,900 with the City of Pasadena. Per the Agreement, the System is considered to meet minimum funding requirements for the year ended June 30, 2001, if the funded percentage exceeded 70%. The minimum fully funded percentage will increase by 1/2% each year until it reaches 80% in the year ending June 30, 2020. As a result of this agreement, the city agreed to make supplemental contributions to the system when needed.
On October 20, 2011, the retirement board approved an Amended and Restated Contribution Agreement No. 20,823 (Agreement No. 20,823), which was subsequently approved by the city council on October 24, 2011. Under this agreement, the city's supplemental payment is computed by carrying forward the minimum funding percentage schedule and reimbursement cap in the Agreement No. 16,900, but is computed using an interest assumption of 6% and an inflation assumption of 3%.
Agreement No. 20,823 also provides for the issuance of pension obligation bonds by the city, that would yield approximately $46.6 million in net proceeds to the system if issued.
Based on the June 30, 2012 actuarial valuation, the funding deficit was $0. The Agreement No.16900 and No. 20823 state that if this minimum funding deficit is greater than $3,000,000, the city will pay $3,000,000 to the System; any remaining amount necessary to reach the minimum funding percentage is to be phased in over a five-year period.
As a condition of participation, members were required to make a contribution to the System. Currently there are no active members in the System, and hence no further member contributions are due the System.
The service retirement is 1/50 multiplied by Final Compensation multiplied by Years of Service multiplied by actuarial Equivalent Factor ranging from 0.8226 to 1.3099 for ages 46 through 55 and above, but not greater than 75% of final compensation.
In current fiscal year, the city issued a pension obligation bond that yielded $46,600,000 in net proceeds to the retirement system.
124

Public Retirement Systems Annual Report — Fiscal Year 2011-12City of Piedmont Police and Fire Pension Plan
Single-Employer Plan
SurvivorsNon-ServiceServiceRetiredVested MembersNon-VestedVestedMembershipActive Inactive Service Disabled
Total Status
— — — 4 5 — 7Safety - Tier 1 16 Closed
—Totals — — 4 5 — 7 16
Contributions
AssetsCash and Short-Term InvestmentsReceivables
InvestmentsOther
Investments, at Fair ValueU.S. Government ObligationsInternational BondsMunicipal BondsDomestic Corporate BondsDomestic Stocks
Total Assets
Mortgages
Accounts PayableInvestment Purchases PayableAccrued ExpensesOther Current Liabilities
Total Liabilities
International Stocks
Net Assets Available for Benefits
Liabilities
Total Additions
InterestDividends
Net Appreciation (Depreciation)
Other Investment Revenues in Fair Value of Investments
Statement of Changes in Plan Net Assets
$ 9,037,538
Real EstateVenture CapitalOther
$ 69,585
$ 8,967,953
$ —
$ )(176,566
Administration ExpensesOther Expenses
Total Deductions
Net Increase (Decrease) In Plan Assets
Beginning of the Year Net Assets Held
$ 273,636
$ )(450,202
as of June 30, 2012 for Period Ending June 30, 2012
$ 8,967,953
602,923——
3,832,7994,593,479
—————
—8,337
—
$ 69,585———
12,644303,085
)(429,054—
Other Revenues —
——
$ 9,418,155
Fixed Assets Net of Accumulated DepreciationOther Assets
——
in Trust for Pension Benefits
End of the Year Net Assets Heldin Trust for Pension Benefits
Investment Expenses
Adjustments —
Actuarial Cost Method:
Total UAAL Amortization Method: (1)
Total UAAL Amortization Period: —
—Years Remaining in Total UAAL Amortization Period:
AdditionsContributions
Employer -
Employee -
Other -
GeneralSafetyCombined
CombinedSafetyGeneral
CombinedSafetyGeneral
$ ———
—
—
——
——
DeductionsBenefit Payments
Service Retirement -
Disability -
Other -
Member Refunds -
General
CombinedSafetyGeneralCombinedSafety
CombinedSafetyGeneral
CombinedSafetyGeneral
$ —142,313
——
131,323———————
Projected Unit Credit
—Year in Which the Total Unfunded Actuarial Liability is Expected to be Fully Amortized:
)(63,241
No Amortization
Statement of Plan Net Assets
Funded
Unfunded
Actuarial ValueActuarial
SalaryInterestValuationActuary: Bartel Assciates, LLC
Summary of Funding Position
of AssetsDate Rate Scale Liability Liability RatioAccrued
ActuarialAccruedFiscal
Year$ )(5,421,658 289.3%3.95% 2.95% 1/1/2010 $ 2,864,314 $ 8,285,9722012
)(5,421,658 289.3%7.00% 3.50%1/1/2010 2,864,314 8,285,9722011)(5,421,658 289.3%0.68% 0.34%1/1/2010 2,864,314 8,285,9722010)(3,994,978 227.3%7.00% 3.50%1/1/2007 3,137,361 7,132,3392009)(3,994,978 227.3%7.00% 3.50%1/1/2007 3,137,361 7,132,3392008)(3,994,978 227.3%7.00% 3.50%1/1/2007 3,137,361 7,132,3392007
Summary of Employer Contributions
UAAL as aPercentage of ARCAnnual RequiredRecognizedFiscal Year Contributions (ARC) Made Percentage of ACP
Contribution Annual CoveredPayroll (ACP)
2012 $ — $ — — %2011 — — — — %2010 — — — — %2009 — — — — %2008 — — — — %2007 — — — — %
125

Public Retirement Systems Annual Report — Fiscal Year 2011-12City of Piedmont Police and Fire Pension Plan — (Continued)
Contribution Rates as a Percentage of Covered Payroll
GeneralI II
SafetyI IIIII IV V VI IIIEmployer - Recommended by Actuary:
Normal CostUAAL Amortization
Total Rates Recommended by Actuary
Total Rates Adopted by BoardPrior Year Rates
Employee Rates Adopted by Board:Age 25Age 35Age 45Single Rate
—
—
—
—
—
—
—
—
% % % %
% % % %
% % % %
% % % %— — — —
— — — —
%
%—
—
— —
— —
— —
— — — —
— — — —
— — — —
— —
— — — —
— —
— — — —
— —
— — — —
— —
— — — —
— —
— — — —
— —
— — — —
6/30/2011 — — — — — — — — — 6/30/2010 — — — — — — — — — 6/30/2009 — — — — — — — — — 6/30/2008 — — — — — — — — — 6/30/2007 — — — — — — — — —
% % % % % % % % %
Retirement Benefit PoliciesGeneral
I IISafety
I IIIII IV V VI IIIEligibility:AgeYears of ServiceAge
Age
Age
Years of ServiceYears of Service
Years of Service
Years of Service Regardless of AgeAge Regardless of Service
5525
Final Average Salary:Position Last HeldHighest Year(s) AverageFinal Year(s) Average
——
——
——
——
——
——
—1
——
——
Compensation at Time of Retirement
OtherNone
2%Maximum Annual IncreaseYIndex to Consumer Price Index
Index to Active Member IncreaseGranted Position Last HeldCost of Living:
Percent Per Year of Service: Age50556065
— — — —
— — — —
— — — —
— — — —
— — — —
— — — —
— — — —
— — — —
— — — —
Social Security Coverage: N
Benefit Comments:
Non-Service Disability - Per Year - Maximum
Service Disability - Per Year - Maximum
Disability Benefits as a Percentage ofFinal Average Salary (FAS):
— —
— —
— —
— —
— —
— —
2 %50 %
— —
— —
— —
— —
— —
— —
— —
— —
— 67 %
— —
— —
Comments:The plan is closed to new participants. As of June 30, 2012, all active Police and Fire Department employees participate in CalPERS.
Footnote:
(1) The Retirement Board has adopted an asset-smoothing technique. This technique recognizes realized and unrealized appreciation in the market value of assets over a period of approximately five years and incorporates a minimum value of 80% of market value and maximum value of 120% of market value.
126

Public Retirement Systems Annual Report — Fiscal Year 2011-12City of Pittsburg Miscellaneous Employees' Retirement System of 1962
Single-Employer Plan
SurvivorsNon-ServiceServiceRetiredVested MembersNon-VestedVestedMembershipActive Inactive Service Disabled
Total Status
— — — 1 — — —General - Tier 1 1 Closed
—Totals — — 1 — — — 1
Contributions
AssetsCash and Short-Term InvestmentsReceivables
InvestmentsOther
Investments, at Fair ValueU.S. Government ObligationsInternational BondsMunicipal BondsDomestic Corporate BondsDomestic Stocks
Total Assets
Mortgages
Accounts PayableInvestment Purchases PayableAccrued ExpensesOther Current Liabilities
Total Liabilities
International Stocks
Net Assets Available for Benefits
Liabilities
Total Additions
InterestDividends
Net Appreciation (Depreciation)
Other Investment Revenues in Fair Value of Investments
Statement of Changes in Plan Net Assets
$ 14,050
Real EstateVenture CapitalOther
$ —
$ 14,050
$ 13,876
$ —
Administration ExpensesOther Expenses
Total Deductions
Net Increase (Decrease) In Plan Assets
Beginning of the Year Net Assets Held
$ 5,274
$ )(5,274
as of June 30, 2012 for Period Ending June 30, 2012
$ 14,050
—————————
174
———
$ ————
——
——
Other Revenues —
——
$ 19,324
Fixed Assets Net of Accumulated DepreciationOther Assets
——
in Trust for Pension Benefits
End of the Year Net Assets Heldin Trust for Pension Benefits
Investment Expenses
Adjustments —
Actuarial Cost Method:
Total UAAL Amortization Method: (1)
Total UAAL Amortization Period: —
—Years Remaining in Total UAAL Amortization Period:
AdditionsContributions
Employer -
Employee -
Other -
GeneralSafetyCombined
CombinedSafetyGeneral
CombinedSafetyGeneral
$ ———
—
—
——
——
DeductionsBenefit Payments
Service Retirement -
Disability -
Other -
Member Refunds -
General
CombinedSafetyGeneralCombinedSafety
CombinedSafetyGeneral
CombinedSafetyGeneral
$ 5,274———————————
Other
—Year in Which the Total Unfunded Actuarial Liability is Expected to be Fully Amortized:
—
No Amortization
Statement of Plan Net Assets
Funded
Unfunded
Actuarial ValueActuarial
SalaryInterestValuationActuary: Bartell Associates
Summary of Funding Position
of AssetsDate Rate Scale Liability Liability RatioAccrued
ActuarialAccruedFiscal
Year$ )(1,075 105.9%4.25% 3.00% 6/30/2011 $ 18,249 $ 19,3242012
)(1,075 105.9%4.25% 3.00%6/30/2011 18,249 19,324201111,790 71.0%4.25% 3.00%6/30/2007 40,592 28,802201011,790 71.0%4.25% 3.00%6/30/2007 40,592 28,802200911,790 71.0%4.25% 3.00%6/30/2007 40,592 28,802200811,790 71.0%4.25% 3.00%6/30/2007 40,592 28,8022007
Summary of Employer Contributions
UAAL as aPercentage of ARCAnnual RequiredRecognizedFiscal Year Contributions (ARC) Made Percentage of ACP
Contribution Annual CoveredPayroll (ACP)
2012 $ — $ — $ — — %2011 — — — — %2010 — — — — %2009 — — — — %2008 — — — — %2007 — — — %
127

Public Retirement Systems Annual Report — Fiscal Year 2011-12City of Pittsburg Miscellaneous Employees' Retirement System of 1962 — (Continued)
Contribution Rates as a Percentage of Covered Payroll
GeneralI II
SafetyI IIIII IV V VI IIIEmployer - Recommended by Actuary:
Normal CostUAAL Amortization
Total Rates Recommended by Actuary
Total Rates Adopted by BoardPrior Year Rates
Employee Rates Adopted by Board:Age 25Age 35Age 45Single Rate
—
—
—
—
—
—
—
—
% % % %
% % % %
% % % %
% % % %— — — —
— — — —
%
%—
—
— —
— —
— —
— — — —
— — — —
— — — —
— —
— — — —
— —
— — — —
— —
— — — —
— —
— — — —
— —
— — — —
— —
— — — —
6/30/2011 — — — — — — — — — 6/30/2010 — — — — — — — — — 6/30/2009 — — — — — — — — — 6/30/2008 — — — — — — — — — 6/30/2007 — — — — — — — — —
% % % % % % % % %
Retirement Benefit PoliciesGeneral
I IISafety
I IIIII IV V VI III
5510
Eligibility:AgeYears of ServiceAge
Age
Age
Years of ServiceYears of Service
Years of Service
Years of Service Regardless of AgeAge Regardless of Service 65
Final Average Salary:Position Last HeldHighest Year(s) AverageFinal Year(s) Average
—3
——
——
——
——
——
——
——
——
Compensation at Time of Retirement
OtherNone
5%Maximum Annual IncreaseIndex to Consumer Price IndexIndex to Active Member IncreaseGranted Position Last HeldCost of Living:
Percent Per Year of Service: Age50556065
— — — —
— — — —
— — — —
— — — —
— — — —
— — — —
— — — —
— — — —
— — — —
NSocial Security Coverage:
The city and employees both contributed to the establishment of a reserve for the purpose of paying an annunity at age 65 of 1/140th of the final compensation for each year of service after entry into the system.
Benefit Comments:
Non-Service Disability - Per Year - Maximum
Service Disability - Per Year - Maximum
Disability Benefits as a Percentage ofFinal Average Salary (FAS):
— 25 %
— —
— —
— —
— —
— —
— —
— —
— —
— 50 %
— —
— —
— —
— —
— —
— —
— —
— —
Comments:This system is closed. Actuarial obligations have been calculated as the present value of all future benefit payments.
Footnote:
(1) The City of Pittsburg uses mortality tables to determine the actuarial accrued liability.
128

Public Retirement Systems Annual Report — Fiscal Year 2011-12City of Richmond - Garfield Pension Plan
Single-Employer Plan
SurvivorsNon-ServiceServiceRetiredVested MembersNon-VestedVestedMembershipActive Inactive Service Disabled
Total Status
— — — 1 — — —Safety - Tier 1 1 Closed
—Totals — — 1 — — — 1
Contributions
AssetsCash and Short-Term InvestmentsReceivables
InvestmentsOther
Investments, at Fair ValueU.S. Government ObligationsInternational BondsMunicipal BondsDomestic Corporate BondsDomestic Stocks
Total Assets
Mortgages
Accounts PayableInvestment Purchases PayableAccrued ExpensesOther Current Liabilities
Total Liabilities
International Stocks
Net Assets Available for Benefits
Liabilities
Total Additions
InterestDividends
Net Appreciation (Depreciation)
Other Investment Revenues in Fair Value of Investments
Statement of Changes in Plan Net Assets
$ 252,267
Real EstateVenture CapitalOther
$ —
$ 252,267
$ 252,256
$ 1,901
Administration ExpensesOther Expenses
Total Deductions
Net Increase (Decrease) In Plan Assets
Beginning of the Year Net Assets Held
$ 83,756
$ )(81,855
as of June 30, 2012 for Period Ending June 30, 2012
$ 252,266
——————————
—11—
$ ————
1,874—
27—
Other Revenues —
——
$ 334,121
Fixed Assets Net of Accumulated DepreciationOther Assets
——
in Trust for Pension Benefits
End of the Year Net Assets Heldin Trust for Pension Benefits
Investment Expenses
Adjustments —
Actuarial Cost Method:
Total UAAL Amortization Method: (1)
Total UAAL Amortization Period: 8
8Years Remaining in Total UAAL Amortization Period:
AdditionsContributions
Employer -
Employee -
Other -
GeneralSafetyCombined
CombinedSafetyGeneral
CombinedSafetyGeneral
$ ———
—
—
——
——
DeductionsBenefit Payments
Service Retirement -
Disability -
Other -
Member Refunds -
General
CombinedSafetyGeneralCombinedSafety
CombinedSafetyGeneral
CombinedSafetyGeneral
$ 83,756———————————
Entry Age
—Year in Which the Total Unfunded Actuarial Liability is Expected to be Fully Amortized:
—
Level Dollar Amount
Statement of Plan Net Assets
Funded
Unfunded
Actuarial ValueActuarial
SalaryInterestValuationActuary: Bartel Associates LLC
Summary of Funding Position
of AssetsDate Rate Scale Liability Liability RatioAccrued
ActuarialAccruedFiscal
Year$ 519,301 39.2%4.50% 3.50% 7/1/2011 $ 853,422 $ 334,1212012
262,095 56.0%4.50% 3.50%7/1/2011 596,216 334,1212011557,460 37.6%4.50% 3.50%7/1/2009 893,734 336,2742010573,549 36.3%4.50% 3.50%7/1/2007 899,777 326,2282009573,549 36.3%4.50% 3.50%7/1/2007 899,777 326,2282008613,989 32.9%5.00% 7.00%7/1/2005 915,287 301,2982007
Summary of Employer Contributions
UAAL as aPercentage of ARCAnnual RequiredRecognizedFiscal Year Contributions (ARC) Made Percentage of ACP
Contribution Annual CoveredPayroll (ACP)
2012 $ 78,731 $ — — $ — — %2011 76,692 76,692 100 — —% %2010 76,692 76,692 100 — —% %2009 72,484 72,484 100 — —% %2008 72,484 72,484 100 — —% %2007 73,917 73,917 100 — —% %
129

Public Retirement Systems Annual Report — Fiscal Year 2011-12City of Richmond - Garfield Pension Plan — (Continued)
Contribution Rates as a Percentage of Covered Payroll
GeneralI II
SafetyI IIIII IV V VI IIIEmployer - Recommended by Actuary:
Normal CostUAAL Amortization
Total Rates Recommended by Actuary
Total Rates Adopted by BoardPrior Year Rates
Employee Rates Adopted by Board:Age 25Age 35Age 45Single Rate
—
—
—
—
—
—
—
—
% % % %
% % % %
% % % %
% % % %— — — —
— — — —
%
%—
—
— —
— —
— —
— — — —
— — — —
— — — —
— —
— — — —
— —
— — — —
— —
— — — —
— —
— — — —
— —
— — — —
— —
— — — —
6/30/2011 — — — — — — — — — 6/30/2010 — — — — — — — — — 6/30/2009 — — — — — — — — — 6/30/2008 — — — — — — — — — 6/30/2007 — — — — — — — — —
% % % % % % % % %
Retirement Benefit PoliciesGeneral
I IISafety
I IIIII IV V VI IIIEligibility:AgeYears of ServiceAge
Age
Age
Years of ServiceYears of Service
Years of Service
Years of Service Regardless of AgeAge Regardless of Service
Final Average Salary:Position Last HeldHighest Year(s) AverageFinal Year(s) Average
——
——
——
——
——
——
——
——
——
Compensation at Time of Retirement
OtherNoneMaximum Annual IncreaseIndex to Consumer Price IndexIndex to Active Member IncreaseGranted Position Last HeldCost of Living:
Percent Per Year of Service: Age50556065
— — — —
— — — —
— — — —
— — — —
— — — —
— — — —
— — — —
— — — —
— — — —
Social Security Coverage: N
Benefit Comments:
Non-Service Disability - Per Year - Maximum
Service Disability - Per Year - Maximum
Disability Benefits as a Percentage ofFinal Average Salary (FAS):
— —
— —
— —
— —
— —
— —
— 25 %
— —
— —
— —
— —
— —
— —
— —
— —
— 50 %
— —
— —
Comments:This retirement fund was established by the City of Richmond as a separate retirement plan for one of its retired police chief. Retirement and other benefits are paid from the assets of the plan and from related investment earnings. Plan provisions have been established and may be amended upon agreement between the plan and the retiree. This retirement plan is being reported as a retirement plan separate from the city's Police and Firemen's Plan.
Footnote:
(1) The unfunded actuarial liability is amortized over the plan member's remaining life expectancy as of the valuation date, which is eight years as of July 1, 2011.
130

Public Retirement Systems Annual Report — Fiscal Year 2011-12City of Richmond General Pension Plan
Single-Employer Plan
SurvivorsNon-ServiceServiceRetiredVested MembersNon-VestedVestedMembershipActive Inactive Service Disabled
Total Status
— — — 13 — — 9General - Tier 1 22 Closed
—Totals — — 13 — — 9 22
Contributions
AssetsCash and Short-Term InvestmentsReceivables
InvestmentsOther
Investments, at Fair ValueU.S. Government ObligationsInternational BondsMunicipal BondsDomestic Corporate BondsDomestic Stocks
Total Assets
Mortgages
Accounts PayableInvestment Purchases PayableAccrued ExpensesOther Current Liabilities
Total Liabilities
International Stocks
Net Assets Available for Benefits
Liabilities
Total Additions
InterestDividends
Net Appreciation (Depreciation)
Other Investment Revenues in Fair Value of Investments
Statement of Changes in Plan Net Assets
$ 954,490
Real EstateVenture CapitalOther
$ —
$ 954,490
$ 954,387
$ 160,317
Administration ExpensesOther Expenses
Total Deductions
Net Increase (Decrease) In Plan Assets
Beginning of the Year Net Assets Held
$ 592,853
$ )(432,536
as of June 30, 2012 for Period Ending June 30, 2012
$ 954,490
——————————
—103
—
$ ————
11,866—
265—
Other Revenues —
——
$ 1,387,026
Fixed Assets Net of Accumulated DepreciationOther Assets
——
in Trust for Pension Benefits
End of the Year Net Assets Heldin Trust for Pension Benefits
Investment Expenses
Adjustments —
Actuarial Cost Method:
Total UAAL Amortization Method:
Total UAAL Amortization Period: 17
8Years Remaining in Total UAAL Amortization Period:
AdditionsContributions
Employer -
Employee -
Other -
GeneralSafetyCombined
CombinedSafetyGeneral
CombinedSafetyGeneral
$ 148,186——
—
—
——
——
DeductionsBenefit Payments
Service Retirement -
Disability -
Other -
Member Refunds -
General
CombinedSafetyGeneralCombinedSafety
CombinedSafetyGeneral
CombinedSafetyGeneral
$ 592,853———————————
Entry Age
2020Year in Which the Total Unfunded Actuarial Liability is Expected to be Fully Amortized:
—
Level Dollar Amount
Statement of Plan Net Assets
Funded
Unfunded
Actuarial ValueActuarial
SalaryInterestValuationActuary: Bartel Associates LLC
Summary of Funding Position
of AssetsDate Rate Scale Liability Liability RatioAccrued
ActuarialAccruedFiscal
Year$ 3,312,114 29.5%4.50% 3.50%7/1/2011 $ 4,699,140 $ 1,387,0262012
3,312,114 29.5%4.50% 3.50%7/1/2011 4,699,140 1,387,02620114,145,842 29.9%4.50% 3.50%7/1/2009 5,916,052 1,770,21020102,825,255 46.1%4.50% 3.50%7/1/2007 5,242,136 2,416,88120092,825,255 46.1%4.50% 3.50%7/1/2007 5,242,136 2,416,88120082,473,097 56.0%5.00% 5.50%7/1/2005 5,614,489 3,141,3922007
Summary of Employer Contributions
UAAL as aPercentage of ARCAnnual RequiredRecognizedFiscal Year Contributions (ARC) Made Percentage of ACP
Contribution Annual CoveredPayroll (ACP)
2012 $ 455,662 $ 148,186 33 $ — —% %2011 486,092 486,092 100 — —% %2010 486,092 486,092 100 — —% %2009 307,948 307,948 100 — —% %2008 307,948 307,948 100 — —% %2007 238,264 238,264 100 — —% %
131

Public Retirement Systems Annual Report — Fiscal Year 2011-12City of Richmond General Pension Plan — (Continued)
Contribution Rates as a Percentage of Covered Payroll
GeneralI II
SafetyI IIIII IV V VI IIIEmployer - Recommended by Actuary:
Normal CostUAAL Amortization
Total Rates Recommended by Actuary
Total Rates Adopted by BoardPrior Year Rates
Employee Rates Adopted by Board:Age 25Age 35Age 45Single Rate
—
—
—
—
—
—
—
—
% % % %
% % % %
% % % %
% % % %— — — —
— — — —
%
%—
—
— —
— —
— —
— — — —
— — — —
— — — —
— —
— — — —
— —
— — — —
— —
— — — —
— —
— — — —
— —
— — — —
— —
— — — —
6/30/2011 — — — — — — — — — 6/30/2010 — — — — — — — — — 6/30/2009 — — — — — — — — — 6/30/2008 — — — — — — — — — 6/30/2007 — — — — — — — — —
% % % % % % % % %
Retirement Benefit PoliciesGeneral
I IISafety
I IIIII IV V VI III
6025
Eligibility:AgeYears of ServiceAge
Age
Age
Years of ServiceYears of Service
Years of Service
Years of Service Regardless of AgeAge Regardless of Service
30
Final Average Salary:Position Last HeldHighest Year(s) AverageFinal Year(s) Average
Y—3
——
——
——
——
——
——
——
——
Compensation at Time of Retirement
OtherNone
5%Maximum Annual IncreaseIndex to Consumer Price IndexIndex to Active Member IncreaseGranted Position Last HeldCost of Living:
Percent Per Year of Service: Age50556065
— — — —
— — — —
— — — —
— — — —
— — — —
— — — —
— — — —
— — — —
— — — —
SSocial Security Coverage:
If retired with fewer than 30 years of service, a member receives a prorated portion of 50% of salary. For example, with 25 years of service, a member would receive 25/30th of 50% of his or her final average salary.
Benefit Comments:
Non-Service Disability - Per Year - Maximum
Service Disability - Per Year - Maximum
Disability Benefits as a Percentage ofFinal Average Salary (FAS):
— 50 %
— —
— —
— —
— —
— —
— —
— —
— —
— 50 %
— —
— —
— —
— —
— —
— —
— —
— —
Comments:Benefits are paid from Assets and Investments. The city is required, under its charter, to contribute the remaining amounts necessary to fund the plan using the Entry-Age method.
Based on information supplied by the City of Richmond, the Tax Override Pension Fund may be used only to fund pensions provided by charter provisions added before the effective date of Proposition 13 (July 1, 1978).
132

Public Retirement Systems Annual Report — Fiscal Year 2011-12City of Richmond Police and Firemen's Pension Plan
Single-Employer Plan
SurvivorsNon-ServiceServiceRetiredVested MembersNon-VestedVestedMembershipActive Inactive Service Disabled
Total Status
— — — 18 11 — 36Safety - Tier 1 65 Closed
—Totals — — 18 11 — 36 65
Contributions
AssetsCash and Short-Term InvestmentsReceivables
InvestmentsOther
Investments, at Fair ValueU.S. Government ObligationsInternational BondsMunicipal BondsDomestic Corporate BondsDomestic Stocks
Total Assets
Mortgages
Accounts PayableInvestment Purchases PayableAccrued ExpensesOther Current Liabilities
Total Liabilities
International Stocks
Net Assets Available for Benefits
Liabilities
Total Additions
InterestDividends
Net Appreciation (Depreciation)
Other Investment Revenues in Fair Value of Investments
Statement of Changes in Plan Net Assets
$ 16,595,503
Real EstateVenture CapitalOther
$ —
$ 16,595,503
$ 240,274
$ )(255,185
Administration ExpensesOther Expenses
Total Deductions
Net Increase (Decrease) In Plan Assets
Beginning of the Year Net Assets Held
$ 4,036,150
$ )(4,291,335
as of June 30, 2012 for Period Ending June 30, 2012
$ 16,595,503
—————————
16,355,104
—125
—
$ ————
441,798—
)(574,441—
Other Revenues —
——
$ 20,886,838
Fixed Assets Net of Accumulated DepreciationOther Assets
——
in Trust for Pension Benefits
End of the Year Net Assets Heldin Trust for Pension Benefits
Investment Expenses
Adjustments —
Actuarial Cost Method:
Total UAAL Amortization Method:
Total UAAL Amortization Period: 20
10Years Remaining in Total UAAL Amortization Period:
AdditionsContributions
Employer -
Employee -
Other -
GeneralSafetyCombined
CombinedSafetyGeneral
CombinedSafetyGeneral
$ ———
—
—
——
——
DeductionsBenefit Payments
Service Retirement -
Disability -
Other -
Member Refunds -
General
CombinedSafetyGeneralCombinedSafety
CombinedSafetyGeneral
CombinedSafetyGeneral
$ —4,036,150
——————————
Entry Age
2022Year in Which the Total Unfunded Actuarial Liability is Expected to be Fully Amortized:
)(122,542
Level Dollar Amount
Statement of Plan Net Assets
Funded
Unfunded
Actuarial ValueActuarial
SalaryInterestValuationActuary: Bartel Associates LLC
Summary of Funding Position
of AssetsDate Rate Scale Liability Liability RatioAccrued
ActuarialAccruedFiscal
Year$ 12,593,537 62.4%6.00% 3.50%7/1/2011 $ 33,488,006 $ 20,894,4692012
12,593,537 62.4%6.00% 3.50%7/1/2011 33,488,006 20,894,469201121,936,082 46.2%6.00% 3.50%7/1/2009 40,786,586 18,850,504201020,680,783 52.6%6.50% 3.50%7/1/2007 43,591,093 22,910,310200920,680,783 52.6%6.50% 3.50%7/1/2007 43,591,093 22,910,310200822,401,478 46.2%6.50% 3.50%7/1/2005 41,653,180 19,251,7022007
Summary of Employer Contributions
UAAL as aPercentage of ARCAnnual RequiredRecognizedFiscal Year Contributions (ARC) Made Percentage of ACP
Contribution Annual CoveredPayroll (ACP)
2012 $ 1,596,771 $ — — $ — — %2011 2,477,902 — — — — %2010 2,477,902 4,600,000 186 — —% %2009 2,199,459 4,800,000 218 — —% %2008 2,199,459 5,000,000 227 — —% %2007 2,215,648 6,215,648 281 — —% %
133

Public Retirement Systems Annual Report — Fiscal Year 2011-12City of Richmond Police and Firemen's Pension Plan — (Continued)
Contribution Rates as a Percentage of Covered Payroll
GeneralI II
SafetyI IIIII IV V VI IIIEmployer - Recommended by Actuary:
Normal CostUAAL Amortization
Total Rates Recommended by Actuary
Total Rates Adopted by BoardPrior Year Rates
Employee Rates Adopted by Board:Age 25Age 35Age 45Single Rate
—
—
—
—
—
—
—
—
% % % %
% % % %
% % % %
% % % %— — — —
— — — —
%
%—
—
— —
— —
— —
— — — —
— — — —
— — — —
— —
— — — —
— —
— — — —
— —
— — — —
— —
— — — —
— —
— — — —
— —
— — — —
6/30/2011 — — — — — — — — — 6/30/2010 — — — — — — — — — 6/30/2009 — — — — — — — — — 6/30/2008 — — — — — — — — — 6/30/2007 — — — — — — — — —
% % % % % % % % %
Retirement Benefit PoliciesGeneral
I IISafety
I IIIII IV V VI IIIEligibility:AgeYears of ServiceAge
Age
Age
Years of ServiceYears of Service
Years of Service
Years of Service Regardless of AgeAge Regardless of Service
25
Final Average Salary:Position Last HeldHighest Year(s) AverageFinal Year(s) Average
——
——
——
——
——
——
Y——Y
——
——
Compensation at Time of Retirement
OtherNone
5%Maximum Annual IncreaseIndex to Consumer Price Index
YIndex to Active Member IncreaseYGranted Position Last Held
Cost of Living:
Percent Per Year of Service: Age50556065
— — — —
— — — —
— — — —
— — — —
— — — —
— — — —
— — — —
— — — —
— — — —
Social Security Coverage: I
Benefit Comments:
Non-Service Disability - Per Year - Maximum
Service Disability - Per Year - Maximum
Disability Benefits as a Percentage ofFinal Average Salary (FAS):
— —
— —
— —
— —
— —
— —
— 50 %
— —
— —
— —
— —
— —
— —
— —
— —
— 50 %
— —
— —
Comments:Funding for the plan is provided from the Security Pension Override Special Revenue Fund. The city is required, under its charter, to contribute the remaining amounts necessary to fund the plan using the entry-age actuarial method as specified by ordinance.
134

Public Retirement Systems Annual Report — Fiscal Year 2011-12City of Sacramento City Employees' Retirement System
Single-Employer Plan
SurvivorsNon-ServiceServiceRetiredVested MembersNon-VestedVestedMembershipActive Inactive Service Disabled
Total Status
1 — 3 24 — 6 12General - Tier 1 46 Closed
— — — 13 8 — 20Safety - Tier 1 41 Closed
— — 1 78 42 11 603 192 Closed
47 — 20 596 67 15 181 926 Closed
— — — 14 9 — 222 45 Closed
— — — 19 11 1 31 62 Closed
48Totals — 24 744 137 33 326 1,312
Contributions
AssetsCash and Short-Term InvestmentsReceivables
InvestmentsOther
Investments, at Fair ValueU.S. Government ObligationsInternational BondsMunicipal BondsDomestic Corporate BondsDomestic Stocks
Total Assets
Mortgages
Accounts PayableInvestment Purchases PayableAccrued ExpensesOther Current Liabilities
Total Liabilities
International Stocks
Net Assets Available for Benefits
Liabilities
Total Additions
InterestDividends
Net Appreciation (Depreciation)
Other Investment Revenues in Fair Value of Investments
Statement of Changes in Plan Net Assets
$ 326,525,000
Real EstateVenture CapitalOther
$ 30,416,000
$ 296,109,000
$ 21,051,000
$ 25,165,000
Administration ExpensesOther Expenses
Total Deductions
Net Increase (Decrease) In Plan Assets
Beginning of the Year Net Assets Held
$ 33,057,000
$ )(7,892,000
as of June 30, 2012 for Period Ending June 30, 2012
$ 296,109,000
4,309,000—
44,253,00062,694,000
129,035,00026,116,000
7,457,000———
—2,246,000
—
$ 31,000—
361,00030,024,000
7,985,0004,302,000
3,277,000149,000
Other Revenues —
——
$ 304,001,000
Fixed Assets Net of Accumulated DepreciationOther Assets
—29,364,000
(1)
in Trust for Pension Benefits
End of the Year Net Assets Heldin Trust for Pension Benefits
Investment Expenses
Adjustments —
Actuarial Cost Method:
Total UAAL Amortization Method:
Total UAAL Amortization Period: 15
15Years Remaining in Total UAAL Amortization Period:
AdditionsContributions
Employer -
Employee -
Other -
GeneralSafetyCombined
CombinedSafetyGeneral
CombinedSafetyGeneral
$ 10,361,000——
—
—
332,000—
——
DeductionsBenefit Payments
Service Retirement -
Disability -
Other -
Member Refunds -
General
CombinedSafetyGeneralCombinedSafety
CombinedSafetyGeneral
CombinedSafetyGeneral
$ 21,557,0006,279,000
—2,327,0002,588,000
—17,000
1,000—
288,000——
Entry Age
—Year in Which the Total Unfunded Actuarial Liability is Expected to be Fully Amortized:
)(1,241,000
Level Dollar Amount
Statement of Plan Net Assets
Funded
Unfunded
Actuarial ValueActuarial
SalaryInterestValuationActuary: Bartel Associates, LLC
Summary of Funding Position
of AssetsDate Rate Scale Liability Liability RatioAccrued
ActuarialAccruedFiscal
Year$ 94,751,000 75.6%6.50% 3.50% 6/30/2012 $ 388,862,000 $ 294,111,0002012
100,000,000 74.8%6.50% 3.50%6/30/2011 397,000,000 297,000,000201198,000,000 75.2%6.50% 3.50%6/30/2010 395,000,000 297,000,000201084,000,000 78.9%6.50% 3.50%6/30/2009 398,000,000 314,000,000200932,220,000 91.8%6.50% 3.50%6/30/2008 392,180,000 359,960,000200829,805,000 92.5%6.50% 3.50%6/30/2007 394,976,000 365,171,0002007
Summary of Employer Contributions
UAAL as aPercentage of ARCAnnual RequiredRecognizedFiscal Year Contributions (ARC) Made Percentage of ACP
Contribution Annual CoveredPayroll (ACP)
2012 $ 10,361,000 $ 10,361,000 100 $ 2,960,000 3,201% %2011 10,547,000 10,547,000 100 4,132,000 2,420% %2010 3,431,000 3,431,000 100 5,302,000 1,848% %2009 3,159,000 3,159,000 100 5,749,000 1,461% %2008 3,534,000 3,534,000 100 8,868,786 363% %2007 — — 9,587,157 311 %
135

Public Retirement Systems Annual Report — Fiscal Year 2011-12City of Sacramento City Employees' Retirement System — (Continued)
Contribution Rates as a Percentage of Covered Payroll
GeneralI II
SafetyI IIIII IV V VI IIIEmployer - Recommended by Actuary:
Normal CostUAAL Amortization
Total Rates Recommended by Actuary
Total Rates Adopted by BoardPrior Year Rates
Employee Rates Adopted by Board:Age 25Age 35Age 45Single Rate
—
—
—
—
—
—
—
—
% % % %
% % % %
%%%
%%%
% % % %
%
%%%
% % %— — — —
— — — —
%
%—
—
— —
— —
— —
7.408.469.51—
7.408.469.51—
7.408.469.51—
— —
— — — —
— —
— — — —
— —
— — — —
— —
— — — —
— —
— — — —
— —
— — — —
6/30/2011 — — — — — — — — — 6/30/2010 — — — — — — — — — 6/30/2009 — — — — — — — — — 6/30/2008 — — — — — — — — — 6/30/2007 — — — — — — — — —
% % % % % % % % %
Retirement Benefit PoliciesGeneral
I IISafety
I IIIII IV V VI III
5520
Eligibility:AgeYears of ServiceAge
Age
Age
Years of ServiceYears of Service
Years of Service
Years of Service Regardless of AgeAge Regardless of Service 70
505
70
505
70
5520
70
505
70
505
70
Final Average Salary:Position Last HeldHighest Year(s) AverageFinal Year(s) Average
—3
—3
—3
——
——
——
—3
—3
—3
Compensation at Time of Retirement
OtherNone
3% 3%3%3%3%Maximum Annual IncreaseYYYYYYIndex to Consumer Price Index
3%
Index to Active Member IncreaseGranted Position Last HeldCost of Living:
Percent Per Year of Service: Age50556065
— 1.101.672.44
1.101.752.402.40
1.101.752.402.40
— — — —
— — — —
— — — —
— 1.101.672.44
1.101.752.402.40
1.101.752.402.40
I II ISocial Security Coverage: II
Service retirement for Tier I is average monthly compensation (AMC) X years of service X benefactor, ranging from 1.10% - 2.44% for ages 55 - 65. For Tier II to III, it is AMC X years of service X benefactor, ranging from 1.10% to 2.40% for ages 50 to 65.
Benefit Comments:
Non-Service Disability - Per Year - Maximum
Service Disability - Per Year - Maximum
Disability Benefits as a Percentage ofFinal Average Salary (FAS):
— 75 %
— 75 %
— 75 %
— —
— —
— —
— 75 %
— 75 %
— 75 %
— 75 %
— 75 %
— 75 %
— —
— —
— —
— 75 %
— 75 %
— 75 %
Comments:General and Safety Tier I represents the 175 Plan; General and Safety II represents the Equal Share Plan; General and Safety Tier III represents the 399 Plan.
During the year ended June 30, 2011, active member contributions ranged from 3% to 10% of payroll. Footnote:
(1) Since 1989, the system hass been fully funded or in an actuarial surplus condition, enabling the city to suspend both its normal and additional contributions since 1993. However, the funded ratio has decreased and the city needs to contribute to the plan. The city contributed a flat amount set in the approved budget.
136

Public Retirement Systems Annual Report — Fiscal Year 2011-12City of San Clemente Restated Employees' Retirement Plan
Single-Employer Plan
SurvivorsNon-ServiceServiceRetiredVested MembersNon-VestedVestedMembershipActive Inactive Service Disabled
Total Status
141 40 95 94 1 — —General - Tier 1 371 Open
141Totals 40 95 94 1 — — 371
Contributions
AssetsCash and Short-Term InvestmentsReceivables
InvestmentsOther
Investments, at Fair ValueU.S. Government ObligationsInternational BondsMunicipal BondsDomestic Corporate BondsDomestic Stocks
Total Assets
Mortgages
Accounts PayableInvestment Purchases PayableAccrued ExpensesOther Current Liabilities
Total Liabilities
International Stocks
Net Assets Available for Benefits
Liabilities
Total Additions
InterestDividends
Net Appreciation (Depreciation)
Other Investment Revenues in Fair Value of Investments
Statement of Changes in Plan Net Assets
$ 36,401,756
Real EstateVenture CapitalOther
$ —
$ 36,401,756
$ —
$ 4,048,126
Administration ExpensesOther Expenses
Total Deductions
Net Increase (Decrease) In Plan Assets
Beginning of the Year Net Assets Held
$ 820,403
$ 3,227,723
as of June 30, 2012 for Period Ending June 30, 2012
$ 36,401,756
1,818,992——
7,297,23914,551,938
5,456,977———
7,276,610
———
$ ————
——
904,759—
Other Revenues —
—152,559
$ 33,174,033
Fixed Assets Net of Accumulated DepreciationOther Assets
——
in Trust for Pension Benefits
End of the Year Net Assets Heldin Trust for Pension Benefits
Investment Expenses
Adjustments —
Actuarial Cost Method:
Total UAAL Amortization Method: (1)
Total UAAL Amortization Period: 20
19Years Remaining in Total UAAL Amortization Period:
AdditionsContributions
Employer -
Employee -
Other -
GeneralSafetyCombined
CombinedSafetyGeneral
CombinedSafetyGeneral
$ 2,183,957——
—
—
959,410—
——
DeductionsBenefit Payments
Service Retirement -
Disability -
Other -
Member Refunds -
General
CombinedSafetyGeneralCombinedSafety
CombinedSafetyGeneral
CombinedSafetyGeneral
$ 667,383——
461————————
Entry Age
2031Year in Which the Total Unfunded Actuarial Liability is Expected to be Fully Amortized:
—
Level Percentage of Projected Covered Payroll
Statement of Plan Net Assets
Funded
Unfunded
Actuarial ValueActuarial
SalaryInterestValuationActuary: Michael S. Jarnes
Summary of Funding Position
of AssetsDate Rate Scale Liability Liability RatioAccrued
ActuarialAccruedFiscal
Year$ 16,604,615 68.5%7.25% 4.50% 7/1/2012 $ 52,775,327 $ 36,170,7122012
14,394,563 69.2%7.25% 4.50%7/1/2011 46,678,961 32,284,39820119,214,115 74.2%7.75% 4.50%7/1/2009 35,702,652 26,488,53720109,214,115 74.2%7.75% 4.50%7/1/2009 35,702,652 26,488,5372009
)(136,872 100.5%7.75% 4.50%7/1/2008 25,812,485 25,949,3572008— 100.0%7.75% 4.50%7/1/2007 24,093,212 24,093,2122007
Summary of Employer Contributions
UAAL as aPercentage of ARCAnnual RequiredRecognizedFiscal Year Contributions (ARC) Made Percentage of ACP
Contribution Annual CoveredPayroll (ACP)
2012 $ 2,205,393 $ 2,183,957 99 $ 13,542,229 123% %2011 1,695,185 1,654,967 98 12,473,080 115% %2010 1,712,259 1,863,810 109 12,940,344 71% %2009 1,797,535 1,625,559 90 13,031,637 71% %2008 1,422,628 1,447,088 102 13,359,200 -1% %2007 1,384,398 1,403,761 101 11,375,587 —% %
137

Public Retirement Systems Annual Report — Fiscal Year 2011-12City of San Clemente Restated Employees' Retirement Plan — (Continued)
Contribution Rates as a Percentage of Covered Payroll
GeneralI II
SafetyI IIIII IV V VI IIIEmployer - Recommended by Actuary:
Normal CostUAAL Amortization
Total Rates Recommended by Actuary
Total Rates Adopted by BoardPrior Year Rates
Employee Rates Adopted by Board:Age 25Age 35Age 45Single Rate
17.10
17.10
—
—
—
—
—
—
% % % %
%
%
% % %
%
% % % %
% % % %— — — —
— — — —
%
%—
—
9.307.80
— —
— —
— — —
7.00
— — — —
— — — —
— —
— — — —
— —
— — — —
— —
— — — —
— —
— — — —
— —
— — — —
— —
— — — —
%%%%%
6/30/2011 12.90 — — — — — — — — 6/30/2010 14.30 — — — — — — — — 6/30/2009 12.30 — — — — — — — — 6/30/2008 11.30 — — — — — — — — 6/30/2007 11.80 — — — — — — — —
% % % % % % % % %
Retirement Benefit PoliciesGeneral
I IISafety
I IIIII IV V VI III
505
Eligibility:AgeYears of ServiceAge
Age
Age
Years of ServiceYears of Service
Years of Service
Years of Service Regardless of AgeAge Regardless of Service
Final Average Salary:Position Last HeldHighest Year(s) AverageFinal Year(s) Average
1—Y
——
——
——
——
——
——
——
——
Compensation at Time of Retirement
OtherNone
2%Maximum Annual IncreaseNIndex to Consumer Price IndexNIndex to Active Member IncreaseNGranted Position Last Held
Cost of Living:
Percent Per Year of Service: Age50556065
— 2.00— —
— — — —
— — — —
— — — —
— — — —
— — — —
— — — —
— — — —
— — — —
ISocial Security Coverage:
Retirement benefit is basic benefit at 2% of average monthly earnings in excess of $133.33 x credited service, plus supplemental benefit, or the retiree's vested cash value with interest at 5% compounded annually to retirement date, whichever is higher.
Benefit Comments:
Non-Service Disability - Per Year - Maximum
Service Disability - Per Year - Maximum
Disability Benefits as a Percentage ofFinal Average Salary (FAS):
— —
— —
— —
— —
— —
— —
— —
— —
— —
— —
— —
— —
— —
— —
— —
— —
— —
— —
Footnote:
(1) Effective with the July 1, 2011 actuarial, a new 20-year amortization period was established for the current unfunded actuarial accrued liability.
138

Public Retirement Systems Annual Report — Fiscal Year 2011-12City of San Jose Federated City Employees' Retirement System
Single-Employer Plan
SurvivorsNon-ServiceServiceRetiredVested MembersNon-VestedVestedMembershipActive Inactive Service Disabled
Total Status
2,276 800 969 2,936 128 79 444General - Tier 1 7,632 Open
2,276Totals 800 969 2,936 128 79 444 7,632
Contributions
AssetsCash and Short-Term InvestmentsReceivables
InvestmentsOther
Investments, at Fair ValueU.S. Government ObligationsInternational BondsMunicipal BondsDomestic Corporate BondsDomestic Stocks
Total Assets
Mortgages
Accounts PayableInvestment Purchases PayableAccrued ExpensesOther Current Liabilities
Total Liabilities
International Stocks
Net Assets Available for Benefits
Liabilities
Total Additions
InterestDividends
Net Appreciation (Depreciation)
Other Investment Revenues in Fair Value of Investments
Statement of Changes in Plan Net Assets
$ 1,656,702,000
Real EstateVenture CapitalOther
$ 7,453,000
$ 1,649,249,000
$ 230,176,000
$ 28,734,000
Administration ExpensesOther Expenses
Total Deductions
Net Increase (Decrease) In Plan Assets
Beginning of the Year Net Assets Held
$ 140,103,000
$ )(111,369,000
as of June 30, 2012 for Period Ending June 30, 2012
$ 1,649,249,000
114,900,0002,013,000
—70,255,000
———
86,649,00088,137,000
1,057,857,000
2,028,0004,687,000
—
$ 3,364,0004,089,000
——
27,026,0009,350,000
)(98,855,000649,000
Other Revenues —
3,306,000—
$ 1,760,618,000
Fixed Assets Net of Accumulated DepreciationOther Assets
——
in Trust for Pension Benefits
End of the Year Net Assets Heldin Trust for Pension Benefits
Investment Expenses
Adjustments —
Actuarial Cost Method:
Total UAAL Amortization Method: (1)
Total UAAL Amortization Period: 20
20Years Remaining in Total UAAL Amortization Period:
AdditionsContributions
Employer -
Employee -
Other -
GeneralSafetyCombined
CombinedSafetyGeneral
CombinedSafetyGeneral
$ 87,082,000——
—
—
10,555,000—
——
DeductionsBenefit Payments
Service Retirement -
Disability -
Other -
Member Refunds -
General
CombinedSafetyGeneralCombinedSafety
CombinedSafetyGeneral
CombinedSafetyGeneral
$ 123,875,000——
6,849,000——
3,878,000——
2,195,000——
Entry Age
2031Year in Which the Total Unfunded Actuarial Liability is Expected to be Fully Amortized:
)(7,073,000
Level Percentage of Projected Covered Payroll
Statement of Plan Net Assets
Funded
Unfunded
Actuarial ValueActuarial
SalaryInterestValuationActuary: Cheiron
Summary of Funding Position
of AssetsDate Rate Scale Liability Liability RatioAccrued
ActuarialAccruedFiscal
Year$ 981,567,000 64.6%7.50% 7.75% 6/30/2011 $ 2,770,227,000 $ 1,788,660,0002012
780,944,000 68.9%7.95% 9.65%6/30/2010 2,510,358,000 1,729,414,0002011729,567,000 70.7%7.75% 9.17%6/30/2009 2,486,155,000 1,756,588,0002010338,092,000 82.8%8.25% 4.25%6/30/2007 1,960,943,000 1,622,851,0002009338,092,000 82.8%8.25% 4.25%6/30/2007 1,960,943,000 1,622,851,0002008326,916,000 80.9%8.25% 4.25%6/30/2005 1,711,370,000 1,384,454,0002007
Summary of Employer Contributions
UAAL as aPercentage of ARCAnnual RequiredRecognizedFiscal Year Contributions (ARC) Made Percentage of ACP
Contribution Annual CoveredPayroll (ACP)
2012 $ 87,082,000 $ 87,082,000 100 $ 318,544,000 308% %2011 59,180,000 59,180,000 100 275,869,000 283% %2010 54,566,000 54,566,000 100 308,697,000 236% %2009 57,020,000 57,020,000 100 291,404,606 116% %2008 54,958,000 54,958,000 100 291,405,000 116% %2007 51,004,000 51,004,000 100 286,446,000 114% %
139

Public Retirement Systems Annual Report — Fiscal Year 2011-12City of San Jose Federated City Employees' Retirement System — (Continued)
Contribution Rates as a Percentage of Covered Payroll
GeneralI II
SafetyI IIIII IV V VI IIIEmployer - Recommended by Actuary:
Normal CostUAAL Amortization
Total Rates Recommended by Actuary
Total Rates Adopted by BoardPrior Year Rates
Employee Rates Adopted by Board:Age 25Age 35Age 45Single Rate
28.34
28.34
—
—
—
—
—
—
% % % %
%
%
% % %
%
% % % %
% % % %— — — —
— — — —
%
%—
—
12.7615.58
— —
— —
— — —
4.68
— — — —
— — — —
— —
— — — —
— —
— — — —
— —
— — — —
— —
— — — —
— —
— — — —
— —
— — — —
%%%%%
6/30/2011 25.75 — — — — — — — — 6/30/2010 18.31 — — — — — — — — 6/30/2009 18.31 — — — — — — — — 6/30/2008 18.16 — — — — — — — — 6/30/2007 18.16 — — — — — — — —
% % % % % % % % %
Retirement Benefit PoliciesGeneral
I IISafety
I IIIII IV V VI III
555
Eligibility:AgeYears of ServiceAge
Age
Age
Years of ServiceYears of Service
Years of Service
Years of Service Regardless of AgeAge Regardless of Service
30
Final Average Salary:Position Last HeldHighest Year(s) AverageFinal Year(s) Average
1—
——
——
——
——
——
——
——
——
Compensation at Time of Retirement
OtherNone
3%Maximum Annual IncreaseNIndex to Consumer Price Index
Index to Active Member IncreaseGranted Position Last HeldCost of Living:
Percent Per Year of Service: Age50556065
— 2.502.502.50
— — — —
— — — —
— — — —
— — — —
— — — —
— — — —
— — — —
— — — —
NSocial Security Coverage:
The retirement annuity maximum is 75% of the Final Average Salary (FAS). Non-Service disability is the greater of 2.5% of final compensation times the number of years of service, up to a maximum of 30 years or 40% of final compensation.
Benefit Comments:
Non-Service Disability - Per Year - Maximum
Service Disability - Per Year - Maximum
Disability Benefits as a Percentage ofFinal Average Salary (FAS):
— 40 %
— —
— —
— —
— —
— —
— —
— —
— —
— 75 %
— —
— —
— —
— —
— —
— —
— —
— —
Comments:The Statement of Plan Net Assets and the Statement of Changes in Plan Net Assets both contain data from the defined benefit pension plan of the City of San Jose Federated City Employees' Retirement System only and do not include the Federated City Employees' post-employment healthcare plan.
Footnote:
(1) The board adopted a 30/20 layered amortization method. The new unfunded actuarial accrued liability resulting from the June 30, 2010 valuation was amortized over a closed 20-year period, while the unfunded accrued liability from the June 30, 2009 valuation was amortized over 30 years. All subsequent valuation gains or losses will be amortized over a closed 20-year period from the date first recognized.
140

Public Retirement Systems Annual Report — Fiscal Year 2011-12City of San Jose Police and Fire Retirement Plan
Single-Employer Plan
SurvivorsNon-ServiceServiceRetiredVested MembersNon-VestedVestedMembershipActive Inactive Service Disabled
Total Status
408 234 39 243 436 8 107Safety - Tier 1 1,475 Open
803 273 127 618 374 11 1132 2,319 Open
1,211Totals 507 166 861 810 19 220 3,794
Contributions
AssetsCash and Short-Term InvestmentsReceivables
InvestmentsOther
Investments, at Fair ValueU.S. Government ObligationsInternational BondsMunicipal BondsDomestic Corporate BondsDomestic Stocks
Total Assets
Mortgages
Accounts PayableInvestment Purchases PayableAccrued ExpensesOther Current Liabilities
Total Liabilities
International Stocks
Net Assets Available for Benefits
Liabilities
Total Additions
InterestDividends
Net Appreciation (Depreciation)
Other Investment Revenues in Fair Value of Investments
Statement of Changes in Plan Net Assets
$ 2,832,568,000
Real EstateVenture CapitalOther
$ 254,104,000
$ 2,578,464,000
$ 81,973,000
$ 106,013,000
Administration ExpensesOther Expenses
Total Deductions
Net Increase (Decrease) In Plan Assets
Beginning of the Year Net Assets Held
$ 155,276,000
$ )(49,263,000
as of June 30, 2012 for Period Ending June 30, 2012
$ 2,578,464,000
327,512,00015,282,00011,007,000
243,464,000603,726,000504,286,000
66,040,000102,764,000122,608,000737,461,000
2,918,00013,527,000
—
$ 3,834,00014,119,000
—236,151,000
43,194,00033,337,000
)(108,807,0008,057,000
Other Revenues —
3,556,000—
$ 2,627,727,000
Fixed Assets Net of Accumulated DepreciationOther Assets
——
in Trust for Pension Benefits
End of the Year Net Assets Heldin Trust for Pension Benefits
Investment Expenses
Adjustments —
Actuarial Cost Method:
Total UAAL Amortization Method: (1)
Total UAAL Amortization Period: 14
14Years Remaining in Total UAAL Amortization Period:
AdditionsContributions
Employer -
Employee -
Other -
GeneralSafetyCombined
CombinedSafetyGeneral
CombinedSafetyGeneral
$ —121,009,000
—
—
—
—19,345,000
——
DeductionsBenefit Payments
Service Retirement -
Disability -
Other -
Member Refunds -
General
CombinedSafetyGeneralCombinedSafety
CombinedSafetyGeneral
CombinedSafetyGeneral
$ —80,884,000
——
64,472,000——
4,438,000——
1,926,000—
Entry Age
—Year in Which the Total Unfunded Actuarial Liability is Expected to be Fully Amortized:
)(10,122,000
Level Percentage of Projected Covered Payroll
Statement of Plan Net Assets
Funded
Unfunded
Actuarial ValueActuarial
SalaryInterestValuationActuary: Cheiron
Summary of Funding Position
of AssetsDate Rate Scale Liability Liability RatioAccrued
ActuarialAccruedFiscal
Year$ 510,286,000 84.0%7.50% 3.50% 6/30/2011 $ 3,196,007,000 $ 2,685,721,0002012
653,751,000 79.8%7.75% 6.00%6/30/2010 3,230,456,000 2,576,705,0002011393,913,000 86.7%8.00% 9.00%6/30/2009 2,963,482,000 2,569,569,0002010
6,596,000 99.7%8.00% 4.00%6/30/2007 2,372,386,000 2,365,790,00020096,596,000 99.7%8.00% 8.00%6/30/2007 2,372,386,000 2,365,790,0002008
44,342,000 97.8%8.00% 4.50%6/30/2005 2,027,432,000 1,983,090,0002007
Summary of Employer Contributions
UAAL as aPercentage of ARCAnnual RequiredRecognizedFiscal Year Contributions (ARC) Made Percentage of ACP
Contribution Annual CoveredPayroll (ACP)
2012 $ 121,009,000 $ 121,009,000 100 $ 251,058,000 203% %2011 77,918,000 77,918,000 100 251,058,473 260% %2010 52,315,000 52,315,000 100 255,222,552 154% %2009 53,103,000 53,103,000 100 227,734,000 3% %2008 56,372,000 56,372,000 100 227,734,000 3% %2007 46,625,000 46,625,000 100 210,018,219 21% %
141

Public Retirement Systems Annual Report — Fiscal Year 2011-12City of San Jose Police and Fire Retirement Plan — (Continued)
Contribution Rates as a Percentage of Covered Payroll
GeneralI II
SafetyI IIIII IV V VI IIIEmployer - Recommended by Actuary:
Normal CostUAAL Amortization
Total Rates Recommended by Actuary
Total Rates Adopted by BoardPrior Year Rates
Employee Rates Adopted by Board:Age 25Age 35Age 45Single Rate
—
—
—
—
51.54
51.54
49.78
49.78
% % % %
% % %
%
%
%
% %
% % % %
% % % %— — — —
— — — —
%
%—
—
— —
— —
— —
— — — —
— — — —
— — — —
— —
— — — —
— —
— — — —
— —
— — — —
28.5323.01
— — —
10.46
27.6922.09
— — —
10.76
— —
— — — —
%%%%%
%%%%%
6/30/2011 — — — — — — 38.77 40.69 — 6/30/2010 — — — — — — 21.61 24.12 — 6/30/2009 — — — — — — 23.32 20.89 — 6/30/2008 — — — — — — 24.71 21.42 — 6/30/2007 — — — — — — 21.03 24.32 —
(2)
% % % % % % % % %
Retirement Benefit PoliciesGeneral
I IISafety
I IIIII IV V VI IIIEligibility:AgeYears of ServiceAge
Age
Age
Years of ServiceYears of Service
Years of Service
Years of Service Regardless of AgeAge Regardless of Service
50255520
70
50255520
7030 30
Final Average Salary:Position Last HeldHighest Year(s) AverageFinal Year(s) Average
——
——
——
——
——
——
1—
1—
——
Compensation at Time of Retirement
OtherNone
3%3%Maximum Annual IncreaseIndex to Consumer Price IndexIndex to Active Member IncreaseGranted Position Last HeldCost of Living:
Percent Per Year of Service: Age50556065
— — — —
— — — —
— — — —
— — — —
— — — —
— — — —
— — — —
— — — —
— — — —
NSocial Security Coverage: N
Benefit Comments:
Non-Service Disability - Per Year - Maximum
Service Disability - Per Year - Maximum
Disability Benefits as a Percentage ofFinal Average Salary (FAS):
— —
— —
— —
— —
— —
— —
50 %90 %
50 %90 %
— —
— —
— —
— —
— —
— —
— —
50 %90 %
60 %90 %
— —
Comments:Effective December 17, 2006, the police member contribution rates were adjusted for benefit improvement. Therefore, the fire members moved from Tier I to Tier II and police members remained in Tier I. It was combined in the prior year. However, as of June 30, 2010, fire and police membership has been separately reported with police in Tier I and fire in Tier II.
Effective July 1, 2006, the monthly retirement benefit for police members is final average salary (FAS) multiplied by 2.5% for the first 20 years of service (and by 4% for the next 10 years of service). Effective July 1, 2008, the monthly retirement benefit for fire members is final compensation multiplied by 2.5% for the first 20 years of service (and by 3% if more than 20 years of service).
The service connected and non-service connected disability monthly benefits for police members are FAS multiplied by 50% plus 4% for each year in excess of 20 years of services. For fire members, the service connected disability benefit is FAS multiplied by 60% plus (FAS multiplied by 3% for each year of service in excess 20 years). The non-service related monthly benefit for fire members is FAS multiplied by 3% for each year of service.
142

Public Retirement Systems Annual Report — Fiscal Year 2011-12City of San Jose Police and Fire Retirement Plan — (Continued)
Footnote:
(1) There are two remaining amortization periods: 1) the outstanding balance of the unfunded actuarial accrued liability calculated through the June 30, 2003 valuation is amortized over the remaining six years; 2) future actuarial experience gains and losses, changes in assumption, and benefit improvement is amortized over 16 years from the date of each such event, beginning with the June 30, 2005 actuarial valuation.
(2) The actual contribution rates paid by the City for fiscal year ended June 30, 2012, differed due to the City funding the annual required contribution amount based on the greater of the dollar amount reported in the actuarial valuation or the dollar amount determined by applying the percentage of payroll reported in the valuation to the actual payroll, if actual payroll exceeds actuarial payroll, for the fiscal year.
143

Public Retirement Systems Annual Report — Fiscal Year 2011-12City of Santa Barbara Police and Fire Pension Fund
Single-Employer Plan
SurvivorsNon-ServiceServiceRetiredVested MembersNon-VestedVestedMembershipActive Inactive Service Disabled
Total Status
— — — 3 — — 32 6 Closed
— — — — 5 — 4Safety - Tier 1 9 Closed
—Totals — — 3 5 — 7 15
Contributions
AssetsCash and Short-Term InvestmentsReceivables
InvestmentsOther
Investments, at Fair ValueU.S. Government ObligationsInternational BondsMunicipal BondsDomestic Corporate BondsDomestic Stocks
Total Assets
Mortgages
Accounts PayableInvestment Purchases PayableAccrued ExpensesOther Current Liabilities
Total Liabilities
International Stocks
Net Assets Available for Benefits
Liabilities
Total Additions
InterestDividends
Net Appreciation (Depreciation)
Other Investment Revenues in Fair Value of Investments
Statement of Changes in Plan Net Assets
$ 604,774
Real EstateVenture CapitalOther
$ 563,669
$ 41,105
$ 41,813
$ 19,738
Administration ExpensesOther Expenses
Total Deductions
Net Increase (Decrease) In Plan Assets
Beginning of the Year Net Assets Held
$ 199,429
$ )(179,691
as of June 30, 2012 for Period Ending June 30, 2012
$ 41,105
———
266,245296,716
—————
———
$ ——
5,133558,536
16,3268,901
507—
Other Revenues —
——
$ 220,796
Fixed Assets Net of Accumulated DepreciationOther Assets
——
in Trust for Pension Benefits
End of the Year Net Assets Heldin Trust for Pension Benefits
Investment Expenses
Adjustments —
Actuarial Cost Method:
Total UAAL Amortization Method:
Total UAAL Amortization Period: 11
11Years Remaining in Total UAAL Amortization Period:
AdditionsContributions
Employer -
Employee -
Other -
GeneralSafetyCombined
CombinedSafetyGeneral
CombinedSafetyGeneral
$ ———
—
—
——
——
DeductionsBenefit Payments
Service Retirement -
Disability -
Other -
Member Refunds -
General
CombinedSafetyGeneralCombinedSafety
CombinedSafetyGeneral
CombinedSafetyGeneral
$ —142,789
——
56,640———————
Amortized over the remaining average lifetime of participants.
Projected Unit Credit
—Year in Which the Total Unfunded Actuarial Liability is Expected to be Fully Amortized:
)(5,996
Other
Statement of Plan Net Assets
Funded
Unfunded
Actuarial ValueActuarial
SalaryInterestValuationActuary: AON Hewitt
Summary of Funding Position
of AssetsDate Rate Scale Liability Liability RatioAccrued
ActuarialAccruedFiscal
Year$ 565,713 54.7%7.00% — %7/1/2011 $ 1,248,052 $ 682,3392012
1,111,121 16.9%7.00% — %7/1/2009 1,337,000 225,87920111,396,000 12.0%7.00% 4.00%7/1/2008 1,586,000 190,00020101,396,000 12.0%7.00% 4.00%7/1/2008 1,586,000 190,00020091,125,916 42.6%7.00% 4.00%7/1/2005 1,962,848 836,93220081,125,916 42.6%7.00% 4.00%7/1/2005 1,962,848 836,9322007
Summary of Employer Contributions
UAAL as aPercentage of ARCAnnual RequiredRecognizedFiscal Year Contributions (ARC) Made Percentage of ACP
Contribution Annual CoveredPayroll (ACP)
2012 $ 102,000 $ — — $ — — %2011 149,000 717,988 482 — —% %2010 178,000 — — — — %2009 178,000 — — — — %2008 — — — %2007 — — — %
144

Public Retirement Systems Annual Report — Fiscal Year 2011-12City of Santa Barbara Police and Fire Pension Fund — (Continued)
Contribution Rates as a Percentage of Covered Payroll
GeneralI II
SafetyI IIIII IV V VI IIIEmployer - Recommended by Actuary:
Normal CostUAAL Amortization
Total Rates Recommended by Actuary
Total Rates Adopted by BoardPrior Year Rates
Employee Rates Adopted by Board:Age 25Age 35Age 45Single Rate
—
—
—
—
—
—
—
—
% % % %
% % % %
% % % %
% % % %— — — —
— — — —
%
%—
—
— —
— —
— —
— — — —
— — — —
— — — —
— —
— — — —
— —
— — — —
— —
— — — —
— —
— — — —
— —
— — — —
— —
— — — —
6/30/2011 — — — — — — — — — 6/30/2010 — — — — — — — — — 6/30/2009 — — — — — — — — — 6/30/2008 — — — — — — — — — 6/30/2007 — — — — — — — — —
% % % % % % % % %
Retirement Benefit PoliciesGeneral
I IISafety
I IIIII IV V VI IIIEligibility:AgeYears of ServiceAge
Age
Age
Years of ServiceYears of Service
Years of Service
Years of Service Regardless of AgeAge Regardless of Service
5525
55
5525
5525 25
Final Average Salary:Position Last HeldHighest Year(s) AverageFinal Year(s) Average
——
——
——
——
——
——
——
——
——
Compensation at Time of Retirement
OtherNoneMaximum Annual IncreaseIndex to Consumer Price IndexIndex to Active Member IncreaseGranted Position Last HeldCost of Living:
Percent Per Year of Service: Age50556065
— — — —
— — — —
— — — —
— — — —
— — — —
— — — —
— 2.00— —
— 2.00— —
— — — —
SSocial Security Coverage: S
Benefit Comments:
Non-Service Disability - Per Year - Maximum
Service Disability - Per Year - Maximum
Disability Benefits as a Percentage ofFinal Average Salary (FAS):
— —
— —
— —
— —
— —
— —
— —
— —
— —
— —
— —
— —
— —
— —
— —
— —
— —
— —
Comments:This plan has been closed since May 1965 and contributions from employer and employees also ceased on that date. The plan is essentially self-funding at this point.
145

Public Retirement Systems Annual Report — Fiscal Year 2011-12Los Angeles City Employees' Retirement System
Single-Employer Plan
SurvivorsNon-ServiceServiceRetiredVested MembersNon-VestedVestedMembershipActive Inactive Service Disabled
Total Status
21,410 3,507 1,634 15,421 — 1,161 641General - Tier 1 43,774 Open
21,410Totals 3,507 1,634 15,421 — 1,161 641 43,774
Contributions
AssetsCash and Short-Term InvestmentsReceivables
InvestmentsOther
Investments, at Fair ValueU.S. Government ObligationsInternational BondsMunicipal BondsDomestic Corporate BondsDomestic Stocks
Total Assets
Mortgages
Accounts PayableInvestment Purchases PayableAccrued ExpensesOther Current Liabilities
Total Liabilities
International Stocks
Net Assets Available for Benefits
Liabilities
Total Additions
InterestDividends
Net Appreciation (Depreciation)
Other Investment Revenues in Fair Value of Investments
Statement of Changes in Plan Net Assets
$ 10,067,435,457
Real EstateVenture CapitalOther
$ 969,274,362
$ 9,098,161,095
$ 337,362,732
$ 559,663,733
Administration ExpensesOther Expenses
Total Deductions
Net Increase (Decrease) In Plan Assets
Beginning of the Year Net Assets Held
$ 688,721,758
$ )(129,058,025
as of June 30, 2012 for Period Ending June 30, 2012
$ 9,098,161,095
590,866,789258,296,996
5,456,765861,942,128
3,493,968,7811,537,725,023
476,192,388551,642,423
1,024,014,209844,134,528
5,669,46779,576,383
402,932
$ —204,991,271
34,259,853730,023,238
95,155,67580,469,219
)(123,473,57538,613,583
Other Revenues —
12,994,579—
$ 9,227,219,120
Fixed Assets Net of Accumulated DepreciationOther Assets
183,913—
in Trust for Pension Benefits
End of the Year Net Assets Heldin Trust for Pension Benefits
Investment Expenses
Adjustments —
Actuarial Cost Method:
Total UAAL Amortization Method: (1)
Total UAAL Amortization Period: 30
30Years Remaining in Total UAAL Amortization Period:
AdditionsContributions
Employer -
Employee -
Other -
GeneralSafetyCombined
CombinedSafetyGeneral
CombinedSafetyGeneral
$ 308,711,905——
—
—
178,246,151—
——
DeductionsBenefit Payments
Service Retirement -
Disability -
Other -
Member Refunds -
General
CombinedSafetyGeneralCombinedSafety
CombinedSafetyGeneral
CombinedSafetyGeneral
$ 645,350,683——
17,165,783——
2,110,118——
11,100,595——
Entry Age
2042Year in Which the Total Unfunded Actuarial Liability is Expected to be Fully Amortized:
)(18,059,225
Level Percentage of Projected Covered Payroll
Statement of Plan Net Assets
Funded
Unfunded
Actuarial ValueActuarial
SalaryInterestValuationActuary: The Segal Company
Summary of Funding Position
of AssetsDate Rate Scale Liability Liability RatioAccrued
ActuarialAccruedFiscal
Year$ 4,458,999,264 69.0%7.75% 6.50% 6/30/2012 $ 14,393,958,574 $ 9,934,959,3102012
3,700,692,504 72.4%7.75% 6.50%6/30/2011 13,391,704,000 9,691,011,49620113,040,997,708 75.9%8.00% 6.50%6/30/2010 12,595,025,119 9,554,027,41120102,464,236,515 79.5%8.00% 6.50%6/30/2009 12,041,983,936 9,577,747,42120091,748,085,441 84.4%8.00% 6.50%6/30/2008 11,186,403,741 9,438,318,30020081,927,174,412 81.7%8.00% 10.00%6/30/2007 10,526,874,184 8,599,699,7722007
Summary of Employer Contributions
UAAL as aPercentage of ARCAnnual RequiredRecognizedFiscal Year Contributions (ARC) Made Percentage of ACP
Contribution Annual CoveredPayroll (ACP)
2012 $ 308,539,905 $ 308,711,905 100 $ 1,819,269,630 245% %2011 303,560,953 306,737,227 101 1,833,392,381 202% %2010 258,642,795 266,239,912 103 1,817,662,284 167% %2009 274,554,786 288,515,751 105 1,816,171,212 136% %2008 288,119,041 302,809,778 105 1,977,644,640 88% %2007 277,516,400 293,159,780 106 1,896,609,013 102% %
146

Public Retirement Systems Annual Report — Fiscal Year 2011-12Los Angeles City Employees' Retirement System — (Continued)
Contribution Rates as a Percentage of Covered Payroll
GeneralI II
SafetyI IIIII IV V VI IIIEmployer - Recommended by Actuary:
Normal CostUAAL Amortization
Total Rates Recommended by Actuary
Total Rates Adopted by BoardPrior Year Rates
Employee Rates Adopted by Board:Age 25Age 35Age 45Single Rate
17.99
17.99
—
—
—
—
—
—
% % % %
%
%
% % %
%
% % % %
% % % %— — — —
— — — —
%
%—
—
6.9311.06
— —
— —
— — —
11.00
— — — —
— — — —
— —
— — — —
— —
— — — —
— —
— — — —
— —
— — — —
— —
— — — —
— —
— — — —
%%%%%
6/30/2011 18.03 — — — — — — — — 6/30/2010 14.11 — — — — — — — — 6/30/2009 14.93 — — — — — — — — 6/30/2008 16.54 — — — — — — — — 6/30/2007 16.86 — — — — — — — —
(2)
% % % % % % % % %
Retirement Benefit PoliciesGeneral
I IISafety
I IIIII IV V VI III
5510
Eligibility:AgeYears of ServiceAge
Age
Age
Years of ServiceYears of Service
Years of Service
Years of Service Regardless of AgeAge Regardless of Service
60105530
7030
Final Average Salary:Position Last HeldHighest Year(s) AverageFinal Year(s) Average
1—
——
——
——
——
——
——
——
——
Compensation at Time of Retirement
OtherNone
3%Maximum Annual IncreaseYIndex to Consumer Price Index
Index to Active Member IncreaseGranted Position Last HeldCost of Living:
Percent Per Year of Service: Age50556065
— 2.162.162.16
— — — —
— — — —
— — — —
— — — —
— — — —
— — — —
— — — —
— — — —
NSocial Security Coverage:
Benefit Comments:
Non-Service Disability - Per Year - Maximum
Service Disability - Per Year - Maximum
Disability Benefits as a Percentage ofFinal Average Salary (FAS):
— 33 %
— —
— —
— —
— —
— —
— —
— —
— —
— 33 %
— —
— —
— —
— —
— —
— —
— —
— —
Footnote:
(1) All unfunded actuarial accrued liability layers as of June 30, 2012 are combined and amortized over 30 years, except the layers created in 2004 and 2005 for GASB compliance and the layers created in 2009 as a result of the Early Retirement Incentive Program, which will maintain their original amortization schedules.
(2) The single rate shown is for employees hired after January 1983.
147

Public Retirement Systems Annual Report — Fiscal Year 2011-12San Diego City Employees' Retirement System
Agent Multiple-Employer Plan
SurvivorsNon-ServiceServiceRetiredVested MembersNon-VestedVestedMembershipActive Inactive Service Disabled
Total Status
250 66 258 289 38 6 632 970 Open
103 15 34 53 18 2 6 231 Open
3,464 2,004 2,353 3,832 381 32 714General - Tier 1 12,780 Open
243 98 76 41 1 — 43 463 Open
1,290 963 542 1,964 786 22 474Safety - Tier 1 6,041 Open
5,350Totals 3,146 3,263 6,179 1,224 62 1,261 20,485
Contributions
AssetsCash and Short-Term InvestmentsReceivables
InvestmentsOther
Investments, at Fair ValueU.S. Government ObligationsInternational BondsMunicipal BondsDomestic Corporate BondsDomestic Stocks
Total Assets
Mortgages
Accounts PayableInvestment Purchases PayableAccrued ExpensesOther Current Liabilities
Total Liabilities
International Stocks
Net Assets Available for Benefits
Liabilities
Total Additions
InterestDividends
Net Appreciation (Depreciation)
Other Investment Revenues in Fair Value of Investments
Statement of Changes in Plan Net Assets
$ 5,796,504,320
Real EstateVenture CapitalOther
$ 1,085,993,352
$ 4,710,510,968
$ 207,127,317
$ 345,781,574
Administration ExpensesOther Expenses
Total Deductions
Net Increase (Decrease) In Plan Assets
Beginning of the Year Net Assets Held
$ 405,069,994
$ )(59,288,420
as of June 30, 2012 for Period Ending June 30, 2012
$ 4,710,510,968
—164,475,427
—1,532,644,5651,534,892,041
941,596,817—
534,742,405—
705,351,294
10,635,094161,318,446
—
$ 1,637,038618,800,091
9,852,230455,703,993
41,376,60828,582,802
)(34,207,55318,633,877
Other Revenues 860,520
11,837,69626,867,099
$ 4,769,799,388
Fixed Assets Net of Accumulated DepreciationOther Assets
3,362,481358,433
in Trust for Pension Benefits
End of the Year Net Assets Heldin Trust for Pension Benefits
Investment Expenses
Adjustments —
Actuarial Cost Method:
Total UAAL Amortization Method: (3)
Total UAAL Amortization Period: —
—Years Remaining in Total UAAL Amortization Period:
AdditionsContributions
Employer -
Employee -
Other -
GeneralSafetyCombined
CombinedSafetyGeneral
CombinedSafetyGeneral
$ 140,134,750107,465,250
—
—
—
28,480,88037,606,925
——
DeductionsBenefit Payments
Service Retirement -
Disability -
Other -
Member Refunds -
General
CombinedSafetyGeneralCombinedSafety
CombinedSafetyGeneral
CombinedSafetyGeneral
$ ——
298,157,188——
53,318,511——
9,542,741——
5,346,759
Entry Age
—Year in Which the Total Unfunded Actuarial Liability is Expected to be Fully Amortized:
(1)
)(23,152,485
(2)
Level Percentage of Projected Covered Payroll
Statement of Plan Net Assets
Funded
Unfunded
Actuarial ValueActuarial
SalaryInterestValuationActuary: Cheiron
Summary of Funding Position
of AssetsDate Rate Scale Liability Liability RatioAccrued
ActuarialAccruedFiscal
Year$ 2,271,031,407 69.1%7.50% 4.25% 6/30/2011 $ 7,356,054,596 $ 5,085,023,1892012
2,224,902,097 67.8%7.75% 4.50%6/30/2010 6,914,138,521 4,689,236,42420112,180,073,639 67.2%7.75% 4.50%6/30/2009 6,638,162,052 4,458,088,41320102,180,073,639 67.2%7.75% 4.50%6/30/2009 6,638,162,052 4,458,088,41320091,323,371,638 79.0%8.00% 4.75%6/30/2008 6,287,393,937 4,964,022,29920081,013,802,149 80.7%8.00% 4.75%6/30/2006 5,240,241,950 4,226,439,8012007
Summary of Employer Contributions
UAAL as aPercentage of ARCAnnual RequiredRecognizedFiscal Year Contributions (ARC) Made Percentage of ACP
Contribution Annual CoveredPayroll (ACP)
2012 $ 247,600,000 $ 247,600,000 100 $ 570,320,446 398% %2011 244,900,000 245,097,536 100 594,998,642 374% %2010 164,400,000 207,333,573 126 601,647,226 362% %2009 172,000,000 172,849,549 100 601,647,226 362% %2008 146,800,000 175,000,938 119 597,879,811 221% %2007 172,900,000 181,388,065 105 587,145,976 173% %
148

Public Retirement Systems Annual Report — Fiscal Year 2011-12San Diego City Employees' Retirement System — (Continued)
Contribution Rates as a Percentage of Covered Payroll
GeneralI II
SafetyI IIIII IV V VI IIIEmployer - Recommended by Actuary:
Normal CostUAAL Amortization
Total Rates Recommended by Actuary
Total Rates Adopted by BoardPrior Year Rates
Employee Rates Adopted by Board:Age 25Age 35Age 45Single Rate
36.03
36.03
32.42
32.42
53.50
53.50
34.71
34.71
% % % %
%
%
%
%
%
%
%
%
%%%
%%%
%%%
%%%
% % % %
%
%
%%%
% % %14.54 — — —
14.54 — — —
%
%—
—
9.7126.32
13.7618.66
13.840.70
8.6611.7712.36
—
5.896.707.61—
5.896.707.61—
— —
— — — —
— —
— — — —
— —
— — — —
14.8338.67
14.2316.1019.19
—
17.6417.07
8.279.39
10.63—
— —
— — — —
%%%%%
%%%%%
%%%%%
%%%%%
%%%%%
6/30/2011 35.03 26.23 16.60 — — — 52.90 31.01 — 6/30/2010 22.44 17.42 12.08 — — — 36.38 19.71 — 6/30/2009 22.85 17.26 12.66 — — — 41.03 21.31 — 6/30/2008 18.77 18.10 10.79 — — — 33.78 21.74 — 6/30/2007 20.39 20.80 13.76 — — — 39.08 25.41 —
% % % % % % % % %
Retirement Benefit PoliciesGeneral
I IISafety
I IIIII IV V VI III
5520
Eligibility:AgeYears of ServiceAge
Age
Age
Years of ServiceYears of Service
Years of Service
Years of Service Regardless of AgeAge Regardless of Service
6210
552062
5
552062
5
50205510
502055
5
Final Average Salary:Position Last HeldHighest Year(s) AverageFinal Year(s) Average
1—
1—
1—
——
——
——
1—
1—
——
Compensation at Time of Retirement
OtherNone
2% 2%2%2%Maximum Annual IncreaseYYYYYIndex to Consumer Price Index
2%
Index to Active Member IncreaseGranted Position Last HeldCost of Living:
Percent Per Year of Service: Age50556065
— 2.252.552.80
— 2.25—
2.55
— 2.25—
2.55
— — — —
— — — —
— — — —
3.003.003.003.00
3.003.003.003.00
— — — —
N N NSocial Security Coverage: NN
Benefit Comments:
Non-Service Disability - Per Year - Maximum
Service Disability - Per Year - Maximum
Disability Benefits as a Percentage ofFinal Average Salary (FAS):
— 33 %
— 33 %
— 33 %
— —
— —
— —
— 33 %
— 33 %
— —
— 50 %
— 50 %
— 50 %
— —
— —
— —
— 50 %
— 50 %
— —
Comments:As of July 1, 2007, the city, port, and airport plans have been separated into independent, qualified, single-employer governmental defined benefit plans and trusts. The city, port, and airport approved their respective Participation and Administration Agreements, and in September 2007, the City Council adopted a necessary enabling resolution approving each Agreement. To confirm the separation of the city, port, and airport plans, SDCERS has filed requests with the IRS for separate determination letters for the group trust, city, port, and airport. The IRS issued a favorable determination letter for the group trust in September 2009 and for the Airport plan and trust in September 2010. The Internal Revenue Service issued favorable determination letters for the City and Port plans and trusts in August 2012.
The tier structure for membership, contribution rates, and retirement policies for General and Safety is as follows: Tier I represents the City of San Diego, Tier II represents the Unified Port District, and Tier III represents the Airport Authority.
149

Public Retirement Systems Annual Report — Fiscal Year 2011-12San Diego City Employees' Retirement System — (Continued)
Footnote:
(1) This amount includes $5,444,000 of the member's portion paid by the plan sponsor.
(2) On June 7, 2010, final judgment was vendered in the case, City of San Diego v. San Diego City Employee's Retirement System regarding underpricing of certain purchase of service credit contracted (PSCs) issued in 2003-04. The judgment required SDCERS to correct the underpricing by either collecting the amount of the underpricing from the member, cancelling the PSC contract and issuing a refund to the member or adjusting the amount of purchased service time to reflect the underpaid amount. (Although this case was closed in June 2010, the ensuing correction process resulted in new litigation being brought against SDCERS.)
(3) The unfunded actuarial liability (UAL) is amortized over several different periods depending on various components, such as the June 30, 2007 UAL, assumption changes in 2008, experience losses from 2008-10, and experience gains from 2011.
150

Public Retirement Systems Annual Report — Fiscal Year 2011-12San Francisco City and County Employees' Retirement System
Single-Employer Plan
SurvivorsNon-ServiceServiceRetiredVested MembersNon-VestedVestedMembershipActive Inactive Service Disabled
Total Status
18,040 4,228 5,197 10,693 — 873 7412 39,772 Closed
1 477 18 — — — —4 496 Open
6 — — 1,206 820 40 933Safety - Tier 1 3,005 Closed
128 — 24 5,875 3 528 2,042General - Tier 1 8,600 Closed
2 88 5 — — — —3 95 Closed
2,855 268 175 937 336 76 872 4,734 Closed
3 2,001 139 — — — —3 2,143 Closed
21,035Totals 7,062 5,558 18,711 1,159 1,517 3,803 58,845
Contributions
AssetsCash and Short-Term InvestmentsReceivables
InvestmentsOther
Investments, at Fair ValueU.S. Government ObligationsInternational BondsMunicipal BondsDomestic Corporate BondsDomestic Stocks
Total Assets
Mortgages
Accounts PayableInvestment Purchases PayableAccrued ExpensesOther Current Liabilities
Total Liabilities
International Stocks
Net Assets Available for Benefits
Liabilities
Total Additions
InterestDividends
Net Appreciation (Depreciation)
Other Investment Revenues in Fair Value of Investments
Statement of Changes in Plan Net Assets
$ 16,717,176,780
Real EstateVenture CapitalOther
$ 1,423,452,054
$ 15,293,724,726
$ 1,654,122,780
$ 689,359,223
Administration ExpensesOther Expenses
Total Deductions
Net Increase (Decrease) In Plan Assets
Beginning of the Year Net Assets Held
$ 994,474,129
$ )(305,114,906
as of June 30, 2012 for Period Ending June 30, 2012
$ 15,293,724,726
1,036,858,893350,645,558
—2,660,044,5554,025,320,6343,195,651,491
—1,403,411,9922,021,471,677
)(15,790,479
34,087,49233,467,519
317,884,668
$ 9,929,7991,380,756,683
28,780,5723,985,000
195,516,615170,759,356
)(246,964,5725,630,687
Other Revenues —
13,661,4451,255,000
$ 15,598,839,630
Fixed Assets Net of Accumulated DepreciationOther Assets
——
in Trust for Pension Benefits
End of the Year Net Assets Heldin Trust for Pension Benefits
Investment Expenses
Adjustments 2
Actuarial Cost Method:
Total UAAL Amortization Method: (1)
Total UAAL Amortization Period: 15
15Years Remaining in Total UAAL Amortization Period:
AdditionsContributions
Employer -
Employee -
Other -
GeneralSafetyCombined
CombinedSafetyGeneral
CombinedSafetyGeneral
$ 344,941,95465,855,871
—
—
—
152,089,81346,069,836
——
DeductionsBenefit Payments
Service Retirement -
Disability -
Other -
Member Refunds -
General
CombinedSafetyGeneralCombinedSafety
CombinedSafetyGeneral
CombinedSafetyGeneral
$ 514,235,566227,079,589
—37,322,097
124,459,630—
49,746,08115,684,870
—10,274,547
755,304—
Entry Age
—Year in Which the Total Unfunded Actuarial Liability is Expected to be Fully Amortized:
)(44,540,337
Level Percentage of Projected Covered Payroll
Statement of Plan Net Assets
Funded
Unfunded
Actuarial ValueActuarial
SalaryInterestValuationActuary: Cheiron, Inc.
Summary of Funding Position
of AssetsDate Rate Scale Liability Liability RatioAccrued
ActuarialAccruedFiscal
Year$ 2,285,607,000 87.7%7.66% 3.91% 7/1/2011 $ 18,598,727,000 $ 16,313,120,0002012
1,574,336,000 91.1%7.75% 4.00%7/1/2010 17,643,394,000 16,069,058,0002011493,919,000 97.0%7.50% 4.50%7/1/2009 16,498,649,000 16,004,730,0002010493,919,000 97.0%7.75% 4.50%7/1/2009 16,498,649,000 16,004,730,0002009
)(1,387,899,000 110.2%8.00% 4.50%7/1/2007 13,541,388,000 14,929,287,0002008)(1,082,153,000 108.6%8.00% 4.50%7/1/2006 12,515,463,000 13,597,616,0002007
151

Public Retirement Systems Annual Report — Fiscal Year 2011-12San Francisco City and County Employees' Retirement System — (Continued)
Summary of Employer Contributions
UAAL as aPercentage of ARCAnnual RequiredRecognizedFiscal Year Contributions (ARC) Made Percentage of ACP
Contribution Annual CoveredPayroll (ACP)
2012 $ 410,797,000 $ 410,797,825 100 $ 2,323,991,126 98% %2011 308,823,546 308,822,546 100 2,263,580,379 70% %2010 223,613,817 223,613,817 100 2,537,784,683 19% %2009 119,750,000 119,749,968 100 2,537,784,683 19% %2008 128,662,000 134,059,918 104 2,376,221,000 -58% %2007 128,099,000 132,601,568 104 2,161,261,000 -50% %
Contribution Rates as a Percentage of Covered Payroll
GeneralI II
SafetyI IIIII IV V VI IIIEmployer - Recommended by Actuary:
Normal CostUAAL Amortization
Total Rates Recommended by Actuary
Total Rates Adopted by BoardPrior Year Rates
Employee Rates Adopted by Board:Age 25Age 35Age 45Single Rate
18.09
18.09
18.09
18.09
18.09
18.09
18.09
18.09
% % % %
%
%
%
%
%
%
%
%
% % % %
% % % %
%
%
%
% % %18.09 — — —
18.09 — — —
%
%
%
%
18.09
18.09
10.857.24
10.857.24
10.857.24
— — —
8.00
— — —
7.50
— — —
7.50
— —
— — — —
— —
— — — —
— —
— — — —
10.857.24
— — —
7.00
10.857.24
— — —
7.50
10.857.24
— — —
9.00
%%%%%
%%%%%
% %%%%%
%%%%%
%6/30/2011 13.56 13.56 13.56 — — — 13.56 13.56 13.566/30/2010 9.49 9.49 — — — — 9.49 9.49 — 6/30/2009 4.99 4.99 — — — — 4.99 4.99 — 6/30/2008 5.91 5.91 — — — — 8.98 8.98 — 6/30/2007 6.24 6.24 — — — — 6.24 6.24 —
% % % % % % % % %
Retirement Benefit PoliciesGeneral
I IISafety
I IIIII IV V VI III
5020
Eligibility:AgeYears of ServiceAge
Age
Age
Years of ServiceYears of Service
Years of Service
Years of Service Regardless of AgeAge Regardless of Service
6010
65
50206010
65
50206010
65
5025
505
505
Final Average Salary:Position Last HeldHighest Year(s) AverageFinal Year(s) Average
1—
1—
——
——
——
——
Y——
1—
1—
Compensation at Time of Retirement
OtherNone
2% 2%2%2%2%Maximum Annual IncreaseYYYYYIndex to Consumer Price Index
2%
YIndex to Active Member IncreaseYGranted Position Last Held
Cost of Living:
Percent Per Year of Service: Age50556065
1.001.502.102.30
1.001.502.102.30
1.001.502.102.30
— — — —
— — — —
— — — —
2.403.003.003.00
2.403.003.003.00
2.403.003.003.00
I NI NSocial Security Coverage: NI
Benefit Comments:
Non-Service Disability - Per Year - Maximum
Service Disability - Per Year - Maximum
Disability Benefits as a Percentage ofFinal Average Salary (FAS):
— 75 %
— 75 %
— 75 %
— —
— —
— —
— 90 %
— 90 %
— 90 %
— —
— —
— —
— —
— —
— —
— 90 %
— 90 %
— 90 %
152

Public Retirement Systems Annual Report — Fiscal Year 2011-12San Francisco City and County Employees' Retirement System — (Continued)
Comments:The San Francisco City and County Employees' Retirement System tier structure and status for fiscal year ending June 30, 2012, are as follows:
General Tier I: Closed.General Tier II: Closed.General Tier III: Closed. Prop D.General Tier IV: Open. Prop C.Safety Tier I (Police and Fire): Closed.Safety Tier II(Police and Fire): Closed.Safety Tier III(Police and Fire): Closed. Prop D.Safety Tier IV(Police and Fire): Open. Prop C.
Members of Safety Tier IV are added to Safety Tier III in the memberhip section due to system limitation.
In February 2008, the voters of the city and county approved a Charter amendment to provide a Deferred Retirement Option Program (DROP) for certain Police members of the plan to be effective July 1, 2008. DROP expired on June 30, 2011. There are 267 DROP members.
Footnote:
(1) Actuarial gains and losses, assumption changes, and supplemental COLAs are amortized over an open 15-year period. Plan amendments and changes in interest crediting rate are amortized over 20-year closed periods.
153

This Page Intentionally Left Blank

DEFINED BENEFIT SYSTEMS
Special District Systems

This Page Intentionally Left Blank

Public Retirement Systems Annual Report — Fiscal Year 2011-12Alameda-Contra Costa Transit District Pension Fund
Single-Employer Plan
SurvivorsNon-ServiceServiceRetiredVested MembersNon-VestedVestedMembershipActive Inactive Service Disabled
Total Status
1,443 410 256 1,184 126 67 226General - Tier 1 3,712 Open
1,443Totals 410 256 1,184 126 67 226 3,712
Contributions
AssetsCash and Short-Term InvestmentsReceivables
InvestmentsOther
Investments, at Fair ValueU.S. Government ObligationsInternational BondsMunicipal BondsDomestic Corporate BondsDomestic Stocks
Total Assets
Mortgages
Accounts PayableInvestment Purchases PayableAccrued ExpensesOther Current Liabilities
Total Liabilities
International Stocks
Net Assets Available for Benefits
Liabilities
AdditionsContributions
Employer -
Employee -
Total Additions
InterestDividends
Net Appreciation (Depreciation)
Other Investment Revenues
DeductionsBenefit Payments
Service Retirement -
in Fair Value of Investments
Other -
Statement of Changes in Plan Net Assets
$ 431,269,700
Real EstateVenture CapitalOther
Investments
$ 3,401,512
$ 427,868,188
$ 204,533,060
$ 36,548,467
Disability -
Other -
Member Refunds -
Administration ExpensesOther Expenses
Total Deductions
Net Increase (Decrease) In Plan Assets
Beginning of the Year Net Assets Held
$ 38,367,087
$ )(1,818,620
as of December 31, 2011 for Period Ending December 31, 2011
$ 427,868,188
1,821,247——
87,026,577134,344,716
—————
3,322,38120,275
201,444
$ 3,253,8239,420
138,269—
9,3666,612,534
)(7,318,665—
Other Revenues 75,041
827,197—
$ 429,686,808
Fixed Assets Net of Accumulated DepreciationOther Assets
——
in Trust for Pension Benefits
End of the Year Net Assets Heldin Trust for Pension Benefits
Investment Expenses
Adjustments —
Actuarial Cost Method:
Total UAAL Amortization Method: (1)
Total UAAL Amortization Period: 2016Years Remaining in Total UAAL Amortization Period:
GeneralSafetyCombined
CombinedSafetyGeneral
CombinedSafetyGeneral
$ 38,312,183——
—
—
——
——
General
CombinedSafety
CombinedSafety
CombinedSafetyGeneral
CombinedSafetyGeneral
$ 31,786,794——
2,675,959——
3,077,137—————
Entry Age
2029
Year in Which the Total Unfunded Actuarial Liability is Expected to be Fully Amortized:
)(1,141,992
General
Level Percentage of Projected Covered Payroll
Statement of Plan Net Assets
Funded
Unfunded
Actuarial ValueActuarial
SalaryInterestValuationActuary: EFI Actuaries
Summary of Funding Position
of AssetsDate Rate Scale Liability Liability RatioAccrued
ActuarialAccruedFiscal
Year$ 263,842,978 61.9%7.50% 4.00% (2) 1/1/2011 $ 692,486,995 $ 428,644,0172012
234,053,941 62.6%7.70% 4.64%1/1/2010 625,116,235 391,062,2942011228,180,706 61.1%7.70% 4.78%1/1/2009 586,781,594 358,600,8882010110,913,201 79.1%7.70% 4.97%1/1/2008 531,756,991 420,843,7902009120,863,233 75.9%7.70% 4.82%1/1/2007 500,514,140 379,650,9072008100,020,512 77.8%7.70% 4.10%1/1/2006 449,786,331 349,765,8192007
Summary of Employer Contributions
UAAL as aPercentage of ARCAnnual RequiredRecognizedFiscal Year Contributions (ARC) Made Percentage of ACP
Contribution Annual CoveredPayroll (ACP)
2012 $ 38,312,183 $ 38,312,183 100 $ 126,536,498 209% %2011 38,360,000 38,460,619 100 136,127,357 172% %2010 33,279,000 33,279,081 100 135,196,012 169% %2009 27,246,151 27,246,151 100 129,935,113 85% %2008 24,987,070 24,987,070 100 124,907,596 97% %2007 22,032,946 22,032,945 100 120,487,434 83% %
157

Public Retirement Systems Annual Report — Fiscal Year 2011-12Alameda-Contra Costa Transit District Pension Fund — (Continued)
Contribution Rates as a Percentage of Covered Payroll
GeneralI II
SafetyI IIIII IV V VI IIIEmployer - Recommended by Actuary:
Normal CostUAAL AmortizationTotal Rates Recommended by Actuary
Total Rates Adopted by BoardPrior Year Rates
Employee Rates Adopted by Board:Age 25Age 35Age 45Single Rate
30.79
30.79
—
—
—
—
—
—
% % % %
%
%
% % %
% % % %
% % % %— — — —
— — — —
%
%—
—
13.5517.24
— —
— —
— — — —
— — — —
— — — —
— —
— — — —
— —
— — — —
— —
— — — —
— —
— — — —
— —
— — — —
— —
— — — —
%%%%%
12/31/2010 29.05 — — — — — — — — 12/31/2009 28.16 — — — — — — — — 12/31/2008 21.23 — — — — — — — — 12/31/2007 21.54 — — — — — — — — 12/31/2006 19.15 — — — — — — — —
% % % % % % % % %
Retirement Benefit PoliciesGeneral
I IISafety
I IIIII IV V VI III
555
Eligibility:AgeYears of ServiceAge
Age
Age
Years of Service
Years of Service
Years of Service
Years of Service Regardless of AgeAge Regardless of Service
551065
56510
Final Average Salary:Position Last HeldHighest Year(s) AverageFinal Year(s) Average
55
——
——
——
——
——
——
——
——
Compensation at Time of Retirement
OtherYNone
Maximum Annual IncreaseIndex to Consumer Price IndexIndex to Active Member IncreaseGranted Position Last HeldCost of Living:
Percent Per Year of Service: Age50556065
— — — —
— — — —
— — — —
— — — —
— — — —
— — — —
— — — —
— — — —
— — — —
SSocial Security Coverage:
The occupational disability benefit is a percentage of the participant's average final earnings.Benefit Comments:
Non-Service Disability - Per Year - Maximum
Service Disability - Per Year - Maximum
Disability Benefits as a Percentage of Final Average Salary (FAS):
— 50 %
— —
— —
— —
— —
— —
— —
— —
— —
— 50 %
— —
— —
— —
— —
— —
— —
— —
— —
Comments:The plan provides retirement benefits for all qualifying union and non-union employees. All represented groups are now combined and reported under one tier.
The district pays the entire cost of the plan. There are no employee contributions.
Service retirement benefits for International Brotherhood of Electrical Workers members is 2% times years of service, or 2.25% at age 60, times the participant's average final earnings. Effective January 1, 2007 for individuals employed on or after June 21, 2006, the service retirement benefit for American Federation of State, County & Municipal Employees (AFSCME) members at age 55 is 2%, increasing to 2.5% at age 60 and after. Service retirement benefits for non-represented members is 2% at age 50 increasing to 2.75% at 55 and after. For service prior to July 1, 1994, of service that is non-represented, the retirement benefit is 2% at age 50, increasing to 2.5% at age 55.
158

Public Retirement Systems Annual Report — Fiscal Year 2011-12Alameda-Contra Costa Transit District Pension Fund — (Continued)
Footnote:
(1) The remaining amortization period is 17 years. In addition, 50% of the 2008 investment loss is amortized over a 30-year period, resulting in an average of 20 years for the total unfunded actuarial liability period. Once the remaining amortization period reaches 12 years, the Unfunded Actuarial Accrued Liability will be amortized as a level percentage of projected active payroll over a rolling 12-year period.
(2) The projected salary increases are 3.70% to 6.50% for members of the Amalgamated Transit Union and IBEW and 3.7% for AFSCME and non-represented members.
159

Public Retirement Systems Annual Report — Fiscal Year 2011-12Antelope Valley Hospital Medical Center Retirement Plan
Single-Employer Plan
SurvivorsNon-ServiceServiceRetiredVested MembersNon-VestedVestedMembershipActive Inactive Service Disabled
Total Status
1,252 729 1,112 467 10 — 25General - Tier 1 3,595 Open
1,252Totals 729 1,112 467 10 — 25 3,595
Contributions
AssetsCash and Short-Term InvestmentsReceivables
InvestmentsOther
Investments, at Fair ValueU.S. Government ObligationsInternational BondsMunicipal BondsDomestic Corporate BondsDomestic Stocks
Total Assets
Mortgages
Accounts PayableInvestment Purchases PayableAccrued ExpensesOther Current Liabilities
Total Liabilities
International Stocks
Net Assets Available for Benefits
Liabilities
AdditionsContributions
Employer -
Employee -
Total Additions
InterestDividends
Net Appreciation (Depreciation)
Other Investment Revenues
DeductionsBenefit Payments
Service Retirement -
in Fair Value of Investments
Other -
Statement of Changes in Plan Net Assets
$ 106,183,978
Real EstateVenture CapitalOther
Investments
$ —
$ 106,183,978
$ 12,028,870
$ 6,436,294
Disability -
Other -
Member Refunds -
Administration ExpensesOther Expenses
Total Deductions
Net Increase (Decrease) In Plan Assets
Beginning of the Year Net Assets Held
$ 5,664,919
$ 771,375
as of June 30, 2012 for Period Ending June 30, 2012
$ 106,183,978
7,011,430——
18,593,94945,768,149
—12,699,977
——
9,589,634
—491,969
—
$ ————
—2,541,534
)(3,479,196—
Other Revenues —
1,008,484—
$ —
Fixed Assets Net of Accumulated DepreciationOther Assets
——
in Trust for Pension Benefits
End of the Year Net Assets Heldin Trust for Pension Benefits
Investment Expenses
Adjustments 105,412,603
Actuarial Cost Method:
Total UAAL Amortization Method:
Total UAAL Amortization Period: 1010Years Remaining in Total UAAL Amortization Period:
GeneralSafetyCombined
CombinedSafetyGeneral
CombinedSafetyGeneral
$ 7,373,956——
—
—
——
——
General
CombinedSafety
CombinedSafety
CombinedSafetyGeneral
CombinedSafetyGeneral
$ 4,656,435———————————Level dollar open to meet funding target level
Projected Unit Credit
—
Year in Which the Total Unfunded Actuarial Liability is Expected to be Fully Amortized:
—
General
Other
Statement of Plan Net Assets
Funded
Unfunded
Actuarial ValueActuarial
SalaryInterestValuationActuary: William H. Clark-Shim
Summary of Funding Position
of AssetsDate Rate Scale Liability Liability RatioAccrued
ActuarialAccruedFiscal
Year$ 53,360,139 64.8%8.00% 4.25%7/1/2011 $ 151,697,557 $ 98,337,4182012
33,220,902 74.3%8.00% 5.00%7/1/2009 129,052,135 95,831,233201024,419,396 80.6%8.00% 5.00%7/1/2008 125,602,280 101,182,884200924,522,049 79.4%8.00% 5.00%7/1/2007 119,177,736 94,655,687200826,639,178 76.1%8.00% 5.00%7/1/2006 111,346,507 84,707,3292007
Summary of Employer Contributions
UAAL as aPercentage of ARCAnnual RequiredRecognizedFiscal Year Contributions (ARC) Made Percentage of ACP
Contribution Annual CoveredPayroll (ACP)
2012 $ 15,110,012 $ 7,373,956 49 $ 134,153,568 40% %2010 11,053,926 5,830,054 53 107,653,212 31% %2009 10,163,395 5,660,550 56 100,178,228 24% %2008 10,159,993 2,997,248 30 93,458,358 26% %2007 10,911,300 2,546,342 23 96,277,887 28% %
160

Public Retirement Systems Annual Report — Fiscal Year 2011-12Antelope Valley Hospital Medical Center Retirement Plan — (Continued)
Contribution Rates as a Percentage of Covered Payroll
GeneralI II
SafetyI IIIII IV V VI IIIEmployer - Recommended by Actuary:
Normal CostUAAL AmortizationTotal Rates Recommended by Actuary
Total Rates Adopted by BoardPrior Year Rates
Employee Rates Adopted by Board:Age 25Age 35Age 45Single Rate
11.26
5.50
—
—
—
—
—
—
% % % %
%
%
% % %
% % % %
% % % %— — — —
— — — —
%
%—
—
5.335.93
— —
— —
— — — —
— — — —
— — — —
— —
— — — —
— —
— — — —
— —
— — — —
— —
— — — —
— —
— — — —
— —
— — — —
%%%%%
6/30/2010 5.42 — — — — — — — — 6/30/2009 5.65 — — — — — — — — 6/30/2008 3.21 — — — — — — — — 6/30/2007 2.64 — — — — — — — — 6/30/2006 1.43 — — — — — — — —
% % % % % % % % %
Retirement Benefit PoliciesGeneral
I IISafety
I IIIII IV V VI III
655
Eligibility:AgeYears of ServiceAge
Age
Age
Years of Service
Years of Service
Years of Service
Years of Service Regardless of AgeAge Regardless of Service
5510
Final Average Salary:Position Last HeldHighest Year(s) AverageFinal Year(s) Average
3—
——
——
——
——
——
——
——
——
Compensation at Time of Retirement
OtherYNone
Maximum Annual IncreaseIndex to Consumer Price IndexIndex to Active Member IncreaseGranted Position Last HeldCost of Living:
Percent Per Year of Service: Age50556065
— — —
1.60
— — — —
— — — —
— — — —
— — — —
— — — —
— — — —
— — — —
— — — —
Social Security Coverage:
Benefit Comments:
Non-Service Disability - Per Year - Maximum
Service Disability - Per Year - Maximum
Disability Benefits as a Percentage of Final Average Salary (FAS):
— —
— —
— —
— —
— —
— —
— —
— —
— —
— —
— —
— —
— —
— —
— —
— —
— —
— —
Comments:The agency did not file a report to State Controller's Office by the deadline in the prior fiscal period.
161

Public Retirement Systems Annual Report — Fiscal Year 2011-12Contra Costa Water District Retirement Plan
Single-Employer Plan
SurvivorsNon-ServiceServiceRetiredVested MembersNon-VestedVestedMembershipActive Inactive Service Disabled
Total Status
193 108 96 207 — 4 38General - Tier 1 646 Open
193Totals 108 96 207 — 4 38 646
Contributions
AssetsCash and Short-Term InvestmentsReceivables
InvestmentsOther
Investments, at Fair ValueU.S. Government ObligationsInternational BondsMunicipal BondsDomestic Corporate BondsDomestic Stocks
Total Assets
Mortgages
Accounts PayableInvestment Purchases PayableAccrued ExpensesOther Current Liabilities
Total Liabilities
International Stocks
Net Assets Available for Benefits
Liabilities
AdditionsContributions
Employer -
Employee -
Total Additions
InterestDividends
Net Appreciation (Depreciation)
Other Investment Revenues
DeductionsBenefit Payments
Service Retirement -
in Fair Value of Investments
Other -
Statement of Changes in Plan Net Assets
$ 112,760,420
Real EstateVenture CapitalOther
Investments
$ —
$ 112,760,420
$ 1,177,833
$ 7,239,421
Disability -
Other -
Member Refunds -
Administration ExpensesOther Expenses
Total Deductions
Net Increase (Decrease) In Plan Assets
Beginning of the Year Net Assets Held
$ 6,231,970
$ 1,007,451
as of June 30, 2012 for Period Ending June 30, 2012
$ 112,760,420
14,952,053——
9,223,360——
13,411,5317,228,028
—66,243,537
228,493—
295,585
$ ————
1,609,4071,135,397
)(1,165,257—
Other Revenues —
——
$ 111,752,969
Fixed Assets Net of Accumulated DepreciationOther Assets
——
in Trust for Pension Benefits
End of the Year Net Assets Heldin Trust for Pension Benefits
Investment Expenses
Adjustments —
Actuarial Cost Method: (1)
Total UAAL Amortization Method:
Total UAAL Amortization Period: 1515Years Remaining in Total UAAL Amortization Period:
GeneralSafetyCombined
CombinedSafetyGeneral
CombinedSafetyGeneral
$ 3,324,636——
—
—
2,390,165—
——
General
CombinedSafety
CombinedSafety
CombinedSafetyGeneral
CombinedSafetyGeneral
$ 6,185,759——
46,211————————
Entry Age
—
Year in Which the Total Unfunded Actuarial Liability is Expected to be Fully Amortized:
)(54,927
General
Level Percentage of Projected Covered Payroll
Statement of Plan Net Assets
Funded
Unfunded
Actuarial ValueActuarial
SalaryInterestValuationActuary: Buck Consultants
Summary of Funding Position
of AssetsDate Rate Scale Liability Liability RatioAccrued
ActuarialAccruedFiscal
Year$ 33,294,000 75.9%8.00% 5.00% 6/30/2012 $ 138,161,000 $ 104,867,0002012
17,475,000 85.7%8.00% 5.00%6/30/2011 122,542,000 105,067,000201111,564,000 89.8%8.00% 5.00%6/30/2010 113,841,000 102,277,0002010
3,352,000 96.8%8.00% 5.00%6/30/2009 105,933,000 102,581,00020091,934,000 98.1%8.00% 5.25%6/30/2008 103,699,000 101,765,00020081,229,000 98.7%8.00% 5.25%6/30/2007 95,166,000 93,937,0002007
Summary of Employer Contributions
UAAL as aPercentage of ARCAnnual RequiredRecognizedFiscal Year Contributions (ARC) Made Percentage of ACP
Contribution Annual CoveredPayroll (ACP)
2012 $ 3,324,636 $ 3,324,636 100 $ 27,603,743 121% %2011 2,700,384 2,700,384 100 27,893,346 63% %2010 2,168,156 2,168,156 100 26,769,171 43% %2009 1,787,200 3,231,402 181 26,048,747 13% %2008 3,327,200 1,589,948 48 24,578,221 8% %2007 2,849,000 2,848,681 100 22,990,702 5% %
162

Public Retirement Systems Annual Report — Fiscal Year 2011-12Contra Costa Water District Retirement Plan — (Continued)
Contribution Rates as a Percentage of Covered Payroll
GeneralI II
SafetyI IIIII IV V VI IIIEmployer - Recommended by Actuary:
Normal CostUAAL AmortizationTotal Rates Recommended by Actuary
Total Rates Adopted by BoardPrior Year Rates
Employee Rates Adopted by Board:Age 25Age 35Age 45Single Rate
13.24
13.24
—
—
—
—
—
—
% % % %
%
%
% % %
%
% % % %
% % % %— — — —
— — — —
%
%—
—
6.516.73
— —
— —
— — —
13.24
— — — —
— — — —
— —
— — — —
— —
— — — —
— —
— — — —
— —
— — — —
— —
— — — —
— —
— — — —
%%%%%
6/30/2011 11.06 — — — — — — — — 6/30/2010 8.52 — — — — — — — — 6/30/2009 8.00 — — — — — — — — 6/30/2008 6.24 — — — — — — — — 6/30/2007 7.56 — — — — — — — —
(2)
% % % % % % % % %
Retirement Benefit PoliciesGeneral
I IISafety
I IIIII IV V VI III
505
Eligibility:AgeYears of ServiceAge
Age
Age
Years of Service
Years of Service
Years of Service
Years of Service Regardless of AgeAge Regardless of Service
50105510
55
Final Average Salary:Position Last HeldHighest Year(s) AverageFinal Year(s) Average
1—
——
——
——
——
——
——
——
——
Compensation at Time of Retirement
OtherNoneMaximum Annual Increase
YIndex to Consumer Price IndexIndex to Active Member IncreaseGranted Position Last HeldCost of Living:
Percent Per Year of Service: Age50556065
1.601.602.552.55
— — — —
— — — —
— — — —
— — — —
— — — —
— — — —
— — — —
— — — —
Social Security Coverage:
Clerical/maintenance participants who become disabled as a result of employment-related causes after completing ten years of service are entitled to monthly pension benefits equal to 30% of their last monthly salary.
Benefit Comments:
Non-Service Disability - Per Year - Maximum
Service Disability - Per Year - Maximum
Disability Benefits as a Percentage of Final Average Salary (FAS):
— 30 %
— —
— —
— —
— —
— —
— —
— —
— —
— 30 %
— —
— —
— —
— —
— —
— —
— —
— —
Footnote:
(1) Each year's change in Unfunded Actuarial Accrued Liability will be separately amortized over a new 15-year period.
(2) All employees are required to contribute to the plan a predetermined percentage of their base salary ranging from 1% to 8%, depending on the member's classification. In addition, the district contributes on behalf of the participant's contribution, from 0% to 5% of base salary, depending on classification.
163

Public Retirement Systems Annual Report — Fiscal Year 2011-12Desert Hospital Retirement Protection Plan
Single-Employer Plan
SurvivorsNon-ServiceServiceRetiredVested MembersNon-VestedVestedMembershipActive Inactive Service Disabled
Total Status
206 — 68 32 — — —General - Tier 1 306 Closed
206Totals — 68 32 — — — 306
Contributions
AssetsCash and Short-Term InvestmentsReceivables
InvestmentsOther
Investments, at Fair ValueU.S. Government ObligationsInternational BondsMunicipal BondsDomestic Corporate BondsDomestic Stocks
Total Assets
Mortgages
Accounts PayableInvestment Purchases PayableAccrued ExpensesOther Current Liabilities
Total Liabilities
International Stocks
Net Assets Available for Benefits
Liabilities
AdditionsContributions
Employer -
Employee -
Total Additions
InterestDividends
Net Appreciation (Depreciation)
Other Investment Revenues
DeductionsBenefit Payments
Service Retirement -
in Fair Value of Investments
Other -
Statement of Changes in Plan Net Assets
$ 3,034,163
Real EstateVenture CapitalOther
Investments
$ —
$ 3,034,163
$ 84,210
$ )(30,042
Disability -
Other -
Member Refunds -
Administration ExpensesOther Expenses
Total Deductions
Net Increase (Decrease) In Plan Assets
Beginning of the Year Net Assets Held
$ 457,919
$ )(487,961
as of June 30, 2012 for Period Ending June 30, 2012
$ 3,034,163
482,086——
411,056615,510
————
1,433,360
—7,941
—
$ ————
39,33950,720
)(114,28215,272
Other Revenues 1,573
——
$ 3,522,124
Fixed Assets Net of Accumulated DepreciationOther Assets
——
in Trust for Pension Benefits
End of the Year Net Assets Heldin Trust for Pension Benefits
Investment Expenses
Adjustments —
Actuarial Cost Method:
Total UAAL Amortization Method:
Total UAAL Amortization Period: ——Years Remaining in Total UAAL Amortization Period:
GeneralSafetyCombined
CombinedSafetyGeneral
CombinedSafetyGeneral
$ ———
—
—
——
——
General
CombinedSafety
CombinedSafety
CombinedSafetyGeneral
CombinedSafetyGeneral
$ ——————
457,919—————
Projected Unit Credit
—
Year in Which the Total Unfunded Actuarial Liability is Expected to be Fully Amortized:
)(22,664
General
No Amortization
Statement of Plan Net Assets
Funded
Unfunded
Actuarial ValueActuarial
SalaryInterestValuationActuary: The Epler Co.
Summary of Funding Position
of AssetsDate Rate Scale Liability Liability RatioAccrued
ActuarialAccruedFiscal
Year$ 4,399,217 44.5%7.50% — %6/30/2011 $ 7,921,342 $ 3,522,1252012
4,399,217 44.5%7.50% — %6/30/2011 7,921,342 3,522,12520115,790,037 36.7%7.50% — %6/30/2009 9,141,403 3,351,36620105,790,037 36.7%7.50% — %6/30/2009 9,141,403 3,351,36620094,760,507 48.9%8.50% — %6/30/2008 9,312,581 4,552,07420084,330,280 54.7%8.50% — %6/30/2006 9,566,663 5,236,3832007
Summary of Employer Contributions
UAAL as aPercentage of ARCAnnual RequiredRecognizedFiscal Year Contributions (ARC) Made Percentage of ACP
Contribution Annual CoveredPayroll (ACP)
2012 $ — $ — $ — — %2011 — — — — %2010 — — — %2009 — — — %2008 — — — — %2007 — — — — %
164

Public Retirement Systems Annual Report — Fiscal Year 2011-12Desert Hospital Retirement Protection Plan — (Continued)
Contribution Rates as a Percentage of Covered Payroll
GeneralI II
SafetyI IIIII IV V VI IIIEmployer - Recommended by Actuary:
Normal CostUAAL AmortizationTotal Rates Recommended by Actuary
Total Rates Adopted by BoardPrior Year Rates
Employee Rates Adopted by Board:Age 25Age 35Age 45Single Rate
—
—
—
—
—
—
—
—
% % % %
% % % %
% % % %
% % % %— — — —
— — — —
%
%—
—
— —
— —
— —
— — — —
— — — —
— — — —
— —
— — — —
— —
— — — —
— —
— — — —
— —
— — — —
— —
— — — —
— —
— — — —
6/30/2011 — — — — — — — — — 6/30/2010 — — — — — — — — — 6/30/2009 — — — — — — — — — 6/30/2008 — — — — — — — — — 6/30/2007 — — — — — — — — —
% % % % % % % % %
Retirement Benefit PoliciesGeneral
I IISafety
I IIIII IV V VI III
5510
Eligibility:AgeYears of ServiceAge
Age
Age
Years of Service
Years of Service
Years of Service
Years of Service Regardless of AgeAge Regardless of Service
605
655
Final Average Salary:Position Last HeldHighest Year(s) AverageFinal Year(s) Average
5—
——
——
——
——
——
——
——
——
Compensation at Time of Retirement
OtherYNone
Maximum Annual IncreaseIndex to Consumer Price IndexIndex to Active Member IncreaseGranted Position Last HeldCost of Living:
Percent Per Year of Service: Age50556065
— — — —
— — — —
— — — —
— — — —
— — — —
— — — —
— — — —
— — — —
— — — —
NSocial Security Coverage:
No disability benefits exist other than normal termination benefits. Normal retirement benefits are equal to the participant's accrued benefit as of June 30, 1986, converted to a lump sum, plus additional calculations through May 1997.
Benefit Comments:
Non-Service Disability - Per Year - Maximum
Service Disability - Per Year - Maximum
Disability Benefits as a Percentage of Final Average Salary (FAS):
— —
— —
— —
— —
— —
— —
— —
— —
— —
— —
— —
— —
— —
— —
— —
— —
— —
— —
Comments:The Desert Hospital Retirement Protection Plan has been frozen since May 31, 1997. Due to the plan's status as a frozen plan, certain disclosures and supplemental schedules required for the financial statements to be in accordance with generally accepted accounting principals were not included.
Participant contributions to the plan are not permitted. There have been no contributions requirements by the district since May 31, 1997. The funded status of the plan is 44.5% in 2011 and the actuary has recommended that the district resume making contributions.
The plan's independent actuary recommended that the district contribute at a minimum of $1,011,471 to the plan for the next five years. The district has accrued contributions payable to the plan of $2,571,588 at June 30, 2012 and the Board of Directors has approved an additional accrued contribution of $857,196 to the plan during the June 30, 2013 year. The district intends to include additional annual contributions in future budgets to meet the plan's unfunded actuarial accrued liability. However, the district's board of directors has elected not to fund any additional amounts to the plan at this time because the district has sufficient asset reserves available.
165

Public Retirement Systems Annual Report — Fiscal Year 2011-12East Bay Municipal Utility District Retirement System
Single-Employer Plan
SurvivorsNon-ServiceServiceRetiredVested MembersNon-VestedVestedMembershipActive Inactive Service Disabled
Total Status
— — 1 197 — 21 147General - Tier 1 366 Closed
1,388 314 222 887 — 44 692 2,924 Open
1,388Totals 314 223 1,084 — 65 216 3,290
Contributions
AssetsCash and Short-Term InvestmentsReceivables
InvestmentsOther
Investments, at Fair ValueU.S. Government ObligationsInternational BondsMunicipal BondsDomestic Corporate BondsDomestic Stocks
Total Assets
Mortgages
Accounts PayableInvestment Purchases PayableAccrued ExpensesOther Current Liabilities
Total Liabilities
International Stocks
Net Assets Available for Benefits
Liabilities
AdditionsContributions
Employer -
Employee -
Total Additions
InterestDividends
Net Appreciation (Depreciation)
Other Investment Revenues
DeductionsBenefit Payments
Service Retirement -
in Fair Value of Investments
Other -
Statement of Changes in Plan Net Assets
$ 1,090,085,000
Real EstateVenture CapitalOther
Investments
$ 116,682,000
$ 973,403,000
$ 131,899,000
$ 78,771,000
Disability -
Other -
Member Refunds -
Administration ExpensesOther Expenses
Total Deductions
Net Increase (Decrease) In Plan Assets
Beginning of the Year Net Assets Held
$ 61,541,000
$ 17,230,000
as of June 30, 2012 for Period Ending June 30, 2012
$ 973,403,000
120,200,0006,985,0002,803,000
83,396,000509,219,000174,852,000
—48,238,000
——
2,316,00010,177,000
—
$ 1,347,00016,071,000
—99,264,000
8,153,00010,536,000
)(223,000967,000
Other Revenues —
1,072,000—
$ 956,173,000
Fixed Assets Net of Accumulated DepreciationOther Assets
——
in Trust for Pension Benefits
End of the Year Net Assets Heldin Trust for Pension Benefits
Investment Expenses
Adjustments —
Actuarial Cost Method:
Total UAAL Amortization Method:
Total UAAL Amortization Period: 30—Years Remaining in Total UAAL Amortization Period:
GeneralSafetyCombined
CombinedSafetyGeneral
CombinedSafetyGeneral
$ 52,156,000——
—
—
10,582,000—
——
General
CombinedSafety
CombinedSafety
CombinedSafetyGeneral
CombinedSafetyGeneral
$ 58,204,000——
1,676,000—————
589,000——
Entry Age
—
Year in Which the Total Unfunded Actuarial Liability is Expected to be Fully Amortized:
)(3,400,000
General
Level Percentage of Projected Covered Payroll
Statement of Plan Net Assets
Funded
Unfunded
Actuarial ValueActuarial
SalaryInterestValuationActuary: The Segal Company
Summary of Funding Position
of AssetsDate Rate Scale Liability Liability RatioAccrued
ActuarialAccruedFiscal
Year$ 491,319,000 66.0%8.00% 4.70%6/30/2011 $ 1,446,038,000 $ 954,719,0002012
480,158,000 65.6%8.00% 4.70%6/30/2010 1,396,003,000 915,845,0002011461,534,000 65.1%8.25% 4.70%6/30/2009 1,323,555,000 862,021,0002010344,076,000 72.4%8.25% 6.07%6/30/2008 1,244,993,000 900,917,0002009299,008,154 73.4%8.25% 6.07%6/30/2007 1,126,105,711 827,097,5572008299,008,154 73.4%8.25% 7.66%6/30/2007 1,126,105,711 827,097,5572007
Summary of Employer Contributions
UAAL as aPercentage of ARCAnnual RequiredRecognizedFiscal Year Contributions (ARC) Made Percentage of ACP
Contribution Annual CoveredPayroll (ACP)
2012 $ 52,156,000 $ 52,156,000 100 $ 156,668,000 314% %2011 50,987,000 50,987,000 100 158,482,000 303% %2010 44,031,000 44,031,000 100 161,893,000 285% %2009 39,485,000 39,485,000 100 158,499,000 217% %2008 37,387,000 37,387,000 100 153,394,000 195% %2007 33,698,000 33,698,000 100 153,394,000 195% %
166

Public Retirement Systems Annual Report — Fiscal Year 2011-12East Bay Municipal Utility District Retirement System — (Continued)
Contribution Rates as a Percentage of Covered Payroll
GeneralI II
SafetyI IIIII IV V VI IIIEmployer - Recommended by Actuary:
Normal CostUAAL AmortizationTotal Rates Recommended by Actuary
Total Rates Adopted by BoardPrior Year Rates
Employee Rates Adopted by Board:Age 25Age 35Age 45Single Rate
—
—
32.91
32.91
—
—
—
—
% % % %
% %
%
% %
%
% % % %
% % % %— — — —
— — — —
%
%—
—
— —
14.3318.58
— —
— — — —
— — —
6.74
— — — —
— —
— — — —
— —
— — — —
— —
— — — —
— —
— — — —
— —
— — — —
— —
— — — —
%%%%%
6/30/2011 — 31.67 — — — — — — — 6/30/2010 — 30.56 — — — — — — — 6/30/2009 — 26.18 — — — — — — — 6/30/2008 — 23.63 — — — — — — — 6/30/2007 — 23.22 — — — — — — —
% % % % % % % % %
Retirement Benefit PoliciesGeneral
I IISafety
I IIIII IV V VI III
545
Eligibility:AgeYears of ServiceAge
Age
Age
Years of Service
Years of Service
Years of Service
Years of Service Regardless of AgeAge Regardless of Service
625
65
545
625
65
Final Average Salary:Position Last HeldHighest Year(s) AverageFinal Year(s) Average
2—
2—
——
——
——
——
——
——
——
Compensation at Time of Retirement
OtherNone
3%Maximum Annual IncreaseYYIndex to Consumer Price Index
3%
Index to Active Member IncreaseGranted Position Last HeldCost of Living:
Percent Per Year of Service: Age50556065
— 2.822.822.82
— 2.602.602.60
— — — —
— — — —
— — — —
— — — —
— — — —
— — — —
— — — —
SSocial Security Coverage: S
Tier I and Tier II members qualify for retirement at age 54 with five years of service. However, a member must have 30 years of service to qualify for an unreduced pension at age 54.
Benefit Comments:
Non-Service Disability - Per Year - Maximum
Service Disability - Per Year - Maximum
Disability Benefits as a Percentage of Final Average Salary (FAS):
2 %—
2 %—
— —
— —
— —
— —
— —
— —
— —
2 %—
2 %—
— —
— —
— —
— —
— —
— —
— —
167

Public Retirement Systems Annual Report — Fiscal Year 2011-12Golden Gate Transit District Amalgamated Retirement Plan
Single-Employer Plan
SurvivorsNon-ServiceServiceRetiredVested MembersNon-VestedVestedMembershipActive Inactive Service Disabled
Total Status
82 179 7 232 39 — 83General - Tier 1 622 Open
82Totals 179 7 232 39 — 83 622
Contributions
AssetsCash and Short-Term InvestmentsReceivables
InvestmentsOther
Investments, at Fair ValueU.S. Government ObligationsInternational BondsMunicipal BondsDomestic Corporate BondsDomestic Stocks
Total Assets
Mortgages
Accounts PayableInvestment Purchases PayableAccrued ExpensesOther Current Liabilities
Total Liabilities
International Stocks
Net Assets Available for Benefits
Liabilities
AdditionsContributions
Employer -
Employee -
Total Additions
InterestDividends
Net Appreciation (Depreciation)
Other Investment Revenues
DeductionsBenefit Payments
Service Retirement -
in Fair Value of Investments
Other -
Statement of Changes in Plan Net Assets
$ 96,284,997
Real EstateVenture CapitalOther
Investments
$ 157,665
$ 96,127,332
$ 3,059,526
$ 1,819,786
Disability -
Other -
Member Refunds -
Administration ExpensesOther Expenses
Total Deductions
Net Increase (Decrease) In Plan Assets
Beginning of the Year Net Assets Held
$ 9,650,947
$ )(7,831,161
as of December 31, 2011 for Period Ending December 31, 2011
$ 96,127,332
————
48,018,23116,029,358
———
28,654,961
148,970373,951
—
$ 86,14471,521
——
5,7412,281,506
)(3,918,778—
Other Revenues —
382,345—
$ 103,958,493
Fixed Assets Net of Accumulated DepreciationOther Assets
——
(1)
in Trust for Pension Benefits
End of the Year Net Assets Heldin Trust for Pension Benefits
Investment Expenses
Adjustments —
Actuarial Cost Method:
Total UAAL Amortization Method:
Total UAAL Amortization Period: 2020Years Remaining in Total UAAL Amortization Period:
GeneralSafetyCombined
CombinedSafetyGeneral
CombinedSafetyGeneral
$ 3,392,754——
—
—
408,727—
——
General
CombinedSafety
CombinedSafety
CombinedSafetyGeneral
CombinedSafetyGeneral
$ 8,766,474——
502,128————————
Entry Age
—
Year in Which the Total Unfunded Actuarial Liability is Expected to be Fully Amortized:
)(350,164
General
Level Percentage of Projected Covered Payroll
Statement of Plan Net Assets
Funded
Unfunded
Actuarial ValueActuarial
SalaryInterestValuationActuary: Milliman USA
Summary of Funding Position
of AssetsDate Rate Scale Liability Liability RatioAccrued
ActuarialAccruedFiscal
Year$ 45,178,385 68.4%8.00% 5.00% 1/1/2011 $ 143,140,197 $ 97,961,8122012
33,302,539 76.0%8.00% 5.00%1/1/2010 138,936,378 105,633,839201133,302,539 76.0%8.00% 5.00%1/1/2010 138,936,378 105,633,839201032,809,000 75.9%8.00% 5.00%1/1/2009 136,011,000 103,202,0002009
3,129,000 97.5%8.00% 5.00%1/1/2007 126,318,000 123,189,00020083,129,000 97.5%8.00% 5.50%1/1/2007 126,318,000 123,189,0002007
Summary of Employer Contributions
UAAL as aPercentage of ARCAnnual RequiredRecognizedFiscal Year Contributions (ARC) Made Percentage of ACP
Contribution Annual CoveredPayroll (ACP)
2012 $ 6,467,283 $ 3,392,754 52 $ 19,765,535 229% %2011 5,677,071 3,429,679 60 21,253,736 157% %2010 4,552,534 3,383,424 74 20,970,474 159% %2009 3,912,888 2,918,755 75 21,186,571 155% %2008 3,716,643 2,865,664 77 18,770,000 17% %2007 3,615,993 2,713,581 75 18,770,000 17% %
168

Public Retirement Systems Annual Report — Fiscal Year 2011-12Golden Gate Transit District Amalgamated Retirement Plan — (Continued)
Contribution Rates as a Percentage of Covered Payroll
GeneralI II
SafetyI IIIII IV V VI IIIEmployer - Recommended by Actuary:
Normal CostUAAL AmortizationTotal Rates Recommended by Actuary
Total Rates Adopted by BoardPrior Year Rates
Employee Rates Adopted by Board:Age 25Age 35Age 45Single Rate
38.46
17.16
—
—
—
—
—
—
% % % %
%
%
% % %
%
% % % %
% % % %— — — —
— — — —
%
%—
—
17.3821.08
— —
— —
— — —
2.00
— — — —
— — — —
— —
— — — —
— —
— — — —
— —
— — — —
— —
— — — —
— —
— — — —
— —
— — — —
%%%%%
12/31/2010 17.16 — — — — — — — — 12/31/2009 17.16 — — — — — — — — 12/31/2008 15.17 — — — — — — — — 12/31/2007 15.17 — — — — — — — — 12/31/2006 15.17 — — — — — — — —
(2)
% % % % % % % % %
Retirement Benefit PoliciesGeneral
I IISafety
I IIIII IV V VI III
5515
Eligibility:AgeYears of ServiceAge
Age
Age
Years of Service
Years of Service
Years of Service
Years of Service Regardless of AgeAge Regardless of Service
50256020
6720
Final Average Salary:Position Last HeldHighest Year(s) AverageFinal Year(s) Average
1—
——
——
——
——
——
——
——
——
Compensation at Time of Retirement
OtherYNone
Maximum Annual IncreaseIndex to Consumer Price IndexIndex to Active Member IncreaseGranted Position Last HeldCost of Living:
Percent Per Year of Service: Age50556065
— — — —
— — — —
— — — —
— — — —
— — — —
— — — —
— — — —
— — — —
— — — —
NSocial Security Coverage:
Benefits are 50% of Average Final Earnings (AFE) plus 1% of AFE for each additional year to age 65. For members who retire after age 60 with at least 20 years of service, an additional 1% of AFE is added.
Benefit Comments:
Non-Service Disability - Per Year - Maximum
Service Disability - Per Year - Maximum
Disability Benefits as a Percentage of Final Average Salary (FAS):
— 35 %
— —
— —
— —
— —
— —
— —
— —
— —
— 50 %
— —
— —
— —
— —
— —
— —
— —
— —
Footnote:
(1) According to the employees contract, employees contributions are required beginning 2009.
(2) The district's contributions to the plan are determined as a result of collective bargaining with the Amalgamated Transit Union Local No. 1575. The memorandum of understanding provides that if the actuarial values of the plan's assets decline to be equal to or less than 93% of the actuarial liabilities, the pension contributions will be increased by 4% of wage with 2% to be paid by the district and 2% by the employees. As a result, effective March 1, 2009, the rate increase under this provision became effective, bringing the total contribution rate to 19.165%.
169

Public Retirement Systems Annual Report — Fiscal Year 2011-12Kaweah Delta Hospital District Employees' Retirement Plan
Single-Employer Plan
SurvivorsNon-ServiceServiceRetiredVested MembersNon-VestedVestedMembershipActive Inactive Service Disabled
Total Status
992 101 967 500 — — 14General - Tier 1 2,574 Closed
992Totals 101 967 500 — — 14 2,574
Contributions
AssetsCash and Short-Term InvestmentsReceivables
InvestmentsOther
Investments, at Fair ValueU.S. Government ObligationsInternational BondsMunicipal BondsDomestic Corporate BondsDomestic Stocks
Total Assets
Mortgages
Accounts PayableInvestment Purchases PayableAccrued ExpensesOther Current Liabilities
Total Liabilities
International Stocks
Net Assets Available for Benefits
Liabilities
AdditionsContributions
Employer -
Employee -
Total Additions
InterestDividends
Net Appreciation (Depreciation)
Other Investment Revenues
DeductionsBenefit Payments
Service Retirement -
in Fair Value of Investments
Other -
Statement of Changes in Plan Net Assets
$ 152,766,477
Real EstateVenture CapitalOther
Investments
$ —
$ 152,766,477
$ 5,645,334
$ 199,959
Disability -
Other -
Member Refunds -
Administration ExpensesOther Expenses
Total Deductions
Net Increase (Decrease) In Plan Assets
Beginning of the Year Net Assets Held
$ 6,812,210
$ )(6,612,251
as of June 30, 2012 for Period Ending June 30, 2012
$ 152,766,477
10,766,204535,879226,977
12,453,78768,394,41338,752,436
———
15,270,969
—452,564267,914
$ ————
1,017,1092,555,060
)(4,445,030—
Other Revenues —
136,844—
$ 159,378,728
Fixed Assets Net of Accumulated DepreciationOther Assets
——
in Trust for Pension Benefits
End of the Year Net Assets Heldin Trust for Pension Benefits
Investment Expenses
Adjustments —
Actuarial Cost Method:
Total UAAL Amortization Method:
Total UAAL Amortization Period: 3030Years Remaining in Total UAAL Amortization Period:
GeneralSafetyCombined
CombinedSafetyGeneral
CombinedSafetyGeneral
$ 2,234,786——
—
—
——
——
General
CombinedSafety
CombinedSafety
CombinedSafetyGeneral
CombinedSafetyGeneral
$ 6,675,366———————————
Projected Unit Credit
—
Year in Which the Total Unfunded Actuarial Liability is Expected to be Fully Amortized:
)(1,161,966
General
Level Dollar Amount
Statement of Plan Net Assets
Funded
Unfunded
Actuarial ValueActuarial
SalaryInterestValuationActuary: Watson Wtatt
Summary of Funding Position
of AssetsDate Rate Scale Liability Liability RatioAccrued
ActuarialAccruedFiscal
Year$ 47,924,153 76.1%8.00% 2.00%6/30/2012 $ 200,690,630 $ 152,766,4772012
26,149,015 85.9%8.00% 2.00%6/30/2011 185,527,743 159,378,728201164,997,665 65.3%8.00% 3.00%6/30/2010 187,243,617 122,245,952201077,716,340 57.0%8.00% 4.00%6/30/2009 180,526,131 102,809,791200928,156,443 81.3%8.00% 4.00%7/1/2007 150,306,017 122,149,574200829,329,635 77.5%8.00% 4.00%7/1/2006 130,285,735 100,956,1002007
Summary of Employer Contributions
UAAL as aPercentage of ARCAnnual RequiredRecognizedFiscal Year Contributions (ARC) Made Percentage of ACP
Contribution Annual CoveredPayroll (ACP)
2012 $ 2,233,412 $ 2,234,786 100 $ — —% %2011 11,324,298 11,325,664 100 — —% %2010 12,909,875 12,911,247 100 66,642,031 98% %2009 10,089,712 10,091,082 100 70,003,288 111% %2008 8,612,952 9,341,143 108 74,772,324 38% %2007 8,117,732 8,341,816 103 71,463,989 41% %
170

Public Retirement Systems Annual Report — Fiscal Year 2011-12Kaweah Delta Hospital District Employees' Retirement Plan — (Continued)
Contribution Rates as a Percentage of Covered Payroll
GeneralI II
SafetyI IIIII IV V VI IIIEmployer - Recommended by Actuary:
Normal CostUAAL AmortizationTotal Rates Recommended by Actuary
Total Rates Adopted by BoardPrior Year Rates
Employee Rates Adopted by Board:Age 25Age 35Age 45Single Rate
—
—
—
—
—
—
—
—
% % % %
% % % %
% % % %
% % % %— — — —
— — — —
%
%—
—
— —
— —
— —
— — — —
— — — —
— — — —
— —
— — — —
— —
— — — —
— —
— — — —
— —
— — — —
— —
— — — —
— —
— — — —
%%%%%
6/30/2011 16.99 — — — — — — — — 6/30/2010 18.44 — — — — — — — — 6/30/2009 13.87 — — — — — — — — 6/30/2008 11.52 — — — — — — — — 6/30/2007 11.36 — — — — — — — —
% % % % % % % % %
Retirement Benefit PoliciesGeneral
I IISafety
I IIIII IV V VI III
5510
Eligibility:AgeYears of ServiceAge
Age
Age
Years of Service
Years of Service
Years of Service
Years of Service Regardless of AgeAge Regardless of Service
505
65
Final Average Salary:Position Last HeldHighest Year(s) AverageFinal Year(s) Average
3—
——
——
——
——
——
——
——
——
Compensation at Time of Retirement
OtherNone
2%Maximum Annual IncreaseYIndex to Consumer Price Index
Index to Active Member IncreaseGranted Position Last HeldCost of Living:
Percent Per Year of Service: Age50556065
1.201.501.802.00
— — — —
— — — —
— — — —
— — — —
— — — —
— — — —
— — — —
— — — —
SSocial Security Coverage:
There are no separate disability benefit provisions.Benefit Comments:
Non-Service Disability - Per Year - Maximum
Service Disability - Per Year - Maximum
Disability Benefits as a Percentage of Final Average Salary (FAS):
— —
— —
— —
— —
— —
— —
— —
— —
— —
— —
— —
— —
— —
— —
— —
— —
— —
— —
Comments:The Board of Directors passed a resolution that allowed employees, as of December 31, 2002, to make an irrevocable choice between continuing in the retirement plan and receiving matching contributions to the 401(K) plan. Nonvested employees who elected not to continue in the Retirement Plan gave up their accrued benefits under the plan. New employees hired on or after January 1, 2003, are ineligible to participate in the retirement plan.
Effective June 30, 2011, the plan was amended to suspend all accruals and freeze benefits under the plan. As a result of the benefit accrual freeze, covered payroll is not reported. Participants were offered a one-time opportunity to convert sick leave hours to years of credited service. The effect of the plan amendment was a reduction in the actuarial accrued liability of approximately $20 million.
171

Public Retirement Systems Annual Report — Fiscal Year 2011-12Long Beach Public Transportation Company Contract Employees' Retirement Plan
Single-Employer Plan
SurvivorsNon-ServiceServiceRetiredVested MembersNon-VestedVestedMembershipActive Inactive Service Disabled
Total Status
446 129 10 103 — — —General - Tier 1 688 Open
446Totals 129 10 103 — — — 688
Contributions
AssetsCash and Short-Term InvestmentsReceivables
InvestmentsOther
Investments, at Fair ValueU.S. Government ObligationsInternational BondsMunicipal BondsDomestic Corporate BondsDomestic Stocks
Total Assets
Mortgages
Accounts PayableInvestment Purchases PayableAccrued ExpensesOther Current Liabilities
Total Liabilities
International Stocks
Net Assets Available for Benefits
Liabilities
AdditionsContributions
Employer -
Employee -
Total Additions
InterestDividends
Net Appreciation (Depreciation)
Other Investment Revenues
DeductionsBenefit Payments
Service Retirement -
in Fair Value of Investments
Other -
Statement of Changes in Plan Net Assets
$ 37,025,393
Real EstateVenture CapitalOther
Investments
$ —
$ 37,025,393
$ 559,407
$ 2,468,202
Disability -
Other -
Member Refunds -
Administration ExpensesOther Expenses
Total Deductions
Net Increase (Decrease) In Plan Assets
Beginning of the Year Net Assets Held
$ 2,801,203
$ )(333,001
as of June 30, 2012 for Period Ending June 30, 2012
$ 37,025,393
———————
71,032—
36,394,954
———
$ ————
202,253661,219
)(1,546,443—
Other Revenues —
164,944—
$ 37,358,394
Fixed Assets Net of Accumulated DepreciationOther Assets
——
(1)
in Trust for Pension Benefits
End of the Year Net Assets Heldin Trust for Pension Benefits
Investment Expenses
Adjustments —
Actuarial Cost Method:
Total UAAL Amortization Method:
Total UAAL Amortization Period: 3025Years Remaining in Total UAAL Amortization Period:
GeneralSafetyCombined
CombinedSafetyGeneral
CombinedSafetyGeneral
$ 2,099,802——
—
—
1,141,708—
——
General
CombinedSafety
CombinedSafety
CombinedSafetyGeneral
CombinedSafetyGeneral
$ 2,636,259———————————
Frozen Entry Age
2037
Year in Which the Total Unfunded Actuarial Liability is Expected to be Fully Amortized:
)(90,337
General
Level Percentage of Projected Covered Payroll
Statement of Plan Net Assets
Funded
Unfunded
Actuarial ValueActuarial
SalaryInterestValuationActuary: Venuti & Associates
Summary of Funding Position
of AssetsDate Rate Scale Liability Liability RatioAccrued
ActuarialAccruedFiscal
Year$ 12,487,183 74.8%7.50% 4.00% 7/1/2012 $ 49,512,576 $ 37,025,3932012
9,998,911 78.9%7.50% 4.00%7/1/2011 47,357,305 37,358,394201116,161,739 64.4%7.50% 4.00%7/1/2010 45,373,970 29,212,231201018,340,407 56.9%7.50% 4.00%7/1/2009 42,568,598 24,228,191200910,113,211 73.8%7.50% 4.00%7/1/2008 38,557,262 28,444,0512008
8,357,000 76.8%7.50% 4.00%7/1/2007 36,056,000 27,699,0002007
Summary of Employer Contributions
UAAL as aPercentage of ARCAnnual RequiredRecognizedFiscal Year Contributions (ARC) Made Percentage of ACP
Contribution Annual CoveredPayroll (ACP)
2012 $ 1,688,703 $ 2,099,802 124 $ 25,904,690 48% %2011 3,791,200 3,791,200 100 25,473,634 39% %2010 4,111,605 4,111,605 100 25,501,412 63% %2009 3,048,814 3,048,814 100 25,266,127 73% %2008 2,661,268 2,661,268 100 23,643,084 43% %2007 2,777,353 2,777,353 100 21,866,049 38% %
172

Public Retirement Systems Annual Report — Fiscal Year 2011-12Long Beach Public Transportation Company Contract Employees' Retirement Plan — (Continued)
Contribution Rates as a Percentage of Covered Payroll
GeneralI II
SafetyI IIIII IV V VI IIIEmployer - Recommended by Actuary:
Normal CostUAAL AmortizationTotal Rates Recommended by Actuary
Total Rates Adopted by BoardPrior Year Rates
Employee Rates Adopted by Board:Age 25Age 35Age 45Single Rate
7.32
7.32
—
—
—
—
—
—
% % % %
%
%
% % %
%
% % % %
% % % %— — — —
— — — —
%
%—
—
7.32—
— —
— —
— — —
5.00
— — — —
— — — —
— —
— — — —
— —
— — — —
— —
— — — —
— —
— — — —
— —
— — — —
— —
— — — —
%%%%%
6/30/2011 15.00 — — — — — — — — 6/30/2010 16.20 — — — — — — — — 6/30/2009 12.18 — — — — — — — — 6/30/2008 11.35 — — — — — — — — 6/30/2007 12.32 — — — — — — — —
% % % % % % % % %
Retirement Benefit PoliciesGeneral
I IISafety
I IIIII IV V VI III
6410
Eligibility:AgeYears of ServiceAge
Age
Age
Years of Service
Years of Service
Years of Service
Years of Service Regardless of AgeAge Regardless of Service
5410
Final Average Salary:Position Last HeldHighest Year(s) AverageFinal Year(s) Average
5—
——
——
——
——
——
——
——
——
Compensation at Time of Retirement
OtherNoneMaximum Annual IncreaseIndex to Consumer Price IndexIndex to Active Member IncreaseGranted Position Last HeldCost of Living:
Percent Per Year of Service: Age50556065
— — — —
— — — —
— — — —
— — — —
— — — —
— — — —
— — — —
— — — —
— — — —
Social Security Coverage:
The normal retirement benefits credited years of service (maximum 40 years) x 1.23% of the first $500 plus 1.7% of Adjusted Monthly Final Earnings. The disability benefit is the same at the date of disability without any reduction factor.
Benefit Comments:
Non-Service Disability - Per Year - Maximum
Service Disability - Per Year - Maximum
Disability Benefits as a Percentage of Final Average Salary (FAS):
— —
— —
— —
— —
— —
— —
— —
— —
— —
— —
— —
— —
— —
— —
— —
— —
— —
— —
Comments:Plan members contributed 5% of their annual salary toward the plan. The plan contributes the remainder of the actuarially determined rate.
Footnote:
(1) Includes $25,643 in transfer to the Salaried plan for accrued benefits for contract employees who accepted salaried positions and became eligible for participation in the Salaried plan.
173

Public Retirement Systems Annual Report — Fiscal Year 2011-12Long Beach Public Transportation Company Salaried Employees' Retirement Plan
Single-Employer Plan
SurvivorsNon-ServiceServiceRetiredVested MembersNon-VestedVestedMembershipActive Inactive Service Disabled
Total Status
101 32 8 29 — — —General - Tier 1 170 Closed
101Totals 32 8 29 — — — 170
Contributions
AssetsCash and Short-Term InvestmentsReceivables
InvestmentsOther
Investments, at Fair ValueU.S. Government ObligationsInternational BondsMunicipal BondsDomestic Corporate BondsDomestic Stocks
Total Assets
Mortgages
Accounts PayableInvestment Purchases PayableAccrued ExpensesOther Current Liabilities
Total Liabilities
International Stocks
Net Assets Available for Benefits
Liabilities
AdditionsContributions
Employer -
Employee -
Total Additions
InterestDividends
Net Appreciation (Depreciation)
Other Investment Revenues
DeductionsBenefit Payments
Service Retirement -
in Fair Value of Investments
Other -
Statement of Changes in Plan Net Assets
$ 11,028,003
Real EstateVenture CapitalOther
Investments
$ —
$ 11,028,003
$ 228,876
$ 1,390,815
Disability -
Other -
Member Refunds -
Administration ExpensesOther Expenses
Total Deductions
Net Increase (Decrease) In Plan Assets
Beginning of the Year Net Assets Held
$ 2,384,356
$ )(993,541
as of June 30, 2012 for Period Ending June 30, 2012
$ 11,028,003
———————
20,629—
10,712,678
65,820——
$ ————
60,886179,223
)(490,23611,337
Other Revenues —
90,188—
$ 12,021,544
Fixed Assets Net of Accumulated DepreciationOther Assets
——
(1)
in Trust for Pension Benefits
End of the Year Net Assets Heldin Trust for Pension Benefits
Investment Expenses
Adjustments —
Actuarial Cost Method:
Total UAAL Amortization Method:
Total UAAL Amortization Period: 3025Years Remaining in Total UAAL Amortization Period:
GeneralSafetyCombined
CombinedSafetyGeneral
CombinedSafetyGeneral
$ 1,269,887——
—
—
387,987—
——
General
CombinedSafety
CombinedSafety
CombinedSafetyGeneral
CombinedSafetyGeneral
$ 2,294,168———————————
Frozen Entry Age
2037
Year in Which the Total Unfunded Actuarial Liability is Expected to be Fully Amortized:
)(28,269
General
Level Percentage of Projected Covered Payroll
Statement of Plan Net Assets
Funded
Unfunded
Actuarial ValueActuarial
SalaryInterestValuationActuary: Venuti & Associates
Summary of Funding Position
of AssetsDate Rate Scale Liability Liability RatioAccrued
ActuarialAccruedFiscal
Year$ 7,396,483 59.9%7.50% 4.00% 7/1/2012 $ 18,424,486 $ 11,028,0032012
6,137,225 66.2%7.50% 4.00%7/1/2011 18,158,380 12,021,15520118,317,280 54.5%7.50% 4.00%7/1/2010 18,267,219 9,949,93920108,552,142 47.4%7.50% 4.00%7/1/2009 16,254,701 7,702,55920095,627,588 63.1%7.50% 4.00%7/1/2008 15,258,643 9,631,05520084,072,000 75.3%7.50% 4.00%7/1/2007 16,456,000 12,384,0002007
Summary of Employer Contributions
UAAL as aPercentage of ARCAnnual RequiredRecognizedFiscal Year Contributions (ARC) Made Percentage of ACP
Contribution Annual CoveredPayroll (ACP)
2012 $ 1,632,231 $ 1,269,887 78 $ 9,516,264 78% %2011 2,041,763 2,210,493 108 9,520,926 64% %2010 1,964,523 2,122,864 108 9,337,229 89% %2009 1,582,975 1,618,352 102 9,375,890 91% %2008 1,202,609 1,209,409 101 9,125,649 62% %2007 1,006,587 1,371,785 136 8,487,000 48% %
174

Public Retirement Systems Annual Report — Fiscal Year 2011-12Long Beach Public Transportation Company Salaried Employees' Retirement Plan — (Continued)
Contribution Rates as a Percentage of Covered Payroll
GeneralI II
SafetyI IIIII IV V VI IIIEmployer - Recommended by Actuary:
Normal CostUAAL AmortizationTotal Rates Recommended by Actuary
Total Rates Adopted by BoardPrior Year Rates
Employee Rates Adopted by Board:Age 25Age 35Age 45Single Rate
13.90
13.90
—
—
—
—
—
—
% % % %
%
%
% % %
%
% % % %
% % % %— — — —
— — — —
%
%—
—
13.90—
— —
— —
— — —
5.00
— — — —
— — — —
— —
— — — —
— —
— — — —
— —
— — — —
— —
— — — —
— —
— — — —
— —
— — — —
%%%%%
6/30/2011 22.19 — — — — — — — — 6/30/2010 23.11 — — — — — — — — 6/30/2009 17.26 — — — — — — — — 6/30/2008 13.43 — — — — — — — — 6/30/2007 12.30 — — — — — — — —
% % % % % % % % %
Retirement Benefit PoliciesGeneral
I IISafety
I IIIII IV V VI III
6410
Eligibility:AgeYears of ServiceAge
Age
Age
Years of Service
Years of Service
Years of Service
Years of Service Regardless of AgeAge Regardless of Service
5410
Final Average Salary:Position Last HeldHighest Year(s) AverageFinal Year(s) Average
3—
——
——
——
——
——
——
——
——
Compensation at Time of Retirement
OtherNoneMaximum Annual IncreaseIndex to Consumer Price IndexIndex to Active Member IncreaseGranted Position Last HeldCost of Living:
Percent Per Year of Service: Age50556065
— — — —
— — — —
— — — —
— — — —
— — — —
— — — —
— — — —
— — — —
— — — —
Social Security Coverage:
Normal retirement is credited years of service times 1.70% of average monthly final earnings (AMFE). Disability Retirement is normal retirement benefit based on credited years of service to disability date. Minimum disability pension is 17% of AMFE.
Benefit Comments:
Non-Service Disability - Per Year - Maximum
Service Disability - Per Year - Maximum
Disability Benefits as a Percentage of Final Average Salary (FAS):
— —
— —
— —
— —
— —
— —
— —
— —
— —
— —
— —
— —
— —
— —
— —
— —
— —
— —
Comments:Normal retirement is credited years of service times 1.70% of average monthly final earnings (AMFE). Disability Retirement is normal retirement benefit based on credited years of service to disability date. Minimum disability pension is 17% of AMFE.
During the fiscal year ended 2012, plan members contributed 5% of their annual salary toward the plan. The employer contributed the remainder of the actuarially determined rate.
Footnote:
(1) Includes $25,643 in transfers from the Contract plan for accrued benefits for contract employees who accepted salaried positions and became eligible for the Salaried plan.
175

Public Retirement Systems Annual Report — Fiscal Year 2011-12Los Angeles County Transportation Authority AFSCME Employees Retirement Income Plan
Single-Employer Plan
SurvivorsNon-ServiceServiceRetiredVested MembersNon-VestedVestedMembershipActive Inactive Service Disabled
Total Status
65 — 69 129 — — —General - Tier 1 263 Closed
65Totals — 69 129 — — — 263
Contributions
AssetsCash and Short-Term InvestmentsReceivables
InvestmentsOther
Investments, at Fair ValueU.S. Government ObligationsInternational BondsMunicipal BondsDomestic Corporate BondsDomestic Stocks
Total Assets
Mortgages
Accounts PayableInvestment Purchases PayableAccrued ExpensesOther Current Liabilities
Total Liabilities
International Stocks
Net Assets Available for Benefits
Liabilities
AdditionsContributions
Employer -
Employee -
Total Additions
InterestDividends
Net Appreciation (Depreciation)
Other Investment Revenues
DeductionsBenefit Payments
Service Retirement -
in Fair Value of Investments
Other -
Statement of Changes in Plan Net Assets
$ 51,348,577
Real EstateVenture CapitalOther
Investments
$ 2,743,519
$ 48,605,058
$ 606,827
$ 1,370,702
Disability -
Other -
Member Refunds -
Administration ExpensesOther Expenses
Total Deductions
Net Increase (Decrease) In Plan Assets
Beginning of the Year Net Assets Held
$ 3,214,037
$ )(1,843,335
as of June 30, 2012 for Period Ending June 30, 2012
$ 48,605,058
3,355,66024,695
710,9705,927,261
32,647,666272,019
5,461,079———
—2,133,926
208,474
$ 134,6812,608,838
——
467,792230,104
)(685,00616,520
Other Revenues —
222,351—
$ 50,448,393
Fixed Assets Net of Accumulated DepreciationOther Assets
——
(2)
(3)
in Trust for Pension Benefits
End of the Year Net Assets Heldin Trust for Pension Benefits
Investment Expenses
Adjustments —
Actuarial Cost Method:
Total UAAL Amortization Method: (1)
Total UAAL Amortization Period: 1515Years Remaining in Total UAAL Amortization Period:
GeneralSafetyCombined
CombinedSafetyGeneral
CombinedSafetyGeneral
$ 1,349,528——
—
—
——
159,875—
General
CombinedSafety
CombinedSafety
CombinedSafetyGeneral
CombinedSafetyGeneral
$ 2,991,686———————————
Projected Unit Credit
—
Year in Which the Total Unfunded Actuarial Liability is Expected to be Fully Amortized:
)(168,111
General
Level Dollar Amount
Statement of Plan Net Assets
Funded
Unfunded
Actuarial ValueActuarial
SalaryInterestValuationActuary: Towers Watson
Summary of Funding Position
of AssetsDate Rate Scale Liability Liability RatioAccrued
ActuarialAccruedFiscal
Year$ 12,250,302 78.1%7.00% 3.75% (4) 12/31/2011 $ 55,847,027 $ 43,596,7252012
7,575,462 85.6%7.50% 3.75%12/31/2010 52,654,235 45,078,77320116,021,690 88.1%7.50% 4.00%12/31/2009 50,674,985 44,653,29520108,408,473 82.7%7.50% 4.00%12/31/2008 48,528,863 40,120,39020095,118,322 89.0%8.00% 4.00%12/31/2007 46,481,860 41,363,53820084,787,772 89.3%8.00% 4.00%12/31/2006 44,914,394 40,126,6222007
Summary of Employer Contributions
UAAL as aPercentage of ARCAnnual RequiredRecognizedFiscal Year Contributions (ARC) Made Percentage of ACP
Contribution Annual CoveredPayroll (ACP)
2012 $ 1,349,528 $ 1,509,403 112 $ 5,212,553 235% %2011 1,253,444 1,469,412 117 5,560,682 136% %2010 1,580,804 1,829,816 116 6,161,426 98% %2009 1,178,688 1,400,852 119 6,950,682 121% %2008 1,120,547 1,348,505 120 7,095,283 72% %2007 1,525,454 1,590,553 104 7,642,912 63% %
176

Public Retirement Systems Annual Report — Fiscal Year 2011-12Los Angeles County Transportation Authority AFSCME Employees Retirement Income Plan — (Continued)
Contribution Rates as a Percentage of Covered Payroll
GeneralI II
SafetyI IIIII IV V VI IIIEmployer - Recommended by Actuary:
Normal CostUAAL AmortizationTotal Rates Recommended by Actuary
Total Rates Adopted by BoardPrior Year Rates
Employee Rates Adopted by Board:Age 25Age 35Age 45Single Rate
24.27
24.27
—
—
—
—
—
—
% % % %
%
%
% % %
% % % %
% % % %— — — —
— — — —
%
%—
—
9.9114.36
— —
— —
— — — —
— — — —
— — — —
— —
— — — —
— —
— — — —
— —
— — — —
— —
— — — —
— —
— — — —
— —
— — — —
%%%%%
6/30/2011 20.34 — — — — — — — — 6/30/2010 22.74 — — — — — — — — 6/30/2009 16.61 — — — — — — — — 6/30/2008 14.66 — — — — — — — — 6/30/2007 16.76 — — — — — — — —
% % % % % % % % %
Retirement Benefit PoliciesGeneral
I IISafety
I IIIII IV V VI III
505
Eligibility:AgeYears of ServiceAge
Age
Age
Years of Service
Years of Service
Years of Service
Years of Service Regardless of AgeAge Regardless of Service 50
30
Final Average Salary:Position Last HeldHighest Year(s) AverageFinal Year(s) Average
3—
——
——
——
——
——
——
——
——
Compensation at Time of Retirement
OtherYNone
Maximum Annual IncreaseIndex to Consumer Price IndexIndex to Active Member IncreaseGranted Position Last HeldCost of Living:
Percent Per Year of Service: Age50556065
— — —
1.67
— — — —
— — — —
— — — —
— — — —
— — — —
— — — —
— — — —
— — — —
SSocial Security Coverage:
Benefit is 1.67% of adjusted final compensation for each year of service if retirement occurs at age 63, but is reduced for retirement before age 63 and increased for retirement after age 63. Disability benefits are the same as normal retirement with 10 years of service and at age 50.
Benefit Comments:
Non-Service Disability - Per Year - Maximum
Service Disability - Per Year - Maximum
Disability Benefits as a Percentage of Final Average Salary (FAS):
2 %—
— —
— —
— —
— —
— —
— —
— —
— —
2 %—
— —
— —
— —
— —
— —
— —
— —
— —
Comments:A Deferred Retirement Option Program (DROP) was established effective January 19, 2005. This program allows participants to elect "retirement" without separation of employment. At retirement, the benefit accrual and employee contributions in this plan will cease. The monthly benefit, which must be taken as an annuity, will be deposited into an account that is part of the Trust Fund. This account will earn investment earnings, but there is no investment return guarantee. At separation of service (or death or disability, if earlier), the value of the DROP account will be paid. Additionally, the regular monthly benefit will commence. In the long term, DROP may change the percentage of retirees electing lump sum options and the timing of retirements.
Footnote:
(1) The amortization method for the Unfunded Actuarial Liability is Level Dollar Supplemental Cost method with an open period of 15 years.
(2) This amount represents the accrued value attributable to former members who transferred from other plans and have now retired and are receiving a benefit paid by this plan.
(3) Year-end audit adjustments of Other Income for Life Insurance deductions, return of benefit payments, and audit reclassification among plans.
(4) Salary increase rate is an age-based rate ranging from 3.5% to 3% for ages 40 years through 45 years and older, respectively. 177

Public Retirement Systems Annual Report — Fiscal Year 2011-12Los Angeles County Transportation Authority Maintenance Employees' Retirement System
Single-Employer Plan
SurvivorsNon-ServiceServiceRetiredVested MembersNon-VestedVestedMembershipActive Inactive Service Disabled
Total Status
1,064 937 48 838 — 86 —General - Tier 1 2,973 Open
1,064Totals 937 48 838 — 86 — 2,973
Contributions
AssetsCash and Short-Term InvestmentsReceivables
InvestmentsOther
Investments, at Fair ValueU.S. Government ObligationsInternational BondsMunicipal BondsDomestic Corporate BondsDomestic Stocks
Total Assets
Mortgages
Accounts PayableInvestment Purchases PayableAccrued ExpensesOther Current Liabilities
Total Liabilities
International Stocks
Net Assets Available for Benefits
Liabilities
AdditionsContributions
Employer -
Employee -
Total Additions
InterestDividends
Net Appreciation (Depreciation)
Other Investment Revenues
DeductionsBenefit Payments
Service Retirement -
in Fair Value of Investments
Other -
Statement of Changes in Plan Net Assets
$ 289,830,524
Real EstateVenture CapitalOther
Investments
$ 15,245,429
$ 274,585,095
$ 3,436,440
$ 20,234,254
Disability -
Other -
Member Refunds -
Administration ExpensesOther Expenses
Total Deductions
Net Increase (Decrease) In Plan Assets
Beginning of the Year Net Assets Held
$ 13,416,171
$ 6,818,083
as of June 30, 2012 for Period Ending June 30, 2012
$ 274,585,095
18,940,596139,386
4,012,98233,455,672
185,194,9501,535,377
30,824,368———
95,17112,085,206
110,376
$ 339,16914,774,811
—131,449
2,547,6801,260,279
)(3,483,909125,851
Other Revenues —
307,234—
$ 267,767,012
Fixed Assets Net of Accumulated DepreciationOther Assets
——
(2)
(3)
in Trust for Pension Benefits
End of the Year Net Assets Heldin Trust for Pension Benefits
Investment Expenses
Adjustments —
Actuarial Cost Method:
Total UAAL Amortization Method: (1)
Total UAAL Amortization Period: 1919Years Remaining in Total UAAL Amortization Period:
GeneralSafetyCombined
CombinedSafetyGeneral
CombinedSafetyGeneral
$ 16,721,579——
—
—
4,121,921—
)(131,449—
General
CombinedSafety
CombinedSafety
CombinedSafetyGeneral
CombinedSafetyGeneral
$ 12,082,527——
1,021,410—————
5,000——
Projected Unit Credit
—
Year in Which the Total Unfunded Actuarial Liability is Expected to be Fully Amortized:
)(927,698
General
Level Dollar Amount
Statement of Plan Net Assets
Funded
Unfunded
Actuarial ValueActuarial
SalaryInterestValuationActuary: Rael and Letson Consultants and Actuaries
Summary of Funding Position
of AssetsDate Rate Scale Liability Liability RatioAccrued
ActuarialAccruedFiscal
Year$ 115,728,372 66.0%7.50% 3.75% (4) 1/12/2012 $ 339,989,492 $ 224,261,1202012
105,186,880 67.5%7.50% 3.75%1/1/2011 323,365,893 218,179,013201183,847,499 71.6%8.00% 3.75%1/1/2010 295,021,182 211,173,6832010
100,287,499 63.5%8.00% 3.75%1/1/2009 275,020,761 174,733,262200976,337,248 70.4%8.00% 4.00%12/31/2007 257,641,903 181,304,655200885,890,434 66.6%8.00% 4.00%12/31/2006 257,511,084 171,620,6502007
Summary of Employer Contributions
UAAL as aPercentage of ARCAnnual RequiredRecognizedFiscal Year Contributions (ARC) Made Percentage of ACP
Contribution Annual CoveredPayroll (ACP)
2012 $ 16,721,579 $ 16,590,130 99 $ 111,163,713 104% %2011 17,069,677 16,775,309 98 107,310,499 98% %2010 16,751,689 16,654,859 99 109,213,913 77% %2009 13,638,122 14,381,288 105 115,504,121 87% %2008 14,541,370 14,506,037 100 100,642,895 76% %2007 14,291,765 14,267,070 100 99,116,894 87% %
178

Public Retirement Systems Annual Report — Fiscal Year 2011-12Los Angeles County Transportation Authority Maintenance Employees' Retirement System — (Continued)
Contribution Rates as a Percentage of Covered Payroll
GeneralI II
SafetyI IIIII IV V VI IIIEmployer - Recommended by Actuary:
Normal CostUAAL AmortizationTotal Rates Recommended by Actuary
Total Rates Adopted by BoardPrior Year Rates
Employee Rates Adopted by Board:Age 25Age 35Age 45Single Rate
14.81
14.81
—
—
—
—
—
—
% % % %
%
%
% % %
%
% % % %
% % % %— — — —
— — — —
%
%—
—
9.685.13
— —
— —
— — —
3.81
— — — —
— — — —
— —
— — — —
— —
— — — —
— —
— — — —
— —
— — — —
— —
— — — —
— —
— — — —
%%%%%
6/30/2011 15.48 — — — — — — — — 6/30/2010 15.45 — — — — — — — — 6/30/2009 14.00 — — — — — — — — 6/30/2008 14.67 — — — — — — — — 6/30/2007 14.61 — — — — — — — —
% % % % % % % % %
Retirement Benefit PoliciesGeneral
I IISafety
I IIIII IV V VI III
5510
Eligibility:AgeYears of ServiceAge
Age
Age
Years of Service
Years of Service
Years of Service
Years of Service Regardless of AgeAge Regardless of Service
23
Final Average Salary:Position Last HeldHighest Year(s) AverageFinal Year(s) Average
3—
——
——
——
——
——
——
——
——
Compensation at Time of Retirement
OtherYNone
Maximum Annual IncreaseIndex to Consumer Price IndexIndex to Active Member IncreaseGranted Position Last HeldCost of Living:
Percent Per Year of Service: Age50556065
— — —
1.67
— — — —
— — — —
— — — —
— — — —
— — — —
— — — —
— — — —
— — — —
SSocial Security Coverage:
Minimum pension is 1.67% of adjusted final compensation for each year of service if retirement at age 63. Actuarially reduced for retirement before age 63 and increased for retirement after age 63.
Benefit Comments:
Non-Service Disability - Per Year - Maximum
Service Disability - Per Year - Maximum
Disability Benefits as a Percentage of Final Average Salary (FAS):
— —
— —
— —
— —
— —
— —
— —
— —
— —
2 %—
— —
— —
— —
— —
— —
— —
— —
— —
Comments:Effective July 1, 2000, the Metropolitan Transportation Authority contributes funds up to 11% of payroll per year. Anything more than 11% is split between employer and employee.
A Deferred Retirement Option Program (DROP) was established effective December 4, 2003. This program allows participants to elect retirement without separation of employment. At retirement, the benefit accrual and employee contributions in this plan will cease. The monthly benefit, which must be taken as an annuity, will be deposited into an account that is part of the Trust Fund. This account will earn investment earnings, but there is no investment return guarantee. At separation of service (or death or disability, if earlier), the value of the DROP account will be paid. Additionally, the regular monthly benefit will commence. In the long term, DROP may change the percentage of retirees electing lump sum options and timing of retirements.
179

Public Retirement Systems Annual Report — Fiscal Year 2011-12Los Angeles County Transportation Authority Maintenance Employees' Retirement System — (Continued)
Footnote:
(1) Effective January 1, 2011, the amortization period was reset to a fixed and declining 20-year period for a period of five years with a 15-year rolling amortization period in effect thereafter.
(2) Transfer to the Los Angeles County Transportation Authority Non-Contract Employees' Retirement System. This amount represents the accrued value attributable to former members who transferred to the Non-Contract plan, have retired, and now receive a benefit paid by the Non-Contract Plan.
(3) Year-end audit adjustments of Other Income for Life Insurance deductions, return of benefit payments, and audit reclassification among plans.
(4) Salary increase rate is based on age-based rates ranging from 12.00% to 2.50% for ages 20 years through over 55, respectively.
180

Public Retirement Systems Annual Report — Fiscal Year 2011-12Los Angeles County Transportation Authority Non-Contract Employees' Retirement System
Single-Employer Plan
SurvivorsNon-ServiceServiceRetiredVested MembersNon-VestedVestedMembershipActive Inactive Service Disabled
Total Status
55 — 467 982 — 2 —General - Tier 1 1,506 Closed
55Totals — 467 982 — 2 — 1,506
Contributions
AssetsCash and Short-Term InvestmentsReceivables
InvestmentsOther
Investments, at Fair ValueU.S. Government ObligationsInternational BondsMunicipal BondsDomestic Corporate BondsDomestic Stocks
Total Assets
Mortgages
Accounts PayableInvestment Purchases PayableAccrued ExpensesOther Current Liabilities
Total Liabilities
International Stocks
Net Assets Available for Benefits
Liabilities
AdditionsContributions
Employer -
Employee -
Total Additions
InterestDividends
Net Appreciation (Depreciation)
Other Investment Revenues
DeductionsBenefit Payments
Service Retirement -
in Fair Value of Investments
Other -
Statement of Changes in Plan Net Assets
$ 111,285,151
Real EstateVenture CapitalOther
Investments
$ 5,830,309
$ 105,454,842
$ 1,308,904
$ 3,590,345
Disability -
Other -
Member Refunds -
Administration ExpensesOther Expenses
Total Deductions
Net Increase (Decrease) In Plan Assets
Beginning of the Year Net Assets Held
$ 8,704,975
$ )(5,114,630
as of June 30, 2012 for Period Ending June 30, 2012
$ 105,454,842
7,272,55053,519
1,540,85012,845,85070,258,364
589,53311,835,518
———
—4,602,825
977,238
$ 203,1105,627,199
——
1,012,516497,223
)(1,444,02753,248
Other Revenues —
254,813—
$ 110,569,472
Fixed Assets Net of Accumulated DepreciationOther Assets
——
(2)
(3)
in Trust for Pension Benefits
End of the Year Net Assets Heldin Trust for Pension Benefits
Investment Expenses
Adjustments —
Actuarial Cost Method:
Total UAAL Amortization Method: (1)
Total UAAL Amortization Period: 1515Years Remaining in Total UAAL Amortization Period:
GeneralSafetyCombined
CombinedSafetyGeneral
CombinedSafetyGeneral
$ 3,114,212——
—
—
113,998—
606,676—
General
CombinedSafety
CombinedSafety
CombinedSafetyGeneral
CombinedSafetyGeneral
$ 8,443,151——
7,011————————
Projected Unit Credit
—
Year in Which the Total Unfunded Actuarial Liability is Expected to be Fully Amortized:
)(363,501
General
Level Dollar Amount
Statement of Plan Net Assets
Funded
Unfunded
Actuarial ValueActuarial
SalaryInterestValuationActuary: Towers Watson
Summary of Funding Position
of AssetsDate Rate Scale Liability Liability RatioAccrued
ActuarialAccruedFiscal
Year$ 41,242,734 71.5%7.00% 3.75% (4) 12/31/2011 $ 144,895,317 $ 103,652,5832012
23,534,043 82.4%7.50% 3.75%12/31/2010 134,021,769 110,487,726201117,658,643 86.6%7.50% 4.00%12/31/2009 131,773,213 114,114,570201027,316,754 78.9%7.50% 4.00%12/31/2008 129,195,117 101,878,363200915,439,998 87.3%8.00% 4.00%12/31/2007 121,427,008 105,987,010200819,406,189 84.2%8.00% 4.00%12/31/2006 123,038,286 103,632,0972007
Summary of Employer Contributions
UAAL as aPercentage of ARCAnnual RequiredRecognizedFiscal Year Contributions (ARC) Made Percentage of ACP
Contribution Annual CoveredPayroll (ACP)
2012 $ 3,114,212 $ 3,720,888 119 $ 4,856,486 849% %2011 2,515,249 3,374,163 134 5,696,901 413% %2010 3,619,980 4,423,158 122 6,206,352 285% %2009 2,287,597 3,103,142 136 6,854,574 399% %2008 2,651,989 3,570,493 135 7,290,512 212% %2007 2,848,539 3,532,161 124 7,160,536 271% %
181

Public Retirement Systems Annual Report — Fiscal Year 2011-12Los Angeles County Transportation Authority Non-Contract Employees' Retirement System — (Continued)
Contribution Rates as a Percentage of Covered Payroll
GeneralI II
SafetyI IIIII IV V VI IIIEmployer - Recommended by Actuary:
Normal CostUAAL AmortizationTotal Rates Recommended by Actuary
Total Rates Adopted by BoardPrior Year Rates
Employee Rates Adopted by Board:Age 25Age 35Age 45Single Rate
54.67
54.67
—
—
—
—
—
—
% % % %
%
%
% % %
% % % %
% % % %— — — —
— — — —
%
%—
—
11.1343.54
— —
— —
— — — —
— — — —
— — — —
— —
— — — —
— —
— — — —
— —
— — — —
— —
— — — —
— —
— — — —
— —
— — — —
%%%%%
6/30/2011 40.53 — — — — — — — — 6/30/2010 52.81 — — — — — — — — 6/30/2009 31.38 — — — — — — — — 6/30/2008 37.04 — — — — — — — — 6/30/2007 36.16 — — — — — — — —
% % % % % % % % %
Retirement Benefit PoliciesGeneral
I IISafety
I IIIII IV V VI III
505
Eligibility:AgeYears of ServiceAge
Age
Age
Years of Service
Years of Service
Years of Service
Years of Service Regardless of AgeAge Regardless of Service 50
30
Final Average Salary:Position Last HeldHighest Year(s) AverageFinal Year(s) Average
3—
——
——
——
——
——
——
——
——
Compensation at Time of Retirement
OtherYNone
Maximum Annual IncreaseIndex to Consumer Price IndexIndex to Active Member IncreaseGranted Position Last HeldCost of Living:
Percent Per Year of Service: Age50556065
— — —
1.67
— — — —
— — — —
— — — —
— — — —
— — — —
— — — —
— — — —
— — — —
SSocial Security Coverage:
Minimum pension is 1.67% of adjusted final compensation for each year of service if retirement is at age 63, but is reduced for retirement before age 63 and increased after age 63. Disability benefit is the same with 10 years of service and at age 50.
Benefit Comments:
Non-Service Disability - Per Year - Maximum
Service Disability - Per Year - Maximum
Disability Benefits as a Percentage of Final Average Salary (FAS):
— —
— —
— —
— —
— —
— —
— —
— —
— —
— —
— —
— —
— —
— —
— —
— —
— —
— —
Comments:A Deferred Retirement Option Program (DROP) was established effective March 25, 2004. This program allows participants to elect retirement without separation of employment. At retirement, the benefit accrual and employee contributions in this plan will cease. The monthly benefit, which must be taken as an annuity, will be deposited into an account that is part of the Trust Fund. This account will earn investment earnings, but there is no investment return guarantee. At separation of service (or death or disability, if earlier), the value of the DROP account will be paid. Additionally, the regular monthly benefit will commence. In the long term, DROP may change the percentage of retirees electing lump sum options and timing of retirements.
Footnote:
(1) The amortization method for the unfunded actuarial liability is the Level Dollar Supplemental Cost method with an open period of 15 years.
(2) This amount represents the accrued value attributable to former union employees who transferred to the Non-Contract position and have retired and are being paid by the Non-Contract Plan.
(3) Year-end audit adjustments of Other Income for Life Insurance deductions, return of benefit payments, and audit reclassification among plans.
(4) Salary increase rate is an age-based rate ranging from 13.50% to 3.75% for ages 20 years through 45 years and older, respectively. 182

Public Retirement Systems Annual Report — Fiscal Year 2011-12Los Angeles County Transportation Authority Transportation Communication Union Employees' Retirement System
Single-Employer Plan
SurvivorsNon-ServiceServiceRetiredVested MembersNon-VestedVestedMembershipActive Inactive Service Disabled
Total Status
320 285 24 384 — 21 —General - Tier 1 1,034 Open
320Totals 285 24 384 — 21 — 1,034
Contributions
AssetsCash and Short-Term InvestmentsReceivables
InvestmentsOther
Investments, at Fair ValueU.S. Government ObligationsInternational BondsMunicipal BondsDomestic Corporate BondsDomestic Stocks
Total Assets
Mortgages
Accounts PayableInvestment Purchases PayableAccrued ExpensesOther Current Liabilities
Total Liabilities
International Stocks
Net Assets Available for Benefits
Liabilities
AdditionsContributions
Employer -
Employee -
Total Additions
InterestDividends
Net Appreciation (Depreciation)
Other Investment Revenues
DeductionsBenefit Payments
Service Retirement -
in Fair Value of Investments
Other -
Statement of Changes in Plan Net Assets
$ 81,873,151
Real EstateVenture CapitalOther
Investments
$ 4,459,274
$ 77,413,877
$ 970,238
$ 5,416,760
Disability -
Other -
Member Refunds -
Administration ExpensesOther Expenses
Total Deductions
Net Increase (Decrease) In Plan Assets
Beginning of the Year Net Assets Held
$ 4,395,740
$ 1,021,020
as of June 30, 2012 for Period Ending June 30, 2012
$ 77,413,877
5,350,45939,375
1,133,6129,450,769
52,273,449433,723
8,707,461———
36,8263,412,072
65,167
$ 164,4714,171,439
—123,364
724,388357,791
)(1,044,73527,589
Other Revenues —
241,550—
$ 76,392,857
Fixed Assets Net of Accumulated DepreciationOther Assets
——
(2)
(3)
in Trust for Pension Benefits
End of the Year Net Assets Heldin Trust for Pension Benefits
Investment Expenses
Adjustments —
Actuarial Cost Method:
Total UAAL Amortization Method: (1)
Total UAAL Amortization Period: 1515Years Remaining in Total UAAL Amortization Period:
GeneralSafetyCombined
CombinedSafetyGeneral
CombinedSafetyGeneral
$ 4,144,963——
—
—
1,592,740—
)(123,364—
General
CombinedSafety
CombinedSafety
CombinedSafetyGeneral
CombinedSafetyGeneral
$ 3,942,438——
207,126—————
4,626——
Projected Unit Credit
—
Year in Which the Total Unfunded Actuarial Liability is Expected to be Fully Amortized:
)(262,612
General
Level Dollar Amount
Statement of Plan Net Assets
Funded
Unfunded
Actuarial ValueActuarial
SalaryInterestValuationActuary: Towers Watson
Summary of Funding Position
of AssetsDate Rate Scale Liability Liability RatioAccrued
ActuarialAccruedFiscal
Year$ 37,480,127 64.4%7.00% 3.75% (4) 12/31/2011 $ 105,147,634 $ 67,667,5072012
28,897,639 69.4%7.50% 3.75%12/31/2010 94,415,211 65,517,572201128,161,103 68.7%7.50% 4.00%12/31/2009 90,026,769 61,865,666201033,095,744 61.6%7.50% 4.00%12/31/2008 86,147,611 53,051,867200919,839,259 72.8%8.00% 4.00%12/31/2007 72,981,395 53,142,136200818,876,316 72.7%8.00% 4.00%12/31/2006 69,215,411 50,339,0952007
Summary of Employer Contributions
UAAL as aPercentage of ARCAnnual RequiredRecognizedFiscal Year Contributions (ARC) Made Percentage of ACP
Contribution Annual CoveredPayroll (ACP)
2012 $ 4,144,962 $ 4,021,599 97 $ 26,974,883 139% %2011 4,040,221 3,602,459 89 26,409,852 109% %2010 4,638,549 4,422,535 95 27,578,375 102% %2009 2,479,998 2,286,123 92 27,056,815 122% %2008 2,446,064 2,349,686 96 26,734,876 74% %2007 2,952,001 2,926,703 99 26,783,854 70% %
183

Public Retirement Systems Annual Report — Fiscal Year 2011-12Los Angeles County Transportation Authority Transportation Communication Union Employees' Retirement System — (Continued)
Contribution Rates as a Percentage of Covered Payroll
GeneralI II
SafetyI IIIII IV V VI IIIEmployer - Recommended by Actuary:
Normal CostUAAL AmortizationTotal Rates Recommended by Actuary
Total Rates Adopted by BoardPrior Year Rates
Employee Rates Adopted by Board:Age 25Age 35Age 45Single Rate
15.69
15.69
—
—
—
—
—
—
% % % %
%
%
% % %
%
% % % %
% % % %— — — —
— — — —
%
%—
—
9.016.68
— —
— —
— — —
6.18
— — — —
— — — —
— —
— — — —
— —
— — — —
— —
— — — —
— —
— — — —
— —
— — — —
— —
— — — —
%%%%%
6/30/2011 14.65 — — — — — — — — 6/30/2010 17.14 — — — — — — — — 6/30/2009 9.28 — — — — — — — — 6/30/2008 9.13 — — — — — — — — 6/30/2007 11.06 — — — — — — — —
% % % % % % % % %
Retirement Benefit PoliciesGeneral
I IISafety
I IIIII IV V VI III
5510
Eligibility:AgeYears of ServiceAge
Age
Age
Years of Service
Years of Service
Years of Service
Years of Service Regardless of AgeAge Regardless of Service
23
Final Average Salary:Position Last HeldHighest Year(s) AverageFinal Year(s) Average
3—
——
——
——
——
——
——
——
——
Compensation at Time of Retirement
OtherYNone
Maximum Annual IncreaseIndex to Consumer Price IndexIndex to Active Member IncreaseGranted Position Last HeldCost of Living:
Percent Per Year of Service: Age50556065
— — —
1.67
— — — —
— — — —
— — — —
— — — —
— — — —
— — — —
— — — —
— — — —
SSocial Security Coverage:
Minimum pension is 1.67% of adjusted final compensation for each year of service if retirement at age 63. Actuarially reduced for retirement before age 63 and increased for retirement after age 63.
Benefit Comments:
Non-Service Disability - Per Year - Maximum
Service Disability - Per Year - Maximum
Disability Benefits as a Percentage of Final Average Salary (FAS):
— —
— —
— —
— —
— —
— —
— —
— —
— —
2 %—
— —
— —
— —
— —
— —
— —
— —
— —
Comments:A Deferred Retirement Option Program (DROP) was established effective October 28, 2004. This program allows participants to elect retirement without separation of employment. At retirement, the benefit accrual and employee contributions in this plan will cease. The monthly benefit, which must be taken as an annuity, will be deposited into an account that is part of the Trust Fund. This account will earn investment earnings, but there is no investment return guarantee. At separation of service (or death or disability, if earlier), the value of the DROP account will be paid. Additionally, the regular monthly benefit will commence. In the long term, DROP may change the percentage of retirees electing lump sum options and timing of retirements.
184

Public Retirement Systems Annual Report — Fiscal Year 2011-12Los Angeles County Transportation Authority Transportation Communication Union Employees' Retirement System — (Continued)
Footnote:
(1) The amortization method for the unfunded actuarial liability is the Level Dollar Supplemental Cost method with an open period of 15 years, except that, effective December 31, 2010, the 23 and out unfunded liability (or surplus) is amortized over a period of 20 years in 2011, with the period decreasing by one year every year until 2016, when it reaches a constant period of 15 years.
(2) Transfer to the Los Angeles County Transportation Authority Non-Contract Employees' Retirement System. This amount represents the accrued value attributable to former members who transferred to the Non-Contract plan, have retired, and are receiving a benefit paid by the Non-Contract Plan.
(3) Year-end audit adjustments of Other Income for Life Insurance deductions, return of benefit payments, and audit reclassification among plans.
(4) Salary increase rate is based on age-based rates ranging from 13.00 % to 3.00 % for ages 20 years through over 45, respectively.
185

Public Retirement Systems Annual Report — Fiscal Year 2011-12Los Angeles County Transportation Authority United Transportation Union Employees' Retirement System
Single-Employer Plan
SurvivorsNon-ServiceServiceRetiredVested MembersNon-VestedVestedMembershipActive Inactive Service Disabled
Total Status
1,702 1,912 133 1,692 — 321 —General - Tier 1 5,760 Open
1,702Totals 1,912 133 1,692 — 321 — 5,760
Contributions
AssetsCash and Short-Term InvestmentsReceivables
InvestmentsOther
Investments, at Fair ValueU.S. Government ObligationsInternational BondsMunicipal BondsDomestic Corporate BondsDomestic Stocks
Total Assets
Mortgages
Accounts PayableInvestment Purchases PayableAccrued ExpensesOther Current Liabilities
Total Liabilities
International Stocks
Net Assets Available for Benefits
Liabilities
AdditionsContributions
Employer -
Employee -
Total Additions
InterestDividends
Net Appreciation (Depreciation)
Other Investment Revenues
DeductionsBenefit Payments
Service Retirement -
in Fair Value of Investments
Other -
Statement of Changes in Plan Net Assets
$ 436,256,466
Real EstateVenture CapitalOther
Investments
$ 23,272,367
$ 412,984,099
$ 5,172,614
$ 32,053,846
Disability -
Other -
Member Refunds -
Administration ExpensesOther Expenses
Total Deductions
Net Increase (Decrease) In Plan Assets
Beginning of the Year Net Assets Held
$ 33,844,179
$ )(1,790,333
as of June 30, 2012 for Period Ending June 30, 2012
$ 412,984,099
28,509,618209,805
6,040,39050,357,889
278,746,5332,311,068
46,397,217———
321,02418,190,308
—
$ 522,00422,238,624
—511,739
3,904,8771,926,448
)(5,584,190145,433
Other Revenues —
438,936—
$ 414,774,432
Fixed Assets Net of Accumulated DepreciationOther Assets
——
(2)
(3)
in Trust for Pension Benefits
End of the Year Net Assets Heldin Trust for Pension Benefits
Investment Expenses
Adjustments —
Actuarial Cost Method:
Total UAAL Amortization Method: (1)
Total UAAL Amortization Period: 1515Years Remaining in Total UAAL Amortization Period:
GeneralSafetyCombined
CombinedSafetyGeneral
CombinedSafetyGeneral
$ 20,379,262——
—
—
13,206,943—
)(511,738—
General
CombinedSafety
CombinedSafety
CombinedSafetyGeneral
CombinedSafetyGeneral
$ 29,379,106——
3,389,049—————
637,088——
Projected Unit Credit
—
Year in Which the Total Unfunded Actuarial Liability is Expected to be Fully Amortized:
)(1,413,189
General
Level Dollar Amount
Statement of Plan Net Assets
Funded
Unfunded
Actuarial ValueActuarial
SalaryInterestValuationActuary: Towers Watson
Summary of Funding Position
of AssetsDate Rate Scale Liability Liability RatioAccrued
ActuarialAccruedFiscal
Year$ 200,184,263 65.9%7.00% 3.75% (4) 12/31/2011 $ 586,643,465 $ 386,459,2022012
154,904,858 71.0%7.50% 3.75%12/31/2010 534,041,534 379,136,6762011150,665,006 70.6%7.50% 4.00%12/31/2009 512,887,262 362,222,2562010181,801,641 62.8%7.50% 4.00%12/31/2008 488,326,609 306,524,9682009129,465,610 70.5%8.00% 4.00%12/31/2007 439,532,418 310,066,8082008127,365,832 69.8%8.00% 4.00%12/31/2006 421,909,773 294,543,9412007
Summary of Employer Contributions
UAAL as aPercentage of ARCAnnual RequiredRecognizedFiscal Year Contributions (ARC) Made Percentage of ACP
Contribution Annual CoveredPayroll (ACP)
2012 $ 20,379,261 $ 19,867,524 97 $ 181,993,114 110% %2011 20,310,744 19,991,199 98 181,850,105 85% %2010 23,230,062 22,490,716 97 190,212,313 79% %2009 14,715,788 13,896,976 94 192,718,732 94% %2008 14,495,568 13,766,511 95 188,647,527 69% %2007 16,092,241 15,489,101 96 186,563,526 68% %
186

Public Retirement Systems Annual Report — Fiscal Year 2011-12Los Angeles County Transportation Authority United Transportation Union Employees' Retirement System — (Continued)
Contribution Rates as a Percentage of Covered Payroll
GeneralI II
SafetyI IIIII IV V VI IIIEmployer - Recommended by Actuary:
Normal CostUAAL AmortizationTotal Rates Recommended by Actuary
Total Rates Adopted by BoardPrior Year Rates
Employee Rates Adopted by Board:Age 25Age 35Age 45Single Rate
11.21
11.21
—
—
—
—
—
—
% % % %
%
%
% % %
%
% % % %
% % % %— — — —
— — — —
%
%—
—
7.194.02
— —
— —
— — —
7.67
— — — —
— — — —
— —
— — — —
— —
— — — —
— —
— — — —
— —
— — — —
— —
— — — —
— —
— — — —
%%%%%
6/30/2011 10.68 — — — — — — — — 6/30/2010 12.05 — — — — — — — — 6/30/2009 7.80 — — — — — — — — 6/30/2008 7.77 — — — — — — — — 6/30/2007 9.20 — — — — — — — —
% % % % % % % % %
Retirement Benefit PoliciesGeneral
I IISafety
I IIIII IV V VI III
5510
Eligibility:AgeYears of ServiceAge
Age
Age
Years of Service
Years of Service
Years of Service
Years of Service Regardless of AgeAge Regardless of Service
655
23
Final Average Salary:Position Last HeldHighest Year(s) AverageFinal Year(s) Average
3—
——
——
——
——
——
——
——
——
Compensation at Time of Retirement
OtherYNone
Maximum Annual IncreaseIndex to Consumer Price IndexIndex to Active Member IncreaseGranted Position Last HeldCost of Living:
Percent Per Year of Service: Age50556065
— — —
1.67
— — — —
— — — —
— — — —
— — — —
— — — —
— — — —
— — — —
— — — —
SSocial Security Coverage:
Minimum pension is 1.67% of adjusted final compensation for each year of service if retirement is at age 63. Pension is reduced for retirement before age 63 and increased for retirement after age 63. Eligibility for disability is 10 years of service.
Benefit Comments:
Non-Service Disability - Per Year - Maximum
Service Disability - Per Year - Maximum
Disability Benefits as a Percentage of Final Average Salary (FAS):
— —
— —
— —
— —
— —
— —
— —
— —
— —
2 %—
— —
— —
— —
— —
— —
— —
— —
— —
Comments:A Deferred Retirement Option Program (DROP) was established effective January 22, 2004. This program allows participants to elect retirement without separation of employment. At retirement, the benefit accrual and employee contributions in this plan will cease. The monthly benefit, which must be taken as an annuity, will be deposited into an account that is part of the Trust Fund. This account will earn investment earnings, but there is no investment return guarantee. At separation of service (or death or disability, if earlier), the value of the DROP account will be paid. Additionally, the regular monthly benefit will commence. In the long term, DROP may change the percentage of retirees electing lump sum options and timing of retirements.
187

Public Retirement Systems Annual Report — Fiscal Year 2011-12Los Angeles County Transportation Authority United Transportation Union Employees' Retirement System — (Continued)
Footnote:
(1) The amortization method for the unfunded actuarial liability is the Level Dollar Supplemental Cost method with an open period of 15 years, except that, effective December 31, 2010, the 23 and out unfunded liability (or surplus) is amortized over a period of 20 years in 2011, with the period decreasing by one year every year until 2016, when it reaches a constant period of 15 years.
(2) Transfer to the Los Angeles County Transportation Authority Non-Contract Employees' Retirement System. This amount represents the accrued value attributable to former members who transferred to the Non-Contract plan, have retired, and are receiving a benefit paid by the Non-Contract Plan.
(3) Year-end audit adjustments of Other Income for Life Insurance deductions, return of benefit payments and audit reclassification among plans.
(4) Salary increase rate is an age-based rate ranging from 13.00% to 3.00% for ages 20 years through 45 years and older, respectively.
188

Public Retirement Systems Annual Report — Fiscal Year 2011-12Modesto Irrigation District Basic Retirement Plan
Single-Employer Plan
SurvivorsNon-ServiceServiceRetiredVested MembersNon-VestedVestedMembershipActive Inactive Service Disabled
Total Status
291 — 47 294 — — 36General - Tier 1 668 Open
36 82 — — — — —2 118 Open
327Totals 82 47 294 — — 36 786
Contributions
AssetsCash and Short-Term InvestmentsReceivables
InvestmentsOther
Investments, at Fair ValueU.S. Government ObligationsInternational BondsMunicipal BondsDomestic Corporate BondsDomestic Stocks
Total Assets
Mortgages
Accounts PayableInvestment Purchases PayableAccrued ExpensesOther Current Liabilities
Total Liabilities
International Stocks
Net Assets Available for Benefits
Liabilities
AdditionsContributions
Employer -
Employee -
Total Additions
InterestDividends
Net Appreciation (Depreciation)
Other Investment Revenues
DeductionsBenefit Payments
Service Retirement -
in Fair Value of Investments
Other -
Statement of Changes in Plan Net Assets
$ 158,361,122
Real EstateVenture CapitalOther
Investments
$ 710,161
$ 157,650,961
$ 3,493,848
$ 8,190,015
Disability -
Other -
Member Refunds -
Administration ExpensesOther Expenses
Total Deductions
Net Increase (Decrease) In Plan Assets
Beginning of the Year Net Assets Held
$ 10,127,404
$ )(1,937,389
as of December 31, 2011 for Period Ending December 31, 2011
$ 157,650,961
11,025,954——
25,529,41567,697,85620,484,767
—7,285,429
—22,299,492
—544,361
—
$ ——
710,161—
2,925,5401,033,242
)(5,840,350—
Other Revenues —
133,75430,000
$ 159,588,350
Fixed Assets Net of Accumulated DepreciationOther Assets
——
in Trust for Pension Benefits
End of the Year Net Assets Heldin Trust for Pension Benefits
Investment Expenses
Adjustments —
Actuarial Cost Method:
Total UAAL Amortization Method:
Total UAAL Amortization Period: 3030Years Remaining in Total UAAL Amortization Period:
GeneralSafetyCombined
CombinedSafetyGeneral
CombinedSafetyGeneral
$ 10,961,544——
—
—
——
——
General
CombinedSafety
CombinedSafety
CombinedSafetyGeneral
CombinedSafetyGeneral
$ 9,963,650———————————
Projected Unit Credit
—
Year in Which the Total Unfunded Actuarial Liability is Expected to be Fully Amortized:
)(889,961
General
Level Dollar Amount
Statement of Plan Net Assets
Funded
Unfunded
Actuarial ValueActuarial
SalaryInterestValuationActuary: Diversified Investment Advisors
Summary of Funding Position
of AssetsDate Rate Scale Liability Liability RatioAccrued
ActuarialAccruedFiscal
Year$ 67,230,002 71.2%7.75% 4.00%1/1/2012 $ 233,272,731 $ 166,042,7292012
66,040,660 69.3%7.75% 4.00%1/1/2011 215,073,516 149,032,856201160,026,631 70.5%7.75% 4.00%1/1/2010 203,314,785 143,288,154201048,780,734 74.6%7.75% 4.00%1/1/2009 192,168,888 143,388,154200931,239,775 82.5%7.75% 4.00%1/1/2008 178,276,456 147,036,681200829,069,086 82.2%7.75% 4.00%1/1/2007 163,697,550 134,628,4642007
Summary of Employer Contributions
UAAL as aPercentage of ARCAnnual RequiredRecognizedFiscal Year Contributions (ARC) Made Percentage of ACP
Contribution Annual CoveredPayroll (ACP)
2012 $ 10,918,743 $ 10,961,544 100 $ 30,530,024 220% %2011 10,440,020 10,481,995 100 31,406,581 210% %2010 9,602,325 9,680,005 101 31,171,112 193% %2009 8,009,420 7,380,000 92 32,130,514 152% %2008 7,490,461 7,950,000 106 32,298,530 97% %2007 8,266,750 8,266,750 100 28,622,267 102% %
189

Public Retirement Systems Annual Report — Fiscal Year 2011-12Modesto Irrigation District Basic Retirement Plan — (Continued)
Contribution Rates as a Percentage of Covered Payroll
GeneralI II
SafetyI IIIII IV V VI IIIEmployer - Recommended by Actuary:
Normal CostUAAL AmortizationTotal Rates Recommended by Actuary
Total Rates Adopted by BoardPrior Year Rates
Employee Rates Adopted by Board:Age 25Age 35Age 45Single Rate
43.32
43.32
14.64
14.64
—
—
—
—
% % % %
%
%
%
%
% %
% % % %
% % % %— — — —
— — — —
%
%—
—
20.5322.79
13.361.28
— —
— — — —
— — — —
— — — —
— —
— — — —
— —
— — — —
— —
— — — —
— —
— — — —
— —
— — — —
— —
— — — —
%%%%%
%%%%%
12/31/2010 39.77 13.84 — — — — — — — 12/31/2009 37.59 14.11 — — — — — — — 12/31/2008 33.41 11.69 — — — — — — — 12/31/2007 25.65 4.62 — — — — — — — 12/31/2006 27.28 8.79 — — — — — — —
% % % % % % % % %
Retirement Benefit PoliciesGeneral
I IISafety
I IIIII IV V VI III
555
Eligibility:AgeYears of ServiceAge
Age
Age
Years of Service
Years of Service
Years of Service
Years of Service Regardless of AgeAge Regardless of Service
605
60
555
605
0
Final Average Salary:Position Last HeldHighest Year(s) AverageFinal Year(s) Average
310
310
——
——
——
——
——
——
——
Compensation at Time of Retirement
OtherNone
4%Maximum Annual IncreaseYYIndex to Consumer Price Index
3%
Index to Active Member IncreaseGranted Position Last HeldCost of Living:
Percent Per Year of Service: Age50556065
— 2.002.752.75
— 2.002.752.75
— — — —
— — — —
— — — —
— — — —
— — — —
— — — —
— — — —
NSocial Security Coverage: N
Upon the Retirement Committee's determination that an employee is totally disabled, the employee will accrue service credit and compensation credit during the period of disability.
Benefit Comments:
Non-Service Disability - Per Year - Maximum
Service Disability - Per Year - Maximum
Disability Benefits as a Percentage of Final Average Salary (FAS):
— —
— —
— —
— —
— —
— —
— —
— —
— —
— —
— —
— —
— —
— —
— —
— —
— —
— —
Comments:In October 2005, the plan's retirement provisions were amended effective January 1, 2006, to provide enhanced pension benefits for eligible employees who terminate employment on or after December 1, 2005. As a result, two classification of benefit tiers have been created. General Tier I is used for plan participants who terminate district employment before December 1, 2005, regardless of the start date of pension benefits, known as Pre-2006 Eligible Employees. General Tier II is used for plan participants who terminate district employment after November 30, 2005, and start to receive pension benefits on or after January 1, 2006, known as Post - 2005 Eligible Employees.
190

Public Retirement Systems Annual Report — Fiscal Year 2011-12Palm Springs Aerial Tramway Restated Pension Plan
Single-Employer Plan
SurvivorsNon-ServiceServiceRetiredVested MembersNon-VestedVestedMembershipActive Inactive Service Disabled
Total Status
50 10 40 21 — — 2General - Tier 1 123 Open
50Totals 10 40 21 — — 2 123
Contributions
AssetsCash and Short-Term InvestmentsReceivables
InvestmentsOther
Investments, at Fair ValueU.S. Government ObligationsInternational BondsMunicipal BondsDomestic Corporate BondsDomestic Stocks
Total Assets
Mortgages
Accounts PayableInvestment Purchases PayableAccrued ExpensesOther Current Liabilities
Total Liabilities
International Stocks
Net Assets Available for Benefits
Liabilities
AdditionsContributions
Employer -
Employee -
Total Additions
InterestDividends
Net Appreciation (Depreciation)
Other Investment Revenues
DeductionsBenefit Payments
Service Retirement -
in Fair Value of Investments
Other -
Statement of Changes in Plan Net Assets
$ 4,073,520
Real EstateVenture CapitalOther
Investments
$ —
$ 4,073,520
$ 242,222
$ 575,382
Disability -
Other -
Member Refunds -
Administration ExpensesOther Expenses
Total Deductions
Net Increase (Decrease) In Plan Assets
Beginning of the Year Net Assets Held
$ 112,593
$ 462,789
as of June 30, 2012 for Period Ending June 30, 2012
$ 4,073,520
203,338——
315,7021,104,636
————
2,164,439
36,0007,183
—
$ ————
31,16972,144
40,069—
Other Revenues —
——
$ 3,610,731
Fixed Assets Net of Accumulated DepreciationOther Assets
——
in Trust for Pension Benefits
End of the Year Net Assets Heldin Trust for Pension Benefits
Investment Expenses
Adjustments —
Actuarial Cost Method:
Total UAAL Amortization Method:
Total UAAL Amortization Period: 1312Years Remaining in Total UAAL Amortization Period:
GeneralSafetyCombined
CombinedSafetyGeneral
CombinedSafetyGeneral
$ 432,000——
—
—
——
——
General
CombinedSafety
CombinedSafety
CombinedSafetyGeneral
CombinedSafetyGeneral
$ 112,593———————————
Uurojected Unit Credit
2024
Year in Which the Total Unfunded Actuarial Liability is Expected to be Fully Amortized:
—
General
Level Dollar Amount
Statement of Plan Net Assets
Funded
Unfunded
Actuarial ValueActuarial
SalaryInterestValuationActuary: Marilyn Jones
Summary of Funding Position
of AssetsDate Rate Scale Liability Liability RatioAccrued
ActuarialAccruedFiscal
Year$ 819,459 81.5%7.50% — %7/1/2011 $ 4,430,189 $ 3,610,7302012
1,028,525 73.2%7.50% — %7/1/2010 3,832,987 2,804,4622011
Summary of Employer Contributions
UAAL as aPercentage of ARCAnnual RequiredRecognizedFiscal Year Contributions (ARC) Made Percentage of ACP
Contribution Annual CoveredPayroll (ACP)
2012 $ 421,948 $ 432,000 102 $ 3,295,279 25% %2011 426,454 426,454 100 3,270,248 31% %
191

Public Retirement Systems Annual Report — Fiscal Year 2011-12Palm Springs Aerial Tramway Restated Pension Plan — (Continued)
Contribution Rates as a Percentage of Covered Payroll
GeneralI II
SafetyI IIIII IV V VI IIIEmployer - Recommended by Actuary:
Normal CostUAAL AmortizationTotal Rates Recommended by Actuary
Total Rates Adopted by BoardPrior Year Rates
Employee Rates Adopted by Board:Age 25Age 35Age 45Single Rate
12.80
13.11
—
—
—
—
—
—
% % % %
%
%
% % %
% % % %
% % % %— — — —
— — — —
%
%—
—
9.852.95
— —
— —
— — — —
— — — —
— — — —
— —
— — — —
— —
— — — —
— —
— — — —
— —
— — — —
— —
— — — —
— —
— — — —
%6/30/2011 13.04 — — — — — — — — — — — — — — — — — — — — — — — — — — — — — — — — — — — — — — — — — — — —
% % % % % % % % %
Retirement Benefit PoliciesGeneral
I IISafety
I IIIII IV V VI III
655
Eligibility:AgeYears of ServiceAge
Age
Age
Years of Service
Years of Service
Years of Service
Years of Service Regardless of AgeAge Regardless of Service
5510
Final Average Salary:Position Last HeldHighest Year(s) AverageFinal Year(s) Average
——
——
——
——
——
——
——
——
——
Compensation at Time of Retirement
OtherYNone
Maximum Annual IncreaseIndex to Consumer Price IndexIndex to Active Member IncreaseGranted Position Last HeldCost of Living:
Percent Per Year of Service: Age50556065
— — — —
— — — —
— — — —
— — — —
— — — —
— — — —
— — — —
— — — —
— — — —
SSocial Security Coverage:
Benefit is based on cents per hour of service. An employee who becomes totally and permanently disabled with at least 15 years of service will receive the accrued benefit as of the disability date.
Benefit Comments:
Non-Service Disability - Per Year - Maximum
Service Disability - Per Year - Maximum
Disability Benefits as a Percentage of Final Average Salary (FAS):
— —
— —
— —
— —
— —
— —
— —
— —
— —
— —
— —
— —
— —
— —
— —
— —
— —
— —
192
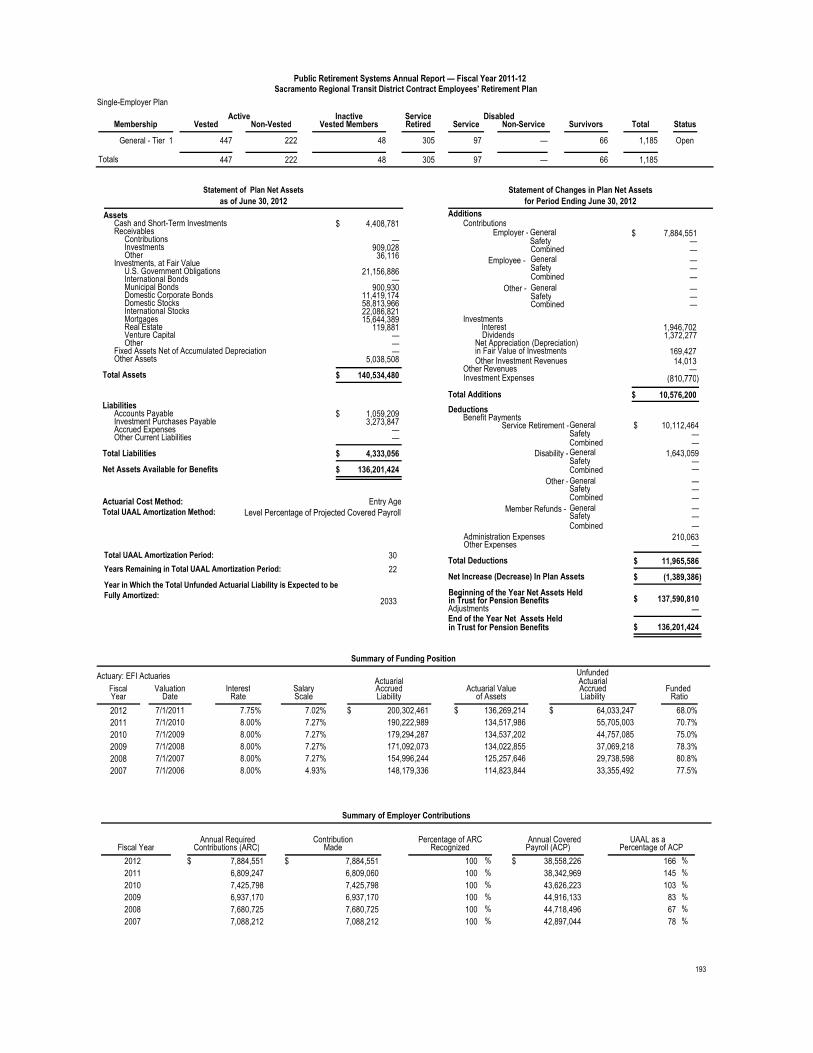
Public Retirement Systems Annual Report — Fiscal Year 2011-12Sacramento Regional Transit District Contract Employees' Retirement Plan
Single-Employer Plan
SurvivorsNon-ServiceServiceRetiredVested MembersNon-VestedVestedMembershipActive Inactive Service Disabled
Total Status
447 222 48 305 97 — 66General - Tier 1 1,185 Open
447Totals 222 48 305 97 — 66 1,185
Contributions
AssetsCash and Short-Term InvestmentsReceivables
InvestmentsOther
Investments, at Fair ValueU.S. Government ObligationsInternational BondsMunicipal BondsDomestic Corporate BondsDomestic Stocks
Total Assets
Mortgages
Accounts PayableInvestment Purchases PayableAccrued ExpensesOther Current Liabilities
Total Liabilities
International Stocks
Net Assets Available for Benefits
Liabilities
AdditionsContributions
Employer -
Employee -
Total Additions
InterestDividends
Net Appreciation (Depreciation)
Other Investment Revenues
DeductionsBenefit Payments
Service Retirement -
in Fair Value of Investments
Other -
Statement of Changes in Plan Net Assets
$ 140,534,480
Real EstateVenture CapitalOther
Investments
$ 4,333,056
$ 136,201,424
$ 4,408,781
$ 10,576,200
Disability -
Other -
Member Refunds -
Administration ExpensesOther Expenses
Total Deductions
Net Increase (Decrease) In Plan Assets
Beginning of the Year Net Assets Held
$ 11,965,586
$ )(1,389,386
as of June 30, 2012 for Period Ending June 30, 2012
$ 136,201,424
21,156,886—
900,93011,419,17458,813,96622,086,82115,644,389
119,881——
—909,028
36,116
$ 1,059,2093,273,847
——
1,946,7021,372,277
169,42714,013
Other Revenues —
210,063—
$ 137,590,810
Fixed Assets Net of Accumulated DepreciationOther Assets
—5,038,508
in Trust for Pension Benefits
End of the Year Net Assets Heldin Trust for Pension Benefits
Investment Expenses
Adjustments —
Actuarial Cost Method:
Total UAAL Amortization Method:
Total UAAL Amortization Period: 3022Years Remaining in Total UAAL Amortization Period:
GeneralSafetyCombined
CombinedSafetyGeneral
CombinedSafetyGeneral
$ 7,884,551——
—
—
——
——
General
CombinedSafety
CombinedSafety
CombinedSafetyGeneral
CombinedSafetyGeneral
$ 10,112,464——
1,643,059————————
Entry Age
2033
Year in Which the Total Unfunded Actuarial Liability is Expected to be Fully Amortized:
)(810,770
General
Level Percentage of Projected Covered Payroll
Statement of Plan Net Assets
Funded
Unfunded
Actuarial ValueActuarial
SalaryInterestValuationActuary: EFI Actuaries
Summary of Funding Position
of AssetsDate Rate Scale Liability Liability RatioAccrued
ActuarialAccruedFiscal
Year$ 64,033,247 68.0%7.75% 7.02%7/1/2011 $ 200,302,461 $ 136,269,2142012
55,705,003 70.7%8.00% 7.27%7/1/2010 190,222,989 134,517,986201144,757,085 75.0%8.00% 7.27%7/1/2009 179,294,287 134,537,202201037,069,218 78.3%8.00% 7.27%7/1/2008 171,092,073 134,022,855200929,738,598 80.8%8.00% 7.27%7/1/2007 154,996,244 125,257,646200833,355,492 77.5%8.00% 4.93%7/1/2006 148,179,336 114,823,8442007
Summary of Employer Contributions
UAAL as aPercentage of ARCAnnual RequiredRecognizedFiscal Year Contributions (ARC) Made Percentage of ACP
Contribution Annual CoveredPayroll (ACP)
2012 $ 7,884,551 $ 7,884,551 100 $ 38,558,226 166% %2011 6,809,247 6,809,060 100 38,342,969 145% %2010 7,425,798 7,425,798 100 43,626,223 103% %2009 6,937,170 6,937,170 100 44,916,133 83% %2008 7,680,725 7,680,725 100 44,718,496 67% %2007 7,088,212 7,088,212 100 42,897,044 78% %
193

Public Retirement Systems Annual Report — Fiscal Year 2011-12Sacramento Regional Transit District Contract Employees' Retirement Plan — (Continued)
Contribution Rates as a Percentage of Covered Payroll
GeneralI II
SafetyI IIIII IV V VI IIIEmployer - Recommended by Actuary:
Normal CostUAAL AmortizationTotal Rates Recommended by Actuary
Total Rates Adopted by BoardPrior Year Rates
Employee Rates Adopted by Board:Age 25Age 35Age 45Single Rate
22.63
22.63
—
—
—
—
—
—
% % % %
%
%
% % %
% % % %
% % % %— — — —
— — — —
%
%—
—
13.099.54
— —
— —
— — — —
— — — —
— — — —
— —
— — — —
— —
— — — —
— —
— — — —
— —
— — — —
— —
— — — —
— —
— — — —
%%%%%
6/30/2011 19.42 — — — — — — — — 6/30/2010 17.83 — — — — — — — — 6/30/2009 16.30 — — — — — — — — 6/30/2008 17.89 — — — — — — — — 6/30/2007 16.96 — — — — — — — —
% % % % % % % % %
Retirement Benefit PoliciesGeneral
I IISafety
I IIIII IV V VI III
5510
Eligibility:AgeYears of ServiceAge
Age
Age
Years of Service
Years of Service
Years of Service
Years of Service Regardless of AgeAge Regardless of Service
555
25
Final Average Salary:Position Last HeldHighest Year(s) AverageFinal Year(s) Average
4—
——
——
——
——
——
——
——
——
Compensation at Time of Retirement
OtherYNone
Maximum Annual IncreaseIndex to Consumer Price IndexIndex to Active Member IncreaseGranted Position Last HeldCost of Living:
Percent Per Year of Service: Age50556065
— 2.002.502.50
— — — —
— — — —
— — — —
— — — —
— — — —
— — — —
— — — —
— — — —
ISocial Security Coverage:
For ATU, the benefit payable to a disabled member is the normal retirement benefit (NRB) earned to the date of disability. For IBEW members, it is NRB, using the members' average final monthly earnings and service accrued through disability date.
Benefit Comments:
Non-Service Disability - Per Year - Maximum
Service Disability - Per Year - Maximum
Disability Benefits as a Percentage of Final Average Salary (FAS):
— —
— —
— —
— —
— —
— —
— —
— —
— —
2 %—
— —
— —
— —
— —
— —
— —
— —
— —
Comments:The district pays the entire cost of the plan.
No contributions are required by the plan members pursuant to each respective bargaining agreement; however, members can buy back service.
194

Public Retirement Systems Annual Report — Fiscal Year 2011-12Sacramento Regional Transit District Salaried Employees' Retirement Plan
Single-Employer Plan
SurvivorsNon-ServiceServiceRetiredVested MembersNon-VestedVestedMembershipActive Inactive Service Disabled
Total Status
168 73 55 189 7 — 16General - Tier 1 508 Open
168Totals 73 55 189 7 — 16 508
Contributions
AssetsCash and Short-Term InvestmentsReceivables
InvestmentsOther
Investments, at Fair ValueU.S. Government ObligationsInternational BondsMunicipal BondsDomestic Corporate BondsDomestic Stocks
Total Assets
Mortgages
Accounts PayableInvestment Purchases PayableAccrued ExpensesOther Current Liabilities
Total Liabilities
International Stocks
Net Assets Available for Benefits
Liabilities
AdditionsContributions
Employer -
Employee -
Total Additions
InterestDividends
Net Appreciation (Depreciation)
Other Investment Revenues
DeductionsBenefit Payments
Service Retirement -
in Fair Value of Investments
Other -
Statement of Changes in Plan Net Assets
$ 54,501,777
Real EstateVenture CapitalOther
Investments
$ 1,533,511
$ 52,968,266
$ 1,701,383
$ 5,601,380
Disability -
Other -
Member Refunds -
Administration ExpensesOther Expenses
Total Deductions
Net Increase (Decrease) In Plan Assets
Beginning of the Year Net Assets Held
$ 5,233,540
$ 367,840
as of June 30, 2012 for Period Ending June 30, 2012
$ 52,968,266
8,134,287—
346,3854,390,387
22,999,9848,550,3946,014,876
48,315——
—350,008
28,578
$ 274,7991,258,712
——
746,515530,508
81,0895,402
Other Revenues —
134,380—
$ 52,600,426
Fixed Assets Net of Accumulated DepreciationOther Assets
—1,937,180
in Trust for Pension Benefits
End of the Year Net Assets Heldin Trust for Pension Benefits
Investment Expenses
Adjustments —
Actuarial Cost Method:
Total UAAL Amortization Method:
Total UAAL Amortization Period: 3022Years Remaining in Total UAAL Amortization Period:
GeneralSafetyCombined
CombinedSafetyGeneral
CombinedSafetyGeneral
$ 4,579,907——
—
—
——
——
General
CombinedSafety
CombinedSafety
CombinedSafetyGeneral
CombinedSafetyGeneral
$ 4,911,319——
187,841————————
Entry Age
2033
Year in Which the Total Unfunded Actuarial Liability is Expected to be Fully Amortized:
)(342,041
General
Level Percentage of Projected Covered Payroll
Statement of Plan Net Assets
Funded
Unfunded
Actuarial ValueActuarial
SalaryInterestValuationActuary: EFI Actuaries
Summary of Funding Position
of AssetsDate Rate Scale Liability Liability RatioAccrued
ActuarialAccruedFiscal
Year$ 44,290,108 54.1%7.75% 5.29%7/1/2011 $ 96,435,226 $ 52,145,1182012
35,875,277 58.7%8.00% 5.54%7/1/2010 86,869,623 50,994,346201132,777,335 60.5%8.00% 5.54%7/1/2009 82,942,062 50,164,727201030,412,943 61.5%8.00% 5.54%7/1/2008 79,072,546 48,659,603200927,712,111 61.7%8.00% 5.54%7/1/2007 72,273,554 44,561,443200825,129,436 61.5%8.00% 4.86%7/1/2006 65,220,040 40,090,6042007
Summary of Employer Contributions
UAAL as aPercentage of ARCAnnual RequiredRecognizedFiscal Year Contributions (ARC) Made Percentage of ACP
Contribution Annual CoveredPayroll (ACP)
2012 $ 4,579,907 $ 4,579,907 100 $ 19,105,372 232% %2011 3,717,655 3,717,655 100 19,466,160 184% %2010 4,268,586 4,268,586 100 22,601,919 145% %2009 3,819,900 3,819,900 100 21,114,983 144% %2008 4,132,017 4,132,017 100 21,929,109 126% %2007 3,694,380 3,694,380 100 21,363,057 118% %
195

Public Retirement Systems Annual Report — Fiscal Year 2011-12Sacramento Regional Transit District Salaried Employees' Retirement Plan — (Continued)
Contribution Rates as a Percentage of Covered Payroll
GeneralI II
SafetyI IIIII IV V VI IIIEmployer - Recommended by Actuary:
Normal CostUAAL AmortizationTotal Rates Recommended by Actuary
Total Rates Adopted by BoardPrior Year Rates
Employee Rates Adopted by Board:Age 25Age 35Age 45Single Rate
23.19
23.19
—
—
—
—
—
—
% % % %
%
%
% % %
% % % %
% % % %— — — —
— — — —
%
%—
—
10.6712.52
— —
— —
— — — —
— — — —
— — — —
— —
— — — —
— —
— — — —
— —
— — — —
— —
— — — —
— —
— — — —
— —
— — — —
%%%%%
6/30/2011 20.30 — — — — — — — — 6/30/2010 19.95 — — — — — — — — 6/30/2009 17.97 — — — — — — — — 6/30/2008 18.31 — — — — — — — — 6/30/2007 17.16 — — — — — — — —
% % % % % % % % %
Retirement Benefit PoliciesGeneral
I IISafety
I IIIII IV V VI III
555
Eligibility:AgeYears of ServiceAge
Age
Age
Years of Service
Years of Service
Years of Service
Years of Service Regardless of AgeAge Regardless of Service
559
25
Final Average Salary:Position Last HeldHighest Year(s) AverageFinal Year(s) Average
4—
——
——
——
——
——
——
——
——
Compensation at Time of Retirement
OtherYNone
Maximum Annual IncreaseIndex to Consumer Price IndexIndex to Active Member IncreaseGranted Position Last HeldCost of Living:
Percent Per Year of Service: Age50556065
— 2.002.502.50
— — — —
— — — —
— — — —
— — — —
— — — —
— — — —
— — — —
— — — —
ISocial Security Coverage:
The disability benefit is equal to 2% of the participant's average final earnings multiplied by service accrued through the date of disability.Benefit Comments:
Non-Service Disability - Per Year - Maximum
Service Disability - Per Year - Maximum
Disability Benefits as a Percentage of Final Average Salary (FAS):
— —
— —
— —
— —
— —
— —
— —
— —
— —
2 %—
— —
— —
— —
— —
— —
— —
— —
— —
Comments:No contributions are required by plan members pursuant to each respective bargaining agreement.
196

Public Retirement Systems Annual Report — Fiscal Year 2011-12San Diego Transit Corporation Employees' Retirement Plan
Single-Employer Plan
SurvivorsNon-ServiceServiceRetiredVested MembersNon-VestedVestedMembershipActive Inactive Service Disabled
Total Status
563 208 242 621 110 — 105General - Tier 1 1,849 Open
563Totals 208 242 621 110 — 105 1,849
Contributions
AssetsCash and Short-Term InvestmentsReceivables
InvestmentsOther
Investments, at Fair ValueU.S. Government ObligationsInternational BondsMunicipal BondsDomestic Corporate BondsDomestic Stocks
Total Assets
Mortgages
Accounts PayableInvestment Purchases PayableAccrued ExpensesOther Current Liabilities
Total Liabilities
International Stocks
Net Assets Available for Benefits
Liabilities
AdditionsContributions
Employer -
Employee -
Total Additions
InterestDividends
Net Appreciation (Depreciation)
Other Investment Revenues
DeductionsBenefit Payments
Service Retirement -
in Fair Value of Investments
Other -
Statement of Changes in Plan Net Assets
$ 142,482,805
Real EstateVenture CapitalOther
Investments
$ 2,610,989
$ 139,871,816
$ 422,720
$ 5,129,691
Disability -
Other -
Member Refunds -
Administration ExpensesOther Expenses
Total Deductions
Net Increase (Decrease) In Plan Assets
Beginning of the Year Net Assets Held
$ 14,688,445
$ )(9,558,754
as of June 30, 2012 for Period Ending June 30, 2012
$ 139,871,816
6,028,559———
11,122,437——
6,497,929—
118,365,308
—45,852
—
$ 2,610,989———
1,381,5531,571,604
)(7,971,698146,439
Other Revenues —
687,518—
$ 149,430,570
Fixed Assets Net of Accumulated DepreciationOther Assets
——
in Trust for Pension Benefits
End of the Year Net Assets Heldin Trust for Pension Benefits
Investment Expenses
Adjustments —
Actuarial Cost Method:
Total UAAL Amortization Method: (1)
Total UAAL Amortization Period: 3030Years Remaining in Total UAAL Amortization Period:
GeneralSafetyCombined
CombinedSafetyGeneral
CombinedSafetyGeneral
$ 10,024,769——
—
—
107,369—
——
General
CombinedSafety
CombinedSafety
CombinedSafetyGeneral
CombinedSafetyGeneral
$ 13,073,070——
927,857————————
Entry Age
—
Year in Which the Total Unfunded Actuarial Liability is Expected to be Fully Amortized:
)(130,345
General
Level Dollar Amount
Statement of Plan Net Assets
Funded
Unfunded
Actuarial ValueActuarial
SalaryInterestValuationActuary: EFI Actuaries
Summary of Funding Position
of AssetsDate Rate Scale Liability Liability RatioAccrued
ActuarialAccruedFiscal
Year$ 85,761,617 63.8%7.50% 4.50% 7/1/2011 $ 236,874,642 $ 151,113,0252012
73,925,110 67.4%7.50% 4.50%7/1/2010 226,820,827 152,895,717201157,893,106 71.4%8.00% 5.00%7/1/2009 202,089,428 144,196,322201030,864,476 84.2%8.00% 5.00%7/1/2008 195,624,156 164,759,680200925,914,515 86.1%8.00% 5.00%7/1/2007 186,611,461 160,696,946200815,794,218 90.6%8.00% 5.00%1/1/2006 168,877,304 153,083,0862007
Summary of Employer Contributions
UAAL as aPercentage of ARCAnnual RequiredRecognizedFiscal Year Contributions (ARC) Made Percentage of ACP
Contribution Annual CoveredPayroll (ACP)
2012 $ 10,024,769 $ 10,024,769 100 $ 32,573,125 263% %2011 7,753,347 7,753,347 100 31,888,597 232% %2010 5,674,021 5,674,021 100 33,893,666 171% %2009 5,272,088 5,275,088 100 33,251,305 93% %2008 4,655,668 4,655,668 100 33,026,594 78% %2007 4,575,781 4,575,781 100 34,958,968 45% %
197

Public Retirement Systems Annual Report — Fiscal Year 2011-12San Diego Transit Corporation Employees' Retirement Plan — (Continued)
Contribution Rates as a Percentage of Covered Payroll
GeneralI II
SafetyI IIIII IV V VI IIIEmployer - Recommended by Actuary:
Normal CostUAAL AmortizationTotal Rates Recommended by Actuary
Total Rates Adopted by BoardPrior Year Rates
Employee Rates Adopted by Board:Age 25Age 35Age 45Single Rate
28.11
28.11
—
—
—
—
—
—
% % % %
%
%
% % %
% % % %
% % % %— — — —
— — — —
%
%—
—
7.8920.22
— —
— —
— — — —
— — — —
— — — —
— —
— — — —
— —
— — — —
— —
— — — —
— —
— — — —
— —
— — — —
— —
— — — —
%%%%%
6/30/2011 22.71 — — — — — — — — 6/30/2010 15.82 — — — — — — — — 6/30/2009 14.29 — — — — — — — — 6/30/2008 14.29 — — — — — — — — 6/30/2007 12.47 — — — — — — — —
% % % % % % % % %
Retirement Benefit PoliciesGeneral
I IISafety
I IIIII IV V VI III
555
Eligibility:AgeYears of ServiceAge
Age
Age
Years of Service
Years of Service
Years of Service
Years of Service Regardless of AgeAge Regardless of Service
655
Final Average Salary:Position Last HeldHighest Year(s) AverageFinal Year(s) Average
3—
——
——
——
——
——
——
——
——
Compensation at Time of Retirement
OtherNone
2%Maximum Annual IncreaseYIndex to Consumer Price Index
Index to Active Member IncreaseGranted Position Last HeldCost of Living:
Percent Per Year of Service: Age50556065
— 2.002.002.00
— — — —
— — — —
— — — —
— — — —
— — — —
— — — —
— — — —
— — — —
SSocial Security Coverage:
Maximum retirement benefit is 70% of final average salary.Benefit Comments:
Non-Service Disability - Per Year - Maximum
Service Disability - Per Year - Maximum
Disability Benefits as a Percentage of Final Average Salary (FAS):
2 %—
— —
— —
— —
— —
— —
— —
— —
— —
2 %—
— —
— —
— —
— —
— —
— —
— —
— —
Comments:In October 2004, the San Diego Metropolitan Transit System, the partner company of San Diego Transit Corporation (SDTC), authorized the issuance of pension obligation bonds (POB) to fund 85% of SDTC's unfunded actuarially accrued liability and the fiscal year 2005 normal cost reimbursements. As a result, POBs of $77,490,000 were sold and $76,282,336 was deposited into the pension plan in November 2004.
The funding policy is to make annual contributions to the plan in amounts necessary to fund current service costs and an annual amortization of past service costs.
The plan is funded entirely by SDTC, except for employees under the IBEW bargaining units who were hired prior to May 1, 2011. These employees are required to contribute 1% of their covered payroll from May 1, 2011, through Mar 31, 2012, increased to 2% from April 1, 2012, through March 31, 2013, and to 3% thereafter.
Footnote:
(1) A new unfunded actuarial accrued liability (UAAL) was created as of April 1, 2000, primarily as a result of improvements in the plan benefits. Therefore, all sources of the UAAL have been combined and are being amortized over a rolling 30-year period.
198

Public Retirement Systems Annual Report — Fiscal Year 2011-12San Joaquin Regional Transit District Contract Employees' Retirement Plan
Single-Employer Plan
SurvivorsNon-ServiceServiceRetiredVested MembersNon-VestedVestedMembershipActive Inactive Service Disabled
Total Status
149 25 36 75 17 — 15General - Tier 1 317 Open
149Totals 25 36 75 17 — 15 317
Contributions
AssetsCash and Short-Term InvestmentsReceivables
InvestmentsOther
Investments, at Fair ValueU.S. Government ObligationsInternational BondsMunicipal BondsDomestic Corporate BondsDomestic Stocks
Total Assets
Mortgages
Accounts PayableInvestment Purchases PayableAccrued ExpensesOther Current Liabilities
Total Liabilities
International Stocks
Net Assets Available for Benefits
Liabilities
AdditionsContributions
Employer -
Employee -
Total Additions
InterestDividends
Net Appreciation (Depreciation)
Other Investment Revenues
DeductionsBenefit Payments
Service Retirement -
in Fair Value of Investments
Other -
Statement of Changes in Plan Net Assets
$ 26,422,976
Real EstateVenture CapitalOther
Investments
$ —
$ 26,422,976
$ 573,027
$ 1,637,122
Disability -
Other -
Member Refunds -
Administration ExpensesOther Expenses
Total Deductions
Net Increase (Decrease) In Plan Assets
Beginning of the Year Net Assets Held
$ 2,669,860
$ )(1,032,738
as of June 30, 2012 for Period Ending June 30, 2012
$ 26,422,976
3,136,775——
4,056,1501,577,378
————
17,039,486
40,160——
$ ————
861,496—
)(1,395,925—
Other Revenues —
157,206—
$ 27,455,714
Fixed Assets Net of Accumulated DepreciationOther Assets
——
in Trust for Pension Benefits
End of the Year Net Assets Heldin Trust for Pension Benefits
Investment Expenses
Adjustments —
Actuarial Cost Method:
Total UAAL Amortization Method:
Total UAAL Amortization Period: 3029Years Remaining in Total UAAL Amortization Period:
GeneralSafetyCombined
CombinedSafetyGeneral
CombinedSafetyGeneral
$ 1,251,779——
—
—
977,085—
——
General
CombinedSafety
CombinedSafety
CombinedSafetyGeneral
CombinedSafetyGeneral
$ 1,877,737——
306,614—————
328,303——
Projected Unit Credit
2041
Year in Which the Total Unfunded Actuarial Liability is Expected to be Fully Amortized:
)(57,313
General
Level Dollar Amount
Statement of Plan Net Assets
Funded
Unfunded
Actuarial ValueActuarial
SalaryInterestValuationActuary: Bartel Associates, LLC
Summary of Funding Position
of AssetsDate Rate Scale Liability Liability RatioAccrued
ActuarialAccruedFiscal
Year$ 18,724,000 61.6%7.75% 4.00% 7/1/2012 $ 48,778,000 $ 30,054,0002012
15,780,784 64.5%7.75% 4.00%7/1/2011 44,471,411 28,690,62720113,465,322 88.7%7.75% 4.00%7/1/2010 30,786,433 27,321,1112010
722,664 97.2%7.75% 4.00%7/1/2009 26,126,338 25,403,6742009752,549 96.9%7.75% 4.00%7/1/2008 24,341,796 23,589,2472008809,542 96.2%8.25% 5.25%7/1/2007 21,547,992 20,738,4502007
Summary of Employer Contributions
UAAL as aPercentage of ARCAnnual RequiredRecognizedFiscal Year Contributions (ARC) Made Percentage of ACP
Contribution Annual CoveredPayroll (ACP)
2012 $ 1,429,263 $ 1,251,779 88 $ 9,674,000 194% %2011 1,458,622 1,242,681 85 10,852,165 145% %2010 1,643,144 1,463,888 89 15,341,581 23% %2009 1,612,376 1,407,384 87 17,443,434 4% %2008 1,635,225 1,351,090 83 18,479,023 4% %2007 1,308,141 1,224,990 94 15,463,187 5% %
199

Public Retirement Systems Annual Report — Fiscal Year 2011-12San Joaquin Regional Transit District Contract Employees' Retirement Plan — (Continued)
Contribution Rates as a Percentage of Covered Payroll
GeneralI II
SafetyI IIIII IV V VI IIIEmployer - Recommended by Actuary:
Normal CostUAAL AmortizationTotal Rates Recommended by Actuary
Total Rates Adopted by BoardPrior Year Rates
Employee Rates Adopted by Board:Age 25Age 35Age 45Single Rate
13.33
15.20
—
—
—
—
—
—
% % % %
%
%
% % %
%
% % % %
% % % %— — — —
— — — —
%
%—
—
13.33—
— —
— —
— — —
12.60
— — — —
— — — —
— —
— — — —
— —
— — — —
— —
— — — —
— —
— — — —
— —
— — — —
— —
— — — —
%%%%%
6/30/2011 12.20 — — — — — — — — 6/30/2010 9.09 — — — — — — — — 6/30/2009 8.17 — — — — — — — — 6/30/2008 6.99 — — — — — — — — 6/30/2007 8.69 — — — — — — — —
(1)
% % % % % % % % %
Retirement Benefit PoliciesGeneral
I IISafety
I IIIII IV V VI III
625
Eligibility:AgeYears of ServiceAge
Age
Age
Years of Service
Years of Service
Years of Service
Years of Service Regardless of AgeAge Regardless of Service
551055305525
Final Average Salary:Position Last HeldHighest Year(s) AverageFinal Year(s) Average
3—
——
——
——
——
——
——
——
——
Compensation at Time of Retirement
OtherNone
5%Maximum Annual IncreaseYIndex to Consumer Price Index
Index to Active Member IncreaseGranted Position Last HeldCost of Living:
Percent Per Year of Service: Age50556065
— — — —
— — — —
— — — —
— — — —
— — — —
— — — —
— — — —
— — — —
— — — —
ISocial Security Coverage:
Retirement benefit is 1.9% (for fiscal year 2001 retirees) and 2.0% (after fiscal year 2001) of monthly final compensation multiplied by years of service. Disability retirement benefit is 2% of final compensation multiplied by years of service.
Benefit Comments:
Non-Service Disability - Per Year - Maximum
Service Disability - Per Year - Maximum
Disability Benefits as a Percentage of Final Average Salary (FAS):
2 %—
— —
— —
— —
— —
— —
— —
— —
— —
2 %—
— —
— —
— —
— —
— —
— —
— —
— —
Comments:As of July 1, 2007, the San Joaquin Regional Transit District split its retirement plan into two plans, one for the members of the Amalgamated Transit Union, Local 276, and another for non-represented employees. However, the net assets held in trust for benefits, and the changes in net assets of both plans were not split, and are reported as a single combined plan. As of August 1, 2010, the San Joaquin Regional Transit District combined its retirement plans into one plan.
Other Post-Employment Health Benefits is included in the calculations for the unfunded actuarial accrued liability and funded ratio.Footnote:
(1) Members pay for half of normal cost and the employer picks up the remaining 50%.
200

Public Retirement Systems Annual Report — Fiscal Year 2011-12Santa Clara Valley Transportation Authority Amalgamated Transit Union Pension Plan
Single-Employer Plan
SurvivorsNon-ServiceServiceRetiredVested MembersNon-VestedVestedMembershipActive Inactive Service Disabled
Total Status
989 402 156 719 — 193 153General - Tier 1 2,612 Open
989Totals 402 156 719 — 193 153 2,612
Contributions
AssetsCash and Short-Term InvestmentsReceivables
InvestmentsOther
Investments, at Fair ValueU.S. Government ObligationsInternational BondsMunicipal BondsDomestic Corporate BondsDomestic Stocks
Total Assets
Mortgages
Accounts PayableInvestment Purchases PayableAccrued ExpensesOther Current Liabilities
Total Liabilities
International Stocks
Net Assets Available for Benefits
Liabilities
AdditionsContributions
Employer -
Employee -
Total Additions
InterestDividends
Net Appreciation (Depreciation)
Other Investment Revenues
DeductionsBenefit Payments
Service Retirement -
in Fair Value of Investments
Other -
Statement of Changes in Plan Net Assets
$ 377,099,006
Real EstateVenture CapitalOther
Investments
$ 374,871
$ 376,724,135
$ —
$ 24,841,036
Disability -
Other -
Member Refunds -
Administration ExpensesOther Expenses
Total Deductions
Net Increase (Decrease) In Plan Assets
Beginning of the Year Net Assets Held
$ 25,193,877
$ )(352,841
as of June 30, 2012 for Period Ending June 30, 2012
$ 376,724,135
67,332,843——
55,142,65491,710,951
————
161,731,312
——
1,181,246
$ 374,871———
13,668,9231,937,341
)(8,137,416—
Other Revenues —
237,885—
$ 377,076,976
Fixed Assets Net of Accumulated DepreciationOther Assets
——
in Trust for Pension Benefits
End of the Year Net Assets Heldin Trust for Pension Benefits
Investment Expenses
Adjustments —
Actuarial Cost Method:
Total UAAL Amortization Method:
Total UAAL Amortization Period: 2020Years Remaining in Total UAAL Amortization Period:
GeneralSafetyCombined
CombinedSafetyGeneral
CombinedSafetyGeneral
$ 19,148,113——
—
—
——
——
General
CombinedSafety
CombinedSafety
CombinedSafetyGeneral
CombinedSafetyGeneral
$ 22,162,609——
2,793,383————————
Entry Age
—
Year in Which the Total Unfunded Actuarial Liability is Expected to be Fully Amortized:
)(1,775,925
General
Level Dollar Amount
Statement of Plan Net Assets
Funded
Unfunded
Actuarial ValueActuarial
SalaryInterestValuationActuary: EFI Actuaries
Summary of Funding Position
of AssetsDate Rate Scale Liability Liability RatioAccrued
ActuarialAccruedFiscal
Year$ 144,030,010 72.2%8.00% 4.38%1/1/2012 $ 517,200,475 $ 373,170,4652012
118,636,425 75.6%8.00% 4.38%1/1/2011 486,770,538 368,134,1132011108,127,100 76.6%8.00% 5.28%1/1/2010 462,912,195 354,785,0952010117,583,095 73.4%8.00% 5.91%1/1/2009 442,830,578 325,247,4832009
79,217,661 81.3%8.00% 5.70%1/1/2008 423,739,213 344,521,552200883,037,469 79.1%8.00% 3.76%1/1/2007 397,853,860 314,816,3912007
Summary of Employer Contributions
UAAL as aPercentage of ARCAnnual RequiredRecognizedFiscal Year Contributions (ARC) Made Percentage of ACP
Contribution Annual CoveredPayroll (ACP)
2012 $ 19,148,113 $ 19,148,113 100 $ 100,376,441 143% %2011 17,807,109 17,807,109 100 97,569,124 122% %2010 17,905,290 17,905,290 100 102,625,557 105% %2009 15,868,435 14,842,509 94 100,877,989 117% %2008 16,137,390 16,137,390 100 98,722,453 80% %2007 15,584,539 14,859,393 95 93,985,560 88% %
201

Public Retirement Systems Annual Report — Fiscal Year 2011-12Santa Clara Valley Transportation Authority Amalgamated Transit Union Pension Plan — (Continued)
Contribution Rates as a Percentage of Covered Payroll
GeneralI II
SafetyI IIIII IV V VI IIIEmployer - Recommended by Actuary:
Normal CostUAAL AmortizationTotal Rates Recommended by Actuary
Total Rates Adopted by BoardPrior Year Rates
Employee Rates Adopted by Board:Age 25Age 35Age 45Single Rate
18.43
18.43
—
—
—
—
—
—
% % % %
%
%
% % %
% % % %
% % % %— — — —
— — — —
%
%—
—
8.4310.00
— —
— —
— — — —
— — — —
— — — —
— —
— — — —
— —
— — — —
— —
— — — —
— —
— — — —
— —
— — — —
— —
— — — —
%%%%%
6/30/2011 17.99 — — — — — — — — 6/30/2010 18.25 — — — — — — — — 6/30/2009 14.85 — — — — — — — — 6/30/2008 15.60 — — — — — — — — 6/30/2007 15.62 — — — — — — — —
% % % % % % % % %
Retirement Benefit PoliciesGeneral
I IISafety
I IIIII IV V VI III
5515
Eligibility:AgeYears of ServiceAge
Age
Age
Years of Service
Years of Service
Years of Service
Years of Service Regardless of AgeAge Regardless of Service
6510
70
Final Average Salary:Position Last HeldHighest Year(s) AverageFinal Year(s) Average
3—
——
——
——
——
——
——
——
——
Compensation at Time of Retirement
OtherNone
4%Maximum Annual IncreaseYIndex to Consumer Price Index
Index to Active Member IncreaseGranted Position Last HeldCost of Living:
Percent Per Year of Service: Age50556065
— 2.00— —
— — — —
— — — —
— — — —
— — — —
— — — —
— — — —
— — — —
— — — —
SSocial Security Coverage:
The standard service retirement is 55 years of age with 15 years of service at 2% per year.Benefit Comments:
Non-Service Disability - Per Year - Maximum
Service Disability - Per Year - Maximum
Disability Benefits as a Percentage of Final Average Salary (FAS):
— 50 %
— —
— —
— —
— —
— —
— —
— —
— —
— 50 %
— —
— —
— —
— —
— —
— —
— —
— —
202

Public Retirement Systems Annual Report — Fiscal Year 2011-12Sunline Transit Retirement Income Plan - Bargaining Unit Personnel
Single-Employer Plan
SurvivorsNon-ServiceServiceRetiredVested MembersNon-VestedVestedMembershipActive Inactive Service Disabled
Total Status
139 85 80 46 — 2 2General - Tier 1 354 Open
139Totals 85 80 46 — 2 2 354
Contributions
AssetsCash and Short-Term InvestmentsReceivables
InvestmentsOther
Investments, at Fair ValueU.S. Government ObligationsInternational BondsMunicipal BondsDomestic Corporate BondsDomestic Stocks
Total Assets
Mortgages
Accounts PayableInvestment Purchases PayableAccrued ExpensesOther Current Liabilities
Total Liabilities
International Stocks
Net Assets Available for Benefits
Liabilities
AdditionsContributions
Employer -
Employee -
Total Additions
InterestDividends
Net Appreciation (Depreciation)
Other Investment Revenues
DeductionsBenefit Payments
Service Retirement -
in Fair Value of Investments
Other -
Statement of Changes in Plan Net Assets
$ 13,642,075
Real EstateVenture CapitalOther
Investments
$ —
$ 13,642,075
$ 608,454
$ 978,272
Disability -
Other -
Member Refunds -
Administration ExpensesOther Expenses
Total Deductions
Net Increase (Decrease) In Plan Assets
Beginning of the Year Net Assets Held
$ 288,899
$ 689,373
as of December 31, 2011 for Period Ending December 31, 2011
$ 13,642,075
2,664,273——
2,143,2072,201,387
————
5,946,552
39,44538,757
—
$ ————
204,849165,493
)(348,358—
Other Revenues —
12,146—
$ 12,952,702
Fixed Assets Net of Accumulated DepreciationOther Assets
——
in Trust for Pension Benefits
End of the Year Net Assets Heldin Trust for Pension Benefits
Investment Expenses
Adjustments —
Actuarial Cost Method:
Total UAAL Amortization Method: (1)
Total UAAL Amortization Period: ——Years Remaining in Total UAAL Amortization Period:
GeneralSafetyCombined
CombinedSafetyGeneral
CombinedSafetyGeneral
$ 1,028,823——
—
—
——
——
General
CombinedSafety
CombinedSafety
CombinedSafetyGeneral
CombinedSafetyGeneral
$ 255,804——
20,949————————
Projected Unit Credit
—
Year in Which the Total Unfunded Actuarial Liability is Expected to be Fully Amortized:
)(72,535
General
No Amortization
Statement of Plan Net Assets
Funded
Unfunded
Actuarial ValueActuarial
SalaryInterestValuationActuary: The Epler Company
Summary of Funding Position
of AssetsDate Rate Scale Liability Liability RatioAccrued
ActuarialAccruedFiscal
Year$ 920,939 93.4%6.00% 3.00% 1/1/2011 $ 13,873,641 $ 12,952,7022012
1,461,000 88.2%6.00% 3.00%1/1/2010 12,411,367 10,950,36720112,665,315 76.3%6.00% 3.00%1/1/2009 11,246,729 8,581,4142010
865,776 91.4%6.00% 3.00%1/1/2008 10,033,619 9,167,8432009757,615 91.2%6.00% 3.00%1/1/2007 8,630,795 7,873,1802008
1,081,778 86.0%6.00% 3.00%1/1/2006 7,742,035 6,660,2572007
Summary of Employer Contributions
UAAL as aPercentage of ARCAnnual RequiredRecognizedFiscal Year Contributions (ARC) Made Percentage of ACP
Contribution Annual CoveredPayroll (ACP)
2012 $ 959,580 $ 1,028,823 107 $ 6,514,916 14% %2011 1,021,656 1,118,615 109 6,688,432 22% %2010 1,118,112 1,095,054 98 6,415,771 42% %2009 820,368 890,759 109 5,746,597 15% %2008 727,512 785,347 108 5,531,108 14% %2007 781,884 773,097 99 5,737,810 19% %
203

Public Retirement Systems Annual Report — Fiscal Year 2011-12Sunline Transit Retirement Income Plan - Bargaining Unit Personnel — (Continued)
Contribution Rates as a Percentage of Covered Payroll
GeneralI II
SafetyI IIIII IV V VI IIIEmployer - Recommended by Actuary:
Normal CostUAAL AmortizationTotal Rates Recommended by Actuary
Total Rates Adopted by BoardPrior Year Rates
Employee Rates Adopted by Board:Age 25Age 35Age 45Single Rate
14.73
15.79
—
—
—
—
—
—
% % % %
%
%
% % %
% % % %
% % % %— — — —
— — — —
%
%—
—
14.73—
— —
— —
— — — —
— — — —
— — — —
— —
— — — —
— —
— — — —
— —
— — — —
— —
— — — —
— —
— — — —
— —
— — — —
%%%%%
12/31/2010 16.72 — — — — — — — — 12/31/2009 17.07 — — — — — — — — 12/31/2008 15.50 — — — — — — — — 12/31/2007 14.20 — — — — — — — — 12/31/2006 13.47 — — — — — — — —
% % % % % % % % %
Retirement Benefit PoliciesGeneral
I IISafety
I IIIII IV V VI III
625
Eligibility:AgeYears of ServiceAge
Age
Age
Years of Service
Years of Service
Years of Service
Years of Service Regardless of AgeAge Regardless of Service
555
25
Final Average Salary:Position Last HeldHighest Year(s) AverageFinal Year(s) Average
3—
——
——
——
——
——
——
——
——
Compensation at Time of Retirement
OtherYNone
Maximum Annual IncreaseIndex to Consumer Price IndexIndex to Active Member IncreaseGranted Position Last HeldCost of Living:
Percent Per Year of Service: Age50556065
0.531.021.442.01
— — — —
— — — —
— — — —
— — — —
— — — —
— — — —
— — — —
— — — —
NSocial Security Coverage:
1/60th of final average month earnings (FAME), multiplied by years and completed quarters of credit service. Prior to July 1, 2007 the formula was 1/90th of FAME up to $400, plus 1/60th of excess of FAME over $400, the sum times credited service.
Benefit Comments:
Non-Service Disability - Per Year - Maximum
Service Disability - Per Year - Maximum
Disability Benefits as a Percentage of Final Average Salary (FAS):
2 %—
— —
— —
— —
— —
— —
— —
— —
— —
2 %—
— —
— —
— —
— —
— —
— —
— —
— —
Comments:Employee contributions are not required or permitted in the plan. The entire cost of the plan is met by the sponsoring employer, SunLine Transit Agency.
Effective July 1, 2007, the benefit is 1/60th of FAME multiplied by years and completed quarters of service.
An employee who becomes totally or permanently disabled after completing five years of service shall be entitled to receive an unreduced pension equal to 2% of final average monthly earnings times years of service.
Footnote:
(1) The Projected Unit Credit method was used to determine plan accrued liabilities. The Aggregate method is used to determine annual plan cost. The Aggregate method spreads the unfunded liabilities over the participants' expected future working lifetime as a level percent of pay.
204

Public Retirement Systems Annual Report — Fiscal Year 2011-12Sunline Transit Retirement Income Plan - Non-Bargaining Unit Personnel
Single-Employer Plan
SurvivorsNon-ServiceServiceRetiredVested MembersNon-VestedVestedMembershipActive Inactive Service Disabled
Total Status
54 29 63 32 — — —General - Tier 1 178 Open
54Totals 29 63 32 — — — 178
Contributions
AssetsCash and Short-Term InvestmentsReceivables
InvestmentsOther
Investments, at Fair ValueU.S. Government ObligationsInternational BondsMunicipal BondsDomestic Corporate BondsDomestic Stocks
Total Assets
Mortgages
Accounts PayableInvestment Purchases PayableAccrued ExpensesOther Current Liabilities
Total Liabilities
International Stocks
Net Assets Available for Benefits
Liabilities
AdditionsContributions
Employer -
Employee -
Total Additions
InterestDividends
Net Appreciation (Depreciation)
Other Investment Revenues
DeductionsBenefit Payments
Service Retirement -
in Fair Value of Investments
Other -
Statement of Changes in Plan Net Assets
$ 14,726,057
Real EstateVenture CapitalOther
Investments
$ —
$ 14,726,057
$ 643,370
$ 1,030,237
Disability -
Other -
Member Refunds -
Administration ExpensesOther Expenses
Total Deductions
Net Increase (Decrease) In Plan Assets
Beginning of the Year Net Assets Held
$ 477,974
$ 552,263
as of December 31, 2011 for Period Ending December 31, 2011
$ 14,726,057
2,994,857——
2,208,7832,376,183
————
6,419,151
42,97440,739
—
$ ————
225,604179,926
)(368,894—
Other Revenues —
12,660—
$ 14,173,794
Fixed Assets Net of Accumulated DepreciationOther Assets
——
in Trust for Pension Benefits
End of the Year Net Assets Heldin Trust for Pension Benefits
Investment Expenses
Adjustments —
Actuarial Cost Method:
Total UAAL Amortization Method: (1)
Total UAAL Amortization Period: ——Years Remaining in Total UAAL Amortization Period:
GeneralSafetyCombined
CombinedSafetyGeneral
CombinedSafetyGeneral
$ 965,644——
—
—
107,136—
——
General
CombinedSafety
CombinedSafety
CombinedSafetyGeneral
CombinedSafetyGeneral
$ 446,089————————
19,225——
Projected Unit Credit
—
Year in Which the Total Unfunded Actuarial Liability is Expected to be Fully Amortized:
)(79,179
General
No Amortization
Statement of Plan Net Assets
Funded
Unfunded
Actuarial ValueActuarial
SalaryInterestValuationActuary: The Epler Company
Summary of Funding Position
of AssetsDate Rate Scale Liability Liability RatioAccrued
ActuarialAccruedFiscal
Year$ 1,224,623 92.0%6.00% 4.00% 1/1/2011 $ 15,398,417 $ 14,173,7942012
2,182,957 84.8%6.00% 4.00%1/1/2010 14,380,040 12,197,08320113,538,257 73.4%6.00% 4.00%1/1/2009 13,287,540 9,749,28320101,274,471 89.3%6.00% 4.00%1/1/2008 11,882,834 10,608,36320091,827,845 83.4%6.00% 4.00%1/1/2007 11,022,943 9,195,09820082,511,609 75.7%6.00% 4.00%1/1/2006 10,320,181 7,808,5722007
Summary of Employer Contributions
UAAL as aPercentage of ARCAnnual RequiredRecognizedFiscal Year Contributions (ARC) Made Percentage of ACP
Contribution Annual CoveredPayroll (ACP)
2012 $ 1,013,700 $ 965,644 95 $ 3,512,416 35% %2011 1,162,812 1,086,531 93 3,725,878 59% %2010 1,265,400 1,100,040 87 3,525,248 100% %2009 951,600 954,198 100 3,429,409 37% %2008 935,508 976,009 104 3,007,499 61% %2007 1,032,552 1,103,686 107 3,176,434 79% %
205

Public Retirement Systems Annual Report — Fiscal Year 2011-12Sunline Transit Retirement Income Plan - Non-Bargaining Unit Personnel — (Continued)
Contribution Rates as a Percentage of Covered Payroll
GeneralI II
SafetyI IIIII IV V VI IIIEmployer - Recommended by Actuary:
Normal CostUAAL AmortizationTotal Rates Recommended by Actuary
Total Rates Adopted by BoardPrior Year Rates
Employee Rates Adopted by Board:Age 25Age 35Age 45Single Rate
28.86
27.49
—
—
—
—
—
—
% % % %
%
%
% % %
%
% % % %
% % % %— — — —
— — — —
%
%—
—
28.86—
— —
— —
— — —
3.00
— — — —
— — — —
— —
— — — —
— —
— — — —
— —
— — — —
— —
— — — —
— —
— — — —
— —
— — — —
%%%%%
12/31/2010 29.16 — — — — — — — — 12/31/2009 31.20 — — — — — — — — 12/31/2008 27.82 — — — — — — — — 12/31/2007 32.45 — — — — — — — — 12/31/2006 34.75 — — — — — — — —
% % % % % % % % %
Retirement Benefit PoliciesGeneral
I IISafety
I IIIII IV V VI III
555
Eligibility:AgeYears of ServiceAge
Age
Age
Years of Service
Years of Service
Years of Service
Years of Service Regardless of AgeAge Regardless of Service
625
25
Final Average Salary:Position Last HeldHighest Year(s) AverageFinal Year(s) Average
—3
——
——
——
——
——
——
——
——
Compensation at Time of Retirement
OtherNone
3%Maximum Annual IncreaseYIndex to Consumer Price Index
Index to Active Member IncreaseGranted Position Last HeldCost of Living:
Percent Per Year of Service: Age50556065
0.801.252.033.49
— — — —
— — — —
— — — —
— — — —
— — — —
— — — —
— — — —
— — — —
NSocial Security Coverage:
2.5% of Final Average Monthly Earnings (FAME) times years and completed months of credited service. The minimum monthly benefit is $400.Benefit Comments:
Non-Service Disability - Per Year - Maximum
Service Disability - Per Year - Maximum
Disability Benefits as a Percentage of Final Average Salary (FAS):
— —
— —
— —
— —
— —
— —
— —
— —
— —
— —
— —
— —
— —
— —
— —
— —
— —
— —
Comments:An employee who becomes totally and permanently disabled after completing five years of service shall be entitled to receive an immediate unreduced pension equal to 2.5% of FAME multiplied by years of credited services.
Footnote:
(1) The Projected Unit Credit method was used to determine plan accrued liabilities. The Aggregate method is used to determine annual plan cost. The Aggregate method spreads the unfunded liabilities over the participants' expected future working lifetime as a level percent of pay.
206

Public Retirement Systems Annual Report — Fiscal Year 2011-12Turlock Irrigation District Pension Plan
Single-Employer Plan
SurvivorsNon-ServiceServiceRetiredVested MembersNon-VestedVestedMembershipActive Inactive Service Disabled
Total Status
194 89 38 180 — — 27General - Tier 1 528 Open
111 38 36 104 — — 132 302 Open
— — 1 2 — — 33 6 Closed
305Totals 127 75 286 — — 43 836
Contributions
AssetsCash and Short-Term InvestmentsReceivables
InvestmentsOther
Investments, at Fair ValueU.S. Government ObligationsInternational BondsMunicipal BondsDomestic Corporate BondsDomestic Stocks
Total Assets
Mortgages
Accounts PayableInvestment Purchases PayableAccrued ExpensesOther Current Liabilities
Total Liabilities
International Stocks
Net Assets Available for Benefits
Liabilities
AdditionsContributions
Employer -
Employee -
Total Additions
InterestDividends
Net Appreciation (Depreciation)
Other Investment Revenues
DeductionsBenefit Payments
Service Retirement -
in Fair Value of Investments
Other -
Statement of Changes in Plan Net Assets
$ 131,422,142
Real EstateVenture CapitalOther
Investments
$ 330,152
$ 131,091,990
$ 10,489,485
$ 8,414,717
Disability -
Other -
Member Refunds -
Administration ExpensesOther Expenses
Total Deductions
Net Increase (Decrease) In Plan Assets
Beginning of the Year Net Assets Held
$ 10,600,157
$ )(2,185,440
as of December 31, 2011 for Period Ending December 31, 2011
$ 131,091,990
8,196,946——
16,056,55072,572,79217,077,298
———
6,797,547
—231,524
—
$ 165,152—
165,000—
1,284,3452,113,686
)(6,627,821—
Other Revenues —
182,313—
$ 133,277,430
Fixed Assets Net of Accumulated DepreciationOther Assets
——
in Trust for Pension Benefits
End of the Year Net Assets Heldin Trust for Pension Benefits
Investment Expenses
Adjustments —
Actuarial Cost Method:
Total UAAL Amortization Method:
Total UAAL Amortization Period: 3017Years Remaining in Total UAAL Amortization Period:
GeneralSafetyCombined
CombinedSafetyGeneral
CombinedSafetyGeneral
$ 11,346,014——
—
—
991,986—
——
General
CombinedSafety
CombinedSafety
CombinedSafetyGeneral
CombinedSafetyGeneral
$ 10,348,113————————
69,731——
Entry Age
2028
Year in Which the Total Unfunded Actuarial Liability is Expected to be Fully Amortized:
)(693,493
General
Level Percentage of Projected Covered Payroll
Statement of Plan Net Assets
Funded
Unfunded
Actuarial ValueActuarial
SalaryInterestValuationActuary: The Epler Company
Summary of Funding Position
of AssetsDate Rate Scale Liability Liability RatioAccrued
ActuarialAccruedFiscal
Year$ 76,763,676 62.7%8.50% 4.50%1/1/2011 $ 205,579,979 $ 128,816,3032012
63,448,473 66.5%8.50% 4.50%1/1/2010 189,518,048 126,069,575201161,429,742 63.7%8.50% 4.50%1/1/2009 169,397,314 107,967,572201026,252,345 83.0%8.50% 4.50%1/1/2008 154,247,702 127,995,357200926,603,964 81.4%8.50% 4.50%1/1/2007 142,708,321 116,104,357200830,456,732 77.0%8.50% 4.50%1/1/2006 132,592,574 102,135,8422007
Summary of Employer Contributions
UAAL as aPercentage of ARCAnnual RequiredRecognizedFiscal Year Contributions (ARC) Made Percentage of ACP
Contribution Annual CoveredPayroll (ACP)
2012 $ 12,396,978 $ 11,346,014 92 $ 33,960,180 226% %2011 10,702,663 9,113,755 85 33,878,065 187% %2010 10,566,311 9,686,338 92 32,704,664 188% %2009 6,288,561 5,789,741 92 30,327,028 87% %2008 5,977,415 6,042,328 101 27,728,066 96% %2007 6,029,696 6,404,232 106 25,507,585 119% %
207

Public Retirement Systems Annual Report — Fiscal Year 2011-12Turlock Irrigation District Pension Plan — (Continued)
Contribution Rates as a Percentage of Covered Payroll
GeneralI II
SafetyI IIIII IV V VI IIIEmployer - Recommended by Actuary:
Normal CostUAAL AmortizationTotal Rates Recommended by Actuary
Total Rates Adopted by BoardPrior Year Rates
Employee Rates Adopted by Board:Age 25Age 35Age 45Single Rate
33.09
33.08
34.09
34.08
—
—
—
—
% % % %
%
%
%
%
% %
% %
% % % %
% % % %— — — —
— — — —
%
%—
—
25.757.34
26.757.34
— —
— — —
3.25
— — —
2.25
— — — —
— —
— — — —
— —
— — — —
— —
— — — —
— —
— — — —
— —
— — — —
— —
— — — —
%%%%%
%%%%%
12/31/2010 26.51 27.51 — — — — — — — 12/31/2009 29.26 30.26 — — — — — — — 12/31/2008 18.76 19.76 — — — — — — — 12/31/2007 21.47 22.47 — — — — — — — 12/31/2006 24.70 25.70 — — — — — — —
% % % % % % % % %
Retirement Benefit PoliciesGeneral
I IISafety
I IIIII IV V VI III
555
Eligibility:AgeYears of ServiceAge
Age
Age
Years of Service
Years of Service
Years of Service
Years of Service Regardless of AgeAge Regardless of Service
605
55
555
605
55
555
605
55
Final Average Salary:Position Last HeldHighest Year(s) AverageFinal Year(s) Average
—2
—2
—2
——
——
——
——
——
——
Compensation at Time of Retirement
OtherNone
4%4%Maximum Annual IncreaseYYYIndex to Consumer Price Index
4%
Index to Active Member IncreaseGranted Position Last HeldCost of Living:
Percent Per Year of Service: Age50556065
— 2.502.502.60
— 2.502.502.60
— 2.502.502.60
— — — —
— — — —
— — — —
— — — —
— — — —
— — — —
S SSocial Security Coverage: S
In the event a participant becomes disabled, his/her benefits shall be calculated in accordance with either the retirement (whether Normal, Early, or Delayed) or the termination benefit provisions of the Plan.
Benefit Comments:
Non-Service Disability - Per Year - Maximum
Service Disability - Per Year - Maximum
Disability Benefits as a Percentage of Final Average Salary (FAS):
— —
— —
— —
— —
— —
— —
— —
— —
— —
— —
— —
— —
— —
— —
— —
— —
— —
— —
Comments:The actuarial cost method used is the Frozen Entry Age Actuarial Cost Method (Level Percent of Pay). The frozen actuarial accrued liability is determined using the Entry Age Normal Actuarial Cost Method, based on each participant's date of hire.
The amount of the monthly retirement benefit at the Normal Retirement Date shall be equal to the largest of: a) the product of 2.5% (2.3% for prior to January 1, 2009) of the participant's Final Average Monthly Earnings and years of service; b) the benefit that would have been payable under the prior plan in effect September 30, 1979; c) the benefit accrued to September 30, 1989, under the plan then in effect; or d) the benefit accrued to September 30, 1992, under the plan then in effect.
208

Public Retirement Systems Annual Report — Fiscal Year 2011-12West Contra Costa Healthcare District Successor Retirement Plan
Single-Employer Plan
SurvivorsNon-ServiceServiceRetiredVested MembersNon-VestedVestedMembershipActive Inactive Service Disabled
Total Status
14 — 104 125 — — —General - Tier 1 243 Closed
14Totals — 104 125 — — — 243
Contributions
AssetsCash and Short-Term InvestmentsReceivables
InvestmentsOther
Investments, at Fair ValueU.S. Government ObligationsInternational BondsMunicipal BondsDomestic Corporate BondsDomestic Stocks
Total Assets
Mortgages
Accounts PayableInvestment Purchases PayableAccrued ExpensesOther Current Liabilities
Total Liabilities
International Stocks
Net Assets Available for Benefits
Liabilities
AdditionsContributions
Employer -
Employee -
Total Additions
InterestDividends
Net Appreciation (Depreciation)
Other Investment Revenues
DeductionsBenefit Payments
Service Retirement -
in Fair Value of Investments
Other -
Statement of Changes in Plan Net Assets
$ 5,359,053
Real EstateVenture CapitalOther
Investments
$ 70,764
$ 5,288,289
$ —
$ )(152,141
Disability -
Other -
Member Refunds -
Administration ExpensesOther Expenses
Total Deductions
Net Increase (Decrease) In Plan Assets
Beginning of the Year Net Assets Held
$ 904,074
$ )(1,056,215
as of December 31, 2011 for Period Ending December 31, 2011
$ 5,288,289
——————————
—5,359,053
—
$ 70,764———
36—
)(152,177—
Other Revenues —
57,146—
$ 6,469,768
Fixed Assets Net of Accumulated DepreciationOther Assets
——
in Trust for Pension Benefits
End of the Year Net Assets Heldin Trust for Pension Benefits
Investment Expenses
Adjustments )(125,264
Actuarial Cost Method:
Total UAAL Amortization Method:
Total UAAL Amortization Period: 1515Years Remaining in Total UAAL Amortization Period:
GeneralSafetyCombined
CombinedSafetyGeneral
CombinedSafetyGeneral
$ ———
—
—
——
——
General
CombinedSafety
CombinedSafety
CombinedSafetyGeneral
CombinedSafetyGeneral
$ 846,928———————————
Projected Unit Credit
—
Year in Which the Total Unfunded Actuarial Liability is Expected to be Fully Amortized:
—
General
(1)
Interest Only
Statement of Plan Net Assets
Funded
Unfunded
Actuarial ValueActuarial
SalaryInterestValuationActuary: Towers & Watson
Summary of Funding Position
of AssetsDate Rate Scale Liability Liability RatioAccrued
ActuarialAccruedFiscal
Year$ 5,186,463 50.5%7.50% 2.00% 7/1/2012 $ 10,474,752 $ 5,288,2892012
3,988,498 61.9%8.00% 4.00%12/31/2010 10,458,266 6,469,76820114,100,043 61.8%8.00% 2.00%12/31/2009 10,725,685 6,625,6422010
782,743 92.6%8.00% 4.00%12/31/2008 10,645,843 9,863,1002009782,743 92.6%8.00% 4.00%12/31/2007 10,645,843 9,863,1002008
Summary of Employer Contributions
UAAL as aPercentage of ARCAnnual RequiredRecognizedFiscal Year Contributions (ARC) Made Percentage of ACP
Contribution Annual CoveredPayroll (ACP)
2012 $ 524,476 $ — — $ — — %2011 443,526 — — — — %2010 460,260 — — — — %2009 84,674 — — — — %2008 59,790 — — — — %
209

Public Retirement Systems Annual Report — Fiscal Year 2011-12West Contra Costa Healthcare District Successor Retirement Plan — (Continued)
Contribution Rates as a Percentage of Covered Payroll
GeneralI II
SafetyI IIIII IV V VI IIIEmployer - Recommended by Actuary:
Normal CostUAAL AmortizationTotal Rates Recommended by Actuary
Total Rates Adopted by BoardPrior Year Rates
Employee Rates Adopted by Board:Age 25Age 35Age 45Single Rate
—
—
—
—
—
—
—
—
% % % %
% % % %
% % % %
% % % %— — — —
— — — —
%
%—
—
— —
— —
— —
— — — —
— — — —
— — — —
— —
— — — —
— —
— — — —
— —
— — — —
— —
— — — —
— —
— — — —
— —
— — — —
12/31/2010 — — — — — — — — — 12/31/2009 — — — — — — — — — 12/31/2008 — — — — — — — — — 6/30/2008 — — — — — — — — —
12/31/2004 — — — — — — — — —
% % % % % % % % %
Retirement Benefit PoliciesGeneral
I IISafety
I IIIII IV V VI III
655
Eligibility:AgeYears of ServiceAge
Age
Age
Years of Service
Years of Service
Years of Service
Years of Service Regardless of AgeAge Regardless of Service
605
505
Final Average Salary:Position Last HeldHighest Year(s) AverageFinal Year(s) Average
——
——
——
——
——
——
——
——
——
Compensation at Time of Retirement
OtherNone
2%Maximum Annual IncreaseIndex to Consumer Price IndexIndex to Active Member IncreaseGranted Position Last HeldCost of Living:
Percent Per Year of Service: Age50556065
— — — —
— — — —
— — — —
— — — —
— — — —
— — — —
— — — —
— — — —
— — — —
Social Security Coverage:
Benefit Comments:
Non-Service Disability - Per Year - Maximum
Service Disability - Per Year - Maximum
Disability Benefits as a Percentage of Final Average Salary (FAS):
— —
— —
— —
— —
— —
— —
— —
— —
— —
— —
— —
— —
— —
— —
— —
— —
— —
— —
Comments:The West Contra Costa Healthcare District Successor Retirement Plan was established on March 9, 2000, as a successor plan to the West Contra Costa Healthcare District Employees' Retirement Plan, which was terminated on that date.
The participants of the predecessor plan were given the option of receiving immediate lump sum distributions of the present value of their benefits, rolling the benefits into an IRA or other plan, or participating in a successor plan.
The plan as been frozen effective January 1, 1994, and there will be no future employer contributions to the plan, unless contributions are required to fund benefits that have already been accrued.
Footnote:
(1) The agency changed fiscal year-end from December 31 to June 30.
210

DEFINED BENEFIT SYSTEMS
School District Systems

This Page Intentionally Left Blank

Public Retirement Systems Annual Report — Fiscal Year 2011-12Self-Insured Schools of California Defined Benefit Plan
Cost-Sharing Multiple-Employer Plan
SurvivorsNon-ServiceServiceRetiredVested MembersNon-VestedVestedMembershipActive Inactive Service Disabled
Total Status
83,797 — 1,960 43 — — —General - Tier 1 85,800 Open
83,797Totals — 1,960 43 — — — 85,800
Contributions
AssetsCash and Short-Term InvestmentsReceivables
InvestmentsOther
Investments, at Fair ValueU.S. Government ObligationsInternational BondsMunicipal BondsDomestic Corporate BondsDomestic Stocks
Total Assets
Mortgages
Accounts PayableInvestment Purchases PayableAccrued ExpensesOther Current Liabilities
Total Liabilities
International Stocks
Net Assets Available for Benefits
Statement of Plan Net Assets
LiabilitiesTotal Additions
InterestDividends
Net Appreciation (Depreciation)
Other Investment Revenues in Fair Value of Investments
Statement of Changes in Plan Net Assets
$ 28,146,247
Real EstateVenture CapitalOther
Investments
$ 13,083
$ 28,133,164
$ 587,943
$ 2,203,021
Administration ExpensesOther Expenses
Total Deductions
Net Increase (Decrease) In Plan AssetsBeginning of the Year Net Assets Held
$ 2,476,868
$ -273,847
as of December 31, 2011 for Period Ending December 31, 2011
$ 28,133,164
—————————
27,359,620
197,1731,511
—
$ 13,083———
7,068—
-751,853—
Other Revenues —
276,956—
28,407,011
Fixed Assets Net of Accumulated DepreciationOther Assets
——
in Trust for Pension Benefits
End of the Year Net Assets Heldin Trust for Pension Benefits
Investment Expenses
Adjustments —
Actuarial Cost Method:
Total UAAL Amortization Method:
Total UAAL Amortization Period: 7
7Years Remaining in Total UAAL Amortization Period:
AdditionsContributions
Employer -
Employee -
Other -
GeneralSafetyCombined
CombinedSafetyGeneral
CombinedSafetyGeneral
$ 2,947,806——
—
—
——
——
DeductionsBenefit Payments
Service Retirement -
Disability -
Other -
Member Refunds -
General
CombinedSafetyGeneralCombinedSafety
CombinedSafetyGeneral
CombinedSafetyGeneral
$ 68,771—————
2,131,141—————
Projected Unit Credit
—Year in Which the Total Unfunded Actuarial Liability is Expected to be Fully Amortized:
—
Level Percentage of Projected Covered Payroll
Funded
Unfunded
Actuarial ValueActuarial
SalaryInterestValuationActuary: Demsey, Filliger & Associates
Summary of Funding Position
of AssetsDate Rate Scale Liability Liability RatioAccrued
ActuarialAccruedFiscal
Year$ 4,689,990 85.1%7.00% 3.50%1/1/2012 $ 31,470,521 $ 26,780,5312012
2,565,705 91.3%7.00% 3.50%1/1/2011 29,630,744 27,065,03920114,067,007 85.2%7.00% 3.50%1/1/2010 27,471,186 23,404,17920104,421,266 82.8%7.00% 3.50%1/1/2009 25,635,206 21,213,9402009-490,566 102.1%7.00% 3.50%1/1/2008 23,327,557 23,818,1232008
1,643,110 92.2%7.00% 3.50%1/1/2007 21,027,522 19,384,4122007
Summary of Employer Contributions
UAAL as aPercentage of ARCAnnual RequiredRecognizedFiscal Year Contributions (ARC) Made Percentage of ACP
Contribution Annual CoveredPayroll (ACP)
2012 $ 2,760,067 $ 2,947,806 107 $ 72,225,013 6% %2011 3,044,472 3,173,462 104 72,253,495 4% %2010 3,244,345 3,228,020 99 73,811,168 6% %2009 3,037,840 2,713,614 89 77,946,090 6% %2008 2,639,671 3,037,840 115 78,593,233 )(1% %2007 2,488,086 2,891,207 116 74,588,422 2% %
213

Public Retirement Systems Annual Report — Fiscal Year 2011-12Self-Insured Schools of California Defined Benefit Plan — Continued
Contribution Rates as a Percentage of Covered Payroll
GeneralI II
SafetyI IIIII IV V VI IIIEmployer - Recommended by Actuary:
— — — — — — — — — Single Rate — — — — — — — — — Age 45
— —
— —
— —
— —
— —
— —
— —
— —
— —
Age 35Age 25Employee Rates Adopted by Board:
— — — — — — — — 3.9012/31/2006 %— — — — — — — — 3.9012/31/2007 %— — — — — — — — 3.5012/31/2008— — — — — — — — 4.4012/31/2009
%%
—
— %
— — — —
— — — — %%%% %%%
%
%
—
—
—
—
—
—
4.10
4.10
Total Rates Adopted by BoardTotal Rates Recommended by Actuary
— — — — — — — — 4.4012/31/2010 %Prior Year Rates
— —
— —
— —
— —
— —
— —
— —
— —
— 4.10 %%%%% %%%%
UAAL AmortizationNormal Cost
% % % % % % % % %
Retirement Benefit PoliciesGeneral
I IISafety
I IIIII IV V VI IIIEligibility:AgeYears of ServiceAge
Age
Age
Years of Service
Years of Service
Years of Service
Years of Service Regardless of AgeAge Regardless of Service 65
Final Average Salary:Position Last HeldHighest Year(s) AverageFinal Year(s) Average
3—
——
——
——
——
——
——
——
——
Compensation at Time of Retirement
OtherYNone
Maximum Annual IncreaseIndex to Consumer Price IndexIndex to Active Member IncreaseGranted Position Last HeldCost of Living:
Percent Per Year of Service: Age50556065
————
————
————
————
————
————
————
————
————
NSocial Security Coverage:
The benefit is 1.5% of Final Average Pay multiplied by Credited Service (maximum of 30 years). There are no disability benefits.Benefit Comments:
Non-Service Disability - Per Year - Maximum
Service Disability - Per Year - Maximum
Disability Benefits as a Percentage ofFinal Average Salary (FAS):
— —
— —
— —
— —
— —
— —
— —
— —
— —
— —
— —
— —
— —
— —
— —
— —
— —
— —
Comments:This retirement plan covers part-time, temporary, and seasonal employees who are not contributing to Social Security or not participating in an agency-sponsored retirement plan.
Employers are required to contribute, on behalf of their employees that are eligible, at an actuarially determined rate.
214

DEFINED BENEFIT SYSTEMS
Other Systems

This Page Intentionally Left Blank

Public Retirement Systems Annual Report — Fiscal Year 2011-12Public Agency Retirement System (PARS) Defined Benefit Plans
Agent Multiple-Employer Plan
SurvivorsNon-ServiceServiceRetiredVested MembersNon-VestedVestedMembershipActive Inactive Service Disabled
Total Status
— — — 2,731 — — —General - Tier 1 2,731 Closed
17 — 15 — — — —2 32 Open
2,186 — 627 — — — —3 2,813 Open
5,528 — 79 1,648 — — —4 7,255 Open
— — — 3 — — —5 3 Open
7,731Totals — 721 4,382 — — — 12,834 (1)
Contributions
AssetsCash and Short-Term InvestmentsReceivables
InvestmentsOther
Investments, at Fair ValueU.S. Government ObligationsInternational BondsMunicipal BondsDomestic Corporate BondsDomestic Stocks
Total Assets
Mortgages
Accounts PayableInvestment Purchases PayableAccrued ExpensesOther Current Liabilities
Total Liabilities
International Stocks
Net Assets Available for Benefits
LiabilitiesTotal Additions
InterestDividends
Net Appreciation (Depreciation)
Other Investment Revenues in Fair Value of Investments
Statement of Changes in Plan Net Assets
$ 257,039,842
Real EstateVenture CapitalOther
Investments
$ 21,088$ 257,018,754
$ 12,847,556
$ 49,365,353
Administration ExpensesOther Expenses
Total Deductions
Net Increase (Decrease) In Plan AssetsBeginning of the Year Net Assets Held
$ 34,332,306
$ 15,033,047
as of June 30, 2012 for Period Ending June 30, 2012
$ 257,018,754
6,879,353——
28,005,229—————
208,715,627
592,077——
$ ——
21,088—
5,597,090—
1,951,398—
Other Revenues 36,188
1,288,0381,596,905
$ 241,985,707
Fixed Assets Net of Accumulated DepreciationOther Assets
——
(2)
in Trust for Pension Benefits
End of the Year Net Assets Heldin Trust for Pension Benefits
Investment Expenses
Adjustments —
Actuarial Cost Method:
Total UAAL Amortization Method:
Total UAAL Amortization Period: —
—Years Remaining in Total UAAL Amortization Period:
AdditionsContributions
Employer -
Employee -
Other -
GeneralSafetyCombined
CombinedSafetyGeneral
CombinedSafetyGeneral
$ 36,939,676——
—
—
5,170,785—
——
DeductionsBenefit Payments
Service Retirement -
Disability -
Other -
Member Refunds -
General
CombinedSafetyGeneralCombinedSafety
CombinedSafetyGeneral
CombinedSafetyGeneral
$ 31,084,220————————
363,143——
Other
Entry Age
—Year in Which the Total Unfunded Actuarial Liability is Expected to be Fully Amortized:
)(329,784
Other
Statement of Plan Net Assets
Funded
Unfunded
Actuarial ValueActuarial
SalaryInterestValuationActuary: Milliman, Inc.
Summary of Funding Position
of AssetsDate Rate Scale Liability Liability RatioAccrued
ActuarialAccruedFiscal
Year$ 6,202,615 56.9%6.80% 3.25% 6/30/2012 $ 8,187,7142012 $ 14,390,329
2,011,146 79.8%6.92% 3.25%6/30/2010 7,921,1952011 9,932,3412,011,146 79.8%6.94% 3.25%6/30/2010 7,921,1952010 9,932,3412,631,550 81.3%6.94% 3.25%6/30/2008 11,404,3552009 14,035,9052,631,550 81.3%6.88% 3.25%6/30/2008 11,404,3552008 14,035,9053,645,055 80.5%6.69% 3.25%6/30/2006 15,011,3872007 18,656,442
217

Public Retirement Systems Annual Report — Fiscal Year 2011-12Public Agency Retirement System (PARS) Defined Benefit Plans — (Continued)
Summary of Employer Contributions
UAAL as aPercentage of ARCAnnual RequiredRecognizedFiscal Year Contributions (ARC) Made Percentage of ACP
Contribution Annual CoveredPayroll (ACP)
2012 $ 653,649 $ 36,939,676 5,651 $ 316,188,679 2% %2011 63,359 52,281,704 82,517 315,882,065 1% %2010 63,359 31,516,427 49,743 644,791,846 —% %2009 712,017 55,283,418 7,764 329,636,060 1% %2008 712,017 77,505,910 10,885 348,085,325 1% %2007 7,551,642 83,334,645 1,104 294,730,188 1% %
Contribution Rates as a Percentage of Covered Payroll
GeneralI II
SafetyI IIIII IV V VI IIIEmployer - Recommended by Actuary:
— — — — — — — — — %%%%% %%%%Normal Cost
— —
— —
— —
— —
— —
— —
— —
— —
— —
— — — — — — — — —
— — — — — — — — — UAAL Amortization
— — — — — — — — — Employee Rates Adopted by Board:
— — — — — — — — — 6/30/2007
Single Rate
— — — — — — — — — 6/30/2008
Age 45
— — — — — — — — — 6/30/2009
Age 35Age 25
— — — — — — — — — 6/30/2010— — — — — — — — — 6/30/2011Prior Year Rates
(3) — — — — — — — — — Total Rates Adopted by Board
— %— — — — %%%% %%%% — — — — Total Rates Recommended by Actuary
% % % % % % % % %
Retirement Benefit PoliciesGeneral
I IISafety
I IIIII IV V VI IIIEligibility:AgeYears of ServiceAge
Age
Age
Years of ServiceYears of Service
Years of Service
Years of Service Regardless of AgeAge Regardless of Service
Final Average Salary:Position Last HeldHighest Year(s) AverageFinal Year(s) Average
——
——
——
——
——
——
——
——
——
Compensation at Time of Retirement
OtherNoneMaximum Annual IncreaseIndex to Consumer Price IndexIndex to Active Member IncreaseGranted Position Last HeldCost of Living:
Percent Per Year of Service: Age50556065
— — — —
— — — —
— — — —
— — — —
— — — —
— — — —
— — — —
— — — —
— — — —
Social Security Coverage:
PARS represents several employers who offer multiple tiers and benefit packages. The plans can not be consolidated in order to present the various service and disability benefits.
Benefit Comments:
Non-Service Disability - Per Year - Maximum
Service Disability - Per Year - Maximum
Disability Benefits as a Percentage ofFinal Average Salary (FAS):
— —
— —
— —
— —
— —
— —
— —
— —
— —
— —
— —
— —
— —
— —
— —
— —
— —
— —
218

Public Retirement Systems Annual Report — Fiscal Year 2011-12Public Agency Retirement System (PARS) Defined Benefit Plans — (Continued)
Comments:For a majority of the PARS plans, members who are eligible for a distribution through termination, retirement, or disability have two options for receiving their benefits: a) lump sum distribution or b) rollover to another retirement plan. Both options result in these members no longer having balances with PARS and no longer being members of the plan. As a result, they are not classified as Service Retired, Service Disability, Ordinary Disability, or Survivor members of the PARS retirement plan. PARS does not actively pay any periodic payments. Instead, annuities will be purchased from an outside company for any periodic payments that is to be made.
The Trust purchases allocated annuity contracts from various life insurance companies for certain retiring employees of participating retirement plans. Allocated annuity contracts are contracts under which the companies have a legal obligation to make all benefit payments for which they have received premiums or consideration requested. Accordingly, funds in the allocated contracts have been excluded from the net assets of the Trust. For the year ended June 30, 2012, at the direction of certain participating plan administrators, the Trust purchased $6,304,849 of annuity contracts to pay benefits to named employees or their beneficiaries.
Membership and contribution rate tier levels may not be consistent from year to year. PARS tier levels are as follows: General Tier I = PARS Supplemental Retirement Plan/Separation Incentive Plan, General Tier II = PARS City of Long Beach Contract Consultants, General Tier III = PARS City of Long Beach Part-Time Seasonal Temporary Plan, General Tier IV = PARS Retirement Enhancement Plan DB, General Tier V = PARS Accumulative Leave Program.
The contribution made is significantly higher than the Annual Required Contribution (ARC) because the actuarial only values self-funded plans. The plans that were annuitized are not included in the actuarial valuation, as all of the liabilities are passed along to the insurance company.
Footnote:
(1) The PARS Defined Benefit Plan is an agent multiple-employer plan. As of June 30, 2012, there were 294 employer members, including 13 counties, 107 cities, 149 school districts, and 25 other employers participating in PARS. Because of the characteristics of a multiple-employer plan, each employer agency of PARS had various numbers of membership tiers of its own and the status of these tiers was not the same as of June 30, 2012. Some tiers were open and some tiers were closed.
(2) Transfers-out consists of funds for plans that were transferred to successor trustees and administrators during the year.
(3) As the PARS Defined Benefit Plan is an agent multiple-employer plan, employer contribution rates vary within the year.
219

This Page Intentionally Left Blank

DEFINED CONTRIBUTION SYSTEMS
State Systems

This Page Intentionally Left Blank

Public Retirement Systems Annual Report — Fiscal Year 2011-12State Peace Officers and Firefighters' Defined Contribution Plan
Contributions
AssetsCash and Short-Term InvestmentsReceivables
InvestmentsOther
Investments, at Fair ValueU.S. Government ObligationsInternational BondsMunicipal BondsDomestic Corporate BondsDomestic Stocks
Total Assets
Mortgages
Accounts PayableInvestment Purchases PayableAccrued ExpensesOther Current Liabilities
Total Liabilities
International Stocks
Net Assets Available for Benefits
Statement of Plan Net Assets
LiabilitiesTotal Additions
InterestDividendsNet Appreciation (Depreciation)Other Investment RevenuesIn Fair Value of Investments
Statement of Changes in Plan Net Assets
$ 476,796,000
Real EstateVenture CapitalOther
Investments
$ 3,016,000$ 473,780,000
$ 17,900,000
Administration ExpensesOther Expenses
Total DeductionsNet Increase (Decrease) In Plan AssetsBeginning of the Year Net Assets Held
$ 26,229,000$ )(26,093,000
as of June 30, 2012 for Period Ending June 30, 2012
Membership 37,833
41,243,000——
126,620,000197,897,00077,039,000
—14,226,000
—1,861,000
3,0007,000
—
$ 782,0001,000
—2,233,000
3,000—
735,000330,000
Other Revenue
1,589,000—
$ 499,873,000
Fixed Assets Net of Accumulated DepreciationOther Assets
——
in Trust for Pension Benefits
in Trust for Pension Benefits
End of the Year Net Assets Held—Adjustments
AdditionsContributions
Employer -
Employee -
Other -
GeneralSafetyCombined
CombinedSafetyGeneral
CombinedSafetyGeneral
$ —92,000
—
—
—
—69,000
——
DeductionsBenefit Payments
Service Retirement -
$ 136,000
Disability -
Other -
Member Refunds -
General
CombinedSafetyGeneralCombinedSafety
CombinedSafetyGeneral
CombinedSafetyGeneral
$ —24,640,000
——————————
—Investment Expenses )(1,093,000
$ 473,780,000
Comments:Contributions to the plan are funded entirely by the employer. Contribution requirements are established and may be amended through a memorandum of understanding (MOU) from the State of California Department of Personnel Administration.
Effective April 2011, the State suspended contributions on behalf of rank and file positions; and effective May 2011, the State suspended contribution on behalf of supervisors, management, and exempt positions. As of June 30, 2012, the duration of the suspension is unknown because the program is being administered according to the most recent MOU.
223

Public Retirement Systems Annual Report — Fiscal Year 2011-12University of California Defined Contribution Plan and 403(B) Plan
Contributions
AssetsCash and Short-Term InvestmentsReceivables
InvestmentsOther
Investments, at Fair ValueU.S. Government ObligationsInternational BondsMunicipal BondsDomestic Corporate BondsDomestic Stocks
Total Assets
Mortgages
Accounts PayableInvestment Purchases PayableAccrued ExpensesOther Current Liabilities
Total Liabilities
International Stocks
Net Assets Available for Benefits
Statement of Plan Net Assets
LiabilitiesTotal Additions
InterestDividendsNet Appreciation (Depreciation)Other Investment RevenuesIn Fair Value of Investments
Statement of Changes in Plan Net Assets
$ 19,272,518,627
Real EstateVenture CapitalOther
Investments
$ 2,675,687,127$ 16,596,831,500
$ 730,894,633
Administration ExpensesOther Expenses
Total DeductionsNet Increase (Decrease) In Plan AssetsBeginning of the Year Net Assets Held
$ 854,941,863$ 321,216,419
as of June 30, 2012 for Period Ending June 30, 2012
Membership 203,834
2,711,407,000——
3,734,148,0003,327,440,000
988,876,000———
7,486,950,367
69,55730,069,070
262,664,000
$ —548,843,173
—2,126,843,954
—375,792,767
)(192,647,00018,794,000
Other Revenue
7,224,6381,342,307
$ 16,275,615,081
Fixed Assets Net of Accumulated DepreciationOther Assets
——
in Trust for Pension Benefits
in Trust for Pension Benefits
End of the Year Net Assets Held—Adjustments
AdditionsContributions
Employer -
Employee -
Other -
GeneralSafetyCombined
CombinedSafetyGeneral
CombinedSafetyGeneral
$ ——
6,252,099
971,497,734
—
——
——
DeductionsBenefit Payments
Service Retirement -
$ 1,176,158,282
Disability -
Other -
Member Refunds -
General
CombinedSafetyGeneralCombinedSafety
CombinedSafetyGeneral
CombinedSafetyGeneral
$ ———————————
846,374,918
—Investment Expenses )(3,531,318
$ 16,596,831,500
Footnote:
(1) The plan membership maybe be duplicated, as members may have accounts in more than one plan and may also have more than one account in one or more of the plans.
224

DEFINED CONTRIBUTION SYSTEMS
City Systems

This Page Intentionally Left Blank

Public Retirement Systems Annual Report — Fiscal Year 2011-12City of Irvine Defined Contribution Pension Plan
Contributions
AssetsCash and Short-Term InvestmentsReceivables
InvestmentsOther
Investments, at Fair ValueU.S. Government ObligationsInternational BondsMunicipal BondsDomestic Corporate BondsDomestic Stocks
Total Assets
Mortgages
Accounts PayableInvestment Purchases PayableAccrued ExpensesOther Current Liabilities
Total Liabilities
International Stocks
Net Assets Available for Benefits
Statement of Plan Net Assets
LiabilitiesTotal Additions
InterestDividendsNet Appreciation (Depreciation)Other Investment RevenuesIn Fair Value of Investments
Statement of Changes in Plan Net Assets
$ 10,632,240
Real EstateVenture CapitalOther
Investments
$ 122,866$ 10,509,374
$ 45,266
Administration ExpensesOther Expenses
Total DeductionsNet Increase (Decrease) In Plan AssetsBeginning of the Year Net Assets Held
$ 473,984$ )(214,594
as of December 31, 2011 for Period Ending December 31, 2011
Membership 102
5,155,313——
1,066,2003,152,986
256,876———
881,817
——
73,782
$ ———
122,866
2,62846,848
)(311—
Other Revenue
—3,906
$ 10,723,968
Fixed Assets Net of Accumulated DepreciationOther Assets
——
(1)
(2)
(3)
(4)
in Trust for Pension Benefits
in Trust for Pension Benefits
End of the Year Net Assets Held
Investment Expenses
Adjustments —
$ 259,390
137
AdditionsContributions
Employer -
Employee -
Other -
GeneralSafetyCombined
CombinedSafetyGeneral
CombinedSafetyGeneral
$ 180,762——
—
—
57,246—
——
DeductionsBenefit Payments
Service Retirement -
Disability -
Other -
Member Refunds -
General
CombinedSafetyGeneralCombinedSafety
CombinedSafetyGeneral
CombinedSafetyGeneral
$ 40,127————————
429,951——
)(27,920
$ 10,509,374
Comments:On October 22, 2002, the Irvine City Council adopted a resolution giving notice of intention to amend the contract between the Board of Administration of the California Public Employees' Retirement system (CalPERS) and the City of Irvine to offer miscellaneous (non-sworn) employees the opportunity to participate in the CalPERS pension plan. On November 15, 2002, the proposed CalPERS contract for miscellaneous employees was approved through a majority vote of eligible employees. During the April 2003 election period, of the 591 employees eligible to participate in the new CalPERS plan, 434 elected to participate in CalPERS and 157 participants elected to remain in the City of Irvine Defined Contribution Pension Plan.
Footnote:
(1) Participants may borrow up to 50% of their vested account balance or $50,000, whichever is less, with the minimum loan amount being $1,000. At December 31, 2011, loans outstanding totaled $73,782.
(2) At December 31, 2011, forfeited nonvested accounts totaled $122,866. These accounts were used to reduce future city contributions, reinstate closed accounts, and pay for plan-related expenses (for which the city is responsible) at the discretion of the city.
(3) Prior to May 17, 2002, participants could not contribute to the plan. However, in anticipation of an opportunity for participants to transfer to a new pension plan, the plan was amended to allow limited redeposits. Effective July 1, 2003, participants are required to contribute 4% of their base compensation to the plan. As of August 6, 2011, participants contributed based on their employee group, either 4% or 6.552% of the participant's base compensation to the Plan.
(4) In 2003, at the time of the transition from the plan to CalPERS, some of the plan participants opting to move to CalPERS had outstanding loans in their 401a accounts. In order to accommodate their transition, the city chose to reduce participants' years of service by an amount commensurate with their outstanding loan balance. Those affected employees continued to make their payroll-deducted loan payments to the plan even though they were no longer participants in the plan.
By mutual agreement, the city transfers annually, on or before March 15, the balances of those participants loan accounts that have been paid in full in the preceding year. This procedure will continue until all of the outstanding loans have been paid in full and the withheld years of service have been restored. During the calendar year 2011, no transfers were made to PERS.
227

Public Retirement Systems Annual Report — Fiscal Year 2011-12City of Ripon Money Purchase Thrift Pension Plan
Contributions
AssetsCash and Short-Term InvestmentsReceivables
InvestmentsOther
Investments, at Fair ValueU.S. Government ObligationsInternational BondsMunicipal BondsDomestic Corporate BondsDomestic Stocks
Total Assets
Mortgages
Accounts PayableInvestment Purchases PayableAccrued ExpensesOther Current Liabilities
Total Liabilities
International Stocks
Net Assets Available for Benefits
Statement of Plan Net Assets
LiabilitiesTotal Additions
InterestDividendsNet Appreciation (Depreciation)Other Investment RevenuesIn Fair Value of Investments
Statement of Changes in Plan Net Assets
$ 8,750,739
Real EstateVenture CapitalOther
Investments
$ —$ 8,750,739
$ 2,511,931
Administration ExpensesOther Expenses
Total DeductionsNet Increase (Decrease) In Plan AssetsBeginning of the Year Net Assets Held
$ 263,494$ 451,964
as of June 30, 2012 for Period Ending June 30, 2012
Membership 64
120,459——
1,395,1682,024,036
————
2,304,736
25,163—
369,246
$ ————
18,451139,469
)(108,909—
Other Revenue
13,383—
$ 8,298,775
Fixed Assets Net of Accumulated DepreciationOther Assets
——
(1)
in Trust for Pension Benefits
in Trust for Pension Benefits
End of the Year Net Assets Held
Investment Expenses
Adjustments —
$ 715,458
—
AdditionsContributions
Employer -
Employee -
Other -
GeneralSafetyCombined
CombinedSafetyGeneral
CombinedSafetyGeneral
$ 383,829——
—
—
282,618—
——
DeductionsBenefit Payments
Service Retirement -
Disability -
Other -
Member Refunds -
General
CombinedSafetyGeneralCombinedSafety
CombinedSafetyGeneral
CombinedSafetyGeneral
$ ——————
250,111—————
—
$ 8,750,739
Comments:The city makes contributions to the plan equal to 10% of the total compensation, excluding overtime, of all participants in the plan under the mandatory provision and up to 3.3% of the qualified employees annual compensation under the voluntary provision. Eligible employees can elect to defer 5% of their compensation to the plan. The plan allows additional employee elective contributions up to 6.6% of annual compensation. The city entered into a memorandum of understanding requiring it to pick up the 5% previously mentioned.
Footnote:
(1) The plan provides for loans to participants that are secured by their vested account balances and can be no greater than the lesser of 50% of the participant's vested account balance or $50,000. The loans bear interest at a fixed rate of 4.25% to 10.25%.
228

Public Retirement Systems Annual Report — Fiscal Year 2011-12San Diego Supplemental Pension Savings Plan
Contributions
AssetsCash and Short-Term InvestmentsReceivables
InvestmentsOther
Investments, at Fair ValueU.S. Government ObligationsInternational BondsMunicipal BondsDomestic Corporate BondsDomestic Stocks
Total Assets
Mortgages
Accounts PayableInvestment Purchases PayableAccrued ExpensesOther Current Liabilities
Total Liabilities
International Stocks
Net Assets Available for Benefits
Statement of Plan Net Assets
LiabilitiesTotal Additions
InterestDividendsNet Appreciation (Depreciation)Other Investment RevenuesIn Fair Value of Investments
Statement of Changes in Plan Net Assets
$ 539,226,029
Real EstateVenture CapitalOther
Investments
$ —$ 539,226,029
$ 514,587,000
Administration ExpensesOther Expenses
Total DeductionsNet Increase (Decrease) In Plan AssetsBeginning of the Year Net Assets Held
$ 67,392,005$ )(34,378,345
as of June 30, 2012 for Period Ending June 30, 2012
Membership 7,159
——————————
——
24,639,029
$ ————
——
)(6,745,959751,702
Other Revenue
—539,837
$ 573,604,374
Fixed Assets Net of Accumulated DepreciationOther Assets
——
in Trust for Pension Benefits
in Trust for Pension Benefits
End of the Year Net Assets Held
Investment Expenses
Adjustments —
$ 33,013,660
—
AdditionsContributions
Employer -
Employee -
Other -
GeneralSafetyCombined
CombinedSafetyGeneral
CombinedSafetyGeneral
$ 19,074,365——
—
—
19,933,552—
——
DeductionsBenefit Payments
Service Retirement -
Disability -
Other -
Member Refunds -
General
CombinedSafetyGeneralCombinedSafety
CombinedSafetyGeneral
CombinedSafetyGeneral
$ ——————
66,852,168—————
—
$ 539,226,029
Comments:The plan requires that both the employee and the city contribute an amount equal to 3% of employee's total salary each pay period. Participants in the plan hired before July 1, 1986, may voluntarily contribute up to an additional 4.5% and participants hired on or after that date may voluntarily contribute up to an additional 3.05% of total salary, with the city matching each. Hourly employees contribute 3.75% on mandatory basis, also matched by the city. For fiscal year 2012, the employer offered a 3% voluntary match to employees. This was after a two-year freeze in employer match.
Footnote:
(1) Service retired membership counts also include vested and non-vested terminated members. The plan is unable to separate service retired and terminated members at this time.
229

This Page Intentionally Left Blank

DEFINED CONTRIBUTION SYSTEMS
Special District Systems

This Page Intentionally Left Blank

Public Retirement Systems Annual Report — Fiscal Year 2011-12
Arvin Edison Water Storage District Employees' Pension Plan
Contributions
AssetsCash and Short-Term InvestmentsReceivables
InvestmentsOther
Investments, at Fair ValueU.S. Government ObligationsInternational BondsMunicipal BondsDomestic Corporate BondsDomestic Stocks
Total Assets
Mortgages
Accounts PayableInvestment Purchases PayableAccrued ExpensesOther Current Liabilities
Total Liabilities
International Stocks
Net Assets Available for Benefits
Statement of Plan Net Assets
LiabilitiesTotal Additions
InterestDividendsNet Appreciation (Depreciation)Other Investment RevenuesIn Fair Value of Investments
Statement of Changes in Plan Net Assets
$ 7,552,791
Real EstateVenture CapitalOther
Investments
$ —$ 7,552,791
$ 160,779
$ 660,270
Administration ExpensesOther Expenses
Total DeductionsNet Increase (Decrease) In Plan AssetsBeginning of the Year Net Assets Held
$ 113,933$ 546,337
as of February 28, 2012 for Period Ending February 28, 2012
$ 7,552,791
Membership 55
———
237,2322,883,665
————
4,131,489
21,558—
118,068
$ ————
46,397218,263
)(111,503—
Other Revenue
——
$ 7,006,454
Fixed Assets Net of Accumulated DepreciationOther Assets
——
in Trust for Pension Benefits
in Trust for Pension Benefits
End of the Year Net Assets Held
Investment Expenses
Adjustments —
—
AdditionsContributions
Employer -
Employee -
Other -
GeneralSafetyCombined
CombinedSafetyGeneral
CombinedSafetyGeneral
$ 352,657——
—
—
195,891—
——
DeductionsBenefit Payments
Service Retirement -
Disability -
Other -
Member Refunds -
General
CombinedSafetyGeneralCombinedSafety
CombinedSafetyGeneral
CombinedSafetyGeneral
$ 113,933———————————
)(41,435
Comments:The district contributed amounts equal to 12% or 17% of eligible employees' wages. Employees had the option to contribute 4% or 6% of their annual wages. Participants are required to contribute at least 4% to receive the district's contribution. Forfeitures of terminated employees' non-vested account balances are used to offset required district contributions.
233

Public Retirement Systems Annual Report — Fiscal Year 2011-12
Centre City Development Corporation Deferred Annuity Plan
Contributions
AssetsCash and Short-Term InvestmentsReceivables
InvestmentsOther
Investments, at Fair ValueU.S. Government ObligationsInternational BondsMunicipal BondsDomestic Corporate BondsDomestic Stocks
Total Assets
Mortgages
Accounts PayableInvestment Purchases PayableAccrued ExpensesOther Current Liabilities
Total Liabilities
International Stocks
Net Assets Available for Benefits
Statement of Plan Net Assets
LiabilitiesTotal Additions
InterestDividendsNet Appreciation (Depreciation)Other Investment RevenuesIn Fair Value of Investments
Statement of Changes in Plan Net Assets
$ 7,352,490
Real EstateVenture CapitalOther
Investments
$ —$ 7,352,490
$ —
$ 569,928
Administration ExpensesOther Expenses
Total DeductionsNet Increase (Decrease) In Plan AssetsBeginning of the Year Net Assets Held
$ 1,568,132$ )(998,204
as of June 30, 2012 for Period Ending June 30, 2012
$ 7,352,490
Membership 80
—————————
7,201,501
——
150,989
$ ————
——
)(45,422—
Other Revenue
——
$ 8,350,694
Fixed Assets Net of Accumulated DepreciationOther Assets
——
(1)
in Trust for Pension Benefits
in Trust for Pension Benefits
End of the Year Net Assets Held
Investment Expenses
Adjustments —
—
AdditionsContributions
Employer -
Employee -
Other -
GeneralSafetyCombined
CombinedSafetyGeneral
CombinedSafetyGeneral
$ 491,512——
—
—
125,478—
——
DeductionsBenefit Payments
Service Retirement -
Disability -
Other -
Member Refunds -
General
CombinedSafetyGeneralCombinedSafety
CombinedSafetyGeneral
CombinedSafetyGeneral
$ 1,568,132———————————
)(1,640
Comments:Centre City Development Corporation was renamed to Civic San Diego (Corporation) in June 2012.
The Tax Deferred Annuity Plan covers all full-time permanent employees. Each year, the Corporation contributes an amount equal to 16% of total eligible compensation for each paticipant.
Footnote:
(1) Participant loans. The plan allow participants to participant in a loan program. The maximum loan amount is the lesser of $50,000 or 50% of the present value of the vested account balance.
234

Public Retirement Systems Annual Report — Fiscal Year 2011-12
Centre City Development Corporation Money Purchase Pension Plan
Contributions
AssetsCash and Short-Term InvestmentsReceivables
InvestmentsOther
Investments, at Fair ValueU.S. Government ObligationsInternational BondsMunicipal BondsDomestic Corporate BondsDomestic Stocks
Total Assets
Mortgages
Accounts PayableInvestment Purchases PayableAccrued ExpensesOther Current Liabilities
Total Liabilities
International Stocks
Net Assets Available for Benefits
Statement of Plan Net Assets
LiabilitiesTotal Additions
InterestDividendsNet Appreciation (Depreciation)Other Investment RevenuesIn Fair Value of Investments
Statement of Changes in Plan Net Assets
$ 2,627,108
Real EstateVenture CapitalOther
Investments
$ 39,144$ 2,587,964
$ —
$ 262,406
Administration ExpensesOther Expenses
Total DeductionsNet Increase (Decrease) In Plan AssetsBeginning of the Year Net Assets Held
$ 1,282,781$ )(1,020,375
as of June 30, 2012 for Period Ending June 30, 2012
$ 2,587,964
Membership 59
—————————
2,626,854
254——
$ ———
39,144
21,873—
20,283—
Other Revenue
——
$ 3,608,339
Fixed Assets Net of Accumulated DepreciationOther Assets
——
(1)
in Trust for Pension Benefits
in Trust for Pension Benefits
End of the Year Net Assets Held
Investment Expenses
Adjustments —
—
AdditionsContributions
Employer -
Employee -
Other -
GeneralSafetyCombined
CombinedSafetyGeneral
CombinedSafetyGeneral
$ 220,570——
—
—
——
——
DeductionsBenefit Payments
Service Retirement -
Disability -
Other -
Member Refunds -
General
CombinedSafetyGeneralCombinedSafety
CombinedSafetyGeneral
CombinedSafetyGeneral
$ ——————
1,123,245——
159,536——
)(320
Comments:Center City Development Corporation was renamed to Civic San Diego (Corporation) in June 2012.
Massachusetts Mutual Life Insurance Company holds the Plan's assets and executes investment transactions. The Plan administrator has obtained a certification from the trustee, as of and for the year ended June, 30, 2012, that the information provided to the plan administrator by the trustee is complete and accurate. Independent auditors, Macias Gini and O'Connell LLP, did not audit and did not express an opinion on the financial statements presented.
The Money Purchase Pension Plan covers all full-time permanent employees. Each year, the Corporation contributes an amount equal to 8% of the total quarterly compensation for all employees.
Footnote:
(1) Includes $24,336 in forfeited nonvested accounts. This amount can be used to reduce future employer contributions. During the year, the corporation's contributions were reduced by $26,732 from forfeited nonvested accounts.
235

Public Retirement Systems Annual Report — Fiscal Year 2011-12
Corcoran Irrigation District Money Purchase Pension Plan
Contributions
AssetsCash and Short-Term InvestmentsReceivables
InvestmentsOther
Investments, at Fair ValueU.S. Government ObligationsInternational BondsMunicipal BondsDomestic Corporate BondsDomestic Stocks
Total Assets
Mortgages
Accounts PayableInvestment Purchases PayableAccrued ExpensesOther Current Liabilities
Total Liabilities
International Stocks
Net Assets Available for Benefits
Statement of Plan Net Assets
LiabilitiesTotal Additions
InterestDividendsNet Appreciation (Depreciation)Other Investment RevenuesIn Fair Value of Investments
Statement of Changes in Plan Net Assets
$ 546,401
Real EstateVenture CapitalOther
Investments
$ 52$ 546,349
$ 5,504
$ )(1,431
Administration ExpensesOther Expenses
Total DeductionsNet Increase (Decrease) In Plan AssetsBeginning of the Year Net Assets Held
$ 9,429$ )(10,860
as of December 31, 2011 for Period Ending December 31, 2011
$ 546,349
Membership 12
————
540,897—————
———
$ ———52
——
)(46,788—
Other Revenue
2,731—
$ 557,209
Fixed Assets Net of Accumulated DepreciationOther Assets
——
(1)
in Trust for Pension Benefits
in Trust for Pension Benefits
End of the Year Net Assets Held
Investment Expenses
Adjustments —
—
AdditionsContributions
Employer -
Employee -
Other -
GeneralSafetyCombined
CombinedSafetyGeneral
CombinedSafetyGeneral
$ 45,357——
—
—
——
——
DeductionsBenefit Payments
Service Retirement -
Disability -
Other -
Member Refunds -
General
CombinedSafetyGeneralCombinedSafety
CombinedSafetyGeneral
CombinedSafetyGeneral
$ 6,698———————————
—
Footnote:
(1) The district makes semi-monthly pension contributions which, when combined with forfeitures of terminated employees, equal 8% of the compensation of the participants eligible to share in the pension contribution for the year. Participants are not allowed to make contributions to the plan; however, rollover contributions are permitted under certain circumstances.
236

Public Retirement Systems Annual Report — Fiscal Year 2011-12
Eastern Sierra Community Service District Money Purchase Pension Plan
Contributions
AssetsCash and Short-Term InvestmentsReceivables
InvestmentsOther
Investments, at Fair ValueU.S. Government ObligationsInternational BondsMunicipal BondsDomestic Corporate BondsDomestic Stocks
Total Assets
Mortgages
Accounts PayableInvestment Purchases PayableAccrued ExpensesOther Current Liabilities
Total Liabilities
International Stocks
Net Assets Available for Benefits
Statement of Plan Net Assets
LiabilitiesTotal Additions
InterestDividendsNet Appreciation (Depreciation)Other Investment RevenuesIn Fair Value of Investments
Statement of Changes in Plan Net Assets
$ 1,301,238
Real EstateVenture CapitalOther
Investments
$ —$ 1,301,238
$ 37,125
$ 96,841
Administration ExpensesOther Expenses
Total DeductionsNet Increase (Decrease) In Plan AssetsBeginning of the Year Net Assets Held
$ 24,573$ 72,268
as of June 30, 2012 for Period Ending June 30, 2012
$ 1,301,238
Membership 5
—————————
1,261,860
2,253——
$ ————
2641,016
)(6,0757,479
Other Revenue
24,573—
$ 1,228,970
Fixed Assets Net of Accumulated DepreciationOther Assets
——
in Trust for Pension Benefits
in Trust for Pension Benefits
End of the Year Net Assets Held
Investment Expenses
Adjustments —
—
AdditionsContributions
Employer -
Employee -
Other -
GeneralSafetyCombined
CombinedSafetyGeneral
CombinedSafetyGeneral
$ 54,395——
—
—
——
——
DeductionsBenefit Payments
Service Retirement -
Disability -
Other -
Member Refunds -
General
CombinedSafetyGeneralCombinedSafety
CombinedSafetyGeneral
CombinedSafetyGeneral
$ ————————————
—
Comments:Trust Company of America holds the plan's assets and executes investment transactions. The plan administrator has obtained a certification from the trustee, as of and for the year ended June 30, 2012, that the information provided to the plan administrator by the trustee is complete and accurate. Independent auditor Larry Bain, CPA, An Accounting Corporation, did not audit and did not express an opinion on the financial statements presented.
Employees are not required to contribute to the plan; therefore, the district made the required 17.5% contribution, amounting to $54,395 for the fiscal year ended June 30, 2012.
237

Public Retirement Systems Annual Report — Fiscal Year 2011-12
Exeter Irrigation District Employees' Money Purchase Pension Plan
Contributions
AssetsCash and Short-Term InvestmentsReceivables
InvestmentsOther
Investments, at Fair ValueU.S. Government ObligationsInternational BondsMunicipal BondsDomestic Corporate BondsDomestic Stocks
Total Assets
Mortgages
Accounts PayableInvestment Purchases PayableAccrued ExpensesOther Current Liabilities
Total Liabilities
International Stocks
Net Assets Available for Benefits
Statement of Plan Net Assets
LiabilitiesTotal Additions
InterestDividendsNet Appreciation (Depreciation)Other Investment RevenuesIn Fair Value of Investments
Statement of Changes in Plan Net Assets
$ 688,609
Real EstateVenture CapitalOther
Investments
$ —$ 688,609
$ —
$ 57,906
Administration ExpensesOther Expenses
Total DeductionsNet Increase (Decrease) In Plan AssetsBeginning of the Year Net Assets Held
$ 4,114$ 53,792
as of December 31, 2011 for Period Ending December 31, 2011
$ 688,609
Membership 6
—————————
629,797
3,195—
55,617
$ ————
9,920—
2,446—
Other Revenue
114—
$ 634,817
Fixed Assets Net of Accumulated DepreciationOther Assets
——
(1)
in Trust for Pension Benefits
in Trust for Pension Benefits
End of the Year Net Assets Held
Investment Expenses
Adjustments —
—
AdditionsContributions
Employer -
Employee -
Other -
GeneralSafetyCombined
CombinedSafetyGeneral
CombinedSafetyGeneral
$ 22,260——
—
—
23,280—
——
DeductionsBenefit Payments
Service Retirement -
Disability -
Other -
Member Refunds -
General
CombinedSafetyGeneralCombinedSafety
CombinedSafetyGeneral
CombinedSafetyGeneral
$ 4,000———————————
—
Comments:The employer contributes 8% of the participant's total compensation. The participant contributes 4% of total compensation.
Footnote:
(1) Loan proceeds receivable from two employee participants as of December 31, 2011.
238

Public Retirement Systems Annual Report — Fiscal Year 2011-12
Fresno Irrigation District Employee Money Purchase Plan
Contributions
AssetsCash and Short-Term InvestmentsReceivables
InvestmentsOther
Investments, at Fair ValueU.S. Government ObligationsInternational BondsMunicipal BondsDomestic Corporate BondsDomestic Stocks
Total Assets
Mortgages
Accounts PayableInvestment Purchases PayableAccrued ExpensesOther Current Liabilities
Total Liabilities
International Stocks
Net Assets Available for Benefits
Statement of Plan Net Assets
LiabilitiesTotal Additions
InterestDividendsNet Appreciation (Depreciation)Other Investment RevenuesIn Fair Value of Investments
Statement of Changes in Plan Net Assets
$ 7,351,788
Real EstateVenture CapitalOther
Investments
$ 3,807$ 7,347,981
$ 3,807
$ 366,758
Administration ExpensesOther Expenses
Total DeductionsNet Increase (Decrease) In Plan AssetsBeginning of the Year Net Assets Held
$ 776,616$ )(409,858
as of December 31, 2011 for Period Ending December 31, 2011
$ 7,347,981
Membership 93
—————————
7,326,923
21,058——
$ ———
3,807
2,306—
)(198,912—
Other Revenue
23,889—
$ 7,757,839
Fixed Assets Net of Accumulated DepreciationOther Assets
——
in Trust for Pension Benefits
in Trust for Pension Benefits
End of the Year Net Assets Held
Investment Expenses
Adjustments —
—
AdditionsContributions
Employer -
Employee -
Other -
GeneralSafetyCombined
CombinedSafetyGeneral
CombinedSafetyGeneral
$ 238,632——
—
—
324,732—
——
DeductionsBenefit Payments
Service Retirement -
Disability -
Other -
Member Refunds -
General
CombinedSafetyGeneralCombinedSafety
CombinedSafetyGeneral
CombinedSafetyGeneral
$ 752,727———————————
—
Comments:The district contributes 0.50% of contribution for eligible participants without requiring them to contribute. Additionally, the district matches the participant's contribution on a one-for-one basis for the first 6% of the participant's contributions, for a maximum district contribution of 6.50%.
239

Public Retirement Systems Annual Report — Fiscal Year 2011-12
Fresno Metropolitan Flood Control District Money Purchase Pension Plan
Contributions
AssetsCash and Short-Term InvestmentsReceivables
InvestmentsOther
Investments, at Fair ValueU.S. Government ObligationsInternational BondsMunicipal BondsDomestic Corporate BondsDomestic Stocks
Total Assets
Mortgages
Accounts PayableInvestment Purchases PayableAccrued ExpensesOther Current Liabilities
Total Liabilities
International Stocks
Net Assets Available for Benefits
Statement of Plan Net Assets
LiabilitiesTotal Additions
InterestDividendsNet Appreciation (Depreciation)Other Investment RevenuesIn Fair Value of Investments
Statement of Changes in Plan Net Assets
$ 10,476,333
Real EstateVenture CapitalOther
Investments
$ —$ 10,476,333
$ 4,275,401
$ 1,025,206
Administration ExpensesOther Expenses
Total DeductionsNet Increase (Decrease) In Plan AssetsBeginning of the Year Net Assets Held
$ 58,965$ 966,241
as of September 30, 2011 for Period Ending September 30, 2011
$ 10,476,333
Membership 101
————
611,731————
5,488,708
——
100,493
$ ————
134,104—
)(45,297—
Other Revenue
3,9145,448
$ 9,510,092
Fixed Assets Net of Accumulated DepreciationOther Assets
——
(1)
in Trust for Pension Benefits
in Trust for Pension Benefits
End of the Year Net Assets Held
Investment Expenses
Adjustments —
—
AdditionsContributions
Employer -
Employee -
Other -
GeneralSafetyCombined
CombinedSafetyGeneral
CombinedSafetyGeneral
$ 558,298——
—
—
378,101—
——
DeductionsBenefit Payments
Service Retirement -
Disability -
Other -
Member Refunds -
General
CombinedSafetyGeneralCombinedSafety
CombinedSafetyGeneral
CombinedSafetyGeneral
$ 49,603———————————
—
Comments:On November 18, 2009, the Board of Directors approved the transfer of the plan to International City/County Management Association Retirement Corporation (ICMA-RC). The board also approved changing the plan year to a calendar year of January 1 through December 31. Bi-weekly employer contributions for participants hired prior to June 30, 1988, is 14% (10% for those hired after that date) of the participant's salary, based on annual compensation, excluding certain other compensation.
Bi-weekly mandatory employee contribution for participants hired prior to June 30, 1988, is 6% (5% for those hired after that date) of the participant's salary, based on annual compensation, excluding certain other compensation.
Footnote:
(1) Participant Loans.
240

Public Retirement Systems Annual Report — Fiscal Year 2011-12
Glenn-Colusa Irrigation District Pension Plan
Contributions
AssetsCash and Short-Term InvestmentsReceivables
InvestmentsOther
Investments, at Fair ValueU.S. Government ObligationsInternational BondsMunicipal BondsDomestic Corporate BondsDomestic Stocks
Total Assets
Mortgages
Accounts PayableInvestment Purchases PayableAccrued ExpensesOther Current Liabilities
Total Liabilities
International Stocks
Net Assets Available for Benefits
Statement of Plan Net Assets
LiabilitiesTotal Additions
InterestDividendsNet Appreciation (Depreciation)Other Investment RevenuesIn Fair Value of Investments
Statement of Changes in Plan Net Assets
$ 5,285,005
Real EstateVenture CapitalOther
Investments
$ —$ 5,285,005
$ 205,338
$ 362,583
Administration ExpensesOther Expenses
Total DeductionsNet Increase (Decrease) In Plan AssetsBeginning of the Year Net Assets Held
$ 353,579$ 9,004
as of September 30, 2011 for Period Ending September 30, 2011
$ 5,285,005
Membership 71
640,607——
554,6002,654,435
————
1,211,334
———
$ ————
45,28791,845
)(113,235—
Other Revenue
70,3872,604
$ 5,276,001
Fixed Assets Net of Accumulated DepreciationOther Assets
—18,691
in Trust for Pension Benefits
in Trust for Pension Benefits
End of the Year Net Assets Held
Investment Expenses
Adjustments —
—
AdditionsContributions
Employer -
Employee -
Other -
GeneralSafetyCombined
CombinedSafetyGeneral
CombinedSafetyGeneral
$ 338,686——
—
—
——
——
DeductionsBenefit Payments
Service Retirement -
Disability -
Other -
Member Refunds -
General
CombinedSafetyGeneralCombinedSafety
CombinedSafetyGeneral
CombinedSafetyGeneral
$ —————————
280,588——
—
Comments:The district contributes 9.5% of the participants' annual base salary to the plan.
241

Public Retirement Systems Annual Report — Fiscal Year 2011-12
Home Gardens Sanitary District Pension Plan
Contributions
AssetsCash and Short-Term InvestmentsReceivables
InvestmentsOther
Investments, at Fair ValueU.S. Government ObligationsInternational BondsMunicipal BondsDomestic Corporate BondsDomestic Stocks
Total Assets
Mortgages
Accounts PayableInvestment Purchases PayableAccrued ExpensesOther Current Liabilities
Total Liabilities
International Stocks
Net Assets Available for Benefits
Statement of Plan Net Assets
LiabilitiesTotal Additions
InterestDividendsNet Appreciation (Depreciation)Other Investment RevenuesIn Fair Value of Investments
Statement of Changes in Plan Net Assets
$ 322,084
Real EstateVenture CapitalOther
Investments
$ 30,377$ 291,707
$ —
$ 41,544
Administration ExpensesOther Expenses
Total DeductionsNet Increase (Decrease) In Plan AssetsBeginning of the Year Net Assets Held
$ —$ 41,544
as of July 31, 2011 for Period Ending July 31, 2011
$ 291,707
Membership 2
—————————
322,084
———
$ 30,377———
——
12,051—
Other Revenue
——
$ 251,046
Fixed Assets Net of Accumulated DepreciationOther Assets
——
(1)
in Trust for Pension Benefits
in Trust for Pension Benefits
End of the Year Net Assets Held
Investment Expenses
Adjustments )(883
—
AdditionsContributions
Employer -
Employee -
Other -
GeneralSafetyCombined
CombinedSafetyGeneral
CombinedSafetyGeneral
$ 29,493——
—
—
——
——
DeductionsBenefit Payments
Service Retirement -
Disability -
Other -
Member Refunds -
General
CombinedSafetyGeneralCombinedSafety
CombinedSafetyGeneral
CombinedSafetyGeneral
$ ————————————
—
Footnote:
(1) The employer contributes 25% of each employee's salary, based on the district's fiscal year ending July 31. Ten percent of the contribution may be used to purchase life insurance for the employee, with the remaining 90% invested in either a passbook savings account or an annuity fund.
242

Public Retirement Systems Annual Report — Fiscal Year 2011-12
Imperial Irrigation District Employee Pension Plan (DCP)
Contributions
AssetsCash and Short-Term InvestmentsReceivables
InvestmentsOther
Investments, at Fair ValueU.S. Government ObligationsInternational BondsMunicipal BondsDomestic Corporate BondsDomestic Stocks
Total Assets
Mortgages
Accounts PayableInvestment Purchases PayableAccrued ExpensesOther Current Liabilities
Total Liabilities
International Stocks
Net Assets Available for Benefits
Statement of Plan Net Assets
LiabilitiesTotal Additions
InterestDividendsNet Appreciation (Depreciation)Other Investment RevenuesIn Fair Value of Investments
Statement of Changes in Plan Net Assets
$ 139,269,894
Real EstateVenture CapitalOther
Investments
$ —$ 139,269,894
$ —
$ 8,383,384
Administration ExpensesOther Expenses
Total DeductionsNet Increase (Decrease) In Plan AssetsBeginning of the Year Net Assets Held
$ 9,923,485$ )(1,540,101
as of December 31, 2011 for Period Ending December 31, 2011
$ 139,269,894
Membership 1,883
—————————
139,269,894
———
$ ————
1,231,2882,485,236
)(2,374,161—
Other Revenue
—7,004
$ 140,809,995
Fixed Assets Net of Accumulated DepreciationOther Assets
——
(1)
in Trust for Pension Benefits
in Trust for Pension Benefits
End of the Year Net Assets Held
Investment Expenses
Adjustments —
447
AdditionsContributions
Employer -
Employee -
Other -
GeneralSafetyCombined
CombinedSafetyGeneral
CombinedSafetyGeneral
$ 6,721,955——
—
—
318,619—
——
DeductionsBenefit Payments
Service Retirement -
Disability -
Other -
Member Refunds -
General
CombinedSafetyGeneralCombinedSafety
CombinedSafetyGeneral
CombinedSafetyGeneral
$ —————————
9,916,481——
—
Comments:The district contributes 7% of the participant's monthly base compensation, limited to $195,000, on behalf of eligible participants. Participants may elect to make after-tax contributions to the plan in an amount that does not exceed the lesser of $30,000 or 25% of the participant's section 415 compensation.
Footnote:
(1) Member refunds consist of in-service withdrawal of $84,925, terminations of $9,828,886, and installment payments of $2,670. Withdrawal represents any individual who took a distribution from the plan while still active and employed. Termination represents any individual who took any kind of payment from the plan after he or she separated from service. The plan is unable to separate the retirement distributions from distributions to employees who simply leave the agency and take their contributions with them.
243

Public Retirement Systems Annual Report — Fiscal Year 2011-12
La Canada Irrigation District Employees' Pension Plan
Contributions
AssetsCash and Short-Term InvestmentsReceivables
InvestmentsOther
Investments, at Fair ValueU.S. Government ObligationsInternational BondsMunicipal BondsDomestic Corporate BondsDomestic Stocks
Total Assets
Mortgages
Accounts PayableInvestment Purchases PayableAccrued ExpensesOther Current Liabilities
Total Liabilities
International Stocks
Net Assets Available for Benefits
Statement of Plan Net Assets
LiabilitiesTotal Additions
InterestDividendsNet Appreciation (Depreciation)Other Investment RevenuesIn Fair Value of Investments
Statement of Changes in Plan Net Assets
$ 1,403,849
Real EstateVenture CapitalOther
Investments
$ 107,811$ 1,296,038
$ —
$ 102,013
Administration ExpensesOther Expenses
Total DeductionsNet Increase (Decrease) In Plan AssetsBeginning of the Year Net Assets Held
$ 30,000$ 72,013
as of December 31, 2011 for Period Ending December 31, 2011
$ 1,296,038
Membership 7
—————————
1,394,733
9,116——
$ ———
107,811
33,361—
)(7,752—
Other Revenue
——
$ 1,224,025
Fixed Assets Net of Accumulated DepreciationOther Assets
——
(1)
in Trust for Pension Benefits
in Trust for Pension Benefits
End of the Year Net Assets Held
Investment Expenses
Adjustments —
—
AdditionsContributions
Employer -
Employee -
Other -
GeneralSafetyCombined
CombinedSafetyGeneral
CombinedSafetyGeneral
$ 76,404——
—
—
——
——
DeductionsBenefit Payments
Service Retirement -
Disability -
Other -
Member Refunds -
General
CombinedSafetyGeneralCombinedSafety
CombinedSafetyGeneral
CombinedSafetyGeneral
$ ——————
30,000—————
—
Comments:Lincoln National Life Insurance Company holds the plan's assets and executes investment transactions. The plan administrator has obtained a certification from the trustee, as of and for the year ended December 31, 2011, that the information provided to the plan administrator by the trustee is complete and accurate. Independent auditor Farber Hass Hurley LLP, did not audit and did not express an opinion on the financial statements presented.
Footnote:
(1) The district contributes to the plan 5% of each employee's compensation, 0.2% of each employee's compensation for each year of the service prior to January 1, 1969, and the contribution amount determined in lieu of Social Security and Medicare for those members who are entitled to an allocation under the plan.
244

Public Retirement Systems Annual Report — Fiscal Year 2011-12
Lakeside Irrigation Water District Money Purchase Pension Plan and Trust
Contributions
AssetsCash and Short-Term InvestmentsReceivables
InvestmentsOther
Investments, at Fair ValueU.S. Government ObligationsInternational BondsMunicipal BondsDomestic Corporate BondsDomestic Stocks
Total Assets
Mortgages
Accounts PayableInvestment Purchases PayableAccrued ExpensesOther Current Liabilities
Total Liabilities
International Stocks
Net Assets Available for Benefits
Statement of Plan Net Assets
LiabilitiesTotal Additions
InterestDividendsNet Appreciation (Depreciation)Other Investment RevenuesIn Fair Value of Investments
Statement of Changes in Plan Net Assets
$ 133,179
Real EstateVenture CapitalOther
Investments
$ —$ 133,179
$ —
$ 16,488
Administration ExpensesOther Expenses
Total DeductionsNet Increase (Decrease) In Plan AssetsBeginning of the Year Net Assets Held
$ —$ 16,488
as of October 31, 2011 for Period Ending October 31, 2011
$ 133,179
Membership 6
—————————
113,883
19,296——
$ ————
—2,220
)(5,028—
Other Revenue
——
$ 116,691
Fixed Assets Net of Accumulated DepreciationOther Assets
——
in Trust for Pension Benefits
in Trust for Pension Benefits
End of the Year Net Assets Held
Investment Expenses
Adjustments —
—
AdditionsContributions
Employer -
Employee -
Other -
GeneralSafetyCombined
CombinedSafetyGeneral
CombinedSafetyGeneral
$ 19,296——
—
—
——
——
DeductionsBenefit Payments
Service Retirement -
Disability -
Other -
Member Refunds -
General
CombinedSafetyGeneralCombinedSafety
CombinedSafetyGeneral
CombinedSafetyGeneral
$ ————————————
—
Comments:The district contributes 7.5% on behalf of the participating employee's total annual compensation accrued during the plan's fiscal year.
245

Public Retirement Systems Annual Report — Fiscal Year 2011-12
Liberty Rural County Fire Protection District Pension Plan and Trust
Contributions
AssetsCash and Short-Term InvestmentsReceivables
InvestmentsOther
Investments, at Fair ValueU.S. Government ObligationsInternational BondsMunicipal BondsDomestic Corporate BondsDomestic Stocks
Total Assets
Mortgages
Accounts PayableInvestment Purchases PayableAccrued ExpensesOther Current Liabilities
Total Liabilities
International Stocks
Net Assets Available for Benefits
Statement of Plan Net Assets
LiabilitiesTotal Additions
InterestDividendsNet Appreciation (Depreciation)Other Investment RevenuesIn Fair Value of Investments
Statement of Changes in Plan Net Assets
$ 110,829
Real EstateVenture CapitalOther
Investments
$ —$ 110,829
$ —
$ 56,023
Administration ExpensesOther Expenses
Total DeductionsNet Increase (Decrease) In Plan AssetsBeginning of the Year Net Assets Held
$ —$ 56,023
as of June 30, 2012 for Period Ending June 30, 2012
$ 110,829
Membership 9
————
81,663—————
29,166——
$ ————
——80—
Other Revenue
——
$ 54,806
Fixed Assets Net of Accumulated DepreciationOther Assets
——
in Trust for Pension Benefits
in Trust for Pension Benefits
End of the Year Net Assets Held
Investment Expenses
Adjustments —
—
AdditionsContributions
Employer -
Employee -
Other -
GeneralSafetyCombined
CombinedSafetyGeneral
CombinedSafetyGeneral
$ —55,943
—
—
—
——
——
DeductionsBenefit Payments
Service Retirement -
Disability -
Other -
Member Refunds -
General
CombinedSafetyGeneralCombinedSafety
CombinedSafetyGeneral
CombinedSafetyGeneral
$ ————————————
—
Comments:The district contributes at a ratio of 7% of the qualified employee's gross compensation.
246

Public Retirement Systems Annual Report — Fiscal Year 2011-12
Lindmore Irrigation District Employees Pension Plan
Contributions
AssetsCash and Short-Term InvestmentsReceivables
InvestmentsOther
Investments, at Fair ValueU.S. Government ObligationsInternational BondsMunicipal BondsDomestic Corporate BondsDomestic Stocks
Total Assets
Mortgages
Accounts PayableInvestment Purchases PayableAccrued ExpensesOther Current Liabilities
Total Liabilities
International Stocks
Net Assets Available for Benefits
Statement of Plan Net Assets
LiabilitiesTotal Additions
InterestDividendsNet Appreciation (Depreciation)Other Investment RevenuesIn Fair Value of Investments
Statement of Changes in Plan Net Assets
$ 887,157
Real EstateVenture CapitalOther
Investments
$ —$ 887,157
$ 887,157
$ 78,679
Administration ExpensesOther Expenses
Total DeductionsNet Increase (Decrease) In Plan AssetsBeginning of the Year Net Assets Held
$ 102,448$ )(23,769
as of December 31, 2011 for Period Ending December 31, 2011
$ 887,157
Membership 9
——————————
———
$ ————
4,475—
26,167—
Other Revenue
395—
$ 910,926
Fixed Assets Net of Accumulated DepreciationOther Assets
——
in Trust for Pension Benefits
in Trust for Pension Benefits
End of the Year Net Assets Held
Investment Expenses
Adjustments —
—
AdditionsContributions
Employer -
Employee -
Other -
GeneralSafetyCombined
CombinedSafetyGeneral
CombinedSafetyGeneral
$ 48,037——
—
—
——
——
DeductionsBenefit Payments
Service Retirement -
Disability -
Other -
Member Refunds -
General
CombinedSafetyGeneralCombinedSafety
CombinedSafetyGeneral
CombinedSafetyGeneral
$ —————————
102,053——
—
Comments:Hartford Life Insurance Company holds the plan's assets and executes investment transactions. The plan administrator has obtained a certification from the trustee, as of and for the year ended December 31, 2010, that the information provided to the plan administrator by the trustee is complete and accurate. Independent auditor Dennis L. Hylton, CPA, did not audit and did not express an opinion on the financial statements presented.
The district is required to contribute 8% of all employees' base compensation. The employer is also required to match up to 4% of base compensation that employees voluntarily contribute into this plan.
247

Public Retirement Systems Annual Report — Fiscal Year 2011-12
Madera Irrigation District 401(k) Pension Plan
Contributions
AssetsCash and Short-Term InvestmentsReceivables
InvestmentsOther
Investments, at Fair ValueU.S. Government ObligationsInternational BondsMunicipal BondsDomestic Corporate BondsDomestic Stocks
Total Assets
Mortgages
Accounts PayableInvestment Purchases PayableAccrued ExpensesOther Current Liabilities
Total Liabilities
International Stocks
Net Assets Available for Benefits
Statement of Plan Net Assets
LiabilitiesTotal Additions
InterestDividendsNet Appreciation (Depreciation)Other Investment RevenuesIn Fair Value of Investments
Statement of Changes in Plan Net Assets
$ 2,029,408
Real EstateVenture CapitalOther
Investments
$ —$ 2,029,408
$ 11,216
$ 214,918
Administration ExpensesOther Expenses
Total DeductionsNet Increase (Decrease) In Plan AssetsBeginning of the Year Net Assets Held
$ 107,190$ 107,728
as of December 31, 2011 for Period Ending December 31, 2011
$ 2,029,408
Membership 57
——————————
———
$ ————
——
)(83,639—
Other Revenue
10,150—
$ 1,921,680
Fixed Assets Net of Accumulated DepreciationOther Assets
10,4392,007,753
in Trust for Pension Benefits
in Trust for Pension Benefits
End of the Year Net Assets Held
Investment Expenses
Adjustments —
—
AdditionsContributions
Employer -
Employee -
Other -
GeneralSafetyCombined
CombinedSafetyGeneral
CombinedSafetyGeneral
$ 156,768——
—
—
141,789—
——
DeductionsBenefit Payments
Service Retirement -
Disability -
Other -
Member Refunds -
General
CombinedSafetyGeneralCombinedSafety
CombinedSafetyGeneral
CombinedSafetyGeneral
$ 97,040———————————
—
Comments:The accounting firm of Cuttone and Mastro has not performed any auditing procedures with respect to the plan's investments. John Hancock Life insurance holds the plan's investments assets and executes investment transactions. The plan administrator has obtained a certification from the trustee as of and for the year ended December 31, 2011, that the information provided to the plan administrator by John Hancock Life Insurance is complete and accurate.
Each year, the employers contribute a discretionary matching contribution equal to a uniform percent of the amount of salary reduction the employee elected to defer and an amount equal to 4% of eligible employees' compensation. For the year ending December 31, 2011, the discretionary matching percentage was 3%. Forfeitures of terminated participants' nonvested accounts are used by the employers to reduce their contribution liability.
248

Public Retirement Systems Annual Report — Fiscal Year 2011-12
Modesto Irrigation District Supplemental Retirement Plan
Contributions
AssetsCash and Short-Term InvestmentsReceivables
InvestmentsOther
Investments, at Fair ValueU.S. Government ObligationsInternational BondsMunicipal BondsDomestic Corporate BondsDomestic Stocks
Total Assets
Mortgages
Accounts PayableInvestment Purchases PayableAccrued ExpensesOther Current Liabilities
Total Liabilities
International Stocks
Net Assets Available for Benefits
Statement of Plan Net Assets
LiabilitiesTotal Additions
InterestDividendsNet Appreciation (Depreciation)Other Investment RevenuesIn Fair Value of Investments
Statement of Changes in Plan Net Assets
$ 74,121,513
Real EstateVenture CapitalOther
Investments
$ —$ 74,121,513
$ 23,406,002
$ 2,525,042
Administration ExpensesOther Expenses
Total DeductionsNet Increase (Decrease) In Plan AssetsBeginning of the Year Net Assets Held
$ 4,075,178$ )(1,550,136
as of December 31, 2011 for Period Ending December 31, 2011
$ 74,121,513
Membership 562
————
41,756,3246,980,716
—1,876,012
——
—102,459
—
$ ————
159,980334,740
)(1,305,842—
Other Revenue
——
$ 75,671,649
Fixed Assets Net of Accumulated DepreciationOther Assets
——
(1)
in Trust for Pension Benefits
in Trust for Pension Benefits
End of the Year Net Assets Held
Investment Expenses
Adjustments —
—
AdditionsContributions
Employer -
Employee -
Other -
GeneralSafetyCombined
CombinedSafetyGeneral
CombinedSafetyGeneral
$ 1,668,082——
—
—
1,668,082—
——
DeductionsBenefit Payments
Service Retirement -
Disability -
Other -
Member Refunds -
General
CombinedSafetyGeneralCombinedSafety
CombinedSafetyGeneral
CombinedSafetyGeneral
$ 4,075,178———————————
—
Footnote:
(1) Each participant is required to contribute 5% of his or her compensation, and the district matches the amount.
249

Public Retirement Systems Annual Report — Fiscal Year 2011-12
North Tahoe Public Utility District Money Purchase Pension Plan
Contributions
AssetsCash and Short-Term InvestmentsReceivables
InvestmentsOther
Investments, at Fair ValueU.S. Government ObligationsInternational BondsMunicipal BondsDomestic Corporate BondsDomestic Stocks
Total Assets
Mortgages
Accounts PayableInvestment Purchases PayableAccrued ExpensesOther Current Liabilities
Total Liabilities
International Stocks
Net Assets Available for Benefits
Statement of Plan Net Assets
LiabilitiesTotal Additions
InterestDividendsNet Appreciation (Depreciation)Other Investment RevenuesIn Fair Value of Investments
Statement of Changes in Plan Net Assets
$ 4,359,258
Real EstateVenture CapitalOther
Investments
$ —$ 4,359,258
$ —
$ )(9,489
Administration ExpensesOther Expenses
Total DeductionsNet Increase (Decrease) In Plan AssetsBeginning of the Year Net Assets Held
$ 96,477$ )(105,966
as of December 31, 2011 for Period Ending December 31, 2011
$ 4,359,258
Membership 58
—————————
4,216,233
——
143,025
$ ————
6,133—
)(15,622—
Other Revenue
42710,391
$ 4,465,224
Fixed Assets Net of Accumulated DepreciationOther Assets
——
(1)
in Trust for Pension Benefits
in Trust for Pension Benefits
End of the Year Net Assets Held
Investment Expenses
Adjustments —
—
AdditionsContributions
Employer -
Employee -
Other -
GeneralSafetyCombined
CombinedSafetyGeneral
CombinedSafetyGeneral
$ ———
—
—
——
——
DeductionsBenefit Payments
Service Retirement -
Disability -
Other -
Member Refunds -
General
CombinedSafetyGeneralCombinedSafety
CombinedSafetyGeneral
CombinedSafetyGeneral
$ 85,659———————————
—
Comments:The district suspended contributions to the plan in August 2010. As of August 27, 2010, the last contribution was made to the plan and the district switched to a defined benefit plan with CalPERS.
Footnote:
(1) Participant loans. Participants may borrow from their fund accounts a minimum of $1,000, up to a maximum equal to the lesser of $50,000 or 50% of their account balances.
250

Public Retirement Systems Annual Report — Fiscal Year 2011-12
Orange County Water District Money Purchase and Cash Balance Retirement Plans
Contributions
AssetsCash and Short-Term InvestmentsReceivables
InvestmentsOther
Investments, at Fair ValueU.S. Government ObligationsInternational BondsMunicipal BondsDomestic Corporate BondsDomestic Stocks
Total Assets
Mortgages
Accounts PayableInvestment Purchases PayableAccrued ExpensesOther Current Liabilities
Total Liabilities
International Stocks
Net Assets Available for Benefits
Statement of Plan Net Assets
LiabilitiesTotal Additions
InterestDividendsNet Appreciation (Depreciation)Other Investment RevenuesIn Fair Value of Investments
Statement of Changes in Plan Net Assets
$ 62,090,929
Real EstateVenture CapitalOther
Investments
$ —$ 62,090,929
$ —
$ 3,462,122
Administration ExpensesOther Expenses
Total DeductionsNet Increase (Decrease) In Plan AssetsBeginning of the Year Net Assets Held
$ 2,145,422$ 1,316,700
as of December 31, 2011 for Period Ending December 31, 2011
$ 62,090,929
Membership 352
—————————
60,474,439
——
1,616,490
$ ————
332,595605,552
)(1,847,13277,650
Other Revenue
—3,470
$ 60,774,229
Fixed Assets Net of Accumulated DepreciationOther Assets
——
(1)
in Trust for Pension Benefits
in Trust for Pension Benefits
End of the Year Net Assets Held
Investment Expenses
Adjustments —
—
AdditionsContributions
Employer -
Employee -
Other -
GeneralSafetyCombined
CombinedSafetyGeneral
CombinedSafetyGeneral
$ 3,112,588——
—
—
917,447—
263,422—
DeductionsBenefit Payments
Service Retirement -
Disability -
Other -
Member Refunds -
General
CombinedSafetyGeneralCombinedSafety
CombinedSafetyGeneral
CombinedSafetyGeneral
$ 801,379—————
1,340,573—————
—
Comments:The district may elect in any year to contribute any portion or all of each participant's first layer contribution, thereby reducing the employee's contribution by the amount contributed by the district. For the year ended December 31, 2011, the district contributed 3% of the employees' share plus their share of 7.65%, for a total of 10.65% of compensation to each employee's account.
Footnote:
(1) The plan allows participants to borrow up to the lesser of $50,000 or 50.00% of the vested portion of the individual participant's account. The loans are secured by up to one-half of the vested account balance in the participant's account and/or a security interest in the residence of the participant. Loans bear interest at rates ranging from 5.00% to 10.50%. The interest rate is determined at the time the loan is approved.
251

Public Retirement Systems Annual Report — Fiscal Year 2011-12
San Diego Convention Center Corporation Money Purchase Pension Plan
Contributions
AssetsCash and Short-Term InvestmentsReceivables
InvestmentsOther
Investments, at Fair ValueU.S. Government ObligationsInternational BondsMunicipal BondsDomestic Corporate BondsDomestic Stocks
Total Assets
Mortgages
Accounts PayableInvestment Purchases PayableAccrued ExpensesOther Current Liabilities
Total Liabilities
International Stocks
Net Assets Available for Benefits
Statement of Plan Net Assets
LiabilitiesTotal Additions
InterestDividendsNet Appreciation (Depreciation)Other Investment RevenuesIn Fair Value of Investments
Statement of Changes in Plan Net Assets
$ 17,039,706
Real EstateVenture CapitalOther
Investments
$ —$ 17,039,706
$ —
$ 1,366,507
Administration ExpensesOther Expenses
Total DeductionsNet Increase (Decrease) In Plan AssetsBeginning of the Year Net Assets Held
$ 787,107$ 579,400
as of December 31, 2011 for Period Ending December 31, 2011
$ 17,039,706
Membership 285
—————————
16,277,277
——
762,429
$ ————
37,581194,039
)(316,256—
Other Revenue
34,019—
$ 16,460,306
Fixed Assets Net of Accumulated DepreciationOther Assets
——
(1)
(2)
in Trust for Pension Benefits
in Trust for Pension Benefits
End of the Year Net Assets Held
Investment Expenses
Adjustments —
20,361
AdditionsContributions
Employer -
Employee -
Other -
GeneralSafetyCombined
CombinedSafetyGeneral
CombinedSafetyGeneral
$ 1,430,782——
—
—
——
——
DeductionsBenefit Payments
Service Retirement -
Disability -
Other -
Member Refunds -
General
CombinedSafetyGeneralCombinedSafety
CombinedSafetyGeneral
CombinedSafetyGeneral
$ —————————
753,088——
—
Comments:The accounting firm of Considine & Considine has not audited or reviewed the financial statements. The plan administrator has obtained a certification from Wells Fargo, the trustee, as of and for the year ended December 31, 2011, that the information provided to the plan administrator by Wells Fargo is complete and accurate.
Footnote:
(1) Participant loans are permitted; however, loan amounts may not exceed the lesser of $50,000 or 50% of the participants' vested account balance, subject to a minimum loan amount of $1,000.
(2) Employer contributes an amount equal to 10% of the total annual compensation of all participants who have earned at least 1,000 hours of service during the plan year. The plan does not permit voluntary contributions.
252

Public Retirement Systems Annual Report — Fiscal Year 2011-12
San Diego Data Processing Corporation Money Purchase Plan
Contributions
AssetsCash and Short-Term InvestmentsReceivables
InvestmentsOther
Investments, at Fair ValueU.S. Government ObligationsInternational BondsMunicipal BondsDomestic Corporate BondsDomestic Stocks
Total Assets
Mortgages
Accounts PayableInvestment Purchases PayableAccrued ExpensesOther Current Liabilities
Total Liabilities
International Stocks
Net Assets Available for Benefits
Statement of Plan Net Assets
LiabilitiesTotal Additions
InterestDividendsNet Appreciation (Depreciation)Other Investment RevenuesIn Fair Value of Investments
Statement of Changes in Plan Net Assets
$ 64,071,843
Real EstateVenture CapitalOther
Investments
$ —$ 64,071,843
$ —
$ 2,648,921
Administration ExpensesOther Expenses
Total DeductionsNet Increase (Decrease) In Plan AssetsBeginning of the Year Net Assets Held
$ 6,688,655$ )(4,039,734
as of December 31, 2011 for Period Ending December 31, 2011
$ 64,071,843
Membership 318
—————————
63,348,607
169,629—
553,607
$ ————
23,4871,270,176
)(2,953,062—
Other Revenue
——
$ 68,111,577
Fixed Assets Net of Accumulated DepreciationOther Assets
——
(1)
in Trust for Pension Benefits
in Trust for Pension Benefits
End of the Year Net Assets Held
Investment Expenses
Adjustments —
—
AdditionsContributions
Employer -
Employee -
Other -
GeneralSafetyCombined
CombinedSafetyGeneral
CombinedSafetyGeneral
$ 3,437,408——
—
—
873,669—
——
DeductionsBenefit Payments
Service Retirement -
Disability -
Other -
Member Refunds -
General
CombinedSafetyGeneralCombinedSafety
CombinedSafetyGeneral
CombinedSafetyGeneral
$ 12,660————————
6,675,995——
)(2,757
Comments:The system consists of three retirement plans - 401(a), 403(b), and 457(b). Only the first two plans are included in this publication.
San Diego Data Processing Corporation contributes 20% of plan-defined eligible wages for each participant in the 401(a) plan. There are no employer contributions for the 403(b) plan.
Footnote:
(1) Participants may borrow from the 401(a) plan up to the lesser of 50% of his or her vested account balance or a maximum of $50,000. All loans are to be repaid through payroll deduction over a repayment period not to exceed three years.
253

Public Retirement Systems Annual Report — Fiscal Year 2011-12
Saucelito Irrigation District Employees' Money Purchase Pension Plan
Contributions
AssetsCash and Short-Term InvestmentsReceivables
InvestmentsOther
Investments, at Fair ValueU.S. Government ObligationsInternational BondsMunicipal BondsDomestic Corporate BondsDomestic Stocks
Total Assets
Mortgages
Accounts PayableInvestment Purchases PayableAccrued ExpensesOther Current Liabilities
Total Liabilities
International Stocks
Net Assets Available for Benefits
Statement of Plan Net Assets
LiabilitiesTotal Additions
InterestDividendsNet Appreciation (Depreciation)Other Investment RevenuesIn Fair Value of Investments
Statement of Changes in Plan Net Assets
$ 655,842
Real EstateVenture CapitalOther
Investments
$ 301,111$ 354,731
$ —
$ 32,727
Administration ExpensesOther Expenses
Total DeductionsNet Increase (Decrease) In Plan AssetsBeginning of the Year Net Assets Held
$ 301,111$ )(268,384
as of December 31, 2011 for Period Ending December 31, 2011
$ 354,731
Membership 3
————
655,842—————
———
$ 301,111———
5,852—
)(6,420—
Other Revenue
——
$ 623,115
Fixed Assets Net of Accumulated DepreciationOther Assets
——
(1)
in Trust for Pension Benefits
in Trust for Pension Benefits
End of the Year Net Assets Held
Investment Expenses
Adjustments —
—
AdditionsContributions
Employer -
Employee -
Other -
GeneralSafetyCombined
CombinedSafetyGeneral
CombinedSafetyGeneral
$ 22,197——
—
—
11,098—
——
DeductionsBenefit Payments
Service Retirement -
Disability -
Other -
Member Refunds -
General
CombinedSafetyGeneralCombinedSafety
CombinedSafetyGeneral
CombinedSafetyGeneral
$ 301,111———————————
—
Footnote:
(1) The district contributes 4% to 12% of employees' compensation to the plan.
254

Public Retirement Systems Annual Report — Fiscal Year 2011-12
Semitropic Water Storage District 401(K) Plan
Contributions
AssetsCash and Short-Term InvestmentsReceivables
InvestmentsOther
Investments, at Fair ValueU.S. Government ObligationsInternational BondsMunicipal BondsDomestic Corporate BondsDomestic Stocks
Total Assets
Mortgages
Accounts PayableInvestment Purchases PayableAccrued ExpensesOther Current Liabilities
Total Liabilities
International Stocks
Net Assets Available for Benefits
Statement of Plan Net Assets
LiabilitiesTotal Additions
InterestDividendsNet Appreciation (Depreciation)Other Investment RevenuesIn Fair Value of Investments
Statement of Changes in Plan Net Assets
$ 5,358,964
Real EstateVenture CapitalOther
Investments
$ —$ 5,358,964
$ —
$ 217,933
Administration ExpensesOther Expenses
Total DeductionsNet Increase (Decrease) In Plan AssetsBeginning of the Year Net Assets Held
$ 127,845$ 90,088
as of December 31, 2011 for Period Ending December 31, 2011
$ 5,358,964
Membership 43
—————————
5,094,862
——
264,102
$ ————
12,295—
)(203,410—
Other Revenue
854—
$ 5,268,876
Fixed Assets Net of Accumulated DepreciationOther Assets
——
in Trust for Pension Benefits
in Trust for Pension Benefits
End of the Year Net Assets Held
Investment Expenses
Adjustments —
—
AdditionsContributions
Employer -
Employee -
Other -
GeneralSafetyCombined
CombinedSafetyGeneral
CombinedSafetyGeneral
$ 268,470——
—
—
140,578—
——
DeductionsBenefit Payments
Service Retirement -
Disability -
Other -
Member Refunds -
General
CombinedSafetyGeneralCombinedSafety
CombinedSafetyGeneral
CombinedSafetyGeneral
$ 126,991———————————
—
Comments:The plan sponsor contributes 10% of pre-tax annual compensation for participating employees, if the participating employee contributes at least 4%.
255

Public Retirement Systems Annual Report — Fiscal Year 2011-12
Southeastern Economic Development Corporation 403(b) Tax Sheltered Plan
Contributions
AssetsCash and Short-Term InvestmentsReceivables
InvestmentsOther
Investments, at Fair ValueU.S. Government ObligationsInternational BondsMunicipal BondsDomestic Corporate BondsDomestic Stocks
Total Assets
Mortgages
Accounts PayableInvestment Purchases PayableAccrued ExpensesOther Current Liabilities
Total Liabilities
International Stocks
Net Assets Available for Benefits
Statement of Plan Net Assets
LiabilitiesTotal Additions
InterestDividendsNet Appreciation (Depreciation)Other Investment RevenuesIn Fair Value of Investments
Statement of Changes in Plan Net Assets
$ 396,178
Real EstateVenture CapitalOther
Investments
$ —$ 396,178
$ —
$ 91,954
Administration ExpensesOther Expenses
Total DeductionsNet Increase (Decrease) In Plan AssetsBeginning of the Year Net Assets Held
$ 521,249$ )(429,295
as of June 30, 2012 for Period Ending June 30, 2012
$ 396,178
Membership 11
—————————
396,178
———
$ ————
1,84619,567
)(23,992—
Other Revenue
1,269—
$ 825,473
Fixed Assets Net of Accumulated DepreciationOther Assets
——
(1)
in Trust for Pension Benefits
in Trust for Pension Benefits
End of the Year Net Assets Held
Investment Expenses
Adjustments —
—
AdditionsContributions
Employer -
Employee -
Other -
GeneralSafetyCombined
CombinedSafetyGeneral
CombinedSafetyGeneral
$ 80,133——
—
—
14,400—
——
DeductionsBenefit Payments
Service Retirement -
Disability -
Other -
Member Refunds -
General
CombinedSafetyGeneralCombinedSafety
CombinedSafetyGeneral
CombinedSafetyGeneral
$ ——————
519,980—————
—
Comments:Employer contributions to the plan are based on 12% of each participant's compensation.
On July 25, 2012, the SEDC Board approved the termination of the plan. All plan assets were distributed to participants by December 5, 2012. Footnote:
(1) Participant loans. Prior to January 1, 2009, the plan allows participants to borrow against their retirement benefits. However, after that date, new loans are not permitted.
256

Public Retirement Systems Annual Report — Fiscal Year 2011-12
Southgate Recreation and Park District Retirement System
Contributions
AssetsCash and Short-Term InvestmentsReceivables
InvestmentsOther
Investments, at Fair ValueU.S. Government ObligationsInternational BondsMunicipal BondsDomestic Corporate BondsDomestic Stocks
Total Assets
Mortgages
Accounts PayableInvestment Purchases PayableAccrued ExpensesOther Current Liabilities
Total Liabilities
International Stocks
Net Assets Available for Benefits
Statement of Plan Net Assets
LiabilitiesTotal Additions
InterestDividendsNet Appreciation (Depreciation)Other Investment RevenuesIn Fair Value of Investments
Statement of Changes in Plan Net Assets
$ 3,759,680
Real EstateVenture CapitalOther
Investments
$ —$ 3,759,680
$ 2,225,709
$ 317,318
Administration ExpensesOther Expenses
Total DeductionsNet Increase (Decrease) In Plan AssetsBeginning of the Year Net Assets Held
$ 160,768$ 156,550
as of June 30, 2012 for Period Ending June 30, 2012
$ 3,759,680
Membership 97
———
251,2541,134,751
124,153————
11,039—
12,774
$ ————
614—
25,475—
Other Revenue
508—
$ 3,603,130
Fixed Assets Net of Accumulated DepreciationOther Assets
——
(1)
in Trust for Pension Benefits
in Trust for Pension Benefits
End of the Year Net Assets Held
Investment Expenses
Adjustments —
—
AdditionsContributions
Employer -
Employee -
Other -
GeneralSafetyCombined
CombinedSafetyGeneral
CombinedSafetyGeneral
$ 284,629——
—
—
6,600—
——
DeductionsBenefit Payments
Service Retirement -
Disability -
Other -
Member Refunds -
General
CombinedSafetyGeneralCombinedSafety
CombinedSafetyGeneral
CombinedSafetyGeneral
$ 160,260———————————
—
Comments:The Southgate Recreation and Park District is the administrator for the plan. The ICMA Retirement Corporation is the trustee of the funds and advises on plan documents, legal issues, fees, and issues quarterly statements to plan participants. ICMA offers participants various mutual funds and money market funds to invest their contributions. Participants with less than one year of service contribute 5% of eligible compensation and the plan sponsor contributes an additional 5%. After the first year, the plan sponsor contributes 10%.
Footnote:
(1) Notes receivable from participants are measured at their unpaid balance plus any accrued but unpaid interest. Delinquent participant loans are reclassified as distributions based on the terms of the plan document.
257

Public Retirement Systems Annual Report — Fiscal Year 2011-12
Tranquillity Irrigation District Money Purchase Thrift Plan
Contributions
AssetsCash and Short-Term InvestmentsReceivables
InvestmentsOther
Investments, at Fair ValueU.S. Government ObligationsInternational BondsMunicipal BondsDomestic Corporate BondsDomestic Stocks
Total Assets
Mortgages
Accounts PayableInvestment Purchases PayableAccrued ExpensesOther Current Liabilities
Total Liabilities
International Stocks
Net Assets Available for Benefits
Statement of Plan Net Assets
LiabilitiesTotal Additions
InterestDividendsNet Appreciation (Depreciation)Other Investment RevenuesIn Fair Value of Investments
Statement of Changes in Plan Net Assets
$ 758,214
Real EstateVenture CapitalOther
Investments
$ —$ 758,214
$ 624,344
$ 122,783
Administration ExpensesOther Expenses
Total DeductionsNet Increase (Decrease) In Plan AssetsBeginning of the Year Net Assets Held
$ 50$ 122,733
as of December 31, 2011 for Period Ending December 31, 2011
$ 758,214
Membership 7
——————————
——
133,870
$ ————
1,42613,294
)(11,312—
Other Revenue
—50
$ 635,481
Fixed Assets Net of Accumulated DepreciationOther Assets
——
in Trust for Pension Benefits
in Trust for Pension Benefits
End of the Year Net Assets Held
Investment Expenses
Adjustments —
—
AdditionsContributions
Employer -
Employee -
Other -
GeneralSafetyCombined
CombinedSafetyGeneral
CombinedSafetyGeneral
$ 80,014——
—
—
39,361—
——
DeductionsBenefit Payments
Service Retirement -
Disability -
Other -
Member Refunds -
General
CombinedSafetyGeneralCombinedSafety
CombinedSafetyGeneral
CombinedSafetyGeneral
$ ————————————
—
Comments:The district contributes each year on behalf of each active plan participant, an amount equal to 17.35% of the participant's annual compensation. As a condition of sharing in employer contributions, each participant agree to contribute at least 7.65% of his or her compensation to the plan.
258

Public Retirement Systems Annual Report — Fiscal Year 2011-12
Truckee-Donner Recreation and Park District Money Purchase Pension Plan
Contributions
AssetsCash and Short-Term InvestmentsReceivables
InvestmentsOther
Investments, at Fair ValueU.S. Government ObligationsInternational BondsMunicipal BondsDomestic Corporate BondsDomestic Stocks
Total Assets
Mortgages
Accounts PayableInvestment Purchases PayableAccrued ExpensesOther Current Liabilities
Total Liabilities
International Stocks
Net Assets Available for Benefits
Statement of Plan Net Assets
LiabilitiesTotal Additions
InterestDividendsNet Appreciation (Depreciation)Other Investment RevenuesIn Fair Value of Investments
Statement of Changes in Plan Net Assets
$ 1,530,201
Real EstateVenture CapitalOther
Investments
$ —$ 1,530,201
$ 392
$ 102,917
Administration ExpensesOther Expenses
Total DeductionsNet Increase (Decrease) In Plan AssetsBeginning of the Year Net Assets Held
$ 6,782$ 96,135
as of December 31, 2011 for Period Ending December 31, 2011
$ 1,530,201
Membership 50
—————————
1,386,707
143,102——
$ ————
5523,858
)(35,057—
Other Revenue
3,464—
$ 1,434,066
Fixed Assets Net of Accumulated DepreciationOther Assets
——
(1)
in Trust for Pension Benefits
in Trust for Pension Benefits
End of the Year Net Assets Held
Investment Expenses
Adjustments —
—
AdditionsContributions
Employer -
Employee -
Other -
GeneralSafetyCombined
CombinedSafetyGeneral
CombinedSafetyGeneral
$ 143,102——
—
—
——
——
DeductionsBenefit Payments
Service Retirement -
Disability -
Other -
Member Refunds -
General
CombinedSafetyGeneralCombinedSafety
CombinedSafetyGeneral
CombinedSafetyGeneral
$ 3,318———————————
)(9,538
Footnote:
(1) The district contributes 8% of covered employees' gross wages. No employee contributions are allowed.
259

Public Retirement Systems Annual Report — Fiscal Year 2011-12
Tulare Lake Basin Water Storage District Pension Trust Fund
Contributions
AssetsCash and Short-Term InvestmentsReceivables
InvestmentsOther
Investments, at Fair ValueU.S. Government ObligationsInternational BondsMunicipal BondsDomestic Corporate BondsDomestic Stocks
Total Assets
Mortgages
Accounts PayableInvestment Purchases PayableAccrued ExpensesOther Current Liabilities
Total Liabilities
International Stocks
Net Assets Available for Benefits
Statement of Plan Net Assets
LiabilitiesTotal Additions
InterestDividendsNet Appreciation (Depreciation)Other Investment RevenuesIn Fair Value of Investments
Statement of Changes in Plan Net Assets
$ 1,506,538
Real EstateVenture CapitalOther
Investments
$ —$ 1,506,538
$ 25,660
$ 59,995
Administration ExpensesOther Expenses
Total DeductionsNet Increase (Decrease) In Plan AssetsBeginning of the Year Net Assets Held
$ 4,273$ 55,722
as of December 31, 2011 for Period Ending December 31, 2011
$ 1,506,538
Membership 17
—————————
1,478,443
1,3131,122
—
$ ————
4538,549
)(65,1502,182
Other Revenue
—3,192
$ 1,450,816
Fixed Assets Net of Accumulated DepreciationOther Assets
——
in Trust for Pension Benefits
in Trust for Pension Benefits
End of the Year Net Assets Held
Investment Expenses
Adjustments —
—
AdditionsContributions
Employer -
Employee -
Other -
GeneralSafetyCombined
CombinedSafetyGeneral
CombinedSafetyGeneral
$ 63,277——
—
—
21,092—
——
DeductionsBenefit Payments
Service Retirement -
Disability -
Other -
Member Refunds -
General
CombinedSafetyGeneralCombinedSafety
CombinedSafetyGeneral
CombinedSafetyGeneral
$ 1,081———————————
—
Comments:The district contribute 9% of allowable compensation of all eligible participants. Each participant is required to contribute 3% of his or her annual allowable compensation.
260

Public Retirement Systems Annual Report — Fiscal Year 2011-12
Valley Sanitary District Money Purchase Pension Plan
Contributions
AssetsCash and Short-Term InvestmentsReceivables
InvestmentsOther
Investments, at Fair ValueU.S. Government ObligationsInternational BondsMunicipal BondsDomestic Corporate BondsDomestic Stocks
Total Assets
Mortgages
Accounts PayableInvestment Purchases PayableAccrued ExpensesOther Current Liabilities
Total Liabilities
International Stocks
Net Assets Available for Benefits
Statement of Plan Net Assets
LiabilitiesTotal Additions
InterestDividendsNet Appreciation (Depreciation)Other Investment RevenuesIn Fair Value of Investments
Statement of Changes in Plan Net Assets
$ 415,903
Real EstateVenture CapitalOther
Investments
$ —$ 415,903
$ —
$ 33,115
Administration ExpensesOther Expenses
Total DeductionsNet Increase (Decrease) In Plan AssetsBeginning of the Year Net Assets Held
$ —$ 33,115
as of June 30, 2012 for Period Ending June 30, 2012
$ 415,903
Membership 2
—————————
414,164
1,739——
$ ————
——
4,881—
Other Revenue
——
$ 382,788
Fixed Assets Net of Accumulated DepreciationOther Assets
——
in Trust for Pension Benefits
in Trust for Pension Benefits
End of the Year Net Assets Held
Investment Expenses
Adjustments —
—
AdditionsContributions
Employer -
Employee -
Other -
GeneralSafetyCombined
CombinedSafetyGeneral
CombinedSafetyGeneral
$ 28,234——
—
—
——
——
DeductionsBenefit Payments
Service Retirement -
Disability -
Other -
Member Refunds -
General
CombinedSafetyGeneralCombinedSafety
CombinedSafetyGeneral
CombinedSafetyGeneral
$ ————————————
—
Comments:The accounting firm of Teaman, Ramirez and Smith, Inc. was instructed by the district's management not to audit or review the investment information. The plan administrator has obtained a certification from the trustee as of and for the year ended June 30, 2012, that the information provided to the plan administrator by Nationwide Life Insurance Company is complete and accurate.
Effective July 1, 2011, the employer contribution percentage to the plan remained at 15.757% of covered payroll.
261

Public Retirement Systems Annual Report — Fiscal Year 2011-12
West Valley Mosquito Vector Control District Money Purchase Pension Plan
Contributions
AssetsCash and Short-Term InvestmentsReceivables
InvestmentsOther
Investments, at Fair ValueU.S. Government ObligationsInternational BondsMunicipal BondsDomestic Corporate BondsDomestic Stocks
Total Assets
Mortgages
Accounts PayableInvestment Purchases PayableAccrued ExpensesOther Current Liabilities
Total Liabilities
International Stocks
Net Assets Available for Benefits
Statement of Plan Net Assets
LiabilitiesTotal Additions
InterestDividendsNet Appreciation (Depreciation)Other Investment RevenuesIn Fair Value of Investments
Statement of Changes in Plan Net Assets
$ —
Real EstateVenture CapitalOther
Investments
$ —$ —
$ —
$ —
Administration ExpensesOther Expenses
Total DeductionsNet Increase (Decrease) In Plan AssetsBeginning of the Year Net Assets Held
$ —$ —
as of June 30, 2012 for Period Ending June 30, 2012
$ —
Membership 10
——————————
———
$ ————
————
Other Revenue
——
$ 822,106
Fixed Assets Net of Accumulated DepreciationOther Assets
——
in Trust for Pension Benefits
in Trust for Pension Benefits
End of the Year Net Assets Held
Investment Expenses
Adjustments )(822,106
—
AdditionsContributions
Employer -
Employee -
Other -
GeneralSafetyCombined
CombinedSafetyGeneral
CombinedSafetyGeneral
$ ———
—
—
——
——
DeductionsBenefit Payments
Service Retirement -
Disability -
Other -
Member Refunds -
General
CombinedSafetyGeneralCombinedSafety
CombinedSafetyGeneral
CombinedSafetyGeneral
$ ————————————
—
Comments:In August 2010, the district received confirmation from the retirement investment firm,TIAA-CREF, that the district has formally terminated this plan and that this is the final report.
262

DEFINED CONTRIBUTION SYSTEMS
School District Systems

This Page Intentionally Left Blank

Public Retirement Systems Annual Report — Fiscal Year 2011-12
Grossmont-Cuyamaca Community College District Pension Eligible Alternative Plan
Contributions
AssetsCash and Short-Term InvestmentsReceivables
InvestmentsOther
Investments, at Fair ValueU.S. Government ObligationsInternational BondsMunicipal BondsDomestic Corporate BondsDomestic Stocks
Total Assets
Mortgages
Accounts PayableInvestment Purchases PayableAccrued ExpensesOther Current Liabilities
Total Liabilities
International Stocks
Net Assets Available for Benefits
Statement of Plan Net Assets
LiabilitiesTotal Additions
InterestDividendsNet Appreciation (Depreciation)Other Investment RevenuesIn Fair Value of Investments
Statement of Changes in Plan Net Assets
$ 6,538,494
Real EstateVenture CapitalOther
Investments
$ —$ 6,538,494
$ 72,244
$ 598,050
Administration ExpensesOther Expenses
Total DeductionsNet Increase (Decrease) In Plan Assets
Beginning of the Year Net Assets Held
$ 460,923$ 137,127
as of June 30, 2012 for Period Ending June 30, 2012
$ 6,538,494
Membership 3,822
—65,796
—1,972,8133,600,914
633,088—
179,969——
13,544—
126
$ ————
17,246138,016
—-4,972
Other Revenue
108,380—
6,401,367
Fixed Assets Net of Accumulated DepreciationOther Assets
——
in Trust for Pension Benefits
in Trust for Pension Benefits
End of the Year Net Assets HeldAdjustments —
126Investment Expenses
AdditionsContributions
Employer -
Employee -
Other -
GeneralSafetyCombined
CombinedSafetyGeneral
CombinedSafetyGeneral
$ 223,851——
—
—
223,783—
——
DeductionsBenefit Payments
Service Retirement -
Disability -
Other -
Member Refunds -
General
CombinedSafetyGeneralCombinedSafety
CombinedSafetyGeneral
CombinedSafetyGeneral
$ —————————
352,543——
—
Comments:Employer contributes 3.75% of eligible wages, and 3.75% are withheld from employees' checks for deposit under the plan.
265

Public Retirement Systems Annual Report — Fiscal Year 2011-12
Leadership Public Schools 401(a) Retirement Plan
Contributions
AssetsCash and Short-Term InvestmentsReceivables
InvestmentsOther
Investments, at Fair ValueU.S. Government ObligationsInternational BondsMunicipal BondsDomestic Corporate BondsDomestic Stocks
Total Assets
Mortgages
Accounts PayableInvestment Purchases PayableAccrued ExpensesOther Current Liabilities
Total Liabilities
International Stocks
Net Assets Available for Benefits
Statement of Plan Net Assets
LiabilitiesTotal Additions
InterestDividendsNet Appreciation (Depreciation)Other Investment RevenuesIn Fair Value of Investments
Statement of Changes in Plan Net Assets
$ 2,422,100
Real EstateVenture CapitalOther
Investments
$ —$ 2,422,100
$ —
$ 324,286
Administration ExpensesOther Expenses
Total DeductionsNet Increase (Decrease) In Plan Assets
Beginning of the Year Net Assets Held
$ 168,134$ 156,152
as of December 31, 2011 for Period Ending December 31, 2011
$ 2,422,100
Membership 129
—————————
2,360,487
——
61,613
$ ————
3,55946,292
-133,798—
Other Revenue
12,682—
2,265,948
Fixed Assets Net of Accumulated DepreciationOther Assets
——
(1)
in Trust for Pension Benefits
in Trust for Pension Benefits
End of the Year Net Assets HeldAdjustments —
—Investment Expenses
AdditionsContributions
Employer -
Employee -
Other -
GeneralSafetyCombined
CombinedSafetyGeneral
CombinedSafetyGeneral
$ 149,732——
—
—
200,201—
58,300—
DeductionsBenefit Payments
Service Retirement -
Disability -
Other -
Member Refunds -
General
CombinedSafetyGeneralCombinedSafety
CombinedSafetyGeneral
CombinedSafetyGeneral
$ ——————
155,452—————
—
Comments:The accounting firm of Vicenti, Lloyd and Stutzman LLP has not audited or reviewed the investment assets of the plan. The plan administrator has obtained a certification from the trustee as of and for the year ended December 31, 2011, that the information provided to the plan administrator by Charles Schwab Trust Company is complete and accurate.
Participants contribute an amount equal to 8% of eligible compensation. The employer contributes an amount equal to 100% of the amount that each participant contributes. Participants may also contribute amounts representing distributions from other qualified defined benefit or contribution plans.
Footnote:
(1) Participant loans. Participants may borrow up to the lesser of 50% of their vested account balance or $50,000.
266

Public Retirement Systems Annual Report — Fiscal Year 2011-12
San Diego Community College District A.P.P.L.E. Program
Contributions
AssetsCash and Short-Term InvestmentsReceivables
InvestmentsOther
Investments, at Fair ValueU.S. Government ObligationsInternational BondsMunicipal BondsDomestic Corporate BondsDomestic Stocks
Total Assets
Mortgages
Accounts PayableInvestment Purchases PayableAccrued ExpensesOther Current Liabilities
Total Liabilities
International Stocks
Net Assets Available for Benefits
Statement of Plan Net Assets
LiabilitiesTotal Additions
InterestDividendsNet Appreciation (Depreciation)Other Investment RevenuesIn Fair Value of Investments
Statement of Changes in Plan Net Assets
$ 13,596,633
Real EstateVenture CapitalOther
Investments
$ —$ 13,596,633
$ —
$ 1,235,851
Administration ExpensesOther Expenses
Total DeductionsNet Increase (Decrease) In Plan Assets
Beginning of the Year Net Assets Held
$ 613,439$ 622,412
as of June 30, 2012 for Period Ending June 30, 2012
$ 13,596,633
Membership 10,526
—————————
13,559,116
37,517——
$ ————
320,501—
-48,253—
Other Revenue
——
12,974,221
Fixed Assets Net of Accumulated DepreciationOther Assets
——
in Trust for Pension Benefits
in Trust for Pension Benefits
End of the Year Net Assets HeldAdjustments —
—Investment Expenses
AdditionsContributions
Employer -
Employee -
Other -
GeneralSafetyCombined
CombinedSafetyGeneral
CombinedSafetyGeneral
$ 491,138——
—
—
472,465—
——
DeductionsBenefit Payments
Service Retirement -
Disability -
Other -
Member Refunds -
General
CombinedSafetyGeneralCombinedSafety
CombinedSafetyGeneral
CombinedSafetyGeneral
$ ——————
613,439—————
—
Comments:The plan contributions are shared among the plan and employees. The employer contributes 3.75% of eligible wages with the same rate withheld from employees' checks for deposit into the plan.
267

This Page Intentionally Left Blank

DEFINED CONTRIBUTION SYSTEMS
Other Systems

This Page Intentionally Left Blank

Public Retirement Systems Annual Report — Fiscal Year 2011-12
County Of San Diego IHSS Public Authority Pension Plan
Contributions
AssetsCash and Short-Term InvestmentsReceivables
InvestmentsOther
Investments, at Fair ValueU.S. Government ObligationsInternational BondsMunicipal BondsDomestic Corporate BondsDomestic Stocks
Total Assets
Mortgages
Accounts PayableInvestment Purchases PayableAccrued ExpensesOther Current Liabilities
Total Liabilities
International Stocks
Net Assets Available for Benefits
Statement of Plan Net Assets
LiabilitiesTotal Additions
InterestDividendsNet Appreciation (Depreciation)Other Investment RevenuesIn Fair Value of Investments
Statement of Changes in Plan Net Assets
$ 1,388,678
Real EstateVenture CapitalOther
Investments
$ 2,895$ 1,385,783
$ 41,317
$ 207,745
Administration ExpensesOther Expenses
Total DeductionsNet Increase (Decrease) In Plan Assets
Beginning of the Year Net Assets Held
$ 10,842$ 196,903
as of June 30, 2012 for Period Ending June 30, 2012
$ 1,385,783
Membership 50
—————————
1,302,595
41,871—
2,895
$ ——
2,895—
4837,180
)(12,637—
Other Revenue
10,783—
$ 1,188,880
Fixed Assets Net of Accumulated DepreciationOther Assets
——
in Trust for Pension Benefits
in Trust for Pension Benefits
End of the Year Net Assets Held
Investment Expenses
—Adjustments
10,783
AdditionsContributions
Employer -
Employee -
Other -
GeneralSafetyCombined
CombinedSafetyGeneral
CombinedSafetyGeneral
$ 172,371——
—
—
——
——
DeductionsBenefit Payments
Service Retirement -
Disability -
Other -
Member Refunds -
General
CombinedSafetyGeneralCombinedSafety
CombinedSafetyGeneral
CombinedSafetyGeneral
$ ——————59—————
—
Comments:For each plan year, the employer shall contribute on behalf of each active (eligible) participant an amount equal to 8% of compensation, including compensation paid during the introductory period. No employee voluntary contributions are permitted under this plan.
271

Public Retirement Systems Annual Report — Fiscal Year 2011-12
Housing Authority of the County of Tulare Defined Contribution Pension Plan
Contributions
AssetsCash and Short-Term InvestmentsReceivables
InvestmentsOther
Investments, at Fair ValueU.S. Government ObligationsInternational BondsMunicipal BondsDomestic Corporate BondsDomestic Stocks
Total Assets
Mortgages
Accounts PayableInvestment Purchases PayableAccrued ExpensesOther Current Liabilities
Total Liabilities
International Stocks
Net Assets Available for Benefits
Statement of Plan Net Assets
LiabilitiesTotal Additions
InterestDividendsNet Appreciation (Depreciation)Other Investment RevenuesIn Fair Value of Investments
Statement of Changes in Plan Net Assets
$ 8,977,931
Real EstateVenture CapitalOther
Investments
$ 18,000$ 8,959,931
$ 8,886
$ 908,363
Administration ExpensesOther Expenses
Total DeductionsNet Increase (Decrease) In Plan Assets
Beginning of the Year Net Assets Held
$ 418,085$ 490,278
as of December 31, 2011 for Period Ending December 31, 2011
$ 8,959,931
Membership 87
————
8,969,045—————
———
$ 18,000———
45—
20,605—
Other Revenue
36,1497,386
$ 8,469,653
Fixed Assets Net of Accumulated DepreciationOther Assets
——
in Trust for Pension Benefits
in Trust for Pension Benefits
End of the Year Net Assets Held
Investment Expenses
—Adjustments
—
AdditionsContributions
Employer -
Employee -
Other -
GeneralSafetyCombined
CombinedSafetyGeneral
CombinedSafetyGeneral
$ 887,713——
—
—
——
——
DeductionsBenefit Payments
Service Retirement -
Disability -
Other -
Member Refunds -
General
CombinedSafetyGeneralCombinedSafety
CombinedSafetyGeneral
CombinedSafetyGeneral
$ 374,550———————————
—
Comments:The contribution limits to the plan depend on the participant's date of hire. Participants hired prior to May 1, 2001, may contribute up to 18% of pretax annual compensation. Participants hired subsequent to May 1, 2001, may contribute up to 12% of annual pretax compensation.
272

Public Retirement Systems Annual Report — Fiscal Year 2011-12
PARS Participant Directed Investment Program Trust
Contributions
AssetsCash and Short-Term InvestmentsReceivables
InvestmentsOther
Investments, at Fair ValueU.S. Government ObligationsInternational BondsMunicipal BondsDomestic Corporate BondsDomestic Stocks
Total Assets
Mortgages
Accounts PayableInvestment Purchases PayableAccrued ExpensesOther Current Liabilities
Total Liabilities
International Stocks
Net Assets Available for Benefits
Statement of Plan Net Assets
LiabilitiesTotal Additions
InterestDividendsNet Appreciation (Depreciation)Other Investment RevenuesIn Fair Value of Investments
Statement of Changes in Plan Net Assets
$ 33,703,811
Real EstateVenture CapitalOther
Investments
$ 13,544$ 33,690,267
$ 963,515
$ 5,837,384
Administration ExpensesOther Expenses
Total DeductionsNet Increase (Decrease) In Plan Assets
Beginning of the Year Net Assets Held
$ 4,162,193$ 1,675,191
as of June 30, 2011 for Period Ending June 30, 2011
$ 33,690,267
Membership 3,925
———
2,193,195—————
30,547,101
———
$ ——
13,544—
231,337—
)(284,136—
Other Revenue
135,380—
$ 32,015,076
Fixed Assets Net of Accumulated DepreciationOther Assets
——
(1)
in Trust for Pension Benefits
in Trust for Pension Benefits
End of the Year Net Assets Held
Investment Expenses
—Adjustments
1,260,217
AdditionsContributions
Employer -
Employee -
Other -
GeneralSafetyCombined
CombinedSafetyGeneral
CombinedSafetyGeneral
$ 3,069,621——
—
—
1,561,380—
——
DeductionsBenefit Payments
Service Retirement -
Disability -
Other -
Member Refunds -
General
CombinedSafetyGeneralCombinedSafety
CombinedSafetyGeneral
CombinedSafetyGeneral
$ 2,417,048————————
1,609,765——
)(1,035
Comments:For a majority of the PARS plans, members who are eligible for a distribution through termination, retirement, or disability have two options for receiving their benefits: 1) lump sum distribution or 2) rollover to another retirement plan. Both options result in these members no longer having balances with PARS and no longer being members of the plan. As a result, they are not classified as Service Retired, Service Disability, Ordinary Disability, or Survivor members of the PARS retirement plan. PARS does not actively pay any periodic payments. Instead, annuities will be purchased from an outside company for any periodic payments that are to be made.
Footnote:
(1) Transfers in consisting of funds received for new plans of the trust.
273

Public Retirement Systems Annual Report — Fiscal Year 2011-12
Public Agency Retirement System (PARS)
Contributions
AssetsCash and Short-Term InvestmentsReceivables
InvestmentsOther
Investments, at Fair ValueU.S. Government ObligationsInternational BondsMunicipal BondsDomestic Corporate BondsDomestic Stocks
Total Assets
Mortgages
Accounts PayableInvestment Purchases PayableAccrued ExpensesOther Current Liabilities
Total Liabilities
International Stocks
Net Assets Available for Benefits
Statement of Plan Net Assets
LiabilitiesTotal Additions
InterestDividendsNet Appreciation (Depreciation)Other Investment RevenuesIn Fair Value of Investments
Statement of Changes in Plan Net Assets
$ 374,856,514
Real EstateVenture CapitalOther
Investments
$ 179,289$ 374,677,225
$ 82,212,673
$ 35,843,986
Administration ExpensesOther Expenses
Total DeductionsNet Increase (Decrease) In Plan Assets
Beginning of the Year Net Assets Held
$ 40,185,449$ )(4,341,463
as of June 30, 2012 for Period Ending June 30, 2012
$ 374,677,225
Membership 228,167
———
124,917,581—————
165,437,243
2,289,017——
$ ——
179,289—
5,511,589—
)(1,643,670—
Other Revenue
2,492,12233,251
$ 379,018,688
Fixed Assets Net of Accumulated DepreciationOther Assets
——
(1)
(2)
in Trust for Pension Benefits
in Trust for Pension Benefits
End of the Year Net Assets Held
Investment Expenses
—Adjustments
33,251
AdditionsContributions
Employer -
Employee -
Other -
GeneralSafetyCombined
CombinedSafetyGeneral
CombinedSafetyGeneral
$ 12,609,156——
—
—
19,481,824—
——
DeductionsBenefit Payments
Service Retirement -
Disability -
Other -
Member Refunds -
General
CombinedSafetyGeneralCombinedSafety
CombinedSafetyGeneral
CombinedSafetyGeneral
$ 9,210,830—————
28,449,246—————
)(148,164
Comments:For a majority of the PARS plans, members who are eligible for a distribution through termination, retirement, or disability have two options for receiving their benefits: 1) lump sum distribution or 2) rollover to another retirement plan. Both options result in these members no longer having balances with PARS and no longer being members of the plan. As a result, they are not classified as Service Retired, Service Disability, Ordinary Disability, or Survivor members of the PARS retirement plan. PARS does not actively pay any periodic payments. Instead, annuities will be purchased from an outside company for any periodic payments that are to be made.
The Trust purchases allocated annuity contracts from various life insurance companies for certain retiring employees of participating retirement plans. Allocated annuity contracts are contracts under which the companies have a legal obligation to make all benefit payments for which they have received premiums or consideration requested. Accordingly, funds in the allocated contracts have been excluded from the net assets of the Trust. For the year ended June 30, 2012, at the direction of certain participating plan administrators, the Trust purchased $6,304,849 of annuity contracts to pay benefits to named employees or their beneficiaries.
Footnote:
(1) Transfers-in consisting of funds received for new plans.
(2) Transfers-out consisting of funds for plans that were transferred to successor trustees and administrators during the year.
274

Public Retirement Systems Annual Report — Fiscal Year 2011-12
San Diego Housing Commission Money Purchase Pension Plan
Contributions
AssetsCash and Short-Term InvestmentsReceivables
InvestmentsOther
Investments, at Fair ValueU.S. Government ObligationsInternational BondsMunicipal BondsDomestic Corporate BondsDomestic Stocks
Total Assets
Mortgages
Accounts PayableInvestment Purchases PayableAccrued ExpensesOther Current Liabilities
Total Liabilities
International Stocks
Net Assets Available for Benefits
Statement of Plan Net Assets
LiabilitiesTotal Additions
InterestDividendsNet Appreciation (Depreciation)Other Investment RevenuesIn Fair Value of Investments
Statement of Changes in Plan Net Assets
$ 10,109,211
Real EstateVenture CapitalOther
Investments
$ —$ 10,109,211
$ —
$ 864,543
Administration ExpensesOther Expenses
Total DeductionsNet Increase (Decrease) In Plan Assets
Beginning of the Year Net Assets Held
$ 923,935$ )(59,392
as of June 30, 2012 for Period Ending June 30, 2012
$ 10,109,211
Membership 439
—————————
10,106,772
2,439——
$ ————
59,842—
)(154,747—
Other Revenue
—8,041
$ 10,168,603
Fixed Assets Net of Accumulated DepreciationOther Assets
——
(1)
in Trust for Pension Benefits
in Trust for Pension Benefits
End of the Year Net Assets Held
Investment Expenses
—Adjustments
—
AdditionsContributions
Employer -
Employee -
Other -
GeneralSafetyCombined
CombinedSafetyGeneral
CombinedSafetyGeneral
$ 338,290——
—
—
621,158—
——
DeductionsBenefit Payments
Service Retirement -
Disability -
Other -
Member Refunds -
General
CombinedSafetyGeneralCombinedSafety
CombinedSafetyGeneral
CombinedSafetyGeneral
$ 90,305—————
813,072——
12,517——
—
Comments:The San Diego Housing Commission contributes 3.75% of plan-defined earnings for each temporary non-benefited employee participants and 1% of plan-defined earned earnings for each permanent employee. The commission also contributes a 100% matching contribution of elective deferrals up to 1.5% maximum for each permanent employee.
Footnote:
(1) Investments are all self-directed mutual funds.
275

Public Retirement Systems Annual Report — Fiscal Year 2011-12
San Diego Housing Commission Pension Plan
Contributions
AssetsCash and Short-Term InvestmentsReceivables
InvestmentsOther
Investments, at Fair ValueU.S. Government ObligationsInternational BondsMunicipal BondsDomestic Corporate BondsDomestic Stocks
Total Assets
Mortgages
Accounts PayableInvestment Purchases PayableAccrued ExpensesOther Current Liabilities
Total Liabilities
International Stocks
Net Assets Available for Benefits
Statement of Plan Net Assets
LiabilitiesTotal Additions
InterestDividendsNet Appreciation (Depreciation)Other Investment RevenuesIn Fair Value of Investments
Statement of Changes in Plan Net Assets
$ 30,748,893
Real EstateVenture CapitalOther
Investments
$ —$ 30,748,893
$ 55,704
$ 2,547,003
Administration ExpensesOther Expenses
Total DeductionsNet Increase (Decrease) In Plan Assets
Beginning of the Year Net Assets Held
$ 2,370,536$ 176,467
as of June 30, 2012 for Period Ending June 30, 2012
$ 30,748,893
Membership 366
—————————
30,560,289
———
$ ————
331,208
312,34760,896
Other Revenue
1,619—
$ 30,572,426
Fixed Assets Net of Accumulated DepreciationOther Assets
—132,900
(1)
in Trust for Pension Benefits
in Trust for Pension Benefits
End of the Year Net Assets Held
Investment Expenses
—Adjustments
—
AdditionsContributions
Employer -
Employee -
Other -
GeneralSafetyCombined
CombinedSafetyGeneral
CombinedSafetyGeneral
$ 2,051,766——
—
—
90,783—
——
DeductionsBenefit Payments
Service Retirement -
Disability -
Other -
Member Refunds -
General
CombinedSafetyGeneralCombinedSafety
CombinedSafetyGeneral
CombinedSafetyGeneral
$ 1,432,843—————
925,279——
10,795——
—
Comments:The San Diego Housing Commission contributes 14% of plan-defined earnings for each participant to the plan.
Footnote:
(1) Investments are all self-directed mutual funds.
276

CalPERS Supplement
1. Actuarial Position by Member Category 2. State Employer Contribution Rates 3. State Employee Contribution Rates 4. Funding Position of Contracting Agencies
– Non Risk Pools
4.1. Funding Position of Contracting Agencies – Risk Pools
5. Summary of Contracting Agency’s Benefits

This Page Intentionally Left Blank

279
CalPERS SUPPLEMENT This section is intended to provide a more comprehensive review of the California Public Employees' Retirement System (CalPERS). CalPERS provided the State Controller's Office with all of the information presented in the following tables. 1. Actuarial Position by Member Category Presented below is the system-wide actuarial position of the various CalPERS categories, as of June 30, 2011. The total
actuarial liabilities calculated using credited projected benefits amount to $328.6 billion, with a market value of assets of $241.7 billion and a shortage of market assets over liabilities of $86.8 billion. The new funded ratio is 73.6%, compared with 65.4% in 2010.
PERS CATEGORIES ACTUARIAL LIABILITIES
MARKET VALUE OF ASSETS*
UNFUNDED LIABILITIES
FUNDED RATIO*
State Miscellaneous .............................. $81,271,085,568 $57,451,959,716 $23,819,125,852 70.7%
State Industrial ...................................... 2,831,498,651 2,179,954,931 651,543,720 77.0%
State Safety .......................................... 7,224,281,258 5,389,522,934 1,834,758,324 74.6%
Peace Officers/Firefighters ................... 30,127,480,709 20,801,283,158 9,326,197,551 69.0%
California Highway Patrol ..................... 8,193,449,625 5,335,993,093 2,857,456,532 65.1%
State Combined .................................. $129,647,795,811 $91,158,713,832 $38,489,081,979 70.3%
County Schools .................................. 58,358,406,128 45,900,990,362 12,457,415,766 78.7%
Public Agencies .................................. 140,561,120,877 104,679,819,364 35,881,301,513 74.5%
GRAND TOTAL .................................... $328,567,322,816 $241,739,523,558 $86,827,799,258 73.6% 2. State Employer Contribution Rates Below are the contribution rates that were effective July 1 of each year since 2005 for the various state categories.
MEMBER CATEGORIES 7-1-06 7-1-07 7-1-08 7-1-09 7-1-10 7-1-11
State Miscellaneous Members
Tier I ............................................... 16.633% 16.574% 16.917% 19.922% 18.175% 20.503%
Tier II .............................................. 16.565% 16.470% 16.737% 19.622% 17.025% 20.457%
State Industrial Members ................ 17.345% 17.236% 17.251% 18.183% 14.934% 16.302%
State Safety Members .................... 18.835% 18.411% 18.099% 20.672% 16.428% 17.503%
Peace Officer/Firefighter Members .. 25.552% 26.064% 25.848% 28.887% 27.415% 30.297%
Highway Patrol Members ................. 32.212% 32.149% 28.438% 32.625% 31.264% 33.728%
County School Members ................. 9.306% 9.428% 9.709% 10.707% 10.923% 11.417%
*Effective June 30, 2007, the CalPERs Board decided to use the Market Value of Assets, instead of Actuarial Value of Assets, because it provides a better measure of the plan's ability to pay benefits and is a better indicator of the short-term solvency of a plan.

280
CalPERS SUPPLEMENT – (Continued)
3. State Employee Contribution Rates Below are the member contribution rates by employment classification, reported as a percentage of salary (effective July 1,
2011).
EMPLOYMENT CLASSIFICATION
CONTRIBUTION RATE
APPLIED TO MONTHLY
COMPENSATION IN EXCESS OF
1. State Miscellaneous Members Not Covered by Social Security ........... 6%-11% $317
2. State Miscellaneous Tier 1 Members Covered by Social Security ....... 5%-10% $513
3. State Miscellaneous Tier 2 Members.................................................... 0% -
4. State Industrial Tier 1 Members Covered by Social Security................ 5%-10% $513
5. State Industrial Tier 1 Members Not Covered by Social Security ......... 6%-11% $317
6. State Industrial Tier 2 Members ............................................................ 0% -
7. State Safety .......................................................................................... 9%-11% $317
8. State Peace Officers/Firefighters .......................................................... 8%-11% VARIES
9. California Highway Patrol...................................................................... 10% $863
10. County School Members Covered by Social Security .......................... 6% - 7% $133
11. County School Members Not Covered by Social Security .................... 6% - 7% -
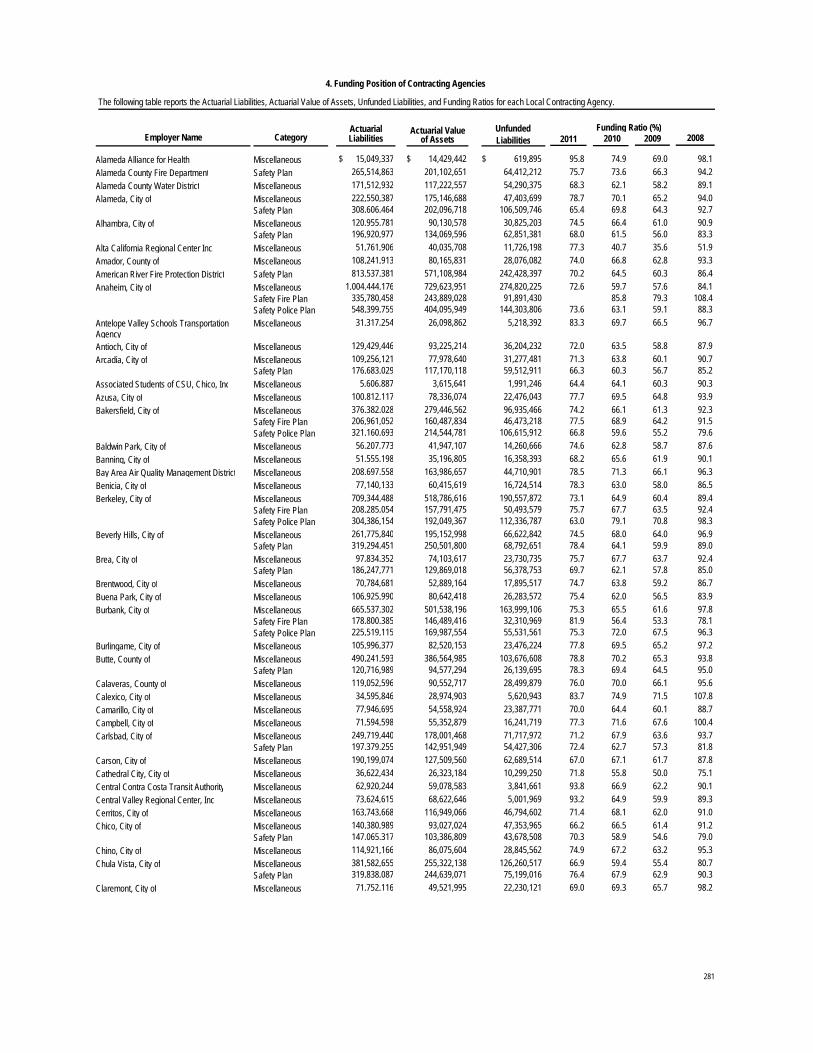
The following table reports the Actuarial Liabilities, Actuarial Value of Assets, Unfunded Liabilities, and Funding Ratios for each Local Contracting Agency.
4. Funding Position of Contracting Agencies
Actuarial Value Funding Ratio (%)Actuarial Unfunded200820092011 2010Employer Name of AssetsCategory Liabilities Liabilities
Alameda Alliance for Health Miscellaneous $ 15,049,337 $ 619,895 98.195.8 74.9 69.0$ 14,429,442
Alameda County Fire Department Safety Plan 265,514,863 64,412,212 94.275.7 73.6 66.3201,102,651
Alameda County Water District Miscellaneous 171,512,932 54,290,375 89.168.3 62.1 58.2117,222,557
Alameda, City of Miscellaneous 222,550,387 47,403,699 94.078.7 70.1 65.2175,146,688Safety Plan 308,606,464 106,509,746 92.765.4 69.8 64.3202,096,718
Alhambra, City of Miscellaneous 120,955,781 30,825,203 90.974.5 66.4 61.090,130,578Safety Plan 196,920,977 62,851,381 83.368.0 61.5 56.0134,069,596
Alta California Regional Center Inc. Miscellaneous 51,761,906 11,726,198 51.977.3 40.7 35.640,035,708
Amador, County of Miscellaneous 108,241,913 28,076,082 93.374.0 66.8 62.880,165,831
American River Fire Protection District Safety Plan 813,537,381 242,428,397 86.470.2 64.5 60.3571,108,984
Anaheim, City of Miscellaneous 1,004,444,176 274,820,225 84.172.6 59.7 57.6729,623,951 Safety Fire Plan 335,780,458 91,891,430 108.485.8 79.3243,889,028
Safety Police Plan 548,399,755 144,303,806 88.373.6 63.1 59.1404,095,949
Antelope Valley Schools Transportation Agency
Miscellaneous 31,317,254 5,218,392 96.783.3 69.7 66.526,098,862
Antioch, City of Miscellaneous 129,429,446 36,204,232 87.972.0 63.5 58.893,225,214
Arcadia, City of Miscellaneous 109,256,121 31,277,481 90.771.3 63.8 60.177,978,640Safety Plan 176,683,029 59,512,911 85.266.3 60.3 56.7117,170,118
Associated Students of CSU, Chico, Inc Miscellaneous 5,606,887 1,991,246 90.364.4 64.1 60.33,615,641
Azusa, City of Miscellaneous 100,812,117 22,476,043 93.977.7 69.5 64.878,336,074
Bakersfield, City of Miscellaneous 376,382,028 96,935,466 92.374.2 66.1 61.3279,446,562 Safety Fire Plan 206,961,052 46,473,218 91.577.5 68.9 64.2160,487,834
Safety Police Plan 321,160,693 106,615,912 79.666.8 59.6 55.2214,544,781
Baldwin Park, City of Miscellaneous 56,207,773 14,260,666 87.674.6 62.8 58.741,947,107
Banning, City of Miscellaneous 51,555,198 16,358,393 90.168.2 65.6 61.935,196,805
Bay Area Air Quality Management District Miscellaneous 208,697,558 44,710,901 96.378.5 71.3 66.1163,986,657
Benicia, City of Miscellaneous 77,140,133 16,724,514 86.578.3 63.0 58.060,415,619
Berkeley, City of Miscellaneous 709,344,488 190,557,872 89.473.1 64.9 60.4518,786,616 Safety Fire Plan 208,285,054 50,493,579 92.475.7 67.7 63.5157,791,475
Safety Police Plan 304,386,154 112,336,787 98.363.0 79.1 70.8192,049,367
Beverly Hills, City of Miscellaneous 261,775,840 66,622,842 96.974.5 68.0 64.0195,152,998Safety Plan 319,294,451 68,792,651 89.078.4 64.1 59.9250,501,800
Brea, City of Miscellaneous 97,834,352 23,730,735 92.475.7 67.7 63.774,103,617Safety Plan 186,247,771 56,378,753 85.069.7 62.1 57.8129,869,018
Brentwood, City of Miscellaneous 70,784,681 17,895,517 86.774.7 63.8 59.252,889,164
Buena Park, City of Miscellaneous 106,925,990 26,283,572 83.975.4 62.0 56.580,642,418
Burbank, City of Miscellaneous 665,537,302 163,999,106 97.875.3 65.5 61.6501,538,196 Safety Fire Plan 178,800,385 32,310,969 78.181.9 56.4 53.3146,489,416
Safety Police Plan 225,519,115 55,531,561 96.375.3 72.0 67.5169,987,554
Burlingame, City of Miscellaneous 105,996,377 23,476,224 97.277.8 69.5 65.282,520,153
Butte, County of Miscellaneous 490,241,593 103,676,608 93.878.8 70.2 65.3386,564,985Safety Plan 120,716,989 26,139,695 95.078.3 69.4 64.594,577,294
Calaveras, County of Miscellaneous 119,052,596 28,499,879 95.676.0 70.0 66.190,552,717
Calexico, City of Miscellaneous 34,595,846 5,620,943 107.883.7 74.9 71.528,974,903
Camarillo, City of Miscellaneous 77,946,695 23,387,771 88.770.0 64.4 60.154,558,924
Campbell, City of Miscellaneous 71,594,598 16,241,719 100.477.3 71.6 67.655,352,879
Carlsbad, City of Miscellaneous 249,719,440 71,717,972 93.771.2 67.9 63.6178,001,468Safety Plan 197,379,255 54,427,306 81.872.4 62.7 57.3142,951,949
Carson, City of Miscellaneous 190,199,074 62,689,514 87.867.0 67.1 61.7127,509,560
Cathedral City, City of Miscellaneous 36,622,434 10,299,250 75.171.8 55.8 50.026,323,184
Central Contra Costa Transit Authority Miscellaneous 62,920,244 3,841,661 90.193.8 66.9 62.259,078,583
Central Valley Regional Center, Inc. Miscellaneous 73,624,615 5,001,969 89.393.2 64.9 59.968,622,646
Cerritos, City of Miscellaneous 163,743,668 46,794,602 91.071.4 68.1 62.0116,949,066
Chico, City of Miscellaneous 140,380,989 47,353,965 91.266.2 66.5 61.493,027,024Safety Plan 147,065,317 43,678,508 79.070.3 58.9 54.6103,386,809
Chino, City of Miscellaneous 114,921,166 28,845,562 95.374.9 67.2 63.286,075,604
Chula Vista, City of Miscellaneous 381,582,655 126,260,517 80.766.9 59.4 55.4255,322,138Safety Plan 319,838,087 75,199,016 90.376.4 67.9 62.9244,639,071
Claremont, City of Miscellaneous 71,752,116 22,230,121 98.269.0 69.3 65.749,521,995
281

4. Funding Position of Contracting Agencies - (Continued)
Actuarial Value Funding Ratio (%)Actuarial Unfunded200820092011 2010Employer Name of AssetsCategory Liabilities Liabilities
Clovis, City of Miscellaneous $ 119,216,293 $ 32,940,234 92.772.3 71.2 65.5$ 86,276,059Safety Plan 133,484,603 40,546,081 85.769.6 64.3 59.392,938,522
Coachella Valley Water District Miscellaneous 271,745,467 88,366,267 87.767.4 64.6 60.3183,379,200Coastal Developmental Services Foundation Miscellaneous 34,656,161 2,694,443 93.292.2 73.9 67.431,961,718Colton, City of Miscellaneous 103,114,649 22,185,859 101.378.4 70.5 65.580,928,790Colusa, County of Miscellaneous 98,661,317 31,335,201 83.068.2 61.4 57.367,326,116Commerce, City of Miscellaneous 80,838,150 15,978,512 91.780.2 66.1 61.664,859,638Compton, City of Miscellaneous 167,117,156 51,246,413 86.469.3 62.2 57.7115,870,743Concord, City of Miscellaneous 163,035,885 53,485,926 77.967.1 54.3 50.6109,549,959
Safety Plan 166,921,164 57,642,906 84.165.4 63.1 58.6109,278,258Conejo Recreation and Park District Miscellaneous 43,926,145 7,292,623 88.783.4 63.6 59.636,633,522Cooperative Personnel Services Miscellaneous 38,306,754 1,408,513 96.996.3 77.1 70.336,898,241Corona, City of Miscellaneous 252,000,728 94,693,611 85.062.4 60.4 56.4157,307,117 Safety Police Plan 150,077,438 48,436,627 72.267.7 54.1 52.3101,640,811Coronado, City of Miscellaneous 67,209,768 18,730,630 88.872.1 65.1 60.848,479,138Costa Mesa, City of Miscellaneous 217,132,722 69,915,454 74.167.8 58.1 52.4147,217,268 Safety Police Plan 204,751,113 73,503,949 94.164.1 68.7 62.3131,247,164Cosumnes Community Services District Miscellaneous 28,024,379 9,382,454 75.666.5 56.4 51.918,641,925
Safety Plan 106,706,001 41,377,339 97.061.2 83.6 75.265,328,662Covina, City of Miscellaneous 66,276,135 16,787,703 99.974.6 67.6 64.549,488,432Cucamonga County Water District Miscellaneous 53,429,612 15,282,928 92.971.4 71.7 65.838,146,684Cucamonga Valley Water District Miscellaneous 53,429,612 15,282,928 92.971.4 71.7 65.838,146,684Culver City, City of Miscellaneous 205,834,626 59,131,215 91.071.2 63.7 60.2146,703,411
Safety Plan 264,528,834 76,000,247 87.863.6 59.6188,528,587Cupertino, City of Miscellaneous 85,378,376 27,245,565 96.168.0 72.4 67.158,132,811Cypress, City of Miscellaneous 56,040,739 10,573,435 80.281.1 61.6 56.645,467,304Daly City, City of Miscellaneous 227,190,176 45,257,909 95.880.0 68.9 63.9181,932,267
Safety Plan 231,832,014 46,913,313 100.779.7 71.0 67.6184,918,701Davis, City of Miscellaneous 152,651,865 49,906,212 83.467.3 61.6 57.2102,745,653
Safety Plan 96,568,277 27,422,570 81.971.6 64.5 57.669,145,707Del Norte County Miscellaneous 89,713,350 23,300,029 96.874.0 66.8 65.066,413,321Downey, City of Miscellaneous 144,892,087 37,703,212 84.473.9 59.6 55.6107,188,875
Safety Plan 281,587,432 72,516,891 96.274.2 66.3 62.2209,070,541East Bay Regional Park District Miscellaneous 195,859,156 68,415,060 102.165.0 73.1 68.1127,444,096Eastern Municipal Water District Miscellaneous 277,962,527 79,069,703 89.971.5 67.9 62.6198,892,824El Cajon, City of Miscellaneous 166,665,778 50,410,561 87.369.7 64.3 59.8116,255,217
Safety Plan 234,599,761 75,262,504 82.767.9 61.0 56.5159,337,257El Centro, City of Miscellaneous 55,179,483 8,032,772 81.185.4 59.1 55.747,146,711El Dorado Irrigation District Miscellaneous 110,172,862 42,836,768 81.661.1 60.2 56.067,336,094El Dorado, County of Miscellaneous 498,510,496 133,182,677 109.373.2 78.0 74.6365,327,819
Safety Plan 232,382,099 77,092,399 85.766.8 65.5 60.3155,289,700El Monte, City of Miscellaneous 127,238,526 32,715,154 90.274.2 66.3 60.794,523,372
Safety Plan 239,373,523 61,575,853 88.165.4 59.3177,797,670El Segundo, City of Miscellaneous 85,636,534 22,703,954 94.073.4 66.5 63.562,932,580
Safety Plan 210,638,267 72,208,400 84.965.7 59.1 56.7138,429,867Elk Grove Community Services District Miscellaneous 28,024,379 9,382,454 75.666.5 56.4 51.918,641,925
Safety Plan 106,706,001 41,377,339 97.061.2 83.6 75.265,328,662Encinitas, City of Miscellaneous 67,942,601 21,918,123 75.767.7 57.0 51.446,024,478Escondido, City of Miscellaneous 289,371,286 89,567,708 94.269.0 62.0 57.4199,803,578
Safety Plan 264,683,120 68,867,072 78.973.9 60.8 55.2195,816,048Estero Municipal Improvement District Miscellaneous 76,201,207 20,186,809 99.373.5 72.0 67.656,014,398Eureka, City of Miscellaneous 74,257,915 23,703,723 86.368.0 70.7 60.150,554,192Fairfield, City of Miscellaneous 227,177,572 54,951,398 83.075.8 62.3 57.1172,226,174
Safety Plan 198,870,891 47,791,060 94.775.9 67.6 63.2151,079,831Far Northern Regional Center Miscellaneous 31,091,408 5,940,628 69.980.8 58.1 51.625,150,780Folsom, City of Miscellaneous 136,947,174 47,658,869 88.565.2 65.0 60.589,288,305
Safety Plan 119,491,978 42,356,186 100.964.5 75.5 70.077,135,792Fontana, City of Miscellaneous 127,620,073 35,048,058 100.272.5 71.9 68.692,572,015
Safety Plan 152,339,057 55,751,159 88.463.4 63.5 59.896,587,898Fremont, City of Miscellaneous 356,592,039 109,807,054 93.769.2 66.3 63.2246,784,985
Safety Plan 478,707,155 153,416,760 82.267.9 59.9 54.4325,290,395
282

4. Funding Position of Contracting Agencies - (Continued)
Actuarial Value Funding Ratio (%)Actuarial Unfunded200820092011 2010Employer Name of AssetsCategory Liabilities Liabilities
Fresno City Housing Authority Miscellaneous $ 27,963,598 $ 3,236,968 98.988.4 72.0 67.9$ 24,726,630Fresno County Housing Authority Miscellaneous 21,952,353 3,058,685 110.386.0 79.9 76.318,893,668Fullerton, City of Miscellaneous 221,054,622 43,522,602 97.880.3 72.0 67.3177,532,020
Safety Plan 360,077,203 103,312,840 74.671.3 58.0 51.2256,764,363Galt, City of Miscellaneous 26,994,706 7,694,013 82.771.5 59.5 55.119,300,693Garden Grove, City of Miscellaneous 220,262,133 60,967,917 95.572.3 66.1 61.7159,294,216
Safety Plan 372,523,372 114,460,813 83.469.2 62.7 57.7258,062,559Gardena, City of Miscellaneous 112,893,719 15,698,317 108.186.0 76.6 73.297,195,402Gilroy, City of Miscellaneous 74,791,092 21,121,716 89.771.7 66.7 61.953,669,376
Safety Plan 107,654,773 32,610,248 97.969.7 73.5 69.375,044,525Glendale, City of Miscellaneous 830,155,283 184,751,253 96.577.7 68.7 63.9645,404,030
Safety Plan 596,913,972 176,789,691 86.970.3 62.5 58.6420,124,281Glendora, City of Miscellaneous 75,689,753 17,125,917 85.177.3 63.4 59.658,563,836Glenn, County of Miscellaneous 122,255,133 35,898,002 85.670.6 63.6 58.086,357,131Gold Coast Transit Miscellaneous 33,035,700 7,546,645 80.477.1 59.0 54.525,489,055Golden Gate Bridge Highway and Transportation District
Miscellaneous 314,608,073 84,698,064 89.073.0 64.1 58.8229,910,009
Hanford, City of Miscellaneous 73,954,232 21,904,752 79.270.3 61.7 55.252,049,480Hawthorne, City of Miscellaneous 149,890,636 32,121,504 96.278.5 70.7 65.8117,769,132Hayward Area Recreation and Park District Miscellaneous 56,218,402 14,853,377 103.373.5 75.4 70.341,365,025Hayward, City of Miscellaneous 340,535,356 107,814,556 87.668.3 65.4 60.5232,720,800 Safety Fire Plan 206,427,050 63,163,543 91.969.4 61.8 58.9143,263,507
Safety Police Plan 254,131,801 80,685,979 84.368.2 62.2 57.9173,445,822Helix Water District Miscellaneous 94,306,836 26,046,157 95.372.3 67.9 64.868,260,679Hemet, City of Miscellaneous 89,080,919 25,286,888 99.971.6 73.7 67.963,794,031
Safety Plan 119,236,919 39,617,806 80.366.7 59.7 54.579,619,113Hornet Foundation, Inc., California State University, Sacramento
Miscellaneous 41,696,075 8,170,371 83.080.4 62.3 57.333,525,704
Housing Authority of the City of Los Angeles Miscellaneous 350,680,461 94,930,246 81.172.9 60.2 55.7255,750,215Housing Authority of the County of Santa Clara
Miscellaneous 38,572,922 )(1,800,358 84.8104.6 65.1 59.440,373,280
Humboldt, County of Miscellaneous 509,944,822 157,685,062 84.169.0 61.4 57.3352,259,760Safety Plan 146,066,019 39,441,394 91.273.0 66.2 62.4106,624,625
Huntington Beach, City of Miscellaneous 415,177,996 105,568,464 98.474.5 68.7 64.8309,609,532Safety Plan 531,801,028 173,058,862 83.567.4 60.0 56.2358,742,166
Huntington Park, City of Miscellaneous 52,462,481 8,635,925 105.583.5 76.3 73.243,826,556Indio, City of Miscellaneous 62,588,244 20,604,404 93.267.0 67.3 63.641,983,840Inglewood, City of Miscellaneous 310,473,828 60,809,506 103.180.4 73.0 69.7249,664,322
Safety Plan 333,898,663 75,264,642 98.577.4 69.7 66.7258,634,021Inland Counties Regional Center, Inc. Miscellaneous 111,772,150 15,369,785 81.786.2 67.0 59.596,402,365Inland Empire Health Plan Miscellaneous 53,910,760 125,447 95.899.7 67.5 63.053,785,313Inland Empire Utilities Agency Miscellaneous 122,731,341 37,278,645 83.469.6 62.6 57.685,452,696Inyo, County of Miscellaneous 133,832,109 33,382,225 90.775.0 66.9 62.8100,449,884Irvine Ranch Water District Miscellaneous 170,392,041 41,639,127 92.475.5 66.4 62.6128,752,914Irvine, City of Miscellaneous 245,667,207 80,873,023 103.667.0 89.0 74.0164,794,184
Safety Plan 152,793,524 39,654,688 71.974.0 55.8 49.7113,138,836Kern County Housing Authority Miscellaneous 24,718,054 3,903,799 90.584.2 66.2 62.820,814,255Kings, County of Miscellaneous 256,950,451 50,382,321 95.080.3 71.8 66.7206,568,130
Safety Plan 166,546,673 27,995,905 97.783.1 74.9 69.6138,550,768La Habra, City of Miscellaneous 75,595,594 15,036,344 98.580.1 77.3 70.360,559,250La Mesa, City of Miscellaneous 78,731,492 21,717,993 86.372.4 64.4 59.257,013,499
Safety Plan 128,282,377 32,681,308 82.974.5 70.1 62.295,601,069Laguna Beach, City of Miscellaneous 76,911,997 21,086,037 94.172.5 64.6 61.055,825,960Lake, County of Miscellaneous 170,258,375 35,259,999 87.079.2 63.1 57.9134,998,376
Safety Plan 64,326,102 12,261,869 91.980.9 70.1 64.752,064,233Lakewood, City of Miscellaneous 96,686,489 22,497,800 94.376.7 69.2 64.274,188,689Lancaster, City of Miscellaneous 98,568,012 30,300,615 78.169.2 57.4 53.768,267,397Las Virgenes Municipal Water District Miscellaneous 69,674,417 16,978,622 84.375.6 62.8 58.852,695,795Lassen, County of Miscellaneous 89,171,856 17,533,298 93.680.3 70.9 65.771,638,558Lee Lake Water District Miscellaneous 108,127 )(1,577 84.3101.4 63.8 57.8109,704Livermore, City of Miscellaneous 191,383,518 52,636,583 85.172.5 63.8 58.8138,746,935
283

4. Funding Position of Contracting Agencies - (Continued)
Actuarial Value Funding Ratio (%)Actuarial Unfunded200820092011 2010Employer Name of AssetsCategory Liabilities Liabilities
Lodi, City of Miscellaneous $ 142,607,697 $ 36,120,487 83.574.6 62.0 57.0$ 106,487,210Safety Plan 132,266,539 45,587,346 89.865.5 66.6 61.786,679,193
Lompoc, City of Miscellaneous 137,346,767 36,100,258 89.973.7 65.5 60.7101,246,509Long Beach, City of Miscellaneous 1,971,681,766 405,298,739 59.379.4 55.9 47.11,566,383,027
Safety Plan 1,868,031,443 286,426,195 79.584.6 59.9 54.81,581,605,248Los Angeles City Community Redevelopment Agency
Miscellaneous 205,090,610 53,156,902 79.774.0 56.9 53.6151,933,708
Los Angeles County Community DevelopmentCommission
Miscellaneous 164,031,147 12,427,325 91.892.4 70.5 64.1151,603,822
Los Angeles County Office of Education Miscellaneous 709,224,263 147,818,456 94.879.1 70.0 65.3561,405,807Los Angeles County Sanitation District No. 2 Miscellaneous 1,232,768,683 248,299,788 98.179.8 72.0 66.7984,468,895Los Angeles Unified School District Safety Plan 258,517,618 66,855,993 92.774.1 68.5 63.9191,661,625Los Gatos, Town of Miscellaneous 75,549,721 20,687,075 85.372.6 63.9 58.354,862,646Lynwood, City of Miscellaneous 69,114,327 20,233,210 84.870.7 62.5 57.648,881,117Madera, City of Miscellaneous 56,335,048 14,813,751 81.573.7 58.2 52.941,521,297Madera, County of Miscellaneous 289,772,492 95,979,277 79.166.8 59.7 54.8193,793,215
Safety Plan 83,555,795 27,625,445 74.266.9 58.6 54.255,930,350Manhattan Beach, City of Miscellaneous 71,498,265 15,070,695 101.378.9 73.1 69.056,427,570Manteca, City of Miscellaneous 109,434,161 36,050,454 69.167.0 51.7 47.473,383,707
Safety Plan 104,640,338 34,811,540 79.966.7 59.3 54.869,828,798Marin Municipal Water District Miscellaneous 175,305,381 55,790,934 84.468.1 63.7 58.1119,514,447Mariposa, County of Miscellaneous 80,888,785 23,382,957 99.371.0 72.8 68.457,505,828Menlo Park, City of Miscellaneous 85,715,937 19,624,024 92.177.1 68.4 63.566,091,913Merced Irrigation District Miscellaneous 56,533,121 15,913,928 83.071.8 63.7 57.540,619,193Merced, City of Miscellaneous 102,743,573 27,430,317 93.873.3 72.0 65.975,313,256
Safety Plan 108,814,708 24,972,307 92.277.0 65.4 61.583,842,401Metropolitan Transportation Commission Miscellaneous 96,864,616 22,092,949 77.577.1 59.1 53.874,771,667Metropolitan Water District of Southern California
Miscellaneous 1,674,273,673 417,075,107 94.175.0 67.7 63.51,257,198,566
Milpitas, City of Miscellaneous 162,749,601 44,359,269 78.272.7 59.0 54.4118,390,332Safety Plan 230,193,199 69,086,663 84.869.9 62.8 58.7161,106,536
Mission Viejo, City of Miscellaneous 51,387,228 14,184,637 76.572.4 59.1 53.437,202,591Modesto, City of Miscellaneous 343,774,527 73,066,119 96.578.7 71.0 66.3270,708,408
Safety Plan 414,530,888 105,599,012 89.974.5 66.6 61.9308,931,876Modoc, County of Miscellaneous 64,322,373 13,962,599 90.978.2 69.7 63.950,359,774Mono, County of Miscellaneous 80,864,947 24,141,392 83.170.1 61.7 56.156,723,555Monrovia, City of Miscellaneous 89,579,789 31,081,936 85.265.3 64.4 59.658,497,853Montclair, City of Miscellaneous 63,345,127 15,970,901 91.874.7 67.5 63.247,374,226Montebello, City of Miscellaneous 135,733,320 31,976,128 89.976.4 65.7 61.1103,757,192
Safety Plan 180,477,386 51,943,416 86.471.2 62.8 58.5128,533,970Monterey Park, City of Miscellaneous 93,612,615 27,873,679 83.770.2 61.4 56.365,738,936
Safety Plan 149,019,685 33,889,214 92.177.2 64.5 60.9115,130,471Monterey Regional Waste Management District
Miscellaneous 22,088,256 5,736,121 90.974.0 66.7 61.316,352,135
Monterey, City of Miscellaneous 170,927,827 52,365,797 78.469.3 55.3 51.3118,562,030Monterey, County of Miscellaneous 1,169,818,464 229,571,226 94.080.3 70.7 65.2940,247,238
Safety Plan 444,376,014 144,609,344 76.767.4 59.2 53.8299,766,670Monterey-Salinas Transit Miscellaneous 47,826,862 6,231,945 91.186.9 65.4 61.341,594,917Moreno Valley, City of Miscellaneous 132,322,141 48,358,777 73.263.4 79.4 51.383,963,364Morgan Hill, City of Miscellaneous 60,469,811 15,832,023 81.873.8 59.7 56.044,637,788Mountain View, City of Miscellaneous 279,761,477 83,472,074 87.170.1 61.7 58.1196,289,403
Safety Plan 240,451,115 72,475,514 83.969.8 61.5 57.3167,975,601Napa, City of Miscellaneous 174,240,264 59,485,223 81.665.8 60.7 55.5114,755,041
Safety Plan 169,719,728 53,141,491 82.868.6 59.7 55.4116,578,237Napa, County of Miscellaneous 535,066,666 139,940,413 88.473.8 65.1 60.0395,126,253National City, City of Miscellaneous 92,018,537 22,402,093 90.475.6 67.6 62.769,616,444
Safety Plan 139,578,104 44,696,469 89.667.9 64.6 60.894,881,635Nevada Irrigation District Miscellaneous 94,462,942 29,374,890 99.668.9 74.7 69.965,088,052Nevada, County of Miscellaneous 343,180,761 113,568,153 85.766.9 61.6 57.4229,612,608Newark, City of Miscellaneous 83,229,864 26,242,933 96.168.4 69.7 65.856,986,931
284

4. Funding Position of Contracting Agencies - (Continued)
Actuarial Value Funding Ratio (%)Actuarial Unfunded200820092011 2010Employer Name of AssetsCategory Liabilities Liabilities
Newport Beach, City of Miscellaneous $ 287,108,575 $ 82,635,315 91.871.2 63.8 61.1$ 204,473,260Safety Plan 405,879,283 142,997,844 80.964.7 58.4 54.7262,881,439
North Bay Regional Center Miscellaneous 32,830,579 10,052,720 81.669.3 64.7 57.422,777,859North County Transit District Miscellaneous 121,006,443 20,273,233 93.683.2 70.0 64.3100,733,210North Kern-South Tulare Hospital District Miscellaneous 7,677,439 2,708,626 73.664.7 59.2 52.74,968,813North Los Angeles County Regional Center, Inc.
Miscellaneous 64,367,233 3,511,200 97.694.5 75.5 68.360,856,033
North of the River Recreation and Park District
Miscellaneous 3,403,518 103,352 83.996.9 59.6 56.13,300,166
Northern California Power Agency Miscellaneous 100,528,265 51,144,952 111.649.1 89.9 81.349,383,313Norwalk, City of Miscellaneous 121,455,437 29,775,264 82.375.4 61.9 57.591,680,173Novato, City of Miscellaneous 73,446,999 14,831,000 100.379.8 82.5 74.858,615,999Oakland City Housing Authority Miscellaneous 77,818,393 16,353,203 81.778.9 59.4 55.261,465,190Oakland, City of Miscellaneous 2,025,140,791 591,693,957 84.470.7 62.6 57.61,433,446,834
Safety Plan 1,357,816,142 442,702,556 82.167.4 62.5 56.5915,113,586Oceanside, City of Miscellaneous 312,677,302 86,414,751 73.372.3 55.0 51.0226,262,551
Safety Plan 356,061,245 81,354,812 90.677.1 64.8 60.9274,706,433Omnitrans Miscellaneous 109,878,995 14,163,624 77.887.1 58.4 53.495,715,371Ontario, City of Miscellaneous 228,770,100 45,323,532 100.180.1 71.2 66.5183,446,568 Safety Fire Plan 186,793,216 44,172,767 90.876.3 67.9 63.0142,620,449
Safety Police Plan 235,842,936 65,839,095 88.272.0 63.9 59.8170,003,841Orange County Health Authority (Caloptima) Miscellaneous 54,094,889 1,558,038 77.097.1 55.9 52.252,536,851Orange, City of Miscellaneous 260,023,355 67,016,973 92.074.2 67.9 62.8193,006,382
Safety Plan 367,790,155 97,384,658 91.773.5 65.5 61.0270,405,497Otay Water District Miscellaneous 88,411,019 32,194,768 89.063.5 67.6 62.356,216,251Oxnard, City of Miscellaneous 332,650,663 78,393,172 84.576.4 62.6 57.5254,257,491 Safety Police Plan 241,154,917 62,401,308 89.774.1 67.9 62.5178,753,609Pacifica, City of Miscellaneous 70,453,919 9,841,526 82.586.0 58.0 54.960,612,393Padre Dam Municipal Water District Miscellaneous 78,446,285 26,187,708 87.866.6 61.5 58.152,258,577Palm Desert, City of Miscellaneous 92,858,742 33,984,599 109.463.4 84.0 78.058,874,143Palm Springs, City of Miscellaneous 165,014,517 41,623,373 80.274.7 58.8 55.1123,391,144
Safety Plan 194,304,748 55,394,749 86.171.4 62.6 58.9138,909,999Palmdale, City of Miscellaneous 118,950,881 34,624,527 90.770.8 65.0 60.884,326,354Palo Alto, City of Miscellaneous 552,715,631 168,658,927 86.969.4 62.1 57.8384,056,704
Safety Plan 313,183,690 88,168,601 83.371.8 61.6 57.4225,015,089Paramount, City of Miscellaneous 58,101,721 15,653,302 84.873.0 61.2 57.342,448,419Pasadena, City of Miscellaneous 819,326,665 227,169,389 92.572.2 64.3 60.5592,157,276
Safety Plan 403,625,610 106,676,100 83.573.5 64.7 58.6296,949,510Paso Robles, City of Miscellaneous 50,752,266 17,500,019 84.965.5 62.2 57.633,252,247Peninsula Health Care District Miscellaneous 2,212,984 )(360,209 — 116.2 87.8 67.02,573,193Peninsula Hospital District Miscellaneous 2,212,984 )(360,209 — 116.2 87.8 67.02,573,193Petaluma, City of Miscellaneous 82,634,429 18,636,333 92.177.4 68.6 63.963,998,096
Safety Plan 139,401,684 45,958,606 82.067.0 60.5 56.293,443,078Phelan Pinon Hills Community Services District
Miscellaneous 493,828 113,507 100.677.0 87.6 78.0380,321
Pico Rivera, City of Miscellaneous 77,656,431 25,078,775 84.867.7 77.7 57.152,577,656Pittsburg, City of Miscellaneous 60,051,999 13,841,452 100.076.9 81.6 71.846,210,547Placer County Water Agency Miscellaneous 81,664,394 27,426,943 88.366.4 64.2 57.454,237,451Placer, County of Miscellaneous 876,895,029 294,302,949 82.266.4 58.9 54.9582,592,080
Safety Plan 279,994,492 101,076,665 76.363.9 57.0 52.6178,917,827Pleasanton, City of Miscellaneous 191,897,126 71,307,408 87.362.8 63.6 59.7120,589,718 Safety Fire Plan 160,306,074 53,011,923 78.166.9 56.0 52.1107,294,151Plumas, County of Miscellaneous 103,839,694 25,173,464 90.575.7 67.8 62.878,666,230Pomona, City of Miscellaneous 224,309,938 46,890,137 96.279.1 71.1 65.8177,419,801
Safety Plan 284,367,753 66,414,167 96.376.6 69.1 64.9217,953,586Port Hueneme, City of Miscellaneous 44,785,333 11,553,543 90.174.2 63.9 59.633,231,790Porterville City Miscellaneous 65,817,690 23,966,503 87.663.5 61.7 57.341,851,187Porterville, City of Miscellaneous 65,817,690 23,966,503 87.663.5 61.7 57.341,851,187Poway, City of Miscellaneous 78,673,260 19,633,567 97.075.0 69.9 65.959,039,693Public Transportation Services Corporation Miscellaneous 403,848,219 65,893,712 85.083.6 71.5 63.9337,954,507Pupil Transportation Cooperative Miscellaneous 22,125,911 2,804,251 78.487.3 55.6 52.619,321,660
285

4. Funding Position of Contracting Agencies - (Continued)
Actuarial Value Funding Ratio (%)Actuarial Unfunded200820092011 2010Employer Name of AssetsCategory Liabilities Liabilities
Rancho California Water District Miscellaneous $ 76,235,050 $ 20,863,405 80.272.6 63.3 58.0$ 55,371,645Rancho Cucamonga, City of Miscellaneous 138,584,349 29,734,489 74.978.5 57.8 52.3108,849,860Rancho Simi Recreation & Park District Miscellaneous 29,181,534 6,776,842 80.276.7 59.5 55.222,404,692Redding, City of Miscellaneous 313,055,347 89,891,115 105.071.2 75.7 72.1223,164,232
Safety Plan 215,899,219 77,485,804 87.564.1 64.8 60.2138,413,415Redlands, City of Miscellaneous 120,111,061 26,373,338 97.778.0 69.3 65.893,737,723Redondo Beach, City of Miscellaneous 148,638,920 33,738,511 94.177.3 68.5 64.2114,900,409
Safety Plan 268,946,368 76,759,216 86.471.4 63.0 58.7192,187,152Redwood City, City of Miscellaneous 219,035,437 62,865,992 86.371.3 62.8 58.5156,169,445
Safety Plan 249,306,267 80,394,052 96.767.7 70.1 64.4168,912,215Redwood Coast Regional Center Miscellaneous 18,804,564 6,246,935 73.366.7 64.0 55.412,557,629Regional Center of Orange County Miscellaneous 48,678,323 8,721,752 94.182.0 68.9 64.939,956,571Regional Center of the East Bay Miscellaneous 47,959,061 8,398,431 78.182.4 67.5 59.739,560,630Rialto, City of Miscellaneous 97,095,589 28,723,797 89.770.4 61.2 57.968,371,792
Safety Plan 192,110,279 58,843,924 95.969.3 63.9 59.5133,266,355Richmond, City of Miscellaneous 370,148,146 74,674,826 80.179.8 58.3 54.5295,473,320
Safety Plan 448,110,149 88,352,269 102.780.2 72.6 69.5359,757,880Riverside County Flood Control and Water Conservation District
Miscellaneous 125,474,204 32,208,996 91.474.3 65.5 60.993,265,208
Riverside Transit Agency Miscellaneous 59,053,891 9,993,608 101.183.0 80.6 69.449,060,283Riverside, City of Miscellaneous 998,216,259 212,135,945 96.078.7 69.3 64.0786,080,314
Safety Plan 731,074,004 156,068,214 95.678.6 70.6 65.4575,005,790Riverside, County of Miscellaneous 4,461,553,672 935,912,939 96.279.0 70.3 65.43,525,640,733
Safety Plan 2,032,001,280 466,202,082 97.477.0 70.7 66.91,565,799,198Rocklin, City of Miscellaneous 50,966,392 15,688,286 92.469.2 65.8 62.535,278,106Rohnert Park, City of Miscellaneous 67,818,078 18,603,382 98.472.5 67.6 65.349,214,696Roseville, City of Miscellaneous 403,899,989 150,381,580 76.162.7 56.2 51.5253,518,409
Safety Plan 196,208,635 64,512,015 73.667.1 60.0 53.2131,696,620Sacramento City Housing Authority Miscellaneous 124,977,405 28,112,304 84.477.5 64.6 58.396,865,101Sacramento Metropolitan Fire District Safety Plan 813,537,381 242,428,397 86.470.2 64.5 60.3571,108,984Sacramento Municipal Utility District Miscellaneous 1,634,178,062 286,712,172 100.582.4 72.5 67.51,347,465,890Sacramento Public Library Authority Miscellaneous 49,813,933 11,095,935 84.477.7 69.6 62.738,717,998Sacramento, City of Miscellaneous 819,168,698 229,632,035 104.171.9 74.9 70.0589,536,663
Safety Plan 1,249,347,774 332,622,135 95.773.3 73.1 67.4916,725,639Salinas, City of Miscellaneous 69,621,977 20,461,159 75.570.6 56.3 50.749,160,818 Safety Police Plan 198,216,423 59,812,997 84.069.8 63.3 57.5138,403,426San Andreas Regional Center, Inc. Miscellaneous 59,137,164 13,189,401 88.377.7 70.4 62.745,947,763San Benito, County of Miscellaneous 113,742,014 31,462,717 85.872.3 64.0 59.882,279,297San Bernardino County Housing Authority Miscellaneous 46,022,017 13,735,929 78.470.1 59.6 54.832,286,088San Bernardino, California State University, Foundation
Miscellaneous 17,770,914 1,609,368 94.290.9 66.3 61.716,161,546
San Bernardino, City of Miscellaneous 427,257,567 102,793,909 94.275.9 67.4 63.0324,463,658Safety Plan 587,024,662 152,561,161 90.774.0 66.1 61.9434,463,501
San Bruno, City of Miscellaneous 91,776,747 26,718,772 87.370.8 63.3 59.365,057,975San Buenaventura, City of Miscellaneous 205,505,646 44,134,109 95.478.5 69.3 65.0161,371,537
Safety Plan 275,332,767 95,153,857 81.165.4 57.5 54.1180,178,910San Diego Association of Governments Miscellaneous 95,110,699 30,649,124 93.067.7 65.2 61.464,461,575San Diego County Office of Education Miscellaneous 215,416,902 53,855,528 82.675.0 64.7 58.7161,561,374San Diego County Water Authority Miscellaneous 153,217,349 51,224,736 82.266.5 61.2 56.8101,992,613San Diego Trolley, Inc. Miscellaneous 88,127,366 18,567,125 113.278.9 69.9 78.869,560,241San Francisco Bay Area Rapid Transit District Miscellaneous 1,661,565,547 307,289,000 82.481.5 60.4 56.71,354,276,547
Safety Plan 213,591,655 72,361,064 98.866.1 72.5 67.4141,230,591San Francisco City and County Housing Authority
Miscellaneous 101,939,107 16,612,181 85.083.7 63.4 59.285,326,926
San Francisco City and County Redevelopment Agency
Miscellaneous 96,675,164 15,337,674 85.384.1 60.5 56.381,337,490
San Francisco, City and County of Safety Plan 836,170,637 135,705,111 93.483.7 64.4 61.4700,465,526San Leandro, City of Miscellaneous 226,836,862 58,808,176 94.774.0 66.8 63.7168,028,686San Luis Obispo - Cal Poly Foundation Miscellaneous 56,974,038 11,579,266 87.079.6 62.1 58.145,394,772San Luis Obispo, City of Miscellaneous 150,651,167 57,850,059 87.761.6 63.9 58.792,801,108San Marcos, City of Miscellaneous 86,945,272 34,186,267 81.660.6 60.8 55.552,759,005
286

4. Funding Position of Contracting Agencies - (Continued)
Actuarial Value Funding Ratio (%)Actuarial Unfunded200820092011 2010Employer Name of AssetsCategory Liabilities Liabilities
San Mateo County Transit District Miscellaneous $ 217,684,642 $ 33,732,173 82.684.5 63.5 57.7$ 183,952,469San Mateo, City of Miscellaneous 190,096,565 47,071,055 91.775.2 67.1 62.5143,025,510
Safety Plan 286,193,053 101,045,617 81.364.6 58.3 54.4185,147,436San Ramon, City of Miscellaneous 83,570,990 9,331,728 82.988.8 62.3 57.474,239,262Santa Ana, City of Miscellaneous 642,850,075 172,664,622 94.973.1 65.2 61.7470,185,453
Safety Plan 859,019,269 195,872,332 94.077.2 69.0 63.8663,146,937Santa Barbara, City of Miscellaneous 410,437,416 126,130,821 82.469.2 61.2 56.6284,306,595 Safety Fire Plan 145,634,246 43,020,422 85.570.4 63.3 59.0102,613,824
Safety Police Plan 190,349,779 57,133,053 84.069.9 61.6 57.2133,216,726Santa Clara County Central Fire Protection District
Safety Plan 412,761,049 114,128,729 94.872.3 68.1 64.4298,632,320
Santa Clara County Transit District Miscellaneous 274,924,477 66,122,463 81.475.9 59.0 55.9208,802,014Santa Clara Valley Transportation Authority Miscellaneous 274,924,477 66,122,463 81.475.9 59.0 55.9208,802,014Santa Clara Valley Water District Miscellaneous 528,826,584 143,991,608 97.272.7 70.0 64.5384,834,976Santa Clara, City of Miscellaneous 509,224,751 175,851,606 83.865.4 58.0 55.1333,373,145
Safety Plan 551,474,687 161,721,343 86.970.6 63.3 59.5389,753,344Santa Clara, County of Miscellaneous 6,930,682,371 1,831,036,607 87.673.5 64.2 59.15,099,645,764
Safety Plan 1,991,107,804 543,431,640 88.472.7 65.2 60.91,447,676,164Santa Clarita, City of Miscellaneous 99,379,470 24,635,029 84.275.2 61.5 56.374,744,441Santa Cruz Metropolitan Transit District Miscellaneous 124,377,660 36,885,168 76.870.3 54.9 52.587,492,492Santa Cruz, City of Miscellaneous 276,803,227 68,185,360 89.175.3 67.2 62.1208,617,867Santa Cruz, County of Miscellaneous 875,808,856 233,442,592 88.473.3 65.0 61.1642,366,264
Safety Plan 133,199,435 31,179,615 83.976.5 69.2 61.2102,019,820 Safety Police Plan 108,356,979 34,783,799 75.067.9 71.4 57.573,573,180Santa Fe Springs, City of Miscellaneous 134,060,595 48,210,422 81.164.0 59.4 56.185,850,173Santa Margarita Water District Miscellaneous 61,460,182 20,544,496 81.966.5 63.8 58.040,915,686Santa Maria, City of Miscellaneous 156,767,365 41,492,674 96.973.5 69.6 64.6115,274,691 Safety Police Plan 90,399,152 22,050,594 95.975.6 65.4 61.368,348,558Santa Monica, City of Miscellaneous 700,593,785 203,185,513 84.771.0 61.1 56.2497,408,272 Safety Fire Plan 173,590,512 48,669,209 88.971.9 64.0 60.4124,921,303
Safety Police Plan 307,730,844 91,203,971 83.270.3 61.4 56.7216,526,873Santa Rosa, City of Miscellaneous 485,570,937 100,567,949 83.179.2 64.6 59.2385,002,988 Safety Fire Plan 153,501,793 43,624,443 98.271.5 70.7 66.3109,877,350
Safety Police Plan 193,619,839 53,254,238 90.172.5 63.7 60.6140,365,601Shasta, County of Miscellaneous 461,156,971 96,236,829 96.779.1 70.8 66.3364,920,142
Safety Plan 175,655,871 48,881,059 87.472.1 64.7 60.1126,774,812Simi Valley, City of Miscellaneous 199,126,764 56,000,503 92.471.8 65.9 63.3143,126,261
Safety Plan 122,144,307 36,973,347 74.769.7 54.6 51.485,170,960Siskiyou, County of Miscellaneous 179,824,758 45,115,447 96.374.9 68.0 64.8134,709,311
Safety Plan 65,500,796 11,718,211 99.482.1 73.4 69.353,782,585Solano, County of Miscellaneous 1,100,723,215 264,739,529 96.775.9 68.9 64.7835,983,686
Safety Plan 323,460,226 74,517,915 76.9 69.1 64.9248,942,311Sonoma County Library Miscellaneous 48,921,418 9,418,600 106.180.7 77.6 73.039,502,818South Central Los Angeles Regional Center for Developmentally Disabled Persons
Miscellaneous 43,271,971 10,724,902 94.575.2 67.3 63.532,547,069
South Coast Area Transit Miscellaneous 33,035,700 7,546,645 80.477.1 59.0 54.525,489,055South Gate, City of Miscellaneous 107,428,940 20,734,534 94.880.7 73.0 65.086,694,406South Lake Tahoe, City of Miscellaneous 70,111,763 21,709,927 89.169.0 67.4 61.148,401,836South San Francisco, City of Miscellaneous 162,844,345 49,216,525 83.869.7 61.8 56.9113,627,820
Safety Plan 226,028,820 66,642,258 103.170.5 75.0 69.8159,386,562Southern California Association of Governments
Miscellaneous 87,378,741 21,617,349 80.775.2 60.3 55.765,761,392
Southern California Regional Rail Authority Miscellaneous 37,464,341 6,770,522 85.981.9 60.2 57.930,693,819State Bar of California Miscellaneous 241,540,887 26,367,546 85.989.0 61.2 57.4215,173,341Stockton, City of Miscellaneous 568,852,600 117,999,377 95.079.2 69.9 64.6450,853,223
Safety Plan 802,778,310 204,489,175 94.974.5 67.2 63.7598,289,135Sunnyvale, City of Miscellaneous 408,576,988 121,732,400 84.070.2 62.8 58.0286,844,588
Safety Plan 403,210,623 120,826,076 85.970.0 62.6 57.8282,384,547Sutter, County of Miscellaneous 272,054,995 79,511,486 83.670.7 60.5 55.9192,543,509
Safety Plan 87,025,635 25,751,971 82.870.4 62.8 57.161,273,664Sweetwater Authority Miscellaneous 77,982,889 27,363,505 77.864.9 60.1 55.250,619,384
287

4. Funding Position of Contracting Agencies - (Continued)
Actuarial Value Funding Ratio (%)Actuarial Unfunded200820092011 2010Employer Name of AssetsCategory Liabilities Liabilities
Tehama, County of Miscellaneous $ 172,779,664 $ 40,317,050 103.076.6 74.0 69.3$ 132,462,614Safety Plan 57,967,134 17,416,380 94.369.9 68.9 64.740,550,754
Temecula, City of Miscellaneous 70,623,963 25,926,419 83.963.2 64.9 58.844,697,544
Thousand Oaks, City of Miscellaneous 215,154,061 57,122,729 89.373.4 63.5 60.7158,031,332
Torrance, City of Miscellaneous 461,921,961 92,601,678 96.779.9 71.1 66.2369,320,283 Safety Fire Plan 278,943,525 93,678,424 82.666.4 59.4 55.9185,265,101
Safety Police Plan 401,927,465 139,185,564 80.865.3 57.5 54.1262,741,901
Tracy, City of Miscellaneous 97,889,894 26,089,693 86.973.3 64.7 59.571,800,201Safety Plan 112,291,769 30,500,739 81.172.8 59.9 55.281,791,030
Tri-Counties Association for the Developmentally Disabled
Miscellaneous 58,622,350 10,832,658 89.181.5 66.7 62.147,789,692
Trinity, County of Miscellaneous 81,246,726 31,571,449 114.861.1 84.1 80.649,675,277
Tulare, City of Miscellaneous 85,383,737 24,755,782 88.871.0 64.7 59.660,627,955
Tuolumne, County of Miscellaneous 203,689,010 46,385,722 86.077.2 62.6 57.7157,303,288
Turlock, City of Miscellaneous 92,422,591 28,955,449 86.868.6 65.5 60.263,467,142
Tustin, City of Miscellaneous 75,399,067 14,387,135 87.580.9 64.7 58.561,011,932
Ukiah, City of Miscellaneous 64,706,927 24,094,230 88.062.7 63.8 59.940,612,697
Union City, City of Miscellaneous 88,176,226 22,178,108 77.474.8 55.3 54.065,998,118
Union Sanitary District Miscellaneous 94,015,409 25,145,521 81.173.2 57.7 53.868,869,888
University Enterprises Inc. Miscellaneous 41,696,075 8,170,371 83.080.4 62.3 57.333,525,704
Upland, City of Miscellaneous 97,893,932 25,732,304 91.373.7 66.1 61.272,161,628Safety Plan 150,435,723 43,452,163 89.371.1 63.9 60.8106,983,560
Vacaville, City of Miscellaneous 172,996,776 53,086,329 88.269.3 62.0 58.7119,910,447Safety Plan 199,208,500 73,209,234 83.363.2 61.5 57.7125,999,266
Vallejo, City of Miscellaneous 213,530,941 73,207,901 86.565.7 65.3 59.6140,323,040Safety Plan 373,951,471 125,775,051 81.566.3 58.8 54.8248,176,420
Valley Mountain Regional Center, Inc. Miscellaneous 46,292,604 8,682,825 102.081.2 81.4 75.037,609,779
Vernon, City of Miscellaneous 108,107,278 21,596,960 93.480.0 67.4 63.286,510,318Safety Plan 169,856,987 36,580,427 90.378.4 65.8 60.9133,276,560
Victorville, City of Miscellaneous 117,307,432 24,718,532 83.378.9 64.8 58.492,588,900
Visalia, City of Miscellaneous 154,724,200 44,057,697 80.671.5 60.9 55.6110,666,503Safety Plan 144,683,223 41,865,543 88.171.0 63.7 60.0102,817,680
Vista, City of Miscellaneous 98,637,696 24,708,731 80.574.9 58.2 53.173,928,965
Walnut Creek, City of Miscellaneous 154,890,638 44,642,844 93.371.1 68.0 63.0110,247,794
Water Employee Services Authority Miscellaneous 54,553,706 14,546,243 90.773.3 64.8 61.340,007,463
Watsonville, City of Miscellaneous 96,514,744 22,458,472 91.976.7 68.2 63.174,056,272
West Covina, City of Miscellaneous 120,586,340 25,291,585 91.779.0 67.2 63.095,294,755Safety Plan 281,287,468 87,267,204 98.768.9 70.7 65.4194,020,264
West Hollywood, City of Miscellaneous 92,016,524 31,371,734 77.365.9 57.9 52.260,644,790
West Sacramento, City of Miscellaneous 83,152,275 26,335,794 67.268.3 52.3 47.256,816,481
Westminster, City of Miscellaneous 99,198,502 26,399,446 83.673.3 62.9 54.272,799,056
Whittier, City of Miscellaneous 138,067,984 26,614,896 102.580.7 72.3 67.3111,453,088Safety Plan 146,237,060 50,899,462 80.265.1 58.4 54.395,337,598
Woodland, City of Miscellaneous 91,365,313 30,309,606 85.966.8 60.2 56.961,055,707Safety Plan 100,029,464 30,819,846 84.869.1 62.7 58.569,209,618
Yolo, County of Miscellaneous 496,694,522 146,920,994 83.770.4 61.7 57.3349,773,528Safety Plan 136,171,633 44,254,807 88.667.5 59.491,916,826
Yorba Linda, City of Miscellaneous 50,663,748 13,868,970 87.072.6 64.0 59.836,794,778
Yuba City, City of Miscellaneous 86,818,020 24,802,492 93.671.4 67.5 63.062,015,528
Yuba, County of Miscellaneous 231,937,885 66,622,328 88.671.2 64.8 59.9165,315,557Safety Plan 76,163,284 22,108,078 83.570.9 62.8 58.054,055,206
288

289
4.1 Funding Position of Contracting Agencies – Risk Pools
Government Code (GC) sections 20840, 20841, and 20842 allow the CalPERS Board to create risk pools and mandate public agency participation in the pools. Article 7.6 was added to Title 2 of the California Code of Regulations, establishing the criteria for participation in risk pools. Risk pooling is the process of combining assets and liabilities across employers to produce large risk-sharing pools. These risk-sharing pools help dramatically reduce or eliminate the large fluctuations in the employer’s contribution rate caused by unexpected demographic events. Plans are assigned to risk pools based on their service retirement formula. CalPERS initiated risk pooling during the fiscal year ended June 30, 2004. However, due to the way CalPERS provides the information to the State Controller's Office, the first year that the pooled information was reflected in this publication was the fiscal year ended June 30, 2005. Agencies that do not have large numbers of active employees are much more susceptible to the impact of unforeseen demographic events, making the agency’s rates fluctuate dramatically from year to year. In an effort to help ensure more stability in the rates of these agencies, they were brought together into a pool – in effect creating one larger agency to help spread out the impact of unforeseen demographic events. With the exception of the Terminated Agency Pool, the following ten pools will be presented, followed by the name of the plans participating within that specific pool:
Miscellaneous 2.0%@55: Miscellaneous employees subject to the 2%@55 formula (GC section 21354 or GC section 21354.1).
Miscellaneous 2.0%@60: Miscellaneous employees subject to the 2%@60 formula (GC section 21353) or 1.25%@65% (GC section 21076).
Miscellaneous 2.5%@55: Miscellaneous employees subject to the 2.5%@55 formula (GC section 21354.4). Miscellaneous 2.7%@55: Miscellaneous employees subject to the 2.7%@55 formula (GC section 21354.5). Miscellaneous 3.0%@60: Miscellaneous employees subject to the 3%@60 formula (GC section 21354.3). Safety 2.0%@50: Safety employees subject to the 2%@50 safety formula (GC section 21362) or 2.5%@55
safety formula (GC Section 21363). Safety 2.0%@55: Safety employees subject to the 2%@55 safety formula (GC section 21369) or
0.5%(1/2%)@55 formula (GC section 21366). Safety 3.0%@50: Safety employees subject to the 3%@50 safety formula (GC section 21362.2). Safety 3.0%@55: Safety employees subject to the 3%@55 safety formula (GC section 21363.1). Inactive Pool: Rate plans determined to be inactive in the June 30, 2004 actuarial valuation (i.e. no active
members in the rate plan), regardless of the benefit formula applicable to the inactive members of the plan. Rate plans moving from an active status to an inactive status will be transferred from their then current pool to the inactive plan pool following a period of at least one year in which they had no active members.
Terminated Agency Pool: GC section 20577.5 allows CalPERS to merge a plan that has been terminated pursuant to GC 20570, 20571, or 20572 into the terminated agency pool without benefit reduction, or with a lesser reduction, if certain conditions are met. When an agency contract is terminated, the agency’s assets and liabilities are determined prior to the employees/retirees of the terminated employer being moved into the terminated public agency pool. A list of terminated employers has not been provided, as they no longer have the responsibility for funding the benefits.

290
This Page Intentionally Left Blank

Actuarial Market Value* UnfundedRisk Pool Name Liabilities of Assets Liabilities 2011 2010 2009 2008Miscellaneous 2.0%@55 3,619,833,905 2,867,303,802 752,530,103 79.21 70.11 64.88 92.86
Agoura Hills and Calabasas Community Center Camrosa Water DistrictAgoura Hills, City of Canyon Lake, City ofAlameda Corridor Transportation Authority Capitol Area Development AuthorityAlameda County Fire Department Carmel‐By‐The‐Sea, City ofAlameda County Mosquito Abatement District Carmichael Water DistrictAliso Viejo, City of Carpinteria Sanitary DistrictAlliance of Schools for Cooperative Insurance Programs Carpinteria Valley Water DistrictAlpine, County of Carpinteria, City ofAltadena Library District Castaic Lake Water AgencyAmador County Transportation Commission Central Basin Municipal Water DistrictAmador Rapid Transit District Central Coast Water AuthorityAmador Water Agency Central Sierra Child Support AgencyAmerican Canyon, City of Central Water DistrictAmerican River Flood Control District Chico Area Recreation and Park DistrictAnderson Cemetery District Children and Families Commission of San Luis Antelope Valley Transit Authority Obispo CountyArcade Creek Recreation and Park District Citrus Heights Water DistrictAromas County Water District Clayton, City ofArrowbear Park County Water District Clearlake Oaks County Water DistrictArvin, City of Clearlake, City ofAssociation of Monterey Bay Area Governments Cloverdale, City ofAtherton, Town of Coachella Valley Association of GovernmentsAuburn Area Recreation and Park District Coachella Valley Public Cemetery DistrictAuburn Public Cemetery District Coast Life Support DistrictAuburn, City of College of the Canyons FoundationAvalon, City of Colusa County One‐Stop PartnershipAvenal, City of Colusa Mosquito Abatement DistrictAztec Shops, Ltd., San Diego University Colusa, City ofBay Area Water Supply and Conservation Agency Contra Costa County Schools Insurance GroupBear Valley Community Services District Contra Costa Transportation AuthorityBellflower, City of Cooperative Organization for the Development of Employee Belmont, City of Selection ProceduresBelvedere, City of Copperopolis Fire Protection DistrictBelvedere‐Tiburon Library Agency Corcoran, City ofBig Bear City Airport District Cordova Recreation and Park DistrictBig Bear Municipal Water District Corning, City ofBishop, City of Costa Mesa Sanitary DistrictBlack Gold Cooperative Library System Crescent City Harbor DistrictBrawley, City of Crescenta Valley Water DistrictBrooktrails Township Community Services District CSAC Excess Insurance AuthorityBrowns Valley Irrigation District Dairy Council of CaliforniaBuellton, City of Dana Point, City ofBuena Park Library District Del Paso Manor Water DistrictBurney Fire District Del Puerto Water DistrictButte County Air Quality Management District Diamond Bar, City ofButte County Association of Governments Dinuba, City ofButte County In‐Home Supportive Services Public Authority Dixon Unified School District Library DistrictButte Local Agency Formation Commission Donald P. and Katherine B. Loker University Butte Schools Self‐Funded Programs Student Union, Inc.Cabrillo College Foundation Dunsmuir, City ofCachuma Operations and Maintenance Board East Quincy Services DistrictCalabasas, City of East San Gabriel Valley Human Services ConsortiumCalaveras Council Of Governments El Dorado County Local Transportation CommissionCalifornia Authority of Racing Fairs El Dorado County Transit AuthorityCalifornia Bear Credit Union El Dorado Hills Community Services DistrictCalifornia Fair Services Authority Esparto Fire Protection DistrictCalifornia Firefighter Joint Apprenticeship Committee Exeter District AmbulanceCalifornia Interscholastic Federation ‐ Northern Section Fair Oaks Recreation & Park DistrictCalifornia Interscholastic Federation, Central Coast Section Fair Oaks Water DistrictCalifornia Interscholastic Federation, North Coast Section Fairfax, Town ofCalifornia Interscholastic Federation, Sac‐Joaquin Section Feather River Recreation and Park DistrictCalifornia Interscholastic Federation, San Diego Section Fillmore, City ofCalifornia Interscholastic Federation, Southern Section Florin Resource Conservation District Elk Grove California Interscholastic Federation, State Office Water WorksCalifornia Joint Powers Insurance Authority Foothill Municipal Water DistrictCalifornia Municipal Utilities Association Fort Bragg, City ofCalifornia Redevelopment Association Fort Ord Reuse AuthorityCalifornia State and Federal Employees No. 20 Credit Union Fresno Westside Mosquito Abatement DistrictCalifornia State University, Fresno Athletic Corporation Fullerton, California State University, Associated StudentsCalifornia State University, San Bernardino Student Union Fulton El‐Camino Recreation and Park DistrictCalifornia State University‐Fresno Association, Inc. Garden Valley Fire Protection DistrictCalleguas Municipal Water District Gilsizer County Drainage DistrictCambria Community Healthcare District Glenn County Mosquito and Vector Control DistrictCameron Park Community Services District Gold Ridge Resource Conservation District
* Effective June 30, 2007, CalPERs board decided to use the Market Value of Assets, instead of Actuarial Value of Assets, because it provides a better measure of the plan's ability to pay benefits and is a better indicator of the short term solvency of a plan
291
4.1 Funding Postion of Contracting Agencies, Risk Pools
Funding Ratio (%)*

Actuarial Market Value* UnfundedRisk Pool Name Liabilities of Assets Liabilities 2011 2010 2009 2008Miscellaneous 2.0%@55 - (Continued) 3,619,833,905 2,867,303,802 752,530,103 79.21 70.11 64.88 92.86
Goleta Sanitary District Marin Children and Families CommissionGoleta West Sanitary District Marin County Housing AuthorityGoleta, City of Marin County In‐Home Supportive Services Public Authority Granada Sanitary District Marina, City ofGreater Los Angeles County Vector Control District Martinez, City ofGreater Vallejo Recreation District Marysville, City ofGreenfield, City of Maxwell Public Utility DistrictGridley Biggs Cemetery District Maywood, City ofGridley, City of McKinleyville Community Services DistrictGrossmont‐Cuyamaca Community College District Meeks Bay Fire Protection District
Auxiliary Organization Mendocino County Russian River Flood Control & Water Guadalupe, City of Conservation Improvement DistrictHalf Moon Bay, City of Mesa Consolidated Water DistrictHappy Homestead Cemetery District Metropolitan Cooperative Library SystemHayward, California State University, Auxiliary Foundation, Inc. Mid Peninsula Water DistrictHenry Miller Reclamation District No. 2131 Mid‐Placer Public Schools Transportation AgencyHercules, City of Midway City Sanitary DistrictHermosa Beach, City of Mill Valley, City ofHighland, City of Mokelumne Rural Fire DistrictHousing Authority of the County of Butte Monte Sereno, City ofHousing Authority of the County of Santa Cruz Montecito Sanitary District of Santa Barbara CountyHuman Rights/Fair Housing Commission of the Montecito Water District
City & County of Sacramento Monterey Bay Unified Air Pollution Control DistrictHumboldt Bay Harbor Recreation and Conservation District Monterey County Local Agency Formation CommissionHumboldt Bay Municipal Water District Monterey County Water Resources AgencyHumboldt Community Services District Monterey Peninsula Airport DistrictHumboldt No. 1 Fire Protection District of Humboldt County Monterey Peninsula Water Management DistrictHumboldt State University Center Board of Directors Moorpark, City ofHumboldt Transit Authority Moraga, Town ofHumboldt Waste Management Authority Moulton‐Niguel Water DistrictIntergovernmental Training and Development Center Mt. San Antonio College Associated StudentsIrwindale, City of Mt. Shasta, City ofIsla Vista Recreation and Park District Municipal Pooling AuthorityJoshua Basin Water District Municipal Water District of Orange CountyJurupa Area Recreation and Park District Napa Sanitation DistrictKing City, City of Needles, City ofKings County Area Public Transit Agency Nevada County Local Agency Formation CommissionKings County Association Of Governments Nevada‐Sierra Regional IHSS Public AuthorityKings IHSS Public Authority Newhall County Water DistrictKings Mosquito Abatement District North Bay Cooperative Library SystemKingsburg, City of North Bay Schools Insurance AuthorityKonocti County Water District North Central Counties ConsortiumLa Canada Flintridge, City of North Coast Railroad AuthorityLa Mirada, City of North Coast Unified Air Quality Management DistrictLaguna Beach County Water District North Tahoe Public Utility DistrictLaguna Niguel, City of Northern California Special Districts Insurance AuthorityLaguna Woods, City of Northern Salinas Valley Mosquito Abatement DistrictLake Forest, City of Northern Sierra Air Quality Management DistrictLake Hemet Municipal Water District Northshore Fire Protection DistrictLake Shastina Community Services District Novato Sanitary DistrictLakeport County Fire Protection District Oakdale Rural Fire Protection DistrictLathrop, City of Oceano Community Services DistrictLawndale, City of Ojai Valley Sanitary DistrictLemoore, City of Ojai, City ofLittle Lake Fire Protection District Orange County Transportation CommissionLivermore/Amador Valley Transit Authority Orange County Vector Control DistrictLivingston, City of Orland Cemetery DistrictLocal Government Services Authority, JPA Oroville Mosquito Abatement DistrictLoma Linda, City of Oroville, City ofLompico County Water District Pacific Grove, City ofLong Beach State University, Associated Students Pajaro Valley Public Cemetery DistrictLong Beach State University, Forty‐Niner Shops, Inc. Pajaro Valley Water Management AgencyLoomis Fire Protection District Palmdale Water DistrictLoomis, Town of Palos Verdes Estates, City ofLos Altos Hills, Town of Palos Verdes Library DistrictLos Gatos‐Saratoga Department of Community Paradise Recreation and Park District
Education and Recreation Paradise, Town ofLos Osos Community Services District Parlier, City ofLower Lake Cemetery District Pasadena City College BookstoreLower Tule River Irrigation District Peninsula Fire Protection DistrictMadera Cemetery District Pico Water DistrictMadera County Mosquito and Vector Control District Pine Grove Mosquito Abatement DistrictMain San Gabriel Basin Watermaster Pioneer Cemetery DistrictMalibu, City of Placentia, City ofManagement of Emeryville Services Authority Placer County Cemetery District No. 1
* Effective June 30, 2007, CalPERs board decided to use the Market Value of Assets, instead of Actuarial Value of Assets, because it provides a better measure of the plan's ability to pay benefits and is a better indicator of the short term solvency of a plan
292
4.1 Funding Position of Contracting Agencies, Risk Pools
Funding Ratio (%)*

Actuarial Market Value* UnfundedRisk Pool Name Liabilities of Assets Liabilities 2011 2010 2009 2008Miscellaneous 2.0%@55 - (Continued) 3,619,833,905 2,867,303,802 752,530,103 79.21 70.11 64.88 92.86
Placer County Resource Conservation District Seaside, City ofPlacer County Transportation Commission Sebastopol, City ofPlacer Hills Fire Protection District Selma Cemetery DistrictPlacer Mosquito and Vector Control District Selma‐Kingsburg‐Fowler County Sanitation DistrictPleasant Hill Recreation and Park District Sewer Authority Mid‐CoastsidePleasant Hill, City of Shafter Wasco Irrigation DistrictPleasant Hill‐Martinez Joint Facilities Agency Shafter, City ofPlumas Eureka Community Services District Shasta Area Safety Communications AgencyPomerado Cemetery District Shasta Mosquito and Vector Control DistrictPomona, Cal Poly, Kellogg Unit Foundation, Inc. Shiloh Public Cemetery DistrictPortola Valley, Town of Signal Hill, City ofQuartz Hill Water District Silicon Valley Animal Control DistrictQuincy Community Services District Solano County Mosquito Abatement DistrictRancho Murieta Community Services District Solano County Water AgencyReclamation District No. 1000 Solano Transportation AuthorityReclamation District No. 1001 Sonoma, City ofRed Bluff, City of Sonoma‐Marin Area Rail Transit District Reedley, City of South Bay Regional Public Communications AuthorityRescue Fire Protection District South Bayside System AuthorityResource Conservation District of the Santa Monica Mountains South Coast Water DistrictRincon Del Diablo Municipal Water District South Orange County Waste Water AuthorityRio Linda Water District South Pasadena, City ofRio Vista, City of Southern Sonoma County Resource Conservation District Riverbank, City of Special District Risk Management AuthorityRiverside County Law Library Squaw Valley Public Service DistrictRolling Hills Estates, City of St. Helena, City ofRosemead, City of Stanton, City ofRoss, Town of State Water ContractorsRussian River Fire Protection District Stege Sanitary DistrictSacramento County Law Library Stockton East Water DistrictSacramento Metropolitan Air Quality Management District Successor Agency To The Redevelopment of theSacramento Metropolitan Cabletelevision Commission City of FresnoSacramento Metropolitan Water Authority Suisun City, City ofSacramento Suburban Water District Suisun Resource Conservation DistrictSalinas Valley Solid Waste Authority Sutter Cemetery DistrictSan Anselmo, Town of Sutter County Housing AuthoritySan Diego Rural Fire Protection District Sweetwater Springs Water DistrictSan Diego State University Associated Students Taft, City ofSan Dimas, City of Tehachapi, City ofSan Fernando, City of Three Valleys Municipal Water DistrictSan Francisco County Transportation Authority Tiburon, Town ofSan Francisco Health Authority Transportation Agency for Monterey CountySan Francisquito Creek Joint Powers Authority Tri‐City Mental Health CenterSan Gabriel Valley Council of Governments Tulelake, City ofSan Gabriel Valley Mosquito and Vector Control District Turlock Mosquito Abatement DistrictSan Gabriel Valley Municipal Water District Upland City Housing AuthoritySan Joaquin County Housing Authority Valley Springs Public Utility DistrictSan Joaquin County IHSS Public Authority Ventura College FoundationSan Joaquin, City of Ventura County Schools Business Services AuthoritySan Jose, City of Ventura County Schools Self‐Funding AuthoritySan Lorenzo Valley Water District Ventura Port DistrictSan Luis Obispo ‐ Cal Poly Associated Students, Inc. Villa Park, City ofSan Luis Obispo City Housing Authority Walnut Valley Water DistrictSan Luis Obispo Council of Governments Walnut, City ofSan Luis Obispo Regional Transit Authority West Cities Communication CenterSan Marino, City of West County Transportation AgencySan Mateo County Law Library West Stanislaus Irrigation DistrictSanta Ana Watershed Project Authority West Valley Water DistrictSanta Clara County Health Authority Westborough Water DistrictSanta Clara County Open‐Space Authority Western Contra Costa County Transit AuthoritySanta Clara County Schools Insurance Group Westlands Water DistrictSanta Clarita Valley School Food Services Agency Williams, City ofSanta Cruz County Regional Transportation Commission Windsor, Town ofSanta Cruz Local Agency Formation Commission Winters, City ofSanta Cruz Regional 9‐1‐1 Woodlake, City ofSanta Maria Public Airport District Woodside Fire Protection DistrictSanta Nella County Water District Yolo County Communications Emergency Services AgencySanta Paula, City of Yolo County Housing AuthoritySanta Ynez River Water Conservation District, Improvement District No. 1 Yolo County In‐Home Supportive Services Public AuthoritySaratoga, City of Yolo‐Solano Air Quality Management DistrictSchool Risk and Insurance Management Group Yorba Linda Water DistriSchools Excess Liability Fund Yreka, City ofSchools Insurance Authority Yuba County Water AgencyScotts Valley Fire Protection District Yuba Sutter Transit AuthoritySeal Beach, City of Yucaipa, City of
* Effective June 30, 2007, CalPERs board decided to use the Market Value of Assets, instead of Actuarial Value of Assets, because it provides a better measure of the plan's ability to pay benefits and is a better indicator of the short term solvency of a plan
293
4.1 Funding Postion of Contracting Agencies, Risk Pools
Funding Ratio (%)*

Actuarial Market Value* UnfundedRisk Pool Name Liabilities of Assets Liabilities 2011 2010 2009 2008Miscellaneous 2.0%@60 682,375,804 572,006,330 110,369,474 83.83 74.93 69.20 97.39
Academic Senate for California Community Colleges Durham Mosquito Abatement DistrictAccess Services Incorporated East Orange County Water DistrictAdelanto, City of Ebbetts Pass Fire Protection DistrictAlameda County Law Library Etna, City ofAlta Irrigation District Fall River Mills Community Services DistrictAngiola Water District Farmersville, City ofArtesia, City of Feather Water DistrictAssociated Students, California State University, Florin County Water District
San Bernardino Fort Bragg Fire Protection AuthorityAssociation of California Water Agencies ‐ Joint Powers Fountain Valley, City of
Insurance Authority Fresno County Law LibraryAtascadero Cemetery District Glendale College, Associated Students ofAvila Beach Community Services District Golden Hills Community Service District Bakersfield State College Foundation Gonzales, City ofBard Water District Greater Anaheim Special Education Local Plan AreaBardsdale Cemetery District Green Valley County Water DistrictBarstow Cemetery District Grossmont Schools Federal Credit UnionBeach Cities Health District Gualala Community Services DistrictBear Mountain Recreation and Park District Health Plan of San JoaquinBella Vista Water District Hidden Hills, City ofBenicia City Housing Authority Hilton Creek Community Services DistrictBeta Healthcare Group Risk Management Authority Housing Authority of the City of CalexicoBiggs, City of Housing Authority of the City of San BuenaventuraBishop, City of Housing Authority of the City of South San FranciscoBlanchard/Santa Paula Public Library District Humboldt County Association of GovernmentsBodega Bay Fire Protection District Imperial, City ofBolinas Community Public Utility District Indian Wells Valley Water DistrictBoron Community Services District Inland Empire Resource Conservation DistrictBorrego Springs Fire Protection District Intelecom Intelligent TelecommunicationsBradbury, City of Inverness Public Utility DistrictBrannan‐Andrus Levee Maintenance District Jackson Valley Irrigation DistrictBrisbane, City of Kaweah Delta Water Conservation DistrictBurney Basin Mosquito Abatement District Kelseyville Fire Protection DistrictByron‐Bethany Irrigation District Kerman, City ofCalifornia Central Valley Flood Control Association Kern County Law LibraryCalifornia Interscholastic Federation, Central Section Kern Health SystemsCalifornia Interscholastic Federation, Southern Section Kern River Valley Cemetery DistrictCalifornia Pines Community Services District Kern‐Tulare Water District California School Boards Association Kettleman City Community Services DistrictCalifornia Special Districts Association Kings County Waste Management AuthorityCalifornia State University, Stanislaus Foundation Kinneloa Irrigation DistrictCalimesa, City of La Habra Heights County Water DistrictCalipatria, City of La Habra Heights, City ofCamarillo Health Care District La Puente Valley County Water DistrictCambria Cemetery District Laguna Hills, City ofCarmel Area Wastewater Agency (Monterey) Lake Don Pedro Community Services DistrictCasitas Municipal Water District Lamont Public Utility DistrictCastroville Water District Lassen County Waterworks District No. 1Cawelo Water District League of California CitiesCenterville Community Services District Levee District No. 1 of Sutter CountyCentral Calaveras Fire and Rescue Protection District Lincoln, City ofChino Basin Water Conservation District Linda Fire Protection DistrictCloverdale Citrus Fair Lindsay Strathmore Public Cemetery DistrictClovis Cemetery District Littlerock Creek Irrigation DistrictCoachella Valley Mosquito and Vector Control District Live Oak Cemetery DistrictCoalinga/Huron Unified School District Library District Livermore City Housing AuthorityCoalinga‐Huron Cemetery District Long Beach State University, Associated StudentsCoalinga‐Huron Recreation and Park District Los Alamos Community Services DistrictColfax Cemetery District Los Angeles County West Vector Control DistrictColfax, City Of Lower Lake County Waterworks District No. 1Community College League of California Majestic Pines Community Services DistrictCommunity Development Commission of Mendocino County Mammoth Lakes Fire DistrictCompton Creek Mosquito Abatement District Marina Coast Water DistrictConsolidated Mosquito Abatement District Marinwood Community Services DistrictContra Costa County Law Library Mariposa Public Utility DistrictCorning Water District McCloud Community Services DistrictCottonwood Water District Meiners Oaks County Water DistrictCrockett Community Services District Mendocino City Community Services DistrictCutler Public Utility District Mendocino Transit AuthorityCutler‐Orosi Joint Powers Wastewater Authority Mid‐Placer Public Schools Transportation AgencyDavis Cemetery District Millview County Water DistrictDel Norte County Library District Minter Field Airport DistrictDel Rey Community Services District Montague, City ofDel Rey Oaks, City of Monterey County Regional Fire Protection DistrictDelano Mosquito Abatement District Morongo Basin Transit Authority
* Effective June 30, 2007, CalPERs board decided to use the Market Value of Assets, instead of Actuarial Value of Assets, because it provides a better measure of the plan's ability to pay benefits and is a better indicator of the short term solvency of a plan
294
4.1 Funding Postion of Contracting Agencies, Risk Pools
Funding Ratio (%)*

Actuarial Market Value* UnfundedRisk Pool Name Liabilities of Assets Liabilities 2010 2009 2008 2007Miscellaneous 2.0%@60 - (Continued) 624,423,437 467,903,476 156,519,961 74.93 69.20 97.39 110.48
Mother Lode Job Training Agency San Francisco, City and County ofMountains Recreation and Conservation Authority San Jacinto Valley Cemetery DistrictMurphys Sanitary District San Mateo County In‐Home Supportive ServicesNapa County Resource Conservation District Public AuthorityNapa County Transportation and Planning Agency Sanger Cemetery DistrictNational Orange Show Santa Barbara County Law LibraryNevada Cemetery District Santa Barbara County Special Education Local Plan AreaNevada City, City of Santa Barbara Regional Health AuthorityNewcastle Rocklin Gold Hill Cemetery District Santa Paula City Housing AuthorityNewport Beach City Employees Federal Credit Union Serrano Water DistrictNorth Delta Water Agency Shasta Community Services DistrictNorth Kern Water Storage District Shasta Valley Cemetery DistrictOakdale Irrigation District Sierra Lakes County Water DistrictOakley, City of Sierra‐Sacramento Valley Emergency Medical Ophir Hill Fire Protection District Services AgencyOrange Cove, City of Signal Hill, City ofOrosi Public Utility District Silveyville Cemetery DistrictOroville Cemetery District Solana Beach, City ofPalm Ranch Irrigation District Solano Irrigation DistrictPalo Verde Valley District Library Soledad, City ofParadise, Town of South Kern Cemetery DistrictPaso Robles City Housing Authority Stallion Springs Community Services DistrictPatterson Water District Stanislaus County Housing AuthorityPenn Valley Fire Protection District Strawberry Recreation DistrictPinedale County Water District Sylvan Cemetery DistrictPixley Irrigation District Tahoe Resource Conservation District Planning & Service Area II, Area Agency on Aging Tehachapi Valley Recreation and Park DistrictPleasant Valley County Water District Tehachapi‐Cummings County Water DistrictPleasant Valley Recreation and Park District Tehama County Mosquito Abatement DistrictPomona Valley Transportation Authority Three Rivers Community Services DistrictPomona, California State Polytechnic University, Tulare Mosquito Abatement District Associated Students, Inc. Tulare Public CemeteryPorter Vista Public Utility District Union Public Utility DistrictPorterville Irrigation District Vacaville Fire Protection DistrictPorterville Public Cemetery District Vacaville‐Elmira Cemetery DistrictPurissima Hills Water District Ventura County Law LibraryReclamation District No. 3 Ventura County Transportation CommissionReclamation District No. 999 Ventura River County Water DistrictRed Bluff Cemetery District Visalia Public Cemetery DistrictReedley Cemetery District Wasco Recreation and Park DistrictResort Improvement District No. 1 Washington Colony Cemetery DistrictRio Alto Water District Weaverville Sanitary DistrictRio Vista Cemetery District Weed, City ofRiverbank City Housing Authority West Kern Water DistrictRiverside County Citrus Pest Control District No. 2 Westwood Community Services DistrictRolling Hills, City of Wilton Fire Protection DistrictRoseville Public Cemetery District Winterhaven Water DistrictSalton Community Services District Winton Water and Sanitary DistrictSan Diego County Law Library Yolo County Federal Credit UnionSan Francisco Community College District Bookstore Auxiliary Yucaipa Valley Water DistrictSan Francisco County Law Library
Actuarial Market Value* UnfundedRisk Pool Name Liabilities of Assets Liabilities 2011 2010 2009 2008Safety 2.5%@55 2,135,350,204 1,543,100,350 592,249,854 72.26 63.94 59.38 87.99
Alameda County Congestion Management Agency Capitola, City ofAlameda County Schools Insurance Group Cayucos Sanitary DistrictAlameda County Transportation Improvement Authority Cayucos‐Morro Bay Cemetery DistrictAlameda County Waste Management Authority Central County Fire DepartmentAlbany Municipal Services Joint Powers Authority Central Fire Protection District of Santa Cruz CountyAlbany, City of Chester Public Utility DistrictAnderson Fire Protection District Chino Basin WatermasterArroyo Grande District Cemetery Chino Valley Independent Fire DistrictArroyo Grande, City of Chowchilla, City ofAssociation of Bay Area Governments Coastside County Water DistrictAssociation of California Water Agencies Colma, Town ofAtascadero, City of Corte Madera, Town ofBeaumont District Library Crescent City, City ofBlue Lake, City of Crestline Village Water DistrictBlythe, City of De Luz Community Services DistrictButte County Mosquito and Vector Control District Denair Community Services DistrictCalifornia Association for Park and Recreation Indemnity Desert Water AgencyCalistoga, City of Dixon, City of
* Effective June 30, 2007, CalPERs board decided to use the Market Value of Assets, instead of Actuarial Value of Assets, because it provides a better measure of the plan's ability to pay benefits and is a better indicator of the short term solvency of a plan
295
Funding Ratio (%)*
4.1 Funding Postion of Contracting Agencies, Risk Pools
Funding Ratio (%)*

Actuarial Market Value* UnfundedRisk Pool Name Liabilities of Assets Liabilities 2011 2010 2009 2008Miscellaneous 2.5%@55 - (Continued) 2,135,350,204 1,543,100,350 592,249,854 72.26 63.94 59.38 87.99
Duarte, City of Redwood Empire School Insurance GroupEast Bay Dischargers Authority Regional Council of Rural CountiesEast Palo Alto, City of Rosamond Community Services DistrictEastern Sierra Transit Authority Rose Bowl Operating CompanyExposition Metro Line Construction Authority Rowland Water DistrictFairfax, Town of Sacramento Area Council of GovernmentsFallbrook Public Utility District Sacramento Transportation AuthorityFeather River Air Quality Management District Sacramento‐Yolo Mosquito and Vector Control DistrictFirebaugh, City of San Benito County Water DistrictFountain Valley, City of San Bernardino Valley Water Conservation DistrictGolden Sierra Job Training Agency San Carlos, City ofGrass Valley, City of San Elijo Joint Powers AuthorityGreat Basin Unified Air Pollution Control District San Francisco Bay Area Water EmergencyGrover Beach, City of Transportation AuthorityGustine, City of San Luis Water DistrictHealdsburg, City of San Mateo County Harbor DistrictHeber Public Utility District San Pablo, City ofHeritage Ranch Community Services District Sanger, City ofHerlong Public Utility District Santa Clara County Law LibraryHidden Valley Lake Community Services District Santa Cruz Port DistrictHi‐Desert Water District Santa Paula, City ofHiggins Area Fire Protection District Sausalito, City ofHollister, City of Scotts Valley, City ofIone, City of Sewerage Commission ‐ Oroville RegionJackson, City of Shasta Lake Fire Protection DistrictKern County Council of Governments Shasta Local Agency Formation Commission Kirkwood Meadows Public Utilities District Sierra Madre, City ofLa Puente, City of Solana Beach, City ofLa Quinta, City of Solvang, City ofLa Verne, City of Soquel Creek Water DistrictLake Arrowhead Community Services District South County Support Services AgencyLake Elsinore, City of South El Monte, City ofLakeport, City of South Orange County Waste Water AuthorityLarkspur, City of South San Joaquin Irrigation DistrictLemon Grove, City of South San Luis Obispo County Sanitation DistrictLomita, City of Southeast Area Social Services Funding AuthorityLos Angeles County Area 'E' Civil Defense and Disaster Board Southern California Public Power AuthorityLos Angeles County Law Library Southwest Transportation AgencyLos Angeles Memorial Coliseum Commission Summit Cemetery DistrictLos Angeles to Pasadena Metro Blue Line Construction Susanville Consolidated Sanitary DistrictMadera Housing Authority, City of Temple City, City ofMcFarland Recreation and Park District Trabuco Canyon Water DistrictMidpeninsula Regional Open Space District Tri‐Dam Housing and Personnel AgencyMill Valley, City of Trindel Insurance FundMonte Vista County Water District Twentynine Palms, City ofNapa County Transportation and Planning Agency Twin Cities Police AuthorityNevada City, City of United Water Conservation DistrictNevada County Resource Conservation District Valley of the Moon Water DistrictNorth Marin Water District Valley Sanitary DistrictOakdale, City of Valley‐Wide Recreation and Park DistrictOakley, City of Victor Valley Wastewater Reclamation AuthorityOlivenhain Municipal Water District Water Facilities Authority‐Joint Powers AgencyOro Loma Sanitary District Waterford, City ofOxnard Harbor District West Bay Sanitary DistrictPebble Beach Community Services District West Contra Costa Integrated Waste Management AuthorityPinole, City of West Valley Mosquito and Vector Control District Pismo Beach, City of West Valley Sanitation District of Santa Clara CountyPlacerville, City of Western Municipal Water DistrictPleasant Valley Recreation and Park District Willow County Water District Public Agency Risk Sharing Authority of California Willow Creek Community Services DistrictRainbow Municipal Water District Winters Cemetery DistrictRancho Cucamonga Fire Protection District Woodside, Town ofRancho Mirage, City of Yolo County Public Agency Risk Management Rancho Palos Verdes, City of Insurance AuthorityRancho Santa Margarita, City of Yolo County Transportation District
Actuarial Market Value* Unfunded Funding Ratio (%)*Risk Pool Name Liabilities of Assets Liabilities 2011 2010 2009 2008Miscellaneous 2.7%@55 2,486,708,579 1,786,913,296 699,795,283 71.86 62.58 57.21 84.95
Alhambra Redevelopment Agency Apple Valley Fire Protection DistrictAlpine Fire Protection District Apple Valley, Town ofAnderson, City of Arcata Fire Protection DistrictAngels, City of Arcata, City of
* Effective June 30, 2007, CalPERs board decided to use the Market Value of Assets, instead of Actuarial Value of Assets, because it provides a better measure of the plan's ability to pay benefits and is a better indicator of the short term solvency of a plan
296
Funding Ratio (%)*
4.1 Funding Postion of Contracting Agencies, Risk Pools

Actuarial Market Value* Unfunded Funding Ratio (%)*Risk Pool Name Liabilities of Assets Liabilities 2011 2010 2009 2008Miscellaneous 2.7%@55 - (Continued) 2,486,708,579 1,786,913,296 699,795,283 71.86 62.58 57.21 84.95
Area 12 Agency on Aging Mammoth Lakes, Town ofBarstow, City of March Joint Powers AuthorityBeaumont‐Cherry Valley Recreation and Park District Marin County Sanitary District No. 1Beaumont‐Cherry Valley Water District Menifee, City ofBell Gardens, City of Menlo Park Fire Protection DistrictBell, City of Merced County Housing AuthorityBig Bear Area Regional Wastewater Agency Millbrae, City ofBig Bear City Community Services District Mission Springs Water DistrictBonita‐Sunnyside Fire Protection District Mojave Water AgencyBrisbane, City of Monterey Peninsula Regional Park DistrictCalaveras County Water District Morro Bay, City ofCalaveras Public Utility District Mt. View Sanitary District of Contra Costa CountyCalifornia Fairs Financing Authority Murrieta Fire ProtectionCalifornia Joint Powers Risk Management Authority Murrieta Valley Cemetery DistrictCallayomi County Water District Murrieta, City ofCastro Valley Sanitary District Napa County Mosquito Abatement DistrictCentral Marin Sanitation Agency Napa Sanitation DistrictCitrus Heights, City Of Newman, City ofClear Creek Community Services District Norco, City ofCotati, City of North Coast County Water DistrictCrestline Lake Arrowhead Water Agency North County Dispatch Joint Powers AgencyCudahy, City of North County Fire Protection District of San Diego CountyDelta Diablo Sanitation District North Tahoe Fire Protection DistrictDesert Hot Springs, City of Northstar Community Services DistrictDiablo Water District Northwest Mosquito and Vector Control DistrictDiamond Springs/El Dorado Fire Protection District Orchard Dale County Water DistrictDublin San Ramon Services District Orland, City ofDublin, City of Patterson, City ofEast Contra Costa Irrigation District Perris, City ofEast Kern Airport District Pine Cove Water DistrictEast Palo Alto Sanitary District Port San Luis Harbor DistrictEast Valley Water District Portola, City ofEl Cerrito, City of Public Entity Risk Management AuthorityEl Dorado County Fire Protection District Rancho Adobe Fire Protection DistrictElk Grove, City of Rancho Cordova, City ofEncina Wastewater Authority Rancho Santa Fe Fire Protection DistrictFern Valley Water District Reclamation District No. 833Forestville County Water District Redwood Empire Municipal Insurance FundFortuna, City of Ridgecrest, City ofFowler, City of Rincon Valley Fire Protection DistrictGeorgetown Divide Public Utility District Riverside County Transportation CommissionGeorgetown Fire Protection District Rosemead, City ofGoleta Water District Ross Valley Fire ServiceGrand Terrace, City of Running Springs Water DistrictGroveland Community Services District Sacramento Regional Fire/EMS Communications CenterHawaiian Gardens, City of San Andreas Sanitary DistrictHeartland Communications Facility Authority San Anselmo, Town ofHelendale Community Services District San Carlos, City ofHerald Fire Protection District San Diego Metropolitan Transit Development BoardHesperia County Water District San Dieguito Water DistrictHesperia, City of San Gabriel County Water DistrictHousing Authority of the City of Eureka San Gabriel, City ofHousing Authority of the City of San Buenaventura San Jacinto, City ofHub Cities Consortium San Mateo County Schools Insurance GroupHughson, City of San Miguel Community Services DistrictImperial Beach, City of San Miguel Consolidated Fire Protection DistrictIndian Wells, City of Sanitary District No. 5 of Marin CountyIndustry, City of Santa Clara County Central Fire Protection DistrictIronhouse Sanitary District Santa Fe Irrigation DistrictJamestown Sanitary District Santee, City ofJune Lake Public Utility District Sausalito‐Marin City Sanitary DistrictJurupa Community Services District Scotts Valley Water DistrictLa Palma, City of Selma, City ofLake Oroville Area Public Utility District Sierra, County ofLake Valley Fire Protection District Sierra‐Sacramento Valley Emergency Medical Lakeside Fire Protection District Services AgencyLas Gallinas Valley Sanitary District of Marin County Solano Irrigation DistrictLincoln, City of Sonora, City ofLindsay, City of South Placer Municipal Utility DistrictLive Oak, City of South Tahoe Public Utility DistrictLocal Agency Formation Commission of Solano County Squaw Valley Public Service DistrictLos Alamitos, City of Stanislaus Consolidated Fire Protection DistrictLos Altos, City of Stinson Beach County Water DistrictLos Banos, City of Suisun‐Fairfield‐Rockville Cemetery DistrictLoyalton, City of Sunnyslope County Water District
* Effective June 30, 2007, CalPERs board decided to use the Market Value of Assets, instead of Actuarial Value of Assets, because it provides a better measure of the plan's ability to pay benefits and is a better indicator of the short term solvency of a plan
297
4.1 Funding Postion of Contracting Agencies, Risk Pools

Actuarial Market Value* UnfundedRisk Pool Name Liabilities of Assets Liabilities 2010 2009 2008 2007Miscellaneous 2.7%@55 - (Continued) 2,297,871,345 1,438,018,113 859,853,232 62.58 57.21 84.95 96.51
Tahoe City Public Utility District Vallejo Sanitation and Flood Control DistrictTahoe‐Truckee Sanitation Agency Valley Center Municipal Water DistrictTiburon Fire Protection District Valley County Water DistrictTri‐County Schools Insurance Group Vandenberg Village Community Services DistrictTrinity County Waterworks District No. 1 Walnut Valley Water DistrictTruckee Donner Public Utility District Western Riverside Council of GovernmentsTruckee Fire Protection District Wildomar, City ofTruckee Sanitary District Willits, City ofTruckee, Town of Willows Cemetery DistrictTruckee‐Tahoe Airport District Windsor Fire Protection Tuolumne Utilities District Yountville, Town ofUpper San Gabriel Valley Municipal Water District Yucca Valley, Town of
Actuarial Market Value* UnfundedRisk Pool Name Liabilities of Assets Liabilities 2011 2010 2009 2008Miscellaneous 3.0%@60 1,023,127,404 746,342,491 276,784,913 72.95 63.26 57.42 83.70
Alturas, City of North of the River Municipal Water DistrictAntelope Valley Mosquito and Vector Control District North Tahoe Fire Protection DistrictAptos/La Selva Fire Protection Agency Pauma Valley Community Services DistrictAtwater, City of Peninsula Traffic Congestion Relief AllianceBeaumont, City of Personal Assistance Services CouncilBighorn‐Desert View Water Agency Piedmont, City ofBorrego Water District Ramona Municipal Water DistrictBurney Water District Richardson Bay Sanitary DistrictCalifornia City, City of Riverside County Regional Park and Open Space DistrictCambria Community Services District Riverside County Waste Resources Management DistrictCentral Basin Municipal Water District Rosedale‐Rio Bravo Water Storage DistrictCoachella, City of Rubidoux Community Services DistrictDel Mar, City of Sacramento Metropolitan Fire DistrictDelta Vector Control District Sacramento Suburban Water DistrictDos Palos, City of San Bernardino Economic Development AgencyEl Dorado Hills County Water District San Bernardino Valley Municipal Water DistrictEscalon, City of San Diego Pooled Insurance Program AuthorityEsparto Community Services District San Fernando, City ofExeter, City of San Gorgonio Pass Water AgencyFairfield‐Suisun Sewer District San Juan Water DistrictForesthill Public Utility District Sand City, City ofFoundation For California Community Colleges Shasta Lake, City ofGlen Ellen Fire Protection District South Feather Water andGold Ridge Fire Protection District South Placer Fire DistrictGrossmont Healthcare District Southern San Joaquin Municipal Utility DistrictHillsborough, Town of Susanville, City ofHousing Authority of the County of Santa Cruz Sutter Creek, City ofKentfield Fire District Templeton Community Services DistrictKern County Cemetery District No. 1 Thermalito Irrigation DistrictKern County Local Agency Formation Commission Trinity Public Utilities DistrictLake County Fire Protection District Twain Harte Community Services DistrictLake County Vector Control District Twentynine Palms Water DistrictLakeside Water District Vallecitos Water DistrictLeucadia Wastewater District Vista Irrigation DistrictLinda County Water District Wasco, City ofLong Beach City College Associated Student Body, Water Replenishment District of Southern California
Liberal Arts Div. - Day Classes Weaverville Community Services DistrictMammoth Lakes Mosquito Abatement District West Basin Municipal Water DistrictMerced County Mosquito Abatement District West County Wastewater DistrictMidway City Sanitary District Westlake Village, City ofMontecito Fire Protection District Wheeler Ridge‐Maricopa Water Storage DistrictMonterey Regional Water Pollution Control Agency Willows, City ofNevada County Consolidated Fire District Woodbridge Rural CountNipomo Community Services District Yuima Municipal Water DistrictNorth Kern Cemetery District
Actuarial Market Value* UnfundedRisk Pool Name Liabilities of Assets Liabilities 2011 2010 2009 2008Safety 2.0%@50 547,694,025 407,998,418 139,695,607 74.49 66.59 61.34 88.82
Amador, County of Bodega Bay Fire Protection DistrictAvalon, City of Calexico, City ofBaldwin Park Unified School District California City, City ofBear Valley Community Services District Campbell, City ofBelvedere, City of Colusa, City of
* Effective June 30, 2007, CalPERs board decided to use the Market Value of Assets, instead of Actuarial Value of Assets, because it provides a better measure of the plan's ability to pay benefits and is a better indicator of the short term solvency of a plan
298
Funding Ratio (%)*
4.1 Funding Postion of Contracting Agencies, Risk Pools
Funding Ratio (%)*
Funding Ratio (%)*

Actuarial Market Value* UnfundedRisk Pool Name Liabilities of Assets Liabilities 2011 2010 2009 2008Safety 2.0%@50 - (Continued) 547,694,025 407,998,418 139,695,607 74.49 66.59 61.34 88.82
Contra Costa Community College District Moraga, Town ofCopperopolis Fire Protection District Mt. Shasta, City ofCrescent City, City of Norco, City ofDel Mar, City of North County Fire Protection District of Monterey CountyDel Norte County Oakdale Rural Fire Protection DistrictDelano, City of Oakland Unified School DistrictEast Kern Airport District Orange Cove, City ofForestville Fire Protection District Oroville, City ofFort Bragg, City of Paso Robles, City ofGreenfield, City of Peninsula Fire Protection DistrictGroveland Community Services District Pismo Beach, City ofHappy Valley Fire Protection District Plumas, County ofHiggins Area Fire Protection District Rancho Adobe Fire Protection DistrictHousing Authority of the City of Los Angeles Red Bluff, City ofHumboldt No. 1 Fire Protection District of Humboldt County Ridgecrest, City ofImperial Beach, City of Rio Vista, City ofImperial, City of Russian River Fire Protection DistrictJackson, City of San Carlos, City ofKelseyville Fire Protection District Sanger, City ofKenwood Fire Protection District Seaside, City ofKing City, City of Selma, City ofLakeport County Fire Protection District South Pasadena, City ofLakeport, City of Suisun Fire Protection DistrictLemoore, City of Taft, City ofLinda Fire Protection District Tuolumne, County ofMarin Community College District Ukiah Valley Fire DistrictMokelumne Rural Fire District Westwood Community Services DistrictMono, County of Yreka, City of
Actuarial Market Value* Unfunded Funding Ratio (%)*Risk Pool Name Liabilities of Assets Liabilities 2011 2010 2009 2008Safety 2.0%@55 87,234,077 67,183,797 20,050,280 77.02 67.90 62.54 90.73
Angels, City of Kerman, City ofArvin, City of Kingsburg, City ofBen Lomond Fire Protection District La Habra Heights, City ofBennett Valley Fire Protection District Little Lake Fire Protection DistrictBolinas Fire Protection District Livingston, City ofBorrego Springs Fire Protection District Loomis Fire Protection DistrictBrooktrails Township Community Services District Ophir Hill Fire Protection DistrictButte‐Glenn Community College District Parlier, City ofCalifornia Pines Community Services District Peardale Chicago Park Fire Protection DistrictCalipatria, City of Penn Valley Fire Protection DistrictCentral Calaveras Fire and Rescue Protection District Placer Hills Fire Protection DistrictCoast Life Support District San Diego Rural Fire Protection DistrictCordelia Fire Protection District of Solano County Suisun City, City ofDel Rey Oaks, City of Taft, City ofDinuba, City of Tulelake, City ofEtna, City of Vacaville Fire Protection DistrictFarmersville, City of Ventura Port DistrictFort Bragg Fire Protection Authority Weed, City ofGonzales, City of Woodlake Fire DistrictGuadalupe, City of Woodlake, City ofInverness Public Utility District Yuba Community College DistrictIone, City of
Actuarial Market Value* UnfundedRisk Pool Name Liabilities of Assets Liabilities 2011 2010 2009 2008Safety 3.0%@50 10,951,745,049 8,164,486,471 2,787,258,578 74.55 65.42 60.18 87.31
Alpine Fire Protection District Atwater, City ofAlpine, County of Auburn, City ofAmador, County of Azusa, City ofAmerican Canyon Fire Protection District Baldwin Park, City ofAnderson, City of Banning, City ofAngels, City of Barstow, City ofAntioch, City of Beaumont, City ofArbuckle‐College City Fire Protection District Bell Gardens, City ofArcata Fire Protection District Bell, City ofArcata, City of Belmont, City ofArroyo Grande, City of Benicia, City ofAtascadero, City of Big Bear City Community Services DistrictAtherton, Town of Bishop, City of
* Effective June 30, 2007, CalPERs board decided to use the Market Value of Assets, instead of Actuarial Value of Assets, because it provides a better measure of the plan's ability to pay benefits and is a better indicator of the short term solvency of a plan
299
Funding Ratio (%)*
Funding Ratio (%)*
4.1 Funding Postion of Contracting Agencies, Risk Pools

Actuarial Market Value* UnfundedRisk Pool Name Liabilities of Assets Liabilities 2011 2010 2009 2008Safety 3.0%@50 - (Continued) 10,951,745,049 8,164,486,471 2,787,258,578 74.55 65.42 60.18 87.31
Blue Lake Fire Protection District Imperial Beach, City ofBlythe, City of Indio, City ofBonita‐Sunnyside Fire Protection District Inyo, County ofBrawley, City of Ione, City ofBrentwood, City of Irwindale, City ofBroadmoor Police Protection District Jackson, City ofBuena Park, City of Kensington Community Service DistrictBurlingame, City of La Habra, City ofCalaveras, County of La Palma, City ofCalifornia City, City of La Verne, City ofCambria Community Healthcare District Laguna Beach, City ofCambria Community Services District Lakeside Fire Protection DistrictCampbell, City of Lassen, County ofCapitola, City of Lincoln, City ofCarmel Regional Fire Ambulance Authority Linden‐Peters Rural County Fire Protection DistrictCarmel‐By‐The‐Sea, City of Livermore, City ofCentral Fire Protection District of Santa Cruz County Lompoc, City ofChester Public Utility District Los Alamitos, City ofChino, City of Los Altos, City ofCitrus Heights, City Of Los Banos, City ofClaremont, City of Los Gatos, Town ofClearlake, City of Madera, City ofCloverdale Fire Protection District Mammoth Lakes, Town ofCloverdale, City of Manhattan Beach, City ofColma, Town of Marina, City ofColton, City of Marinwood Community Services DistrictColusa, County of Mariposa, County ofCompton Unified School District Martinez, City ofCompton, City of Marysville, City ofCorning, City of Menlo Park Fire Protection DistrictCorona, City of Menlo Park, City ofCoronado, City of Modoc, County ofCorte Madera, Town of Mono, County ofCosta Mesa, City of Monrovia, City ofCotati, City of Montclair, City ofCottonwood Fire Protection District Monterey Peninsula Airport DistrictCovina, City of Monterey, City ofCypress, City of Morgan Hill, City ofDel Mar, City of Morro Bay, City ofDesert Hot Springs, City of Murrieta Fire Protection DistrictDiamond Springs/El Dorado Fire Protection District Murrieta, City ofDixon, City of Napa, County ofDos Palos, City of Nevada City, City ofEast Bay Regional Park District Nevada, County ofEl Centro, City of Newark, City ofEl Cerrito, City of Newman, City ofEl Dorado County Fire Protection District North Tahoe Fire Protection DistrictEl Dorado Hills County Water District Northstar Community Services DistrictElk Grove, City of Oakdale, City ofEmeryville, City of Orland, City ofEscalon, City of Oxnard, City ofEstero Municipal Improvement District Pacific Grove, City ofEureka, City of Pacifica, City ofFairfax, Town of Palos Verdes Estates, City ofFontana Unified School District Paradise, Town ofFortuna, City of Paso Robles, City ofFountain Valley, City of Patterson, City ofGalt, City of Piedmont, City ofGarden Valley Fire Protection District Pismo Beach, City ofGardena, City of Pittsburg, City ofGeorgetown Fire Protection District Placentia, City ofGlendale Community College District Placerville, City ofGlendora, City of Pleasant Hill, City ofGlenn, County of Pleasanton, City ofGold Ridge Fire Protection District Port San Luis Harbor DistrictGrass Valley, City of Poway, City ofGridley, City of Rancho Cucamonga Fire Protection DistrictHacienda La Puente Unified School District Rancho Santa Fe Fire Protection DistrictHawthorne, City of Red Bluff, City ofHealdsburg, City of Redlands, City ofHercules, City of Ripon, City ofHermosa Beach, City of Rocklin, City ofHillsborough, Town of Rohnert Park, City ofHollister, City of Running Springs Water DistrictHuntington Park, City of Salinas, City of
* Effective June 30, 2007, CalPERs board decided to use the Market Value of Assets, instead of Actuarial Value of Assets, because it provides a better measure of the plan's ability to pay benefits and is a better indicator of the short term solvency of a plan
300
4.1 Funding Postion of Contracting Agencies, Risk Pools
Funding Ratio (%)*
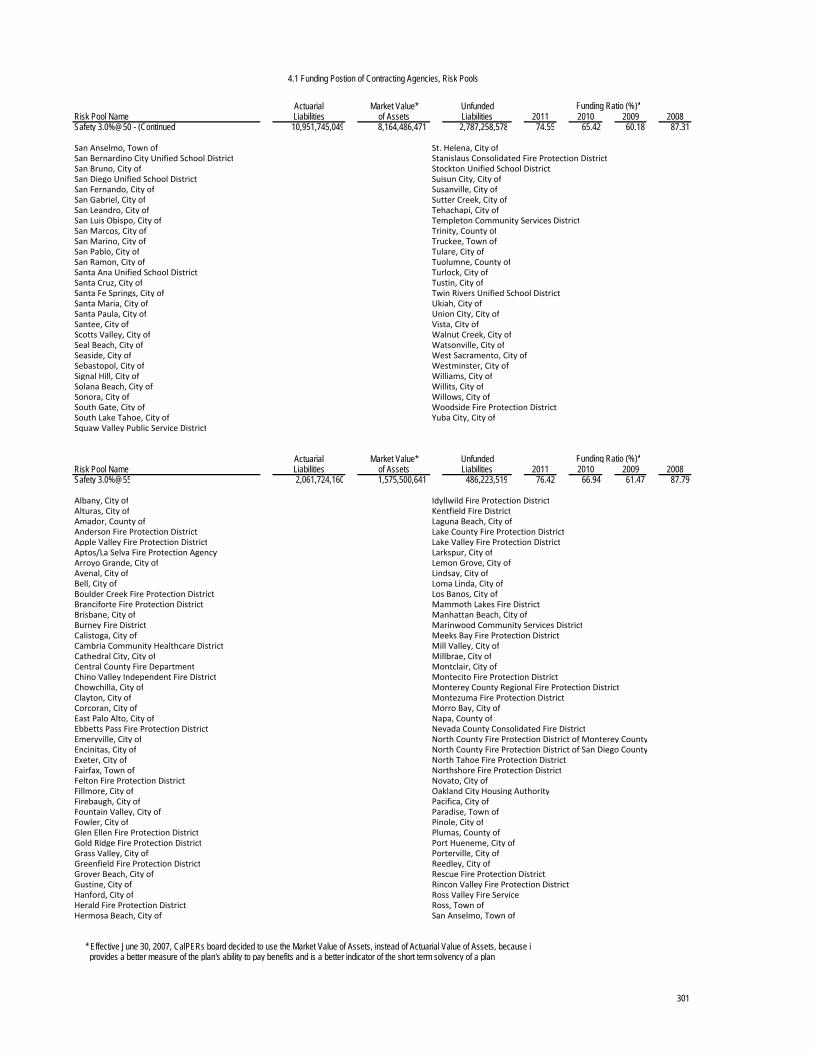
Actuarial Market Value* UnfundedRisk Pool Name Liabilities of Assets Liabilities 2011 2010 2009 2008Safety 3.0%@50 - (Continued) 10,951,745,049 8,164,486,471 2,787,258,578 74.55 65.42 60.18 87.31
San Anselmo, Town of St. Helena, City ofSan Bernardino City Unified School District Stanislaus Consolidated Fire Protection DistrictSan Bruno, City of Stockton Unified School DistrictSan Diego Unified School District Suisun City, City ofSan Fernando, City of Susanville, City ofSan Gabriel, City of Sutter Creek, City ofSan Leandro, City of Tehachapi, City ofSan Luis Obispo, City of Templeton Community Services DistrictSan Marcos, City of Trinity, County ofSan Marino, City of Truckee, Town ofSan Pablo, City of Tulare, City ofSan Ramon, City of Tuolumne, County ofSanta Ana Unified School District Turlock, City ofSanta Cruz, City of Tustin, City ofSanta Fe Springs, City of Twin Rivers Unified School District Santa Maria, City of Ukiah, City ofSanta Paula, City of Union City, City ofSantee, City of Vista, City ofScotts Valley, City of Walnut Creek, City ofSeal Beach, City of Watsonville, City ofSeaside, City of West Sacramento, City ofSebastopol, City of Westminster, City ofSignal Hill, City of Williams, City ofSolana Beach, City of Willits, City ofSonora, City of Willows, City ofSouth Gate, City of Woodside Fire Protection DistrictSouth Lake Tahoe, City of Yuba City, City ofSquaw Valley Public Service District
Actuarial Market Value* UnfundedRisk Pool Name Liabilities of Assets Liabilities 2011 2010 2009 2008Safety 3.0%@55 2,061,724,160 1,575,500,641 486,223,519 76.42 66.94 61.47 87.79
Albany, City of Idyllwild Fire Protection DistrictAlturas, City of Kentfield Fire DistrictAmador, County of Laguna Beach, City ofAnderson Fire Protection District Lake County Fire Protection DistrictApple Valley Fire Protection District Lake Valley Fire Protection DistrictAptos/La Selva Fire Protection Agency Larkspur, City ofArroyo Grande, City of Lemon Grove, City ofAvenal, City of Lindsay, City ofBell, City of Loma Linda, City ofBoulder Creek Fire Protection District Los Banos, City ofBranciforte Fire Protection District Mammoth Lakes Fire DistrictBrisbane, City of Manhattan Beach, City ofBurney Fire District Marinwood Community Services DistrictCalistoga, City of Meeks Bay Fire Protection DistrictCambria Community Healthcare District Mill Valley, City ofCathedral City, City of Millbrae, City ofCentral County Fire Department Montclair, City ofChino Valley Independent Fire District Montecito Fire Protection DistrictChowchilla, City of Monterey County Regional Fire Protection DistrictClayton, City of Montezuma Fire Protection DistrictCorcoran, City of Morro Bay, City ofEast Palo Alto, City of Napa, County ofEbbetts Pass Fire Protection District Nevada County Consolidated Fire DistrictEmeryville, City of North County Fire Protection District of Monterey CountyEncinitas, City of North County Fire Protection District of San Diego CountyExeter, City of North Tahoe Fire Protection DistrictFairfax, Town of Northshore Fire Protection DistrictFelton Fire Protection District Novato, City ofFillmore, City of Oakland City Housing AuthorityFirebaugh, City of Pacifica, City ofFountain Valley, City of Paradise, Town ofFowler, City of Pinole, City ofGlen Ellen Fire Protection District Plumas, County ofGold Ridge Fire Protection District Port Hueneme, City ofGrass Valley, City of Porterville, City ofGreenfield Fire Protection District Reedley, City ofGrover Beach, City of Rescue Fire Protection DistrictGustine, City of Rincon Valley Fire Protection DistrictHanford, City of Ross Valley Fire ServiceHerald Fire Protection District Ross, Town ofHermosa Beach, City of San Anselmo, Town of
* Effective June 30, 2007, CalPERs board decided to use the Market Value of Assets, instead of Actuarial Value of Assets, because it provides a better measure of the plan's ability to pay benefits and is a better indicator of the short term solvency of a plan
301
Funding Ratio (%)*
4.1 Funding Postion of Contracting Agencies, Risk Pools
Funding Ratio (%)*

Actuarial Market Value* UnfundedRisk Pool Name Liabilities of Assets Liabilities 2010 2009 2008 2007Safety 3.0%@55 1,915,095,826 1,281,909,314 633,186,512 66.94 61.47 87.79 99.65
San Benito, County of South Placer Fire DistrictSan Clemente, City of Stallion Springs Community Services DistrictSan Joaquin Delta Community College District Tiburon Fire Protection DistrictSan Marino, City of Tiburon, Town ofSan Miguel Consolidated Fire Protection District Truckee Fire ProtectioSand City, City of Tulare, City ofSanger, City of Tuolumne Fire Protection DistrictSanta Monica Community College District Twain Harte Community Services DistrictSausalito, City of Twentynine Palms Water DistrictScotts Valley Fire Protection District Twin Cities Police AutShafter, City of Ukiah, City ofShasta Lake Fire Protection District West Almanor Community Services DistrictSierra Madre, City of West Valley‐Mission Community College DistrictSierra, County of Windsor Fire Protection DistrictSignal Hill, City of Winters, City ofSoledad, City of Woodbridge Rural County Fire Protection DistrictSouth Lake Tahoe, City of
Actuarial Market Value* UnfundedRisk Pool Name Liabilities of Assets Liabilities 2011 2010 2009 2008Inactive Risk Pool ** 633,375,835 508,531,138 124,844,697 80.29 71.50 67.66 101.26
Adelanto, City of Mountain‐Valley Library SystemAmerican Canyon Fire Protection District Natomas Fire Protection DistrictArmona Community Services District Natomas Fire Protection DistrictArrowbear Park County Water District Needles, City ofBiggs, City of Niland Sanitary DistrictBlue Lake, City of North State Cooperative Library SystemBroadmoor Police Protection District Oceano Community Services DistrictCalifornia Firefighter Joint Apprenticeship Committee Ojai, City ofCalifornia Maritime Academy Foundation, Inc. Olcese Water DistrictCameron Park Community Services District Orange Cove Fire Protection District ofCarmel Highlands Fire Protection District of Monterey County Fresno and Tulare CountiesCarpinteria, City of Pacific Fire Protection DistrictCentral Coast Computing Authority Pajaro Valley Fire Protection AgencyCentral Sierra Planning Council Paramount, City ofCoachella, City of Pasadena Unified School DistrictCoalinga‐Huron Mosquito Abatement District Perris, City ofCoastside Fire Protection District Plumas Local Agency Formation CommissionCoastside Fire Protection District Ramona Municipal Water DistrictCollege Town Rancho Santiago Community College Associated StudentsCompton, City of Reclamation District No. 1660Cordelia Fire Protection District of Solano County Rincon Del Diablo Municipal Water DistrictCuyama Valley Recreation District Riverbank, City ofDaly City Redevelopment Agency Riverside County Air Pollution Control DistrictDougherty Regional Fire Authority Rubidoux Community Services DistrictDowney Cemetery District Salida Fire Protection DistrictDunsmuir, City of Salton Community Services DistrictFort Bragg, City of Samoa Peninsula Fire Protection DistrictFruitridge Fire Protection District San Bernardino County Transportation AuthorityGrover Beach, City of San Carlos, City ofHalf Moon Bay, City of San Clemente, City ofHamilton Branch Fire Protection District San Francisco City and County Housing AuthorityHappy Camp Sanitary District San Jacinto, City ofHawaiian Gardens, City of San Joaquin, County ofHesperia Fire Protection District San Simeon Community Services DistrictHopland Public Utility District Santa Cruz County Law LibraryHughson, City of Santa Monica, City ofIdyllwild Fire Protection District Seal Beach, City ofIndependent Cities Association, Inc. Soledad Community Health Care DistrictJanesville Fire Protection District Solvang, City ofLa Branza Water District Sonoma State Enterprises, Inc.Lake Elsinore, City of Sonoma Student Union CorporationLinden‐Peters Rural County Fire Protection District Sonoma, City ofLos Angeles Community College District Sonoma, City ofLos Angeles Regionalized Insurance Services Authority South County Fire Protection AuthorityLos Osos Community Services District Stanton, City ofLynwood, City of Taft, City ofMarin Healthcare District Tehachapi, City ofMaywood, City of Three Arch Bay Community Services DistrictMcCloud Community Services District Torrance City Redevelopment AgencyMid City Development Corporation Tracy Rural County Fire Protection District
* Effective June 30, 2007, CalPERs board decided to use the Market Value of Assets, instead of Actuarial Value of Assets, because it provides a better measure of the plan's ability to pay benefits and is a better indicator of the short term solvency of a plan
**Inactive risk pool consist of miscellaneous and safety plans.
302
Funding Ratio (%)*
4.1 Funding Postion of Contracting Agencies, Risk Pools
Funding Ratio (%)*

Actuarial Market Value* UnfundedRisk Pool Name Liabilities of Assets Liabilities 2011 2010 2009 2008Inactive Risk Pool ** - (Continued) 633,375,835 508,531,138 124,844,697 80.29 71.50 67.66 101.26
Treasure Island Development Authority Waterford, City ofUkiah Valley Fire District West End Communications AuthorityVeterans Home of California Post Fund Wildomar Cemetery DistrictVictorville, City of Winters Fire Protection DistrictWasco, City of
* Effective June 30, 2007, CalPERs board decided to use the Market Value of Assets, instead of Actuarial Value of Assets, because it provides a better measure of the plan's ability to pay benefits and is a better indicator of the short term solvency of a plan
**Inactive risk pool consist of miscellaneous and safety plans.
303
4.1 Funding Postion of Contracting Agencies, Risk Pools
Funding Ratio (%)*

5. CalPERS Supplement – Summary of Contracting Agencies’s Benefits The following table compares selected benefits of all the local public agencies that contracted with CalPERS. Agencies are listed alphabetically, with the plan types (miscellaneous or safety) listed below. The five-digit code reported is used for identification by CalPERS of the various benefit formulas and may be useful if additional information is needed. The abbreviations used in the tables are described below. A. Retirement Benefit Formula – This column indicates the retirement benefit formula used to compute retirement benefits
for each agency and group. A CalPERS member who has at least five years of credited service becomes eligible for service retirement upon attainment of age 50.
1. Three Percent at Age 50 Formula (3% @ 50 – Local Safety Members):
Age
% Per Year of Service
50 and Older .......................................................................................................................... 3.000%
2. Three Percent at Age 55 Formula (3% @ 55 – Local Safety Members): Age
% Per Year of Service
50 ............................................................................................................................................ 2.400% 52 ............................................................................................................................................ 2.640% 54 ............................................................................................................................................ 2.880% 55 and Older ........................................................................................................................... 3.000%
3. Two Percent at Age 50 Formula (2% @ 50 – Local Safety Members):
Age
% Per Year of Service
50 ............................................................................................................................................ 2.000% 52 ............................................................................................................................................ 2.280% 54 ............................................................................................................................................ 2.560% 55 and Older ........................................................................................................................... 2.700%
4. One-Half Percent at Age 55 Formula (0.05% @ 55 – Local Safety Members):
Entry Age
Percent Factor
25 ............................................................................................................................................ 1.667% 30 ............................................................................................................................................ 2.000% 35 and Older ........................................................................................................................... 2.500%
If a member retires between the ages of 50 and 55, the above percent factors must be discounted as follows: Age
Discount Factor
50 ............................................................................................................................................ 0.713 52 ............................................................................................................................................ 0.814 54 ............................................................................................................................................ 0.933
5. Two Percent at Age 55 Formula (2% @ 55 – Local Safety Members):
Age
% Per Year of Service
50 ............................................................................................................................................ 1.426% 52 ............................................................................................................................................ 1.628% 55 and Older ........................................................................................................................... 2.000%
304

5. CalPERS Supplement – Summary of Contracting Agency’s Benefits – (Continued)
6. Two Percent at Age 55 Formula (2% @ 55 – Local Miscellaneous Members): Age
% Per Year of Service
50 ............................................................................................................................................ 1.426% 55 ............................................................................................................................................ 2.000% 60 ............................................................................................................................................ 2.262% 63 and Older ........................................................................................................................... 2.418%
7. Two Percent at Age 55 State-School Formula (2% @ 55 – Local Miscellaneous Members):
Age
% Per Year of Service
50 ............................................................................................................................................ 1.100% 55 ............................................................................................................................................ 2.000% 60 ............................................................................................................................................ 2.314% 63 and Older ........................................................................................................................... 2.500%
8. Two and One-Half Percent at Age 55 Formula (2.5% @ 55 – Local Safety Members):
Age
% Per Year of Service
50 ............................................................................................................................................ 2.000% 52 ............................................................................................................................................ 2.200% 55 and Older ........................................................................................................................... 2.500%
9. One and One-Quarter Percent at Age 65 Tier 2 Formula (1.25% @ 65 – Local Miscellaneous Members):
Age
% Per Year of Service
50 ............................................................................................................................................ 0.500% 52 ............................................................................................................................................ 0.600% 54 ............................................................................................................................................ 0.800% 56 ............................................................................................................................................ 0.800% 58 ............................................................................................................................................ 0.900% 60 ............................................................................................................................................ 1.000% 62 ............................................................................................................................................ 1.100% 64 ............................................................................................................................................ 1.200% 65 and Older ........................................................................................................................... 1.250%
10. Two Percent at Age 60 Formula (2% @ 60 – Local Miscellaneous Members):
Age
% Per Year of Service
50 ............................................................................................................................................ 1.092% 55 ............................................................................................................................................ 1.460% 60 ............................................................................................................................................ 2.000% 63 and Older ........................................................................................................................... 2.418%
11. One and One-Quarter Percent at Age 60 Formula (1.25% @ 60 – Local Safety Members):
Age
% Per Year of Service
50 ............................................................................................................................................ 0.619% 55 ............................................................................................................................................ 0.868% 60 ............................................................................................................................................ 1.250% 65 ............................................................................................................................................ 1.750%
12. Two and One-Half Percent at Age 55 Formula (2.5% @ 55 – Local Miscellaneous Members): Age
% Per Year of Service
50 ............................................................................................................................................ 2.000% 52 ............................................................................................................................................ 2.200% 55 and Older ........................................................................................................................... 2.500%
305

5. CalPERS Supplement – Summary of Contracting Agency’s Benefits – (Continued)
13. 2.7 Percent at Age 55 Formula (2.7% @ 55 – Local Miscellaneous Members):
Age
% Per Year of Service
50 ............................................................................................................................................ 2.000% 52 ............................................................................................................................................ 2.280% 55 and Older ........................................................................................................................... 2.700%
14. Three Percent at Age 60 Formula (3% @ 60 – Local Miscellaneous Members):
Age
% Per Year of Service
50 ............................................................................................................................................ 2.000% 52 ............................................................................................................................................ 2.200% 54 ............................................................................................................................................ 2.400% 56 ............................................................................................................................................ 2.600% 58 ............................................................................................................................................ 2.800% 60 and Older ........................................................................................................................... 3.000%
B. Final Compensation Offset – This column is used to report which plans apply an offset to the final compensation.
Y — The final compensation used to calculate the retirement benefit is offset by $133.33 (or by 1/3 if the final compensation is less than $400).
N — No offset is applied to the final compensation used to calculate the retirement benefit.
C. Final Compensation Period – This column reports whether the retirement benefit is based on a one or three-year final
average salary. D. COLA (Cost-of-Living Adjustment) – CalPERS retirees and survivors receive a COLA of 2% per year on a
compounded basis, no greater than the cumulative change in the consumer price index since the date of retirement. Some contracting agencies provide increases of 3%, 4%, or 5% (also limited to the cumulative increase in the consumer price index).
E. Pre-Retirement Death Benefit Option 2 Settlement – A “Y” indicates that the employer has contracted for this benefit,
which provides, upon death of a member prior to retirement, an allowance equal to the retirement benefit the member would have received had he or she retired on the date of death and elected the Option 2 Settlement. A retiree who elects the Option 2 Settlement receives an allowance that has been reduced so that it will continue to be paid to a surviving beneficiary after the retiree’s death. (Government Code section 21548).
F. Sick Leave Credit – A “Y” indicates that the agency has contracted for its employees to receive additional service credit
for unused sick leave (Government Code section 20965).
G. Post-Retirement Survivor Allowance (PRSA) – A “Y” indicates that the employer has contracted for this benefit, which provides, upon death of a member after retirement or disability, a continued allowance to the surviving spouse until death or remarriage, or to surviving children or dependent parents (Government Code sections 21624 and 21626).
H. Ordinary Disability Increase – This benefit applies to future ordinary disability retirements of miscellaneous members
and of non-job-related disability retirements of Safety members. The current statutory level of disability retirement benefits for members with at least five years of credited service (with a 33-1/3% maximum) would be raised to a minimum benefit of 30% of final compensation for five years of service and increased by 1% of final compensation for each additional year of service to a maximum benefit of 50% of final compensation. Under no circumstances may the disability retirement allowance be more than the service retirement allowance if the member were to continue in employment and retire at age 60 (Government Code section 21427).
306

5. CalPERS Supplement – Summary of Contracting Agency’s Benefits – (Continued)
I. 1959 Survivor Benefit (Government Code sections 20070, 21382.5, 21570, 21571, 21572, 21573, 21574.5, 21575, 21576, 21577, 21578, 21579, 21580, 21581, 21582) – This optional benefit provides the following monthly allowance to beneficiaries of a member who dies prior to retirement. This benefit is in addition to the basic death benefit or the 1957 survivor benefit, but would be reduced by the amount of the industrial death benefits, if payable.
Spouse with two or more children, or three or more dependent children, alone ............................................ $430 Spouse with one dependent child, or two dependent children, alone ............................................................ $360 Widow or widower, alone, age 62 (ages vary at different levels) or older; dependent mother or dependent father alone, age 62 (ages vary at different levels) or older; or one dependent child ..................
$180
Section 21572 (2nd level) provides for monthly benefit payments of $538, $450, and $225, respectively. Section 21573 (3rd level) provides for monthly benefit payments of $840, $700, and $350, respectively. Section 21574 (4th level) provides for monthly benefit payments of $2,280, $1,900, and $950, respectively. Section 21574.5 (indexed level) provides for monthly benefit payments of $1,500, $1,000, and $500, respectively, as of January 1, 2000. These benefits increase at the rate of 2% per year. A “1” indicates that the agency has contracted for section 21571 benefits. A “2” indicates that it has opted for section 21572 benefits. A “3” indicates it has selected section 21573 benefits. A “4” indicates that it has elected section 21574 benefits. An “8” indicates that the agency has contracted for section 21574.5 benefits.
J. Member Contribution Rate – The contribution rate paid by members as a percent of payroll. Some agencies use a
fixed dollar amount, determined annually. These rates are designated as “Varies.” K. Employer Contribution Rate – The contribution rate, effective fiscal year 2013-14, that is paid by the contracting
agency as a percentage of payroll or a fixed dollar amount determined annually.
307

5. CalPERS Supplement - Summary of Contracting Agency Benefits - (Continued)
Final Pre- SickPost
Ordinary 1959Compensation SurvivorRetirement Leave
RetirementDisabilityBenefit
FinalContribution Rate
Employer Name Offset Option 2 Credit IncreaseSurvivor
BenefitFormula Period COLA Member EmployerCompensation
Allowance
Academic Senate for California Community Colleges
Misc 70001 2% @ 60 3 4YY 10.340%2% 7.00Access Services Incorporated
Misc 70001 2% @ 60 3 3YY 10.338%2% 7.00Adelanto, City of
Misc 70001 2% @ 60 3 4YY 4.716%2% 7.00Police 75001 2% @ 55 3 3YY 0.000%2% 7.00
Agoura Hills and Calabasas Community Center
Misc 70001 2% @ 55 3 3YY 10.282%2% 7.00Agoura Hills, City of
Misc 70001 2% @ 55 3 3YY 10.282%2% 7.00Alameda Alliance for Health
Misc 70001 2% @ 60 3 3 7.120%2% 7.00Alameda Corridor Transportation Authority
Misc 70001 2% @ 55 1 3YY 14.980%2% 7.00Alameda County Congestion Management Agency
Misc 70001 2% @ 55 1 4YY 15.972%2% 7.00Misc 70002 2.5% @ 55 1 4YY 15.972%2% 8.00
Alameda County Fire DepartmentMisc 70001 2% @ 55 1 3YY 10.781%2% 7.00Misc 70401 2% @ 55 1 3YY 10.781%2% 7.00Misc 70402 2% @ 55 1 3YY 10.781%2% 7.00Fire 74001 3% @ 50 1 3Y 26.543%2% 9.00Fire 74401 3% @ 50 1 1 26.543%2% 9.00Fire 74402 3% @ 50 1 1 26.543%2% 9.00Fire 74403 3% @ 50 1 3Y 26.543%2% 9.00Fire 74404 3% @ 50 1 3Y 26.543%2% 9.00
Alameda County Law LibraryMisc 70001 2% @ 60 3 YY 3.040%2% 7.00
Alameda County Mosquito Abatement District
Misc 70001 2% @ 55 1 3YY Y 11.603%2% 7.00Alameda County Schools Insurance Group
Misc 70001 2% @ 55 1 4YY 22.105%2% 7.00Misc 70002 2.5% @ 55 1 4YY 22.105%2% 8.00
Alameda County Transportation Commission
Misc 70001 2.5% @ 55 1 4YY 15.309%2% 8.00Misc 70401 2% @ 55 1 4YY 15.309%2% 7.00
Alameda County Transportation Improvement Authority
Misc 70001 2% @ 55 1 4YY 14.660%2% 7.00Misc 70002 2.5% @ 55 1 4YY 14.660%2% 8.00Misc 70401 2% @ 55 1 4YY 14.660%2% 7.00Misc 70402 2.5% @ 55 1 4YY 14.660%2% 8.00
Alameda County Waste Management Authority
Misc 70001 2% @ 55 1 4YY 14.660%2% 7.00Misc 70002 2.5% @ 55 1 4YY 14.660%2% 8.00
Alameda County Water DistrictMisc 70001 2% @ 55 1 4Y Y 24.533%3% 7.00Misc Y70002 2% @ 55 1 Y Y 24.533%3% 7.00Misc 70003 2.5% @ 55 1 4YY Y 24.533%3% 8.00Misc Y70004 2.5% @ 55 1 Y Y 24.533%3% 8.00
Alameda, City ofMisc 70001 2% @ 55 1 3Y Y 14.970%2% 7.00Misc Y70002 2% @ 55 1 Y Y 14.970%2% 7.00Misc Y70401 2% @ 55 1 Y Y 14.970%2% 7.00Fire 74001 3% @ 50 1 3Y Y 39.506%2% 9.00Police 75001 3% @ 50 1 3Y Y 39.506%2% 9.00
308

5. CalPERS Supplement - Summary of Contracting Agency Benefits - (Continued)
Final Pre- SickPost
Ordinary 1959Compensation SurvivorRetirement Leave
RetirementDisabilityBenefit
FinalContribution Rate
Employer Name Offset Option 2 Credit IncreaseSurvivor
BenefitFormula Period COLA Member EmployerCompensation
Allowance
Albany Municipal Services Joint Powers Authority
Misc 70001 2% @ 55 3 4YY 15.095%2% 7.00Misc 70002 2.5% @ 55 3 4YY 15.095%2% 8.00Misc 70101 2% @ 60 3 4YY 8.049%2% 7.00Misc 70401 2% @ 55 3 YY 15.095%2% 7.00
Albany, City ofMisc 70001 2% @ 55 3 YY 15.185%2% 7.00Misc 70002 2.5% @ 55 3 YY 15.185%2% 8.00Fire 74001 3% @ 55 1 4YY 21.669%2% 9.00Police 75001 3% @ 55 1 4YY 21.669%2% 9.00
Alhambra Redevelopment AgencyMisc 70001 2% @ 55 1 3YY 25.447%2% 7.00Misc 70002 2.7% @ 55 1 3YY 25.447%2% 8.00
Alhambra, City ofMisc 70001 2% @ 55 1 3 18.629%2% 7.00Misc 70002 2.7% @ 55 1 3Y 18.629%2% 8.00Fire 74001 3% @ 50 1 3Y Y 35.627%2% 9.00Police 75001 3% @ 50 1 3Y Y 35.627%2% 9.00
Aliso Viejo, City ofMisc 70001 2% @ 55 3 8YY 10.282%2% 7.00
Alliance of Schools for Cooperative Insurance Programs
Misc 70001 2% @ 55 1 4YY 12.024%2% 7.00Alpine Fire Protection District
Misc 70001 2% @ 55 1 4YY 16.155%2% 7.00Misc 70002 2.7% @ 55 1 4YY 16.155%2% 8.00Fire 74001 3% @ 50 1 4YY 26.149%2% 9.00
Alpine, County ofMisc 70001 2% @ 55 1 2YY Y Y 16.302%2% 7.00Misc Y70002 2% @ 55 1 YY Y Y 16.302%2% 7.00Fire 74001 1/2 @ 55 1 2YY Y Y 35.752%2% variesFire Y74002 1/2 @ 55 1 YY Y Y 35.752%2% variesPeace 77001 3% @ 50 1 2YY Y Y 35.752%2% 9.00
Alta California Regional Center Inc.Misc 70001 2% @ 60 3 8 9.525%2% 7.00
Alta Irrigation DistrictMisc Y70001 2% @ 60 3 YY Y 8.335%2% 7.00
Altadena Library DistrictMisc Y70001 2% @ 55 1 YY Y 11.603%2% 7.00Misc 70002 2% @ 55 1 YY Y 11.603%2% 7.00
Alturas, City ofMisc Y70001 2% @ 55 1 YY 20.971%2% 7.00Misc 70002 2% @ 55 1 YY 20.971%2% 7.00Misc Y70003 2.7% @ 55 1 YY 20.971%2% 8.00Misc Y70004 3% @ 60 1 YY 20.971%2% 8.00Fire 74001 3% @ 55 1 YY 31.542%2% 9.00Police 75001 3% @ 55 1 YY 31.542%2% 9.00
Amador County Transportation CommissionMisc 70001 2% @ 55 1 4YY 10.906%2% 7.00
Amador Rapid Transit DistrictMisc 70001 2% @ 55 3 YY 11.332%2% 7.00
Amador Water AgencyMisc 70001 2% @ 55 3 YY 13.362%2% 7.00
309

5. CalPERS Supplement - Summary of Contracting Agency Benefits - (Continued)
Final Pre- SickPost
Ordinary 1959Compensation SurvivorRetirement Leave
RetirementDisabilityBenefit
FinalContribution Rate
Employer Name Offset Option 2 Credit IncreaseSurvivor
BenefitFormula Period COLA Member EmployerCompensation
Allowance
Amador, County ofMisc 70001 2% @ 55 1 YY 16.205%2% 7.00Misc Y70002 2% @ 55 1 YY 16.205%2% 7.00Misc Y70101 2% @ 60 3 YY 16.205%2% 7.00Fire 74001 1/2 @ 55 3 3YY Y 32.495%2% variesFire 74002 2% @ 55 3 3YY Y 32.495%2% 7.00Peace 77001 3% @ 50 1 3YY Y 32.495%2% 9.00Peace 77002 3% @ 50 1 3YY Y 32.495%2% 9.00Peace 77101 3% @ 55 3 3YY Y 20.774%2% 9.00Peace 79001 2% @ 50 3 3YY 21.670%2% 9.00
American Canyon Fire Protection DistrictMisc 70001 2% @ 60 3 YY 0.000%2% 7.00Misc 70002 3% @ 60 3 YY 0.000%2% 8.00Fire 74001 3% @ 50 1 3YY 35.121%2% 9.00Fire 74002 3% @ 50 1 3YY 35.121%2% 9.00Fire 74101 3% @ 55 1 3YY 21.669%2% 9.00
American Canyon, City ofMisc 70001 2% @ 55 1 8YY Y 14.904%2% 7.00Misc 70401 2% @ 55 1 YY Y 14.904%2% 7.00
American River Flood Control DistrictMisc Y70001 2% @ 55 1 YY 10.781%2% 7.00
Anaheim, City ofMisc 70001 2% @ 55 1 4YY Y 22.031%2% 7.00Misc 70002 2.7% @ 55 1 4YY Y 22.031%2% 8.00Misc 70401 2% @ 55 1 4YY Y 22.031%2% 7.00Fire 74001 3% @ 50 1 4YY Y 33.364%2% 9.00Police 75001 3% @ 50 1 4YY Y 32.884%2% 9.00Police 75101 3% @ 50 1 4YY Y 32.884%2% 9.00
Anderson Cemetery DistrictMisc Y70001 2% @ 55 3 YY 38.115%2% 7.00Misc 70002 2% @ 55 3 YY 38.115%2% 7.00
Anderson Fire Protection DistrictMisc Y70001 2% @ 60 3 YY 8.713%2% 7.00Misc Y70002 2.5% @ 55 3 YY 8.713%2% 8.00Fire Y74001 3% @ 55 3 YY 25.094%2% 9.00
Anderson, City ofMisc Y70001 2% @ 55 1 YY 15.685%2% 7.00Misc 70002 2% @ 55 1 YY 15.685%2% 7.00Misc 70003 2% @ 55 1 YY 15.685%2% 7.00Misc Y70004 2.7% @ 55 1 YY 15.685%2% 8.00Misc 70005 2.7% @ 55 1 YY 15.685%2% 8.00Police 75001 3% @ 50 3 YY 25.168%2% 9.00
Angels, City ofMisc Y70001 2% @ 55 1 YY 21.842%2% 7.00Misc 70002 2% @ 55 1 YY 21.842%2% 7.00Misc Y70003 2.7% @ 55 1 YY 21.842%2% 8.00Fire Y74001 2% @ 55 3 YY 15.312%2% 7.00Police Y75001 3% @ 50 3 YY 39.265%2% 9.00
Angiola Water DistrictMisc 70001 2% @ 60 3 YY 4.166%2% 7.00
Antelope Valley Mosquito and Vector Control District
Misc Y70001 2% @ 55 1 YY Y 18.420%2% 7.00Misc 70002 2% @ 55 1 YY Y 18.420%2% 7.00Misc Y70003 3% @ 60 1 YY Y 18.420%2% 8.00
Antelope Valley Schools Transportation Agency
Misc 70001 2% @ 55 1 Y 12.037%2% 7.00Misc Y70002 2% @ 55 1 Y 12.037%2% 7.00
Antelope Valley Transit AuthorityMisc 70001 2% @ 55 3 YY 10.282%2% 7.00
310

5. CalPERS Supplement - Summary of Contracting Agency Benefits - (Continued)
Final Pre- SickPost
Ordinary 1959Compensation SurvivorRetirement Leave
RetirementDisabilityBenefit
FinalContribution Rate
Employer Name Offset Option 2 Credit IncreaseSurvivor
BenefitFormula Period COLA Member EmployerCompensation
Allowance
Antioch, City ofMisc 70001 2% @ 55 1 2 23.687%5% 7.00Misc Y70002 2% @ 55 1 23.687%5% 7.00Misc 70003 2.7% @ 55 1 2 23.687%5% 8.00Misc Y70004 2.7% @ 55 1 23.687%5% 8.00Misc 70101 2% @ 55 1 2 23.687%5% 7.00Police 75001 3% @ 50 1 YY Y 31.680%2% 9.00
Apple Valley Fire Protection DistrictMisc 70001 2% @ 55 1 3YY Y 24.707%2% 7.00Misc 70002 2.7% @ 55 1 3YY Y 24.707%2% 8.00Fire 74001 3% @ 55 1 3YY Y Y 19.757%2% 9.00
Apple Valley, Town ofMisc 70001 2% @ 55 1 YY 17.664%2% 7.00Misc 70002 2.7% @ 55 1 YY 17.664%2% 8.00Misc 70401 2% @ 55 1 YY 17.664%2% 7.00Misc 70402 2.7% @ 55 1 YY 17.664%2% 8.00
Aptos/La Selva Fire Protection AgencyMisc 70001 2% @ 55 1 YY 30.643%2% 7.00Misc 70002 3% @ 60 1 YY 30.643%2% 8.00Misc 70401 2% @ 55 3 YY 30.643%2% 7.00Fire 74001 3% @ 55 1 4YY Y 39.562%2% 9.00Fire 74401 3% @ 55 1 4YY 39.562%2% 9.00Fire 74402 3% @ 55 3 YY 39.562%2% 9.00
Arbuckle-College City Fire Protection District
Fire Y74001 3% @ 50 3 YY 34.507%2% 9.00Arcade Creek Recreation and Park District
Misc 70001 2% @ 55 3 YY 26.491%2% 7.00Arcadia, City of
Misc 70001 2% @ 55 1 3YY Y 21.045%2% 7.00Misc Y70002 2% @ 55 1 YY Y 21.045%2% 7.00Misc 70003 2.5% @ 55 1 3YY Y 21.045%2% 8.00Misc Y70004 2.5% @ 55 1 YY Y 21.045%2% 8.00Fire 74001 3% @ 50 1 4YY Y 39.433%2% 9.00Fire 74002 3% @ 50 1 4YY Y 39.433%2% 9.00Police 75001 3% @ 50 1 3YY Y 39.433%2% 9.00Police 75002 3% @ 50 1 3YY Y 39.433%2% 9.00
Arcata Fire Protection DistrictMisc 70001 2% @ 60 1 3YY 10.650%2% 7.00Misc 70002 2.7% @ 55 1 3YY 10.650%2% 8.00Fire 74001 3% @ 50 1 3YY Y 37.612%2% 9.00
Arcata, City ofMisc Y70001 2% @ 55 1 YY 23.506%2% 7.00Misc 70002 2% @ 55 1 YY 23.506%2% 7.00Misc 70003 2% @ 55 1 YY 23.506%2% 7.00Misc Y70004 2.7% @ 55 1 YY 23.506%2% 8.00Misc 70005 2.7% @ 55 1 YY 23.506%2% 8.00Misc 70006 2.7% @ 55 1 YY 23.506%2% 8.00Police Y75001 3% @ 50 1 YY 35.531%2% 9.00
Area 12 Agency on AgingMisc 70001 2% @ 60 1 YY 16.903%2% 7.00Misc 70002 2.7% @ 55 1 YY 16.903%2% 8.00
Armona Community Services DistrictMisc Y70001 2% @ 60 3 YY 0.000%2% 7.00
Aromas County Water DistrictMisc 70001 2% @ 55 1 YY 17.643%2% 7.00
Arrowbear Park County Water DistrictMisc 70001 2% @ 55 1 YY 0.000%2% 7.00Fire Y74001 2% @ 50 3 YY 0.000%2% 9.00
Arroyo Grande District CemeteryMisc Y70001 2% @ 60 3 YY 13.846%2% 7.00Misc Y70002 2.5% @ 55 3 YY 13.846%2% 8.00
311

5. CalPERS Supplement - Summary of Contracting Agency Benefits - (Continued)
Final Pre- SickPost
Ordinary 1959Compensation SurvivorRetirement Leave
RetirementDisabilityBenefit
FinalContribution Rate
Employer Name Offset Option 2 Credit IncreaseSurvivor
BenefitFormula Period COLA Member EmployerCompensation
Allowance
Arroyo Grande, City ofMisc Y70001 2% @ 55 1 YY 23.218%2% 7.00Misc 70002 2% @ 55 1 YY 23.218%2% 7.00Misc Y70003 2.5% @ 55 1 YY 23.218%2% 8.00Fire 74001 2% @ 50 3 YY 23.948%2% 9.00Fire Y74002 3% @ 55 1 YY 23.948%2% 9.00Police 75001 3% @ 55 1 YY 45.856%2% 9.00Police Y75002 3% @ 50 1 YY 45.856%2% 9.00
Artesia, City ofMisc 70001 2% @ 60 1 YY 8.738%2% 7.00
Arvin, City ofMisc Y70001 2% @ 55 3 YY 7.483%2% 7.00Misc 70002 2% @ 55 3 YY 7.483%2% 7.00Police Y75001 2% @ 55 3 YY 14.160%2% 7.00
Associated Students of CSU, Chico, IncMisc 70002 2% @ 60 3 Y 13.737%2% 7.00
Associated Students, California State University, San Bernardino
Misc Y70001 2% @ 60 3 YY Y 14.981%2% 5.00Association of Bay Area Governments
Misc Y70001 2% @ 55 3 YY 23.429%2% 7.00Misc Y70002 2.5% @ 55 3 YY 23.429%2% 8.00
Association of California Water AgenciesMisc 70001 2% @ 60 1 3YY 18.557%2% 7.00Misc 70002 2.5% @ 55 1 3YY 18.557%2% 8.00
Association of California Water Agencies - Joint Powers Insurance Authority
Misc 70001 2% @ 60 1 4YY Y Y 9.205%2% 7.00Association of Monterey Bay Area Governments
Misc Y70001 2% @ 55 1 YY 16.788%5% 7.00Misc 70002 2% @ 55 1 YY 16.788%5% 7.00
Atascadero Cemetery DistrictMisc 70001 2% @ 60 3 YY 10.558%2% 7.00
Atascadero, City ofMisc 70001 2% @ 55 1 YY Y 18.042%2% 7.00Misc 70002 2.5% @ 55 1 YY Y 18.042%2% 8.00Fire 74001 3% @ 50 1 4YY 32.726%2% 9.00Fire 74401 3% @ 50 1 4YY 32.726%2% 9.00Police 75001 3% @ 50 1 4YY 32.726%2% 9.00
Atherton, Town ofMisc 70001 2% @ 55 3 3YY Y 15.844%2% 7.00Police 75001 3% @ 50 1 3YY Y 27.877%2% 9.00Police 75002 3% @ 50 1 3YY Y 27.877%2% 9.00
Atwater, City ofMisc Y70001 2% @ 55 1 YY 28.556%4% 7.00Misc 70002 2% @ 55 3 YY 28.556%4% 7.00Misc Y70003 3% @ 60 1 YY 28.556%4% 8.00Fire Y74001 3% @ 50 3 YY 58.082%4% 9.00Fire Y74002 3% @ 50 1 YY 58.082%4% 9.00Police Y75001 3% @ 50 1 YY 58.082%4% 9.00Police Y75002 3% @ 50 1 YY 58.082%4% 9.00
Auburn Area Recreation and Park DistrictMisc Y70001 2% @ 55 3 YY Y 11.220%2% 7.00
Auburn Public Cemetery DistrictMisc Y70001 2% @ 55 3 YY 16.194%2% 7.00
Auburn, City ofMisc 70001 2% @ 55 1 YY 11.630%2% 7.00Misc Y70002 2% @ 55 1 YY 11.630%2% 7.00Fire 74001 3% @ 50 1 YY 31.516%2% 9.00Fire 74002 3% @ 50 1 4YY 31.516%2% 9.00Police 75001 2% @ 50 1 YY 26.586%2% 9.00Police 75002 3% @ 50 1 YY 26.586%2% 9.00
312

5. CalPERS Supplement - Summary of Contracting Agency Benefits - (Continued)
Final Pre- SickPost
Ordinary 1959Compensation SurvivorRetirement Leave
RetirementDisabilityBenefit
FinalContribution Rate
Employer Name Offset Option 2 Credit IncreaseSurvivor
BenefitFormula Period COLA Member EmployerCompensation
Allowance
Avalon, City ofMisc Y70001 2% @ 55 3 YY 17.286%2% 7.00Fire Y74001 2% @ 50 3 YY 30.812%2% 9.00Police Y75001 2% @ 50 3 YY 30.812%2% 9.00
Avenal, City ofMisc Y70001 2% @ 55 3 YY 11.300%2% 7.00Misc 70002 2% @ 60 3 YY 11.300%2% 7.00Misc Y70401 2% @ 60 3 YY Y 11.300%2% 7.00Misc 70402 2% @ 60 3 YY Y 11.300%2% 7.00Police Y75001 3% @ 55 3 YY 24.573%2% 9.00
Avila Beach Community Services DistrictMisc 70001 2% @ 60 3 3YY 23.338%2% 7.00
Aztec Shops, Ltd., San Diego UniversityMisc Y70001 2% @ 55 1 YY 18.607%2% 7.00
Azusa, City ofMisc 70001 2% @ 55 3 4Y Y 13.645%2% 7.00Misc Y70002 2% @ 55 3 Y Y 13.645%2% 7.00Fire 74001 1/2 @ 55 3 YY Y 30.281%2% variesPolice 75001 3% @ 50 1 4YY Y 30.281%2% 9.00Police 75002 3% @ 50 1 4YY Y 30.281%2% 9.00
Bakersfield State College FoundationMisc 70001 2% @ 60 3 YY 10.049%2% 7.00Misc Y70002 2% @ 60 3 YY 10.049%2% 5.00
Bakersfield, City ofMisc 70001 2% @ 55 1 4 16.939%2% 7.00Misc 70002 3% @ 60 1 4Y 16.939%2% 8.00Misc 70101 2.7% @ 55 3 4Y 16.939%2% 8.00Fire 74001 3% @ 50 1 4Y Y 26.375%2% 9.00Fire 74002 3% @ 50 1 4Y Y 26.375%2% 9.00Fire 74101 2% @ 50 3 4Y Y 26.375%2% 9.00Police 75001 3% @ 50 1 4Y 35.094%2% 9.00Police 75002 3% @ 50 1 4Y 35.094%2% 9.00Police 75101 2% @ 50 3 4Y 35.094%2% 9.00
Baldwin Park Unified School DistrictPolice 75001 2% @ 50 3 3YY Y 21.303%2% 9.00
Baldwin Park, City ofMisc 70001 2% @ 55 1 1 19.604%2% 7.00Misc Y70002 2% @ 55 1 19.604%2% 7.00Misc 70003 2.7% @ 55 1 1 19.604%2% 8.00Police 75001 3% @ 50 1 1YY 26.149%2% 9.00
Banning, City ofMisc Y70001 2% @ 55 1 20.255%2% 7.00Misc 70002 2% @ 55 1 20.255%2% 7.00Misc 70003 2% @ 55 1 20.255%2% 7.00Misc 70004 2.5% @ 55 1 20.255%2% 8.00Fire Y74001 2% @ 50 1 YY Y 41.376%2% 9.00Fire 74002 2% @ 50 1 YY Y 41.376%2% 9.00Police Y75001 3% @ 50 1 YY Y 41.376%2% 9.00
Bard Water DistrictMisc 70001 2% @ 60 3 YY 2.762%2% 7.00
Bardsdale Cemetery DistrictMisc Y70001 2% @ 60 3 YY 3.942%2% 7.00Misc 70002 2% @ 60 3 YY 3.942%2% 7.00
Barstow Cemetery DistrictMisc Y70001 2% @ 60 3 YY Y 31.453%2% 7.00
Barstow, City ofMisc 70001 2% @ 55 1 4YY 0.000%2% 7.00Misc 70002 2.7% @ 55 1 4YY 0.000%2% 8.00Police 75002 3% @ 50 1 4YY 26.149%2% 9.00
Bay Area Air Quality Management DistrictMisc Y70001 2% @ 55 1 Y Y 11.982%2% 7.00Misc 70002 2% @ 55 1 Y Y 11.982%2% 7.00
313

5. CalPERS Supplement - Summary of Contracting Agency Benefits - (Continued)
Final Pre- SickPost
Ordinary 1959Compensation SurvivorRetirement Leave
RetirementDisabilityBenefit
FinalContribution Rate
Employer Name Offset Option 2 Credit IncreaseSurvivor
BenefitFormula Period COLA Member EmployerCompensation
Allowance
Bay Area Water Supply and Conservation Agency
Misc 70001 2% @ 55 1 4YY Y 12.583%3% 7.00Beach Cities Health District
Misc Y70001 2% @ 60 1 YY 9.278%2% 7.00Bear Mountain Recreation and Park District
Misc 70001 2% @ 60 3 YY 0.488%2% 7.00Bear Valley Community Services District
Misc Y70001 2% @ 55 3 YY Y 10.282%2% 7.00Misc 70002 2% @ 55 3 YY 10.282%2% 7.00Police Y75001 2% @ 50 3 YY Y 19.900%2% 9.00
Beaumont District LibraryMisc 70001 2% @ 60 3 YY 17.140%2% 7.00Misc 70002 2.5% @ 55 3 YY 17.140%2% 8.00
Beaumont, City ofMisc 70001 2% @ 60 1 YY 16.932%2% 7.00Misc Y70002 2% @ 60 1 YY 16.932%2% 7.00Misc 70003 3% @ 60 1 YY 16.932%2% 8.00Misc Y70004 3% @ 60 1 YY 16.932%2% 8.00Fire Y74001 1/2 @ 55 3 YY 30.574%2% variesPolice 75001 3% @ 50 1 4YY 30.574%2% 9.00
Beaumont-Cherry Valley Recreation and Park District
Misc 70001 2% @ 60 1 3YY 11.144%2% 7.00Misc 70002 2.7% @ 55 1 3YY 11.144%2% 8.00
Beaumont-Cherry Valley Water DistrictMisc 70001 2% @ 55 1 YY Y 31.318%5% 7.00Misc 70002 2.7% @ 55 1 YY Y 31.318%5% 8.00
Bell Gardens, City ofMisc 70001 2% @ 55 1 4YY 16.312%2% 7.00Misc Y70002 2% @ 55 1 YY 16.312%2% 7.00Misc 70003 2% @ 60 3 YY 16.312%2% 7.00Misc 70004 2.7% @ 55 1 4YY 16.312%2% 8.00Police 75001 3% @ 50 1 4YY Y 48.415%2% 9.00
Bell, City ofMisc 70001 2% @ 55 1 YY Y 26.010%5% 7.00Misc Y70002 2% @ 55 1 YY Y 26.010%5% 7.00Misc Y70003 2.7% @ 55 1 YY Y 26.010%5% 8.00Fire 74001 3% @ 50 1 3YY Y 28.212%2% 9.00Police 75001 3% @ 50 1 3YY Y 28.212%2% 9.00Police 75101 3% @ 55 1 3YY Y 23.397%2% 9.00
Bella Vista Water DistrictMisc Y70001 2% @ 60 3 YY 8.049%2% 7.00
Bellflower, City ofMisc Y70001 2% @ 55 1 YY Y Y 12.192%2% 7.00Misc 70002 2% @ 55 1 YY Y Y 12.192%2% 7.00
Belmont, City ofMisc 70001 2% @ 55 1 4YY 15.002%2% 7.00Police 75001 3% @ 50 1 4YY 37.833%2% 9.00
Belvedere, City ofMisc 70001 2% @ 55 1 3YY 15.610%2% 7.00Misc Y70002 2% @ 55 1 YY 15.610%2% 7.00Police 75001 2% @ 50 3 3YY 30.270%2% 9.00
Belvedere-Tiburon Library AgencyMisc 70001 2% @ 55 3 3YY 11.494%2% 7.00
Ben Lomond Fire Protection DistrictFire 74001 2% @ 55 3 3YY 21.533%2% 7.00
Benicia City Housing AuthorityMisc Y70001 2% @ 60 1 YY Y 13.906%2% 7.00
314

5. CalPERS Supplement - Summary of Contracting Agency Benefits - (Continued)
Final Pre- SickPost
Ordinary 1959Compensation SurvivorRetirement Leave
RetirementDisabilityBenefit
FinalContribution Rate
Employer Name Offset Option 2 Credit IncreaseSurvivor
BenefitFormula Period COLA Member EmployerCompensation
Allowance
Benicia, City ofMisc 70001 2% @ 55 1 3Y 15.757%2% 7.00Misc 70003 2.7% @ 55 1 3Y 15.757%2% 8.00Fire 74001 3% @ 50 1 4YY Y 27.877%2% 9.00Fire 74101 3% @ 55 3 4YY Y 22.502%2% 9.00Police 75001 3% @ 50 1 4YY Y 27.877%2% 9.00Police 75101 3% @ 55 3 4YY Y 22.502%2% 9.00
Bennett Valley Fire Protection DistrictFire 74001 2% @ 55 1 YY 15.092%2% 7.00
Berkeley, City ofMisc 70001 2% @ 55 1 3Y Y 20.945%2% 7.00Misc Y70002 2% @ 55 1 Y Y 20.945%2% 7.00Misc 70003 2.7% @ 55 1 3Y Y 20.945%2% 8.00Misc Y70004 2.7% @ 55 1 Y Y 20.945%2% 8.00Misc Y70401 2% @ 55 1 Y 20.945%2% 7.00Misc Y70402 2.7% @ 55 1 Y 20.945%2% 8.00Fire 74001 3% @ 50 1 8Y Y 31.462%2% 9.00Police 75001 3% @ 50 1 4YY Y 45.710%2% 9.00
Beta Healthcare Group Risk Management Authority
Misc 70001 2% @ 60 3 8YY 8.049%2% 7.00Beverly Hills, City of
Misc 70001 2% @ 55 1 4 16.676%2% 7.00Misc 70002 2.5% @ 55 1 4Y 16.676%2% 8.00Fire 74001 3% @ 50 1 4Y 33.161%2% 9.00Police 75001 3% @ 50 1 4Y 33.161%2% 9.00
Big Bear Area Regional Wastewater Agency
Misc 70001 2% @ 55 1 3YY Y 16.707%2% 7.00Misc 70002 2.7% @ 55 1 3YY Y 16.707%2% 8.00Misc 70401 2% @ 55 1 YY Y 16.707%2% 7.00Misc 70402 2.7% @ 55 1 YY Y 16.707%2% 8.00
Big Bear City Airport DistrictMisc 70001 2% @ 55 1 4YY Y Y 13.489%3% 7.00
Big Bear City Community Services DistrictMisc 70001 2% @ 55 1 YY Y 16.707%2% 7.00Misc 70002 2% @ 55 1 3YY Y 16.707%2% 7.00Misc 70003 2.7% @ 55 1 YY Y 16.707%2% 8.00Fire Y74001 3% @ 50 1 YY Y 34.370%2% 9.00
Big Bear Municipal Water DistrictMisc 70001 2% @ 55 1 YY 10.781%2% 7.00Misc 70002 2% @ 55 1 YY 10.781%2% 7.00
Biggs, City ofMisc Y70001 2% @ 60 3 YY 10.177%2% 7.00Misc 70002 2% @ 60 3 YY 10.177%2% 7.00Police Y75001 2% @ 55 3 YY 0.000%2% 7.00
Bighorn-Desert View Water AgencyMisc 70001 2% @ 60 1 3YY 17.620%2% 7.00Misc 70002 3% @ 60 1 3YY 17.620%2% 8.00Misc 70401 2% @ 60 3 3YY 17.620%2% 7.00Misc Y70402 2% @ 60 3 YY 17.620%2% 7.00Misc 70403 2% @ 60 3 3YY 17.620%2% 7.00
Bishop, City ofMisc 70002 2% @ 55 1 1YY 21.472%4% 7.00Misc 70101 2% @ 60 1 1YY 9.255%4% 7.00Fire 74001 3% @ 50 1 4YY 32.906%4% 9.00Police 75001 3% @ 50 1 1YY 32.906%4% 9.00
Black Gold Cooperative Library SystemMisc 70001 2% @ 55 1 4YY 10.781%2% 7.00
315

5. CalPERS Supplement - Summary of Contracting Agency Benefits - (Continued)
Final Pre- SickPost
Ordinary 1959Compensation SurvivorRetirement Leave
RetirementDisabilityBenefit
FinalContribution Rate
Employer Name Offset Option 2 Credit IncreaseSurvivor
BenefitFormula Period COLA Member EmployerCompensation
Allowance
Blanchard/Santa Paula Public Library District
Misc 70001 2% @ 60 3 YY 13.936%2% 7.00Misc Y70002 2% @ 60 3 YY 13.936%2% 7.00
Blue Lake Fire Protection DistrictFire 74001 3% @ 50 3 4YY 27.251%2% 9.00
Blue Lake, City ofMisc Y70001 2% @ 55 1 YY 20.147%2% 7.00Misc 70002 2% @ 55 3 YY 20.147%2% 7.00Misc 70003 2% @ 55 1 YY 20.147%2% 7.00Misc 70004 2.5% @ 55 1 YY 20.147%2% 8.00Police 75001 2% @ 50 3 YY 0.000%2% 9.00
Blythe, City ofMisc Y70001 2% @ 55 1 YY 18.615%2% 7.00Misc 70002 2% @ 55 1 YY 18.615%2% 7.00Misc Y70003 2.5% @ 55 1 YY 18.615%2% 8.00Misc 70004 2.5% @ 55 1 YY 18.615%2% 8.00Police Y75001 3% @ 50 1 YY 40.665%2% 9.00
Bodega Bay Fire Protection DistrictMisc 70001 2% @ 60 3 3YY 8.049%2% 7.00Fire 74001 2% @ 50 3 3YY 34.183%2% 9.00
Bolinas Community Public Utility DistrictMisc 70001 2% @ 60 3 4YY 11.185%2% 7.00Misc Y70002 2% @ 60 3 YY 11.185%2% 7.00
Bolinas Fire Protection DistrictFire Y74001 2% @ 55 3 YY 33.846%2% 7.00
Bonita-Sunnyside Fire Protection DistrictMisc 70001 2% @ 55 1 YY 15.685%2% 7.00Misc Y70002 2% @ 55 1 YY 15.685%2% 7.00Misc 70003 2.7% @ 55 1 YY 15.685%2% 8.00Misc 70101 2% @ 55 1 YY 15.685%2% 7.00Fire 74001 3% @ 50 1 4YY 26.149%2% 9.00
Boron Community Services DistrictMisc 70001 2% @ 60 1 YY Y 27.019%2% 7.00
Borrego Springs Fire Protection DistrictMisc 70001 2% @ 60 1 3YY 0.000%2% 7.00Fire 74001 1/2 @ 55 1 4YY 24.200%2% variesFire 74002 2% @ 55 1 4YY 24.200%2% 7.00
Borrego Water DistrictMisc 70001 2% @ 60 3 3YY 20.434%2% 7.00Misc 70002 3% @ 60 3 3YY 20.434%2% 8.00
Boulder Creek Fire Protection DistrictFire 74001 3% @ 55 1 4YY Y 23.397%2% 9.00
Bradbury, City ofMisc Y70001 2% @ 60 3 YY 14.716%2% 7.00
Branciforte Fire Protection DistrictFire Y74001 3% @ 55 3 YY 47.403%2% 9.00
Brannan-Andrus Levee Maintenance District
Misc Y70001 2% @ 60 3 YY 3.679%2% 7.00Misc 70002 2% @ 60 3 YY 3.679%2% 7.00
Brawley, City ofMisc Y70001 2% @ 55 1 YY 15.911%2% 7.00Fire Y74001 3% @ 50 1 YY 37.579%2% 9.00Police Y75001 3% @ 50 1 YY 37.579%2% 9.00
316
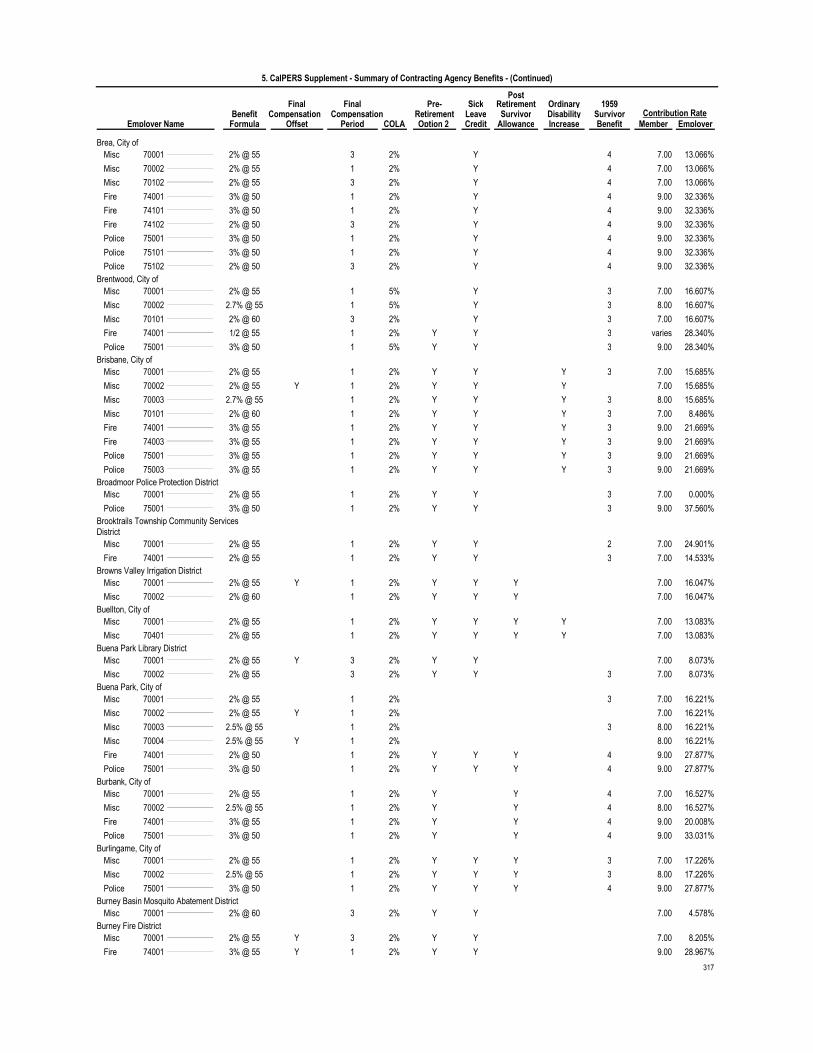
5. CalPERS Supplement - Summary of Contracting Agency Benefits - (Continued)
Final Pre- SickPost
Ordinary 1959Compensation SurvivorRetirement Leave
RetirementDisabilityBenefit
FinalContribution Rate
Employer Name Offset Option 2 Credit IncreaseSurvivor
BenefitFormula Period COLA Member EmployerCompensation
Allowance
Brea, City ofMisc 70001 2% @ 55 3 4Y 13.066%2% 7.00Misc 70002 2% @ 55 1 4Y 13.066%2% 7.00Misc 70102 2% @ 55 3 4Y 13.066%2% 7.00Fire 74001 3% @ 50 1 4Y 32.336%2% 9.00Fire 74101 3% @ 50 1 4Y 32.336%2% 9.00Fire 74102 2% @ 50 3 4Y 32.336%2% 9.00Police 75001 3% @ 50 1 4Y 32.336%2% 9.00Police 75101 3% @ 50 1 4Y 32.336%2% 9.00Police 75102 2% @ 50 3 4Y 32.336%2% 9.00
Brentwood, City ofMisc 70001 2% @ 55 1 3Y 16.607%5% 7.00Misc 70002 2.7% @ 55 1 3Y 16.607%5% 8.00Misc 70101 2% @ 60 3 3Y 16.607%2% 7.00Fire 74001 1/2 @ 55 1 3YY 28.340%2% variesPolice 75001 3% @ 50 1 3YY 28.340%5% 9.00
Brisbane, City ofMisc 70001 2% @ 55 1 3YY Y 15.685%2% 7.00Misc Y70002 2% @ 55 1 YY Y 15.685%2% 7.00Misc 70003 2.7% @ 55 1 3YY Y 15.685%2% 8.00Misc 70101 2% @ 60 1 3YY Y 8.486%2% 7.00Fire 74001 3% @ 55 1 3YY Y 21.669%2% 9.00Fire 74003 3% @ 55 1 3YY Y 21.669%2% 9.00Police 75001 3% @ 55 1 3YY Y 21.669%2% 9.00Police 75003 3% @ 55 1 3YY Y 21.669%2% 9.00
Broadmoor Police Protection DistrictMisc 70001 2% @ 55 1 3YY 0.000%2% 7.00Police 75001 3% @ 50 1 3YY 37.560%2% 9.00
Brooktrails Township Community Services District
Misc 70001 2% @ 55 1 2YY 24.901%2% 7.00Fire 74001 2% @ 55 1 3YY 14.533%2% 7.00
Browns Valley Irrigation DistrictMisc Y70001 2% @ 55 1 YY Y 16.047%2% 7.00Misc 70002 2% @ 60 1 YY Y 16.047%2% 7.00
Buellton, City ofMisc 70001 2% @ 55 1 YY Y Y 13.083%2% 7.00Misc 70401 2% @ 55 1 YY Y Y 13.083%2% 7.00
Buena Park Library DistrictMisc Y70001 2% @ 55 3 YY 8.073%2% 7.00Misc 70002 2% @ 55 3 3YY 8.073%2% 7.00
Buena Park, City ofMisc 70001 2% @ 55 1 3 16.221%2% 7.00Misc Y70002 2% @ 55 1 16.221%2% 7.00Misc 70003 2.5% @ 55 1 3 16.221%2% 8.00Misc Y70004 2.5% @ 55 1 16.221%2% 8.00Fire 74001 2% @ 50 1 4YY Y 27.877%2% 9.00Police 75001 3% @ 50 1 4YY Y 27.877%2% 9.00
Burbank, City ofMisc 70001 2% @ 55 1 4Y Y 16.527%2% 7.00Misc 70002 2.5% @ 55 1 4Y Y 16.527%2% 8.00Fire 74001 3% @ 55 1 4Y Y 20.008%2% 9.00Police 75001 3% @ 50 1 4Y Y 33.031%2% 9.00
Burlingame, City ofMisc 70001 2% @ 55 1 3YY Y 17.226%2% 7.00Misc 70002 2.5% @ 55 1 3YY Y 17.226%2% 8.00Police 75001 3% @ 50 1 4YY Y 27.877%2% 9.00
Burney Basin Mosquito Abatement DistrictMisc 70001 2% @ 60 3 YY 4.578%2% 7.00
Burney Fire DistrictMisc Y70001 2% @ 55 3 YY 8.205%2% 7.00Fire Y74001 3% @ 55 1 YY 28.967%2% 9.00
317

5. CalPERS Supplement - Summary of Contracting Agency Benefits - (Continued)
Final Pre- SickPost
Ordinary 1959Compensation SurvivorRetirement Leave
RetirementDisabilityBenefit
FinalContribution Rate
Employer Name Offset Option 2 Credit IncreaseSurvivor
BenefitFormula Period COLA Member EmployerCompensation
Allowance
Burney Water DistrictMisc Y70001 2% @ 60 3 YY 19.215%2% 7.00Misc Y70002 3% @ 60 3 YY 19.215%2% 8.00
Butte County Air Quality Management District
Misc 70001 2% @ 55 1 3YY 14.612%2% 7.00Misc Y70402 2% @ 55 1 YY 14.612%2% 7.00
Butte County Association of GovernmentsMisc 70001 2% @ 55 3 4YY 12.494%2% 7.00
Butte County In-Home Supportive Services Public Authority
Misc 70001 2% @ 55 1 4YY 10.781%2% 7.00Misc Y70002 2% @ 55 1 YY 10.781%2% 7.00
Butte County Mosquito and Vector Control District
Misc Y70001 2% @ 55 3 YY 14.697%2% 7.00Misc Y70002 2.5% @ 55 3 YY 14.697%2% 8.00
Butte Local Agency Formation CommissionMisc 70001 2% @ 55 1 4YY 11.834%2% 7.00
Butte Schools Self-Funded ProgramsMisc 70001 2% @ 55 1 3YY Y 15.702%2% 7.00
Butte, County ofMisc 70001 2% @ 55 1 YY 11.652%2% 7.00Misc Y70002 2% @ 55 1 YY 11.652%2% 7.00Fire Y74001 2% @ 50 1 YY 19.837%2% 9.00Peace Y77001 2% @ 50 1 YY 19.837%2% 9.00Police Y78001 3% @ 50 1 YY 19.837%2% 9.00
Butte-Glenn Community College DistrictPolice 75001 2% @ 55 3 4YY Y 22.682%2% 7.00
Byron-Bethany Irrigation DistrictMisc Y70001 2% @ 60 3 YY 5.054%2% 7.00Misc 70002 2% @ 60 3 YY 5.054%2% 7.00Misc Y70401 2% @ 60 3 YY 5.054%2% 7.00
Cabrillo College FoundationMisc 70001 2% @ 55 3 4YY 10.282%2% 7.00Misc 70002 2% @ 55 3 YY 10.282%2% 7.00
Cachuma Operations and Maintenance Board
Misc Y70001 2% @ 55 1 YY 12.487%2% 7.00Misc 70002 2% @ 60 3 YY 12.487%2% 7.00
Calabasas, City ofMisc 70001 2% @ 55 3 3YY 11.384%2% 7.00
Calaveras Council Of GovernmentsMisc 70001 2% @ 55 1 4YY Y 11.272%2% 7.00
Calaveras County Water DistrictMisc Y70001 2% @ 55 1 YY 15.685%2% 7.00Misc Y70002 2.7% @ 55 1 YY 15.685%2% 8.00
Calaveras Public Utility DistrictMisc Y70001 2% @ 55 3 YY 15.064%2% 7.00Misc 70002 2% @ 55 3 YY 15.064%2% 7.00Misc Y70003 2.7% @ 55 3 YY 15.064%2% 8.00
Calaveras, County ofMisc Y70001 2% @ 55 1 Y Y 14.629%2% 7.00Misc 70002 2% @ 55 1 2Y Y 14.629%2% 7.00Fire 74001 2% @ 50 1 2YY Y 36.893%2% 9.00Peace 77001 3% @ 50 1 2YY Y 36.893%2% 9.00
Calexico, City ofMisc 70001 2% @ 60 3 Y 6.073%2% 7.00Fire 74001 2% @ 50 3 1YY 28.535%2% 9.00Fire 74002 2% @ 50 3 1YY 28.535%2% 9.00Police 75001 2% @ 50 3 1YY 28.535%2% 9.00Police 75002 2% @ 50 3 1YY 28.535%2% 9.00
318

5. CalPERS Supplement - Summary of Contracting Agency Benefits - (Continued)
Final Pre- SickPost
Ordinary 1959Compensation SurvivorRetirement Leave
RetirementDisabilityBenefit
FinalContribution Rate
Employer Name Offset Option 2 Credit IncreaseSurvivor
BenefitFormula Period COLA Member EmployerCompensation
Allowance
California Association for Park and Recreation Indemnity
Misc 70001 2% @ 55 1 YY 20.643%2% 7.00Misc 70002 2.5% @ 55 1 YY 20.643%2% 8.00
California Authority of Racing FairsMisc 70001 2% @ 55 3 YY 1.591%2% 7.00
California Bear Credit UnionMisc Y70001 2% @ 55 3 YY 4.268%2% 7.00Misc Y70401 2% @ 55 3 YY 4.268%2% 7.00
California Central Valley Flood Control Association
Misc 70001 2% @ 60 3 8YY 11.101%2% 7.00Misc 70002 2% @ 60 3 YY 11.101%2% 7.00
California City, City ofMisc 70001 2% @ 55 1 4YY 24.095%2% 7.00Misc 70002 3% @ 60 1 4YY 24.095%2% 8.00Misc 70401 2% @ 55 1 YY 24.095%2% 7.00Fire 74001 3% @ 50 1 4YY 46.644%2% 9.00Police 75001 3% @ 50 1 4YY 46.644%2% 9.00Police 75101 2% @ 50 1 4YY 20.742%2% 9.00
California Fair Services AuthorityMisc 70001 2% @ 55 1 YY 13.771%2% 7.00
California Fairs Financing AuthorityMisc 70001 2% @ 55 1 YY 20.383%2% 7.00Misc 70002 2.7% @ 55 1 YY 20.383%2% 8.00
California Firefighter Joint Apprenticeship Committee
Misc 70001 2% @ 55 1 4YY 15.825%2% 7.00Fire 74001 2% @ 50 1 3YY Y 0.000%2% 9.00
California Interscholastic Federation - Northern Section
Misc 70001 2% @ 55 1 4YY 11.958%2% 7.00California Interscholastic Federation, Central Coast Section
Misc 70001 2% @ 55 1 YY 14.762%2% 7.00California Interscholastic Federation, Central Section
Misc Y70001 2% @ 60 3 YY 8.165%2% 7.00California Interscholastic Federation, North Coast Section
Misc 70001 2% @ 55 1 YY Y 20.489%2% 7.00California Interscholastic Federation, Sac-Joaquin Section
Misc 70001 2% @ 55 1 YY 14.781%2% 7.00California Interscholastic Federation, San Diego Section
Misc Y70001 2% @ 55 1 YY Y 29.955%2% 7.00California Interscholastic Federation, Southern Section
Misc 70001 2% @ 55 1 2YY 24.278%3% 7.00Misc 70002 2% @ 55 1 YY 24.278%3% 7.00Misc 70101 2% @ 60 1 YY 8.486%2% 7.00
California Interscholastic Federation, State Office
Misc 70001 2% @ 55 1 2YY 15.213%2% 7.00Misc 70002 2% @ 55 1 YY 15.213%2% 7.00
California Joint Powers Insurance AuthorityMisc Y70001 2% @ 55 1 YY 14.113%2% 7.00Misc 70002 2% @ 55 1 YY 14.113%2% 7.00
California Joint Powers Risk Management Authority
Misc 70001 2% @ 55 1 4YY 15.685%2% 7.00Misc 70002 2.7% @ 55 1 4YY 15.685%2% 8.00
California Maritime Academy Foundation, Inc.
Misc Y70001 2% @ 60 3 YY 0.000%2% 7.00319

5. CalPERS Supplement - Summary of Contracting Agency Benefits - (Continued)
Final Pre- SickPost
Ordinary 1959Compensation SurvivorRetirement Leave
RetirementDisabilityBenefit
FinalContribution Rate
Employer Name Offset Option 2 Credit IncreaseSurvivor
BenefitFormula Period COLA Member EmployerCompensation
Allowance
California Municipal Utilities AssociationMisc 70001 2% @ 55 3 YY Y Y 23.650%2% 7.00Misc 70002 2% @ 55 3 YY Y Y 23.650%2% 7.00
California Pines Community Services District
Misc 70001 2% @ 60 3 3YY 5.563%2% 7.00Fire 74001 2% @ 55 3 4YY 16.554%2% 7.00
California Redevelopment AssociationMisc 70001 2% @ 55 3 4YY 8.052%2% 7.00
California School Boards AssociationMisc Y70001 2% @ 60 1 YY Y 16.067%2% 7.00
California Special Districts AssociationMisc 70001 2% @ 60 3 8YY 8.049%2% 7.00
California State and Federal Employees No. 20 Credit Union
Misc Y70001 2% @ 55 1 YY 15.743%2% 7.00Misc 70002 2% @ 55 1 YY 15.743%2% 7.00
California State University, Fresno Athletic Corporation
Misc 70001 2% @ 55 3 YY 10.733%2% 7.00California State University, San Bernardino Student Union
Misc 70001 2% @ 55 3 4YY 14.719%2% 7.00California State University, Stanislaus Foundation
Misc Y70001 2% @ 60 1 YY 22.599%2% 5.00Misc 70002 2% @ 60 1 YY 22.599%2% 6.00
California State University-Fresno Association, Inc.
Misc Y70001 2% @ 55 1 YY 12.182%2% 7.00Calimesa, City of
Misc 70001 2% @ 60 1 YY 11.138%2% 7.00Calipatria, City of
Misc Y70001 2% @ 60 3 YY 0.000%2% 7.00Fire Y74001 2% @ 55 3 YY 14.556%2% 7.00Police Y75001 2% @ 55 3 YY 77.788%2% 7.00
Calistoga, City ofMisc Y70001 2% @ 55 1 YY 21.588%2% 7.00Misc 70002 2% @ 55 3 YY 21.588%2% 7.00Misc Y70003 2.5% @ 55 1 YY 21.588%2% 8.00Fire Y74001 3% @ 55 1 YY 32.832%2% 9.00Police Y75001 2% @ 50 1 YY 32.832%2% 9.00Police Y75002 3% @ 55 1 YY 32.832%2% 9.00
Callayomi County Water DistrictMisc 70001 2% @ 55 1 YY 20.049%2% 7.00Misc 70002 2.7% @ 55 1 YY 20.049%2% 8.00
Calleguas Municipal Water DistrictMisc Y70001 2% @ 55 3 YY 11.796%2% 7.00Misc 70002 2% @ 55 3 YY 11.796%2% 7.00
Camarillo Health Care DistrictMisc 70001 2% @ 60 1 YY 8.486%2% 7.00Misc 70002 2% @ 60 1 YY 8.486%2% 7.00
Camarillo, City ofMisc 70001 2% @ 55 1 Y Y 18.229%2% 7.00Misc 70002 2% @ 55 1 4YY Y 18.229%2% 7.00
Cambria Cemetery DistrictMisc Y70001 2% @ 60 1 YY 15.138%2% 7.00
Cambria Community Healthcare DistrictMisc 70001 2% @ 55 3 3YY 12.295%2% 7.00Fire 74001 3% @ 50 1 3YY 36.811%2% 9.00Fire 74101 3% @ 55 1 3YY 21.669%2% 9.00
320

5. CalPERS Supplement - Summary of Contracting Agency Benefits - (Continued)
Final Pre- SickPost
Ordinary 1959Compensation SurvivorRetirement Leave
RetirementDisabilityBenefit
FinalContribution Rate
Employer Name Offset Option 2 Credit IncreaseSurvivor
BenefitFormula Period COLA Member EmployerCompensation
Allowance
Cambria Community Services DistrictMisc Y70001 2% @ 55 1 YY 27.208%2% 7.00Misc Y70002 3% @ 60 1 YY 27.208%2% 8.00Misc Y70401 2% @ 55 1 YY 27.208%2% 7.00Misc Y70402 3% @ 60 1 YY 27.208%2% 8.00Fire Y74001 3% @ 50 1 YY 30.492%2% 9.00
Cameron Park Community Services DistrictMisc 70001 2% @ 55 3 3YY 19.185%2% 7.00Fire 74001 2% @ 50 3 3YY 0.000%2% 9.00
Campbell, City ofMisc 70001 2% @ 55 3 3Y 16.260%2% 7.00Misc Y70002 2% @ 55 3 Y 16.260%2% 7.00Misc 70003 2.5% @ 55 3 3Y Y 16.260%2% 8.00Misc Y70004 2.5% @ 55 3 Y 16.260%2% 8.00Misc 70101 2% @ 60 3 3Y Y 16.260%2% 7.00Police 75001 3% @ 50 1 4YY Y 45.904%2% 9.00Police 75101 2% @ 50 1 4YY 20.742%2% 9.00
Camrosa Water DistrictMisc 70001 2% @ 55 3 3YY 13.152%2% 7.00
Canyon Lake, City ofMisc 70001 2% @ 55 3 YY 17.887%2% 7.00
Capitol Area Development AuthorityMisc 70001 2% @ 55 1 2YY Y 13.592%2% 7.00
Capitola, City ofMisc Y70001 2% @ 55 1 YY 15.684%2% 7.00Misc 70002 2% @ 55 1 2YY 15.684%2% 7.00Misc Y70003 2.5% @ 55 1 YY 15.684%2% 8.00Misc 70004 2.5% @ 55 1 2YY 15.684%2% 8.00Fire 74001 3% @ 50 1 2YY 26.149%2% 9.00Police 75001 3% @ 50 1 2YY 26.149%2% 9.00
Carlsbad, City ofMisc 70001 2% @ 55 1 3Y Y Y 24.028%2% 7.00Misc Y70002 2% @ 55 1 Y Y Y 24.028%2% 7.00Misc 70003 3% @ 60 1 3Y Y Y 24.028%2% 8.00Misc Y70004 3% @ 60 1 Y Y Y 24.028%2% 8.00Misc Y70401 2% @ 55 1 24.028%2% 7.00Misc 70402 2% @ 55 1 3 24.028%2% 7.00Misc Y70403 3% @ 60 1 24.028%2% 8.00Misc 70404 3% @ 60 1 3 24.028%2% 8.00Fire 74001 3% @ 50 1 4Y Y 33.915%2% 9.00Fire 74101 2% @ 50 3 4Y Y 33.915%2% 9.00Police 75001 3% @ 50 1 3Y Y 33.915%2% 9.00Police 75101 2% @ 50 3 3Y Y 33.915%2% 9.00
Carmel Area Wastewater Agency (Monterey)
Misc 70001 2% @ 60 3 YY 8.049%2% 7.00Carmel Highlands Fire Protection District of Monterey County
Misc Y70001 2% @ 60 3 YY 0.000%2% 7.00Fire 74001 1/2 @ 55 1 YY Y 0.000%2% varies
Carmel Regional Fire Ambulance AuthorityFire 74001 3% @ 50 3 4YY 36.250%2% 9.00
Carmel-By-The-Sea, City ofMisc 70001 2% @ 55 1 4YY 10.781%2% 7.00Fire 74001 3% @ 50 1 4YY 26.149%2% 9.00Police 75001 3% @ 50 1 4YY 26.149%2% 9.00
Carmichael Water DistrictMisc Y70001 2% @ 55 1 YY 5.059%5% 7.00Misc 70002 2% @ 55 1 YY 5.059%5% 7.00
321

5. CalPERS Supplement - Summary of Contracting Agency Benefits - (Continued)
Final Pre- SickPost
Ordinary 1959Compensation SurvivorRetirement Leave
RetirementDisabilityBenefit
FinalContribution Rate
Employer Name Offset Option 2 Credit IncreaseSurvivor
BenefitFormula Period COLA Member EmployerCompensation
Allowance
Carpinteria Sanitary DistrictMisc Y70001 2% @ 55 1 YY 11.480%2% 7.00Misc 70002 2% @ 55 1 YY 11.480%2% 7.00Misc 70003 2% @ 55 1 YY 11.480%2% 7.00
Carpinteria Valley Water DistrictMisc Y70001 2% @ 55 1 YY 19.537%2% 7.00Misc 70002 2% @ 55 1 YY 19.537%2% 7.00Misc Y70101 2% @ 55 3 YY 10.282%2% 7.00
Carpinteria, City ofMisc 70001 2% @ 55 1 YY 13.408%3% 7.00Police 75001 2% @ 50 1 YY 0.000%2% 9.00
Carson, City ofMisc 70001 2% @ 55 1 4 21.946%2% 7.00Misc 70002 3% @ 60 1 4 21.946%2% 8.00Misc 70101 2% @ 60 1 4 21.946%2% 7.00Misc 70102 2% @ 55 1 4 21.946%2% 7.00
Casitas Municipal Water DistrictMisc 70001 2% @ 60 1 3YY Y 8.486%2% 7.00Misc Y70002 2% @ 60 1 YY Y 8.486%2% 7.00
Castaic Lake Water AgencyMisc 70001 2% @ 55 1 3YY Y 11.603%2% 7.00
Castro Valley Sanitary DistrictMisc 70001 2% @ 55 1 3YY 17.021%2% 7.00Misc Y70002 2% @ 55 1 YY 17.021%2% 7.00Misc 70003 2.7% @ 55 1 3YY 17.021%2% 8.00Misc 70101 2% @ 55 1 3YY 11.739%2% 7.00
Castroville Water DistrictMisc Y70001 2% @ 60 1 YY Y 8.181%2% 7.00Misc 70002 2% @ 60 1 YY Y 8.181%2% 7.00
Cathedral City, City ofMisc 70001 2% @ 55 1 4 14.326%2% 7.00Fire 74001 3% @ 55 1 4YY 24.552%2% 9.00Police 75001 3% @ 55 1 4YY 31.628%2% 9.00
Cawelo Water DistrictMisc 70001 2% @ 60 3 YY 12.604%2% 7.00Misc 70002 2% @ 60 3 YY 12.604%2% 7.00
Cayucos Sanitary DistrictMisc Y70001 2% @ 55 1 YY 14.660%2% 7.00Misc Y70002 2.5% @ 55 1 YY 14.660%2% 8.00
Cayucos-Morro Bay Cemetery DistrictMisc Y70001 2% @ 60 3 YY 18.116%2% 7.00Misc 70002 2% @ 60 3 YY 18.116%2% 7.00Misc Y70003 2.5% @ 55 3 YY 18.116%2% 8.00
Centerville Community Services DistrictMisc Y70001 2% @ 60 3 YY 7.475%2% 7.00
Central Basin Municipal Water DistrictMisc 70001 2% @ 60 1 1YY Y 16.773%2% 7.00Misc Y70002 2% @ 60 1 YY Y 16.773%2% 7.00Misc 70003 3% @ 60 1 1YY Y 16.773%2% 8.00Misc Y70004 3% @ 60 1 YY Y 16.773%2% 8.00Misc Y70101 2% @ 55 1 YY Y 11.603%2% 7.00
Central Calaveras Fire and Rescue Protection District
Misc 70001 2% @ 60 3 4YY 9.647%2% 7.00Fire 74001 2% @ 55 3 3YY 16.492%2% 7.00
Central Coast Computing AuthorityMisc 70001 2% @ 60 3 YY 0.000%2% 7.00
Central Coast Water AuthorityMisc 70001 2% @ 55 1 3YY Y 13.810%2% 7.00
Central Contra Costa Transit AuthorityMisc 70001 2% @ 60 3 Y Y 7.321%2% 7.00
322

5. CalPERS Supplement - Summary of Contracting Agency Benefits - (Continued)
Final Pre- SickPost
Ordinary 1959Compensation SurvivorRetirement Leave
RetirementDisabilityBenefit
FinalContribution Rate
Employer Name Offset Option 2 Credit IncreaseSurvivor
BenefitFormula Period COLA Member EmployerCompensation
Allowance
Central County Fire DepartmentMisc 70001 2.5% @ 55 1 4YY Y 15.577%2% 8.00Misc 70401 2.5% @ 55 1 3YY Y 15.577%2% 8.00Misc Y70402 3% @ 60 1 YY Y 15.577%2% 8.00Fire 74001 3% @ 55 1 4YY Y 23.397%2% 9.00Fire 74401 3% @ 55 1 4YY Y 23.397%2% 9.00Fire 74402 3% @ 55 1 4YY Y 23.397%2% 9.00
Central Fire Protection District of Santa Cruz County
Misc 70001 2% @ 55 1 8YY 14.660%2% 7.00Misc 70002 2.5% @ 55 1 8YY 14.660%2% 8.00Misc 70401 2% @ 55 1 8YY 14.660%2% 7.00Misc 70402 2% @ 55 1 8YY 14.660%2% 7.00Misc 70403 2% @ 60 1 2YY 14.660%2% 7.00Misc 70404 2% @ 60 1 2YY 14.660%2% 7.00Fire 74001 3% @ 50 1 8YY 26.149%2% 9.00Fire 74101 3% @ 55 3 8YY 20.774%2% 9.00Fire 74401 3% @ 50 1 8YY 26.149%2% 9.00Fire 74402 3% @ 50 1 8YY 26.149%2% 9.00Fire 74403 3% @ 50 1 8YY 26.149%2% 9.00Fire 74404 2% @ 50 1 2YY 26.149%2% 9.00
Central Marin Sanitation AgencyMisc 70001 2% @ 55 1 4YY 23.139%2% 7.00Misc 70002 2.7% @ 55 1 4YY 23.139%2% 8.00
Central Sierra Child Support AgencyMisc 70001 2% @ 55 1 8YY Y Y 12.094%2% 7.00Misc 70002 2% @ 55 1 YY Y Y 12.094%2% 7.00Misc 70401 2% @ 55 1 8YY Y Y 12.094%2% 7.00Misc Y70403 2% @ 55 1 YY Y Y 12.094%2% 7.00Misc 70405 2% @ 55 1 8YY Y Y 12.094%2% 7.00Misc Y70406 2% @ 55 1 YY 12.094%2% 7.00
Central Sierra Planning CouncilMisc 70001 2% @ 60 3 3YY 0.000%2% 7.00
Central Valley Regional Center, Inc.Misc 70001 2% @ 55 1 3Y Y 8.100%2% 7.00
Central Water DistrictMisc 70001 2% @ 55 1 YY 13.220%2% 7.00
Cerritos, City ofMisc Y70001 2% @ 55 1 Y Y 19.883%2% 7.00Misc 70002 2% @ 55 1 4Y Y 19.883%2% 7.00Misc Y70003 3% @ 60 1 Y Y 19.883%2% 8.00Misc 70004 3% @ 60 1 4Y Y Y 19.883%2% 8.00Misc 70101 2.5% @ 55 1 4Y Y Y 19.883%2% 8.00Misc 70102 2% @ 60 1 4Y Y Y 19.883%2% 7.00
Chester Public Utility DistrictMisc Y70001 2% @ 55 1 YY 26.601%2% 7.00Misc 70002 2% @ 55 1 YY 26.601%2% 7.00Misc 70003 2.5% @ 55 1 YY 26.601%2% 8.00Fire Y74001 3% @ 50 1 YY 30.982%2% 9.00Fire Y74401 3% @ 50 1 YY 30.982%2% 9.00
Chico Area Recreation and Park DistrictMisc Y70001 2% @ 55 1 YY 10.781%2% 7.00Misc 70002 2% @ 55 1 YY 10.781%2% 7.00
Chico, City ofMisc 70001 2% @ 55 1 4Y Y 26.254%2% 7.00Misc Y70002 2% @ 55 1 Y Y 26.254%2% 7.00Misc 70003 3% @ 60 1 4Y Y 26.254%2% 8.00Misc Y70004 3% @ 60 1 Y Y 26.254%2% 8.00Fire 74001 3% @ 50 1 4Y Y 31.310%2% 9.00Police 75001 3% @ 50 1 4Y Y 31.310%2% 9.00
323

5. CalPERS Supplement - Summary of Contracting Agency Benefits - (Continued)
Final Pre- SickPost
Ordinary 1959Compensation SurvivorRetirement Leave
RetirementDisabilityBenefit
FinalContribution Rate
Employer Name Offset Option 2 Credit IncreaseSurvivor
BenefitFormula Period COLA Member EmployerCompensation
Allowance
Children and Families Commission of San Luis Obispo County
Misc 70001 2% @ 55 1 4YY Y 13.022%3% 7.00Misc 70002 2% @ 55 1 YY Y 13.022%3% 7.00
Chino Basin Water Conservation DistrictMisc Y70001 2% @ 60 1 YY 8.486%2% 7.00Misc 70002 2% @ 60 1 YY 8.486%2% 7.00
Chino Basin WatermasterMisc 70001 2% @ 55 1 4YY 14.660%2% 7.00Misc 70002 2.5% @ 55 1 4YY 14.660%2% 8.00
Chino Valley Independent Fire DistrictMisc 70001 2% @ 55 1 4YY 14.660%2% 7.00Misc Y70002 2% @ 55 1 YY 14.660%2% 7.00Misc 70003 2.5% @ 55 1 4YY 14.660%2% 8.00Fire 74001 3% @ 55 1 4YY Y 23.397%2% 9.00
Chino, City ofMisc 70001 2% @ 55 1 4 16.961%2% 7.00Misc Y70002 2% @ 55 1 16.961%2% 7.00Misc 70003 2.7% @ 55 1 4 16.961%2% 8.00Fire 74001 2% @ 50 1 YY Y 26.149%2% 9.00Police 75001 3% @ 50 1 4YY 26.149%2% 9.00
Chowchilla, City ofMisc 70001 2% @ 55 1 YY 18.488%2% 7.00Misc 70002 2.5% @ 55 1 4YY 18.488%2% 8.00Fire 74001 3% @ 55 1 4YY 36.446%2% 9.00Police 75001 3% @ 55 1 4YY 36.882%2% 9.00
Chula Vista, City ofMisc 70001 2% @ 55 1 4Y Y 25.437%2% 7.00Misc 70002 3% @ 60 1 4Y Y 25.437%2% 8.00Misc 70101 2% @ 60 3 4Y Y 25.437%2% 7.00Misc 70401 2% @ 55 1 4Y Y 25.437%2% 7.00Misc 70402 3% @ 60 1 4Y Y 25.437%2% 8.00Fire 74001 3% @ 50 1 4Y Y 27.316%2% 9.00Fire 74101 3% @ 55 3 4Y Y 27.316%2% 9.00Fire 74401 3% @ 50 1 4Y Y 27.316%2% 9.00Police 75001 3% @ 50 1 4Y Y 27.316%2% 9.00Police 75101 3% @ 55 3 4Y Y 27.316%2% 9.00
Citrus Heights Water DistrictMisc Y70001 2% @ 55 1 YY 18.959%2% 7.00
Citrus Heights, City OfMisc 70001 2% @ 55 1 4YY 15.685%2% 7.00Misc 70002 2.7% @ 55 1 4YY 15.685%2% 8.00Misc 70101 2% @ 55 3 4YY 10.282%2% 7.00Police 75001 3% @ 50 1 4YY 26.149%2% 9.00Police 75101 3% @ 55 3 4YY 20.774%2% 9.00
Claremont, City ofMisc 70001 2% @ 55 1 3Y 22.074%2% 7.00Misc 70002 2.5% @ 55 1 3Y 22.074%2% 8.00Fire 74001 1/2 @ 55 3 YY 26.149%2% variesPolice 75001 2% @ 50 1 3YY 26.149%2% 9.00Police 75002 3% @ 50 1 3YY 26.149%2% 9.00
Clayton, City ofMisc 70001 2% @ 55 3 3YY 16.445%2% 7.00Misc 70101 2% @ 60 3 3YY 8.049%2% 7.00Police 75001 3% @ 55 3 4YY 38.163%2% 9.00
Clear Creek Community Services DistrictMisc 70001 2% @ 60 1 YY 22.748%2% 7.00Misc 70002 2.7% @ 55 1 YY 22.748%2% 8.00
Clearlake Oaks County Water DistrictMisc Y70001 2% @ 55 3 YY 7.356%2% 7.00Misc 70002 2% @ 55 3 YY 7.356%2% 7.00
324

5. CalPERS Supplement - Summary of Contracting Agency Benefits - (Continued)
Final Pre- SickPost
Ordinary 1959Compensation SurvivorRetirement Leave
RetirementDisabilityBenefit
FinalContribution Rate
Employer Name Offset Option 2 Credit IncreaseSurvivor
BenefitFormula Period COLA Member EmployerCompensation
Allowance
Clearlake, City ofMisc 70001 2% @ 55 3 YY 13.992%2% 7.00Police 75001 3% @ 50 3 YY 46.976%2% 9.00
Cloverdale Citrus FairMisc 70001 2% @ 60 3 YY 5.146%2% 7.00
Cloverdale Fire Protection DistrictFire 74001 3% @ 50 1 4YY Y 28.042%2% 9.00
Cloverdale, City ofMisc 70001 2% @ 55 1 4YY Y 15.727%2% 7.00Misc Y70002 2% @ 55 1 YY 15.727%2% 7.00Fire 74001 2% @ 50 1 4YY Y 32.511%2% 9.00Police 75001 3% @ 50 1 4YY Y 32.511%2% 9.00
Clovis Cemetery DistrictMisc Y70001 2% @ 60 3 YY Y 18.525%2% 7.00
Clovis, City ofMisc 70001 2% @ 55 1 4 18.051%2% 7.00Misc Y70002 2% @ 55 1 18.051%2% 7.00Misc 70003 2.5% @ 55 1 4 18.051%2% 8.00Misc Y70004 2.5% @ 55 1 18.051%2% 8.00Misc 70005 2.7% @ 55 1 4Y 18.051%2% 8.00Misc Y70006 2.7% @ 55 1 18.051%2% 8.00Fire 74001 3% @ 50 1 4Y 30.052%2% 9.00Fire 74002 3% @ 50 1 4YY 30.052%2% 9.00Police 75001 3% @ 50 1 4Y 30.052%2% 9.00Police 75002 3% @ 50 1 4YY 30.052%2% 9.00
Coachella Valley Association of Governments
Misc 70001 2% @ 55 1 3YY Y 12.216%2% 7.00Coachella Valley Mosquito and Vector Control District
Misc Y70001 2% @ 60 1 YY 5.511%2% 7.00Misc 70002 2% @ 60 1 YY 5.511%2% 7.00
Coachella Valley Public Cemetery DistrictMisc 70001 2% @ 55 1 YY 10.781%2% 7.00Misc Y70002 2% @ 55 1 YY 10.781%2% 7.00Misc 70003 2% @ 55 1 YY 10.781%2% 7.00
Coachella Valley Water DistrictMisc Y70001 2% @ 55 1 Y Y 21.018%2% 7.00Misc 70002 2% @ 55 1 Y Y 21.018%2% 7.00Misc Y70003 2.5% @ 55 1 Y Y 21.018%2% 8.00
Coachella, City ofMisc 70001 2% @ 55 1 1YY 18.483%2% 7.00Misc 70002 3% @ 60 1 1YY 18.483%2% 8.00Misc 70401 2% @ 55 3 YY 18.483%2% 7.00Fire 74001 1/2 @ 55 3 1YY 0.000%2% variesFire 74401 1/2 @ 55 3 YY 0.000%2% variesPolice 75001 2% @ 50 1 1YY 0.000%2% 9.00
Coalinga/Huron Unified School District Library District
Misc 70001 2% @ 60 3 8YY 9.041%2% 7.00Misc Y70002 2% @ 60 3 YY 9.041%2% 7.00
Coalinga-Huron Cemetery DistrictMisc Y70001 2% @ 60 3 YY 0.162%2% 7.00
Coalinga-Huron Mosquito Abatement District
Misc Y70001 2% @ 60 3 YY 0.000%2% 7.00Coalinga-Huron Recreation and Park District
Misc Y70001 2% @ 60 3 YY 2.372%2% 7.00Misc 70002 2% @ 60 3 YY 2.372%2% 7.00
Coast Life Support DistrictMisc 70001 2% @ 55 3 3YY 15.773%2% 7.00Fire 74001 2% @ 55 3 3YY 19.427%2% 7.00
325

5. CalPERS Supplement - Summary of Contracting Agency Benefits - (Continued)
Final Pre- SickPost
Ordinary 1959Compensation SurvivorRetirement Leave
RetirementDisabilityBenefit
FinalContribution Rate
Employer Name Offset Option 2 Credit IncreaseSurvivor
BenefitFormula Period COLA Member EmployerCompensation
Allowance
Coastal Developmental Services Foundation
Misc 70001 2% @ 60 1 3Y Y 7.248%2% 7.00Coastside County Water District
Misc Y70001 2% @ 55 1 YY Y 25.409%2% 7.00Misc Y70002 2.5% @ 55 1 YY Y 25.409%2% 8.00
Coastside Fire Protection DistrictMisc 70001 2.7% @ 55 1 4YY 0.000%2% 8.00Misc 70401 2% @ 55 1 YY 0.000%2% 7.00Misc 70402 2.7% @ 55 1 YY 0.000%2% 8.00Misc 70403 2% @ 55 1 YY 0.000%2% 7.00Fire 74001 3% @ 55 1 4YY Y 0.000%2% 9.00Fire 74401 3% @ 55 1 4YY Y 0.000%2% 9.00Fire 74402 3% @ 50 1 4YY 0.000%2% 9.00
Colfax Cemetery DistrictMisc Y70001 2% @ 60 3 YY 8.049%2% 7.00
Colfax, City OfMisc 70001 2% @ 60 1 YY 8.486%2% 7.00
College of the Canyons FoundationMisc 70001 2% @ 55 1 YY Y 11.603%2% 7.00
College TownMisc Y70001 2% @ 60 3 YY 0.000%2% 7.00
Colma, Town ofMisc Y70001 2% @ 55 1 YY 18.391%2% 7.00Misc 70002 2% @ 60 3 YY 18.391%2% 7.00Misc Y70003 2.5% @ 55 1 YY 18.391%2% 8.00Police Y75001 3% @ 50 1 YY 34.594%2% 9.00
Colton, City ofMisc 70001 2% @ 55 1 4 14.484%2% 7.00Misc Y70002 2% @ 55 1 14.484%2% 7.00Misc 70003 2.7% @ 55 1 4 14.484%2% 8.00Misc Y70004 2.7% @ 55 1 14.484%2% 8.00Fire 74001 3% @ 50 1 4YY Y 28.516%2% 9.00Police 75001 3% @ 50 1 4YY Y 28.525%2% 9.00
Colusa County One-Stop PartnershipMisc 70001 2% @ 55 3 4YY 11.768%2% 7.00
Colusa Mosquito Abatement DistrictMisc 70001 2% @ 55 3 YY 15.181%2% 7.00
Colusa, City ofMisc Y70001 2% @ 55 1 YY 11.989%2% 7.00Misc 70002 2% @ 55 1 YY 11.989%2% 7.00Misc Y70101 2% @ 60 3 YY 8.049%2% 7.00Fire Y74001 2% @ 50 3 YY 22.170%2% 9.00Police Y75001 2% @ 50 3 YY 28.151%2% 9.00
Colusa, County ofMisc 70001 2% @ 55 1 21.060%2% 7.00Misc Y70002 2% @ 55 1 21.060%2% 7.00Misc Y70003 3% @ 60 1 21.060%2% 8.00Peace Y77001 3% @ 50 1 YY 26.149%2% 9.00Peace 77002 2% @ 50 1 YY 26.149%2% 9.00Peace Y77003 2% @ 55 1 YY 26.149%2% 7.00
Commerce, City ofMisc 70001 2% @ 55 1 YY Y 12.330%2% 7.00
Community College League of CaliforniaMisc Y70001 2% @ 60 3 YY 14.056%2% 7.00
Community Development Commission of Mendocino County
Misc 70001 2% @ 60 3 YY 10.416%2% 7.00Misc 70002 2% @ 60 3 YY 10.416%2% 7.00
Compton Creek Mosquito Abatement District
Misc Y70001 2% @ 60 3 YY Y 0.000%2% 7.00
326

5. CalPERS Supplement - Summary of Contracting Agency Benefits - (Continued)
Final Pre- SickPost
Ordinary 1959Compensation SurvivorRetirement Leave
RetirementDisabilityBenefit
FinalContribution Rate
Employer Name Offset Option 2 Credit IncreaseSurvivor
BenefitFormula Period COLA Member EmployerCompensation
Allowance
Compton Unified School DistrictPolice 75001 3% @ 50 3 3YY Y 48.407%2% 9.00Police 75002 2% @ 60 3 3YY Y 48.407%2% 7.00
Compton, City ofMisc 70001 2% @ 55 1 3Y 22.599%2% 7.00Misc 70002 2.7% @ 55 1 3Y 22.599%2% 8.00Fire 74001 3% @ 50 1 1YY Y 55.711%2% 9.00Fire 74101 2% @ 50 1 1YY Y 55.711%2% 9.00Police 75001 2% @ 50 1 3YY Y 0.000%2% 9.00Police 75101 2% @ 50 3 3YY Y 0.000%2% 9.00
Concord, City ofMisc 70001 2% @ 55 1 YY 26.105%2% 7.00Misc 70002 2.5% @ 55 1 YY 26.105%2% 8.00Misc 70101 2% @ 55 1 YY 26.105%2% 7.00Police Y75001 3% @ 50 1 YY 33.355%2% 9.00Police 75002 3% @ 50 1 YY 33.355%2% 9.00Police 75003 3% @ 50 1 YY 33.355%2% 9.00
Conejo Recreation and Park DistrictMisc 70001 2% @ 55 1 4Y 8.607%2% 7.00Misc 70101 2% @ 60 1 4Y 8.607%2% 7.00
Consolidated Mosquito Abatement DistrictMisc Y70001 2% @ 60 3 YY 14.036%2% 7.00
Contra Costa Community College DistrictPolice 75001 2% @ 50 3 8YY Y 25.994%2% 9.00
Contra Costa County Law LibraryMisc 70001 2% @ 60 3 YY 14.939%2% 7.00
Contra Costa County Schools Insurance Group
Misc 70001 2% @ 55 3 3YY 12.291%2% 7.00Contra Costa Transportation Authority
Misc 70001 2% @ 55 3 4YY 13.458%2% 7.00Cooperative Organization for the Development of Employee Selection Procedures
Misc 70001 2% @ 55 1 8YY Y 11.176%2% 7.00Misc 70002 2% @ 55 1 YY Y 11.176%2% 7.00Misc Y70401 2% @ 55 1 YY Y 11.176%2% 7.00
Cooperative Personnel ServicesMisc 70001 2% @ 55 3 3YY Y 11.063%2% 7.00
Copperopolis Fire Protection DistrictMisc 70001 2% @ 55 1 YY 13.656%5% 7.00Fire 74001 2% @ 50 1 YY 32.496%5% 9.00
Corcoran, City ofMisc 70001 2% @ 55 1 2YY 10.706%2% 7.00Fire 74001 2.5% @ 55 1 2YY 34.055%2% 8.00Police 75001 3% @ 55 1 2YY 34.055%2% 9.00
Cordelia Fire Protection District of Solano County
Misc Y70001 2% @ 55 3 YY 0.000%2% 7.00Fire 74001 2% @ 55 3 YY 51.201%2% 7.00
Cordova Recreation and Park DistrictMisc 70001 2% @ 55 1 YY 22.599%3% 7.00
Corning Water DistrictMisc Y70001 2% @ 60 3 YY 10.416%2% 7.00Misc 70002 2% @ 60 3 YY 10.416%2% 7.00
Corning, City ofMisc 70001 2% @ 55 1 YY 10.781%2% 7.00Fire 74001 3% @ 50 1 YY 26.149%2% 9.00Police 75001 3% @ 50 1 YY 26.149%2% 9.00
327

5. CalPERS Supplement - Summary of Contracting Agency Benefits - (Continued)
Final Pre- SickPost
Ordinary 1959Compensation SurvivorRetirement Leave
RetirementDisabilityBenefit
FinalContribution Rate
Employer Name Offset Option 2 Credit IncreaseSurvivor
BenefitFormula Period COLA Member EmployerCompensation
Allowance
Corona, City ofMisc 70001 2% @ 55 1 4Y 28.195%2% 7.00Misc Y70002 2% @ 55 1 Y 28.195%2% 7.00Misc 70003 2.7% @ 55 1 4Y 28.195%2% 8.00Misc Y70004 2.7% @ 55 1 Y 28.195%2% 8.00Fire 74001 3% @ 50 1 4YY Y 41.279%2% 9.00Police 75001 3% @ 50 1 3Y Y 33.542%2% 9.00
Coronado, City ofMisc 70001 2% @ 55 1 20.099%2% 7.00Misc 70002 3% @ 60 1 20.099%2% 8.00Fire 74001 3% @ 50 1 2YY Y 26.149%2% 9.00Police 75001 3% @ 50 1 2YY 26.149%2% 9.00
Corte Madera, Town ofMisc Y70001 2% @ 55 1 YY Y 24.086%2% 7.00Misc 70002 2% @ 55 1 4YY Y 24.086%2% 7.00Misc Y70003 2.5% @ 55 1 YY Y 24.086%2% 8.00Misc 70004 2.5% @ 55 1 4YY Y 24.086%2% 8.00Fire 74001 3% @ 50 1 4YY Y 43.195%2% 9.00
Costa Mesa Sanitary DistrictMisc 70001 2% @ 55 1 4YY Y 11.603%2% 7.00
Costa Mesa, City ofMisc 70001 2% @ 55 1 3Y Y 27.383%2% 7.00Misc 70002 2.5% @ 55 1 3Y Y 27.383%2% 8.00Fire 74001 3% @ 50 1 3YY Y Y 45.618%2% 9.00Police 75001 3% @ 50 1 3Y Y 38.542%2% 9.00
Cosumnes Community Services DistrictMisc 70001 2% @ 55 1 4Y 13.519%2% 7.00Misc 70002 2.5% @ 55 1 4Y 13.519%2% 8.00Misc 70101 2% @ 55 1 4Y 13.519%2% 7.00Misc 70401 2% @ 55 1 4Y 13.519%2% 7.00Misc Y70402 2% @ 55 1 Y 13.519%2% 7.00Misc Y70403 2% @ 60 3 YY 13.519%2% 7.00Misc 70404 2.5% @ 55 1 4YY 13.519%2% 8.00Fire 74001 3% @ 50 1 4Y 26.942%2% 9.00Fire 74401 3% @ 50 1 4 26.942%2% 9.00Fire 74402 3% @ 50 1 YY 26.942%2% 9.00
Cotati, City ofMisc Y70001 2% @ 55 1 YY 25.669%2% 7.00Misc 70002 2% @ 55 1 4YY 25.669%2% 7.00Misc Y70003 2.7% @ 55 1 YY 25.669%2% 8.00Misc 70004 2.7% @ 55 1 4YY 25.669%2% 8.00Misc 70101 2% @ 60 1 4YY 8.486%2% 7.00Police 75001 3% @ 50 3 2YY 54.198%2% 9.00Police 75002 3% @ 50 3 2YY 54.198%2% 9.00Police 75101 2% @ 50 3 2YY 19.900%2% 9.00
Cottonwood Fire Protection DistrictFire 74002 3% @ 50 3 3YY 12.549%2% 9.00
Cottonwood Water DistrictMisc Y70001 2% @ 60 3 YY 8.818%2% 7.00
328

5. CalPERS Supplement - Summary of Contracting Agency Benefits - (Continued)
Final Pre- SickPost
Ordinary 1959Compensation SurvivorRetirement Leave
RetirementDisabilityBenefit
FinalContribution Rate
Employer Name Offset Option 2 Credit IncreaseSurvivor
BenefitFormula Period COLA Member EmployerCompensation
Allowance
Covina, City ofMisc 70001 2% @ 55 1 4Y Y 17.922%2% 7.00Misc 70002 2.5% @ 55 1 4Y Y 17.922%2% 8.00Misc 70101 2% @ 55 1 4Y Y 17.922%2% 7.00Misc 70402 2% @ 55 1 4Y 17.922%2% 7.00Fire 74001 2% @ 50 1 4YY Y 17.806%2% 9.00Fire 74002 2% @ 50 1 4YY Y 17.806%2% 9.00Fire 74102 2% @ 50 1 4YY Y 17.806%2% 9.00Fire 74402 2% @ 50 1 4YY Y 17.806%2% 9.00Police 75001 3% @ 50 1 4YY Y 17.806%2% 9.00Police 75002 3% @ 50 1 4YY Y 17.806%2% 9.00Police 75102 3% @ 50 1 4YY Y 17.806%2% 9.00Police 75103 3% @ 55 1 4YY Y 23.397%2% 9.00
Crescent City Harbor DistrictMisc Y70001 2% @ 55 1 YY 21.023%2% 7.00Misc 70002 2% @ 55 1 YY 21.023%2% 7.00
Crescent City, City ofMisc Y70001 2% @ 55 3 YY 16.211%2% 7.00Misc 70002 2% @ 55 3 2YY 16.211%2% 7.00Misc Y70003 2.5% @ 55 3 YY 16.211%2% 8.00Misc 70004 2.5% @ 55 3 2YY 16.211%2% 8.00Fire 74001 2% @ 50 3 8YY 52.672%2% 9.00Police 75001 2% @ 50 3 2YY 37.579%2% 9.00
Crescenta Valley Water DistrictMisc Y70001 2% @ 55 1 YY 10.781%2% 7.00Misc 70002 2% @ 55 1 YY 10.781%2% 7.00
Crestline Lake Arrowhead Water AgencyMisc 70001 2% @ 55 1 3YY 17.675%5% 7.00Misc 70002 2.7% @ 55 1 3YY 17.675%5% 8.00
Crestline Village Water DistrictMisc 70001 2.5% @ 55 3 4YY 29.501%2% 8.00
Crockett Community Services DistrictMisc 70001 2% @ 60 3 4YY 8.049%2% 7.00Misc 70401 2% @ 60 3 4YY 8.049%2% 7.00
CSAC Excess Insurance AuthorityMisc 70001 2% @ 55 1 2YY 11.709%4% 7.00
Cucamonga Valley Water DistrictMisc 70001 2% @ 55 1 4YY Y Y 16.540%2% 7.00Misc Y70002 2% @ 55 1 YY Y Y 16.540%2% 7.00Misc 70003 2.5% @ 55 1 4YY Y Y 16.540%2% 8.00Misc 70101 2% @ 60 3 4YY Y Y 16.540%2% 7.00
Cudahy, City ofMisc 70001 2% @ 55 1 YY 21.586%2% 7.00Misc Y70002 2% @ 55 1 YY 21.586%2% 7.00Misc 70003 2.7% @ 55 1 YY 21.586%2% 8.00Misc Y70004 2.7% @ 55 1 YY 21.586%2% 8.00
Culver City, City ofMisc 70001 2% @ 55 1 1Y 17.761%2% 7.00Misc Y70002 2% @ 55 1 Y 17.761%2% 7.00Misc 70003 2.5% @ 55 1 1Y 17.761%2% 8.00Misc Y70004 2.5% @ 55 1 Y 17.761%2% 8.00Fire 74001 3% @ 55 1 4Y Y 35.744%2% 9.00Police 75001 3% @ 50 1 4Y Y 35.744%2% 9.00Police 75002 3% @ 55 3 Y 35.744%2% 9.00
Cupertino, City ofMisc Y70001 2% @ 55 1 Y 21.777%2% 7.00Misc 70002 2% @ 55 1 4Y 21.777%2% 7.00Misc Y70003 2.7% @ 55 1 Y 21.777%2% 8.00Misc 70004 2.7% @ 55 1 4Y 21.777%2% 8.00
Cutler Public Utility DistrictMisc Y70001 2% @ 60 3 YY 18.959%2% 7.00
329

5. CalPERS Supplement - Summary of Contracting Agency Benefits - (Continued)
Final Pre- SickPost
Ordinary 1959Compensation SurvivorRetirement Leave
RetirementDisabilityBenefit
FinalContribution Rate
Employer Name Offset Option 2 Credit IncreaseSurvivor
BenefitFormula Period COLA Member EmployerCompensation
Allowance
Cutler-Orosi Joint Powers Wastewater Authority
Misc Y70001 2% @ 60 3 YY 7.635%2% 7.00Cuyama Valley Recreation District
Misc Y70001 2% @ 60 3 YY 0.000%2% 7.00Misc 70002 2% @ 60 3 YY 0.000%2% 7.00
Cypress, City ofMisc 70001 2% @ 55 1 3Y 12.968%2% 7.00Misc Y70002 2% @ 55 1 Y 12.968%2% 7.00Fire 74001 2% @ 55 3 YY Y 34.606%2% 7.00Police 75001 3% @ 50 1 4YY Y 34.606%2% 9.00
Dairy Council of CaliforniaMisc 70001 2% @ 55 3 3YY 3.016%2% 7.00
Daly City Redevelopment AgencyMisc 70001 2% @ 60 3 YY 0.000%2% 7.00
Daly City, City ofMisc 70001 2% @ 55 1 3Y 17.405%3% 7.00Misc 70002 3% @ 60 1 3YY 17.405%3% 8.00Misc Y70401 2% @ 55 1 17.405%3% 7.00Misc 70402 2% @ 55 1 17.405%3% 7.00Misc Y70403 3% @ 60 1 17.405%3% 8.00Fire 74001 3% @ 55 1 4Y 21.949%2% 9.00Police 75001 3% @ 55 1 3Y 21.949%2% 9.00
Dana Point, City ofMisc 70001 2% @ 55 1 3YY Y 10.781%2% 7.00
Davis Cemetery DistrictMisc 70001 2% @ 60 3 YY 8.049%2% 7.00
Davis, City ofMisc 70001 2% @ 55 1 4Y 21.128%2% 7.00Misc Y70002 2% @ 55 1 Y 21.128%2% 7.00Misc 70003 2.5% @ 55 1 4Y 21.128%2% 8.00Fire 74001 3% @ 50 1 4Y 27.823%2% 9.00Police 75001 3% @ 50 1 4Y 27.823%2% 9.00
De Luz Community Services DistrictMisc 70001 2% @ 55 3 YY 22.075%2% 7.00Misc 70002 2.5% @ 55 3 YY 22.075%2% 8.00
Del Mar, City ofMisc 70001 2% @ 55 3 3YY Y 15.544%2% 7.00Misc Y70002 2% @ 55 3 YY Y 15.544%2% 7.00Misc 70003 3% @ 60 3 3YY Y 15.544%2% 8.00Fire 74001 3% @ 50 3 8YY Y 25.168%2% 9.00Safety 76001 2% @ 50 3 2YY Y 18.082%2% 9.00
Del Norte CountyMisc Y70001 2% @ 55 1 Y 13.630%2% 7.00Misc 70002 2% @ 55 1 Y 13.630%2% 7.00Misc Y70401 2% @ 55 1 Y 13.630%2% 7.00Fire Y74001 2% @ 50 1 YY 28.250%2% 9.00Peace Y77001 2% @ 50 1 YY 28.250%2% 9.00
Del Norte County Library DistrictMisc 70001 2% @ 60 3 3YY 6.695%2% 7.00
Del Paso Manor Water DistrictMisc Y70001 2% @ 55 1 YY 11.702%2% 7.00Misc 70002 2% @ 55 1 YY 11.702%2% 7.00
Del Puerto Water DistrictMisc 70001 2% @ 55 1 4YY 13.768%2% 7.00
Del Rey Community Services DistrictMisc 70001 2% @ 60 3 YY 0.000%2% 7.00
Del Rey Oaks, City ofMisc Y70001 2% @ 60 3 YY 8.313%2% 7.00Misc 70002 2% @ 60 3 YY 8.313%2% 7.00Police 75001 2% @ 55 3 YY 26.449%2% 7.00
Delano Mosquito Abatement DistrictMisc 70001 2% @ 60 3 YY 0.344%2% 7.00
330

5. CalPERS Supplement - Summary of Contracting Agency Benefits - (Continued)
Final Pre- SickPost
Ordinary 1959Compensation SurvivorRetirement Leave
RetirementDisabilityBenefit
FinalContribution Rate
Employer Name Offset Option 2 Credit IncreaseSurvivor
BenefitFormula Period COLA Member EmployerCompensation
Allowance
Delano, City ofPolice Y75001 2% @ 50 3 YY 35.467%2% 9.00
Delta Diablo Sanitation DistrictMisc 70001 2.7% @ 55 3 YY 16.246%3% 8.00
Delta Vector Control DistrictMisc Y70001 2% @ 55 3 YY 16.130%2% 7.00Misc Y70002 3% @ 60 3 YY 16.130%2% 8.00
Denair Community Services DistrictMisc Y70001 2% @ 55 3 YY 14.083%2% 7.00Misc Y70002 2.5% @ 55 3 YY 14.083%2% 8.00
Desert Hot Springs, City ofMisc Y70001 2% @ 55 1 YY 19.480%2% 7.00Misc Y70002 2.7% @ 55 1 YY 19.480%2% 8.00Police Y75001 3% @ 50 1 YY Y 35.282%2% 9.00
Desert Water AgencyMisc Y70001 2% @ 55 1 YY Y Y 20.312%2% 7.00Misc 70002 2% @ 55 1 YY Y Y 20.312%2% 7.00Misc Y70003 2.5% @ 55 1 YY Y Y 20.312%2% 8.00Misc 70004 2.5% @ 55 1 YY Y Y 20.312%2% 8.00
Diablo Water DistrictMisc 70001 2.7% @ 55 1 YY 16.867%3% 8.00
Diamond Bar, City ofMisc 70001 2% @ 55 3 4YY 10.282%2% 7.00
Diamond Springs/El Dorado Fire Protection District
Misc 70001 2% @ 55 1 YY 20.329%2% 7.00Misc 70002 2.7% @ 55 1 YY 20.329%2% 8.00Fire Y74001 3% @ 50 1 YY 31.597%2% 9.00
Dinuba, City ofMisc Y70001 2% @ 55 1 YY 13.981%2% 7.00Misc 70002 2% @ 55 1 3YY 13.981%2% 7.00Fire 74001 1/2 @ 55 1 3YY 18.466%2% variesFire 74002 2% @ 55 1 3YY 18.466%2% 7.00Police 75001 1/2 @ 55 1 3YY 18.466%2% variesPolice 75002 2% @ 55 1 3YY 18.466%2% 7.00
Dixon Unified School District Library DistrictMisc Y70001 2% @ 55 1 YY 16.886%5% 7.00Misc 70002 2% @ 55 1 YY 16.886%5% 7.00
Dixon, City ofMisc 70001 2% @ 55 1 1YY 21.817%2% 7.00Misc Y70002 2% @ 55 1 YY 21.817%2% 7.00Misc 70003 2.5% @ 55 1 1YY 21.817%2% 8.00Fire 74001 3% @ 50 3 4YY 30.416%2% 9.00Police 75001 3% @ 50 3 4YY 35.687%2% 9.00
Donald P. and Katherine B. Loker University Student Union, Inc.
Misc Y70001 2% @ 55 3 YY 16.101%2% 5.00Dos Palos, City of
Misc Y70001 2% @ 55 3 YY 13.553%2% 7.00Misc 70002 2% @ 55 3 YY 13.553%2% 7.00Misc Y70003 3% @ 60 3 YY 13.553%2% 8.00Fire Y74001 3% @ 50 3 YY 14.066%2% 9.00Police Y75001 3% @ 50 3 YY 14.066%2% 9.00
Dougherty Regional Fire AuthorityMisc 70001 2% @ 60 1 3YY 0.000%2% 7.00Misc Y70401 2% @ 60 1 YY 0.000%2% 7.00Fire 74001 3% @ 50 1 3YY 0.000%2% 9.00Fire Y74401 3% @ 50 1 YY 0.000%2% 9.00
Downey Cemetery DistrictMisc Y70001 2% @ 60 3 YY 0.000%2% 7.00
331

5. CalPERS Supplement - Summary of Contracting Agency Benefits - (Continued)
Final Pre- SickPost
Ordinary 1959Compensation SurvivorRetirement Leave
RetirementDisabilityBenefit
FinalContribution Rate
Employer Name Offset Option 2 Credit IncreaseSurvivor
BenefitFormula Period COLA Member EmployerCompensation
Allowance
Downey, City ofMisc 70001 2% @ 55 1 4 18.996%2% 7.00Misc Y70002 2% @ 55 1 18.996%2% 7.00Misc 70003 2.7% @ 55 1 4Y 18.996%2% 8.00Misc Y70004 2.7% @ 55 1 18.996%2% 8.00Misc 70401 2% @ 55 1 3 18.996%2% 7.00Fire 74001 3% @ 50 1 3Y 29.539%2% 9.00Police 75001 3% @ 50 1 3Y 29.539%2% 9.00
Duarte, City ofMisc 70001 2% @ 55 1 3YY Y 25.289%2% 7.00Misc 70002 2.5% @ 55 1 3YY Y 25.289%2% 8.00
Dublin San Ramon Services DistrictMisc Y70001 2% @ 55 1 YY 15.685%2% 7.00Misc 70002 2% @ 55 1 YY 15.685%2% 7.00Misc Y70003 2.7% @ 55 1 YY 15.685%2% 8.00Misc 70004 2.7% @ 55 1 YY 15.685%2% 8.00
Dublin, City ofMisc 70001 2% @ 55 1 3YY 15.685%2% 7.00Misc 70002 2.7% @ 55 1 3YY 15.685%2% 8.00
Dunsmuir, City ofMisc Y70001 2% @ 55 3 YY 9.691%2% 7.00Fire Y74001 2% @ 50 3 YY 0.000%2% 9.00Police Y75001 2% @ 50 3 YY 0.000%2% 9.00
Durham Mosquito Abatement DistrictMisc 70001 2% @ 60 1 YY 10.969%2% 7.00
East Bay Dischargers AuthorityMisc 70001 2% @ 55 1 YY 3.676%2% 7.00Misc 70002 2.5% @ 55 1 YY 3.676%2% 8.00
East Bay Regional Park DistrictMisc 70001 2% @ 55 3 Y 21.856%2% 7.00Misc 70002 2.5% @ 55 3 Y 21.856%2% 8.00Fire 74001 3% @ 50 1 YY 26.149%2% 9.00Police 75001 3% @ 50 1 YY 26.149%2% 9.00
East Contra Costa Irrigation DistrictMisc 70001 2% @ 55 3 1YY 15.064%2% 7.00Misc 70002 2.7% @ 55 3 1YY 15.064%2% 8.00
East Kern Airport DistrictMisc 70001 2% @ 60 1 8YY Y 26.381%3% 7.00Misc 70002 2.7% @ 55 1 8YY Y 26.381%3% 8.00Fire 74001 2% @ 50 1 3YY Y 35.468%3% 9.00
East Orange County Water DistrictMisc 70001 2% @ 60 3 YY 8.049%2% 7.00
East Palo Alto Sanitary DistrictMisc 70001 2% @ 60 1 YY 17.523%2% 7.00Misc 70002 2.7% @ 55 1 YY 17.523%2% 8.00
East Palo Alto, City ofMisc 70001 2% @ 60 3 3YY 15.544%2% 7.00Misc 70002 2.5% @ 55 3 3YY 15.544%2% 8.00Police 75001 3% @ 55 3 3YY 26.753%2% 9.00
East Quincy Services DistrictMisc Y70001 2% @ 55 3 YY 19.169%2% 7.00
East San Gabriel Valley Human Services Consortium
Misc 70001 2% @ 55 1 1YY 15.725%2% 7.00East Valley Water District
Misc 70001 2% @ 55 3 4YY 19.794%2% 7.00Misc Y70002 2% @ 55 3 YY 19.794%2% 7.00Misc 70003 2.7% @ 55 3 4YY 19.794%2% 8.00Misc Y70004 2.7% @ 55 3 YY 19.794%2% 8.00
332

5. CalPERS Supplement - Summary of Contracting Agency Benefits - (Continued)
Final Pre- SickPost
Ordinary 1959Compensation SurvivorRetirement Leave
RetirementDisabilityBenefit
FinalContribution Rate
Employer Name Offset Option 2 Credit IncreaseSurvivor
BenefitFormula Period COLA Member EmployerCompensation
Allowance
Eastern Municipal Water DistrictMisc 70001 2% @ 55 1 4Y 15.344%2% 7.00Misc Y70002 2% @ 55 1 15.344%2% 7.00Misc 70003 2.5% @ 55 1 4Y 15.344%2% 8.00Misc Y70004 2.5% @ 55 1 15.344%2% 8.00Misc 70101 2% @ 55 1 4Y 15.344%2% 7.00
Eastern Sierra Transit AuthorityMisc 70001 2.5% @ 55 3 4YY 14.520%2% 8.00
Ebbetts Pass Fire Protection DistrictMisc 70001 2% @ 60 3 YY 10.018%2% 7.00Fire 74001 3% @ 55 3 YY 20.774%2% 9.00
El Cajon, City ofMisc 70001 2% @ 55 1 4Y 28.476%2% 7.00Misc 70002 3% @ 60 1 4Y 28.476%2% 8.00Fire 74001 3% @ 50 1 3Y Y 39.066%2% 9.00Fire 74101 3% @ 55 3 3Y Y 39.066%2% 9.00Police 75001 3% @ 50 1 3Y Y 39.066%2% 9.00Police 75101 3% @ 55 3 3Y Y 39.066%2% 9.00
El Centro, City ofMisc 70001 2% @ 55 1 3Y Y Y 9.255%2% 7.00Misc Y70002 2% @ 55 1 Y Y Y 9.255%2% 7.00Misc 70101 2% @ 55 1 3Y Y 9.255%2% 7.00Fire 74001 3% @ 50 1 4YY Y 53.554%2% 9.00Police 75001 3% @ 50 1 4YY Y 53.554%2% 9.00
El Cerrito, City ofMisc Y70001 2% @ 55 1 YY 20.603%2% 7.00Misc 70002 2% @ 55 1 YY 20.603%2% 7.00Misc Y70003 2.7% @ 55 1 YY 20.603%2% 8.00Fire 74001 3% @ 50 1 4YY 32.048%2% 9.00Police 75001 3% @ 50 1 4YY 32.048%2% 9.00
El Dorado County Fire Protection DistrictMisc 70001 2% @ 55 3 3YY Y 22.397%2% 7.00Misc 70002 2.7% @ 55 3 3YY Y 22.397%2% 8.00Misc 70101 2% @ 55 3 3YY Y 22.397%2% 7.00Misc 70102 2.7% @ 55 3 3YY Y 22.397%2% 8.00Misc 70401 2% @ 55 3 YY 22.397%2% 7.00Misc 70402 2% @ 55 3 3YY 22.397%2% 7.00Misc 70403 2.7% @ 55 3 3YY 22.397%2% 8.00Fire 74001 3% @ 50 1 3YY Y 34.444%2% 9.00Fire 74101 2% @ 50 1 3YY Y 20.742%2% 9.00Fire 74401 3% @ 50 1 YY 34.444%2% 9.00Fire 74402 3% @ 50 1 3YY 34.444%2% 9.00Fire 74403 3% @ 50 1 3YY Y 34.444%2% 9.00Fire 74404 3% @ 50 1 YY Y 34.444%2% 9.00Fire 74405 3% @ 50 3 YY 34.444%2% 9.00Fire 74406 3% @ 50 3 YY 34.444%2% 9.00
El Dorado County Local Transportation Commission
Misc 70001 2% @ 55 1 4YY 12.393%2% 7.00El Dorado County Transit Authority
Misc 70001 2% @ 55 1 3YY Y 14.379%2% 7.00El Dorado Hills Community Services District
Misc 70001 2% @ 55 1 YY Y 15.788%2% 7.00Misc 70002 2% @ 55 1 YY Y 15.788%2% 7.00
El Dorado Hills County Water DistrictMisc 70001 2% @ 55 1 3YY 15.724%2% 7.00Misc 70002 3% @ 60 1 3YY Y 15.724%2% 8.00Fire 74001 3% @ 50 1 3YY Y 26.149%2% 9.00
333
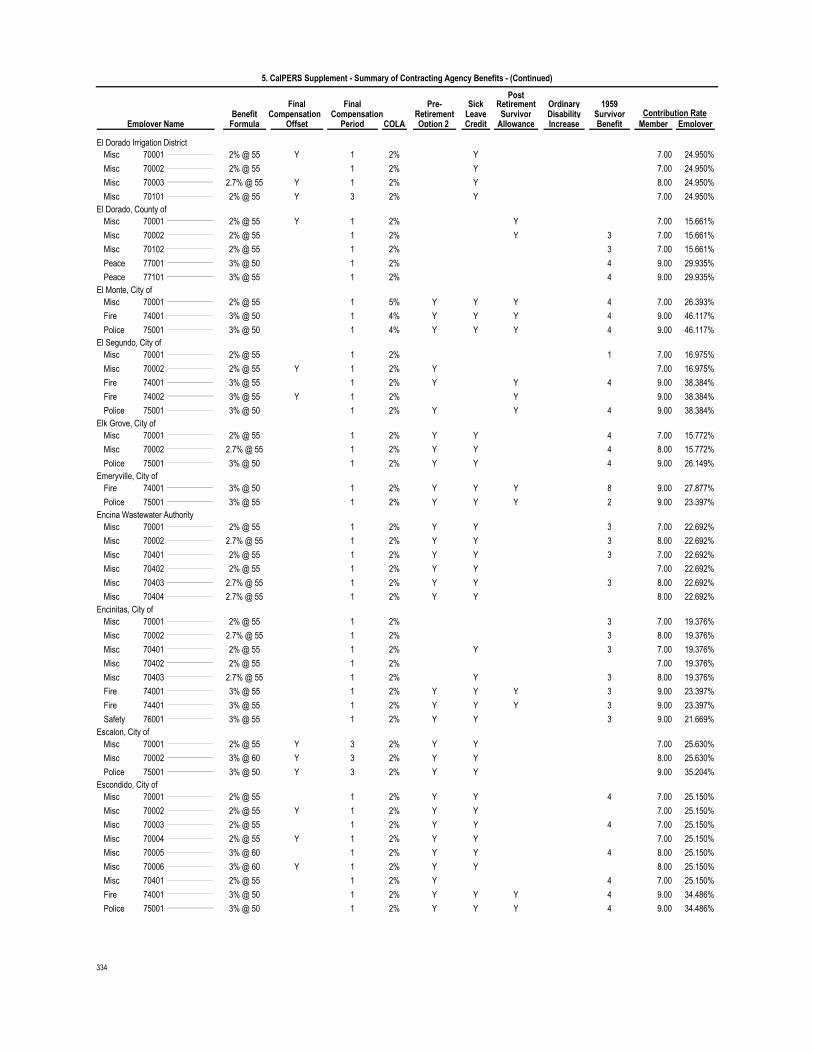
5. CalPERS Supplement - Summary of Contracting Agency Benefits - (Continued)
Final Pre- SickPost
Ordinary 1959Compensation SurvivorRetirement Leave
RetirementDisabilityBenefit
FinalContribution Rate
Employer Name Offset Option 2 Credit IncreaseSurvivor
BenefitFormula Period COLA Member EmployerCompensation
Allowance
El Dorado Irrigation DistrictMisc Y70001 2% @ 55 1 Y 24.950%2% 7.00Misc 70002 2% @ 55 1 Y 24.950%2% 7.00Misc Y70003 2.7% @ 55 1 Y 24.950%2% 8.00Misc Y70101 2% @ 55 3 Y 24.950%2% 7.00
El Dorado, County ofMisc Y70001 2% @ 55 1 Y 15.661%2% 7.00Misc 70002 2% @ 55 1 3Y 15.661%2% 7.00Misc 70102 2% @ 55 1 3 15.661%2% 7.00Peace 77001 3% @ 50 1 4 29.935%2% 9.00Peace 77101 3% @ 55 1 4 29.935%2% 9.00
El Monte, City ofMisc 70001 2% @ 55 1 4YY Y 26.393%5% 7.00Fire 74001 3% @ 50 1 4YY Y 46.117%4% 9.00Police 75001 3% @ 50 1 4YY Y 46.117%4% 9.00
El Segundo, City ofMisc 70001 2% @ 55 1 1 16.975%2% 7.00Misc Y70002 2% @ 55 1 Y 16.975%2% 7.00Fire 74001 3% @ 55 1 4Y Y 38.384%2% 9.00Fire Y74002 3% @ 55 1 Y 38.384%2% 9.00Police 75001 3% @ 50 1 4Y Y 38.384%2% 9.00
Elk Grove, City ofMisc 70001 2% @ 55 1 4YY 15.772%2% 7.00Misc 70002 2.7% @ 55 1 4YY 15.772%2% 8.00Police 75001 3% @ 50 1 4YY 26.149%2% 9.00
Emeryville, City ofFire 74001 3% @ 50 1 8YY Y 27.877%2% 9.00Police 75001 3% @ 55 1 2YY Y 23.397%2% 9.00
Encina Wastewater AuthorityMisc 70001 2% @ 55 1 3YY 22.692%2% 7.00Misc 70002 2.7% @ 55 1 3YY 22.692%2% 8.00Misc 70401 2% @ 55 1 3YY 22.692%2% 7.00Misc 70402 2% @ 55 1 YY 22.692%2% 7.00Misc 70403 2.7% @ 55 1 3YY 22.692%2% 8.00Misc 70404 2.7% @ 55 1 YY 22.692%2% 8.00
Encinitas, City ofMisc 70001 2% @ 55 1 3 19.376%2% 7.00Misc 70002 2.7% @ 55 1 3 19.376%2% 8.00Misc 70401 2% @ 55 1 3Y 19.376%2% 7.00Misc 70402 2% @ 55 1 19.376%2% 7.00Misc 70403 2.7% @ 55 1 3Y 19.376%2% 8.00Fire 74001 3% @ 55 1 3YY Y 23.397%2% 9.00Fire 74401 3% @ 55 1 3YY Y 23.397%2% 9.00Safety 76001 3% @ 55 1 3YY 21.669%2% 9.00
Escalon, City ofMisc Y70001 2% @ 55 3 YY 25.630%2% 7.00Misc Y70002 3% @ 60 3 YY 25.630%2% 8.00Police Y75001 3% @ 50 3 YY 35.204%2% 9.00
Escondido, City ofMisc 70001 2% @ 55 1 4YY 25.150%2% 7.00Misc Y70002 2% @ 55 1 YY 25.150%2% 7.00Misc 70003 2% @ 55 1 4YY 25.150%2% 7.00Misc Y70004 2% @ 55 1 YY 25.150%2% 7.00Misc 70005 3% @ 60 1 4YY 25.150%2% 8.00Misc Y70006 3% @ 60 1 YY 25.150%2% 8.00Misc 70401 2% @ 55 1 4Y 25.150%2% 7.00Fire 74001 3% @ 50 1 4YY Y 34.486%2% 9.00Police 75001 3% @ 50 1 4YY Y 34.486%2% 9.00
334

5. CalPERS Supplement - Summary of Contracting Agency Benefits - (Continued)
Final Pre- SickPost
Ordinary 1959Compensation SurvivorRetirement Leave
RetirementDisabilityBenefit
FinalContribution Rate
Employer Name Offset Option 2 Credit IncreaseSurvivor
BenefitFormula Period COLA Member EmployerCompensation
Allowance
Esparto Community Services DistrictMisc Y70001 2% @ 60 3 YY 19.081%2% 7.00Misc 70002 2% @ 60 3 YY 19.081%2% 7.00Misc Y70003 3% @ 60 3 YY 19.081%2% 8.00
Esparto Fire Protection DistrictMisc 70001 2% @ 55 3 4YY 9.972%2% 7.00Misc Y70002 2% @ 55 3 YY 9.972%2% 7.00
Estero Municipal Improvement DistrictMisc 70001 2% @ 55 3 4 18.757%2% 7.00Misc 70003 2.7% @ 55 3 4 18.757%2% 8.00Fire 74001 3% @ 50 3 4YY 31.025%2% 9.00Police 75001 3% @ 50 3 4YY 31.025%2% 9.00
Etna, City ofMisc 70001 2% @ 60 3 YY 2.461%2% 7.00Police 75001 2% @ 55 3 YY 24.677%2% 7.00
Eureka, City ofMisc 70001 2% @ 55 1 3Y 24.584%2% 7.00Misc Y70002 2% @ 55 1 Y 24.584%2% 7.00Misc 70003 2.7% @ 55 1 3Y 24.584%2% 8.00Misc Y70004 2.7% @ 55 1 Y 24.584%2% 8.00Fire 74001 3% @ 50 1 2YY Y 42.643%2% 9.00Police 75001 3% @ 50 3 2YY Y 41.134%2% 9.00
Exeter District AmbulanceMisc 70001 2% @ 55 3 4YY 51.553%2% 7.00
Exeter, City ofMisc 70001 2% @ 60 3 4YY 30.011%2% 7.00Misc 70002 3% @ 60 3 4YY 30.011%2% 8.00Police 75001 3% @ 55 3 3YY 31.107%2% 9.00
Exposition Metro Line Construction Authority
Misc 70001 2.5% @ 55 1 4YY 14.979%2% 8.00Fair Oaks Recreation & Park District
Misc 70001 2% @ 55 1 YY 6.570%2% 7.00Fair Oaks Water District
Misc Y70001 2% @ 55 3 YY 9.381%2% 7.00Misc 70002 2% @ 55 3 YY 9.381%2% 7.00
Fairfax, Town ofMisc 70001 2% @ 55 3 3YY Y 18.208%2% 7.00Misc Y70002 2% @ 55 3 YY Y 18.208%2% 7.00Misc 70003 2.5% @ 55 3 3YY Y 18.208%2% 8.00Misc 70101 2% @ 55 3 3YY Y 11.104%2% 7.00Police 75001 3% @ 50 3 3YY Y 55.960%2% 9.00Police 75101 3% @ 55 3 3YY Y 22.502%2% 9.00
Fairfield, City ofMisc 70001 2% @ 55 1 4Y 17.966%2% 7.00Misc Y70002 2% @ 55 1 Y 17.966%2% 7.00Misc 70003 2.7% @ 55 1 4Y 17.966%2% 8.00Misc Y70004 2.7% @ 55 1 Y 17.966%2% 8.00Misc 70401 2% @ 55 1 Y Y 17.966%5% 7.00Misc 70402 2% @ 60 1 1Y Y 17.966%5% 7.00Misc 70403 2.7% @ 55 1 1Y Y 17.966%5% 8.00Fire 74001 3% @ 50 1 4Y 26.138%2% 9.00Police 75001 3% @ 50 1 4YY 26.138%2% 9.00
Fairfield-Suisun Sewer DistrictMisc 70001 2% @ 55 1 4YY 16.184%2% 7.00Misc 70002 3% @ 60 1 4YY 16.184%2% 8.00
Fall River Mills Community Services DistrictMisc Y70001 2% @ 60 3 YY 22.015%2% 7.00Misc 70002 2% @ 60 3 YY 22.015%2% 7.00
335

5. CalPERS Supplement - Summary of Contracting Agency Benefits - (Continued)
Final Pre- SickPost
Ordinary 1959Compensation SurvivorRetirement Leave
RetirementDisabilityBenefit
FinalContribution Rate
Employer Name Offset Option 2 Credit IncreaseSurvivor
BenefitFormula Period COLA Member EmployerCompensation
Allowance
Fallbrook Public Utility DistrictMisc Y70001 2% @ 55 1 YY Y Y 27.468%2% 7.00Misc 70002 2% @ 55 1 YY Y Y 27.468%2% 7.00Misc Y70003 2.5% @ 55 1 YY Y Y 27.468%2% 8.00Misc Y70401 2% @ 55 1 YY Y 27.468%2% 7.00Misc 70402 2% @ 55 1 YY Y 27.468%2% 7.00Misc Y70403 2.5% @ 55 1 YY Y 27.468%2% 8.00
Far Northern Regional CenterMisc 70001 2% @ 60 1 4Y 16.302%2% 7.00
Farmersville, City ofMisc Y70001 2% @ 60 3 YY 17.248%2% 7.00Fire Y74001 2% @ 55 3 YY 15.603%2% 7.00Police Y75001 2% @ 55 3 YY 15.603%2% 7.00
Feather River Air Quality Management District
Misc 70001 2% @ 55 1 3YY 18.277%2% 7.00Misc 70002 2.5% @ 55 1 3YY 18.277%2% 8.00
Feather River Recreation and Park DistrictMisc Y70001 2% @ 55 3 YY 8.258%2% 7.00Misc 70002 2% @ 55 3 YY 8.258%2% 7.00
Feather Water DistrictMisc Y70001 2% @ 60 3 YY 0.000%2% 7.00Misc 70002 2% @ 60 3 YY 0.000%2% 7.00
Felton Fire Protection DistrictFire Y74001 3% @ 55 3 YY 20.774%2% 9.00
Fern Valley Water DistrictMisc Y70001 2% @ 55 1 YY Y 8.040%2% 7.00Misc 70002 2% @ 55 1 YY Y 8.040%2% 7.00Misc Y70003 2.7% @ 55 1 YY Y 8.040%2% 8.00
Fillmore, City ofMisc Y70001 2% @ 55 1 YY 17.308%3% 7.00Misc 70002 2% @ 55 1 YY 17.308%3% 7.00Fire Y74001 3% @ 55 3 YY 47.093%3% 9.00Police Y75001 2% @ 55 3 YY 47.093%2% 7.00
Firebaugh, City ofMisc Y70001 2% @ 55 1 YY 16.068%2% 7.00Misc 70002 2% @ 60 3 YY 16.068%2% 7.00Misc Y70003 2.5% @ 55 1 YY 16.068%2% 8.00Police Y75001 3% @ 55 1 YY 30.804%2% 9.00
Florin County Water DistrictMisc Y70001 2% @ 60 3 YY 8.969%2% 7.00Misc 70002 2% @ 60 3 YY 8.969%2% 7.00
Florin Resource Conservation District Elk Grove Water Works
Misc 70001 2% @ 55 3 4YY 14.427%2% 7.00Folsom, City of
Misc Y70001 2% @ 55 1 21.893%2% 7.00Misc 70002 2% @ 55 1 21.893%2% 7.00Misc Y70003 2.7% @ 55 1 Y 21.893%2% 8.00Misc Y70101 2% @ 55 3 Y 21.893%2% 7.00Fire Y74001 3% @ 50 1 Y 34.146%2% 9.00Police Y75001 3% @ 50 1 Y 34.146%2% 9.00Police Y75101 2% @ 50 3 Y 34.146%2% 9.00
Fontana Unified School DistrictPolice 75001 3% @ 50 1 3YY Y 27.757%2% 9.00
Fontana, City ofMisc 70001 2% @ 55 1 4 14.272%2% 7.00Misc 70002 2.5% @ 55 1 4 14.272%2% 8.00Police 75001 3% @ 50 1 4 31.907%2% 9.00
Foothill Municipal Water DistrictMisc 70001 2% @ 55 1 8YY Y 11.603%2% 7.00Misc Y70002 2% @ 55 1 YY Y 11.603%2% 7.00
336

5. CalPERS Supplement - Summary of Contracting Agency Benefits - (Continued)
Final Pre- SickPost
Ordinary 1959Compensation SurvivorRetirement Leave
RetirementDisabilityBenefit
FinalContribution Rate
Employer Name Offset Option 2 Credit IncreaseSurvivor
BenefitFormula Period COLA Member EmployerCompensation
Allowance
Foresthill Public Utility DistrictMisc Y70001 3% @ 60 3 YY 15.690%2% 8.00
Forestville County Water DistrictMisc Y70001 2% @ 60 3 YY 16.801%2% 7.00Misc 70002 2% @ 60 3 YY 16.801%2% 7.00Misc Y70003 2.7% @ 55 3 YY 16.801%2% 8.00
Forestville Fire Protection DistrictFire Y74001 2% @ 50 3 YY 19.900%2% 9.00
Fort Bragg Fire Protection AuthorityMisc Y70001 2% @ 60 3 YY 8.702%2% 7.00Misc 70002 2% @ 60 3 YY 8.702%2% 7.00Fire Y74001 2% @ 55 3 YY 15.312%2% 7.00
Fort Bragg, City ofMisc Y70001 2% @ 55 3 YY Y 11.425%2% 7.00Misc 70002 2% @ 55 3 YY Y 11.425%2% 7.00Fire Y74001 1/2 @ 55 3 YY 0.000%2% variesPolice Y75001 2% @ 50 3 YY 28.866%2% 9.00
Fort Ord Reuse AuthorityMisc 70001 2% @ 55 1 3YY 14.057%2% 7.00
Fortuna, City ofMisc Y70001 2% @ 60 3 YY 16.593%2% 7.00Misc 70002 2% @ 60 3 YY 16.593%2% 7.00Misc Y70003 2.7% @ 55 3 YY 16.593%2% 8.00Misc 70004 2.7% @ 55 3 YY 16.593%2% 8.00Police 75001 2% @ 50 1 3YY 27.374%2% 9.00Police 75002 3% @ 50 1 3YY 27.374%2% 9.00
Foundation For California Community Colleges
Misc 70001 3% @ 60 3 8YY 15.084%2% 8.00Fountain Valley, City of
Misc 70001 2% @ 55 1 4YY Y 21.917%2% 7.00Misc Y70002 2% @ 55 1 YY Y 21.917%2% 7.00Misc 70003 2.5% @ 55 1 4YY Y 21.917%2% 8.00Misc Y70004 2.5% @ 55 1 YY Y 21.917%2% 8.00Misc 70101 2% @ 60 3 4YY 9.205%2% 7.00Fire 74001 3% @ 50 1 YY Y 34.840%2% 9.00Police 75001 3% @ 50 1 YY Y 34.840%2% 9.00Police 75101 3% @ 55 3 YY 23.397%2% 9.00
Fowler, City ofMisc Y70001 2% @ 60 1 YY 21.495%2% 7.00Misc 70002 2% @ 60 1 YY 21.495%2% 7.00Misc Y70003 2.7% @ 55 1 YY 21.495%2% 8.00Police Y75001 3% @ 55 1 YY 26.976%2% 9.00Police 75002 2% @ 55 1 YY 26.976%2% 7.00
Fremont, City ofMisc 70001 2% @ 55 1 4 23.461%3% 7.00Misc 70002 2.5% @ 55 1 4 23.461%3% 8.00Fire 74001 3% @ 50 1 3Y 39.450%2% 9.00Fire 74002 3% @ 50 1 3Y 39.450%2% 9.00Police 75001 3% @ 50 1 3Y 39.450%2% 9.00Police 75002 3% @ 50 1 3Y 39.450%2% 9.00
Fresno City Housing AuthorityMisc Y70001 2% @ 60 1 Y 6.189%2% 7.00
Fresno County Housing AuthorityMisc Y70001 2% @ 60 1 Y 7.074%2% 7.00
Fresno County Law LibraryMisc Y70001 2% @ 60 3 YY 5.937%2% 7.00Misc 70002 2% @ 60 3 YY 5.937%2% 7.00
Fresno Westside Mosquito Abatement District
Misc Y70001 2% @ 55 3 YY 4.425%2% 7.00Misc 70002 2% @ 55 3 YY 4.425%2% 7.00
337

5. CalPERS Supplement - Summary of Contracting Agency Benefits - (Continued)
Final Pre- SickPost
Ordinary 1959Compensation SurvivorRetirement Leave
RetirementDisabilityBenefit
FinalContribution Rate
Employer Name Offset Option 2 Credit IncreaseSurvivor
BenefitFormula Period COLA Member EmployerCompensation
Allowance
Fruitridge Fire Protection DistrictMisc 70001 2% @ 60 3 1YY 0.000%2% 7.00Misc Y70002 2% @ 60 3 YY 0.000%2% 7.00Fire 74001 2% @ 50 1 1YY 0.000%2% 9.00
Fullerton, California State University, Associated Students
Misc Y70001 2% @ 55 1 YY Y Y 21.450%2% 5.00Misc Y70101 2% @ 60 1 YY Y Y 12.035%2% 5.00
Fullerton, City ofMisc 70001 2% @ 55 1 4YY Y 12.301%2% 7.00Fire 74001 3% @ 50 1 4Y Y 34.681%2% 9.00Police 75001 3% @ 50 1 4Y Y 34.681%2% 9.00
Fulton El-Camino Recreation and Park District
Misc Y70001 2% @ 55 1 YY 10.781%2% 7.00Misc 70002 2% @ 55 1 YY 10.781%2% 7.00
Galt, City ofMisc Y70001 2% @ 55 1 YY 13.731%2% 7.00Misc 70002 2% @ 55 1 13.731%2% 7.00Police Y75001 3% @ 50 1 YY 37.003%2% 9.00
Garden Grove, City ofMisc 70001 2% @ 55 1 8YY Y 20.152%2% 7.00Misc 70002 2.5% @ 55 1 8YY Y 20.152%2% 8.00Fire 74001 3% @ 50 1 8YY Y 35.800%2% 9.00Police 75001 3% @ 50 1 8YY Y 35.800%2% 9.00
Garden Valley Fire Protection DistrictMisc Y70001 2.7% @ 55 1 YY 10.098%2% 8.00Misc Y70101 2% @ 55 3 YY 10.098%2% 7.00Fire 74001 3% @ 50 1 YY 29.346%2% 9.00
Gardena, City ofMisc 70001 2% @ 55 1 3Y Y 9.262%2% 7.00Fire 74001 3% @ 50 1 3YY Y 44.752%2% 9.00Police 75001 3% @ 50 1 3YY Y 44.752%2% 9.00
Georgetown Divide Public Utility DistrictMisc Y70001 2% @ 55 1 YY 40.649%3% 7.00Misc 70002 2% @ 55 1 YY 40.649%3% 7.00Misc 70003 2% @ 55 1 YY 40.649%3% 7.00Misc 70004 2.7% @ 55 1 YY 40.649%3% 8.00Misc 70101 2.7% @ 55 3 YY 15.064%2% 8.00
Georgetown Fire Protection DistrictMisc 70001 2% @ 55 3 3YY 27.356%2% 7.00Misc 70002 2.7% @ 55 3 3YY 27.356%2% 8.00Fire 74001 3% @ 50 3 3YY 28.457%2% 9.00
Gilroy, City ofMisc 70001 2% @ 55 1 3Y 20.179%2% 7.00Misc Y70002 2% @ 55 1 Y 20.179%2% 7.00Misc 70003 2.5% @ 55 1 3Y 20.179%2% 8.00Fire 74001 3% @ 55 1 4Y 31.748%2% 9.00Fire 74101 2% @ 55 3 4Y 31.748%2% 7.00Police 75001 3% @ 50 1 4Y 31.748%2% 9.00Police 75101 2% @ 50 1 4Y 31.748%2% 9.00
Gilsizer County Drainage DistrictMisc Y70001 2% @ 55 3 YY 4.762%2% 7.00Misc 70002 2% @ 55 3 YY 4.762%2% 7.00
Glen Ellen Fire Protection DistrictMisc 70001 2% @ 55 1 YY 15.724%2% 7.00Misc 70002 3% @ 60 1 YY 15.724%2% 8.00Fire 74001 3% @ 55 1 4YY 23.905%2% 9.00
Glendale College, Associated Students ofMisc Y70001 2% @ 60 3 YY 13.483%2% 7.00
Glendale Community College DistrictPolice 75001 3% @ 50 1 4YY Y 37.240%2% 9.00
338

5. CalPERS Supplement - Summary of Contracting Agency Benefits - (Continued)
Final Pre- SickPost
Ordinary 1959Compensation SurvivorRetirement Leave
RetirementDisabilityBenefit
FinalContribution Rate
Employer Name Offset Option 2 Credit IncreaseSurvivor
BenefitFormula Period COLA Member EmployerCompensation
Allowance
Glendale, City ofMisc 70001 2% @ 55 1 4Y Y 16.183%2% 7.00Misc 70002 2.5% @ 55 1 4YY Y 16.183%2% 8.00Misc 70101 2% @ 55 3 4YY Y 16.183%2% 7.00Fire 74001 3% @ 50 1 4YY Y 31.792%2% 9.00Fire 74101 3% @ 55 1 4YY Y 31.792%2% 9.00Police 75001 3% @ 50 1 4YY Y 31.792%2% 9.00
Glendora, City ofMisc 70001 2% @ 55 1 2Y 15.111%2% 7.00Misc Y70002 2% @ 55 1 Y 15.111%2% 7.00Misc 70003 2.5% @ 55 1 2Y 15.111%2% 8.00Misc Y70004 2.5% @ 55 1 Y 15.111%2% 8.00Fire 74001 1/2 @ 55 3 1YY Y 27.877%2% variesPolice 75001 3% @ 50 1 4YY Y 27.877%2% 9.00Police 75002 3% @ 50 1 4YY Y 27.877%2% 9.00
Glenn County Mosquito and Vector Control District
Misc 70001 2% @ 55 1 YY Y 4.482%2% 7.00Glenn, County of
Misc 70001 2% @ 55 3 1Y 15.931%2% 7.00Misc Y70002 2% @ 55 3 Y 15.931%2% 7.00Misc Y70003 2.5% @ 55 3 Y 15.931%2% 8.00Peace 77001 3% @ 50 3 YY 37.750%2% 9.00
Gold Coast TransitMisc 70001 2% @ 55 3 4 14.967%2% 7.00Misc 70002 2.7% @ 55 3 4 14.967%2% 8.00
Gold Ridge Fire Protection DistrictMisc 70001 3% @ 60 1 4YY 17.099%2% 8.00Fire 74001 3% @ 50 1 YY Y 30.281%2% 9.00Fire 74101 3% @ 55 1 YY Y 25.633%2% 9.00Fire 74401 3% @ 50 1 YY Y 30.281%2% 9.00
Gold Ridge Resource Conservation DistrictMisc Y70001 2% @ 55 3 YY 11.623%2% 7.00
Golden Gate Bridge Highway and Transportation District
Misc 70001 2% @ 55 1 21.264%3% 7.00Misc Y70002 2% @ 55 1 21.264%3% 7.00Misc Y70003 2.5% @ 55 1 21.264%3% 8.00
Golden Hills Community Service DistrictMisc Y70001 2% @ 60 3 YY 19.355%2% 7.00
Golden Sierra Job Training AgencyMisc 70001 2% @ 55 1 YY 33.455%2% 7.00Misc 70002 2.5% @ 55 1 YY 33.455%2% 8.00
Goleta Sanitary DistrictMisc Y70001 2% @ 55 1 YY Y 14.807%2% 7.00Misc 70002 2% @ 55 3 YY 14.807%2% 7.00
Goleta Water DistrictMisc 70001 2% @ 55 1 YY 23.473%2% 7.00Misc 70002 2.7% @ 55 1 YY 23.473%2% 8.00
Goleta West Sanitary DistrictMisc 70001 2% @ 55 1 YY Y 7.317%2% 7.00
Goleta, City ofMisc 70001 2% @ 55 1 4YY 11.084%2% 7.00
Gonzales, City ofMisc Y70001 2% @ 60 3 YY 15.585%2% 7.00Fire Y74001 1/2 @ 55 3 YY 16.118%2% variesFire Y74002 2% @ 55 3 YY 16.118%2% 7.00Police Y75001 1/2 @ 55 3 YY 16.118%2% variesPolice Y75002 2% @ 55 3 YY 16.118%2% 7.00
Granada Sanitary DistrictMisc 70003 2% @ 55 3 YY 25.431%2% 7.00
339

5. CalPERS Supplement - Summary of Contracting Agency Benefits - (Continued)
Final Pre- SickPost
Ordinary 1959Compensation SurvivorRetirement Leave
RetirementDisabilityBenefit
FinalContribution Rate
Employer Name Offset Option 2 Credit IncreaseSurvivor
BenefitFormula Period COLA Member EmployerCompensation
Allowance
Grand Terrace, City ofMisc 70001 2% @ 55 1 4YY 21.991%2% 7.00Misc 70002 2.7% @ 55 1 4YY 21.991%2% 8.00
Grass Valley, City ofMisc Y70001 2% @ 55 1 YY 14.660%2% 7.00Misc 70002 2% @ 55 1 YY 14.660%2% 7.00Misc Y70003 2.5% @ 55 1 YY 14.660%2% 8.00Fire Y74001 3% @ 55 1 YY 21.669%2% 9.00Police Y75001 3% @ 50 1 YY 26.149%2% 9.00
Great Basin Unified Air Pollution Control District
Misc Y70001 2% @ 55 1 YY 20.123%2% 7.00Misc 70002 2% @ 55 1 YY 20.123%2% 7.00Misc Y70003 2.5% @ 55 1 YY 20.123%2% 8.00
Greater Anaheim Special Education Local Plan Area
Misc 70001 2% @ 60 3 3YY 8.776%2% 7.00Greater Los Angeles County Vector Control District
Misc 70001 2% @ 55 1 8YY 12.413%2% 7.00Misc Y70002 2% @ 55 1 YY 12.413%2% 7.00
Greater Vallejo Recreation DistrictMisc 70001 2% @ 55 3 3YY 19.151%2% 7.00
Green Valley County Water DistrictMisc 70001 2% @ 60 3 3YY 23.877%2% 7.00
Greenfield Fire Protection DistrictFire 74001 3% @ 55 3 8YY 22.435%2% 9.00
Greenfield, City ofMisc Y70001 2% @ 55 3 YY 11.413%2% 7.00Police Y75001 2% @ 50 3 YY 26.881%2% 9.00
Gridley Biggs Cemetery DistrictMisc Y70001 2% @ 55 1 YY 21.499%2% 7.00Misc 70002 2% @ 55 1 YY 21.499%2% 7.00
Gridley, City ofMisc 70001 2% @ 55 1 3YY 17.571%2% 7.00Misc Y70002 2% @ 55 1 YY 17.571%2% 7.00Misc 70101 2% @ 55 3 3YY 10.282%2% 7.00Fire 74001 1/2 @ 55 3 3YY 31.268%2% variesPolice 75001 3% @ 50 3 3YY 31.268%2% 9.00
Grossmont Healthcare DistrictMisc 70001 2% @ 60 1 YY 17.787%2% 7.00Misc 70002 3% @ 60 1 3YY 17.787%2% 8.00Misc 70003 3% @ 60 1 YY 17.787%2% 8.00
Grossmont Schools Federal Credit UnionMisc 70001 2% @ 60 1 YY Y Y 9.974%3% 7.00
Grossmont-Cuyamaca Community College District Auxiliary Organization
Misc 70001 2% @ 55 3 8YY 10.139%2% 7.00Misc 70002 2% @ 55 3 YY 10.139%2% 7.00
Groveland Community Services DistrictMisc Y70001 2% @ 55 1 YY 12.899%2% 7.00Misc 70002 2% @ 55 1 YY 12.899%2% 7.00Misc Y70003 2.7% @ 55 1 YY 12.899%2% 8.00Fire Y74001 2% @ 50 1 YY 20.742%2% 9.00
Grover Beach, City ofMisc Y70001 2% @ 55 1 YY 17.248%2% 7.00Misc 70002 2% @ 55 1 YY 17.248%2% 7.00Misc Y70003 2.5% @ 55 1 YY 17.248%2% 8.00Fire Y74001 1/2 @ 55 1 YY 0.000%2% variesFire Y74002 2% @ 55 1 YY 0.000%2% 7.00Police Y75001 3% @ 55 1 YY 26.670%2% 9.00
340

5. CalPERS Supplement - Summary of Contracting Agency Benefits - (Continued)
Final Pre- SickPost
Ordinary 1959Compensation SurvivorRetirement Leave
RetirementDisabilityBenefit
FinalContribution Rate
Employer Name Offset Option 2 Credit IncreaseSurvivor
BenefitFormula Period COLA Member EmployerCompensation
Allowance
Guadalupe, City ofMisc Y70001 2% @ 55 1 YY 12.207%2% 7.00Misc 70002 2% @ 60 3 YY 12.207%2% 7.00Fire Y74001 2% @ 55 3 YY 13.276%2% 7.00Police Y75001 2% @ 55 3 YY 13.276%2% 7.00
Gualala Community Services DistrictMisc 70001 2% @ 60 3 3YY 10.792%2% 7.00
Gustine, City ofMisc Y70001 2% @ 55 3 YY 10.935%2% 7.00Misc 70002 2% @ 55 3 YY 10.935%2% 7.00Misc Y70003 2.5% @ 55 3 YY 10.935%2% 8.00Fire Y74001 3% @ 55 3 YY 31.877%2% 9.00Police Y75001 3% @ 55 3 YY 31.877%2% 9.00
Hacienda La Puente Unified School DistrictPolice 75001 3% @ 50 1 4YY Y 37.286%2% 9.00
Half Moon Bay, City ofMisc 70001 2% @ 55 1 3YY Y 18.987%2% 7.00Misc Y70002 2% @ 55 1 YY Y 18.987%2% 7.00Police 75001 3% @ 50 1 4YY Y 0.000%2% 9.00Police 75002 3% @ 50 1 4YY Y 0.000%2% 9.00
Hamilton Branch Fire Protection DistrictFire 74001 3% @ 55 3 4YY 0.000%2% 9.00
Hanford, City ofMisc 70001 2% @ 55 1 3Y Y 28.226%3% 7.00Misc 70002 3% @ 60 1 3YY Y 28.226%3% 8.00Fire 74001 3% @ 55 1 8YY Y 30.882%2% 9.00Fire 74002 3% @ 55 1 8YY Y 30.882%2% 9.00Police 75001 3% @ 55 1 4YY Y 31.254%2% 9.00Police 75002 3% @ 55 1 4YY Y 31.254%2% 9.00
Happy Camp Sanitary DistrictMisc Y70001 2% @ 60 3 YY 0.000%2% 7.00Misc 70002 2% @ 60 3 YY 0.000%2% 7.00
Happy Homestead Cemetery DistrictMisc Y70001 2% @ 55 1 YY 11.916%2% 7.00Misc 70002 2% @ 55 1 YY 11.916%2% 7.00
Happy Valley Fire Protection DistrictFire Y74001 2% @ 50 3 YY 19.303%2% 9.00
Hawaiian Gardens, City ofMisc Y70001 2% @ 55 1 YY Y 22.785%2% 7.00Misc 70002 2% @ 55 3 YY Y 22.785%2% 7.00Misc Y70003 2.7% @ 55 1 YY Y 22.785%2% 8.00Police Y75001 2% @ 50 3 YY Y 0.000%2% 9.00
Hawthorne, City ofMisc 70001 2% @ 55 1 1Y 17.375%2% 7.00Misc 70002 3% @ 60 1 1Y 17.375%2% 8.00Misc 70401 2% @ 55 1 3Y 17.375%2% 7.00Misc 70402 3% @ 60 1 3Y 17.375%2% 8.00Fire 74001 2% @ 50 1 1YY Y 27.877%2% 9.00Police 75001 3% @ 50 1 1YY Y 27.877%2% 9.00
Hayward Area Recreation and Park DistrictMisc Y70001 2% @ 55 1 Y 17.455%2% 7.00Misc 70002 2% @ 55 1 Y 17.455%2% 7.00Misc Y70003 2.5% @ 55 1 Y 17.455%2% 8.00Misc 70004 2.5% @ 55 1 Y 17.455%2% 8.00
Hayward, California State University, Auxiliary Foundation, Inc.
Misc Y70001 2% @ 55 1 YY Y 14.756%2% 5.00
341

5. CalPERS Supplement - Summary of Contracting Agency Benefits - (Continued)
Final Pre- SickPost
Ordinary 1959Compensation SurvivorRetirement Leave
RetirementDisabilityBenefit
FinalContribution Rate
Employer Name Offset Option 2 Credit IncreaseSurvivor
BenefitFormula Period COLA Member EmployerCompensation
Allowance
Hayward, City ofMisc 70001 2% @ 55 1 4 19.658%2% 7.00Misc Y70002 2% @ 55 1 19.658%2% 7.00Misc 70003 2.5% @ 55 1 4 19.658%2% 8.00Misc Y70004 2.5% @ 55 1 19.658%2% 8.00Fire 74001 3% @ 50 1 3Y Y 33.437%2% 9.00Police 75001 3% @ 50 1 3Y 35.186%2% 9.00
Healdsburg, City ofMisc 70001 2% @ 55 1 4YY Y 15.577%2% 7.00Misc 70002 2.5% @ 55 1 4YY Y 15.577%2% 8.00Fire 74001 3% @ 50 1 4YY 26.149%2% 9.00Police 75001 3% @ 50 1 4YY 26.149%2% 9.00
Health Plan of San JoaquinMisc 70001 2% @ 60 3 4YY 10.877%2% 7.00
Heartland Communications Facility Authority
Misc 70001 2% @ 55 1 4YY Y 16.155%2% 7.00Misc 70002 2.7% @ 55 1 4YY Y 16.155%2% 8.00
Heber Public Utility DistrictMisc 70001 2% @ 60 3 YY 11.214%2% 7.00Misc 70002 2.5% @ 55 3 YY 11.214%2% 8.00
Helendale Community Services DistrictMisc 70001 2.7% @ 55 3 4YY 15.748%2% 8.00
Helix Water DistrictMisc Y70001 2% @ 55 1 Y Y 17.636%2% 7.00Misc 70002 2% @ 55 1 Y Y 17.636%2% 7.00Misc Y70003 2.5% @ 55 1 Y Y 17.636%2% 8.00Misc 70004 2.5% @ 55 1 Y Y 17.636%2% 8.00
Hemet, City ofMisc 70001 2% @ 55 1 4Y 22.707%2% 7.00Misc Y70002 2% @ 55 1 Y 22.707%2% 7.00Misc 70003 2.7% @ 55 1 4Y 22.707%2% 8.00Misc Y70004 2.7% @ 55 1 Y 22.707%2% 8.00Fire 74001 3% @ 50 1 3Y 42.474%2% 9.00Police 75001 3% @ 50 1 1Y 42.474%2% 9.00
Henry Miller Reclamation District No. 2131Misc 70001 2% @ 55 1 3YY 12.388%2% 7.00
Herald Fire Protection DistrictMisc 70001 2.7% @ 55 3 8YY 15.064%2% 8.00Fire 74001 3% @ 55 3 3YY 27.873%2% 9.00
Hercules, City ofMisc 70001 2% @ 55 3 3YY 13.208%2% 7.00Police 75001 3% @ 50 1 3YY 38.451%2% 9.00
Heritage Ranch Community Services District
Misc 70001 2% @ 55 1 4YY 14.660%2% 7.00Misc 70002 2.5% @ 55 1 4YY 14.660%2% 8.00
Herlong Public Utility DistrictMisc 70001 2.5% @ 55 3 4YY 20.434%2% 8.00
Hermosa Beach, City ofMisc 70001 2% @ 55 1 3YY 18.203%2% 7.00Misc 70102 2% @ 60 1 3YY 8.486%2% 7.00Fire 74001 3% @ 55 1 3YY Y 44.047%2% 9.00Police 75001 3% @ 50 1 3YY Y 61.738%2% 9.00Police 75102 2% @ 50 1 3YY Y 22.145%2% 9.00
Hesperia County Water DistrictMisc 70001 2% @ 55 1 4YY 13.624%2% 7.00Misc 70002 2.7% @ 55 1 4YY 13.624%2% 8.00
Hesperia Fire Protection DistrictMisc 70001 2% @ 55 3 4YY 0.000%2% 7.00Fire 74001 2% @ 50 1 4YY 0.000%2% 9.00
342

5. CalPERS Supplement - Summary of Contracting Agency Benefits - (Continued)
Final Pre- SickPost
Ordinary 1959Compensation SurvivorRetirement Leave
RetirementDisabilityBenefit
FinalContribution Rate
Employer Name Offset Option 2 Credit IncreaseSurvivor
BenefitFormula Period COLA Member EmployerCompensation
Allowance
Hesperia, City ofMisc 70001 2% @ 55 1 4YY 19.080%2% 7.00Misc 70002 2.7% @ 55 1 4YY 19.080%2% 8.00
Hidden Hills, City ofMisc 70001 2% @ 60 3 YY 8.049%2% 7.00
Hidden Valley Lake Community Services District
Misc 70001 2% @ 55 1 4YY 20.691%2% 7.00Misc 70002 2.5% @ 55 1 4YY 20.691%2% 8.00
Hi-Desert Water DistrictMisc Y70001 2% @ 55 1 YY Y 21.461%2% 7.00Misc 70002 2% @ 55 1 YY Y 21.461%2% 7.00Misc 70003 2% @ 55 1 YY Y 21.461%2% 7.00Misc 70004 2.5% @ 55 1 YY Y 21.461%2% 8.00
Higgins Area Fire Protection DistrictMisc 70001 2% @ 60 1 3YY 25.453%2% 7.00Misc 70002 2.5% @ 55 1 3YY 25.453%2% 8.00Fire 74001 2% @ 50 3 3YY 19.700%2% 9.00
Highland, City ofMisc 70001 2% @ 55 1 3YY Y 15.398%2% 7.00
Hillsborough, Town ofMisc 70001 2% @ 55 1 1YY Y 16.773%2% 7.00Misc Y70002 2% @ 55 1 YY Y 16.773%2% 7.00Misc 70003 2.7% @ 55 1 1YY Y 16.773%2% 8.00Misc Y70004 2.7% @ 55 1 YY Y 16.773%2% 8.00Misc Y70005 3% @ 60 1 YY Y 16.773%2% 8.00Police 75001 3% @ 50 1 4YY Y 27.877%2% 9.00
Hilton Creek Community Services DistrictMisc 70001 2% @ 60 3 3YY 10.387%2% 7.00
Hollister, City ofMisc 70001 2% @ 55 1 4YY 22.974%2% 7.00Misc Y70002 2% @ 55 1 YY 22.974%2% 7.00Misc 70003 2.5% @ 55 1 4YY 22.974%2% 8.00Misc Y70004 2.5% @ 55 1 YY 22.974%2% 8.00Fire 74001 3% @ 50 3 4YY 35.907%2% 9.00Police 75001 3% @ 50 1 4YY 53.394%2% 9.00
Hopland Public Utility DistrictMisc 70001 2% @ 55 3 4YY 0.000%2% 7.00
Housing Authority of the City of CalexicoMisc 70001 2% @ 60 3 YY 19.791%2% 7.00
Housing Authority of the City of EurekaMisc 70001 2.7% @ 55 1 YY 15.616%2% 8.00
Housing Authority of the City of Los AngelesMisc Y70001 2% @ 55 1 17.331%2% 7.00Misc Y70002 2.7% @ 55 1 17.331%2% 8.00Police Y75001 2% @ 50 1 YY 243.859%2% 9.00Police Y75002 2% @ 55 1 YY 243.859%2% 7.00Police Y75101 2% @ 50 1 YY 243.859%2% 9.00
Housing Authority of the City of San Buenaventura
Misc 70002 2.7% @ 55 1 4YY 16.867%3% 8.00Misc Y70003 2% @ 60 3 YY 16.867%2% 7.00Misc 70102 2% @ 60 3 4YY 8.049%2% 7.00
Housing Authority of the City of South San Francisco
Misc 70001 2% @ 60 3 YY 16.958%2% 7.00Housing Authority of the County of Butte
Misc Y70001 2% @ 55 1 YY 14.627%2% 7.00Housing Authority of the County of Santa Clara
Misc 70001 2% @ 55 3 YY 9.231%2% 7.00
343
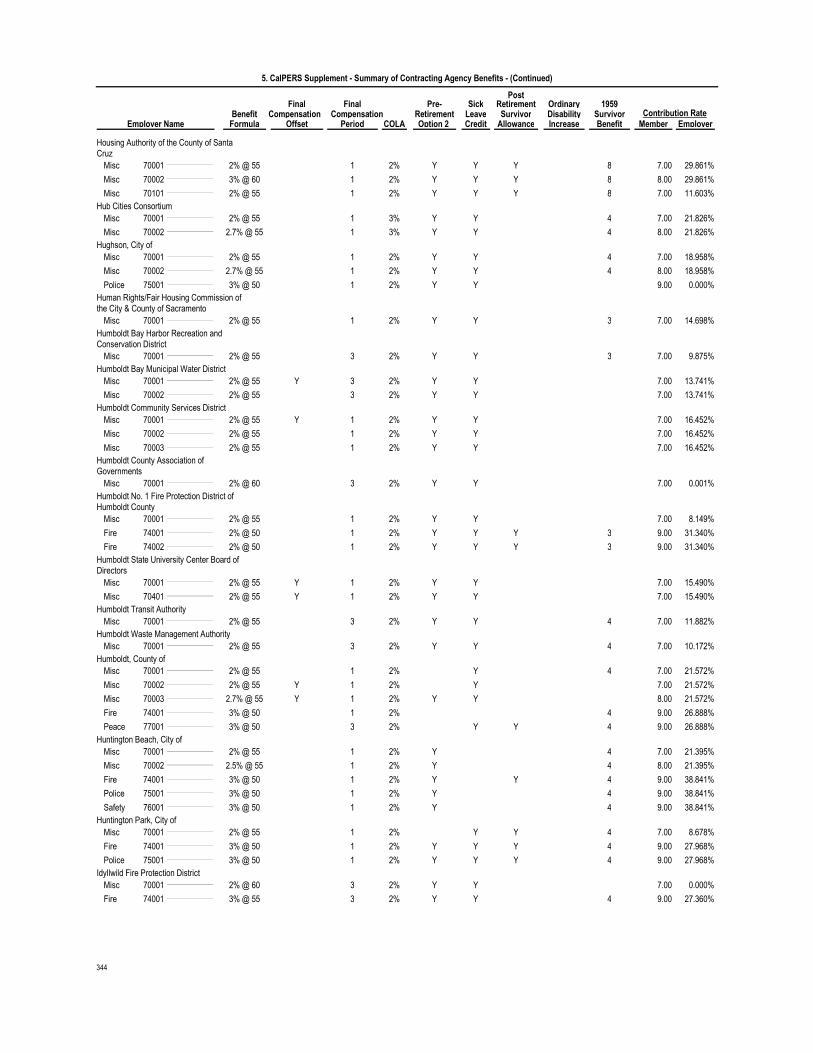
5. CalPERS Supplement - Summary of Contracting Agency Benefits - (Continued)
Final Pre- SickPost
Ordinary 1959Compensation SurvivorRetirement Leave
RetirementDisabilityBenefit
FinalContribution Rate
Employer Name Offset Option 2 Credit IncreaseSurvivor
BenefitFormula Period COLA Member EmployerCompensation
Allowance
Housing Authority of the County of Santa Cruz
Misc 70001 2% @ 55 1 8YY Y 29.861%2% 7.00Misc 70002 3% @ 60 1 8YY Y 29.861%2% 8.00Misc 70101 2% @ 55 1 8YY Y 11.603%2% 7.00
Hub Cities ConsortiumMisc 70001 2% @ 55 1 4YY 21.826%3% 7.00Misc 70002 2.7% @ 55 1 4YY 21.826%3% 8.00
Hughson, City ofMisc 70001 2% @ 55 1 4YY 18.958%2% 7.00Misc 70002 2.7% @ 55 1 4YY 18.958%2% 8.00Police 75001 3% @ 50 1 YY 0.000%2% 9.00
Human Rights/Fair Housing Commission of the City & County of Sacramento
Misc 70001 2% @ 55 1 3YY 14.698%2% 7.00Humboldt Bay Harbor Recreation and Conservation District
Misc 70001 2% @ 55 3 3YY 9.875%2% 7.00Humboldt Bay Municipal Water District
Misc Y70001 2% @ 55 3 YY 13.741%2% 7.00Misc 70002 2% @ 55 3 YY 13.741%2% 7.00
Humboldt Community Services DistrictMisc Y70001 2% @ 55 1 YY 16.452%2% 7.00Misc 70002 2% @ 55 1 YY 16.452%2% 7.00Misc 70003 2% @ 55 1 YY 16.452%2% 7.00
Humboldt County Association of Governments
Misc 70001 2% @ 60 3 YY 0.001%2% 7.00Humboldt No. 1 Fire Protection District of Humboldt County
Misc 70001 2% @ 55 1 YY 8.149%2% 7.00Fire 74001 2% @ 50 1 3YY Y 31.340%2% 9.00Fire 74002 2% @ 50 1 3YY Y 31.340%2% 9.00
Humboldt State University Center Board of Directors
Misc Y70001 2% @ 55 1 YY 15.490%2% 7.00Misc Y70401 2% @ 55 1 YY 15.490%2% 7.00
Humboldt Transit AuthorityMisc 70001 2% @ 55 3 4YY 11.882%2% 7.00
Humboldt Waste Management AuthorityMisc 70001 2% @ 55 3 4YY 10.172%2% 7.00
Humboldt, County ofMisc 70001 2% @ 55 1 4Y 21.572%2% 7.00Misc Y70002 2% @ 55 1 Y 21.572%2% 7.00Misc Y70003 2.7% @ 55 1 YY 21.572%2% 8.00Fire 74001 3% @ 50 1 4 26.888%2% 9.00Peace 77001 3% @ 50 3 4Y Y 26.888%2% 9.00
Huntington Beach, City ofMisc 70001 2% @ 55 1 4Y 21.395%2% 7.00Misc 70002 2.5% @ 55 1 4Y 21.395%2% 8.00Fire 74001 3% @ 50 1 4Y Y 38.841%2% 9.00Police 75001 3% @ 50 1 4Y 38.841%2% 9.00Safety 76001 3% @ 50 1 4Y 38.841%2% 9.00
Huntington Park, City ofMisc 70001 2% @ 55 1 4Y Y 8.678%2% 7.00Fire 74001 3% @ 50 1 4YY Y 27.968%2% 9.00Police 75001 3% @ 50 1 4YY Y 27.968%2% 9.00
Idyllwild Fire Protection DistrictMisc 70001 2% @ 60 3 YY 0.000%2% 7.00Fire 74001 3% @ 55 3 4YY 27.360%2% 9.00
344
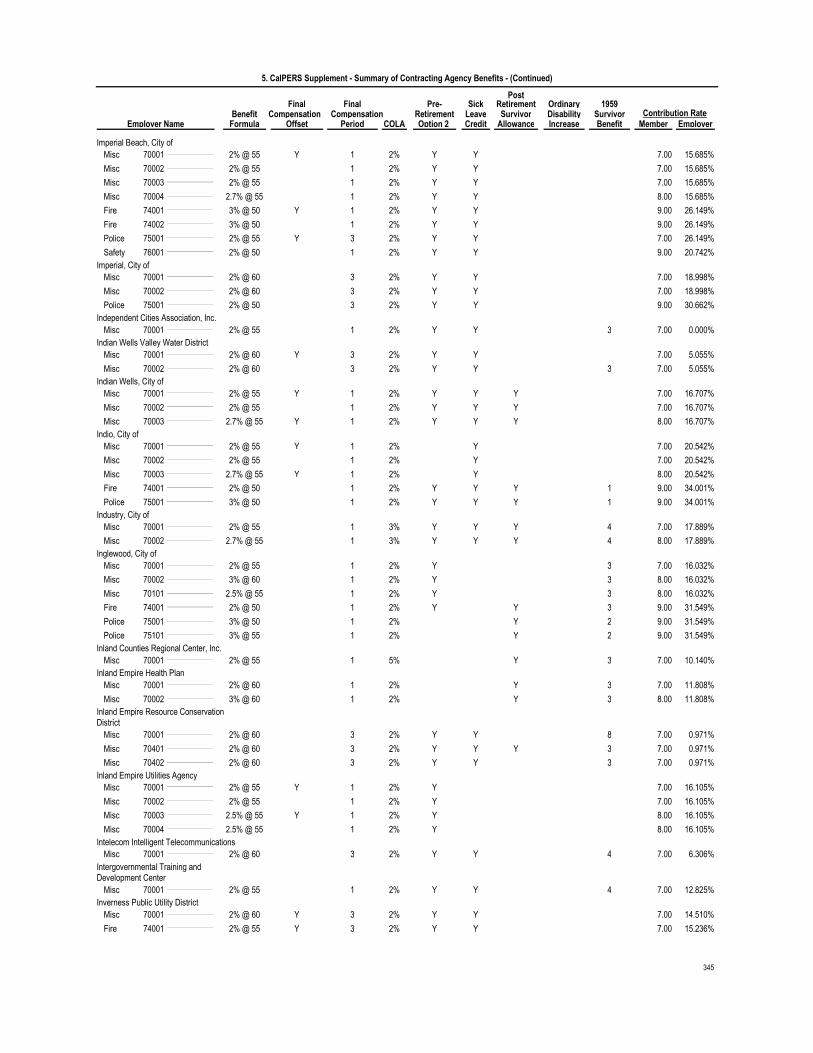
5. CalPERS Supplement - Summary of Contracting Agency Benefits - (Continued)
Final Pre- SickPost
Ordinary 1959Compensation SurvivorRetirement Leave
RetirementDisabilityBenefit
FinalContribution Rate
Employer Name Offset Option 2 Credit IncreaseSurvivor
BenefitFormula Period COLA Member EmployerCompensation
Allowance
Imperial Beach, City ofMisc Y70001 2% @ 55 1 YY 15.685%2% 7.00Misc 70002 2% @ 55 1 YY 15.685%2% 7.00Misc 70003 2% @ 55 1 YY 15.685%2% 7.00Misc 70004 2.7% @ 55 1 YY 15.685%2% 8.00Fire Y74001 3% @ 50 1 YY 26.149%2% 9.00Fire 74002 3% @ 50 1 YY 26.149%2% 9.00Police Y75001 2% @ 55 3 YY 26.149%2% 7.00Safety 76001 2% @ 50 1 YY 20.742%2% 9.00
Imperial, City ofMisc 70001 2% @ 60 3 YY 18.998%2% 7.00Misc 70002 2% @ 60 3 YY 18.998%2% 7.00Police 75001 2% @ 50 3 YY 30.662%2% 9.00
Independent Cities Association, Inc.Misc 70001 2% @ 55 1 3YY 0.000%2% 7.00
Indian Wells Valley Water DistrictMisc Y70001 2% @ 60 3 YY 5.055%2% 7.00Misc 70002 2% @ 60 3 3YY 5.055%2% 7.00
Indian Wells, City ofMisc Y70001 2% @ 55 1 YY Y 16.707%2% 7.00Misc 70002 2% @ 55 1 YY Y 16.707%2% 7.00Misc Y70003 2.7% @ 55 1 YY Y 16.707%2% 8.00
Indio, City ofMisc Y70001 2% @ 55 1 Y 20.542%2% 7.00Misc 70002 2% @ 55 1 Y 20.542%2% 7.00Misc Y70003 2.7% @ 55 1 Y 20.542%2% 8.00Fire 74001 2% @ 50 1 1YY Y 34.001%2% 9.00Police 75001 3% @ 50 1 1YY Y 34.001%2% 9.00
Industry, City ofMisc 70001 2% @ 55 1 4YY Y 17.889%3% 7.00Misc 70002 2.7% @ 55 1 4YY Y 17.889%3% 8.00
Inglewood, City ofMisc 70001 2% @ 55 1 3Y 16.032%2% 7.00Misc 70002 3% @ 60 1 3Y 16.032%2% 8.00Misc 70101 2.5% @ 55 1 3Y 16.032%2% 8.00Fire 74001 2% @ 50 1 3Y Y 31.549%2% 9.00Police 75001 3% @ 50 1 2Y 31.549%2% 9.00Police 75101 3% @ 55 1 2Y 31.549%2% 9.00
Inland Counties Regional Center, Inc.Misc 70001 2% @ 55 1 3Y 10.140%5% 7.00
Inland Empire Health PlanMisc 70001 2% @ 60 1 3Y 11.808%2% 7.00Misc 70002 3% @ 60 1 3Y 11.808%2% 8.00
Inland Empire Resource Conservation District
Misc 70001 2% @ 60 3 8YY 0.971%2% 7.00Misc 70401 2% @ 60 3 3YY Y 0.971%2% 7.00Misc 70402 2% @ 60 3 3YY 0.971%2% 7.00
Inland Empire Utilities AgencyMisc Y70001 2% @ 55 1 Y 16.105%2% 7.00Misc 70002 2% @ 55 1 Y 16.105%2% 7.00Misc Y70003 2.5% @ 55 1 Y 16.105%2% 8.00Misc 70004 2.5% @ 55 1 Y 16.105%2% 8.00
Intelecom Intelligent TelecommunicationsMisc 70001 2% @ 60 3 4YY 6.306%2% 7.00
Intergovernmental Training and Development Center
Misc 70001 2% @ 55 1 4YY 12.825%2% 7.00Inverness Public Utility District
Misc Y70001 2% @ 60 3 YY 14.510%2% 7.00Fire Y74001 2% @ 55 3 YY 15.236%2% 7.00
345

5. CalPERS Supplement - Summary of Contracting Agency Benefits - (Continued)
Final Pre- SickPost
Ordinary 1959Compensation SurvivorRetirement Leave
RetirementDisabilityBenefit
FinalContribution Rate
Employer Name Offset Option 2 Credit IncreaseSurvivor
BenefitFormula Period COLA Member EmployerCompensation
Allowance
Inyo, County ofMisc 70001 2% @ 55 1 1Y Y Y 14.874%2% 7.00Misc Y70002 2% @ 55 1 Y Y Y 14.874%2% 7.00Peace 77001 3% @ 50 1 3YY 36.294%2% 9.00
Ione, City ofMisc Y70001 2% @ 55 3 YY 16.392%2% 7.00Misc 70002 2% @ 55 3 YY 16.392%2% 7.00Misc Y70003 2.5% @ 55 3 YY 16.392%2% 8.00Fire Y74001 2% @ 55 3 YY 15.312%2% 7.00Police Y75001 3% @ 50 3 YY 50.949%2% 9.00
Ironhouse Sanitary DistrictMisc 70001 2.7% @ 55 1 4YY 21.898%3% 8.00
Irvine Ranch Water DistrictMisc 70001 2% @ 55 1 4 16.795%2% 7.00Misc Y70002 2% @ 55 1 16.795%2% 7.00Misc 70003 2.5% @ 55 1 4Y 16.795%2% 8.00Misc 70401 2% @ 55 1 16.795%2% 7.00Misc 70402 2% @ 55 1 YY 16.795%2% 7.00Misc 70403 2.5% @ 55 1 Y 16.795%2% 8.00Misc 70404 2.5% @ 55 1 YY 16.795%2% 8.00
Irvine, City ofMisc 70001 2.7% @ 55 1 4Y 24.138%2% 8.00Police 75001 3% @ 50 1 4Y Y 34.309%2% 9.00
Irwindale, City ofMisc 70001 2% @ 55 1 4YY Y Y 10.630%2% 7.00Misc Y70002 2% @ 55 1 YY Y Y 10.630%2% 7.00Misc 70102 2% @ 55 3 4YY Y Y 11.104%2% 7.00Fire 74001 2% @ 55 1 4YY Y Y 27.877%2% 7.00Police 75001 3% @ 50 1 4YY Y Y 27.877%2% 9.00Police 75101 3% @ 50 3 4YY Y Y 26.896%2% 9.00
Isla Vista Recreation and Park DistrictMisc 70001 2% @ 55 1 3YY 12.326%2% 7.00
Jackson Valley Irrigation DistrictMisc Y70001 2% @ 60 3 YY 8.049%2% 7.00
Jackson, City ofMisc Y70001 2% @ 55 1 YY 26.898%2% 7.00Misc Y70002 2.5% @ 55 1 YY 26.898%2% 8.00Fire Y74001 2% @ 50 3 YY 23.237%2% 9.00Police Y75001 3% @ 50 3 YY 51.961%2% 9.00
Jamestown Sanitary DistrictMisc Y70001 2% @ 55 1 YY 15.685%2% 7.00Misc 70002 2% @ 55 1 YY 15.685%2% 7.00Misc Y70003 2.7% @ 55 1 YY 15.685%2% 8.00
Janesville Fire Protection DistrictFire 74001 2% @ 55 3 3YY 0.000%2% 7.00
Joshua Basin Water DistrictMisc Y70001 2% @ 55 1 YY Y 11.603%2% 7.00
June Lake Public Utility DistrictMisc 70001 2% @ 55 3 3YY 33.400%2% 7.00Misc 70002 2.7% @ 55 3 3YY 33.400%2% 8.00
Jurupa Area Recreation and Park DistrictMisc 70001 2% @ 55 1 8YY Y 18.501%2% 7.00
Jurupa Community Services DistrictMisc Y70001 2% @ 55 3 YY 17.669%2% 7.00Misc 70002 2% @ 55 3 YY 17.669%2% 7.00Misc Y70003 2.7% @ 55 3 YY 17.669%2% 8.00
Kaweah Delta Water Conservation DistrictMisc 70001 2% @ 60 3 4YY 1.572%2% 7.00
Kelseyville Fire Protection DistrictMisc 70001 2% @ 60 3 YY 4.578%2% 7.00Fire 74002 2% @ 50 3 YY Y 28.874%2% 9.00
346

5. CalPERS Supplement - Summary of Contracting Agency Benefits - (Continued)
Final Pre- SickPost
Ordinary 1959Compensation SurvivorRetirement Leave
RetirementDisabilityBenefit
FinalContribution Rate
Employer Name Offset Option 2 Credit IncreaseSurvivor
BenefitFormula Period COLA Member EmployerCompensation
Allowance
Kensington Community Service DistrictPolice 75001 3% @ 50 1 4YY 36.477%2% 9.00
Kentfield Fire DistrictMisc 70001 3% @ 60 1 4YY 31.639%2% 8.00Fire 74001 3% @ 55 1 4YY Y 35.785%2% 9.00
Kenwood Fire Protection DistrictFire 74001 2% @ 50 1 YY 20.742%2% 9.00
Kerman, City ofMisc Y70001 2% @ 60 3 YY 8.049%2% 7.00Police Y75001 2% @ 55 3 YY 15.312%2% 7.00
Kern County Cemetery District No. 1Misc Y70001 2% @ 55 3 YY 15.084%2% 7.00Misc 70002 2% @ 55 3 YY 15.084%2% 7.00Misc Y70003 3% @ 60 3 YY 15.084%2% 8.00
Kern County Council of GovernmentsMisc Y70001 2% @ 55 1 YY 16.599%2% 7.00Misc 70002 2% @ 55 1 YY 16.599%2% 7.00Misc Y70003 2.5% @ 55 1 YY 16.599%2% 8.00
Kern County Housing AuthorityMisc Y70001 2% @ 55 1 Y 8.808%2% 7.00
Kern County Law LibraryMisc Y70001 2% @ 60 3 YY 0.000%2% 7.00Misc 70002 2% @ 60 3 YY 0.000%2% 7.00
Kern County Local Agency Formation Commission
Misc Y70001 2% @ 55 1 YY Y 12.166%2% 7.00Misc 70002 2% @ 55 1 YY Y 12.166%2% 7.00Misc Y70003 3% @ 60 1 YY Y 12.166%2% 8.00
Kern Health SystemsMisc 70001 2% @ 60 3 3YY 8.049%2% 7.00
Kern River Valley Cemetery DistrictMisc 70001 2% @ 60 3 YY 18.542%2% 7.00
Kern-Tulare Water DistrictMisc 70001 2% @ 60 3 YY 6.926%2% 7.00Misc 70002 2% @ 60 3 4YY 6.926%2% 7.00Misc 70003 2% @ 60 3 YY 6.926%2% 7.00Misc 70401 2% @ 60 3 YY 6.926%2% 7.00
Kettleman City Community Services DistrictMisc 70001 2% @ 60 3 YY 8.049%2% 7.00
King City, City ofMisc Y70001 2% @ 55 3 YY 19.071%2% 7.00Misc 70002 2% @ 55 3 YY 19.071%2% 7.00Police Y75001 2% @ 50 3 YY 25.515%2% 9.00
Kings County Area Public Transit AgencyMisc 70001 2% @ 55 3 4YY 10.282%2% 7.00
Kings County Association Of GovernmentsMisc 70001 2% @ 55 1 4YY 10.781%2% 7.00
Kings County Waste Management AuthorityMisc 70001 2% @ 60 1 YY 10.768%2% 7.00
Kings IHSS Public AuthorityMisc 70001 2% @ 55 1 4YY 12.314%2% 7.00
Kings Mosquito Abatement DistrictMisc 70001 2% @ 55 3 3YY 4.944%2% 7.00Misc Y70002 2% @ 55 3 YY 4.944%2% 7.00
Kings, County ofMisc 70001 2% @ 55 1 11.146%2% 7.00Misc Y70002 2% @ 55 1 11.146%2% 7.00Misc 70003 2% @ 55 1 Y 11.146%2% 7.00Fire 74001 3% @ 55 1 4Y 17.451%2% 9.00Peace 77001 3% @ 55 1 4Y 17.451%2% 9.00Peace 77002 3% @ 55 1 4Y 17.451%2% 9.00Peace 77102 2% @ 55 1 4Y 17.451%2% 7.00
347

5. CalPERS Supplement - Summary of Contracting Agency Benefits - (Continued)
Final Pre- SickPost
Ordinary 1959Compensation SurvivorRetirement Leave
RetirementDisabilityBenefit
FinalContribution Rate
Employer Name Offset Option 2 Credit IncreaseSurvivor
BenefitFormula Period COLA Member EmployerCompensation
Allowance
Kingsburg, City ofMisc Y70001 2% @ 55 3 YY 13.124%2% 7.00Misc 70002 2% @ 60 3 YY 13.124%2% 7.00Fire Y74001 2% @ 55 3 YY 17.693%2% 7.00Police Y75001 2% @ 55 3 YY 17.693%2% 7.00
Kinneloa Irrigation DistrictMisc Y70001 2% @ 60 3 YY 6.038%2% 7.00Misc 70002 2% @ 60 3 YY 6.038%2% 7.00
Kirkwood Meadows Public Utilities DistrictMisc Y70001 2% @ 60 1 YY 20.077%2% 7.00Misc Y70002 2.5% @ 55 1 YY 20.077%2% 8.00
Konocti County Water DistrictMisc 70001 2% @ 55 3 YY 10.696%2% 7.00
La Branza Water DistrictMisc 70001 2% @ 60 3 YY 0.000%2% 7.00
La Canada Flintridge, City ofMisc 70001 2% @ 55 1 4YY 10.781%2% 7.00
La Habra Heights County Water DistrictMisc 70001 2% @ 60 3 YY 8.049%2% 7.00
La Habra Heights, City ofMisc 70001 2% @ 60 3 YY 12.256%2% 7.00Fire 74001 2% @ 55 3 YY 9.054%2% 7.00
La Habra, City ofMisc 70001 2% @ 55 1 4YY Y 12.571%2% 7.00Misc Y70002 2% @ 55 1 YY Y 12.571%2% 7.00Fire 74001 3% @ 50 1 4YY Y 34.808%2% 9.00Police 75001 3% @ 50 1 4YY Y 34.808%2% 9.00
La Mesa, City ofMisc 70001 2% @ 55 1 24.141%2% 7.00Misc 70002 3% @ 60 1 24.141%2% 8.00Misc 70101 2.5% @ 55 1 24.141%2% 8.00Fire 74001 3% @ 50 1 3Y Y 32.722%2% 9.00Police 75001 3% @ 50 1 3Y Y 32.722%2% 9.00Police 75101 3% @ 55 1 3Y Y 32.722%2% 9.00
La Mirada, City ofMisc Y70001 2% @ 55 1 YY 10.781%2% 7.00Misc 70002 2% @ 55 1 3YY 10.781%2% 7.00
La Palma, City ofMisc 70001 2% @ 55 1 4YY 15.685%2% 7.00Misc 70002 2.7% @ 55 1 4YY 15.685%2% 8.00Police 75001 3% @ 50 1 4YY Y 27.877%2% 9.00Police 75002 3% @ 50 1 4YY Y 27.877%2% 9.00
La Puente Valley County Water DistrictMisc 70001 2% @ 60 3 YY 11.455%2% 7.00
La Puente, City ofMisc 70001 2% @ 55 1 2YY Y 16.677%5% 7.00Misc 70002 2.5% @ 55 1 2YY Y 16.677%5% 8.00
La Quinta, City ofMisc 70001 2% @ 55 1 3YY 14.660%2% 7.00Misc 70002 2.5% @ 55 1 3YY 14.660%2% 8.00
La Verne, City ofMisc 70001 2% @ 55 1 4YY 16.587%2% 7.00Misc Y70002 2% @ 55 1 YY 16.587%2% 7.00Misc 70003 2.5% @ 55 1 4YY 16.587%2% 8.00Misc Y70004 2.5% @ 55 1 YY 16.587%2% 8.00Fire 74001 3% @ 50 1 4YY 26.207%2% 9.00Police 75001 3% @ 50 1 4YY 26.207%2% 9.00
Laguna Beach County Water DistrictMisc 70001 2% @ 55 1 3YY 8.903%2% 7.00
348

5. CalPERS Supplement - Summary of Contracting Agency Benefits - (Continued)
Final Pre- SickPost
Ordinary 1959Compensation SurvivorRetirement Leave
RetirementDisabilityBenefit
FinalContribution Rate
Employer Name Offset Option 2 Credit IncreaseSurvivor
BenefitFormula Period COLA Member EmployerCompensation
Allowance
Laguna Beach, City ofMisc 70001 2% @ 55 1 4Y 17.255%2% 7.00Misc 70002 2.5% @ 55 1 4Y 17.255%2% 8.00Fire 74001 3% @ 50 1 4YY 26.149%2% 9.00Fire 74002 3% @ 50 1 4YY 26.149%2% 9.00Police 75001 3% @ 50 1 4YY 26.149%2% 9.00Police 75002 3% @ 50 1 4YY 26.149%2% 9.00Safety 76001 3% @ 55 1 4YY 21.669%2% 9.00Safety 76002 3% @ 55 1 4YY 21.669%2% 9.00
Laguna Hills, City ofMisc 70001 2% @ 60 1 3YY Y 9.205%2% 7.00
Laguna Niguel, City ofMisc 70001 2% @ 55 1 3YY 11.272%2% 7.00Misc 70401 2% @ 55 1 YY 11.272%2% 7.00
Laguna Woods, City ofMisc 70001 2% @ 55 1 3YY Y 11.639%2% 7.00Misc 70002 2% @ 55 1 YY Y 11.639%2% 7.00
Lake Arrowhead Community Services District
Misc 70001 2% @ 55 3 YY 14.083%2% 7.00Misc 70002 2.5% @ 55 3 YY 14.083%2% 8.00
Lake County Fire Protection DistrictMisc 70001 3% @ 60 1 4YY 26.815%3% 8.00Misc Y70401 3% @ 60 1 YY 26.815%3% 8.00Misc Y70402 2% @ 60 1 YY 26.815%3% 7.00Fire 74001 3% @ 55 1 4YY 28.122%3% 9.00Fire Y74401 3% @ 55 1 YY 28.122%3% 9.00Fire Y74402 3% @ 55 1 YY 28.122%3% 9.00
Lake County Vector Control DistrictMisc Y70001 2% @ 60 1 YY 24.108%2% 7.00Misc Y70002 3% @ 60 1 YY 24.108%2% 8.00
Lake Don Pedro Community Services District
Misc 70001 2% @ 60 3 3YY Y 8.619%2% 7.00Misc 70002 2% @ 60 3 YY Y 8.619%2% 7.00Misc 70003 2% @ 60 3 3YY Y 8.619%2% 7.00
Lake Elsinore, City ofMisc Y70001 2% @ 55 1 YY Y 22.820%2% 7.00Misc 70002 2% @ 55 1 YY Y 22.820%2% 7.00Misc 70003 2% @ 55 1 YY Y 22.820%2% 7.00Misc 70004 2.5% @ 55 1 YY Y 22.820%2% 8.00Fire 74001 1.25% @ 60 3 YY 0.000%2% variesPolice 75001 1.25% @ 60 3 YY 0.000%2% varies
Lake Forest, City ofMisc 70001 2% @ 55 1 3YY 10.781%2% 7.00
Lake Hemet Municipal Water DistrictMisc 70001 2% @ 55 3 YY 10.333%2% 7.00
Lake Oroville Area Public Utility DistrictMisc Y70001 2.7% @ 55 1 YY 25.075%2% 8.00
Lake Shastina Community Services DistrictMisc 70001 2% @ 55 3 4YY 16.778%2% 7.00
Lake Valley Fire Protection DistrictMisc 70001 2% @ 55 1 4YY 17.810%2% 7.00Misc Y70002 2% @ 55 1 YY 17.810%2% 7.00Misc 70003 2.7% @ 55 1 4YY 17.810%2% 8.00Fire 74001 3% @ 55 1 4YY Y 21.669%2% 9.00
Lake, County ofMisc Y70001 2% @ 55 1 YY 12.361%2% 7.00Misc Y70401 2% @ 55 1 12.361%2% 7.00Misc Y70402 2% @ 55 1 12.361%2% 7.00Fire 74001 2% @ 50 3 Y 17.335%2% 9.00Peace 77001 2% @ 50 3 Y Y 17.335%2% 9.00
349

5. CalPERS Supplement - Summary of Contracting Agency Benefits - (Continued)
Final Pre- SickPost
Ordinary 1959Compensation SurvivorRetirement Leave
RetirementDisabilityBenefit
FinalContribution Rate
Employer Name Offset Option 2 Credit IncreaseSurvivor
BenefitFormula Period COLA Member EmployerCompensation
Allowance
Lakeport County Fire Protection DistrictMisc 70001 2% @ 55 1 4YY 11.692%2% 7.00Misc 70401 2% @ 55 1 4YY 11.692%2% 7.00Fire 74001 2% @ 50 1 4YY 28.018%2% 9.00Fire 74401 2% @ 50 1 4YY 28.018%2% 9.00
Lakeport, City ofMisc Y70001 2% @ 55 1 YY 22.552%2% 7.00Misc 70002 2% @ 55 1 2YY 22.552%2% 7.00Misc Y70003 2.5% @ 55 1 YY 22.552%2% 8.00Misc 70004 2.5% @ 55 1 2YY 22.552%2% 8.00Police 75001 2% @ 50 1 2YY 40.969%2% 9.00
Lakeside Fire Protection DistrictMisc 70001 2% @ 55 1 1YY Y 17.177%2% 7.00Misc 70002 2.7% @ 55 1 1YY Y 17.177%2% 8.00Fire 74001 3% @ 50 1 4YY Y 27.877%2% 9.00
Lakeside Water DistrictMisc 70001 2% @ 55 3 YY 15.084%2% 7.00Misc 70002 3% @ 60 3 YY 15.084%2% 8.00Misc Y70401 2% @ 55 3 YY 15.084%2% 7.00Misc 70402 2% @ 55 3 YY 15.084%2% 7.00
Lakewood, City ofMisc 70001 2% @ 55 1 12.744%2% 7.00
Lamont Public Utility DistrictMisc 70001 2% @ 60 3 YY 7.696%2% 7.00
Lancaster, City ofMisc 70001 2% @ 55 1 3 18.672%2% 7.00Misc 70002 2.7% @ 55 1 3 18.672%2% 8.00
Larkspur, City ofMisc 70001 2% @ 55 1 3YY 14.660%2% 7.00Misc Y70002 2% @ 55 1 YY 14.660%2% 7.00Misc 70003 2.5% @ 55 1 3YY 14.660%2% 8.00Fire 74001 3% @ 55 1 4YY Y 23.397%2% 9.00
Las Gallinas Valley Sanitary District of Marin County
Misc Y70001 2% @ 55 1 YY 18.869%2% 7.00Misc 70002 2% @ 55 3 YY 18.869%2% 7.00Misc Y70003 2.7% @ 55 1 YY 18.869%2% 8.00
Las Virgenes Municipal Water DistrictMisc Y70001 2% @ 55 1 Y 15.897%3% 7.00Misc 70002 2% @ 55 1 Y 15.897%3% 7.00Misc 70003 2% @ 55 1 Y 15.897%3% 7.00
Lassen County Waterworks District No. 1Misc 70001 2% @ 60 3 4YY 9.757%2% 7.00
Lassen, County ofMisc Y70001 2% @ 55 1 Y 11.679%2% 7.00Misc 70002 2% @ 55 1 Y 11.679%2% 7.00Fire 74001 1/2 @ 55 1 YY 37.909%2% variesPeace 77001 3% @ 50 1 3YY 37.909%2% 9.00
Lathrop, City ofMisc 70001 2% @ 55 3 3YY 12.551%2% 7.00Misc 70101 2% @ 60 3 3YY 8.049%2% 7.00
Lawndale, City ofMisc 70001 2% @ 55 1 4YY 10.781%2% 7.00
League of California CitiesMisc 70001 2% @ 60 3 YY 8.049%2% 7.00
Lee Lake Water DistrictMisc 70001 2% @ 60 1 4YY 8.959%2% 7.00
350

5. CalPERS Supplement - Summary of Contracting Agency Benefits - (Continued)
Final Pre- SickPost
Ordinary 1959Compensation SurvivorRetirement Leave
RetirementDisabilityBenefit
FinalContribution Rate
Employer Name Offset Option 2 Credit IncreaseSurvivor
BenefitFormula Period COLA Member EmployerCompensation
Allowance
Lemon Grove, City ofMisc 70001 2% @ 55 1 4YY 19.982%2% 7.00Misc 70002 2.5% @ 55 1 4YY 19.982%2% 8.00Misc 70401 2% @ 60 1 4YY 19.982%2% 7.00Fire 74002 3% @ 55 1 4YY 24.540%2% 9.00Fire 74401 2% @ 50 1 4YY 24.540%2% 9.00
Lemoore, City ofMisc Y70001 2% @ 55 3 YY 11.210%2% 7.00Fire Y74001 2% @ 55 3 YY 21.155%2% 7.00Police Y75001 2% @ 50 3 YY 21.155%2% 9.00
Leucadia Wastewater DistrictMisc 70001 2% @ 55 1 3YY 15.724%2% 7.00Misc 70002 2% @ 55 1 YY 15.724%2% 7.00Misc 70003 3% @ 60 1 3YY 15.724%2% 8.00Misc 70004 3% @ 60 1 YY 15.724%2% 8.00
Levee District No. 1 of Sutter CountyMisc Y70001 2% @ 60 3 YY 8.049%2% 7.00
Lincoln, City ofMisc Y70001 2% @ 55 1 YY 20.287%2% 7.00Misc Y70002 2.7% @ 55 1 YY 20.287%2% 8.00Misc Y70101 2% @ 60 3 YY 8.049%2% 7.00Fire Y74001 3% @ 50 3 YY 27.590%2% 9.00Police Y75001 3% @ 50 3 YY 27.590%2% 9.00
Linda County Water DistrictMisc Y70001 2% @ 60 3 YY 33.087%2% 7.00Misc 70002 2% @ 60 3 YY 33.087%2% 7.00Misc Y70003 3% @ 60 3 YY 33.087%2% 8.00
Linda Fire Protection DistrictMisc 70001 2% @ 60 1 4YY 8.486%2% 7.00Fire 74001 2% @ 50 1 4YY 20.742%2% 9.00
Linden-Peters Rural County Fire Protection District
Misc 70001 2% @ 60 3 YY 0.000%2% 7.00Fire 74001 3% @ 50 3 YY 23.082%2% 9.00
Lindsay Strathmore Public Cemetery District
Misc Y70001 2% @ 60 3 YY 0.000%2% 7.00Lindsay, City of
Misc Y70001 2% @ 55 1 YY 23.615%2% 7.00Misc 70002 2% @ 55 1 YY 23.615%2% 7.00Misc Y70003 2.7% @ 55 1 YY 23.615%2% 8.00Fire Y74001 3% @ 55 1 YY 28.667%2% 9.00Police Y75001 3% @ 55 1 YY 28.667%2% 9.00
Little Lake Fire Protection DistrictMisc 70001 2% @ 55 3 YY 12.579%2% 7.00Fire 74001 2% @ 55 3 YY 8.927%2% 7.00
Littlerock Creek Irrigation DistrictMisc Y70001 2% @ 60 1 YY 8.486%2% 7.00Misc 70002 2% @ 60 1 YY 8.486%2% 7.00
Live Oak Cemetery DistrictMisc Y70001 2% @ 60 3 YY 8.968%2% 7.00
Live Oak, City ofMisc 70001 2% @ 60 1 YY 21.632%2% 7.00Misc 70002 2.5% @ 55 1 YY 21.632%2% 8.00Misc 70003 2.7% @ 55 1 YY 21.632%2% 8.00
Livermore City Housing AuthorityMisc Y70001 2% @ 60 3 YY 9.886%2% 7.00
Livermore, City ofMisc 70001 2% @ 55 1 4Y 20.918%2% 7.00Misc 70002 2.7% @ 55 1 4Y 20.918%2% 8.00Police 75001 3% @ 50 1 4YY 26.149%2% 9.00
Livermore/Amador Valley Transit AuthorityMisc 70001 2% @ 55 1 4YY 10.781%2% 7.00
351

5. CalPERS Supplement - Summary of Contracting Agency Benefits - (Continued)
Final Pre- SickPost
Ordinary 1959Compensation SurvivorRetirement Leave
RetirementDisabilityBenefit
FinalContribution Rate
Employer Name Offset Option 2 Credit IncreaseSurvivor
BenefitFormula Period COLA Member EmployerCompensation
Allowance
Livingston, City ofMisc 70001 2% @ 55 1 YY 12.884%2% 7.00Police 75001 2% @ 55 1 YY 16.743%2% 7.00
Local Agency Formation Commission of Solano County
Misc 70001 2.7% @ 55 1 4YY Y 16.707%2% 8.00Local Government Services Authority, JPA
Misc 70001 2% @ 55 1 4YY 10.830%2% 7.00Lodi, City of
Misc 70001 2% @ 55 3 3Y Y Y 16.203%2% 7.00Misc Y70002 2% @ 55 3 Y Y Y 16.203%2% 7.00Fire 74001 3% @ 50 1 3Y 35.657%2% 9.00Police 75001 3% @ 50 1 3Y 35.657%2% 9.00
Loma Linda, City ofMisc 70001 2% @ 55 1 YY 12.485%2% 7.00Misc Y70002 2% @ 55 1 YY 12.485%2% 7.00Fire 74001 3% @ 55 1 4YY 27.337%2% 9.00
Lomita, City ofMisc 70001 2% @ 55 1 4YY 21.329%2% 7.00Misc 70002 2.5% @ 55 1 4YY 21.329%2% 8.00
Lompico County Water DistrictMisc 70001 2% @ 55 3 YY 26.704%2% 7.00
Lompoc, City ofMisc 70001 2% @ 55 1 3Y Y 20.707%2% 7.00Misc Y70002 2% @ 55 1 Y Y 20.707%2% 7.00Misc 70003 2.7% @ 55 1 3Y Y 20.707%2% 8.00Misc Y70004 2.7% @ 55 1 Y Y 20.707%2% 8.00Fire 74001 3% @ 50 3 4YY Y 33.130%2% 9.00Police 75001 3% @ 50 3 4YY Y 33.130%2% 9.00
Long Beach City College Associated Student Body, Liberal Arts Div. - Day Classes
Misc Y70001 2% @ 55 1 YY 40.819%2% 7.00Misc Y70002 3% @ 60 1 YY 40.819%2% 8.00
Long Beach State University, Associated Students
Misc Y70001 2% @ 55 1 YY Y 15.743%2% 5.00Misc Y70101 2% @ 60 3 YY Y 10.768%2% 5.00
Long Beach State University, Forty-Niner Shops, Inc.
Misc Y70001 2% @ 55 1 YY 12.358%2% 7.00Long Beach, City of
Misc Y70001 2% @ 55 1 YY Y 15.648%5% 7.00Misc Y70002 2.7% @ 55 1 YY Y 15.648%5% 8.00Misc Y70101 2% @ 55 1 Y Y 15.648%2% 7.00Misc Y70103 2.7% @ 55 1 YY Y 15.648%2% 8.00Misc Y70104 2.5% @ 55 1 YY Y 15.648%2% 8.00Fire 74001 3% @ 50 1 4YY Y 22.315%5% 9.00Fire 74101 3% @ 50 1 4YY Y 22.315%2% 9.00Police 75001 3% @ 50 1 4YY Y 22.315%5% 9.00Police 75002 3% @ 50 1 YY Y 22.315%5% 9.00Police 75101 3% @ 50 1 4YY Y 22.315%2% 9.00Safety Y76001 3% @ 50 1 YY Y 22.315%5% 9.00Safety 76002 3% @ 50 1 YY Y 22.315%5% 9.00Safety Y76101 3% @ 50 1 YY Y 22.315%2% 9.00Safety 76102 3% @ 50 1 YY Y 22.315%2% 9.00
Loomis Fire Protection DistrictMisc 70001 2% @ 55 3 8YY 31.977%2% 7.00Fire 74001 2% @ 55 3 8YY 21.415%2% 7.00
Loomis, Town ofMisc 70001 2% @ 55 3 3YY 9.467%2% 7.00
352

5. CalPERS Supplement - Summary of Contracting Agency Benefits - (Continued)
Final Pre- SickPost
Ordinary 1959Compensation SurvivorRetirement Leave
RetirementDisabilityBenefit
FinalContribution Rate
Employer Name Offset Option 2 Credit IncreaseSurvivor
BenefitFormula Period COLA Member EmployerCompensation
Allowance
Los Alamitos, City ofMisc 70001 2% @ 55 1 4YY 10.746%2% 7.00Misc Y70002 2% @ 55 1 YY 10.746%2% 7.00Misc 70003 2.7% @ 55 1 4YY 10.746%2% 8.00Misc Y70004 2.7% @ 55 1 YY 10.746%2% 8.00Police 75001 3% @ 50 1 4YY 27.320%2% 9.00
Los Alamos Community Services DistrictMisc 70001 2% @ 60 3 YY 11.875%2% 7.00
Los Altos Hills, Town ofMisc 70001 2% @ 55 3 4YY Y 11.104%2% 7.00Misc Y70002 2% @ 55 3 YY Y 11.104%2% 7.00Misc 70101 2% @ 60 3 4YY Y 8.768%2% 7.00
Los Altos, City ofMisc 70001 2% @ 55 1 3YY 15.685%2% 7.00Misc 70002 2.7% @ 55 1 3YY 15.685%2% 8.00Police 75001 3% @ 50 1 3YY 26.582%2% 9.00Police 75002 3% @ 50 1 3YY 26.582%2% 9.00Police 75102 3% @ 50 1 3YY 26.582%2% 9.00
Los Angeles City Community Redevelopment Agency
Misc Y70001 2% @ 55 1 Y 20.208%3% 7.00Misc 70002 2% @ 55 1 Y 20.208%3% 7.00
Los Angeles Community College DistrictPolice 75001 3% @ 55 3 2YY 0.000%2% 9.00Police 75101 3% @ 55 3 1YY 0.000%2% 9.00
Los Angeles County Area 'E' Civil Defense and Disaster Board
Misc 70001 2% @ 60 1 3YY 14.660%2% 7.00Misc 70002 2.5% @ 55 1 3YY 14.660%2% 8.00
Los Angeles County Community Development Commission
Misc 70001 2% @ 60 1 4Y 6.831%2% 7.00Misc Y70401 2% @ 60 1 Y 6.831%2% 7.00
Los Angeles County Law LibraryMisc 70001 2% @ 60 1 YY Y 7.236%4% 7.00Misc Y70002 2% @ 60 1 YY Y 7.236%4% 7.00Misc 70003 2.5% @ 55 1 YY Y 7.236%4% 8.00Misc Y70004 2.5% @ 55 1 YY Y 7.236%4% 8.00
Los Angeles County Office of EducationMisc 70001 2% @ 55 1 2Y 13.957%2% 7.00Misc Y70002 2% @ 55 1 Y 13.957%2% 7.00Misc Y70003 2% @ 55 1 Y 13.957%2% 7.00Misc 70004 2.5% @ 55 1 2Y 13.957%2% 8.00Misc Y70005 2.5% @ 55 1 Y 13.957%2% 8.00
Los Angeles County Sanitation District No. 2
Misc 70001 2% @ 55 1 3Y Y 11.509%2% 7.00Misc Y70002 2% @ 55 1 Y Y 11.509%2% 7.00
Los Angeles County West Vector Control District
Misc 70001 2% @ 60 1 3YY 8.293%2% 7.00Los Angeles Memorial Coliseum Commission
Misc 70001 2% @ 60 3 YY 7.818%2% 7.00Misc 70002 2.5% @ 55 3 YY 7.818%2% 8.00
Los Angeles Regionalized Insurance Services Authority
Misc 70001 2% @ 55 1 3YY 0.000%2% 7.00Los Angeles to Pasadena Metro Blue Line Construction
Misc 70001 2% @ 55 1 4YY 14.660%2% 7.00Misc 70002 2.5% @ 55 1 4YY 14.660%2% 8.00
353

5. CalPERS Supplement - Summary of Contracting Agency Benefits - (Continued)
Final Pre- SickPost
Ordinary 1959Compensation SurvivorRetirement Leave
RetirementDisabilityBenefit
FinalContribution Rate
Employer Name Offset Option 2 Credit IncreaseSurvivor
BenefitFormula Period COLA Member EmployerCompensation
Allowance
Los Angeles Unified School DistrictPolice 75001 3% @ 50 1 4Y 31.821%5% 9.00Police 75002 2% @ 60 1 4Y 31.821%5% 7.00Police 75101 3% @ 50 1 4Y 31.821%5% 9.00
Los Banos, City ofMisc Y70001 2% @ 55 1 YY Y 21.212%2% 7.00Misc 70002 2% @ 55 1 YY Y 21.212%2% 7.00Misc Y70003 2.7% @ 55 1 YY Y 21.212%2% 8.00Misc Y70101 2% @ 60 3 YY Y 8.768%2% 7.00Fire Y74001 3% @ 50 1 YY Y 36.027%2% 9.00Fire Y74101 3% @ 55 3 YY Y 22.502%2% 9.00Police Y75001 3% @ 50 1 YY Y 36.027%2% 9.00Police Y75101 3% @ 55 3 YY Y 22.502%2% 9.00
Los Gatos, Town ofMisc 70001 2% @ 55 1 4Y 21.899%2% 7.00Misc Y70002 2% @ 55 1 Y 21.899%2% 7.00Misc 70003 2.5% @ 55 1 4Y 21.899%2% 8.00Police 75001 3% @ 50 1 4YY Y 40.850%2% 9.00
Los Gatos-Saratoga Department of Community Education and Recreation
Misc 70001 2% @ 55 1 3YY Y 15.408%2% 7.00Los Osos Community Services District
Misc 70001 2% @ 55 1 3YY Y 13.256%2% 7.00Fire 74001 2% @ 50 3 3YY Y 0.000%2% 9.00
Lower Lake Cemetery DistrictMisc 70001 2% @ 55 3 YY 16.139%2% 7.00
Lower Lake County Waterworks District No. 1
Misc 70001 2% @ 60 1 YY 31.879%2% 7.00Lower Tule River Irrigation District
Misc Y70001 2% @ 55 1 YY 13.397%2% 7.00Misc 70002 2% @ 55 1 YY 13.397%2% 7.00
Loyalton, City ofMisc Y70001 2% @ 55 3 YY 21.755%2% 7.00Misc Y70002 2.7% @ 55 3 YY 21.755%2% 8.00
Lynwood, City ofMisc 70001 2% @ 55 1 4Y 22.877%2% 7.00Misc 70002 3% @ 60 1 4Y 22.877%2% 8.00Fire 74001 2% @ 50 1 3YY Y 0.000%2% 9.00Police 75001 2% @ 50 1 1YY Y 0.000%2% 9.00
Madera Cemetery DistrictMisc Y70001 2% @ 55 1 YY 15.686%2% 7.00Misc 70002 2% @ 60 3 YY 15.686%2% 7.00Misc 70003 2% @ 55 1 YY 15.686%2% 7.00
Madera County Mosquito and Vector Control District
Misc Y70001 2% @ 55 3 YY 7.975%2% 7.00Madera Housing Authority, City of
Misc 70001 2% @ 55 1 3YY 18.287%2% 7.00Misc 70002 2.5% @ 55 1 3YY 18.287%2% 8.00
Madera, City ofMisc 70001 2% @ 55 1 8Y 16.242%2% 7.00Misc Y70002 2% @ 55 1 Y 16.242%2% 7.00Misc 70003 2.5% @ 55 1 8Y 16.242%2% 8.00Misc Y70004 2.5% @ 55 1 Y 16.242%2% 8.00Fire 74001 2% @ 55 1 1YY 36.066%2% 7.00Police 75001 3% @ 50 1 8YY 36.066%2% 9.00
354

5. CalPERS Supplement - Summary of Contracting Agency Benefits - (Continued)
Final Pre- SickPost
Ordinary 1959Compensation SurvivorRetirement Leave
RetirementDisabilityBenefit
FinalContribution Rate
Employer Name Offset Option 2 Credit IncreaseSurvivor
BenefitFormula Period COLA Member EmployerCompensation
Allowance
Madera, County ofMisc 70001 2% @ 55 1 1 20.505%2% 7.00Misc Y70002 2% @ 55 1 20.505%2% 7.00Misc Y70003 2.7% @ 55 1 20.505%2% 8.00Peace Y77001 3% @ 55 1 24.061%2% 9.00Peace Y77002 3% @ 55 1 24.061%2% 9.00Peace Y77003 3% @ 55 1 24.061%2% 9.00Peace Y77004 3% @ 55 1 24.061%2% 9.00
Main San Gabriel Basin WatermasterMisc 70001 2% @ 55 1 2YY 10.781%2% 7.00
Majestic Pines Community Services DistrictMisc 70001 2% @ 60 3 3YY 11.162%2% 7.00
Malibu, City ofMisc 70001 2% @ 55 1 YY Y 11.603%2% 7.00
Mammoth Lakes Fire DistrictMisc 70001 2% @ 60 3 YY 0.000%2% 7.00Fire 74001 3% @ 55 1 4YY Y 24.849%2% 9.00
Mammoth Lakes Mosquito Abatement District
Misc 70001 3% @ 60 3 4YY 36.654%2% 8.00Mammoth Lakes, Town of
Misc 70001 2% @ 55 3 4YY 21.099%2% 7.00Misc 70002 2.7% @ 55 3 4YY 21.099%2% 8.00Police 75001 3% @ 50 3 4YY 32.331%2% 9.00
Management of Emeryville Services Authority
Misc 70001 2% @ 55 1 3YY Y 7.307%2% 7.00Misc 70401 2% @ 55 1 YY Y 7.307%2% 7.00Misc 70402 2% @ 55 1 YY Y 7.307%2% 7.00
Manhattan Beach, City ofMisc 70001 2% @ 55 1 3Y 11.014%2% 7.00Fire 74001 3% @ 55 1 4YY Y 23.397%2% 9.00Fire 74101 3% @ 55 1 4YY Y 23.397%2% 9.00Police 75001 3% @ 50 1 1YY Y 27.877%2% 9.00Police 75101 3% @ 50 1 1YY Y 27.877%2% 9.00
Manteca, City ofMisc 70001 2% @ 55 1 4Y Y 23.435%2% 7.00Misc Y70002 2% @ 55 1 Y Y 23.435%2% 7.00Misc 70003 2.7% @ 55 1 4Y Y 23.435%2% 8.00Misc Y70004 2.7% @ 55 1 Y Y 23.435%2% 8.00Fire 74001 3% @ 55 1 4Y Y 34.124%2% 9.00Police 75001 3% @ 50 1 4Y Y 34.124%2% 9.00
March Joint Powers AuthorityMisc 70001 2% @ 55 1 4YY 17.298%2% 7.00Misc 70002 2.7% @ 55 1 4YY 17.298%2% 8.00
Marin Children and Families CommissionMisc 70001 2% @ 55 3 8YY 10.553%2% 7.00Misc 70002 2% @ 55 3 YY 10.553%2% 7.00
Marin Community College DistrictPolice 75001 2% @ 50 1 4YY Y 33.849%2% 9.00
Marin County Housing AuthorityMisc Y70001 2% @ 55 3 YY 10.282%2% 7.00Misc 70002 2% @ 55 3 YY 10.282%2% 7.00
Marin County In-Home Supportive Services Public Authority
Misc 70001 2% @ 55 3 8YY 13.516%2% 7.00Marin County Sanitary District No. 1
Misc 70001 2% @ 55 3 YY 17.911%2% 7.00Misc 70002 2.7% @ 55 3 YY 17.911%2% 8.00
Marin Healthcare DistrictMisc 70001 2% @ 60 3 YY 0.000%2% 7.00
355

5. CalPERS Supplement - Summary of Contracting Agency Benefits - (Continued)
Final Pre- SickPost
Ordinary 1959Compensation SurvivorRetirement Leave
RetirementDisabilityBenefit
FinalContribution Rate
Employer Name Offset Option 2 Credit IncreaseSurvivor
BenefitFormula Period COLA Member EmployerCompensation
Allowance
Marin Municipal Water DistrictMisc 70001 2% @ 55 3 20.975%2% 7.00Misc 70002 2.7% @ 55 3 20.975%2% 8.00
Marina Coast Water DistrictMisc 70001 2% @ 60 1 YY 8.486%2% 7.00
Marina, City ofMisc 70001 2% @ 55 1 4YY 10.781%2% 7.00Fire 74001 3% @ 50 1 4YY 26.149%2% 9.00Fire 74401 3% @ 50 1 4YY 26.149%2% 9.00Police 75001 3% @ 50 1 4YY 26.149%2% 9.00
Marinwood Community Services DistrictMisc Y70001 2% @ 60 1 YY 12.069%2% 7.00Misc 70002 2% @ 60 1 YY 12.069%2% 7.00Fire Y74001 3% @ 50 3 YY 32.491%2% 9.00Fire Y74101 3% @ 55 3 YY 20.774%2% 9.00
Mariposa Public Utility DistrictMisc Y70001 2% @ 60 3 YY 8.049%2% 7.00Misc 70002 2% @ 60 3 YY 8.049%2% 7.00
Mariposa, County ofMisc Y70001 2% @ 55 1 Y 19.193%2% 7.00Misc 70002 2% @ 55 3 Y 19.193%2% 7.00Misc Y70003 2.7% @ 55 1 Y 19.193%2% 8.00Fire Y74001 3% @ 50 1 YY 34.782%2% 9.00Fire Y74002 3% @ 50 1 YY 34.782%2% 9.00Peace Y77001 3% @ 50 1 YY 34.782%2% 9.00Peace Y77002 3% @ 50 1 YY 34.782%2% 9.00
Martinez, City ofMisc 70001 2% @ 55 1 YY 10.781%2% 7.00Misc Y70002 2% @ 55 1 YY 10.781%2% 7.00Fire 74001 1/2 @ 55 3 2YY 47.278%2% variesPolice 75001 3% @ 50 1 4YY 47.278%2% 9.00
Marysville, City ofMisc Y70001 2% @ 55 1 YY Y 9.629%2% 7.00Misc 70002 2% @ 55 1 3YY Y 9.629%2% 7.00Misc 70102 2% @ 55 3 3YY Y 14.498%2% 7.00Fire 74001 2% @ 50 1 4YY Y 45.955%2% 9.00Fire 74101 2% @ 50 3 4YY Y 45.955%2% 9.00Police 75001 3% @ 50 1 4YY Y 45.955%2% 9.00Police 75101 3% @ 50 3 4YY Y 45.955%2% 9.00
Maxwell Public Utility DistrictMisc Y70001 2% @ 55 3 YY 10.282%2% 7.00Misc 70002 2% @ 55 3 YY 10.282%2% 7.00
Maywood, City ofMisc 70001 2% @ 55 1 8YY 5.907%2% 7.00Misc Y70002 2% @ 55 1 YY 5.907%2% 7.00Police 75001 3% @ 50 1 1YY 0.000%2% 9.00Police 75101 3% @ 55 1 1YY 0.000%2% 9.00
McCloud Community Services DistrictMisc Y70001 2% @ 60 3 YY 5.882%2% 7.00Misc 70002 2% @ 60 3 YY 5.882%2% 7.00Fire Y74001 1/2 @ 55 3 YY 0.000%2% varies
McFarland Recreation and Park DistrictMisc Y70001 2% @ 55 3 YY 22.080%2% 7.00Misc 70002 2% @ 55 3 YY 22.080%2% 7.00Misc Y70003 2.5% @ 55 3 YY 22.080%2% 8.00
McKinleyville Community Services DistrictMisc Y70001 2% @ 55 3 YY 9.690%2% 7.00Misc 70002 2% @ 55 3 YY 9.690%2% 7.00
Meeks Bay Fire Protection DistrictMisc 70001 2% @ 55 3 3YY 12.541%2% 7.00Fire 74001 3% @ 55 1 YY 21.669%2% 9.00
356

5. CalPERS Supplement - Summary of Contracting Agency Benefits - (Continued)
Final Pre- SickPost
Ordinary 1959Compensation SurvivorRetirement Leave
RetirementDisabilityBenefit
FinalContribution Rate
Employer Name Offset Option 2 Credit IncreaseSurvivor
BenefitFormula Period COLA Member EmployerCompensation
Allowance
Meiners Oaks County Water DistrictMisc 70001 2% @ 60 3 YY 23.502%2% 7.00
Mendocino City Community Services District
Misc Y70001 2% @ 60 3 YY 16.618%2% 7.00Misc 70002 2% @ 60 3 YY 16.618%2% 7.00
Mendocino County Russian River Flood Control & Water Conservation Improvement Di
Misc 70001 2% @ 55 3 4YY 10.692%2% 7.00Mendocino Transit Authority
Misc 70001 2% @ 60 3 3YY 7.964%2% 7.00Menifee, City of
Misc 70001 2.7% @ 55 1 4YY Y 16.708%2% 8.00Menlo Park Fire Protection District
Misc 70001 2% @ 55 1 8YY 15.685%2% 7.00Misc 70002 2.7% @ 55 1 8YY 15.685%2% 8.00Fire 74001 3% @ 50 1 8YY Y 27.877%2% 9.00
Menlo Park, City ofMisc 70001 2% @ 55 1 1 17.702%2% 7.00Misc 70002 2.7% @ 55 1 1 17.702%2% 8.00Police 75001 3% @ 50 3 3YY 26.149%2% 9.00Police 75002 3% @ 50 1 3YY 26.149%2% 9.00
Merced County Housing AuthorityMisc Y70001 2% @ 60 1 YY 22.006%2% 7.00Misc Y70002 2.7% @ 55 1 YY 22.006%2% 8.00
Merced County Mosquito Abatement District
Misc Y70001 2% @ 60 3 YY 19.267%2% 7.00Misc Y70002 3% @ 60 3 YY 19.267%2% 8.00
Merced Irrigation DistrictMisc 70001 2% @ 60 3 Y Y Y 13.176%2% 7.00Misc 70002 2% @ 60 3 Y Y Y 13.176%2% 7.00
Merced, City ofMisc Y70001 2% @ 55 3 14.044%2% 7.00Misc 70002 2% @ 55 3 14.044%2% 7.00Misc Y70003 2.5% @ 55 3 14.044%2% 8.00Fire 74001 3% @ 50 3 22.581%2% 9.00Fire 74002 3% @ 50 3 22.581%2% 9.00Police 75001 3% @ 50 3 22.581%2% 9.00Police 75002 3% @ 50 3 22.581%2% 9.00
Mesa Consolidated Water DistrictMisc 70001 2% @ 55 1 YY Y 11.603%2% 7.00
Metropolitan Cooperative Library SystemMisc 70001 2% @ 55 3 YY 10.282%2% 7.00
Metropolitan Transportation CommissionMisc 70001 2% @ 55 3 3Y 16.401%3% 7.00Misc 70002 2.5% @ 55 3 3Y 16.401%3% 8.00
Metropolitan Water District of Southern California
Misc 70001 2% @ 55 1 4YY Y Y 16.306%2% 7.00Mid City Development Corporation
Misc 70001 2% @ 60 3 3YY 0.000%2% 7.00Mid Peninsula Water District
Misc 70001 2% @ 55 3 YY 14.864%2% 7.00Midpeninsula Regional Open Space District
Misc 70001 2% @ 55 1 YY 14.660%2% 7.00Misc 70002 2.5% @ 55 1 YY 14.660%2% 8.00
Mid-Placer Public Schools Transportation Agency
Misc 70001 2% @ 55 1 YY 8.896%2% 7.00Misc Y70002 2% @ 55 1 YY 8.896%2% 7.00Misc 70101 2% @ 60 1 YY 10.015%2% 7.00Misc Y70102 2% @ 60 1 YY 10.015%2% 7.00
357

5. CalPERS Supplement - Summary of Contracting Agency Benefits - (Continued)
Final Pre- SickPost
Ordinary 1959Compensation SurvivorRetirement Leave
RetirementDisabilityBenefit
FinalContribution Rate
Employer Name Offset Option 2 Credit IncreaseSurvivor
BenefitFormula Period COLA Member EmployerCompensation
Allowance
Midway City Sanitary DistrictMisc 70001 2% @ 55 1 YY 15.724%2% 7.00Misc 70002 3% @ 60 1 YY 15.724%2% 8.00Misc 70101 2% @ 55 1 YY 10.781%2% 7.00
Midway Heights County Water DistrictMisc 70001 2% @ 60 3 4YY Y 11.936%3% 7.00
Mill Valley, City ofMisc 70001 2% @ 55 1 3YY Y 15.577%2% 7.00Misc Y70002 2% @ 55 1 YY Y 15.577%2% 7.00Misc 70003 2.5% @ 55 1 3YY Y 15.577%2% 8.00Misc Y70004 2.5% @ 55 1 YY Y 15.577%2% 8.00Misc 70101 2% @ 55 3 3YY Y 11.104%2% 7.00Fire 74001 3% @ 55 1 8YY 21.669%2% 9.00Fire 74101 3% @ 55 3 8YY 20.774%2% 9.00Police 75001 3% @ 55 1 8YY 21.669%2% 9.00Police 75101 3% @ 55 3 8YY 20.774%2% 9.00
Millbrae, City ofMisc 70001 2% @ 55 1 4YY Y 22.747%2% 7.00Misc 70002 2% @ 55 1 4YY Y 22.747%2% 7.00Misc 70003 2.7% @ 55 1 4YY Y 22.747%2% 8.00Misc 70004 2.7% @ 55 1 4YY Y 22.747%2% 8.00Misc 70101 2% @ 55 1 4YY Y 22.747%2% 7.00Fire 74001 3% @ 55 1 YY Y 26.755%2% 9.00Police 75001 3% @ 55 1 YY Y 23.926%2% 9.00
Millview County Water DistrictMisc Y70001 2% @ 60 3 YY 10.555%2% 7.00
Milpitas, City ofMisc 70001 2% @ 55 1 3Y 21.115%2% 7.00Misc Y70002 2% @ 55 1 Y 21.115%2% 7.00Misc 70003 2.7% @ 55 1 3Y 21.115%2% 8.00Misc Y70004 2.7% @ 55 1 Y 21.115%2% 8.00Fire 74001 3% @ 50 1 3Y 32.931%2% 9.00Police 75001 3% @ 50 1 4YY Y 32.931%2% 9.00
Minter Field Airport DistrictMisc 70001 2% @ 60 1 3YY 10.246%2% 7.00
Mission Springs Water DistrictMisc 70001 2% @ 55 3 YY 24.896%2% 7.00Misc 70002 2.7% @ 55 3 YY 24.896%2% 8.00
Mission Viejo, City ofMisc 70001 2% @ 55 1 3 17.725%2% 7.00Misc 70002 2.7% @ 55 1 3Y 17.725%2% 8.00Misc 70101 2% @ 60 3 3Y 17.725%2% 7.00
Modesto, City ofMisc 70001 2% @ 55 1 3Y Y 11.984%2% 7.00Misc Y70002 2% @ 55 1 Y Y 11.984%2% 7.00Misc 70101 2% @ 55 1 3Y 11.984%2% 7.00Fire 74001 3% @ 50 1 8Y 30.607%2% 9.00Police 75001 3% @ 50 1 8Y 30.607%2% 9.00
Modoc, County ofMisc Y70001 2% @ 55 1 Y 12.308%2% 7.00Misc 70002 2% @ 55 1 Y 12.308%2% 7.00Fire 74001 1/2 @ 55 1 YY 47.149%2% variesPeace 77001 3% @ 50 1 YY 47.149%2% 9.00
Mojave Water AgencyMisc 70001 2% @ 55 1 3YY Y 23.274%2% 7.00Misc 70002 2.7% @ 55 1 3YY Y 23.274%2% 8.00
Mokelumne Rural Fire DistrictMisc Y70001 2% @ 55 3 YY 10.282%2% 7.00Fire Y74001 2% @ 50 3 YY 19.900%2% 9.00
358

5. CalPERS Supplement - Summary of Contracting Agency Benefits - (Continued)
Final Pre- SickPost
Ordinary 1959Compensation SurvivorRetirement Leave
RetirementDisabilityBenefit
FinalContribution Rate
Employer Name Offset Option 2 Credit IncreaseSurvivor
BenefitFormula Period COLA Member EmployerCompensation
Allowance
Mono, County ofMisc 70001 2% @ 55 1 4 20.288%2% 7.00Misc 70002 2.7% @ 55 1 4 20.288%2% 8.00Fire 74001 3% @ 50 1 4YY Y 26.149%2% 9.00Fire 74101 2% @ 50 1 4YY Y 20.742%2% 9.00Peace 77001 3% @ 50 1 4YY 26.149%2% 9.00Police 78001 3% @ 50 1 4YY 26.149%2% 9.00
Monrovia, City ofMisc 70001 2% @ 55 1 4Y Y 26.381%2% 7.00Misc 70002 2.7% @ 55 1 4Y Y 26.381%2% 8.00Fire 74001 3% @ 50 1 4YY Y 30.068%3% 9.00Fire 74002 3% @ 50 1 4YY Y 30.068%3% 9.00Police 75001 3% @ 50 1 4YY Y 30.068%3% 9.00Police 75002 3% @ 50 1 4YY Y 30.068%3% 9.00
Montague, City ofMisc 70001 2% @ 60 3 YY 6.154%2% 7.00
Montclair, City ofMisc 70001 2% @ 55 1 2Y 19.702%2% 7.00Misc 70002 3% @ 60 1 2Y 19.702%2% 8.00Misc 70101 2% @ 60 1 2Y 19.702%2% 7.00Fire 74001 3% @ 50 1 2YY Y 59.931%2% 9.00Fire 74101 3% @ 55 1 2YY Y 23.397%2% 9.00Police 75001 3% @ 50 1 3YY 44.567%2% 9.00Police 75101 3% @ 55 1 3YY 21.669%2% 9.00
Monte Sereno, City ofMisc 70001 2% @ 55 3 YY 14.726%2% 7.00
Monte Vista County Water DistrictMisc Y70001 2% @ 55 1 YY 15.152%2% 7.00Misc 70002 2% @ 55 1 YY 15.152%2% 7.00Misc Y70003 2.5% @ 55 1 YY 15.152%2% 8.00
Montebello, City ofMisc Y70001 2% @ 55 1 18.426%2% 7.00Misc 70002 2% @ 55 1 18.426%2% 7.00Misc 70003 2% @ 55 1 18.426%2% 7.00Misc 70004 2.7% @ 55 1 18.426%2% 8.00Fire 74001 3% @ 50 1 3Y 39.374%2% 9.00Police 75001 3% @ 50 1 3Y 39.374%2% 9.00Police 75002 3% @ 50 1 Y 39.374%2% 9.00
Montecito Fire Protection DistrictMisc 70001 2% @ 55 1 3YY Y 18.148%2% 7.00Misc 70002 3% @ 60 1 3YY Y 18.148%2% 8.00Fire 74001 3% @ 55 1 3YY Y 23.397%2% 9.00Fire 74002 3% @ 55 1 3YY Y 23.397%2% 9.00
Montecito Sanitary District of Santa Barbara County
Misc Y70001 2% @ 55 1 YY 9.301%2% 7.00Misc 70002 2% @ 55 1 YY 9.301%2% 7.00
Montecito Water DistrictMisc Y70001 2% @ 55 1 YY 10.781%2% 7.00Misc 70002 2% @ 55 3 YY 10.781%2% 7.00Misc Y70401 2% @ 55 1 YY 10.781%2% 7.00Misc 70402 2% @ 55 3 YY 10.781%2% 7.00
Monterey Bay Unified Air Pollution Control District
Misc 70001 2% @ 55 1 4YY 13.978%2% 7.00Misc Y70401 2% @ 55 1 YY 13.978%2% 7.00
Monterey County Local Agency Formation Commission
Misc 70001 2% @ 55 1 4YY 10.781%2% 7.00
359

5. CalPERS Supplement - Summary of Contracting Agency Benefits - (Continued)
Final Pre- SickPost
Ordinary 1959Compensation SurvivorRetirement Leave
RetirementDisabilityBenefit
FinalContribution Rate
Employer Name Offset Option 2 Credit IncreaseSurvivor
BenefitFormula Period COLA Member EmployerCompensation
Allowance
Monterey County Regional Fire Protection District
Misc 70001 2% @ 60 1 3YY Y 9.205%2% 7.00Misc Y70002 2% @ 60 1 YY Y 9.205%2% 7.00Misc 70401 2% @ 55 1 YY Y 9.205%2% 7.00Misc 70402 3% @ 60 1 YY Y 9.205%2% 8.00Fire 74001 3% @ 55 1 3YY Y 23.397%2% 9.00Fire 74401 3% @ 50 1 YY Y 23.397%2% 9.00
Monterey County Water Resources AgencyMisc 70001 2% @ 55 1 1YY 12.012%2% 7.00
Monterey Park, City ofMisc 70001 2% @ 55 1 4Y 21.676%2% 7.00Misc 70002 2.5% @ 55 1 4Y 21.676%2% 8.00Misc 70003 2.7% @ 55 1 4YY 21.676%2% 8.00Fire 74001 3% @ 55 1 4Y 25.887%2% 9.00Fire 74002 3% @ 55 1 4Y 25.887%2% 9.00Police 75001 3% @ 55 1 4Y 25.887%2% 9.00Police 75002 3% @ 55 1 4Y 25.887%2% 9.00
Monterey Peninsula Airport DistrictMisc Y70001 2% @ 55 1 YY 10.781%2% 7.00Misc 70002 2% @ 55 1 YY 10.781%2% 7.00Fire Y74001 3% @ 50 1 YY 26.149%2% 9.00Police Y75001 3% @ 50 1 YY 26.149%2% 9.00
Monterey Peninsula Regional Park DistrictMisc Y70001 2% @ 55 1 YY 23.839%3% 7.00Misc 70002 2% @ 55 1 4YY 23.839%3% 7.00Misc 70003 2.7% @ 55 1 4YY 23.839%3% 8.00
Monterey Peninsula Water Management District
Misc 70001 2% @ 55 1 4YY 13.532%2% 7.00Monterey Regional Waste Management District
Misc 70001 2% @ 55 1 3Y Y 12.495%2% 7.00Misc Y70002 2% @ 55 1 Y Y 12.495%2% 7.00
Monterey Regional Water Pollution Control Agency
Misc 70001 2% @ 55 1 3YY 15.724%2% 7.00Misc 70002 3% @ 60 1 3YY 15.724%2% 8.00Misc 70401 2% @ 55 1 3YY 15.724%2% 7.00Misc 70402 2% @ 60 3 YY 15.724%2% 7.00
Monterey, City ofMisc 70001 2% @ 55 1 4Y 22.481%2% 7.00Misc 70002 2.7% @ 55 1 4Y 22.481%2% 8.00Fire 74001 3% @ 50 1 8YY 33.476%2% 9.00Fire 74002 3% @ 50 1 8YY 33.476%2% 9.00Police 75001 3% @ 50 1 8YY 33.476%2% 9.00Police 75002 3% @ 50 1 8YY 33.476%2% 9.00
Monterey, County ofMisc 70001 2% @ 55 1 1Y 10.926%2% 7.00Misc Y70002 2% @ 55 1 Y 10.926%2% 7.00Fire 74001 2% @ 50 3 4Y 28.962%2% 9.00Peace 77001 3% @ 50 1 4Y 28.962%2% 9.00Peace 77101 3% @ 50 1 4 28.962%2% 9.00Peace 77102 2% @ 55 1 4 28.962%2% 7.00
Monterey-Salinas TransitMisc 70001 2% @ 55 1 1Y 8.660%2% 7.00
Montezuma Fire Protection DistrictFire 74001 3% @ 55 3 YY 32.485%2% 9.00
Moorpark, City ofMisc 70001 2% @ 55 3 4YY 10.282%2% 7.00
360

5. CalPERS Supplement - Summary of Contracting Agency Benefits - (Continued)
Final Pre- SickPost
Ordinary 1959Compensation SurvivorRetirement Leave
RetirementDisabilityBenefit
FinalContribution Rate
Employer Name Offset Option 2 Credit IncreaseSurvivor
BenefitFormula Period COLA Member EmployerCompensation
Allowance
Moraga, Town ofMisc 70001 2% @ 55 3 4YY 10.282%2% 7.00Police 75001 2% @ 50 3 4YY 19.900%2% 9.00
Moreno Valley, City ofMisc 70001 2% @ 55 1 4Y 22.305%2% 7.00Misc 70002 2.7% @ 55 1 4Y 22.305%2% 8.00
Morgan Hill, City ofMisc 70001 2% @ 55 1 4Y 16.384%2% 7.00Misc Y70002 2% @ 55 1 Y 16.384%2% 7.00Misc 70003 2.5% @ 55 1 4Y 16.384%2% 8.00Police 75001 3% @ 50 1 4YY 34.630%2% 9.00
Morongo Basin Transit AuthorityMisc 70001 2% @ 60 3 YY 8.366%2% 7.00
Morro Bay, City ofMisc 70001 2% @ 55 1 YY 23.217%2% 7.00Misc 70002 2.7% @ 55 1 4YY 23.217%2% 8.00Fire 74001 3% @ 50 1 4YY 41.225%2% 9.00Fire 74101 3% @ 55 3 4YY 20.774%2% 9.00Police 75001 3% @ 50 1 4YY 37.729%2% 9.00Police 75101 3% @ 55 3 4YY 20.774%2% 9.00
Mother Lode Job Training AgencyMisc 70001 2% @ 60 3 YY 9.102%2% 7.00
Moulton-Niguel Water DistrictMisc 70001 2% @ 55 1 1YY 12.667%3% 7.00Misc 70101 2% @ 55 1 1YY 11.709%3% 7.00
Mountain View, City ofMisc 70001 2% @ 55 1 3Y 21.974%2% 7.00Misc Y70002 2% @ 55 3 21.974%2% 7.00Misc 70003 2.7% @ 55 1 3Y 21.974%2% 8.00Fire 74001 3% @ 50 1 4YY 30.689%2% 9.00Fire 74002 3% @ 50 1 4YY 30.689%2% 9.00Police 75001 3% @ 50 1 3 30.689%2% 9.00Police 75002 3% @ 50 1 4YY 30.689%2% 9.00
Mountains Recreation and Conservation Authority
Misc 70001 2% @ 60 3 3YY 8.930%2% 7.00Mountain-Valley Library System
Misc Y70001 2% @ 60 3 YY 0.000%2% 7.00Mt. San Antonio College Associated Students
Misc Y70001 2% @ 55 1 YY 14.637%2% 7.00Mt. Shasta, City of
Misc Y70001 2% @ 55 3 YY 14.359%2% 7.00Fire Y74001 2% @ 50 3 YY 22.460%2% 9.00Police Y75001 2% @ 50 3 YY 17.862%2% 9.00
Mt. View Sanitary District of Contra Costa County
Misc Y70001 2% @ 55 1 YY Y 27.596%5% 7.00Misc 70002 2% @ 55 1 YY Y 27.596%5% 7.00Misc 70003 2% @ 55 1 YY Y 27.596%5% 7.00Misc 70004 2.7% @ 55 1 YY Y 27.596%5% 8.00
Municipal Pooling AuthorityMisc 70001 2% @ 55 1 4YY 10.781%2% 7.00
Municipal Water District of Orange CountyMisc 70001 2% @ 55 1 4YY 10.781%2% 7.00Misc 70401 2% @ 55 1 YY 10.781%2% 7.00
Murphys Sanitary DistrictMisc Y70001 2% @ 60 3 YY 8.049%2% 7.00
Murrieta Fire Protection DistrictMisc 70001 2% @ 55 1 3YY 19.304%2% 7.00Misc 70002 2.7% @ 55 1 3YY 19.304%2% 8.00Fire 74001 3% @ 50 1 4YY 31.245%2% 9.00
361

5. CalPERS Supplement - Summary of Contracting Agency Benefits - (Continued)
Final Pre- SickPost
Ordinary 1959Compensation SurvivorRetirement Leave
RetirementDisabilityBenefit
FinalContribution Rate
Employer Name Offset Option 2 Credit IncreaseSurvivor
BenefitFormula Period COLA Member EmployerCompensation
Allowance
Murrieta Valley Cemetery DistrictMisc 70001 2.7% @ 55 3 4YY 15.991%2% 8.00
Murrieta, City ofMisc 70001 2% @ 55 1 4YY 18.860%2% 7.00Misc 70002 2.7% @ 55 1 4YY 18.860%2% 8.00Police 75001 3% @ 50 1 4YY 28.925%2% 9.00
Napa County Mosquito Abatement DistrictMisc 70001 2% @ 55 1 4YY Y 31.299%2% 7.00Misc 70002 2.7% @ 55 1 4YY Y 31.299%2% 8.00
Napa County Resource Conservation District
Misc 70001 2% @ 60 3 4YY 20.440%2% 7.00Napa County Transportation and Planning Agency
Misc 70001 2.5% @ 55 3 4YY 14.083%2% 8.00Misc 70101 2% @ 60 3 4YY 8.049%2% 7.00
Napa Sanitation DistrictMisc 70001 2% @ 55 1 4YY Y 31.081%3% 7.00Misc 70002 2.7% @ 55 1 4YY Y 31.081%3% 8.00Misc 70101 2% @ 55 1 4YY Y 11.603%2% 7.00
Napa, City ofMisc 70001 2% @ 55 1 8Y Y 23.122%2% 7.00Misc Y70002 2% @ 55 1 Y Y 23.122%2% 7.00Misc 70003 2.5% @ 55 1 8Y Y 23.122%2% 8.00Misc Y70004 2.5% @ 55 1 Y Y 23.122%2% 8.00Misc 70005 2.7% @ 55 1 8Y Y 23.122%2% 8.00Misc Y70006 2.7% @ 55 1 Y Y 23.122%2% 8.00Misc 70101 2% @ 55 1 8Y Y 23.122%2% 7.00Misc 70102 2.5% @ 55 1 8Y Y 23.122%2% 8.00Misc 70401 2% @ 55 1 4YY Y 23.122%2% 7.00Misc 70402 2.7% @ 55 1 4YY Y 23.122%2% 8.00Fire 74001 3% @ 50 1 8Y Y 34.278%2% 9.00Fire 74101 3% @ 50 1 8Y Y 34.278%2% 9.00Police 75001 3% @ 50 1 4Y Y 34.278%2% 9.00Police 75101 3% @ 50 1 4Y Y 34.278%2% 9.00
Napa, County ofMisc 70001 2% @ 55 1 4YY Y 16.656%2% 7.00Misc 70003 2.5% @ 55 1 4YY Y 16.656%2% 8.00Misc 70101 2% @ 55 3 4YY 16.656%2% 7.00Misc 70102 2.5% @ 55 3 4YY 16.656%2% 8.00Misc 70401 2% @ 55 1 4YY Y 16.656%2% 7.00Peace 77001 3% @ 50 1 4YY Y 27.877%2% 9.00Peace 77002 3% @ 50 1 4YY Y 27.877%2% 9.00Peace 77101 3% @ 50 1 4YY 26.149%2% 9.00Peace 77102 3% @ 55 1 4YY 21.669%2% 9.00
National City, City ofMisc 70001 2% @ 55 1 3Y Y 21.237%2% 7.00Misc 70002 3% @ 60 1 3Y Y 21.237%2% 8.00Misc 70101 2% @ 60 1 3Y Y 21.237%2% 7.00Misc 70401 2% @ 55 1 3YY Y 21.237%2% 7.00Misc 70402 3% @ 60 1 3YY Y 21.237%2% 8.00Misc 70403 2% @ 55 1 3YY Y 21.237%2% 7.00Fire 74001 3% @ 50 1 3Y Y 38.007%2% 9.00Police 75001 3% @ 50 1 3Y Y 38.007%2% 9.00Police 75101 3% @ 55 1 3Y Y 38.007%2% 9.00
National Orange ShowMisc Y70001 2% @ 60 3 YY 1.574%2% 7.00
Natomas Fire Protection DistrictMisc 70001 2% @ 60 3 YY 0.000%2% 7.00Fire 74001 2% @ 50 3 YY 0.000%2% 9.00
362

5. CalPERS Supplement - Summary of Contracting Agency Benefits - (Continued)
Final Pre- SickPost
Ordinary 1959Compensation SurvivorRetirement Leave
RetirementDisabilityBenefit
FinalContribution Rate
Employer Name Offset Option 2 Credit IncreaseSurvivor
BenefitFormula Period COLA Member EmployerCompensation
Allowance
Needles, City ofMisc Y70001 2% @ 55 3 YY 6.648%2% 7.00Police Y75001 2% @ 50 3 YY 0.000%2% 9.00
Nevada Cemetery DistrictMisc Y70001 2% @ 60 3 YY 12.546%2% 7.00
Nevada City, City ofMisc Y70001 2% @ 55 1 YY 14.660%2% 7.00Misc Y70002 2.5% @ 55 1 YY 14.660%2% 8.00Misc Y70101 2% @ 60 1 YY 8.486%2% 7.00Fire Y74001 3% @ 50 1 YY 26.149%2% 9.00Police Y75001 3% @ 50 1 YY 26.149%2% 9.00
Nevada County Consolidated Fire DistrictMisc 70001 2% @ 55 1 4YY 24.760%2% 7.00Misc 70002 3% @ 60 1 4YY 24.760%2% 8.00Misc 70401 2% @ 55 1 YY 24.760%2% 7.00Misc 70402 2% @ 55 1 4YY 24.760%2% 7.00Misc 70403 3% @ 60 1 4YY 24.760%2% 8.00Misc 70404 3% @ 60 1 YY 24.760%2% 8.00Fire 74001 3% @ 55 1 3YY 27.034%2% 9.00Fire 74401 3% @ 55 1 3YY 27.034%2% 9.00Fire 74402 3% @ 55 1 YY 27.034%2% 9.00Fire 74403 3% @ 55 1 3YY 27.034%2% 9.00
Nevada County Local Agency Formation Commission
Misc 70001 2% @ 55 3 YY 15.740%2% 7.00Nevada County Resource Conservation District
Misc 70001 2.5% @ 55 1 YY 14.660%2% 8.00Nevada Irrigation District
Misc 70001 2% @ 55 1 3Y Y 22.700%2% 7.00Misc 70002 2.5% @ 55 1 3Y Y 22.700%2% 8.00
Nevada, County ofMisc Y70001 2% @ 55 1 YY Y 24.484%2% 7.00Misc 70002 2% @ 55 1 YY Y 24.484%2% 7.00Misc Y70003 2.7% @ 55 1 YY Y 24.484%2% 8.00Fire Y74001 3% @ 50 1 YY Y 39.953%2% 9.00Fire Y74002 2% @ 50 1 YY Y 39.953%2% 9.00Peace Y77001 3% @ 50 1 YY Y 39.953%2% 9.00Peace Y77002 3% @ 50 1 YY Y 39.953%2% 9.00Peace Y77101 3% @ 55 3 YY Y 22.502%2% 9.00
Nevada-Sierra Regional IHSS Public Authority
Misc 70001 2% @ 55 3 4YY 10.373%2% 7.00Newark, City of
Misc 70001 2% @ 55 1 8YY 23.146%2% 7.00Misc 70002 2.5% @ 55 1 8YY 23.146%2% 8.00Fire 74001 3% @ 50 1 8YY 38.550%2% 9.00Police 75001 3% @ 50 1 8YY 38.550%2% 9.00
Newcastle Rocklin Gold Hill Cemetery District
Misc Y70001 2% @ 60 3 YY 8.472%2% 7.00Newhall County Water District
Misc Y70001 2% @ 55 1 YY 9.155%2% 7.00Misc 70002 2% @ 55 1 YY 9.155%2% 7.00
Newman, City ofMisc Y70001 2% @ 55 3 YY 22.677%2% 7.00Misc Y70002 2.7% @ 55 3 YY 22.677%2% 8.00Misc Y70101 2% @ 55 3 YY 10.282%2% 7.00Police Y75001 3% @ 50 3 YY 34.779%2% 9.00
Newport Beach City Employees Federal Credit Union
Misc Y70001 2% @ 60 1 YY 15.903%2% 7.00
363

5. CalPERS Supplement - Summary of Contracting Agency Benefits - (Continued)
Final Pre- SickPost
Ordinary 1959Compensation SurvivorRetirement Leave
RetirementDisabilityBenefit
FinalContribution Rate
Employer Name Offset Option 2 Credit IncreaseSurvivor
BenefitFormula Period COLA Member EmployerCompensation
Allowance
Newport Beach, City ofMisc 70001 2% @ 55 1 4YY 17.920%2% 7.00Misc 70002 2.5% @ 55 1 4YY 17.920%2% 8.00Fire 74001 3% @ 50 1 4Y 40.677%2% 9.00Police 75001 3% @ 50 1 4Y 40.677%2% 9.00Safety 76001 3% @ 50 1 4Y 40.677%2% 9.00
Niland Sanitary DistrictMisc Y70001 2% @ 60 3 YY 0.000%2% 7.00
Nipomo Community Services DistrictMisc 70001 2% @ 55 1 4YY Y 21.135%2% 7.00Misc 70002 3% @ 60 1 4YY Y 21.135%2% 8.00Misc 70101 3% @ 60 3 4YY Y 16.133%2% 8.00
Norco, City ofMisc Y70001 2% @ 55 3 YY 23.365%2% 7.00Misc 70002 2% @ 55 3 4YY 23.365%2% 7.00Misc Y70003 2.7% @ 55 3 YY 23.365%2% 8.00Misc 70004 2.7% @ 55 3 4YY 23.365%2% 8.00Fire 74001 2% @ 50 1 4YY 20.198%2% 9.00
North Bay Cooperative Library SystemMisc 70001 2% @ 55 1 8YY 8.872%2% 7.00Misc Y70002 2% @ 55 1 YY 8.872%2% 7.00
North Bay Regional CenterMisc 70001 2% @ 60 3 4 11.564%2% 7.00
North Bay Schools Insurance AuthorityMisc 70001 2% @ 55 3 3YY Y 15.384%2% 7.00
North Central Counties ConsortiumMisc 70001 2% @ 55 3 YY 18.970%2% 7.00
North Coast County Water DistrictMisc 70001 2% @ 55 1 YY 24.757%2% 7.00Misc 70002 2.7% @ 55 1 YY 24.757%2% 8.00
North Coast Railroad AuthorityMisc 70001 2% @ 55 1 4YY Y 16.393%2% 7.00
North Coast Unified Air Quality Management District
Misc 70001 2% @ 55 1 2YY 11.750%2% 7.00North County Dispatch Joint Powers Agency
Misc 70001 2.7% @ 55 1 4YY 15.685%2% 8.00Misc 70401 2% @ 55 1 4YY 15.685%2% 7.00Misc 70402 2.7% @ 55 1 4YY 15.685%2% 8.00
North County Fire Protection District of Monterey County
Fire 74001 3% @ 55 1 3YY Y 23.397%2% 9.00Fire 74101 2% @ 50 3 3YY 19.900%2% 9.00Fire 74401 3% @ 55 1 3YY Y 23.397%2% 9.00
North County Fire Protection District of San Diego County
Misc 70001 2% @ 55 1 4YY Y 33.043%2% 7.00Misc Y70002 2% @ 55 1 YY Y 33.043%2% 7.00Misc 70003 2.7% @ 55 1 4YY Y 33.043%2% 8.00Fire 74001 3% @ 55 1 4YY Y 30.211%2% 9.00
North County Transit DistrictMisc 70001 2% @ 55 3 Y 11.988%2% 7.00Misc Y70002 2% @ 55 3 Y 11.988%2% 7.00
North Delta Water AgencyMisc 70001 2% @ 60 3 8YY 11.030%2% 7.00Misc 70002 2% @ 60 3 YY 11.030%2% 7.00
North Kern Cemetery DistrictMisc Y70001 2% @ 60 1 YY Y Y 13.918%2% 7.00Misc 70002 2% @ 60 1 YY Y Y 13.918%2% 7.00Misc Y70003 3% @ 60 1 YY Y Y 13.918%2% 8.00
364

5. CalPERS Supplement - Summary of Contracting Agency Benefits - (Continued)
Final Pre- SickPost
Ordinary 1959Compensation SurvivorRetirement Leave
RetirementDisabilityBenefit
FinalContribution Rate
Employer Name Offset Option 2 Credit IncreaseSurvivor
BenefitFormula Period COLA Member EmployerCompensation
Allowance
North Kern Water Storage DistrictMisc Y70001 2% @ 60 3 YY 3.693%2% 7.00Misc 70002 2% @ 60 3 YY 3.693%2% 7.00
North Kern-South Tulare Hospital DistrictMisc Y70001 2% @ 60 3 8.231%2% 7.00
North Los Angeles County Regional Center, Inc.
Misc 70001 2% @ 55 1 Y 7.691%2% 7.00Misc 70101 2% @ 60 1 Y 7.691%2% 7.00
North Marin Water DistrictMisc Y70001 2% @ 55 1 YY 20.035%2% 7.00Misc Y70002 2.5% @ 55 1 YY 20.035%2% 8.00
North of the River Municipal Water DistrictMisc 70001 2% @ 60 1 YY Y 29.871%2% 7.00Misc 70002 3% @ 60 1 YY Y 29.871%2% 8.00
North of the River Recreation and Park District
Misc 70001 2% @ 60 3 9.951%2% 7.00North State Cooperative Library System
Misc 70001 2% @ 55 1 YY 0.000%2% 7.00Misc Y70002 2% @ 55 1 YY 0.000%2% 7.00
North Tahoe Fire Protection DistrictMisc 70001 2% @ 55 1 3YY 28.978%2% 7.00Misc 70002 3% @ 60 1 3YY 28.978%2% 8.00Misc 70101 2.7% @ 55 1 3YY 16.854%2% 8.00Misc 70401 2% @ 55 1 3YY 28.978%2% 7.00Misc Y70402 2% @ 55 1 YY 28.978%2% 7.00Misc 70403 2% @ 55 1 3YY 28.978%2% 7.00Misc Y70404 3% @ 60 1 YY 28.978%2% 8.00Fire 74001 3% @ 50 1 3YY 43.190%2% 9.00Fire 74101 3% @ 55 1 3YY 23.905%2% 9.00Fire 74401 3% @ 50 1 3YY 43.190%2% 9.00Fire 74402 3% @ 50 1 3YY 43.190%2% 9.00Fire 74403 3% @ 50 1 3YY 43.190%2% 9.00
North Tahoe Public Utility DistrictMisc 70001 2% @ 55 3 YY 10.282%2% 7.00
Northern California Power AgencyMisc Y70001 2% @ 60 3 YY 27.605%3% 7.00Misc Y70002 2.5% @ 55 3 YY 27.605%3% 8.00
Northern California Special Districts Insurance Authority
Misc 70001 2% @ 55 3 1YY 10.282%2% 7.00Northern Salinas Valley Mosquito Abatement District
Misc 70001 2% @ 55 1 YY 10.781%2% 7.00Northern Sierra Air Quality Management District
Misc 70001 2% @ 55 1 3YY Y Y 16.747%2% 7.00Northshore Fire Protection District
Misc 70001 2% @ 55 3 4YY 51.737%2% 7.00Misc 70401 2% @ 55 3 3YY 51.737%2% 7.00Fire 74001 3% @ 55 1 4YY 30.880%2% 9.00Fire 74401 2% @ 55 1 4YY 30.880%2% 7.00Fire Y74402 3% @ 55 1 YY 30.880%2% 9.00Fire Y74403 3% @ 55 1 YY 30.880%2% 9.00Fire 74404 3% @ 55 1 YY 30.880%2% 9.00
365

5. CalPERS Supplement - Summary of Contracting Agency Benefits - (Continued)
Final Pre- SickPost
Ordinary 1959Compensation SurvivorRetirement Leave
RetirementDisabilityBenefit
FinalContribution Rate
Employer Name Offset Option 2 Credit IncreaseSurvivor
BenefitFormula Period COLA Member EmployerCompensation
Allowance
Northstar Community Services DistrictMisc 70001 2% @ 55 1 YY 20.731%2% 7.00Misc 70002 2.7% @ 55 1 YY 20.731%2% 8.00Misc Y70401 2% @ 55 1 YY 20.731%2% 7.00Misc Y70402 2.7% @ 55 1 YY 20.731%2% 8.00Fire 74001 3% @ 50 1 YY 26.149%2% 9.00Fire Y74401 3% @ 50 1 YY 26.149%2% 9.00Fire Y74402 3% @ 50 1 YY 26.149%2% 9.00
Northwest Mosquito and Vector Control District
Misc Y70001 2% @ 55 1 YY Y 16.707%2% 7.00Misc 70002 2% @ 55 1 YY Y 16.707%2% 7.00Misc Y70003 2.7% @ 55 1 YY Y 16.707%2% 8.00
Norwalk, City ofMisc 70001 2% @ 55 1 3Y 18.809%2% 7.00Misc 70002 2.7% @ 55 1 3Y 18.809%2% 8.00
Novato Sanitary DistrictMisc 70001 2% @ 55 1 3YY 10.781%2% 7.00Misc Y70002 2% @ 55 1 YY 10.781%2% 7.00
Novato, City ofMisc 70001 2% @ 55 1 4Y 12.698%2% 7.00Police 75001 3% @ 55 1 4YY 21.669%2% 9.00Police 75002 3% @ 55 1 4YY 21.669%2% 9.00
Oakdale Irrigation DistrictMisc 70001 2% @ 60 3 YY 8.049%2% 7.00
Oakdale Rural Fire Protection DistrictMisc 70001 2% @ 55 3 3YY 11.312%2% 7.00Fire 74001 2% @ 50 3 3YY 19.882%2% 9.00
Oakdale, City ofMisc Y70001 2% @ 55 1 YY Y Y 21.515%2% 7.00Misc 70002 2% @ 55 1 3YY Y Y 21.515%2% 7.00Misc Y70003 2.5% @ 55 1 YY Y Y 21.515%2% 8.00Misc 70004 2.5% @ 55 1 3YY Y Y 21.515%2% 8.00Misc 70101 2% @ 60 3 3YY Y Y 9.243%2% 7.00Fire 74001 3% @ 50 1 4YY Y Y 40.245%2% 9.00Police 75001 3% @ 50 1 3YY Y Y 40.245%2% 9.00
Oakland City Housing AuthorityMisc 70001 2% @ 55 1 Y 9.529%2% 7.00Police 75001 3% @ 55 1 YY 21.669%2% 9.00
Oakland Unified School DistrictPolice 75001 2% @ 50 3 3YY Y 30.669%2% 9.00
Oakland, City ofMisc 70001 2% @ 55 1 Y 27.295%2% 7.00Misc 70002 2.7% @ 55 1 Y 27.295%2% 8.00Misc Y70401 2% @ 55 3 27.295%2% 7.00Misc 70402 2% @ 55 3 27.295%2% 7.00Misc Y70403 2.7% @ 55 3 27.295%2% 8.00Misc 70404 2.7% @ 55 3 27.295%2% 8.00Fire 74001 3% @ 50 1 3Y Y 33.346%2% 9.00Police 75001 3% @ 50 1 Y 33.346%2% 9.00
Oakley, City ofMisc 70001 2% @ 55 1 4YY 16.687%2% 7.00Misc 70002 2.5% @ 55 1 4YY 16.687%2% 8.00Misc 70101 2% @ 60 1 4YY 8.486%2% 7.00
Oceano Community Services DistrictMisc 70001 2% @ 55 3 YY 9.949%2% 7.00Fire 74001 2% @ 55 3 8YY 0.000%2% 7.00
366

5. CalPERS Supplement - Summary of Contracting Agency Benefits - (Continued)
Final Pre- SickPost
Ordinary 1959Compensation SurvivorRetirement Leave
RetirementDisabilityBenefit
FinalContribution Rate
Employer Name Offset Option 2 Credit IncreaseSurvivor
BenefitFormula Period COLA Member EmployerCompensation
Allowance
Oceanside, City ofMisc 70001 2% @ 55 1 3Y Y 20.580%2% 7.00Misc Y70002 2% @ 55 1 Y Y 20.580%2% 7.00Misc Y70003 2% @ 55 1 Y 20.580%2% 7.00Misc 70004 2.7% @ 55 1 3Y Y 20.580%2% 8.00Misc Y70005 2.7% @ 55 1 Y Y 20.580%2% 8.00Misc 70401 2% @ 55 1 3Y 20.580%2% 7.00Fire 74001 3% @ 50 1 3Y Y Y 28.170%2% 9.00Police 75001 3% @ 50 1 3Y Y 28.170%2% 9.00Police 75401 3% @ 50 1 3Y Y 28.170%2% 9.00Safety 76001 3% @ 50 1 8Y Y 28.170%2% 9.00
Ojai Valley Sanitary DistrictMisc 70001 2% @ 55 3 3YY Y 12.789%2% 7.00Misc 70401 2% @ 55 3 YY Y 12.789%2% 7.00
Ojai, City ofMisc Y70001 2% @ 55 1 YY 16.819%2% 7.00Misc 70002 2% @ 55 1 YY 16.819%2% 7.00Misc Y70101 2% @ 60 1 YY 8.486%2% 7.00Police Y75001 1/2 @ 55 3 YY 0.000%2% varies
Olcese Water DistrictMisc 70001 2% @ 60 3 YY 0.000%2% 7.00
Olivenhain Municipal Water DistrictMisc Y70001 2% @ 55 3 YY 14.083%2% 7.00Misc 70002 2% @ 55 3 YY 14.083%2% 7.00Misc Y70003 2.5% @ 55 3 YY 14.083%2% 8.00
OmnitransMisc 70001 2% @ 55 1 Y 10.666%2% 7.00
Ontario, City ofMisc 70001 2% @ 55 1 YY 12.942%2% 7.00Misc Y70002 2% @ 55 1 YY 12.942%2% 7.00Misc Y70003 2.5% @ 55 1 YY 12.942%2% 8.00Misc 70004 2.5% @ 55 1 YY 12.942%2% 8.00Fire 74001 3% @ 50 1 4YY Y 26.909%2% 9.00Police 75001 3% @ 50 1 4YY Y 32.088%2% 9.00
Ophir Hill Fire Protection DistrictMisc 70001 2% @ 60 3 3YY 8.395%2% 7.00Fire 74001 2% @ 55 3 3YY 15.618%2% 7.00
Orange County Health Authority (Caloptima)
Misc 70001 2% @ 60 3 3 8.413%3% 7.00Orange County Transportation Commission
Misc 70001 2% @ 55 3 3YY 0.000%2% 7.00Orange County Vector Control District
Misc 70001 2% @ 55 1 4YY 10.781%2% 7.00Orange Cove Fire Protection District of Fresno and Tulare Counties
Fire 74001 2% @ 55 3 YY 0.000%2% 7.00Orange Cove, City of
Misc Y70001 2% @ 60 3 YY 6.565%2% 7.00Misc 70002 2% @ 60 3 YY 6.565%2% 7.00Police Y75001 2% @ 50 1 YY 12.398%2% 9.00
Orange, City ofMisc 70001 2% @ 55 1 3Y 20.063%2% 7.00Misc Y70002 2% @ 55 1 Y 20.063%2% 7.00Misc 70003 2.7% @ 55 1 3Y 20.063%2% 8.00Misc Y70004 2.7% @ 55 1 Y 20.063%2% 8.00Fire 74001 3% @ 50 1 3Y 30.113%2% 9.00Police 75001 3% @ 50 1 3Y 30.113%2% 9.00
Orchard Dale County Water DistrictMisc Y70001 2% @ 55 1 YY Y 27.327%2% 7.00Misc 70002 2% @ 55 1 YY Y 27.327%2% 7.00Misc Y70003 2.7% @ 55 1 YY Y 27.327%2% 8.00
367

5. CalPERS Supplement - Summary of Contracting Agency Benefits - (Continued)
Final Pre- SickPost
Ordinary 1959Compensation SurvivorRetirement Leave
RetirementDisabilityBenefit
FinalContribution Rate
Employer Name Offset Option 2 Credit IncreaseSurvivor
BenefitFormula Period COLA Member EmployerCompensation
Allowance
Orland Cemetery DistrictMisc Y70001 2% @ 55 3 YY 15.797%2% 7.00
Orland, City ofMisc Y70001 2% @ 55 3 YY 15.064%2% 7.00Misc 70002 2% @ 55 3 YY 15.064%2% 7.00Misc Y70003 2.7% @ 55 3 YY 15.064%2% 8.00Police Y75001 3% @ 50 3 YY 25.168%2% 9.00
Oro Loma Sanitary DistrictMisc 70001 2% @ 55 1 YY Y Y 15.577%2% 7.00Misc 70002 2.5% @ 55 1 YY Y Y 15.577%2% 8.00
Orosi Public Utility DistrictMisc Y70001 2% @ 60 3 YY 14.146%2% 7.00
Oroville Cemetery DistrictMisc Y70001 2% @ 60 1 YY 8.394%2% 7.00
Oroville Mosquito Abatement DistrictMisc Y70001 2% @ 55 3 YY 10.749%2% 7.00
Oroville, City ofMisc 70001 2% @ 55 1 4YY Y Y 12.094%2% 7.00Misc Y70002 2% @ 55 1 YY Y Y 12.094%2% 7.00Fire 74001 2% @ 50 1 4YY Y Y 22.145%2% 9.00Fire 74002 2% @ 50 1 4YY Y Y 22.145%2% 9.00Police 75001 2% @ 50 1 4YY Y Y 22.145%2% 9.00Police 75002 2% @ 50 1 4YY Y Y 22.145%2% 9.00
Otay Water DistrictMisc Y70001 2% @ 55 1 Y 25.435%2% 7.00Misc 70002 2% @ 55 1 Y 25.435%2% 7.00Misc 70003 2.7% @ 55 1 Y 25.435%2% 8.00
Oxnard Harbor DistrictMisc Y70001 2% @ 55 3 YY Y 17.054%2% 7.00Misc Y70002 2.5% @ 55 3 YY Y 17.054%2% 8.00
Oxnard, City ofMisc 70001 2% @ 55 1 4Y 13.450%2% 7.00Misc 70401 2% @ 55 1 13.450%2% 7.00Misc Y70402 2% @ 55 1 4 13.450%2% 7.00Fire 74001 3% @ 50 1 4YY Y 36.070%2% 9.00Police 75001 3% @ 50 1 3Y Y 35.881%2% 9.00
Pacific Fire Protection DistrictMisc 70001 2% @ 60 3 2YY 0.000%2% 7.00
Pacific Grove, City ofMisc 70001 2% @ 55 1 4YY 11.438%2% 7.00Misc Y70002 2% @ 55 1 YY 11.438%2% 7.00Fire 74001 3% @ 50 1 4YY 27.352%2% 9.00Police 75001 3% @ 50 1 4YY 27.352%2% 9.00
Pacifica, City ofMisc 70001 2% @ 55 1 4Y Y 12.758%2% 7.00Misc Y70002 2% @ 55 1 Y 12.758%2% 7.00Misc 70003 2.5% @ 55 1 4Y Y 12.758%2% 8.00Misc Y70004 2.5% @ 55 1 Y 12.758%2% 8.00Fire 74001 3% @ 55 1 4YY 21.669%2% 9.00Police 75001 3% @ 50 1 4YY 26.149%2% 9.00
Padre Dam Municipal Water DistrictMisc Y70001 2% @ 55 1 Y 19.906%2% 7.00Misc 70002 2% @ 55 1 Y 19.906%2% 7.00Misc Y70003 3% @ 60 1 Y 19.906%2% 8.00Misc 70004 3% @ 60 1 Y 19.906%2% 8.00Misc Y70101 2.5% @ 55 1 Y 19.906%2% 8.00
Pajaro Valley Fire Protection AgencyFire 74001 2% @ 50 1 3YY 0.000%2% 9.00Fire 74401 2% @ 55 3 3YY 0.000%2% 7.00Fire 74402 2% @ 50 3 YY 0.000%2% 9.00
Pajaro Valley Public Cemetery DistrictMisc Y70001 2% @ 55 1 YY 17.006%2% 7.00
368

5. CalPERS Supplement - Summary of Contracting Agency Benefits - (Continued)
Final Pre- SickPost
Ordinary 1959Compensation SurvivorRetirement Leave
RetirementDisabilityBenefit
FinalContribution Rate
Employer Name Offset Option 2 Credit IncreaseSurvivor
BenefitFormula Period COLA Member EmployerCompensation
Allowance
Pajaro Valley Water Management AgencyMisc 70001 2% @ 55 1 YY 13.742%2% 7.00
Palm Desert, City ofMisc 70001 2% @ 55 1 2Y Y Y 26.548%2% 7.00Misc 70002 2.7% @ 55 1 2Y Y Y 26.548%2% 8.00
Palm Ranch Irrigation DistrictMisc 70001 2% @ 60 3 YY 0.158%2% 7.00
Palm Springs, City ofMisc 70001 2% @ 55 1 4Y 20.494%2% 7.00Misc Y70002 2% @ 55 1 Y 20.494%2% 7.00Misc 70003 2.7% @ 55 1 4Y 20.494%2% 8.00Misc Y70004 2.7% @ 55 1 Y 20.494%2% 8.00Fire 74001 3% @ 50 1 4Y Y 34.075%2% 9.00Police 75001 3% @ 50 1 4Y 34.075%2% 9.00Police 75101 3% @ 55 1 4Y 34.075%2% 9.00
Palmdale Water DistrictMisc Y70001 2% @ 55 1 YY 12.913%2% 7.00Misc 70002 2% @ 55 1 YY 12.913%2% 7.00
Palmdale, City ofMisc 70001 2% @ 55 1 3Y 27.689%2% 7.00Misc 70002 2.7% @ 55 1 3Y 27.689%2% 8.00Misc 70101 2% @ 60 1 3Y 27.689%2% 7.00
Palo Alto, City ofMisc 70001 2% @ 55 1 1 25.536%2% 7.00Misc 70002 2.7% @ 55 1 1 25.536%2% 8.00Misc 70101 2% @ 60 1 1 25.536%2% 7.00Fire 74001 3% @ 50 1 1Y 34.716%2% 9.00Fire 74002 3% @ 50 1 1Y 34.716%2% 9.00Police 75001 3% @ 50 1 1 34.716%2% 9.00
Palo Verde Valley District LibraryMisc Y70001 2% @ 60 3 YY 12.890%2% 7.00Misc 70002 2% @ 60 3 YY 12.890%2% 7.00
Palos Verdes Estates, City ofMisc 70001 2% @ 55 1 3YY 4.496%2% 7.00Fire 74001 1/2 @ 55 1 2YY 26.149%2% variesPolice 75001 3% @ 50 1 2YY 26.149%2% 9.00
Palos Verdes Library DistrictMisc Y70001 2% @ 55 1 YY 10.452%2% 7.00
Paradise Recreation and Park DistrictMisc Y70001 2% @ 55 3 YY 10.282%2% 7.00
Paradise, Town ofMisc 70001 2% @ 55 1 4YY 11.545%2% 7.00Misc 70101 2% @ 60 3 4YY 8.049%2% 7.00Fire 74001 3% @ 50 1 4YY Y 27.803%2% 9.00Fire 74101 3% @ 55 3 4YY Y 20.774%2% 9.00Police 75001 3% @ 50 1 4YY Y 27.803%2% 9.00Police 75101 3% @ 55 3 4YY Y 20.774%2% 9.00
Paramount, City ofMisc 70001 2% @ 55 1 Y Y 18.221%2% 7.00Misc 70002 2.5% @ 55 1 4Y Y Y 18.221%2% 8.00Police 75001 2% @ 55 1 YY Y Y 0.000%2% 7.00
Parlier, City ofMisc Y70001 2% @ 55 3 YY 20.426%2% 7.00Police Y75001 2% @ 55 3 YY 17.633%2% 7.00
Pasadena City College BookstoreMisc Y70001 2% @ 55 1 YY Y 11.603%2% 7.00
Pasadena Unified School DistrictPolice 75001 3% @ 50 1 4YY Y 0.000%2% 9.00
369
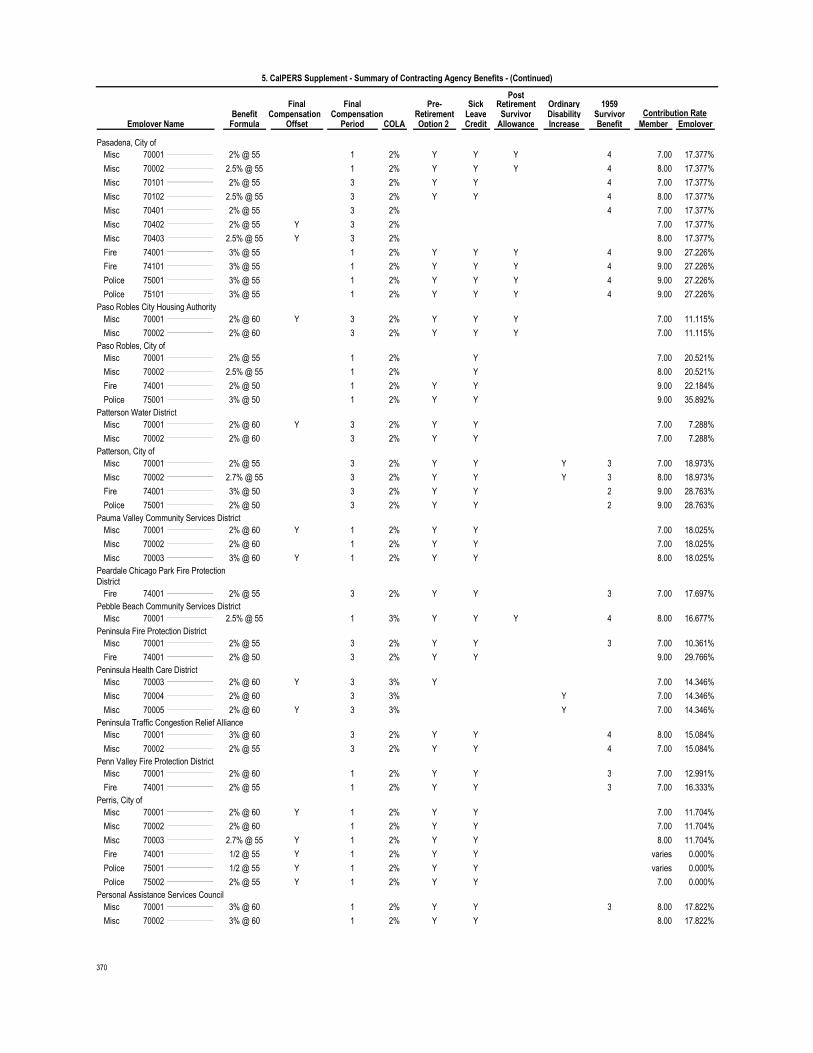
5. CalPERS Supplement - Summary of Contracting Agency Benefits - (Continued)
Final Pre- SickPost
Ordinary 1959Compensation SurvivorRetirement Leave
RetirementDisabilityBenefit
FinalContribution Rate
Employer Name Offset Option 2 Credit IncreaseSurvivor
BenefitFormula Period COLA Member EmployerCompensation
Allowance
Pasadena, City ofMisc 70001 2% @ 55 1 4YY Y 17.377%2% 7.00Misc 70002 2.5% @ 55 1 4YY Y 17.377%2% 8.00Misc 70101 2% @ 55 3 4YY 17.377%2% 7.00Misc 70102 2.5% @ 55 3 4YY 17.377%2% 8.00Misc 70401 2% @ 55 3 4 17.377%2% 7.00Misc Y70402 2% @ 55 3 17.377%2% 7.00Misc Y70403 2.5% @ 55 3 17.377%2% 8.00Fire 74001 3% @ 55 1 4YY Y 27.226%2% 9.00Fire 74101 3% @ 55 1 4YY Y 27.226%2% 9.00Police 75001 3% @ 55 1 4YY Y 27.226%2% 9.00Police 75101 3% @ 55 1 4YY Y 27.226%2% 9.00
Paso Robles City Housing AuthorityMisc Y70001 2% @ 60 3 YY Y 11.115%2% 7.00Misc 70002 2% @ 60 3 YY Y 11.115%2% 7.00
Paso Robles, City ofMisc 70001 2% @ 55 1 Y 20.521%2% 7.00Misc 70002 2.5% @ 55 1 Y 20.521%2% 8.00Fire 74001 2% @ 50 1 YY 22.184%2% 9.00Police 75001 3% @ 50 1 YY 35.892%2% 9.00
Patterson Water DistrictMisc Y70001 2% @ 60 3 YY 7.288%2% 7.00Misc 70002 2% @ 60 3 YY 7.288%2% 7.00
Patterson, City ofMisc 70001 2% @ 55 3 3YY Y 18.973%2% 7.00Misc 70002 2.7% @ 55 3 3YY Y 18.973%2% 8.00Fire 74001 3% @ 50 3 2YY 28.763%2% 9.00Police 75001 2% @ 50 3 2YY 28.763%2% 9.00
Pauma Valley Community Services DistrictMisc Y70001 2% @ 60 1 YY 18.025%2% 7.00Misc 70002 2% @ 60 1 YY 18.025%2% 7.00Misc Y70003 3% @ 60 1 YY 18.025%2% 8.00
Peardale Chicago Park Fire Protection District
Fire 74001 2% @ 55 3 3YY 17.697%2% 7.00Pebble Beach Community Services District
Misc 70001 2.5% @ 55 1 4YY Y 16.677%3% 8.00Peninsula Fire Protection District
Misc 70001 2% @ 55 3 3YY 10.361%2% 7.00Fire 74001 2% @ 50 3 YY 29.766%2% 9.00
Peninsula Health Care DistrictMisc Y70003 2% @ 60 3 Y 14.346%3% 7.00Misc 70004 2% @ 60 3 Y 14.346%3% 7.00Misc Y70005 2% @ 60 3 Y 14.346%3% 7.00
Peninsula Traffic Congestion Relief AllianceMisc 70001 3% @ 60 3 4YY 15.084%2% 8.00Misc 70002 2% @ 55 3 4YY 15.084%2% 7.00
Penn Valley Fire Protection DistrictMisc 70001 2% @ 60 1 3YY 12.991%2% 7.00Fire 74001 2% @ 55 1 3YY 16.333%2% 7.00
Perris, City ofMisc Y70001 2% @ 60 1 YY 11.704%2% 7.00Misc 70002 2% @ 60 1 YY 11.704%2% 7.00Misc Y70003 2.7% @ 55 1 YY 11.704%2% 8.00Fire Y74001 1/2 @ 55 1 YY 0.000%2% variesPolice Y75001 1/2 @ 55 1 YY 0.000%2% variesPolice Y75002 2% @ 55 1 YY 0.000%2% 7.00
Personal Assistance Services CouncilMisc 70001 3% @ 60 1 3YY 17.822%2% 8.00Misc 70002 3% @ 60 1 YY 17.822%2% 8.00
370

5. CalPERS Supplement - Summary of Contracting Agency Benefits - (Continued)
Final Pre- SickPost
Ordinary 1959Compensation SurvivorRetirement Leave
RetirementDisabilityBenefit
FinalContribution Rate
Employer Name Offset Option 2 Credit IncreaseSurvivor
BenefitFormula Period COLA Member EmployerCompensation
Allowance
Petaluma, City ofMisc 70001 2% @ 55 1 3Y 14.488%2% 7.00Fire 74001 3% @ 50 1 4Y Y 37.742%2% 9.00Fire 74002 3% @ 50 1 4Y Y 37.742%2% 9.00Police 75001 3% @ 50 1 4Y 37.742%2% 9.00Police 75002 3% @ 50 1 4Y 37.742%2% 9.00
Phelan Pinon Hills Community Services District
Misc 70001 2.5% @ 55 3 4YY 11.553%2% 8.00Pico Rivera, City of
Misc 70001 2% @ 55 1 4Y 19.673%2% 7.00Misc 70002 2.5% @ 55 1 4YY 19.673%2% 8.00
Pico Water DistrictMisc Y70001 2% @ 55 1 YY 5.239%5% 7.00Misc 70002 2% @ 55 1 YY 5.239%5% 7.00
Piedmont, City ofMisc Y70001 2% @ 60 1 YY 23.788%2% 7.00Misc 70002 2% @ 60 1 YY 23.788%2% 7.00Misc Y70003 3% @ 60 1 YY 23.788%2% 8.00Fire 74001 3% @ 50 1 4YY Y 45.956%2% 9.00Police 75001 3% @ 50 1 YY Y 45.956%2% 9.00
Pine Cove Water DistrictMisc 70001 2% @ 55 1 YY 21.761%2% 7.00Misc 70002 2.7% @ 55 1 YY 21.761%2% 8.00
Pine Grove Mosquito Abatement DistrictMisc 70002 2% @ 55 3 YY 8.418%2% 7.00
Pinedale County Water DistrictMisc Y70001 2% @ 60 1 YY Y Y 10.434%2% 7.00Misc 70002 2% @ 60 1 YY Y Y 10.434%2% 7.00Misc 70003 2% @ 60 1 YY Y Y 10.434%2% 7.00
Pinole, City ofMisc 70001 2% @ 55 1 3YY 16.874%2% 7.00Misc Y70002 2% @ 55 1 YY 16.874%2% 7.00Misc 70003 2.5% @ 55 1 3YY 16.874%2% 8.00Misc Y70004 2.5% @ 55 1 YY 16.874%2% 8.00Fire 74001 3% @ 55 1 3YY 22.103%2% 9.00Police 75001 3% @ 55 1 3YY 22.103%2% 9.00
Pioneer Cemetery DistrictMisc Y70001 2% @ 55 3 YY 6.866%2% 7.00Misc 70002 2% @ 55 3 YY 6.866%2% 7.00
Pismo Beach, City ofMisc Y70001 2% @ 55 1 YY 18.043%2% 7.00Misc Y70002 2.5% @ 55 1 YY 18.043%2% 8.00Fire Y74001 2% @ 50 3 YY 51.725%2% 9.00Police Y75001 3% @ 50 1 YY 45.658%2% 9.00
Pittsburg, City ofMisc Y70001 2% @ 55 1 Y 12.711%3% 7.00Misc Y70101 2% @ 60 3 Y 12.711%2% 7.00Police 75001 3% @ 50 1 4YY 28.340%3% 9.00
Pixley Irrigation DistrictMisc Y70001 2% @ 60 1 YY Y Y 6.013%2% 7.00Misc 70002 2% @ 60 1 4YY Y Y 6.013%2% 7.00
Placentia, City ofMisc 70001 2% @ 55 1 4YY Y 10.781%2% 7.00Misc Y70002 2% @ 55 1 YY Y 10.781%2% 7.00Fire 74001 2% @ 55 3 1YY Y 49.161%2% 7.00Police 75001 3% @ 50 1 4YY Y 49.161%2% 9.00
Placer County Cemetery District No. 1Misc Y70001 2% @ 55 3 YY 10.282%2% 7.00
Placer County Resource Conservation District
Misc 70001 2% @ 55 3 YY 12.874%2% 7.00
371

5. CalPERS Supplement - Summary of Contracting Agency Benefits - (Continued)
Final Pre- SickPost
Ordinary 1959Compensation SurvivorRetirement Leave
RetirementDisabilityBenefit
FinalContribution Rate
Employer Name Offset Option 2 Credit IncreaseSurvivor
BenefitFormula Period COLA Member EmployerCompensation
Allowance
Placer County Transportation CommissionMisc 70001 2% @ 55 1 YY Y 14.385%2% 7.00
Placer County Water AgencyMisc Y70001 2% @ 55 1 20.011%2% 7.00Misc 70002 2% @ 55 1 20.011%2% 7.00Misc Y70003 2.7% @ 55 1 20.011%2% 8.00Misc 70004 2.7% @ 55 1 20.011%2% 8.00
Placer Hills Fire Protection DistrictMisc 70001 2% @ 55 3 3YY 13.891%2% 7.00Fire 74001 2% @ 55 3 YY 20.153%2% 7.00
Placer Mosquito and Vector Control DistrictMisc 70001 2% @ 55 3 4YY 10.282%2% 7.00
Placer, County ofMisc 70001 2% @ 55 1 Y 20.790%2% 7.00Misc Y70002 2% @ 55 1 Y 20.790%2% 7.00Misc Y70003 2.5% @ 55 1 Y 20.790%2% 8.00Misc Y70101 2% @ 55 3 Y 20.790%2% 7.00Peace Y77001 3% @ 50 1 Y 30.378%2% 9.00Peace Y77101 3% @ 55 3 Y 30.378%2% 9.00
Placerville, City ofMisc Y70001 2% @ 55 3 YY Y 21.260%2% 7.00Misc 70002 2% @ 55 3 YY Y 21.260%2% 7.00Misc Y70003 2.5% @ 55 3 YY Y 21.260%2% 8.00Misc 70004 2.5% @ 55 3 YY Y 21.260%2% 8.00Police Y75001 3% @ 50 3 YY Y 30.701%2% 9.00Police 75002 3% @ 50 3 YY Y 30.701%2% 9.00
Planning & Service Area II, Area Agency on Aging
Misc 70001 2% @ 60 1 YY Y 0.000%2% 7.00Pleasant Hill Recreation and Park District
Misc Y70001 2% @ 55 1 YY 13.463%2% 7.00Pleasant Hill, City of
Misc 70001 2% @ 55 1 3YY 14.311%2% 7.00Fire 74001 3% @ 50 1 3YY 26.149%2% 9.00Police 75001 3% @ 50 1 3YY 26.149%2% 9.00
Pleasant Hill-Martinez Joint Facilities Agency
Misc 70001 2% @ 55 1 3YY 10.781%2% 7.00Pleasant Valley County Water District
Misc Y70001 2% @ 60 3 YY 1.487%2% 7.00Misc 70002 2% @ 60 3 YY 1.487%2% 7.00
Pleasant Valley Recreation and Park District
Misc Y70001 2% @ 60 3 YY 14.083%2% 7.00Misc 70002 2% @ 60 3 YY 14.083%2% 7.00Misc Y70003 2.5% @ 55 3 YY 14.083%2% 8.00Misc Y70101 2% @ 60 3 YY 8.049%2% 7.00
Pleasanton, City ofMisc 70001 2% @ 55 1 3Y 24.821%2% 7.00Misc 70002 2.7% @ 55 1 3Y 24.821%2% 8.00Misc 70401 2.7% @ 55 1 4Y 24.821%2% 8.00Fire 74001 3% @ 50 1 4YY 35.559%2% 9.00Fire 74101 3% @ 50 1 4YY 35.559%2% 9.00Fire 74401 3% @ 50 1 3Y 35.559%2% 9.00Police 75001 3% @ 50 1 1YY 26.149%2% 9.00
Plumas Eureka Community Services District
Misc 70001 2% @ 55 3 4YY 24.243%2% 7.00Plumas Local Agency Formation Commission
Misc 70002 2% @ 55 1 YY 0.000%3% 7.00
372

5. CalPERS Supplement - Summary of Contracting Agency Benefits - (Continued)
Final Pre- SickPost
Ordinary 1959Compensation SurvivorRetirement Leave
RetirementDisabilityBenefit
FinalContribution Rate
Employer Name Offset Option 2 Credit IncreaseSurvivor
BenefitFormula Period COLA Member EmployerCompensation
Allowance
Plumas, County ofMisc 70001 2% @ 55 1 3 14.844%2% 7.00Misc Y70002 2% @ 55 1 14.844%2% 7.00Fire 74001 1/2 @ 55 3 1YY Y 217.467%2% variesPeace 77001 2% @ 50 3 4YY Y 217.467%2% 9.00Police 78001 3% @ 55 3 4YY Y 27.992%2% 9.00
Pomerado Cemetery DistrictMisc Y70001 2% @ 55 3 YY 35.947%2% 7.00
Pomona Valley Transportation AuthorityMisc 70001 2% @ 60 3 3YY 7.134%2% 7.00
Pomona, Cal Poly, Kellogg Unit Foundation, Inc.
Misc Y70001 2% @ 55 3 YY 10.016%2% 5.00Misc 70002 2% @ 55 3 YY 10.016%2% 6.00Misc Y70101 2% @ 60 3 YY 8.049%2% 7.00
Pomona, California State Polytechnic University, Associated Students, Inc.
Misc 70001 2% @ 60 3 1YY 7.547%2% 6.00Pomona, City of
Misc 70001 2% @ 55 1 1Y Y 14.890%2% 7.00Misc Y70002 2% @ 55 1 Y Y 14.890%2% 7.00Misc 70101 2% @ 60 3 1 14.890%2% 7.00Fire 74001 2% @ 50 1 1Y 36.657%2% 9.00Police 75001 3% @ 50 1 1Y Y 36.657%2% 9.00Police 75002 3% @ 50 1 1Y Y 36.657%2% 9.00Police 75101 3% @ 55 1 1Y Y 36.657%2% 9.00
Port Hueneme, City ofMisc Y70001 2% @ 55 1 16.308%2% 7.00Misc 70002 2% @ 55 1 16.308%2% 7.00Misc Y70003 2.7% @ 55 1 16.308%2% 8.00Misc Y70401 2% @ 55 3 16.308%2% 7.00Misc 70402 2% @ 55 3 16.308%2% 7.00Fire Y74001 2% @ 55 3 YY 21.669%2% 7.00Police Y75001 3% @ 55 1 YY 21.669%2% 9.00
Port San Luis Harbor DistrictMisc Y70001 2% @ 55 3 YY 15.064%2% 7.00Misc Y70002 2.7% @ 55 3 YY 15.064%2% 8.00Police Y75001 3% @ 50 3 YY 25.168%2% 9.00
Porter Vista Public Utility DistrictMisc Y70001 2% @ 60 3 YY 14.986%2% 7.00
Porterville Irrigation DistrictMisc Y70001 2% @ 60 3 YY 2.630%2% 7.00Misc 70002 2% @ 60 3 YY 2.630%2% 7.00
Porterville Public Cemetery DistrictMisc Y70001 2% @ 60 3 YY 4.338%2% 7.00Misc 70002 2% @ 60 3 YY 4.338%2% 7.00
Porterville, City ofMisc 70001 2% @ 55 1 4Y Y 22.995%2% 7.00Misc 70002 2.7% @ 55 1 4Y Y 22.995%2% 8.00Fire 74001 3% @ 55 1 4YY 31.234%2% 9.00Police 75001 3% @ 55 1 4YY 31.234%2% 9.00
Portola Valley, Town ofMisc Y70001 2% @ 55 3 YY 10.282%2% 7.00Misc 70002 2% @ 60 3 YY 10.282%2% 7.00
Portola, City ofMisc Y70001 2% @ 60 3 YY 7.319%2% 7.00Misc Y70002 2.7% @ 55 3 YY 7.319%2% 8.00
373

5. CalPERS Supplement - Summary of Contracting Agency Benefits - (Continued)
Final Pre- SickPost
Ordinary 1959Compensation SurvivorRetirement Leave
RetirementDisabilityBenefit
FinalContribution Rate
Employer Name Offset Option 2 Credit IncreaseSurvivor
BenefitFormula Period COLA Member EmployerCompensation
Allowance
Poway, City ofMisc 70001 2% @ 55 1 8Y 15.521%2% 7.00Misc Y70401 2% @ 55 1 3Y 15.521%2% 7.00Misc 70402 2% @ 55 1 8Y 15.521%2% 7.00Misc Y70403 2% @ 55 1 Y 15.521%2% 7.00Misc 70404 2% @ 55 1 8Y 15.521%2% 7.00Fire 74001 3% @ 50 3 8YY 25.168%2% 9.00Fire Y74401 3% @ 50 3 YY 25.168%2% 9.00Fire 74402 3% @ 50 3 8YY 25.168%2% 9.00
Public Agency Risk Sharing Authority of California
Misc 70001 2% @ 55 1 3YY Y 16.541%5% 7.00Misc 70002 2.5% @ 55 1 3YY Y 16.541%5% 8.00
Public Entity Risk Management AuthorityMisc 70001 2% @ 55 1 3YY Y 16.707%2% 7.00Misc 70002 2.7% @ 55 1 3YY Y 16.707%2% 8.00
Public Transportation Services CorporationMisc 70001 2% @ 60 3 3 9.100%2% 7.00Misc 70401 2% @ 60 3 3 9.100%2% 7.00
Pupil Transportation CooperativeMisc 70001 2% @ 55 1 2Y Y 10.146%2% 7.00Misc Y70002 2% @ 55 1 Y Y 10.146%2% 7.00
Purissima Hills Water DistrictMisc Y70001 2% @ 60 3 YY Y 4.269%2% 7.00Misc 70002 2% @ 60 3 YY Y 4.269%2% 7.00
Quartz Hill Water DistrictMisc Y70001 2% @ 55 1 YY 11.537%5% 7.00Misc 70002 2% @ 55 1 YY 11.537%5% 7.00
Quincy Community Services DistrictMisc 70001 2% @ 55 3 3YY 17.138%2% 7.00Misc 70401 2% @ 55 3 3YY 17.138%2% 7.00
Rainbow Municipal Water DistrictMisc 70001 2% @ 55 1 YY 14.660%2% 7.00Misc 70002 2.5% @ 55 1 YY 14.660%2% 8.00
Ramona Municipal Water DistrictMisc 70001 2% @ 55 1 YY Y 26.651%2% 7.00Misc 70002 3% @ 60 1 YY Y 26.651%2% 8.00Fire 74001 2% @ 50 1 YY Y 0.000%2% 9.00
Rancho Adobe Fire Protection DistrictMisc 70001 2% @ 55 1 YY Y 14.676%2% 7.00Misc 70002 2.7% @ 55 1 YY Y 14.676%2% 8.00Misc 70401 2% @ 55 1 YY Y 14.676%2% 7.00Misc 70402 2% @ 55 1 YY Y 14.676%2% 7.00Fire 74001 2% @ 50 1 YY Y 22.145%2% 9.00Fire 74401 2% @ 50 1 YY Y 22.145%2% 9.00Fire 74402 2% @ 50 1 YY Y 22.145%2% 9.00
Rancho California Water DistrictMisc 70001 2% @ 55 1 2 17.669%2% 7.00Misc 70002 2.5% @ 55 1 2 17.669%2% 8.00Misc 70003 2.7% @ 55 1 2 17.669%2% 8.00
Rancho Cordova, City ofMisc 70001 2% @ 55 3 8YY 15.064%2% 7.00Misc 70002 2.7% @ 55 3 8YY 15.064%2% 8.00
Rancho Cucamonga Fire Protection DistrictMisc 70001 2% @ 55 1 4YY 14.660%2% 7.00Misc 70002 2.5% @ 55 1 4YY 14.660%2% 8.00Misc 70101 2% @ 55 3 4YY 10.282%2% 7.00Misc 70401 2% @ 55 1 4YY 14.660%2% 7.00Fire 74001 3% @ 50 1 4YY 26.149%2% 9.00Fire 74101 3% @ 55 3 4YY 20.774%2% 9.00Fire 74401 3% @ 50 1 4YY 26.149%2% 9.00Fire 74402 3% @ 50 1 4YY 26.149%2% 9.00
374

5. CalPERS Supplement - Summary of Contracting Agency Benefits - (Continued)
Final Pre- SickPost
Ordinary 1959Compensation SurvivorRetirement Leave
RetirementDisabilityBenefit
FinalContribution Rate
Employer Name Offset Option 2 Credit IncreaseSurvivor
BenefitFormula Period COLA Member EmployerCompensation
Allowance
Rancho Cucamonga, City ofMisc 70001 2% @ 55 1 4Y 13.346%2% 7.00Misc 70002 2.5% @ 55 1 4Y 13.346%2% 8.00Misc 70101 2% @ 55 3 4Y 13.346%2% 7.00
Rancho Mirage, City ofMisc 70001 2% @ 55 1 4YY 21.894%2% 7.00Misc 70002 2.5% @ 55 1 4YY 21.894%2% 8.00
Rancho Murieta Community Services District
Misc 70001 2% @ 55 1 3YY 12.608%2% 7.00Rancho Palos Verdes, City of
Misc 70001 2% @ 55 1 4YY 14.660%2% 7.00Misc 70002 2.5% @ 55 1 4YY 14.660%2% 8.00
Rancho Santa Fe Fire Protection DistrictMisc 70001 2% @ 55 1 4YY 15.685%2% 7.00Misc 70002 2.7% @ 55 1 4YY 15.685%2% 8.00Fire 74001 3% @ 50 1 4YY 26.149%2% 9.00Fire 74002 3% @ 50 1 4YY 26.149%2% 9.00
Rancho Santa Margarita, City ofMisc 70001 2.5% @ 55 3 8YY 17.666%3% 8.00Misc 70101 2% @ 60 3 8YY 8.818%3% 7.00
Rancho Santiago Community College Associated Students
Misc Y70001 2% @ 55 1 YY 0.000%2% 7.00Rancho Simi Recreation & Park District
Misc Y70001 2% @ 55 1 11.736%2% 7.00Misc 70002 2% @ 55 1 11.736%2% 7.00Misc Y70101 2% @ 60 3 11.736%2% 7.00
Reclamation District No. 1000Misc Y70001 2% @ 55 1 YY 15.483%2% 7.00Misc 70002 2% @ 60 1 YY 15.483%2% 7.00
Reclamation District No. 1001Misc Y70001 2% @ 55 1 YY 4.934%2% 7.00Misc 70002 2% @ 55 1 YY 4.934%2% 7.00
Reclamation District No. 1660Misc Y70001 2% @ 60 3 YY 0.000%2% 7.00Misc 70002 2% @ 60 3 YY 0.000%2% 7.00
Reclamation District No. 3Misc Y70001 2% @ 60 3 YY 7.556%2% 7.00
Reclamation District No. 833Misc Y70001 2% @ 60 1 YY 13.087%2% 7.00Misc 70002 2% @ 60 3 YY 13.087%2% 7.00Misc Y70003 2.7% @ 55 1 YY 13.087%2% 8.00
Reclamation District No. 999Misc Y70001 2% @ 60 3 YY 12.946%2% 7.00
Red Bluff Cemetery DistrictMisc 70001 2% @ 60 1 YY 20.666%2% 7.00
Red Bluff, City ofMisc Y70001 2% @ 55 1 YY 6.679%2% 7.00Misc 70002 2% @ 55 1 YY 6.679%2% 7.00Misc Y70101 2% @ 55 1 YY 6.679%2% 7.00Misc 70102 2% @ 55 1 YY 6.679%2% 7.00Fire Y74001 2% @ 50 1 YY 20.742%2% 9.00Police Y75001 3% @ 50 1 YY 26.149%2% 9.00Police Y75102 3% @ 55 1 YY 21.669%2% 9.00
375

5. CalPERS Supplement - Summary of Contracting Agency Benefits - (Continued)
Final Pre- SickPost
Ordinary 1959Compensation SurvivorRetirement Leave
RetirementDisabilityBenefit
FinalContribution Rate
Employer Name Offset Option 2 Credit IncreaseSurvivor
BenefitFormula Period COLA Member EmployerCompensation
Allowance
Redding, City ofMisc 70001 2% @ 55 1 8Y Y 18.482%2% 7.00Misc Y70002 2% @ 55 1 Y Y 18.482%2% 7.00Misc Y70401 2% @ 55 1 Y 18.482%2% 7.00Fire 74001 3% @ 50 1 4Y Y Y 40.704%2% 9.00Fire 74002 3% @ 50 1 4Y Y Y 40.704%2% 9.00Fire Y74401 3% @ 50 1 Y Y Y 40.704%2% 9.00Police 75001 3% @ 50 1 4Y Y Y 40.704%2% 9.00Police 75002 3% @ 50 1 4Y Y Y 40.704%2% 9.00Police 75003 3% @ 50 1 4Y Y Y 40.704%2% 9.00
Redlands, City ofMisc 70001 2% @ 55 1 Y 15.083%2% 7.00Misc Y70002 2% @ 55 1 Y Y 15.083%2% 7.00Fire 74001 3% @ 50 1 YY Y 28.370%2% 9.00Police 75001 3% @ 50 1 YY Y 28.078%2% 9.00
Redondo Beach, City ofMisc 70001 2% @ 55 1 1Y Y 14.938%2% 7.00Misc Y70002 2% @ 55 1 YY Y 14.938%2% 7.00Misc 70003 2% @ 55 1 1Y Y 14.938%2% 7.00Misc Y70004 2% @ 55 1 Y Y 14.938%2% 7.00Misc 70005 2% @ 55 1 1Y Y 14.938%2% 7.00Misc Y70006 2% @ 55 1 Y Y 14.938%2% 7.00Misc 70007 2% @ 55 1 1Y Y 14.938%2% 7.00Misc Y70008 2% @ 55 1 YY Y 14.938%2% 7.00Fire 74001 3% @ 55 1 4YY Y 40.631%2% 9.00Fire 74002 3% @ 55 1 4YY Y 40.631%2% 9.00Fire 74003 3% @ 55 1 4Y Y 40.631%2% 9.00Police 75001 3% @ 50 1 4YY Y 40.631%2% 9.00Police 75002 3% @ 50 1 4YY Y 40.631%2% 9.00Police 75003 3% @ 50 1 4Y Y 40.631%2% 9.00
Redwood City, City ofMisc 70001 2% @ 55 1 3 20.856%2% 7.00Misc 70002 2.7% @ 55 1 3 20.856%2% 8.00Fire 74001 3% @ 50 1 4YY Y 36.316%2% 9.00Police 75001 3% @ 50 1 4YY Y 36.316%2% 9.00
Redwood Coast Regional CenterMisc 70001 2% @ 60 3 8 13.472%2% 7.00
Redwood Empire Municipal Insurance FundMisc 70001 2% @ 55 1 4YY 25.099%5% 7.00Misc 70002 2.7% @ 55 1 4YY 25.099%5% 8.00
Redwood Empire School Insurance GroupMisc 70001 2% @ 55 1 3YY Y 19.429%2% 7.00Misc 70002 2.5% @ 55 1 3YY Y 19.429%2% 8.00
Reedley Cemetery DistrictMisc Y70001 2% @ 60 3 YY 0.000%2% 7.00
Reedley, City ofMisc Y70001 2% @ 55 3 YY 11.961%2% 7.00Misc 70002 2% @ 55 3 YY 11.961%2% 7.00Fire Y74001 3% @ 55 3 YY 21.928%2% 9.00Police Y75002 3% @ 55 3 YY 27.195%2% 9.00
Regional Center of Orange CountyMisc 70001 2% @ 55 3 4Y Y 10.302%2% 7.00
Regional Center of the East BayMisc 70001 2% @ 55 3 8Y 15.211%2% 7.00
Regional Council of Rural CountiesMisc 70001 2% @ 55 1 3YY 17.670%2% 7.00Misc 70002 2.5% @ 55 1 3YY 17.670%2% 8.00
Rescue Fire Protection DistrictMisc 70001 2% @ 55 1 3YY Y 0.000%2% 7.00Fire 74001 3% @ 55 1 4YY Y 33.181%2% 9.00
Resort Improvement District No. 1Misc 70001 2% @ 60 3 YY 11.178%2% 7.00
376

5. CalPERS Supplement - Summary of Contracting Agency Benefits - (Continued)
Final Pre- SickPost
Ordinary 1959Compensation SurvivorRetirement Leave
RetirementDisabilityBenefit
FinalContribution Rate
Employer Name Offset Option 2 Credit IncreaseSurvivor
BenefitFormula Period COLA Member EmployerCompensation
Allowance
Resource Conservation District of the Santa Monica Mountains
Misc Y70001 2% @ 55 3 YY 10.282%2% 7.00Rialto, City of
Misc 70001 2% @ 55 1 4Y Y Y 23.585%2% 7.00Misc 70002 2.7% @ 55 1 4Y Y Y 23.585%2% 8.00Fire 74001 3% @ 50 1 4Y Y 42.168%4% 9.00Police 75001 3% @ 50 1 Y 42.168%4% 9.00
Richardson Bay Sanitary DistrictMisc 70001 2% @ 55 1 YY Y 5.055%5% 7.00Misc 70002 3% @ 60 1 YY Y 5.055%5% 8.00
Richmond, City ofMisc 70001 2% @ 55 1 1Y Y 17.371%2% 7.00Misc 70002 2.7% @ 55 1 1Y Y 17.371%2% 8.00Misc 70401 2% @ 55 3 1Y Y 17.371%2% 7.00Misc 70402 2% @ 55 3 Y Y 17.371%2% 7.00Misc 70403 2% @ 55 3 17.371%2% 7.00Fire 74001 3% @ 55 1 1Y Y 26.085%2% 9.00Police 75001 3% @ 50 1 1Y Y 26.085%2% 9.00
Ridgecrest, City ofMisc Y70001 2% @ 55 1 YY 18.226%2% 7.00Misc 70002 2% @ 55 1 YY 18.226%2% 7.00Misc Y70003 2.7% @ 55 1 YY 18.226%2% 8.00Misc 70004 2.7% @ 55 1 YY 18.226%2% 8.00Police 75001 2% @ 50 1 YY 27.407%2% 9.00
Rincon Del Diablo Municipal Water DistrictMisc 70001 2% @ 55 1 4YY Y Y 12.094%2% 7.00Misc Y70002 2% @ 55 1 YY Y Y 12.094%2% 7.00Fire 74001 2% @ 50 1 3YY Y 0.000%2% 9.00Fire 74101 2% @ 55 3 3YY Y 0.000%2% 7.00
Rincon Valley Fire Protection DistrictMisc 70001 2% @ 55 1 4YY 6.128%2% 7.00Misc 70002 2.7% @ 55 1 4YY 6.128%2% 8.00Fire 74001 3% @ 55 1 4YY 21.669%2% 9.00Fire 74401 3% @ 55 3 YY 21.669%2% 9.00
Rio Alto Water DistrictMisc Y70001 2% @ 60 1 YY 15.105%2% 7.00Misc 70002 2% @ 60 1 YY 15.105%2% 7.00Misc 70003 2% @ 60 1 YY 15.105%2% 7.00
Rio Linda Water DistrictMisc 70001 2% @ 55 3 YY 17.106%2% 7.00
Rio Vista Cemetery DistrictMisc Y70001 2% @ 60 3 YY 0.000%2% 7.00
Rio Vista, City ofMisc Y70001 2% @ 55 1 YY 20.419%2% 7.00Fire Y74001 2% @ 50 1 YY 37.232%2% 9.00Police Y75001 2% @ 50 1 YY 37.232%2% 9.00
Ripon, City ofPolice Y75001 3% @ 50 3 YY 32.111%2% 9.00
Riverbank City Housing AuthorityMisc 70001 2% @ 60 3 3YY 11.239%2% 7.00
Riverbank, City ofMisc 70001 2% @ 55 3 YY 12.576%2% 7.00Misc Y70002 2% @ 55 3 YY 12.576%2% 7.00Misc 70101 2% @ 60 3 YY 8.049%2% 7.00Police 75001 1/2 @ 55 3 YY 0.000%2% variesPolice 75002 2% @ 55 3 YY 0.000%2% 7.00
Riverside County Air Pollution Control District
Misc 70001 2% @ 60 3 1YY 0.000%2% 7.00Riverside County Citrus Pest Control District No. 2
Misc Y70001 2% @ 60 3 YY 0.000%5% 7.00
377

5. CalPERS Supplement - Summary of Contracting Agency Benefits - (Continued)
Final Pre- SickPost
Ordinary 1959Compensation SurvivorRetirement Leave
RetirementDisabilityBenefit
FinalContribution Rate
Employer Name Offset Option 2 Credit IncreaseSurvivor
BenefitFormula Period COLA Member EmployerCompensation
Allowance
Riverside County Flood Control and Water Conservation District
Misc 70001 2% @ 55 1 1Y 17.701%2% 7.00Misc Y70002 2% @ 55 1 Y 17.701%2% 7.00Misc Y70003 3% @ 60 1 Y 17.701%2% 8.00Misc 70101 2% @ 55 1 1Y 17.701%2% 7.00Misc Y70102 2% @ 55 1 Y 17.701%2% 7.00
Riverside County Law LibraryMisc Y70001 2% @ 55 1 YY 10.655%2% 7.00Misc 70002 2% @ 55 1 YY 10.655%2% 7.00
Riverside County Regional Park and Open Space District
Misc 70001 2% @ 55 1 1YY Y 17.441%2% 7.00Misc Y70002 2% @ 55 1 YY Y 17.441%2% 7.00Misc 70003 3% @ 60 1 1YY Y 17.441%2% 8.00Misc Y70004 3% @ 60 1 YY Y 17.441%2% 8.00Misc Y70401 2% @ 55 1 YY Y 17.441%2% 7.00Misc Y70402 3% @ 60 1 YY Y 17.441%2% 8.00
Riverside County Transportation Commission
Misc 70001 2% @ 55 1 3YY Y 23.557%3% 7.00Misc 70002 2.7% @ 55 1 3YY Y 23.557%3% 8.00
Riverside County Waste Resources Management District
Misc 70001 2% @ 55 1 3YY Y 20.579%2% 7.00Misc Y70002 2% @ 55 1 YY Y 20.579%2% 7.00Misc Y70003 3% @ 60 1 YY Y 20.579%2% 8.00Misc 70004 3% @ 60 1 3YY Y 20.579%2% 8.00
Riverside Transit AgencyMisc 70001 2% @ 55 3 Y 8.827%2% 7.00
Riverside, City ofMisc 70001 2% @ 55 1 3Y Y 18.314%3% 7.00Misc Y70002 2% @ 55 1 Y Y 18.314%3% 7.00Misc 70005 2.7% @ 55 1 3Y Y 18.314%3% 8.00Misc Y70006 2.7% @ 55 1 Y Y 18.314%3% 8.00Misc Y70401 2% @ 55 1 18.314%3% 7.00Misc 70402 2% @ 55 1 3 18.314%3% 7.00Misc Y70403 2.7% @ 55 1 18.314%3% 8.00Misc 70404 2.7% @ 55 1 3 18.314%3% 8.00Fire 74001 3% @ 50 1 3Y 26.894%2% 9.00Fire 74101 3% @ 50 1 3Y 26.894%2% 9.00Fire 74102 3% @ 55 3 3Y 26.894%2% 9.00Police 75001 3% @ 50 1 3Y 26.894%2% 9.00Police 75101 3% @ 50 1 3Y 26.894%2% 9.00
Riverside, County ofMisc 70001 2% @ 55 1 8Y 15.581%2% 7.00Misc Y70002 2% @ 55 1 Y 15.581%2% 7.00Misc Y70003 2% @ 55 1 Y 15.581%2% 7.00Misc Y70004 3% @ 60 1 Y 15.581%2% 8.00Misc Y70005 3% @ 60 1 Y 15.581%2% 8.00Misc 70006 3% @ 60 1 8Y 15.581%2% 8.00Misc Y70102 2% @ 55 1 Y 15.581%2% 7.00Fire 74001 3% @ 50 3 8Y Y 24.134%2% 9.00Peace 77001 3% @ 50 1 8Y Y 24.134%2% 9.00Peace 77002 3% @ 50 1 8Y Y 24.134%2% 9.00
Rocklin, City ofMisc 70001 2% @ 55 1 4Y 15.654%2% 7.00Misc Y70002 2% @ 55 1 Y 15.654%2% 7.00Fire 74001 3% @ 50 1 3YY 26.149%2% 9.00Police 75001 3% @ 50 1 4YY 26.149%2% 9.00
378

5. CalPERS Supplement - Summary of Contracting Agency Benefits - (Continued)
Final Pre- SickPost
Ordinary 1959Compensation SurvivorRetirement Leave
RetirementDisabilityBenefit
FinalContribution Rate
Employer Name Offset Option 2 Credit IncreaseSurvivor
BenefitFormula Period COLA Member EmployerCompensation
Allowance
Rohnert Park, City ofMisc 70001 2% @ 55 1 3Y 24.404%5% 7.00Misc Y70002 2% @ 55 1 Y 24.404%5% 7.00Misc 70005 2.7% @ 55 1 3Y 24.404%5% 8.00Misc 70101 2.7% @ 55 1 3Y 24.404%2% 8.00Misc 70102 2% @ 55 1 3Y 24.404%2% 7.00Fire 74001 3% @ 50 1 3YY 47.645%5% 9.00Fire 74101 3% @ 50 1 3YY 26.149%2% 9.00Police 75001 3% @ 50 1 3YY 47.645%5% 9.00Police 75101 3% @ 50 1 3YY 26.149%2% 9.00
Rolling Hills Estates, City ofMisc 70001 2% @ 55 1 1YY Y Y 11.603%2% 7.00Misc Y70002 2% @ 55 1 YY Y Y 11.603%2% 7.00
Rolling Hills, City ofMisc Y70001 2% @ 60 3 YY Y 8.768%2% 7.00Misc 70002 2% @ 60 3 YY Y 8.768%2% 7.00
Rosamond Community Services DistrictMisc 70001 2% @ 60 3 YY 17.896%2% 7.00Misc 70002 2.5% @ 55 3 YY 17.896%2% 8.00
Rose Bowl Operating CompanyMisc 70001 2% @ 60 1 4YY 18.379%2% 7.00Misc 70002 2.5% @ 55 1 4YY 18.379%2% 8.00
Rosedale-Rio Bravo Water Storage DistrictMisc 70001 3% @ 60 1 4YY 17.769%2% 8.00
Rosemead, City ofMisc 70001 2% @ 55 1 YY 27.445%2% 7.00Misc 70002 2.7% @ 55 1 YY 27.445%2% 8.00Misc 70101 2% @ 55 1 YY 10.781%2% 7.00
Roseville Public Cemetery DistrictMisc 70001 2% @ 60 1 3YY 5.952%2% 7.00
Roseville, City ofMisc Y70001 2% @ 55 1 Y 21.752%2% 7.00Misc 70002 2% @ 55 1 3Y 21.752%2% 7.00Misc 70003 2.7% @ 55 1 3YY 21.752%2% 8.00Misc Y70004 2.7% @ 55 1 Y 21.752%2% 8.00Fire 74001 3% @ 50 1 3YY Y 34.311%3% 9.00Police 75001 3% @ 50 1 4YY Y 34.311%2% 9.00
Ross Valley Fire ServiceMisc 70001 2% @ 60 1 YY 10.050%2% 7.00Misc 70002 2.7% @ 55 1 YY 10.050%2% 8.00Misc Y70401 2% @ 60 1 YY 10.050%2% 7.00Misc 70402 2% @ 60 1 YY 10.050%2% 7.00Fire 74001 3% @ 55 1 3YY Y 23.397%2% 9.00Fire 74401 3% @ 55 1 YY Y 23.397%2% 9.00Fire 74402 3% @ 55 1 YY Y 23.397%2% 9.00Fire 74403 3% @ 55 1 YY Y 23.397%2% 9.00
Ross, Town ofMisc Y70001 2% @ 55 3 YY 10.282%2% 7.00Misc 70002 2% @ 55 3 YY 10.282%2% 7.00Fire Y74001 3% @ 55 1 YY 21.039%2% 9.00Police Y75001 3% @ 55 1 YY 21.039%2% 9.00
Rowland Water DistrictMisc Y70001 2% @ 55 1 YY 17.677%2% 7.00Misc 70002 2% @ 55 1 YY 17.677%2% 7.00Misc Y70003 2.5% @ 55 1 YY 17.677%2% 8.00
Rubidoux Community Services DistrictMisc 70001 3% @ 60 1 YY 17.202%2% 8.00Fire Y74001 2% @ 55 3 YY 0.000%2% 7.00
379

5. CalPERS Supplement - Summary of Contracting Agency Benefits - (Continued)
Final Pre- SickPost
Ordinary 1959Compensation SurvivorRetirement Leave
RetirementDisabilityBenefit
FinalContribution Rate
Employer Name Offset Option 2 Credit IncreaseSurvivor
BenefitFormula Period COLA Member EmployerCompensation
Allowance
Running Springs Water DistrictMisc Y70001 2% @ 55 1 YY 22.974%2% 7.00Misc 70002 2% @ 55 1 2YY 22.974%2% 7.00Misc Y70003 2.7% @ 55 1 YY 22.974%2% 8.00Misc 70004 2.7% @ 55 1 2YY 22.974%2% 8.00Fire 74001 3% @ 50 1 2YY 34.542%2% 9.00
Russian River Fire Protection DistrictMisc 70001 2% @ 55 1 3YY 10.781%2% 7.00Fire 74001 2% @ 50 1 3YY 20.742%2% 9.00
Sacramento Area Council of GovernmentsMisc 70001 2% @ 55 1 3YY 19.983%4% 7.00Misc Y70002 2% @ 55 1 YY 19.983%4% 7.00Misc 70003 2.5% @ 55 1 3YY 19.983%4% 8.00Misc Y70004 2.5% @ 55 1 YY 19.983%4% 8.00Misc Y70401 2% @ 55 1 YY 19.983%4% 7.00Misc 70402 2% @ 55 1 YY 19.983%4% 7.00Misc Y70403 2.5% @ 55 1 YY 19.983%4% 8.00
Sacramento City Housing AuthorityMisc Y70001 2% @ 55 1 Y Y 14.532%2% 7.00Misc Y70401 2% @ 55 1 Y Y 14.532%2% 7.00
Sacramento County Law LibraryMisc Y70001 2% @ 55 3 YY 11.558%2% 7.00Misc 70002 2% @ 55 3 YY 11.558%2% 7.00
Sacramento Metropolitan Air Quality Management District
Misc 70001 2% @ 55 3 3YY 12.145%2% 7.00Misc 70002 2% @ 55 3 3YY 12.145%2% 7.00Misc Y70003 2% @ 55 3 YY 12.145%2% 7.00
Sacramento Metropolitan Cabletelevision Commission
Misc Y70001 2% @ 55 1 YY Y 12.094%2% 7.00Sacramento Metropolitan Fire District
Misc 70001 2% @ 55 1 4YY Y Y 15.866%2% 7.00Misc 70002 3% @ 60 1 4YY Y Y 15.866%2% 8.00Misc 70401 2% @ 55 1 4YY 15.866%2% 7.00Misc 70402 2% @ 55 1 4YY Y 15.866%2% 7.00Misc Y70403 2% @ 55 1 YY Y 15.866%2% 7.00Misc 70404 2% @ 55 1 4YY Y 15.866%2% 7.00Misc 70405 2% @ 55 1 4YY 15.866%2% 7.00Misc 70406 2% @ 55 3 4YY 15.866%2% 7.00Misc 70407 2% @ 55 1 4YY Y Y 15.866%2% 7.00Misc 70408 2% @ 55 1 4YY Y 15.866%2% 7.00Misc 70409 2% @ 60 3 4YY Y Y 15.866%2% 7.00Misc 70410 3% @ 60 1 4YY 15.866%2% 8.00Misc 70411 3% @ 60 1 4YY Y 15.866%2% 8.00Misc 70412 3% @ 60 1 4YY 15.866%2% 8.00Misc 70413 3% @ 60 1 4YY Y Y 15.866%2% 8.00Misc 70414 3% @ 60 3 4YY Y Y 15.866%2% 8.00Misc 70415 3% @ 60 1 4YY Y 15.866%2% 8.00Misc 70416 3% @ 60 1 4YY Y 15.866%2% 8.00Fire 74001 3% @ 50 1 4Y Y Y 34.367%2% 9.00Fire 74401 3% @ 50 1 4Y Y 34.367%2% 9.00Fire 74402 3% @ 50 1 4Y Y 34.367%2% 9.00Fire 74403 3% @ 50 1 4Y Y 34.367%2% 9.00Fire 74404 3% @ 50 1 4Y 34.367%2% 9.00Fire 74405 3% @ 50 3 4 34.367%2% 9.00Fire 74406 3% @ 50 1 4Y Y Y 34.367%2% 9.00Fire 74407 3% @ 50 1 4Y Y 34.367%2% 9.00Fire 74408 3% @ 50 1 4Y Y Y 34.367%2% 9.00
Sacramento Metropolitan Water AuthorityMisc 70001 2% @ 55 3 YY Y 11.104%2% 7.00
380

5. CalPERS Supplement - Summary of Contracting Agency Benefits - (Continued)
Final Pre- SickPost
Ordinary 1959Compensation SurvivorRetirement Leave
RetirementDisabilityBenefit
FinalContribution Rate
Employer Name Offset Option 2 Credit IncreaseSurvivor
BenefitFormula Period COLA Member EmployerCompensation
Allowance
Sacramento Municipal Utility DistrictMisc 70001 2% @ 55 3 Y Y 10.865%5% 7.00Misc Y70002 2% @ 55 3 Y Y 10.865%5% 7.00
Sacramento Public Library AuthorityMisc 70001 2% @ 55 1 3Y Y 14.404%2% 7.00Misc 70002 2% @ 55 1 Y Y 14.404%2% 7.00Misc Y70003 2% @ 55 1 Y Y 14.404%2% 7.00Misc 70101 2% @ 55 1 3Y 14.404%2% 7.00Misc 70102 2% @ 55 1 Y 14.404%2% 7.00Misc Y70103 2% @ 55 1 Y 14.404%2% 7.00
Sacramento Regional Fire/EMS Communications Center
Misc 70001 2% @ 55 1 3YY 22.620%2% 7.00Misc 70002 2.7% @ 55 1 3YY 22.620%2% 8.00
Sacramento Suburban Water DistrictMisc 70001 3% @ 60 1 4YY Y 16.773%2% 8.00Misc 70002 3% @ 60 1 YY Y 16.773%2% 8.00Misc 70101 2% @ 55 3 YY Y 11.104%2% 7.00Misc Y70401 2% @ 55 1 YY Y 16.773%3% 7.00Misc 70402 2% @ 55 1 YY Y 16.773%3% 7.00Misc 70403 3% @ 60 1 YY Y 16.773%2% 8.00
Sacramento Transportation AuthorityMisc 70001 2% @ 55 3 3YY 19.303%2% 7.00Misc 70002 2.5% @ 55 3 3YY 19.303%2% 8.00
Sacramento, City ofMisc 70001 2% @ 55 1 Y Y 14.163%2% 7.00Misc Y70002 2% @ 55 1 Y Y 14.163%2% 7.00Fire 74001 3% @ 55 1 Y Y 29.457%2% 9.00Fire 74101 3% @ 55 1 Y Y 29.457%3% 9.00Fire 74102 3% @ 55 1 Y Y 29.457%2% 9.00Fire 74401 3% @ 55 1 2Y Y 29.457%2% 9.00Police 75001 3% @ 50 1 8YY Y 29.457%2% 9.00Police 75101 3% @ 50 1 8YY Y 29.457%3% 9.00Police 75102 3% @ 50 1 8YY Y 29.457%2% 9.00
Sacramento-Yolo Mosquito and Vector Control District
Misc 70001 2% @ 55 1 3YY Y 15.489%2% 7.00Misc 70002 2.5% @ 55 1 3YY Y 15.489%2% 8.00
Salida Fire Protection DistrictMisc 70001 2% @ 55 1 3YY 0.000%2% 7.00Fire 74001 3% @ 50 1 3YY 0.000%2% 9.00
Salinas Valley Solid Waste AuthorityMisc 70001 2% @ 55 1 4YY 10.695%2% 7.00
Salinas, City ofMisc 70001 2% @ 55 1 14.545%2% 7.00Fire 74001 3% @ 50 1 1YY Y 45.791%2% 9.00Police 75001 3% @ 50 1 8Y 34.975%2% 9.00
Salton Community Services DistrictMisc Y70001 2% @ 60 1 YY 6.484%2% 7.00Misc 70002 2% @ 60 1 YY 6.484%2% 7.00Fire Y74001 1/2 @ 55 3 YY 0.000%2% variesPolice Y75001 1/2 @ 55 3 YY 0.000%2% varies
Samoa Peninsula Fire Protection DistrictFire 74001 1/2 @ 55 1 3YY Y 0.000%2% varies
San Andreas Regional Center, Inc.Misc 70001 2% @ 55 3 3 13.217%2% 7.00Misc 70002 2.5% @ 55 3 3 13.217%2% 8.00
San Andreas Sanitary DistrictMisc Y70001 2% @ 55 3 YY 23.319%2% 7.00Misc 70002 2% @ 55 3 YY 23.319%2% 7.00Misc Y70003 2.7% @ 55 3 YY 23.319%2% 8.00
381

5. CalPERS Supplement - Summary of Contracting Agency Benefits - (Continued)
Final Pre- SickPost
Ordinary 1959Compensation SurvivorRetirement Leave
RetirementDisabilityBenefit
FinalContribution Rate
Employer Name Offset Option 2 Credit IncreaseSurvivor
BenefitFormula Period COLA Member EmployerCompensation
Allowance
San Anselmo, Town ofMisc Y70001 2% @ 55 1 YY 15.685%2% 7.00Misc 70002 2% @ 55 1 YY 15.685%2% 7.00Misc Y70003 2.7% @ 55 1 YY 15.685%2% 8.00Misc Y70101 2% @ 55 1 YY 10.781%2% 7.00Police Y75001 3% @ 50 1 YY 26.149%2% 9.00Police Y75002 3% @ 50 1 YY 26.149%2% 9.00Police Y75101 3% @ 55 1 YY 21.669%2% 9.00
San Benito County Water DistrictMisc 70001 2% @ 55 3 YY 14.083%2% 7.00Misc 70002 2.5% @ 55 3 YY 14.083%2% 8.00
San Benito, County ofMisc 70001 2% @ 55 3 Y 14.058%2% 7.00Misc Y70002 2% @ 55 3 Y 14.058%2% 7.00Fire 74001 2% @ 50 3 YY Y 33.008%2% 9.00Peace 77001 3% @ 55 3 YY Y 33.008%2% 9.00
San Bernardino City Unified School DistrictPolice 75001 3% @ 50 1 4YY Y 51.280%5% 9.00
San Bernardino County Housing AuthorityMisc Y70001 2% @ 55 1 15.742%2% 7.00Misc Y70002 2.5% @ 55 1 15.742%2% 8.00
San Bernardino County Transportation Authority
Misc 70001 2% @ 60 1 YY Y 0.000%2% 7.00San Bernardino Economic Development Agency
Misc 70001 2% @ 55 1 3YY Y 18.625%2% 7.00Misc 70002 3% @ 60 1 3YY Y 18.625%2% 8.00Misc 70401 2% @ 55 1 2YY Y 18.625%2% 7.00Misc Y70402 2% @ 55 1 YY Y 18.625%2% 7.00Misc 70403 2% @ 55 1 2YY Y 18.625%2% 7.00Misc 70404 3% @ 60 1 2YY Y 18.625%2% 8.00Misc Y70405 3% @ 60 1 YY Y 18.625%2% 8.00
San Bernardino Valley Municipal Water District
Misc 70001 2% @ 60 1 YY Y 33.029%4% 7.00Misc Y70002 2% @ 60 1 YY Y 33.029%4% 7.00Misc 70003 2% @ 60 1 YY Y 33.029%4% 7.00Misc 70004 3% @ 60 1 YY Y 33.029%4% 8.00Misc 70006 3% @ 60 1 YY Y 33.029%4% 8.00Misc 70101 2% @ 60 1 YY Y 10.000%4% 7.00
San Bernardino Valley Water Conservation District
Misc 70001 2% @ 55 1 YY 14.660%2% 7.00Misc 70002 2.5% @ 55 1 YY 14.660%2% 8.00
San Bernardino, California State University, Foundation
Misc Y70001 2% @ 55 1 Y Y 10.723%2% 5.00San Bernardino, City of
Misc 70001 2% @ 55 1 4Y 18.186%2% 7.00Misc 70002 2.7% @ 55 1 4Y 18.186%2% 8.00Fire 74001 3% @ 50 1 4Y 31.455%2% 9.00Fire 74101 3% @ 55 1 4Y 31.455%2% 9.00Police 75001 3% @ 50 1 Y 31.455%2% 9.00Police 75101 3% @ 55 1 Y 31.455%2% 9.00
San Bruno, City ofMisc 70001 2% @ 55 1 4 19.781%2% 7.00Misc Y70002 2% @ 55 1 19.781%2% 7.00Misc 70003 2.7% @ 55 1 4 19.781%2% 8.00Misc Y70004 2.7% @ 55 1 19.781%2% 8.00Fire 74001 3% @ 50 1 4YY 26.149%2% 9.00Police 75001 3% @ 50 1 4YY 26.149%2% 9.00
382

5. CalPERS Supplement - Summary of Contracting Agency Benefits - (Continued)
Final Pre- SickPost
Ordinary 1959Compensation SurvivorRetirement Leave
RetirementDisabilityBenefit
FinalContribution Rate
Employer Name Offset Option 2 Credit IncreaseSurvivor
BenefitFormula Period COLA Member EmployerCompensation
Allowance
San Buenaventura, City ofMisc 70001 2% @ 55 1 4 13.466%2% 7.00Misc 70101 2% @ 60 3 4 13.466%2% 7.00Fire 74001 3% @ 55 1 3Y 39.552%2% 9.00Police 75001 3% @ 50 1 4Y 39.552%2% 9.00Police 75101 3% @ 55 1 4Y 39.552%2% 9.00
San Carlos, City ofMisc 70001 2% @ 55 1 YY 21.983%2% 7.00Misc 70002 2.7% @ 55 1 YY 21.983%2% 8.00Misc 70101 2.5% @ 55 1 YY 15.133%2% 8.00Fire 74001 2% @ 50 3 8YY 19.900%2% 9.00Police 75001 3% @ 50 1 3YY Y 0.000%2% 9.00Police 75101 3% @ 55 1 3YY Y 0.000%2% 9.00
San Clemente, City ofFire Y74001 2% @ 50 1 YY Y 0.000%2% 9.00Police Y75001 2% @ 50 1 YY Y 0.000%2% 9.00Safety Y76001 3% @ 55 1 YY Y 33.093%2% 9.00
San Diego Association of GovernmentsMisc 70001 2% @ 55 1 4Y 18.164%2% 7.00Misc 70002 2.7% @ 55 1 4Y 18.164%2% 8.00Misc 70401 2.7% @ 55 1 Y 18.164%2% 8.00Misc Y70402 2.7% @ 55 1 Y 18.164%2% 8.00Misc Y70403 2.7% @ 55 1 Y 18.164%2% 8.00
San Diego County Law LibraryMisc 70001 2% @ 60 1 3YY Y 7.620%2% 7.00
San Diego County Office of EducationMisc 70001 2% @ 55 1 8YY Y 15.250%3% 7.00Misc Y70002 2% @ 55 1 YY Y 15.250%3% 7.00Misc Y70003 2% @ 55 1 YY Y 15.250%3% 7.00
San Diego County Water AuthorityMisc 70001 2% @ 55 1 Y 19.735%3% 7.00Misc Y70002 2% @ 55 1 Y 19.735%3% 7.00Misc Y70003 2.5% @ 55 1 Y 19.735%3% 8.00
San Diego Metropolitan Transit Development Board
Misc 70001 2% @ 55 1 YY 18.786%2% 7.00Misc Y70002 2% @ 55 1 YY 18.786%2% 7.00Misc 70003 2.7% @ 55 1 YY 18.786%2% 8.00Misc Y70004 2.7% @ 55 1 YY 18.786%2% 8.00
San Diego Pooled Insurance Program Authority
Misc 70001 2% @ 55 1 4YY 22.548%2% 7.00Misc 70002 3% @ 60 1 4YY 22.548%2% 8.00
San Diego Rural Fire Protection DistrictMisc 70001 2% @ 55 1 3YY 29.482%2% 7.00Fire 74001 2% @ 55 3 3YY 18.404%2% 7.00
San Diego State University Associated Students
Misc Y70001 2% @ 55 1 YY Y 14.099%2% 7.00San Diego Trolley, Inc.
Misc 70001 2% @ 55 1 2 9.708%2% 7.00San Diego Unified School District
Police 75001 3% @ 50 1 4YY Y Y 44.629%2% 9.00San Dieguito Water District
Misc 70001 2% @ 55 1 3YY 15.685%2% 7.00Misc 70003 2.7% @ 55 1 3YY 15.685%2% 8.00
San Dimas, City ofMisc 70001 2% @ 55 3 3YY 14.940%2% 7.00
San Elijo Joint Powers AuthorityMisc 70001 2% @ 55 1 8YY 16.920%2% 7.00Misc 70002 2.5% @ 55 1 8YY 16.920%2% 8.00
383

5. CalPERS Supplement - Summary of Contracting Agency Benefits - (Continued)
Final Pre- SickPost
Ordinary 1959Compensation SurvivorRetirement Leave
RetirementDisabilityBenefit
FinalContribution Rate
Employer Name Offset Option 2 Credit IncreaseSurvivor
BenefitFormula Period COLA Member EmployerCompensation
Allowance
San Fernando, City ofMisc 70001 2% @ 55 1 4YY 26.207%5% 7.00Misc Y70002 2% @ 55 1 YY 26.207%5% 7.00Misc Y70003 3% @ 60 1 YY 26.207%5% 8.00Misc Y70101 2% @ 55 1 YY 11.709%3% 7.00Misc Y70401 2% @ 55 1 YY 26.207%5% 7.00Misc 70402 2% @ 55 1 YY 26.207%5% 7.00Misc Y70403 3% @ 60 1 YY 26.207%5% 8.00Misc 70404 3% @ 60 1 YY 26.207%5% 8.00Fire 74001 1/2 @ 55 3 1YY 26.133%2% variesPolice 75001 3% @ 50 1 4YY 44.999%5% 9.00Police 75002 3% @ 50 1 4YY 44.999%5% 9.00Police 75101 3% @ 50 3 4YY 26.133%2% 9.00
San Francisco Bay Area Rapid Transit District
Misc 70001 2% @ 55 1 Y 12.269%2% 7.00Misc Y70002 2% @ 55 1 12.269%2% 7.00Misc 70003 2% @ 55 1 Y 12.269%2% 7.00Misc 70004 2% @ 55 1 Y 12.269%2% 7.00Police 75001 3% @ 50 1 4Y 42.885%2% 9.00Police 75002 3% @ 50 1 4Y 42.885%2% 9.00
San Francisco Bay Area Water Emergency Transportation Authority
Misc 70001 2.5% @ 55 1 4YY 15.650%2% 8.00Misc 70401 2% @ 55 1 4YY 15.650%2% 7.00Misc 70402 2.5% @ 55 1 4YY 15.650%2% 8.00
San Francisco City and County Housing Authority
Misc Y70001 2% @ 55 1 Y 11.065%5% 7.00Police Y75001 2% @ 55 3 YY 0.000%2% 7.00Police Y75002 2% @ 60 3 YY 0.000%2% 7.00
San Francisco City and County Redevelopment Agency
Misc Y70001 2% @ 55 1 Y Y 12.860%4% 7.00Misc 70002 2% @ 55 1 Y Y 12.860%4% 7.00
San Francisco Community College District Bookstore Auxiliary
Misc Y70001 2% @ 60 3 YY 10.573%3% 7.00San Francisco County Law Library
Misc 70001 2% @ 60 3 YY 7.125%2% 7.00San Francisco County Transportation Authority
Misc 70001 2% @ 55 1 2YY 11.379%2% 7.00San Francisco Health Authority
Misc 70001 2% @ 55 3 3YY 10.282%2% 7.00San Francisco, City and County of
Misc 70001 2% @ 60 1 5YY Y 0.000%2% 7.00Misc Y70002 2% @ 60 1 YY Y 0.000%2% 7.00Misc 70003 2% @ 60 1 3YY Y 0.000%2% 6.00Misc Y70004 2% @ 60 1 YY Y 0.000%2% 5.00Misc 70005 2% @ 55 1 5YY Y 0.000%2% 7.00Misc Y70006 2% @ 55 1 YY Y 0.000%2% 7.00Misc 70103 1.25% @ 65 1 3YY Y 0.000%3% 0.00Misc 70104 1.25% @ 65 1 YY Y 0.000%3% 0.00Police 75001 2% @ 50 1 5YY Y 21.588%2% 9.00Police 75101 2% @ 55 3 2 21.588%2% 7.00Peace 77001 2% @ 50 1 1Y 21.588%2% 9.00Peace 77101 2% @ 50 1 1Y 21.588%2% 9.00Police 78001 3% @ 55 1 1Y 21.588%2% 9.00
San Francisquito Creek Joint Powers Authority
Misc 70001 2% @ 55 3 8YY 14.058%2% 7.00
384

5. CalPERS Supplement - Summary of Contracting Agency Benefits - (Continued)
Final Pre- SickPost
Ordinary 1959Compensation SurvivorRetirement Leave
RetirementDisabilityBenefit
FinalContribution Rate
Employer Name Offset Option 2 Credit IncreaseSurvivor
BenefitFormula Period COLA Member EmployerCompensation
Allowance
San Gabriel County Water DistrictMisc 70001 2% @ 55 1 YY Y 20.254%2% 7.00Misc 70002 2.7% @ 55 1 YY Y 20.254%2% 8.00
San Gabriel Valley Council of GovernmentsMisc 70001 2% @ 55 3 4YY 10.282%2% 7.00
San Gabriel Valley Mosquito and Vector Control District
Misc 70001 2% @ 55 1 YY Y 12.214%2% 7.00San Gabriel Valley Municipal Water District
Misc Y70001 2% @ 55 1 YY Y 11.603%2% 7.00Misc 70002 2% @ 55 1 YY Y 11.603%2% 7.00
San Gabriel, City ofMisc 70001 2% @ 55 1 4YY Y Y 21.875%2% 7.00Misc 70002 2.7% @ 55 1 4YY Y Y 21.875%2% 8.00Fire 74001 3% @ 50 1 4YY Y Y 37.310%2% 9.00Fire 74002 3% @ 50 1 4YY Y Y 37.310%2% 9.00Police 75001 3% @ 50 1 4YY Y Y 37.310%2% 9.00Police 75002 3% @ 50 1 4YY Y Y 37.310%2% 9.00
San Gorgonio Pass Water AgencyMisc 70001 2% @ 55 1 YY Y 25.929%4% 7.00Misc 70002 3% @ 60 1 YY Y 25.929%4% 8.00
San Jacinto Valley Cemetery DistrictMisc 70001 2% @ 60 3 YY 0.000%2% 7.00
San Jacinto, City ofMisc Y70001 2% @ 55 1 YY 22.191%2% 7.00Misc 70002 2% @ 55 1 4YY 22.191%2% 7.00Misc 70003 2.7% @ 55 1 4YY 22.191%2% 8.00Fire 74001 2% @ 55 1 4YY 0.000%2% 7.00Police 75001 2% @ 50 3 4YY 0.000%2% 9.00Police 75002 2% @ 50 1 4YY 0.000%2% 9.00
San Joaquin County Housing AuthorityMisc Y70001 2% @ 55 1 YY 10.939%2% 7.00
San Joaquin County IHSS Public AuthorityMisc 70001 2% @ 55 1 4YY Y 13.743%3% 7.00Misc 70002 2% @ 55 1 YY Y 13.743%3% 7.00
San Joaquin Delta Community College District
Police 75001 3% @ 55 3 3YY Y 37.089%2% 9.00San Joaquin, City of
Misc Y70001 2% @ 55 3 YY 10.282%2% 7.00Misc 70002 2% @ 55 3 3YY 10.282%2% 7.00
San Joaquin, County ofMisc 70001 2% @ 55 1 YY Y 0.000%3% 7.00Misc Y70002 2% @ 55 1 YY Y 0.000%3% 7.00
San Jose, City ofMisc 70001 2% @ 55 3 3YY 17.106%2% 7.00
San Juan Water DistrictMisc Y70001 2% @ 55 1 YY 15.724%2% 7.00Misc 70002 2% @ 55 1 YY 15.724%2% 7.00Misc Y70003 3% @ 60 1 YY 15.724%2% 8.00Misc Y70101 3% @ 60 3 YY 15.084%2% 8.00
San Leandro, City ofMisc 70001 2% @ 55 1 Y Y 22.686%2% 7.00Misc 70002 2.5% @ 55 1 Y Y 22.686%2% 8.00Misc 70101 2% @ 55 3 Y Y 22.686%2% 7.00Fire 74001 3% @ 50 1 YY Y 27.877%2% 9.00Police 75001 3% @ 50 1 4YY Y 27.877%2% 9.00Police 75002 3% @ 50 1 YY Y 27.877%2% 9.00
San Lorenzo Valley Water DistrictMisc Y70001 2% @ 55 3 YY 10.319%2% 7.00Misc 70002 2% @ 55 3 YY 10.319%2% 7.00
385

5. CalPERS Supplement - Summary of Contracting Agency Benefits - (Continued)
Final Pre- SickPost
Ordinary 1959Compensation SurvivorRetirement Leave
RetirementDisabilityBenefit
FinalContribution Rate
Employer Name Offset Option 2 Credit IncreaseSurvivor
BenefitFormula Period COLA Member EmployerCompensation
Allowance
San Luis Obispo - Cal Poly Associated Students, Inc.
Misc 70001 2% @ 55 1 1YY Y 17.427%2% 6.00Misc Y70002 2% @ 55 1 YY Y 17.427%2% 5.00Misc Y70101 2% @ 60 3 YY Y 10.768%2% 7.00
San Luis Obispo - Cal Poly FoundationMisc Y70001 2% @ 55 1 YY Y 12.764%2% 5.00Misc Y70101 2% @ 60 3 YY Y 12.764%2% 5.00
San Luis Obispo City Housing AuthorityMisc Y70001 2% @ 55 3 YY 21.407%2% 7.00
San Luis Obispo Council of GovernmentsMisc 70001 2% @ 55 1 4YY Y 15.205%3% 7.00
San Luis Obispo Regional Transit AuthorityMisc 70001 2% @ 55 1 3YY 15.005%2% 7.00
San Luis Obispo, City ofMisc 70001 2% @ 55 1 4Y 24.684%2% 7.00Misc 70002 2.7% @ 55 1 4YY 24.684%2% 8.00Fire 74001 3% @ 55 1 3YY Y 42.163%2% 9.00Fire 74002 3% @ 50 1 3YY Y 42.163%2% 9.00Fire 74102 3% @ 50 1 3YY Y 42.163%2% 9.00Police 75001 3% @ 50 1 4YY Y 42.163%2% 9.00Police 75002 3% @ 50 1 4YY Y 42.163%2% 9.00Police 75102 2% @ 50 1 4YY Y 42.163%2% 9.00
San Luis Water DistrictMisc Y70001 2% @ 60 3 YY 0.713%2% 7.00Misc 70002 2% @ 60 3 YY 0.713%2% 7.00Misc Y70003 2.5% @ 55 3 YY 0.713%2% 8.00
San Marcos, City ofMisc Y70001 2% @ 55 1 Y Y 25.275%2% 7.00Misc 70002 2% @ 55 1 Y Y 25.275%2% 7.00Misc Y70003 2.7% @ 55 1 Y Y 25.275%2% 8.00Misc 70004 2.7% @ 55 1 Y Y 25.275%2% 8.00Misc 70401 2% @ 55 1 2Y Y 25.275%5% 7.00Fire 74001 3% @ 50 1 8YY Y Y 27.877%2% 9.00Fire 74401 3% @ 50 1 8YY Y Y 27.877%5% 9.00
San Marino, City ofMisc 70001 2% @ 55 1 3YY Y 19.956%2% 7.00Fire 74001 3% @ 50 1 3YY Y 27.877%2% 9.00Fire 74101 3% @ 55 1 3YY Y 23.397%2% 9.00Police 75001 3% @ 50 1 3YY Y 27.877%2% 9.00
San Mateo County Harbor DistrictMisc Y70001 2% @ 55 3 YY 19.432%2% 7.00Misc 70002 2% @ 55 3 3YY 19.432%2% 7.00Misc 70003 2.5% @ 55 3 3YY 19.432%2% 8.00Misc Y70004 2.5% @ 55 3 YY 19.432%2% 8.00
San Mateo County In-Home Supportive Services Public Authority
Misc 70001 2% @ 60 3 3YY 9.110%2% 7.00San Mateo County Law Library
Misc Y70001 2% @ 55 3 YY 5.878%2% 7.00Misc 70002 2% @ 55 3 YY 5.878%2% 7.00
San Mateo County Schools Insurance Group
Misc Y70001 2% @ 55 1 YY 19.510%2% 7.00Misc 70002 2% @ 55 1 YY 19.510%2% 7.00Misc Y70003 2.7% @ 55 1 YY 19.510%2% 8.00
San Mateo County Transit DistrictMisc 70001 2% @ 55 3 Y 8.863%2% 7.00Misc Y70002 2% @ 55 3 Y 8.863%2% 7.00
386

5. CalPERS Supplement - Summary of Contracting Agency Benefits - (Continued)
Final Pre- SickPost
Ordinary 1959Compensation SurvivorRetirement Leave
RetirementDisabilityBenefit
FinalContribution Rate
Employer Name Offset Option 2 Credit IncreaseSurvivor
BenefitFormula Period COLA Member EmployerCompensation
Allowance
San Mateo, City ofMisc 70001 2% @ 55 1 1Y 14.666%2% 7.00Misc Y70002 2% @ 55 1 Y 14.666%2% 7.00Fire 74001 3% @ 50 1 4Y 37.525%2% 9.00Fire Y74002 3% @ 50 1 Y 37.525%2% 9.00Police 75001 3% @ 50 1 4Y 37.525%2% 9.00
San Miguel Community Services DistrictMisc 70001 2.7% @ 55 1 4YY 19.127%2% 8.00
San Miguel Consolidated Fire Protection District
Misc 70001 2% @ 55 1 4YY Y Y 17.531%2% 7.00Misc 70002 2.7% @ 55 1 4YY Y Y 17.531%2% 8.00Misc 70401 2% @ 55 1 4YY Y Y 17.531%2% 7.00Misc 70402 2.7% @ 55 1 4YY Y Y 17.531%2% 8.00Misc 70403 2.7% @ 55 1 4YY Y Y 17.531%2% 8.00Misc 70404 2% @ 55 3 4YY Y 17.531%2% 7.00Misc 70405 2% @ 55 1 4YY Y Y 17.531%2% 7.00Misc 70407 2% @ 55 3 4YY 17.531%2% 7.00Fire 74001 3% @ 55 1 4YY Y Y 23.397%2% 9.00Fire 74401 3% @ 55 1 4YY Y Y 23.397%2% 9.00Fire 74402 3% @ 55 1 4YY 23.397%2% 9.00Fire 74403 3% @ 55 1 4YY Y Y 23.397%2% 9.00Fire 74404 3% @ 55 1 4YY Y Y 23.397%2% 9.00Fire 74405 3% @ 55 1 4YY Y Y 23.397%2% 9.00
San Pablo, City ofMisc 70001 2% @ 55 1 3YY 14.660%2% 7.00Misc Y70002 2% @ 55 1 YY 14.660%2% 7.00Misc 70003 2.5% @ 55 1 3YY 14.660%2% 8.00Misc Y70401 2% @ 60 1 YY 14.660%2% 7.00Misc 70402 2% @ 55 1 3YY 14.660%2% 7.00Fire 74001 2% @ 50 1 1YY 26.149%2% 9.00Police 75001 3% @ 50 1 3YY 26.149%2% 9.00
San Ramon, City ofMisc 70001 2% @ 55 1 4YY 13.498%2% 7.00Misc 70002 2.7% @ 55 1 4YY 13.498%2% 8.00Police 75001 3% @ 50 1 4YY Y 27.877%2% 9.00
San Simeon Community Services DistrictMisc 70001 2% @ 60 3 4YY 0.000%2% 7.00
Sand City, City ofMisc 70001 2% @ 55 1 4YY 24.396%2% 7.00Misc Y70002 2% @ 55 1 YY 24.396%2% 7.00Misc 70003 3% @ 60 1 4YY 24.396%2% 8.00Police 75001 3% @ 55 1 4YY 23.700%2% 9.00
Sanger Cemetery DistrictMisc Y70001 2% @ 60 3 YY 8.205%2% 7.00
Sanger, City ofMisc Y70001 2% @ 55 3 YY 20.815%2% 7.00Misc 70002 2% @ 55 3 YY 20.815%2% 7.00Misc Y70003 2.5% @ 55 3 YY 20.815%2% 8.00Fire Y74001 2% @ 50 1 YY 275.499%2% 9.00Fire Y74002 3% @ 55 1 YY 275.499%2% 9.00Fire Y74102 3% @ 55 3 YY 26.363%2% 9.00Police Y75001 2% @ 50 1 YY 28.196%2% 9.00Police Y75002 2% @ 50 1 YY 28.196%2% 9.00Police Y75102 2% @ 50 3 YY 28.196%2% 9.00
Sanitary District No. 5 of Marin CountyMisc 70001 2% @ 55 1 YY 32.143%2% 7.00Misc 70002 2.7% @ 55 1 YY 32.143%2% 8.00
Santa Ana Unified School DistrictPolice 75001 3% @ 50 1 4YY Y 33.112%2% 9.00
387

5. CalPERS Supplement - Summary of Contracting Agency Benefits - (Continued)
Final Pre- SickPost
Ordinary 1959Compensation SurvivorRetirement Leave
RetirementDisabilityBenefit
FinalContribution Rate
Employer Name Offset Option 2 Credit IncreaseSurvivor
BenefitFormula Period COLA Member EmployerCompensation
Allowance
Santa Ana Watershed Project AuthorityMisc 70001 2% @ 55 1 YY 11.709%5% 7.00
Santa Ana, City ofMisc 70001 2% @ 55 1 4YY Y 22.824%2% 7.00Misc 70002 2.7% @ 55 1 4YY Y 22.824%2% 8.00Misc 70101 2% @ 55 1 4YY Y 22.824%2% 7.00Fire 74001 3% @ 50 1 4YY Y 29.406%2% 9.00Fire 74101 3% @ 50 1 4YY Y 29.406%2% 9.00Police 75001 3% @ 50 1 4YY Y 29.406%2% 9.00Police 75101 3% @ 50 1 4YY Y 29.406%2% 9.00
Santa Barbara County Law LibraryMisc Y70001 2% @ 60 3 YY 3.264%2% 7.00Misc 70002 2% @ 60 3 YY 3.264%2% 7.00
Santa Barbara County Special Education Local Plan Area
Misc 70001 2% @ 60 3 YY 8.049%2% 7.00Santa Barbara Regional Health Authority
Misc 70001 2% @ 60 3 3YY 8.210%2% 7.00Santa Barbara, City of
Misc 70001 2% @ 55 1 4Y 23.635%2% 7.00Misc 70002 2.7% @ 55 1 4Y 23.635%2% 8.00Fire 74001 3% @ 50 1 2Y Y 35.264%2% 9.00Police 75001 3% @ 50 1 2Y 35.163%2% 9.00
Santa Clara County Central Fire Protection District
Misc 70001 2% @ 55 1 3YY Y 24.301%2% 7.00Misc 70002 2.7% @ 55 1 3YY Y 24.301%2% 8.00Misc 70401 2% @ 55 3 3YY Y 24.301%2% 7.00Misc 70402 2% @ 55 1 3YY 24.301%2% 7.00Misc 70403 2.7% @ 55 1 3YY Y 24.301%2% 8.00Misc 70404 2% @ 55 1 3YY Y 24.301%2% 7.00Fire 74001 3% @ 50 1 3YY Y 32.743%2% 9.00Fire 74401 3% @ 50 1 4Y 32.743%2% 9.00Fire 74402 3% @ 50 1 1Y 32.743%2% 9.00Fire Y74403 3% @ 50 3 32.743%2% 9.00Fire 74404 3% @ 50 1 1Y 32.743%2% 9.00Fire 74405 3% @ 50 1 1Y 32.743%2% 9.00Fire 74406 3% @ 50 3 1Y 32.743%2% 9.00Fire Y74407 3% @ 50 1 3Y Y 32.743%2% 9.00Fire 74408 2% @ 50 1 1Y 32.743%2% 9.00Fire 74409 3% @ 50 1 3YY Y 32.743%2% 9.00
Santa Clara County Health AuthorityMisc 70001 2% @ 55 3 3YY 10.282%2% 7.00
Santa Clara County Law LibraryMisc Y70001 2% @ 55 1 YY Y 16.677%5% 7.00Misc 70002 2% @ 55 1 YY Y 16.677%5% 7.00Misc Y70003 2.5% @ 55 1 YY Y 16.677%5% 8.00
Santa Clara County Open-Space AuthorityMisc 70001 2% @ 55 3 8YY 10.282%2% 7.00
Santa Clara County Schools Insurance Group
Misc 70001 2% @ 55 1 YY 11.207%2% 7.00Santa Clara Valley Transportation Authority
Misc Y70001 2% @ 55 1 Y 14.025%2% 7.00Misc 70401 2% @ 55 1 Y 14.025%2% 7.00Misc 70402 2% @ 55 1 1Y Y 14.025%2% 7.00Misc Y70403 2% @ 55 1 Y Y 14.025%2% 7.00
Santa Clara Valley Water DistrictMisc 70001 2% @ 55 1 4YY Y 17.749%2% 7.00Misc 70002 2.5% @ 55 1 4YY Y 17.749%2% 8.00Misc 70402 2% @ 60 3 1 17.749%2% varies
388

5. CalPERS Supplement - Summary of Contracting Agency Benefits - (Continued)
Final Pre- SickPost
Ordinary 1959Compensation SurvivorRetirement Leave
RetirementDisabilityBenefit
FinalContribution Rate
Employer Name Offset Option 2 Credit IncreaseSurvivor
BenefitFormula Period COLA Member EmployerCompensation
Allowance
Santa Clara, City ofMisc 70001 2% @ 55 1 1Y 25.216%2% 7.00Misc Y70002 2% @ 55 1 Y 25.216%2% 7.00Misc Y70003 2.7% @ 55 1 Y 25.216%2% 8.00Misc 70004 2.7% @ 55 1 1Y 25.216%2% 8.00Fire 74001 3% @ 50 3 4Y Y 35.340%2% 9.00Fire Y74002 3% @ 50 3 Y Y 35.340%2% 9.00Police 75001 3% @ 50 1 4Y Y 35.340%2% 9.00Police Y75002 3% @ 50 1 Y Y 35.340%2% 9.00
Santa Clara, County ofMisc 70001 2% @ 55 1 1Y Y 16.052%2% 7.00Misc Y70002 2% @ 55 1 Y Y 16.052%2% 7.00Misc Y70003 2.5% @ 55 1 Y Y 16.052%2% 8.00Misc Y70401 2% @ 60 3 Y 16.052%2% 7.00Misc 70402 2% @ 60 3 Y 16.052%2% 7.00Fire 74001 3% @ 50 1 1Y Y 28.025%2% 9.00Peace 77001 3% @ 50 1 1Y Y 28.025%2% 9.00Peace Y77002 3% @ 50 1 Y Y 28.025%2% 9.00
Santa Clarita Valley School Food Services Agency
Misc 70001 2% @ 55 1 3YY Y 14.183%2% 7.00Misc Y70002 2% @ 55 1 YY Y 14.183%2% 7.00
Santa Clarita, City ofMisc 70001 2% @ 55 3 8 13.303%2% 7.00Misc 70002 2.7% @ 55 3 8 13.303%2% 8.00Misc 70101 2% @ 60 3 8 13.303%2% 7.00
Santa Cruz County Law LibraryMisc 70001 2% @ 55 1 YY 0.000%2% 7.00
Santa Cruz County Regional Transportation Commission
Misc 70001 2% @ 55 1 4YY 12.390%2% 7.00Misc 70002 2% @ 55 1 YY 12.390%2% 7.00Misc Y70401 2% @ 55 1 YY 12.390%2% 7.00Misc 70402 2% @ 55 1 YY 12.390%2% 7.00
Santa Cruz Local Agency Formation Commission
Misc 70001 2% @ 55 1 YY 15.607%2% 7.00Santa Cruz Metropolitan Transit District
Misc 70001 2% @ 55 1 3Y 19.268%2% 7.00Misc 70002 2% @ 55 1 3Y 19.268%2% 7.00Misc 70003 2.5% @ 55 1 3Y 19.268%2% 8.00
Santa Cruz Port DistrictMisc 70003 2% @ 55 3 YY 30.597%2% 7.00Misc 70004 2.5% @ 55 3 YY 30.597%2% 8.00Misc 70101 2% @ 60 3 YY 8.049%2% 7.00
Santa Cruz Regional 9-1-1Misc 70001 2% @ 55 1 3YY 14.057%2% 7.00
Santa Cruz, City ofMisc 70001 2% @ 55 1 3Y Y 16.029%2% 7.00Misc Y70002 2% @ 55 1 Y 16.029%2% 7.00Fire 74001 3% @ 50 1 3YY Y 27.877%2% 9.00Fire 74002 3% @ 50 1 3YY Y 27.877%2% 9.00Police 75001 3% @ 50 1 3YY Y 27.877%2% 9.00Police 75002 3% @ 50 1 3YY Y 27.877%2% 9.00Police 75101 3% @ 55 3 3YY Y 22.502%2% 9.00
Santa Cruz, County ofMisc Y70001 2% @ 55 1 Y 15.099%2% 7.00Misc 70002 2% @ 55 1 15.099%2% 7.00Fire 74001 2% @ 50 1 1 19.094%2% 9.00Peace 77001 2% @ 50 1 3 19.094%2% 9.00Police 78001 3% @ 50 1 3 30.534%2% 9.00
389

5. CalPERS Supplement - Summary of Contracting Agency Benefits - (Continued)
Final Pre- SickPost
Ordinary 1959Compensation SurvivorRetirement Leave
RetirementDisabilityBenefit
FinalContribution Rate
Employer Name Offset Option 2 Credit IncreaseSurvivor
BenefitFormula Period COLA Member EmployerCompensation
Allowance
Santa Fe Irrigation DistrictMisc 70001 2% @ 55 1 3YY 15.685%2% 7.00Misc 70002 2.7% @ 55 1 3YY 15.685%2% 8.00
Santa Fe Springs, City ofMisc 70001 2% @ 55 1 4Y 30.216%2% 7.00Misc 70002 2.7% @ 55 1 4Y 30.216%2% 8.00Fire 74001 3% @ 50 1 4YY Y 28.579%2% 9.00Police 75001 3% @ 50 1 1YY Y 28.579%2% 9.00
Santa Margarita Water DistrictMisc 70001 2% @ 55 1 4 19.795%2% 7.00Misc 70002 2.5% @ 55 1 4 19.795%2% 8.00Misc 70003 2.7% @ 55 1 4Y 19.795%2% 8.00
Santa Maria Public Airport DistrictMisc 70001 2% @ 55 1 3YY 10.781%2% 7.00Misc Y70002 2% @ 55 1 YY 10.781%2% 7.00
Santa Maria, City ofMisc 70001 2% @ 55 1 4YY Y 18.611%2% 7.00Misc Y70002 2% @ 55 1 YY Y 18.611%2% 7.00Misc 70003 2.7% @ 55 1 4YY Y 18.611%2% 8.00Misc Y70004 2.7% @ 55 1 YY Y 18.611%2% 8.00Misc 70101 2% @ 55 3 4YY Y 18.611%2% 7.00Fire 74001 3% @ 50 1 4YY Y 27.877%2% 9.00Fire 74002 3% @ 50 1 4YY Y 27.877%2% 9.00Fire 74102 3% @ 55 3 4YY Y 22.502%2% 9.00Police 75001 3% @ 50 1 4YY 28.462%2% 9.00Police 75002 3% @ 50 3 4Y 28.462%2% 9.00Police 75101 3% @ 55 3 4YY 28.462%2% 9.00
Santa Monica Community College DistrictPolice 75001 3% @ 55 3 8YY Y 22.502%2% 9.00
Santa Monica, City ofMisc 70001 2% @ 55 1 4Y 18.199%2% 7.00Misc 70002 2.7% @ 55 1 4Y 18.199%2% 8.00Fire 74001 3% @ 55 1 4Y Y 29.279%2% 9.00Police 75001 3% @ 50 1 4Y 40.393%2% 9.00Safety 76001 1/2 @ 55 3 1YY 0.000%2% varies
Santa Nella County Water DistrictMisc 70001 2% @ 55 3 YY 21.409%2% 7.00
Santa Paula City Housing AuthorityMisc Y70001 2% @ 60 1 YY Y 8.257%2% 7.00Misc 70002 2% @ 60 1 YY Y 8.257%2% 7.00
Santa Paula, City ofMisc 70001 2% @ 55 1 3YY Y 28.093%2% 7.00Misc 70002 2.5% @ 55 1 3YY Y 28.093%2% 8.00Misc 70101 2% @ 55 1 3YY Y 10.781%2% 7.00Fire 74001 3% @ 50 3 1YY Y 39.266%2% 9.00Police 75001 3% @ 50 3 3YY Y 39.266%2% 9.00
Santa Rosa, City ofMisc 70001 2% @ 55 1 4YY 17.018%2% 7.00Misc 70002 3% @ 60 1 4YY 17.018%2% 8.00Misc 70401 2% @ 55 1 4Y 17.018%2% 7.00Misc Y70402 2% @ 60 3 17.018%2% 7.00Fire 74001 3% @ 50 1 4Y 29.363%2% 9.00Fire 74003 3% @ 50 1 4Y 29.363%2% 9.00Police 75001 3% @ 50 1 4Y 30.389%2% 9.00
Santa Ynez River Water Conservation District, Improvement District No. 1
Misc Y70001 2% @ 55 3 YY Y 15.322%2% 7.00Misc 70002 2% @ 60 3 YY Y 15.322%2% 7.00
390

5. CalPERS Supplement - Summary of Contracting Agency Benefits - (Continued)
Final Pre- SickPost
Ordinary 1959Compensation SurvivorRetirement Leave
RetirementDisabilityBenefit
FinalContribution Rate
Employer Name Offset Option 2 Credit IncreaseSurvivor
BenefitFormula Period COLA Member EmployerCompensation
Allowance
Santee, City ofMisc 70001 2% @ 55 1 3YY 17.408%2% 7.00Misc 70002 2.5% @ 55 1 3YY 17.408%2% 8.00Misc 70003 2.7% @ 55 1 3YY 17.408%2% 8.00Misc 70401 2% @ 55 1 3YY 17.408%2% 7.00Misc 70402 2.5% @ 55 1 3YY 17.408%2% 8.00Fire 74001 3% @ 50 1 8YY Y 33.093%2% 9.00Fire 74401 3% @ 50 1 8YY Y 33.093%2% 9.00
Saratoga, City ofMisc 70001 2% @ 55 1 3YY Y 11.603%2% 7.00Misc Y70002 2% @ 55 1 YY Y 11.603%2% 7.00
Sausalito, City ofMisc 70001 2% @ 55 1 1YY Y 15.577%2% 7.00Misc Y70002 2% @ 55 1 YY Y 15.577%2% 7.00Misc 70003 2.5% @ 55 1 1YY Y 15.577%2% 8.00Misc Y70004 2.5% @ 55 1 YY Y 15.577%2% 8.00Fire 74001 3% @ 55 1 4YY Y 23.397%2% 9.00Police 75001 3% @ 55 1 4YY Y 39.885%2% 9.00
Sausalito-Marin City Sanitary DistrictMisc 70001 2% @ 55 1 YY 16.854%2% 7.00Misc 70002 2.7% @ 55 1 YY 16.854%2% 8.00
School Risk and Insurance Management Group
Misc 70001 2% @ 55 1 3YY 13.825%2% 7.00Schools Excess Liability Fund
Misc 70001 2% @ 55 1 3YY 13.369%2% 7.00Schools Insurance Authority
Misc 70001 2% @ 55 1 8YY Y 12.413%2% 7.00Scotts Valley Fire Protection District
Misc 70001 2% @ 55 1 8YY 13.292%2% 7.00Fire 74001 3% @ 55 3 8YY 21.669%2% 9.00Fire 74002 3% @ 55 1 8YY 21.669%2% 9.00
Scotts Valley Water DistrictMisc Y70001 2% @ 55 1 YY 16.155%2% 7.00Misc 70002 2% @ 55 1 3YY 16.155%2% 7.00Misc Y70003 2.7% @ 55 1 YY 16.155%2% 8.00Misc 70004 2.7% @ 55 1 3YY 16.155%2% 8.00Misc 70101 2% @ 55 3 3YY 10.282%2% 7.00
Scotts Valley, City ofMisc Y70001 2% @ 55 1 YY 14.660%2% 7.00Misc 70002 2% @ 55 1 YY 14.660%2% 7.00Misc Y70003 2.5% @ 55 1 YY 14.660%2% 8.00Police Y75001 3% @ 50 3 YY 25.168%2% 9.00
Seal Beach, City ofMisc 70001 2% @ 55 1 3YY Y 9.874%2% 7.00Misc Y70002 2% @ 55 1 YY Y 9.874%2% 7.00Fire 74001 2% @ 50 1 1YY Y 0.000%2% 9.00Police 75001 3% @ 50 1 3YY Y 27.877%2% 9.00Safety 76001 3% @ 50 1 3YY Y 27.877%2% 9.00
Seaside, City ofMisc 70001 2% @ 55 1 4YY 11.143%2% 7.00Misc Y70401 2% @ 60 3 YY 11.143%2% 7.00Misc 70402 2% @ 60 3 4YY 11.143%2% 7.00Fire 74001 3% @ 50 1 4YY 26.924%2% 9.00Fire 74101 2% @ 50 1 4YY 20.742%2% 9.00Police 75001 3% @ 50 1 4YY 26.924%2% 9.00
391

5. CalPERS Supplement - Summary of Contracting Agency Benefits - (Continued)
Final Pre- SickPost
Ordinary 1959Compensation SurvivorRetirement Leave
RetirementDisabilityBenefit
FinalContribution Rate
Employer Name Offset Option 2 Credit IncreaseSurvivor
BenefitFormula Period COLA Member EmployerCompensation
Allowance
Sebastopol, City ofMisc 70001 2% @ 55 1 3YY 16.624%2% 7.00Misc Y70002 2% @ 55 1 YY 16.624%2% 7.00Fire 74001 3% @ 50 3 3YY 37.025%2% 9.00Fire Y74002 1/2 @ 55 3 YY 37.025%2% variesPolice 75001 3% @ 50 3 3YY 36.328%2% 9.00Police Y75002 1/2 @ 55 3 YY 36.328%2% varies
Selma Cemetery DistrictMisc Y70001 2% @ 55 3 YY Y 11.104%2% 7.00
Selma, City ofMisc Y70001 2% @ 60 3 YY 25.695%2% 7.00Misc Y70002 2.7% @ 55 3 YY 25.695%2% 8.00Fire Y74001 2% @ 50 3 YY 19.900%2% 9.00Police Y75001 2% @ 50 3 YY 19.900%2% 9.00
Selma-Kingsburg-Fowler County Sanitation District
Misc 70001 2% @ 55 3 4YY 17.883%5% 7.00Serrano Water District
Misc 70001 2% @ 60 1 YY 8.486%2% 7.00Sewer Authority Mid-Coastside
Misc 70001 2% @ 55 1 3YY Y 14.424%2% 7.00Sewerage Commission - Oroville Region
Misc Y70001 2% @ 60 1 YY 21.332%2% 7.00Misc 70002 2% @ 60 3 YY 21.332%2% 7.00Misc Y70003 2.5% @ 55 1 YY 21.332%2% 8.00
Shafter Wasco Irrigation DistrictMisc Y70001 2% @ 55 1 YY 10.781%2% 7.00Misc 70002 2% @ 55 1 YY 10.781%2% 7.00
Shafter, City ofMisc Y70001 2% @ 55 1 YY 17.175%2% 7.00Misc 70002 2% @ 55 1 YY 17.175%2% 7.00Police Y75001 3% @ 55 1 YY 21.669%2% 9.00Police 75002 3% @ 55 1 YY 21.669%2% 9.00
Shasta Area Safety Communications Agency
Misc 70001 2% @ 55 1 YY 13.301%2% 7.00Shasta Community Services District
Misc Y70001 2% @ 60 3 YY 0.954%2% 7.00Misc 70002 2% @ 60 3 YY 0.954%2% 7.00
Shasta Lake Fire Protection DistrictMisc 70001 2.5% @ 55 3 4YY 14.348%2% 8.00Fire 74001 3% @ 55 1 3YY 29.489%2% 9.00Fire 74401 3% @ 55 1 3YY 29.489%2% 9.00
Shasta Lake, City ofMisc 70001 2% @ 55 1 8YY 22.876%2% 7.00Misc 70002 3% @ 60 1 8YY 22.876%2% 8.00Misc Y70401 2% @ 55 1 YY 22.876%2% 7.00Misc Y70402 3% @ 60 1 YY 22.876%2% 8.00
Shasta Local Agency Formation Commission
Misc 70001 2.5% @ 55 3 8YY 16.434%2% 8.00Shasta Mosquito and Vector Control District
Misc Y70001 2% @ 55 1 YY 16.899%2% 7.00Shasta Valley Cemetery District
Misc Y70001 2% @ 60 3 YY 1.712%2% 7.00Misc 70002 2% @ 60 3 YY 1.712%2% 7.00
392
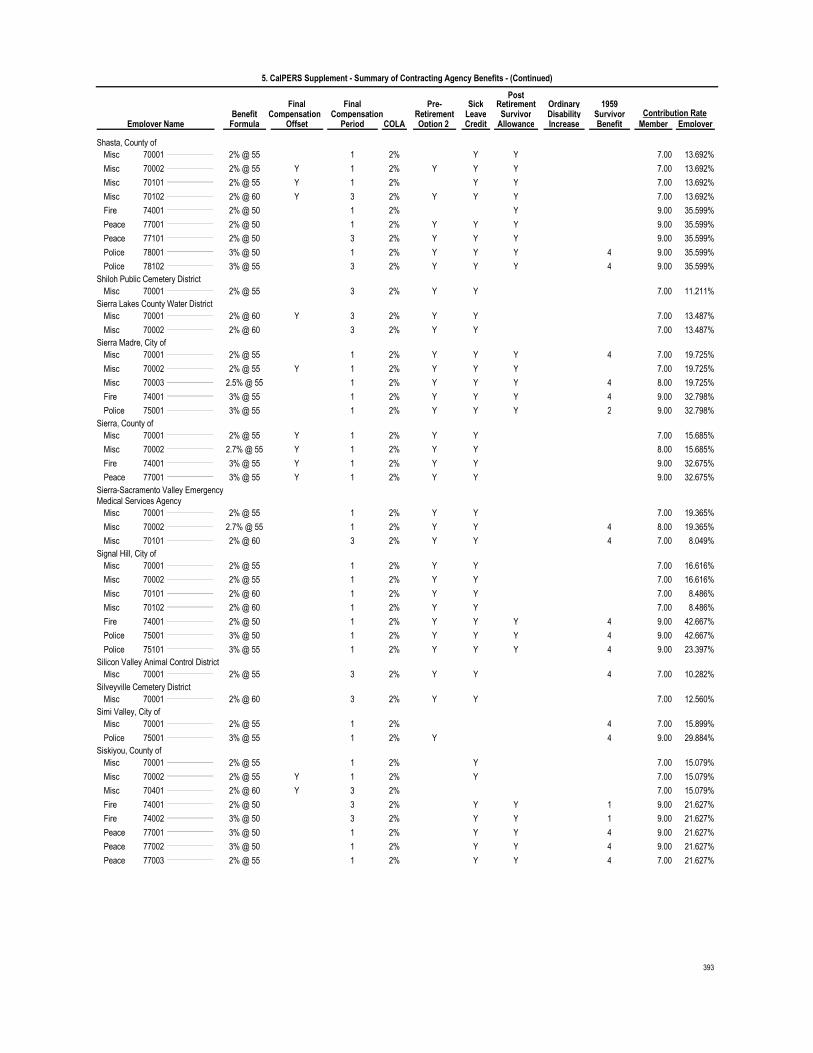
5. CalPERS Supplement - Summary of Contracting Agency Benefits - (Continued)
Final Pre- SickPost
Ordinary 1959Compensation SurvivorRetirement Leave
RetirementDisabilityBenefit
FinalContribution Rate
Employer Name Offset Option 2 Credit IncreaseSurvivor
BenefitFormula Period COLA Member EmployerCompensation
Allowance
Shasta, County ofMisc 70001 2% @ 55 1 Y Y 13.692%2% 7.00Misc Y70002 2% @ 55 1 YY Y 13.692%2% 7.00Misc Y70101 2% @ 55 1 Y Y 13.692%2% 7.00Misc Y70102 2% @ 60 3 YY Y 13.692%2% 7.00Fire 74001 2% @ 50 1 Y 35.599%2% 9.00Peace 77001 2% @ 50 1 YY Y 35.599%2% 9.00Peace 77101 2% @ 50 3 YY Y 35.599%2% 9.00Police 78001 3% @ 50 1 4YY Y 35.599%2% 9.00Police 78102 3% @ 55 3 4YY Y 35.599%2% 9.00
Shiloh Public Cemetery DistrictMisc 70001 2% @ 55 3 YY 11.211%2% 7.00
Sierra Lakes County Water DistrictMisc Y70001 2% @ 60 3 YY 13.487%2% 7.00Misc 70002 2% @ 60 3 YY 13.487%2% 7.00
Sierra Madre, City ofMisc 70001 2% @ 55 1 4YY Y 19.725%2% 7.00Misc Y70002 2% @ 55 1 YY Y 19.725%2% 7.00Misc 70003 2.5% @ 55 1 4YY Y 19.725%2% 8.00Fire 74001 3% @ 55 1 4YY Y 32.798%2% 9.00Police 75001 3% @ 55 1 2YY Y 32.798%2% 9.00
Sierra, County ofMisc Y70001 2% @ 55 1 YY 15.685%2% 7.00Misc Y70002 2.7% @ 55 1 YY 15.685%2% 8.00Fire Y74001 3% @ 55 1 YY 32.675%2% 9.00Peace Y77001 3% @ 55 1 YY 32.675%2% 9.00
Sierra-Sacramento Valley Emergency Medical Services Agency
Misc 70001 2% @ 55 1 YY 19.365%2% 7.00Misc 70002 2.7% @ 55 1 4YY 19.365%2% 8.00Misc 70101 2% @ 60 3 4YY 8.049%2% 7.00
Signal Hill, City ofMisc 70001 2% @ 55 1 YY 16.616%2% 7.00Misc 70002 2% @ 55 1 YY 16.616%2% 7.00Misc 70101 2% @ 60 1 YY 8.486%2% 7.00Misc 70102 2% @ 60 1 YY 8.486%2% 7.00Fire 74001 2% @ 50 1 4YY Y 42.667%2% 9.00Police 75001 3% @ 50 1 4YY Y 42.667%2% 9.00Police 75101 3% @ 55 1 4YY Y 23.397%2% 9.00
Silicon Valley Animal Control DistrictMisc 70001 2% @ 55 3 4YY 10.282%2% 7.00
Silveyville Cemetery DistrictMisc 70001 2% @ 60 3 YY 12.560%2% 7.00
Simi Valley, City ofMisc 70001 2% @ 55 1 4 15.899%2% 7.00Police 75001 3% @ 55 1 4Y 29.884%2% 9.00
Siskiyou, County ofMisc 70001 2% @ 55 1 Y 15.079%2% 7.00Misc Y70002 2% @ 55 1 Y 15.079%2% 7.00Misc Y70401 2% @ 60 3 15.079%2% 7.00Fire 74001 2% @ 50 3 1Y Y 21.627%2% 9.00Fire 74002 3% @ 50 3 1Y Y 21.627%2% 9.00Peace 77001 3% @ 50 1 4Y Y 21.627%2% 9.00Peace 77002 3% @ 50 1 4Y Y 21.627%2% 9.00Peace 77003 2% @ 55 1 4Y Y 21.627%2% 7.00
393

5. CalPERS Supplement - Summary of Contracting Agency Benefits - (Continued)
Final Pre- SickPost
Ordinary 1959Compensation SurvivorRetirement Leave
RetirementDisabilityBenefit
FinalContribution Rate
Employer Name Offset Option 2 Credit IncreaseSurvivor
BenefitFormula Period COLA Member EmployerCompensation
Allowance
Solana Beach, City ofMisc 70001 2% @ 55 1 2YY 14.660%2% 7.00Misc 70002 2.5% @ 55 1 2YY 14.660%2% 8.00Misc 70101 2% @ 60 3 2YY 8.049%2% 7.00Fire 74001 3% @ 50 1 8YY 26.149%2% 9.00Fire 74101 2% @ 50 3 8YY 19.900%2% 9.00Fire 74401 3% @ 50 1 8YY 26.149%2% 9.00Safety 76001 3% @ 50 1 2YY 26.149%2% 9.00
Solano County Mosquito Abatement DistrictMisc Y70001 2% @ 55 3 YY 17.435%2% 7.00Misc 70002 2% @ 55 3 YY 17.435%2% 7.00
Solano County Water AgencyMisc 70001 2% @ 55 1 3YY 12.846%2% 7.00
Solano Irrigation DistrictMisc 70001 2% @ 55 3 YY 17.972%2% 7.00Misc 70002 2.7% @ 55 3 YY 17.972%2% 8.00Misc 70101 2% @ 60 3 YY 8.049%2% 7.00
Solano Transportation AuthorityMisc 70001 2% @ 55 3 3YY 11.497%2% 7.00
Solano, County ofMisc Y70001 2% @ 55 1 Y 16.720%2% 7.00Misc 70002 2% @ 55 1 Y 16.720%2% 7.00Misc Y70003 2.7% @ 55 1 Y 16.720%2% 8.00Misc 70004 2.7% @ 55 1 Y 16.720%2% 8.00Misc Y70401 2% @ 55 1 16.720%2% 7.00Fire 74001 1/2 @ 55 1 1 20.699%2% variesFire 74002 2% @ 55 1 1 20.699%2% 7.00Peace 77001 1/2 @ 55 1 4Y 20.699%2% variesPeace 77002 2% @ 55 1 4Y 20.699%2% 7.00Peace 77003 2% @ 55 1 4Y 20.699%2% 7.00Peace 77004 2% @ 50 1 4Y 20.699%2% 9.00Peace 77005 2.7% @ 55 1 4Y 20.699%2% 8.00Police 78001 3% @ 50 1 4Y 20.699%2% 9.00Police 78101 3% @ 55 3 4Y 20.699%2% 9.00
Soledad Community Health Care DistrictMisc Y70001 2% @ 60 3 YY 0.000%2% 7.00
Soledad, City ofMisc 70001 2% @ 60 3 YY 8.260%2% 7.00Fire Y74001 3% @ 55 3 YY 22.921%2% 9.00Police Y75001 3% @ 55 3 YY 22.921%2% 9.00
Solvang, City ofMisc Y70001 2% @ 55 1 YY Y 18.775%2% 7.00Misc 70002 2% @ 55 1 YY Y 18.775%2% 7.00Misc Y70003 2.5% @ 55 1 YY Y 18.775%2% 8.00Misc Y70401 2% @ 55 1 YY Y 18.775%2% 7.00Misc 70402 2% @ 55 1 YY Y 18.775%2% 7.00Fire Y74001 2% @ 50 1 YY Y 0.000%2% 9.00
Sonoma County LibraryMisc 70001 2% @ 55 1 2Y 15.919%3% 7.00
Sonoma State Enterprises, Inc.Misc Y70001 2% @ 60 3 YY 0.000%2% 7.00
Sonoma Student Union CorporationMisc 70001 2% @ 55 1 YY 0.000%2% 7.00
Sonoma, City ofMisc 70001 2% @ 55 1 3YY Y 11.603%2% 7.00Misc Y70002 2% @ 55 1 YY Y 11.603%2% 7.00Fire 74001 3% @ 50 1 3YY Y 0.000%2% 9.00Fire 74002 3% @ 50 1 3YY Y 0.000%2% 9.00Police 75001 3% @ 50 3 4YY Y 0.000%2% 9.00Police 75002 3% @ 50 3 4YY Y 0.000%2% 9.00
Sonoma-Marin Area Rail Transit DistrictMisc 70001 2% @ 55 3 8YY 12.629%2% 7.00
394

5. CalPERS Supplement - Summary of Contracting Agency Benefits - (Continued)
Final Pre- SickPost
Ordinary 1959Compensation SurvivorRetirement Leave
RetirementDisabilityBenefit
FinalContribution Rate
Employer Name Offset Option 2 Credit IncreaseSurvivor
BenefitFormula Period COLA Member EmployerCompensation
Allowance
Sonora, City ofMisc Y70001 2% @ 55 1 YY Y 28.163%2% 7.00Misc 70002 2% @ 55 1 YY Y 28.163%2% 7.00Misc Y70003 2.7% @ 55 1 YY Y 28.163%2% 8.00Misc 70004 2.7% @ 55 1 YY Y 28.163%2% 8.00Fire Y74001 3% @ 50 1 YY 35.811%2% 9.00Police Y75001 3% @ 50 1 YY 44.233%2% 9.00
Soquel Creek Water DistrictMisc 70001 2% @ 55 3 4YY 14.556%2% 7.00Misc Y70002 2% @ 55 3 YY 14.556%2% 7.00Misc 70003 2.5% @ 55 3 4YY 14.556%2% 8.00Misc Y70004 2.5% @ 55 3 YY 14.556%2% 8.00Misc 70101 2.5% @ 55 3 4YY 14.083%2% 8.00
South Bay Regional Public Communications Authority
Misc 70001 2% @ 55 1 YY 10.781%2% 7.00South Bayside System Authority
Misc 70001 2% @ 55 1 4YY 10.781%2% 7.00Misc 70101 2% @ 60 3 4YY 8.049%2% 7.00
South Central Los Angeles Regional Center for Developmentally Disabled Persons
Misc 70001 3% @ 60 3 4 15.168%2% 8.00Misc 70101 2% @ 60 3 4 15.168%2% 7.00
South Coast Water DistrictMisc 70001 2% @ 55 1 4YY 10.781%2% 7.00Misc Y70401 2% @ 55 3 YY 10.781%2% 7.00Misc 70402 2% @ 55 1 4YY 10.781%2% 7.00
South County Fire Protection AuthorityMisc 70001 2% @ 55 1 2YY 0.000%2% 7.00Misc 70401 2% @ 55 1 2YY 0.000%2% 7.00Fire 74001 3% @ 50 1 3YY Y 0.000%2% 9.00Fire 74002 3% @ 50 3 3YY Y 0.000%2% 9.00Fire 74101 3% @ 55 1 3YY Y 0.000%2% 9.00Fire 74401 3% @ 50 1 3YY Y 0.000%2% 9.00Fire 74402 3% @ 50 1 3YY Y 0.000%2% 9.00
South County Support Services AgencyMisc 70001 2% @ 55 1 4YY Y 15.577%2% 7.00Misc 70002 2.5% @ 55 1 4YY Y 15.577%2% 8.00
South El Monte, City ofMisc Y70001 2% @ 55 1 YY 22.130%2% 7.00Misc 70002 2% @ 55 1 YY 22.130%2% 7.00Misc 70003 2% @ 55 1 YY 22.130%2% 7.00Misc 70004 2.5% @ 55 1 YY 22.130%2% 8.00
South Feather Water and Power AgencyMisc 70001 3% @ 60 3 YY 15.084%2% 8.00
South Gate, City ofMisc 70001 2% @ 55 1 4Y Y 14.652%2% 7.00Misc 70002 2.7% @ 55 1 4Y Y 14.652%2% 8.00Fire 74001 3% @ 50 1 YY Y 28.991%2% 9.00Police 75001 3% @ 50 1 YY Y 28.991%2% 9.00
South Kern Cemetery DistrictMisc Y70001 2% @ 60 3 YY 5.902%2% 7.00Misc 70002 2% @ 60 3 YY 5.902%2% 7.00Misc 70003 2% @ 60 3 YY 5.902%2% 7.00
395

5. CalPERS Supplement - Summary of Contracting Agency Benefits - (Continued)
Final Pre- SickPost
Ordinary 1959Compensation SurvivorRetirement Leave
RetirementDisabilityBenefit
FinalContribution Rate
Employer Name Offset Option 2 Credit IncreaseSurvivor
BenefitFormula Period COLA Member EmployerCompensation
Allowance
South Lake Tahoe, City ofMisc 70001 2% @ 55 3 8Y 24.588%2% 7.00Misc Y70002 2% @ 55 3 Y 24.588%2% 7.00Misc 70003 2.7% @ 55 3 8Y 24.588%2% 8.00Misc Y70004 2.7% @ 55 3 Y 24.588%2% 8.00Fire 74001 3% @ 50 1 8YY Y 60.962%2% 9.00Fire 74101 3% @ 50 3 8YY Y 26.896%2% 9.00Police 75001 3% @ 50 1 1YY Y 53.922%2% 9.00Police 75101 3% @ 50 3 1YY Y 26.896%2% 9.00Police 75102 3% @ 55 3 1YY Y 22.502%2% 9.00
South Orange County Waste Water Authority
Misc 70001 2% @ 55 1 4YY 14.660%2% 7.00Misc 70002 2.5% @ 55 1 4YY 14.660%2% 8.00Misc 70101 2% @ 55 1 4YY 10.781%2% 7.00Misc 70401 2% @ 55 1 4YY 14.660%2% 7.00Misc 70402 2% @ 55 1 4YY 14.660%2% 7.00Misc 70403 2.5% @ 55 1 4YY 14.660%2% 8.00
South Pasadena, City ofMisc 70001 2% @ 55 1 1YY Y 14.828%2% 7.00Fire 74001 2% @ 50 1 1YY Y 22.145%2% 9.00Police 75001 2% @ 50 1 1YY Y 22.145%2% 9.00
South Placer Fire DistrictMisc 70001 2% @ 55 1 1YY 29.141%2% 7.00Misc 70002 3% @ 60 1 1YY 29.141%2% 8.00Fire 74001 3% @ 55 1 1YY 25.658%2% 9.00
South Placer Municipal Utility DistrictMisc Y70001 2% @ 55 1 YY 15.685%2% 7.00Misc 70002 2% @ 55 1 YY 15.685%2% 7.00Misc Y70003 2.7% @ 55 1 YY 15.685%2% 8.00
South San Francisco, City ofMisc 70001 2% @ 55 1 1Y Y 22.081%2% 7.00Misc Y70002 2% @ 55 1 Y Y 22.081%2% 7.00Misc Y70003 2.7% @ 55 1 Y Y 22.081%2% 8.00Misc Y70103 2% @ 60 3 Y Y 22.081%2% 7.00Fire 74001 3% @ 50 1 3YY Y 36.470%2% 9.00Fire 74101 3% @ 55 3 3YY Y 36.470%2% 9.00Police 75001 3% @ 50 1 3Y Y 36.470%2% 9.00Police 75101 3% @ 55 3 3Y Y 36.470%2% 9.00
South San Joaquin Irrigation DistrictMisc Y70001 2% @ 60 1 YY 18.324%2% 7.00Misc 70002 2% @ 60 1 YY 18.324%2% 7.00Misc Y70003 2.5% @ 55 1 YY 18.324%2% 8.00
South San Luis Obispo County Sanitation District
Misc Y70001 2% @ 55 3 YY 11.403%2% 7.00Misc 70002 2% @ 55 3 YY 11.403%2% 7.00Misc Y70003 2.5% @ 55 3 YY 11.403%2% 8.00
South Tahoe Public Utility DistrictMisc 70001 2% @ 55 3 YY 16.201%2% 7.00Misc 70002 2.7% @ 55 3 YY 16.201%2% 8.00
Southeast Area Social Services Funding Authority
Misc 70001 2% @ 60 1 4YY 16.476%2% 7.00Misc 70002 2.5% @ 55 1 4YY 16.476%2% 8.00Misc 70101 2% @ 60 1 4YY 8.486%2% 7.00
Southern California Association of Governments
Misc 70001 2% @ 55 1 Y 15.046%2% 7.00Southern California Public Power Authority
Misc 70001 2% @ 55 1 YY 18.577%3% 7.00Misc 70002 2.5% @ 55 1 YY 18.577%3% 8.00
396

5. CalPERS Supplement - Summary of Contracting Agency Benefits - (Continued)
Final Pre- SickPost
Ordinary 1959Compensation SurvivorRetirement Leave
RetirementDisabilityBenefit
FinalContribution Rate
Employer Name Offset Option 2 Credit IncreaseSurvivor
BenefitFormula Period COLA Member EmployerCompensation
Allowance
Southern California Regional Rail AuthorityMisc 70001 2% @ 60 3 3 9.125%2% 7.00
Southern San Joaquin Municipal Utility District
Misc Y70001 2% @ 55 1 YY 22.947%2% 7.00Misc 70002 2% @ 55 1 YY 22.947%2% 7.00Misc Y70003 3% @ 60 1 YY 22.947%2% 8.00
Southern Sonoma County Resource Conservation District
Misc 70001 2% @ 55 3 YY 20.915%2% 7.00Southwest Transportation Agency
Misc Y70001 2% @ 55 1 YY Y 21.980%2% 7.00Misc 70002 2% @ 55 1 YY Y 21.980%2% 7.00Misc Y70003 2.5% @ 55 1 YY Y 21.980%2% 8.00
Special District Risk Management AuthorityMisc 70001 2% @ 55 3 YY 10.282%2% 7.00Misc 70002 2% @ 55 3 YY 10.282%2% 7.00
Squaw Valley Public Service DistrictMisc Y70001 2% @ 55 1 YY Y 17.177%2% 7.00Misc 70002 2% @ 55 1 YY Y 17.177%2% 7.00Misc Y70003 2.7% @ 55 1 YY Y 17.177%2% 8.00Misc 70004 2.7% @ 55 1 YY Y 17.177%2% 8.00Misc Y70101 2% @ 55 3 YY Y 11.595%2% 7.00Misc 70102 2% @ 55 3 YY Y 11.595%2% 7.00Fire Y74001 3% @ 50 1 YY 26.149%2% 9.00Fire Y74101 3% @ 50 1 YY 26.149%2% 9.00Fire Y74401 3% @ 50 1 YY 26.149%2% 9.00Fire Y74402 3% @ 50 1 YY 26.149%2% 9.00
St. Helena, City ofMisc Y70001 2% @ 55 1 YY 15.714%2% 7.00Fire Y74001 1/2 @ 55 3 YY 48.403%2% variesPolice Y75001 3% @ 50 3 YY 48.403%2% 9.00Police 75002 3% @ 50 1 YY 48.403%2% 9.00
Stallion Springs Community Services District
Misc Y70001 2% @ 60 3 YY 8.049%2% 7.00Police Y75001 3% @ 55 3 YY 20.774%2% 9.00
Stanislaus Consolidated Fire Protection District
Misc 70001 2% @ 55 1 4YY 15.685%2% 7.00Misc 70002 2.7% @ 55 1 4YY 15.685%2% 8.00Misc 70401 2% @ 60 1 YY 15.685%2% 7.00Fire 74001 3% @ 50 1 4YY 26.149%2% 9.00Fire 74401 3% @ 50 1 YY 26.149%2% 9.00
Stanislaus County Housing AuthorityMisc Y70001 2% @ 60 3 YY 4.474%2% 7.00Misc 70002 2% @ 60 3 YY 4.474%2% 7.00Misc Y70101 2% @ 60 3 YY 4.474%2% 7.00Misc 70102 2% @ 60 3 YY 4.474%2% 7.00
Stanton, City ofMisc 70001 2% @ 55 1 2YY 14.141%2% 7.00Fire 74001 1/2 @ 55 3 2YY 0.000%2% variesPolice 75001 1/2 @ 55 3 2YY 0.000%2% varies
State Bar of CaliforniaMisc Y70001 2% @ 55 1 Y 9.104%4% 7.00Misc 70002 2% @ 55 1 Y 9.104%4% 7.00Misc 70003 2% @ 55 1 Y 9.104%4% 7.00
State Water ContractorsMisc 70001 2% @ 55 1 YY 18.220%2% 7.00
Stege Sanitary DistrictMisc 70001 2% @ 55 1 8YY 16.020%2% 7.00
397

5. CalPERS Supplement - Summary of Contracting Agency Benefits - (Continued)
Final Pre- SickPost
Ordinary 1959Compensation SurvivorRetirement Leave
RetirementDisabilityBenefit
FinalContribution Rate
Employer Name Offset Option 2 Credit IncreaseSurvivor
BenefitFormula Period COLA Member EmployerCompensation
Allowance
Stinson Beach County Water DistrictMisc 70001 2% @ 55 3 4YY 23.602%2% 7.00Misc 70002 2.7% @ 55 3 4YY 23.602%2% 8.00
Stockton East Water DistrictMisc Y70001 2% @ 55 1 YY Y 15.510%5% 7.00Misc 70002 2% @ 55 1 4YY Y 15.510%5% 7.00
Stockton Unified School DistrictPolice 75001 3% @ 50 3 3YY Y 36.066%2% 9.00
Stockton, City ofMisc 70001 2% @ 55 1 4Y Y 17.939%5% 7.00Misc Y70002 2% @ 55 1 Y Y 17.939%5% 7.00Misc Y70401 2% @ 60 3 Y 17.939%2% 7.00Misc 70402 2% @ 60 3 4Y 17.939%2% 7.00Fire 74001 3% @ 50 1 4Y Y 34.605%2% 9.00Police 75001 3% @ 50 1 4Y Y 34.605%2% 9.00
Strawberry Recreation DistrictMisc Y70001 2% @ 60 3 YY 6.645%2% 7.00
Successor Agency To The Redevelopment of the City of Fresno
Misc 70001 2% @ 55 1 YY 13.249%2% 7.00Suisun City, City of
Misc 70001 2% @ 55 1 3YY 12.955%2% 7.00Fire 74001 2% @ 55 1 3YY 28.768%2% 7.00Police 75001 3% @ 50 1 4YY 39.445%2% 9.00
Suisun Fire Protection DistrictFire Y74001 3% @ 50 3 YY 37.606%2% 9.00Fire Y74101 2% @ 50 3 YY 37.606%2% 9.00
Suisun Resource Conservation DistrictMisc Y70001 2% @ 55 3 YY 12.586%2% 7.00
Suisun-Fairfield-Rockville Cemetery DistrictMisc 70001 2% @ 55 1 3YY 14.716%2% 7.00Misc 70002 2.7% @ 55 1 3YY 14.716%2% 8.00Misc Y70401 2% @ 60 3 YY 14.716%2% 7.00
Summit Cemetery DistrictMisc 70001 2% @ 55 1 4YY 24.287%2% 7.00Misc 70002 2.5% @ 55 1 4YY 24.287%2% 8.00Misc Y70401 2% @ 55 1 YY 24.287%2% 7.00Misc Y70402 2% @ 55 1 YY 24.287%2% 7.00Misc Y70403 2.5% @ 55 1 YY 24.287%2% 8.00Misc Y70404 2.5% @ 55 1 YY 24.287%2% 8.00
Sunnyslope County Water DistrictMisc 70001 2% @ 55 1 3YY 15.685%2% 7.00Misc 70002 2.7% @ 55 1 3YY 15.685%2% 8.00
Sunnyvale, City ofMisc 70001 2% @ 55 1 3 21.506%2% 7.00Misc 70002 2.7% @ 55 1 3 21.506%2% 8.00Fire 74001 3% @ 50 1 1Y 36.058%2% 9.00Police 75001 3% @ 50 1 3Y 36.058%2% 9.00
Susanville Consolidated Sanitary DistrictMisc 70001 2% @ 55 3 4YY 27.613%2% 7.00Misc Y70002 2% @ 55 3 YY 27.613%2% 7.00Misc 70003 2.5% @ 55 3 4YY 27.613%2% 8.00
Susanville, City ofMisc Y70001 2% @ 55 1 YY 27.107%2% 7.00Misc 70002 2% @ 55 1 YY 27.107%2% 7.00Misc Y70003 3% @ 60 1 YY 27.107%2% 8.00Fire Y74001 3% @ 50 1 YY 42.699%2% 9.00Police 75001 3% @ 50 1 2YY 42.699%2% 9.00Police 75002 3% @ 50 1 2YY 42.699%2% 9.00
Sutter Cemetery DistrictMisc Y70001 2% @ 55 3 YY 8.341%2% 7.00Misc 70002 2% @ 60 3 YY 8.341%2% 7.00
398

5. CalPERS Supplement - Summary of Contracting Agency Benefits - (Continued)
Final Pre- SickPost
Ordinary 1959Compensation SurvivorRetirement Leave
RetirementDisabilityBenefit
FinalContribution Rate
Employer Name Offset Option 2 Credit IncreaseSurvivor
BenefitFormula Period COLA Member EmployerCompensation
Allowance
Sutter County Housing AuthorityMisc Y70001 2% @ 55 1 YY 13.644%2% 7.00Misc 70002 2% @ 60 1 YY 13.644%2% 7.00
Sutter Creek, City ofMisc Y70001 2% @ 55 1 YY 30.615%2% 7.00Misc 70002 2% @ 55 1 YY 30.615%2% 7.00Misc Y70003 3% @ 60 1 YY 30.615%2% 8.00Police Y75001 3% @ 50 1 YY 29.191%2% 9.00
Sutter, County ofMisc Y70001 2% @ 55 1 Y 19.827%2% 7.00Misc Y70002 2.7% @ 55 1 YY 19.827%2% 8.00Fire 74001 2% @ 50 3 Y 28.491%2% 9.00Fire Y74002 2% @ 50 3 Y 28.491%2% 9.00Fire Y74003 3% @ 50 1 YY 28.491%2% 9.00Peace Y77001 2% @ 50 3 28.491%2% 9.00Peace Y77002 3% @ 50 3 28.491%2% 9.00Peace Y77003 3% @ 50 1 YY 28.491%2% 9.00Peace Y77004 2% @ 55 3 Y 28.491%2% 7.00
Sweetwater AuthorityMisc Y70001 2% @ 55 1 YY 20.963%2% 7.00Misc 70002 2% @ 55 1 Y 20.963%2% 7.00Misc 70003 2% @ 55 1 YY 20.963%2% 7.00Misc 70004 2.5% @ 55 1 YY 20.963%2% 8.00
Sweetwater Springs Water DistrictMisc 70001 2% @ 55 3 3YY 10.282%2% 7.00
Sylvan Cemetery DistrictMisc 70001 2% @ 60 3 YY Y 9.547%2% 7.00
Taft, City ofMisc Y70001 2% @ 55 3 YY 10.282%2% 7.00Misc 70002 2% @ 55 3 YY 10.282%2% 7.00Fire Y74001 2% @ 50 3 YY 0.000%2% 9.00Fire Y74101 2% @ 55 3 YY 0.000%2% 7.00Police Y75001 2% @ 50 3 YY 105.223%2% 9.00Police Y75101 2% @ 55 3 YY 16.060%2% 7.00
Tahoe City Public Utility DistrictMisc Y70001 2% @ 55 1 YY 15.685%2% 7.00Misc 70002 2% @ 55 1 YY 15.685%2% 7.00Misc Y70003 2.7% @ 55 1 YY 15.685%2% 8.00Misc 70004 2.7% @ 55 1 YY 15.685%2% 8.00
Tahoe Resource Conservation DistrictMisc Y70001 2% @ 60 3 YY Y 8.991%2% 7.00
Tahoe-Truckee Sanitation AgencyMisc 70001 2% @ 55 3 3YY 16.246%3% 7.00Misc 70002 2.7% @ 55 3 3YY 16.246%3% 8.00
Tehachapi Valley Recreation and Park District
Misc Y70001 2% @ 60 3 YY 2.192%2% 7.00Misc 70002 2% @ 60 3 YY 2.192%2% 7.00
Tehachapi, City ofMisc Y70001 2% @ 55 3 YY 11.286%2% 7.00Misc 70002 2% @ 60 3 YY 11.286%2% 7.00Fire Y74001 2% @ 55 3 YY 0.000%2% 7.00Police Y75001 3% @ 50 1 YY 26.149%2% 9.00
Tehachapi-Cummings County Water DistrictMisc Y70001 2% @ 60 1 YY 8.961%2% 7.00
Tehama County Mosquito Abatement District
Misc 70001 2% @ 60 3 3YY 8.857%2% 7.00
399

5. CalPERS Supplement - Summary of Contracting Agency Benefits - (Continued)
Final Pre- SickPost
Ordinary 1959Compensation SurvivorRetirement Leave
RetirementDisabilityBenefit
FinalContribution Rate
Employer Name Offset Option 2 Credit IncreaseSurvivor
BenefitFormula Period COLA Member EmployerCompensation
Allowance
Tehama, County ofMisc Y70001 2% @ 55 1 Y 13.681%2% 7.00Misc 70002 2% @ 55 1 Y 13.681%2% 7.00Fire Y74001 2% @ 50 1 25.967%2% 9.00Fire Y74002 2% @ 50 1 25.967%2% 9.00Peace Y77001 2% @ 50 1 25.967%2% 9.00Peace Y77002 3% @ 55 1 25.967%2% 9.00Peace Y77003 2% @ 55 1 25.967%2% 7.00
Temecula, City ofMisc 70001 2% @ 55 1 4Y 22.514%2% 7.00Misc 70002 2.5% @ 55 1 4Y 22.514%2% 8.00Misc 70003 2.7% @ 55 1 4Y 22.514%2% 8.00
Temple City, City ofMisc 70001 2% @ 55 1 4YY Y 15.577%2% 7.00Misc Y70002 2% @ 55 1 YY Y 15.577%2% 7.00Misc 70003 2.5% @ 55 1 4YY Y 15.577%2% 8.00Misc Y70004 2.5% @ 55 1 YY Y 15.577%2% 8.00
Templeton Community Services DistrictMisc 70001 2% @ 55 1 YY 24.881%2% 7.00Misc 70002 2% @ 55 1 YY 24.881%2% 7.00Misc 70003 3% @ 60 1 YY 24.881%2% 8.00Fire 74001 3% @ 50 1 YY 57.901%2% 9.00
Thermalito Irrigation DistrictMisc 70001 3% @ 60 3 YY 31.046%2% 8.00
Thousand Oaks, City ofMisc 70001 2% @ 55 1 4Y 16.850%2% 7.00Misc 70101 2% @ 55 1 4Y 16.850%2% 7.00
Three Arch Bay Community Services District
Misc 70001 2% @ 60 3 YY 0.000%2% 7.00Three Rivers Community Services District
Misc 70001 2% @ 60 3 4YY 12.247%2% 7.00Three Valleys Municipal Water District
Misc 70001 2% @ 55 1 4YY 10.781%2% 7.00Tiburon Fire Protection District
Misc 70001 2% @ 55 1 4YY 15.685%2% 7.00Misc 70002 2.7% @ 55 1 4YY 15.685%2% 8.00Fire 74001 3% @ 55 1 4YY 21.669%2% 9.00
Tiburon, Town ofMisc 70001 2% @ 55 1 4YY 10.781%2% 7.00Police 75001 3% @ 55 3 1YY 20.774%2% 9.00
Torrance City Redevelopment AgencyMisc 70001 2% @ 60 1 YY Y 0.000%2% 7.00
Torrance, City ofMisc 70001 2% @ 55 1 Y Y 13.615%2% 7.00Fire 74001 3% @ 50 1 4Y Y Y 42.642%2% 9.00Police 75001 3% @ 50 1 4Y Y 47.944%2% 9.00
Trabuco Canyon Water DistrictMisc 70001 2% @ 55 1 YY Y Y 16.050%2% 7.00Misc 70002 2.5% @ 55 1 YY Y Y 16.050%2% 8.00
Tracy Rural County Fire Protection DistrictMisc 70001 2% @ 60 3 YY 0.000%2% 7.00Misc Y70002 2% @ 60 3 YY 0.000%2% 7.00Fire 74001 3% @ 55 1 YY 0.000%2% 9.00
Tracy, City ofMisc Y70001 2% @ 55 1 15.125%2% 7.00Misc Y70002 2.5% @ 55 1 15.125%2% 8.00Misc Y70101 2% @ 55 3 15.125%2% 7.00Fire 74001 3% @ 55 1 4Y Y 27.693%2% 9.00Fire 74101 3% @ 55 1 4Y 27.693%2% 9.00Police 75001 3% @ 50 1 4Y 27.693%2% 9.00Police 75101 3% @ 55 1 4Y 27.693%2% 9.00
400

5. CalPERS Supplement - Summary of Contracting Agency Benefits - (Continued)
Final Pre- SickPost
Ordinary 1959Compensation SurvivorRetirement Leave
RetirementDisabilityBenefit
FinalContribution Rate
Employer Name Offset Option 2 Credit IncreaseSurvivor
BenefitFormula Period COLA Member EmployerCompensation
Allowance
Transbay Joint Powers AuthorityMisc 70001 2% @ 55 1 4YY 10.781%2% 7.00
Transportation Agency for Monterey CountyMisc 70001 2% @ 55 1 3YY 12.292%2% 7.00
Treasure Island Development AuthorityMisc 70001 2% @ 55 1 4YY 0.000%2% 7.00
Tri-City Mental Health CenterMisc 70001 2% @ 55 1 3YY 9.584%2% 7.00
Tri-Counties Association for the Developmentally Disabled
Misc 70001 2% @ 60 1 3Y 15.348%2% 7.00Misc 70002 3% @ 60 1 3Y 15.348%2% 8.00Misc 70101 2% @ 60 3 3 15.348%2% 7.00
Tri-County Schools Insurance GroupMisc 70001 2% @ 55 1 YY 15.685%2% 7.00Misc 70002 2.7% @ 55 1 YY 15.685%2% 8.00
Tri-Dam Housing and Personnel AgencyMisc Y70001 2% @ 55 1 YY 14.660%2% 7.00Misc 70002 2% @ 60 1 YY 14.660%2% 7.00Misc Y70003 2.5% @ 55 1 YY 14.660%2% 8.00
Trindel Insurance FundMisc 70001 2.5% @ 55 1 4YY 14.660%2% 8.00
Trinity County Waterworks District No. 1Misc 70001 2% @ 55 3 YY 28.298%2% 7.00Misc 70002 2.7% @ 55 3 YY 28.298%2% 8.00
Trinity Public Utilities DistrictMisc 70001 3% @ 60 3 YY 21.061%2% 8.00
Trinity, County ofMisc Y70001 2% @ 55 3 Y 26.426%2% 7.00Misc Y70002 2.5% @ 55 3 Y 26.426%2% 8.00Peace Y77001 3% @ 50 3 YY 39.423%2% 9.00
Truckee Donner Public Utility DistrictMisc 70001 2% @ 60 3 YY 15.064%2% 7.00Misc 70002 2.7% @ 55 3 YY 15.064%2% 8.00
Truckee Fire Protection DistrictMisc 70001 2% @ 55 1 4YY Y Y 25.084%3% 7.00Misc 70002 2.7% @ 55 1 4YY Y Y 25.084%3% 8.00Fire 74001 3% @ 55 1 4YY Y Y 27.801%3% 9.00
Truckee Sanitary DistrictMisc 70001 2% @ 55 3 YY 15.064%2% 7.00Misc 70002 2.7% @ 55 3 YY 15.064%2% 8.00
Truckee, Town ofMisc 70001 2% @ 55 1 3YY Y 16.707%2% 7.00Misc 70002 2.7% @ 55 1 3YY Y 16.707%2% 8.00Police 75001 3% @ 50 1 8YY Y 27.877%2% 9.00
Truckee-Tahoe Airport DistrictMisc 70001 2% @ 55 1 4YY 15.685%2% 7.00Misc 70002 2.7% @ 55 1 4YY 15.685%2% 8.00
Tulare Mosquito Abatement DistrictMisc Y70001 2% @ 60 3 YY 4.372%2% 7.00
Tulare Public CemeteryMisc Y70001 2% @ 60 3 YY 0.000%2% 7.00
401

5. CalPERS Supplement - Summary of Contracting Agency Benefits - (Continued)
Final Pre- SickPost
Ordinary 1959Compensation SurvivorRetirement Leave
RetirementDisabilityBenefit
FinalContribution Rate
Employer Name Offset Option 2 Credit IncreaseSurvivor
BenefitFormula Period COLA Member EmployerCompensation
Allowance
Tulare, City ofMisc 70001 2% @ 55 1 4YY 21.496%2% 7.00Misc Y70002 2% @ 55 1 YY 21.496%2% 7.00Misc 70003 2.7% @ 55 1 4YY 21.496%2% 8.00Misc 70101 2.5% @ 55 1 4YY 21.496%2% 8.00Misc Y70401 2% @ 55 3 Y 21.496%2% 7.00Misc 70402 2% @ 55 3 Y 21.496%2% 7.00Misc Y70403 2.7% @ 55 3 Y 21.496%2% 8.00Fire 74001 3% @ 50 1 4YY 39.311%2% 9.00Fire 74003 3% @ 50 1 4YY 39.311%2% 9.00Fire 74101 3% @ 55 1 4YY 21.669%2% 9.00Police 75001 3% @ 50 1 4YY 34.499%2% 9.00Police 75003 3% @ 50 1 4YY 34.499%2% 9.00
Tulelake, City ofMisc Y70001 2% @ 55 3 YY 0.000%2% 7.00Police Y75001 2% @ 55 3 YY 11.703%2% 7.00
Tuolumne Fire Protection DistrictFire 74001 3% @ 55 3 4YY 23.442%2% 9.00
Tuolumne Utilities DistrictMisc 70001 2% @ 55 1 3YY 21.866%2% 7.00Misc Y70002 2% @ 55 1 YY 21.866%2% 7.00Misc 70003 2.7% @ 55 1 3YY 21.866%2% 8.00Misc Y70004 2.7% @ 55 1 YY 21.866%2% 8.00Misc Y70401 2% @ 55 1 YY 21.866%2% 7.00Misc Y70402 2% @ 55 1 YY 21.866%2% 7.00Misc Y70403 2.7% @ 55 1 YY 21.866%2% 8.00Misc Y70404 2.7% @ 55 1 YY 21.866%2% 8.00
Tuolumne, County ofMisc Y70001 2% @ 55 1 13.958%2% 7.00Misc 70002 2% @ 55 1 13.958%2% 7.00Misc Y70101 2% @ 60 3 13.958%2% 7.00Fire 74001 1/2 @ 55 1 YY 34.253%2% variesPeace 77001 3% @ 50 1 YY 34.253%2% 9.00Peace 77002 3% @ 50 1 YY 34.253%2% 9.00Peace 77101 2% @ 50 3 YY 19.900%2% 9.00
Turlock Mosquito Abatement DistrictMisc Y70001 2% @ 55 3 YY 10.282%2% 7.00Misc 70002 2% @ 55 3 YY 10.282%2% 7.00Misc Y70101 2% @ 60 3 YY 8.049%2% 7.00
Turlock, City ofMisc 70001 2% @ 55 1 3Y 20.939%2% 7.00Misc Y70002 2% @ 55 1 Y 20.939%2% 7.00Misc 70003 2.7% @ 55 1 3Y 20.939%2% 8.00Fire 74001 3% @ 50 1 4YY 30.802%2% 9.00Police 75001 3% @ 50 1 4YY 32.148%2% 9.00
Tustin, City ofMisc 70001 2% @ 55 1 3 10.962%2% 7.00Misc 70002 2% @ 55 1 3 10.962%2% 7.00Fire 74001 1/2 @ 55 3 1YY 34.671%2% variesPolice 75001 3% @ 50 1 4YY 34.671%2% 9.00Police 75002 3% @ 50 1 4YY 34.671%2% 9.00
Twain Harte Community Services DistrictMisc 70001 3% @ 60 3 4YY 15.084%2% 8.00Fire 74001 3% @ 55 3 4YY 20.774%2% 9.00
Twentynine Palms Water DistrictMisc Y70001 2% @ 55 3 YY 16.866%2% 7.00Misc Y70002 3% @ 60 3 YY 16.866%2% 8.00Fire Y74001 3% @ 55 3 YY 20.318%2% 9.00
Twentynine Palms, City ofMisc 70001 2% @ 55 1 3YY 19.329%2% 7.00Misc 70002 2.5% @ 55 1 3YY 19.329%2% 8.00
402

5. CalPERS Supplement - Summary of Contracting Agency Benefits - (Continued)
Final Pre- SickPost
Ordinary 1959Compensation SurvivorRetirement Leave
RetirementDisabilityBenefit
FinalContribution Rate
Employer Name Offset Option 2 Credit IncreaseSurvivor
BenefitFormula Period COLA Member EmployerCompensation
Allowance
Twin Cities Police AuthorityMisc 70001 2% @ 55 1 4YY Y 29.609%2% 7.00Misc 70002 2.5% @ 55 1 4YY Y 29.609%2% 8.00Misc 70101 2% @ 55 1 4YY 29.609%2% 7.00Misc 70102 2.5% @ 55 1 4YY 29.609%2% 8.00Police 75001 3% @ 55 1 4YY Y 285.835%2% 9.00Police 75101 3% @ 55 1 4YY 25.579%2% 9.00Police 75401 3% @ 55 1 1YY Y 285.835%2% 9.00Police 75402 3% @ 55 3 YY 25.579%2% 9.00
Twin Rivers Unified School DistrictPolice 75001 3% @ 50 1 4YY Y 34.747%3% 9.00Police 75401 3% @ 50 1 4YY Y 34.747%3% 9.00
Ukiah Valley Fire DistrictMisc 70001 2% @ 60 3 YY 0.000%2% 7.00Fire 74001 2% @ 50 1 4YY 20.176%2% 9.00
Ukiah, City ofMisc Y70001 2% @ 55 1 Y Y 26.237%2% 7.00Misc 70002 2% @ 55 1 3Y Y 26.237%2% 7.00Misc Y70003 2.7% @ 55 1 Y Y 26.237%2% 8.00Misc 70004 2.7% @ 55 1 3Y Y 26.237%2% 8.00Fire 74001 3% @ 55 1 3YY Y 32.763%2% 9.00Police 75001 3% @ 50 1 4YY Y 37.852%2% 9.00
Union City, City ofMisc 70001 2% @ 55 1 3YY Y Y 18.549%2% 7.00Misc Y70002 2% @ 55 1 YY Y Y 18.549%2% 7.00Misc 70003 2.5% @ 55 1 3YY Y Y 18.549%2% 8.00Misc Y70004 2.5% @ 55 1 YY Y Y 18.549%2% 8.00Misc 70101 2% @ 60 3 3YY Y Y 18.549%2% 7.00Fire 74002 3% @ 50 1 1YY Y 18.362%2% 9.00Fire 74101 3% @ 55 3 1YY Y 20.774%2% 9.00Police 75001 3% @ 50 1 1YY Y 18.362%2% 9.00Police 75101 3% @ 55 3 1YY Y 20.774%2% 9.00
Union Public Utility DistrictMisc Y70001 2% @ 60 3 YY 15.330%2% 7.00Misc 70002 2% @ 60 3 YY 15.330%2% 7.00
Union Sanitary DistrictMisc 70001 2% @ 55 1 4Y 16.399%2% 7.00Misc Y70002 2% @ 55 1 Y 16.399%2% 7.00Misc 70003 2.5% @ 55 1 4Y 16.399%2% 8.00Misc Y70004 2.5% @ 55 1 Y 16.399%2% 8.00
United Water Conservation DistrictMisc Y70001 2% @ 55 1 YY 20.638%2% 7.00Misc 70002 2% @ 55 1 YY 20.638%2% 7.00Misc Y70003 2.5% @ 55 1 YY 20.638%2% 8.00
University Enterprises Inc.Misc Y70001 2% @ 55 1 Y 12.977%2% 5.00Misc 70002 2% @ 55 1 Y 12.977%2% 6.00Misc 70401 2% @ 55 1 Y 12.977%2% 6.00Misc Y70402 2% @ 55 1 Y 12.977%2% 5.00
Upland City Housing AuthorityMisc Y70001 2% @ 55 3 YY 12.851%2% 7.00
Upland, City ofMisc 70001 2% @ 55 1 3Y 19.198%2% 7.00Misc 70002 2.5% @ 55 1 3Y 19.198%2% 8.00Fire 74001 3% @ 55 1 3Y 33.139%2% 9.00Police 75001 3% @ 55 1 3Y 33.139%2% 9.00
Upper San Gabriel Valley Municipal Water District
Misc 70001 2% @ 55 1 4YY Y 27.587%5% 7.00Misc 70002 2.7% @ 55 1 4YY Y 27.587%5% 8.00
403

5. CalPERS Supplement - Summary of Contracting Agency Benefits - (Continued)
Final Pre- SickPost
Ordinary 1959Compensation SurvivorRetirement Leave
RetirementDisabilityBenefit
FinalContribution Rate
Employer Name Offset Option 2 Credit IncreaseSurvivor
BenefitFormula Period COLA Member EmployerCompensation
Allowance
Vacaville Fire Protection DistrictMisc 70001 2% @ 60 3 YY 8.689%2% 7.00Fire 74001 2% @ 55 3 YY 16.030%2% 7.00Fire 74401 2% @ 55 3 YY 16.030%2% 7.00
Vacaville, City ofMisc Y70001 2% @ 55 1 YY Y 16.959%2% 7.00Misc 70002 2% @ 55 1 4YY Y 16.959%2% 7.00Fire 74001 3% @ 50 1 4YY Y Y 39.856%2% 9.00Fire 74101 2% @ 50 1 3Y 39.856%2% 9.00Police 75001 3% @ 50 1 4YY Y 39.856%2% 9.00Police 75101 2% @ 50 1 4Y Y 39.856%2% 9.00
Vacaville-Elmira Cemetery DistrictMisc 70001 2% @ 60 3 YY 8.497%2% 7.00
Vallecitos Water DistrictMisc Y70001 2% @ 55 1 YY 15.724%2% 7.00Misc 70002 2% @ 55 1 YY 15.724%2% 7.00Misc Y70003 3% @ 60 1 YY 15.724%2% 8.00Misc 70004 3% @ 60 1 YY 15.724%2% 8.00
Vallejo Sanitation and Flood Control DistrictMisc 70001 2% @ 55 1 8YY 15.685%2% 7.00Misc 70002 2.7% @ 55 1 8YY 15.685%2% 8.00
Vallejo, City ofMisc 70001 2% @ 55 1 1Y 28.576%2% 7.00Misc Y70002 2% @ 55 1 Y 28.576%2% 7.00Misc Y70003 2.7% @ 55 1 Y 28.576%2% 8.00Misc Y70401 2% @ 55 1 28.576%2% 7.00Misc Y70402 2% @ 55 1 28.576%2% 7.00Fire 74001 3% @ 50 1 4YY Y 48.124%2% 9.00Police 75001 3% @ 50 1 4YY Y 48.124%2% 9.00Police 75002 3% @ 50 1 YY Y 48.124%2% 9.00
Valley Center Municipal Water DistrictMisc 70001 2% @ 55 1 4YY Y 29.782%2% 7.00Misc 70002 2.7% @ 55 1 4YY Y 29.782%2% 8.00
Valley County Water DistrictMisc 70001 2% @ 55 1 YY Y 20.533%2% 7.00Misc 70002 2% @ 55 1 YY Y 20.533%2% 7.00Misc 70003 2.7% @ 55 1 YY Y 20.533%2% 8.00
Valley Mountain Regional Center, Inc.Misc 70001 2% @ 60 1 3Y 9.712%2% 7.00
Valley of the Moon Water DistrictMisc Y70001 2% @ 55 3 YY 14.083%2% 7.00Misc 70002 2% @ 55 3 YY 14.083%2% 7.00Misc Y70003 2.5% @ 55 3 YY 14.083%2% 8.00
Valley Sanitary DistrictMisc Y70001 2% @ 55 3 YY Y 20.587%2% 7.00Misc Y70002 2.5% @ 55 3 YY Y 20.587%2% 8.00
Valley Springs Public Utility DistrictMisc 70001 2% @ 60 3 YY 10.282%2% 7.00Misc 70002 2% @ 55 3 YY 10.282%2% 7.00Misc 70401 2% @ 60 3 YY 10.282%2% 7.00Misc 70402 2% @ 55 3 YY 10.282%2% 7.00
Valley-Wide Recreation and Park DistrictMisc 70001 2% @ 55 1 3YY 16.153%2% 7.00Misc 70002 2.5% @ 55 1 3YY 16.153%2% 8.00
Vandenberg Village Community Services District
Misc 70001 2% @ 55 1 YY 15.685%2% 7.00Misc 70002 2.7% @ 55 1 YY 15.685%2% 8.00
Ventura College FoundationMisc 70001 2% @ 55 3 4YY 11.863%2% 7.00
Ventura County Law LibraryMisc 70001 2% @ 60 3 YY 8.905%2% 7.00
404

5. CalPERS Supplement - Summary of Contracting Agency Benefits - (Continued)
Final Pre- SickPost
Ordinary 1959Compensation SurvivorRetirement Leave
RetirementDisabilityBenefit
FinalContribution Rate
Employer Name Offset Option 2 Credit IncreaseSurvivor
BenefitFormula Period COLA Member EmployerCompensation
Allowance
Ventura County Schools Business Services Authority
Misc 70001 2% @ 55 1 3YY Y 13.128%2% 7.00Ventura County Schools Self-Funding Authority
Misc 70001 2% @ 55 1 4YY Y 16.806%2% 7.00Ventura County Transportation Commission
Misc 70001 2% @ 60 1 YY 8.486%2% 7.00Ventura Port District
Misc 70001 2% @ 55 1 4YY Y 17.230%2% 7.00Police 75001 2% @ 55 1 4YY Y 12.388%2% 7.00Police 75002 2% @ 55 1 4YY Y 12.388%2% 7.00
Ventura River County Water DistrictMisc 70001 2% @ 60 3 YY 7.614%2% 7.00
Vernon, City ofMisc 70001 2% @ 55 1 3Y Y 16.456%2% 7.00Misc 70002 2.7% @ 55 1 3Y Y 16.456%2% 8.00Fire 74001 3% @ 50 1 4Y Y 28.602%2% 9.00Police 75001 3% @ 50 1 1Y 28.602%2% 9.00Peace 79001 3% @ 55 1 3Y 28.602%2% 9.00
Veterans Home of California Post FundMisc 70001 2% @ 60 3 YY 0.000%2% 7.00
Victor Valley Transit AuthorityMisc 70001 2.7% @ 55 3 4YY 15.517%2% 8.00
Victor Valley Wastewater Reclamation Authority
Misc 70001 2% @ 55 3 3YY 16.625%2% 7.00Misc 70002 2.5% @ 55 3 3YY 16.625%2% 8.00
Victorville, City ofMisc Y70001 2% @ 55 1 Y Y 14.148%2% 7.00Misc 70002 2% @ 55 1 4Y Y 14.148%2% 7.00Misc Y70003 2.5% @ 55 1 Y Y 14.148%2% 8.00Misc 70004 2.5% @ 55 1 4Y Y 14.148%2% 8.00Misc 70402 2% @ 60 3 14.148%2% 7.00Misc Y70403 2% @ 55 3 YY 14.148%2% 7.00Misc 70404 2% @ 55 3 YY 14.148%2% 7.00Misc Y70405 2% @ 55 3 YY 14.148%2% 7.00Misc 70406 2.5% @ 55 3 14.148%2% 8.00Fire 74001 2% @ 50 1 4YY Y Y 0.000%2% 9.00Police 75001 2% @ 50 1 3YY Y Y 0.000%2% 9.00
Villa Park, City ofMisc 70001 2% @ 55 1 4YY 20.537%2% 7.00
Visalia Public Cemetery DistrictMisc Y70001 2% @ 60 3 YY 3.265%2% 7.00
Visalia, City ofMisc 70001 2% @ 55 3 2Y 18.971%2% 7.00Misc Y70002 2% @ 55 3 Y 18.971%2% 7.00Misc 70003 3% @ 60 3 2Y Y 18.971%2% 8.00Misc Y70004 3% @ 60 3 Y 18.971%2% 8.00Misc 70101 2.5% @ 55 3 2Y Y 18.971%2% 8.00Misc 70102 2% @ 60 3 2Y Y 18.971%2% 7.00Fire 74001 3% @ 50 1 4Y 31.553%2% 9.00Fire 74003 3% @ 50 1 4Y Y 31.553%2% 9.00Fire 74101 3% @ 55 3 4Y Y 31.553%2% 9.00Police 75001 3% @ 50 1 4Y 31.553%2% 9.00Police 75003 3% @ 50 1 4Y Y 31.553%2% 9.00Police 75101 3% @ 55 3 4Y Y 31.553%2% 9.00
Vista Irrigation DistrictMisc Y70001 2% @ 55 1 YY Y 20.273%2% 7.00Misc 70002 2% @ 55 1 YY Y 20.273%2% 7.00Misc 70003 3% @ 60 1 YY Y 20.273%2% 8.00
405

5. CalPERS Supplement - Summary of Contracting Agency Benefits - (Continued)
Final Pre- SickPost
Ordinary 1959Compensation SurvivorRetirement Leave
RetirementDisabilityBenefit
FinalContribution Rate
Employer Name Offset Option 2 Credit IncreaseSurvivor
BenefitFormula Period COLA Member EmployerCompensation
Allowance
Vista, City ofMisc 70001 2% @ 55 1 2Y 20.493%2% 7.00Misc 70002 3% @ 60 1 2Y 20.493%2% 8.00Fire 74001 3% @ 50 1 3YY 33.551%2% 9.00Fire 74102 1/2 @ 55 3 YY 33.551%2% variesPolice 75001 1/2 @ 55 1 1YY 33.551%2% varies
Walnut Creek, City ofMisc 70001 2% @ 55 1 4Y Y 17.298%2% 7.00Police 75001 3% @ 50 1 4YY Y 27.877%2% 9.00
Walnut Valley Water DistrictMisc 70001 2% @ 55 1 YY Y 16.867%3% 7.00Misc 70002 2.7% @ 55 1 YY Y 16.867%3% 8.00Misc 70101 2% @ 55 1 YY Y 11.709%3% 7.00
Walnut, City ofMisc 70001 2% @ 55 1 4YY 12.590%2% 7.00
Wasco Recreation and Park DistrictMisc Y70001 2% @ 60 3 YY 8.583%2% 7.00
Wasco, City ofMisc Y70001 2% @ 55 1 YY 27.095%2% 7.00Misc 70002 2% @ 55 1 YY 27.095%2% 7.00Misc Y70003 3% @ 60 1 YY 27.095%2% 8.00Misc Y70401 2% @ 55 1 YY 27.095%2% 7.00Misc Y70402 3% @ 60 1 YY 27.095%2% 8.00Fire Y74001 2% @ 55 3 YY 0.000%2% 7.00Police Y75001 2% @ 55 3 YY 0.000%2% 7.00
Washington Colony Cemetery DistrictMisc Y70001 2% @ 60 3 YY 15.340%2% 7.00
Water Employee Services AuthorityMisc 70001 2.7% @ 55 1 4Y Y 18.774%2% 8.00Misc Y70401 2% @ 55 1 Y Y 18.774%2% 7.00Misc 70402 2% @ 55 1 3Y Y 18.774%2% 7.00Misc 70403 2% @ 55 1 3Y Y 18.774%2% 7.00Misc 70404 2.7% @ 55 1 3Y Y 18.774%2% 8.00
Water Facilities Authority-Joint Powers Agency
Misc 70001 2% @ 55 1 3YY 14.660%2% 7.00Misc 70002 2.5% @ 55 1 3YY 14.660%2% 8.00
Water Replenishment District of Southern California
Misc 70001 2% @ 55 1 YY Y 16.773%2% 7.00Misc Y70002 2% @ 55 1 YY Y 16.773%2% 7.00Misc 70003 3% @ 60 1 YY Y 16.773%2% 8.00Misc Y70004 3% @ 60 1 YY Y 16.773%2% 8.00
Waterford, City ofMisc 70001 2% @ 60 3 YY 14.925%2% 7.00Misc 70002 2.5% @ 55 3 YY 14.925%2% 8.00Police 75001 1/2 @ 55 3 YY 0.000%2% varies
Watsonville, City ofMisc 70001 2% @ 55 3 1Y 11.252%2% 7.00Misc Y70002 2% @ 55 3 YY 11.252%2% 7.00Fire 74001 3% @ 50 1 2YY 26.149%2% 9.00Police 75001 3% @ 50 1 2YY 26.149%2% 9.00
Weaverville Community Services DistrictMisc 70001 2% @ 55 3 3YY Y Y 16.593%2% 7.00Misc 70002 3% @ 60 3 3YY Y Y 16.593%2% 8.00
Weaverville Sanitary DistrictMisc 70001 2% @ 60 3 YY 27.080%2% 7.00Misc 70101 2% @ 60 3 YY 27.080%2% 7.00
Weed, City ofMisc Y70001 2% @ 60 3 YY 7.505%2% 7.00Fire 74001 2% @ 55 3 YY 21.299%2% 7.00Police 75001 2% @ 55 3 YY 21.299%2% 7.00
406

5. CalPERS Supplement - Summary of Contracting Agency Benefits - (Continued)
Final Pre- SickPost
Ordinary 1959Compensation SurvivorRetirement Leave
RetirementDisabilityBenefit
FinalContribution Rate
Employer Name Offset Option 2 Credit IncreaseSurvivor
BenefitFormula Period COLA Member EmployerCompensation
Allowance
West Almanor Community Services DistrictFire 74001 3% @ 55 1 3YY 21.669%2% 9.00
West Basin Municipal Water DistrictMisc 70001 2% @ 60 1 YY Y 15.909%2% 7.00Misc 70002 3% @ 60 1 YY Y 15.909%2% 8.00
West Bay Sanitary DistrictMisc 70001 2% @ 55 3 4YY 14.083%2% 7.00Misc Y70002 2% @ 55 3 YY 14.083%2% 7.00Misc 70003 2.5% @ 55 3 4YY 14.083%2% 8.00Misc Y70004 2.5% @ 55 3 YY 14.083%2% 8.00
West Cities Communication CenterMisc 70001 2% @ 55 1 3YY Y 13.813%2% 7.00
West Contra Costa Integrated Waste Management Authority
Misc 70001 2% @ 55 3 4YY 14.083%2% 7.00Misc 70002 2.5% @ 55 3 4YY 14.083%2% 8.00Misc 70401 2% @ 55 1 3YY 14.083%2% 7.00
West County Transportation AgencyMisc 70001 2% @ 55 1 YY 12.844%2% 7.00Misc Y70002 2% @ 55 1 YY 12.844%2% 7.00
West County Wastewater DistrictMisc Y70001 2% @ 55 1 YY 15.724%2% 7.00Misc 70002 2% @ 55 1 4YY 15.724%2% 7.00Misc 70004 2% @ 55 1 4YY 15.724%2% 7.00Misc Y70005 3% @ 60 1 YY 15.724%2% 8.00Misc 70006 3% @ 60 1 4YY 15.724%2% 8.00
West Covina, City ofMisc 70001 2% @ 55 1 4Y 14.734%2% 7.00Misc 70002 2.5% @ 55 1 4Y 14.734%2% 8.00Misc 70101 2% @ 60 1 4Y 14.734%2% 7.00Misc 70401 2% @ 55 1 4Y 14.734%2% 7.00Fire 74001 3% @ 50 1 4Y Y 38.955%2% 9.00Fire 74002 3% @ 50 1 4YY Y 38.955%2% 9.00Fire 74401 3% @ 50 1 4YY Y 38.955%2% 9.00Police 75001 3% @ 50 1 4YY Y 38.955%2% 9.00Police 75002 3% @ 50 1 4YY Y 38.955%2% 9.00
West End Communications AuthorityMisc 70001 2% @ 55 3 3YY 0.000%2% 7.00
West Hollywood, City ofMisc 70001 2% @ 55 1 4 18.610%2% 7.00Misc 70002 2.7% @ 55 1 4 18.610%2% 8.00
West Kern Water DistrictMisc 70001 2% @ 60 1 YY 20.570%2% 7.00
West Sacramento, City ofMisc 70001 2% @ 55 3 3Y 16.386%2% 7.00Misc 70002 2.5% @ 55 3 3Y 16.386%2% 8.00Misc 70401 2% @ 55 3 Y 16.386%2% 7.00Misc Y70402 2% @ 55 3 Y 16.386%2% 7.00Misc 70403 2% @ 55 1 16.386%2% 7.00Misc 70404 2.5% @ 55 3 Y 16.386%2% 8.00Misc Y70405 2.5% @ 55 3 Y 16.386%2% 8.00Misc 70406 2% @ 60 1 16.386%2% 7.00Misc Y70407 2% @ 60 3 16.386%2% 7.00Misc 70408 2.5% @ 55 1 16.386%2% 8.00Fire 74001 3% @ 50 1 4YY Y 26.149%2% 9.00Fire 74401 3% @ 50 1 YY 26.149%2% 9.00Fire 74402 2% @ 50 1 YY 26.149%2% 9.00Fire 74403 2% @ 50 1 YY 26.149%2% 9.00Fire 74404 2% @ 50 1 YY 26.149%2% 9.00Police 75001 3% @ 50 1 3YY 26.149%2% 9.00
West Stanislaus Irrigation DistrictMisc Y70001 2% @ 55 3 YY 5.790%2% 7.00
407

5. CalPERS Supplement - Summary of Contracting Agency Benefits - (Continued)
Final Pre- SickPost
Ordinary 1959Compensation SurvivorRetirement Leave
RetirementDisabilityBenefit
FinalContribution Rate
Employer Name Offset Option 2 Credit IncreaseSurvivor
BenefitFormula Period COLA Member EmployerCompensation
Allowance
West Valley Mosquito and Vector Control District
Misc 70001 2.5% @ 55 3 4YY 14.083%2% 8.00West Valley Sanitation District of Santa Clara County
Misc Y70001 2% @ 55 1 YY 14.660%2% 7.00Misc 70002 2% @ 55 1 YY 14.660%2% 7.00Misc Y70003 2.5% @ 55 1 YY 14.660%2% 8.00
West Valley Water DistrictMisc Y70001 2% @ 55 1 YY 15.118%2% 7.00Misc 70002 2% @ 55 1 YY 15.118%2% 7.00Misc 70003 2% @ 55 1 YY 15.118%2% 7.00
West Valley-Mission Community College District
Police 75001 3% @ 55 3 3YY Y 37.149%2% 9.00Westborough Water District
Misc 70001 2% @ 55 3 YY 10.282%2% 7.00Western Contra Costa County Transit Authority
Misc 70001 2% @ 55 3 4YY 26.247%2% 7.00Western Municipal Water District
Misc Y70001 2% @ 55 1 YY 14.151%2% 7.00Misc 70002 2% @ 55 1 YY 14.151%2% 7.00Misc 70003 2% @ 55 3 YY 14.151%2% 7.00Misc 70004 2.5% @ 55 1 YY 14.151%2% 8.00Misc 70401 2% @ 55 1 YY 14.151%2% 7.00Misc 70402 2.5% @ 55 1 YY 14.151%2% 8.00
Western Riverside Council of GovernmentsMisc 70001 2% @ 60 1 YY Y Y 18.349%2% 7.00Misc 70002 2.7% @ 55 1 YY Y Y 18.349%2% 8.00
Westlake Village, City ofMisc 70001 2% @ 55 3 YY 15.084%2% 7.00Misc 70002 3% @ 60 3 YY 15.084%2% 8.00
Westlands Water DistrictMisc 70001 2% @ 55 1 3YY 5.635%2% 7.00Misc Y70002 2% @ 55 1 YY 5.635%2% 7.00
Westminster, City ofMisc 70001 2% @ 55 1 4Y Y 20.024%2% 7.00Misc Y70002 2% @ 55 1 Y Y 20.024%2% 7.00Misc 70003 2.5% @ 55 1 4Y Y 20.024%2% 8.00Fire 74001 3% @ 50 1 1YY Y 28.298%2% 9.00Police 75001 3% @ 50 1 4YY Y 28.298%2% 9.00
Westwood Community Services DistrictMisc Y70001 2% @ 60 3 YY 0.000%2% 7.00Misc 70002 2% @ 60 3 YY 0.000%2% 7.00Fire Y74001 2% @ 50 3 YY 47.993%2% 9.00
Wheeler Ridge-Maricopa Water Storage District
Misc Y70001 2% @ 60 1 YY 13.061%3% 7.00Misc 70002 2% @ 60 1 YY 13.061%3% 7.00Misc Y70003 3% @ 60 1 YY 13.061%3% 8.00
Whittier, City ofMisc 70001 2% @ 55 1 3YY 12.993%2% 7.00Misc 70002 2.5% @ 55 1 3YY 12.993%2% 8.00Fire 74001 1/2 @ 55 3 1Y 38.303%2% variesPolice 75001 3% @ 50 1 3YY 38.303%2% 9.00
Wildomar Cemetery DistrictMisc Y70001 2% @ 55 3 YY 0.000%2% 7.00Misc Y70002 2.7% @ 55 3 YY 0.000%2% 8.00
Wildomar, City ofMisc 70001 2.7% @ 55 1 4YY 16.025%2% 8.00
408

5. CalPERS Supplement - Summary of Contracting Agency Benefits - (Continued)
Final Pre- SickPost
Ordinary 1959Compensation SurvivorRetirement Leave
RetirementDisabilityBenefit
FinalContribution Rate
Employer Name Offset Option 2 Credit IncreaseSurvivor
BenefitFormula Period COLA Member EmployerCompensation
Allowance
Williams, City ofMisc Y70001 2% @ 55 3 YY 10.282%2% 7.00Misc 70002 2% @ 55 3 YY 10.282%2% 7.00Police Y75001 3% @ 50 3 YY 32.467%2% 9.00
Willits, City ofMisc Y70001 2% @ 55 3 YY 21.229%2% 7.00Misc Y70002 2.7% @ 55 3 YY 21.229%2% 8.00Police Y75001 3% @ 50 3 YY 43.587%2% 9.00
Willow County Water DistrictMisc Y70001 2.5% @ 55 3 YY 15.183%3% 8.00
Willow Creek Community Services DistrictMisc Y70001 2% @ 60 3 YY 17.332%2% 7.00Misc 70002 2% @ 60 3 YY 17.332%2% 7.00Misc Y70003 2.5% @ 55 3 YY 17.332%2% 8.00
Willows Cemetery DistrictMisc Y70001 2% @ 55 3 YY 11.233%2% 7.00Misc 70002 2% @ 55 3 YY 11.233%2% 7.00Misc Y70003 2.7% @ 55 3 YY 11.233%2% 8.00
Willows, City ofMisc Y70001 2% @ 55 3 YY 21.799%2% 7.00Misc 70002 2% @ 55 3 YY 21.799%2% 7.00Misc Y70003 3% @ 60 3 YY 21.799%2% 8.00Fire Y74001 3% @ 50 3 YY 40.192%2% 9.00Police Y75001 3% @ 50 3 YY 40.192%2% 9.00
Wilton Fire Protection DistrictMisc 70001 2% @ 60 3 YY 18.987%2% 7.00
Windsor Fire Protection DistrictMisc 70001 2% @ 60 3 4YY 15.064%2% 7.00Misc 70002 2.7% @ 55 3 4YY 15.064%2% 8.00Fire 74001 3% @ 55 1 4YY 21.669%2% 9.00
Windsor, Town ofMisc 70001 2% @ 55 1 4YY 10.781%2% 7.00Misc Y70401 2% @ 55 1 YY 10.781%2% 7.00Misc 70402 2% @ 55 1 YY 10.781%2% 7.00
Winterhaven Water DistrictMisc 70001 2% @ 60 3 YY 13.087%2% 7.00
Winters Cemetery DistrictMisc 70001 2% @ 60 3 YY 18.012%2% 7.00Misc 70002 2.5% @ 55 3 YY 18.012%2% 8.00
Winters Fire Protection DistrictMisc 70001 2% @ 60 3 YY 0.000%2% 7.00Fire 74001 3% @ 50 3 YY 0.000%2% 9.00
Winters, City ofMisc Y70001 2% @ 55 1 YY 13.831%2% 7.00Misc 70002 2% @ 55 1 YY 13.831%2% 7.00Fire Y74001 1/2 @ 55 3 YY 27.868%2% variesFire Y74002 2% @ 50 3 YY 27.868%2% 9.00Police Y75001 1/2 @ 55 3 YY 27.868%2% variesPolice Y75002 3% @ 55 3 YY 27.868%2% 9.00
Winton Water and Sanitary DistrictMisc 70001 2% @ 60 3 4YY 11.209%2% 7.00
Woodbridge Rural County Fire Protection District
Misc 70001 2% @ 55 1 4YY 35.891%2% 7.00Misc Y70002 2% @ 55 1 YY 35.891%2% 7.00Misc 70003 3% @ 60 1 4YY 35.891%2% 8.00Fire 74001 3% @ 55 1 4YY 30.217%2% 9.00
Woodlake Fire DistrictFire Y74001 2% @ 55 3 YY 14.788%2% 7.00
Woodlake, City ofMisc 70001 2% @ 55 3 3YY 11.750%2% 7.00Police 75001 2% @ 55 3 3YY 23.658%2% 7.00
409

5. CalPERS Supplement - Summary of Contracting Agency Benefits - (Continued)
Final Pre- SickPost
Ordinary 1959Compensation SurvivorRetirement Leave
RetirementDisabilityBenefit
FinalContribution Rate
Employer Name Offset Option 2 Credit IncreaseSurvivor
BenefitFormula Period COLA Member EmployerCompensation
Allowance
Woodland, City ofMisc 70001 2% @ 55 1 4Y 23.045%2% 7.00Misc 70002 2.7% @ 55 1 4Y 23.045%2% 8.00Fire 74001 3% @ 50 1 4YY 32.656%2% 9.00Police 75001 3% @ 50 1 4YY 32.656%2% 9.00
Woodside Fire Protection DistrictMisc 70001 2% @ 55 3 YY 10.282%2% 7.00Fire 74001 3% @ 50 1 4YY Y 27.877%2% 9.00
Woodside, Town ofMisc Y70001 2% @ 55 1 YY 16.438%2% 7.00Misc 70002 2% @ 60 3 YY 16.438%2% 7.00Misc Y70003 2.5% @ 55 1 YY 16.438%2% 8.00
Yolo County Communications Emergency Services Agency
Misc 70001 2% @ 55 1 YY 12.662%2% 7.00Yolo County Federal Credit Union
Misc Y70001 2% @ 60 3 YY 10.279%3% 7.00Yolo County Housing Authority
Misc Y70001 2% @ 55 3 YY 11.518%2% 7.00Yolo County In-Home Supportive Services Public Authority
Misc 70001 2% @ 55 1 8YY 12.433%2% 7.00Yolo County Public Agency Risk Management Insurance Authority
Misc 70001 2% @ 55 1 3YY 17.816%2% 7.00Misc 70002 2.5% @ 55 1 3YY 17.816%2% 8.00
Yolo County Transportation DistrictMisc 70001 2% @ 60 1 3YY 18.686%2% 7.00Misc 70002 2.5% @ 55 1 3YY 18.686%2% 8.00Misc 70401 2% @ 60 1 3YY 18.686%2% 7.00Misc 70402 2.5% @ 55 1 3YY 18.686%2% 8.00
Yolo, County ofMisc Y70001 2% @ 55 1 Y 19.063%2% 7.00Misc 70002 2% @ 55 1 Y 19.063%2% 7.00Misc Y70003 2.5% @ 55 1 YY 19.063%2% 8.00Misc Y70101 2% @ 55 3 Y 19.063%2% 7.00Misc 70102 2% @ 55 3 Y 19.063%2% 7.00Peace Y77001 3% @ 55 1 YY 26.475%2% 9.00Peace Y77002 3% @ 55 1 Y 26.475%2% 9.00Police Y78001 3% @ 50 1 YY 26.475%2% 9.00
Yolo-Solano Air Quality Management District
Misc 70001 2% @ 55 1 YY 12.312%2% 7.00Yorba Linda Water District
Misc 70001 2% @ 55 1 4YY 10.781%2% 7.00Misc Y70002 2% @ 55 1 YY 10.781%2% 7.00
Yorba Linda, City ofMisc 70001 2% @ 55 1 3Y Y 17.263%2% 7.00Misc Y70401 2% @ 55 3 Y 17.263%2% 7.00Misc 70402 2% @ 55 3 Y 17.263%2% 7.00
Yountville, Town ofMisc 70001 2% @ 55 1 1YY 20.098%2% 7.00Misc 70002 2.7% @ 55 1 1YY 20.098%2% 8.00Misc 70101 2% @ 55 1 1YY 10.781%2% 7.00
Yreka, City ofMisc Y70001 2% @ 55 3 YY 10.282%2% 7.00Police Y75001 2% @ 50 3 YY 19.900%2% 9.00
410

5. CalPERS Supplement - Summary of Contracting Agency Benefits - (Continued)
Final Pre- SickPost
Ordinary 1959Compensation SurvivorRetirement Leave
RetirementDisabilityBenefit
FinalContribution Rate
Employer Name Offset Option 2 Credit IncreaseSurvivor
BenefitFormula Period COLA Member EmployerCompensation
Allowance
Yuba City, City ofMisc Y70001 2% @ 55 1 Y Y Y 23.595%3% 7.00Misc 70002 2% @ 55 1 8Y Y Y 23.595%3% 7.00Misc Y70003 2.7% @ 55 1 Y Y Y 23.595%3% 8.00Misc 70004 2.7% @ 55 1 8Y Y Y 23.595%3% 8.00Misc 70102 2% @ 55 3 8Y Y Y 23.595%3% 7.00Misc 70103 2.7% @ 55 3 8Y Y Y 23.595%3% 8.00Misc 70401 2% @ 60 1 3 23.595%2% 7.00Fire 74001 3% @ 50 1 8YY Y Y 30.068%3% 9.00Fire 74101 3% @ 50 3 8YY Y 29.087%3% 9.00Fire 74401 3% @ 50 1 3YY Y 29.087%2% 9.00Police 75001 3% @ 50 1 8YY Y Y 30.068%3% 9.00Police 75101 3% @ 50 3 8YY Y 29.087%3% 9.00
Yuba Community College DistrictPolice 75001 2% @ 55 1 8YY Y 17.897%2% 7.00
Yuba County Water AgencyMisc 70001 2% @ 55 1 3YY 12.540%2% 7.00Misc Y70002 2% @ 55 1 YY 12.540%2% 7.00
Yuba Sutter Transit AuthorityMisc 70001 2% @ 55 3 3YY Y 14.905%2% 7.00
Yuba, County ofMisc 70001 2% @ 55 1 3YY 14.927%2% 7.00Misc Y70002 2% @ 55 1 14.927%2% 7.00Peace 77001 2% @ 50 1 3Y 18.943%2% 9.00
Yucaipa Valley Water DistrictMisc 70001 2% @ 60 1 YY 14.435%2% 7.00Misc 70002 2% @ 60 1 YY 14.435%2% 7.00
Yucaipa, City ofMisc 70001 2% @ 55 1 3YY Y 11.603%2% 7.00
Yucca Valley, Town ofMisc 70001 2% @ 55 3 3YY 19.510%2% 7.00Misc 70002 2.7% @ 55 3 3YY 19.510%2% 8.00Misc 70101 2% @ 60 3 3YY 8.049%2% 7.00
Yuima Municipal Water DistrictMisc 70001 2% @ 55 1 4YY 33.837%2% 7.00Misc 70002 3% @ 60 1 4YY 33.837%2% 8.00
411