2015 executive women in agriculture maximize your … executive women in agriculture maximize your...
TRANSCRIPT

2015 Executive Women in Agriculture Maximize your 2016 Crop Insurance Decisions
December 3-4, 2015 Chicago, IL
-
Jamie Wasemiller 141 W. Jackson Blvd Suite 1201A Chicago, IL 60604 Cell: 707-365-0601 web: www.gulkegroup.com e-mail: [email protected]

Education and Implementation are Important Keys to Legacy Farms

Highway Bill The House of Representatives voted on the Highway Bill that
included the crop insurance language reversing the $3 billion cut contained in the Budget Bill. The vote was 359 in favor and 65 opposed.
The Senate voted last night at the bill passed 83 to 16.

Farm Bill Programs ARC and PLC payments on your ground was originally to be
determined based on which county the FSA office was in that administered your land and not where you ground was physically located.
That has been changed and will be retroactive for 2014 until early February, 2016.

APH Yield Exclusion If the RMA determines your county or a contiguous counties yield
was at least 50% below the simple average of the per acre planted acre yield for the crop for the previous 10 consecutive crop years that yield may be removed from your APH determination.
Must be elected by the producer!

Whole Farm Revenue Protection Authorized in the 2014 Farm Bill
Provides producers with risk management protection for all commodities on the farm under one insurance policy.
Provides protection against loss of Gross revenue that a producer expects to earn, including animals and animal products, during the insurance period.

Two previous products have become one; AGR & AGR-Lite into Whole Farm Revenue Protection.
WFRP Pilot Area
2015

WFRP Pilot Area
2016
For 2016 available in every State and county in the US

WFRP – Coverage is based on (lesser of);
1. The 5-year average of the entity’s Schedule F (on-farm historic average gross revenue using five consecutive tax years information
2. 2016’s expected revenue (the commodities the producer expects to earn revenue from during the current insurance period as reported on the Farm Operation Report)
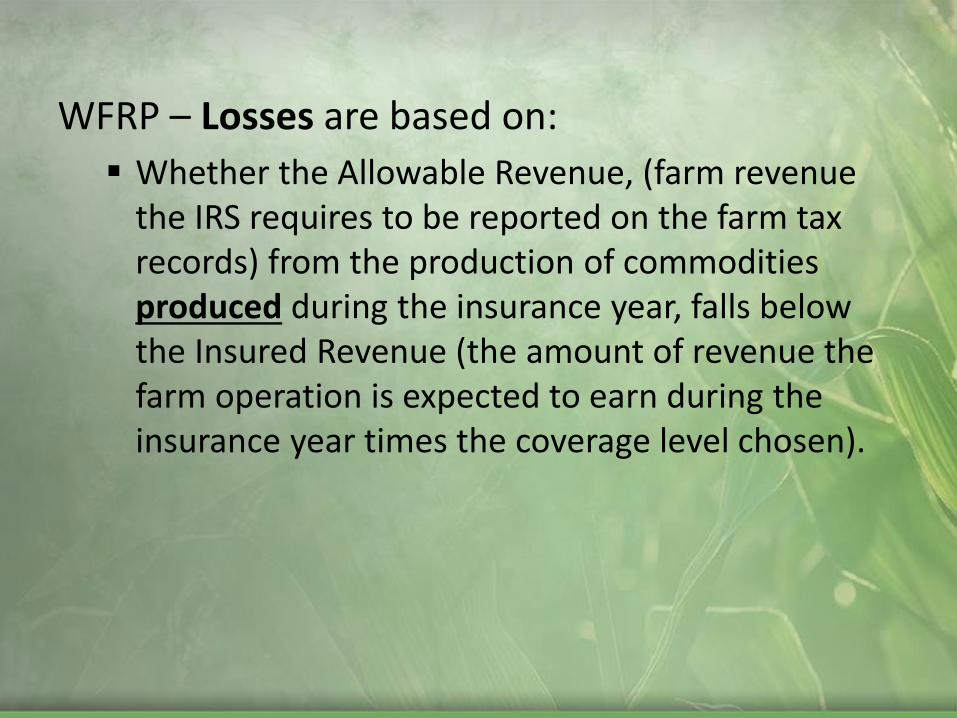
WFRP – Losses are based on:
Whether the Allowable Revenue, (farm revenue the IRS requires to be reported on the farm tax records) from the production of commodities produced during the insurance year, falls below the Insured Revenue (the amount of revenue the farm operation is expected to earn during the insurance year times the coverage level chosen).
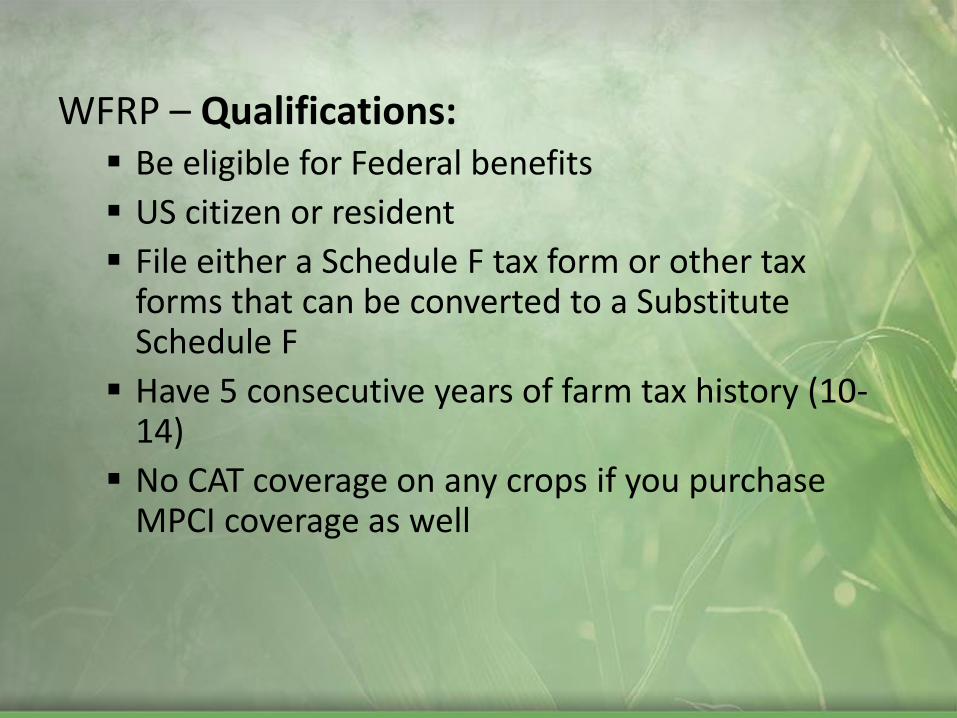
WFRP – Qualifications: Be eligible for Federal benefits
US citizen or resident
File either a Schedule F tax form or other tax forms that can be converted to a Substitute Schedule F
Have 5 consecutive years of farm tax history (10-14)
No CAT coverage on any crops if you purchase MPCI coverage as well

WFRP – Qualifications:
Have no more than $8.5 million in insured revenue based on level of insurance selected PER ENTITY.
If you have commodities that have MPCI available you must have at least 2 commodities that count
Each commodity must generate about 10% of the farms gross revenue to qualify

WFRP – Growing Operations:
Operations that have grown over time can increase their approved revenue amount based on an indexing procedure
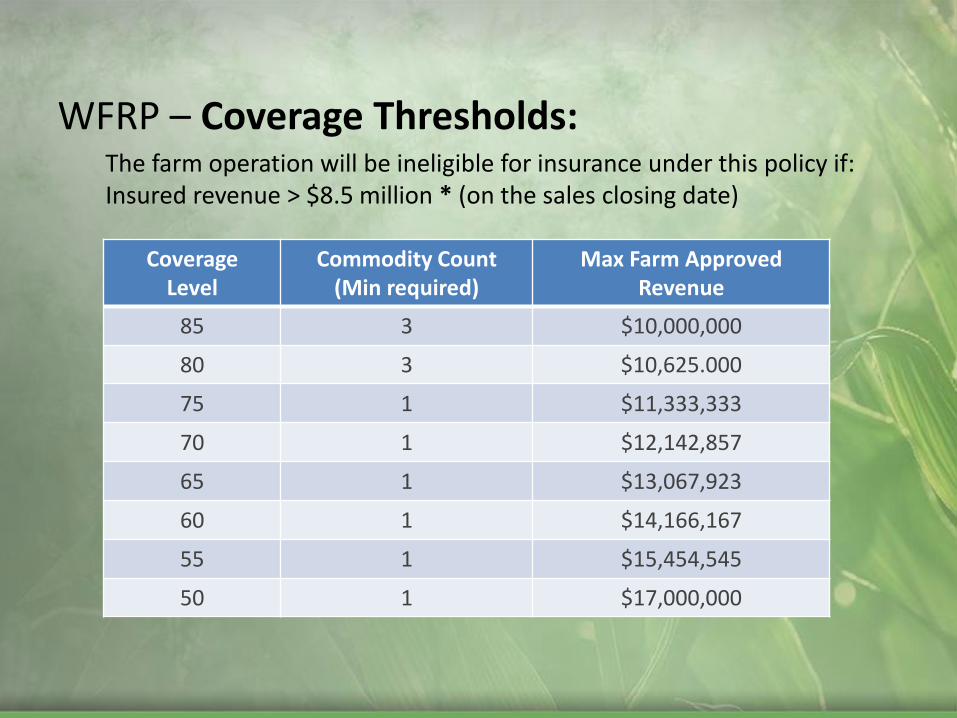
WFRP – Coverage Thresholds: The farm operation will be ineligible for insurance under this policy if: Insured revenue > $8.5 million * (on the sales closing date)
Coverage Level
Commodity Count (Min required)
Max Farm Approved Revenue
85 3 $10,000,000
80 3 $10,625.000
75 1 $11,333,333
70 1 $12,142,857
65 1 $13,067,923
60 1 $14,166,167
55 1 $15,454,545
50 1 $17,000,000

RP – Subsidy Rate
WFRP – Subsidy Rates:
Coverage Level 50% 55% 60% 65% 70% 75% 80% 85%
Commodity Count: 1
67% 64% 64% 59% 59% 55% N/A N/A
Commodity Count: 2
80% 80% 80% 80% 80% 80% N/A N/A
Commodity Count: 3+
80% 80% 80% 80% 80% 80% 71% 56%
Coverage Level 50% 55% 60% 65% 70% 75% 80% 85%
Enterprise Unit 80% 80% 80% 80% 80% 77% 68% 53%
Optional Unit 67% 64% 64% 59% 59% 55% 48% 38%

WFRP – Important to consider…
Utilizing Whole Farm Revenue Protection IN ADDITION TO any other crop insurance policies you normally buy.
Claims are settled after taxes are filed You may want individual crop coverage WFRP does not have Prevented Planting Coverage Some producers receive huge benefits from TA Yield,
Yield Exclusion and other insurance products Cost of WFPR is subsidized even more If you have any CAT coverage on any crop you are
ineligible for WFRP

$4.15
Indexed vs. Non Indexed Coverage
RP
Price Discovery
Feb
$3.80 RP
Price Discovery
Oct
$3.35
WFRP
Focuses on actual Gross Revenue and not the one
month windows
Jan Mar Apr May June July Aug Sep Nov Dec
Provides Extra Harvest Rev. Protection.

Coverage Example
1000 / 175 BU / $4 BU 1000 / 50 BU / $9.50 BU
350 / 5 Tons / $300 Ton 75 / 900 BU / $8 BU
Expected Revenue $2,240,000
80% Coverage ($1,792,000)
71% Subsidy Level
PREMIUM $16,370
$6.75 / ACRE
Rate of 0.91%

Cov Level Liability Tot. Premium Subsidy % Pro. Premium Rate/[$] Prem/Acre
85% $1,904,000 $67,592 56% $29,740 1.56% $12.26
80% $1,792,000 $56,448 71% $16,370 0.91% $6.75
75% $1,680,000 $48,720 80% $9,744 0.58% $4.02
70% $1,568,000 $39,984 80% $7,996 0.51% $3.30
65% $1,456,000 $32,760 80% $6,552 0.45% $2.70
60% $1,344,000 $27,552 80% $5,510 0.41% $2.27
55% $1,232,000 $22,792 80% $4,558 0.37% $1.88
50% $1,120,000 $19,040 80% $3,808 0.34% $1.57
WFRP Historic Avg $2,300,000
Total Expected $2,240,000
MPCI Liability Total $998,750
# of All Commodities 4
Qualifying Threshold $185,920
WFRP Example Quote
Coverage Example

Coverage Example 2
Expected Revenue $5.5 Million
75% Coverage
PREMIUM $45,000

Coverage Example 3
Expected Revenue $425,000
80% Coverage
PREMIUM $3,500

Loss Example: 100/ 195 APH/ $4 Irrigated
100/ 100 APH/ $4 Dryland
100/ 65 APH / $8.50 Irrigated
100/ 35 APH / $8.50 Dryland
100 Live Cattle @ 1000lb $1.50 100 Feeders @ 400lb $1.80
Expected Crop Rev. $203,000 Expected Cattle Rev. $222,000
Total: $425,000
MPCI @ 75% Coverage = $152,250 or only about 35% of Expected Farm Revenue
Corn sold @ $3.40 average / Beans sold @ $7.90 average and Yields down 10%
85% $361,250 80% $340,000
Crop Rev. 161,400 Cattle Market down 20% Cattle Rev. $177,600
Total Farm Revenue $339,000

Key Points
• Covering yearly Gross Revenue and not select windows of coverage
• Includes Livestock Revenue & 95 commodities • High Subsidy Rate • Will cover previous uninsured revenue streams, farm
related • Can be very beneficial for beginning or tough cash
marketing years • Unsold bushels priced the end of December • Could impact relationship with banker/lender • Can Lock in a gross revenue floor now • Many agents and some AIP’s uninformed and uninterested

In order to quote, you need the following;
Tax Forms – 5 consecutive years’ Schedule F (2009-2013) including any referenced supplemental forms
Farm Operation Report – Intended Farm Plan for 2015, by commodity. Must use “fair market price” as basis for revenue expectation for the commodity year (price subject to AIP determination).
Whole Farm Application – Identifies the State, County, and commodities being insured and at what level indicated on the policy. Also specifies tax filing type (required for policy approval).
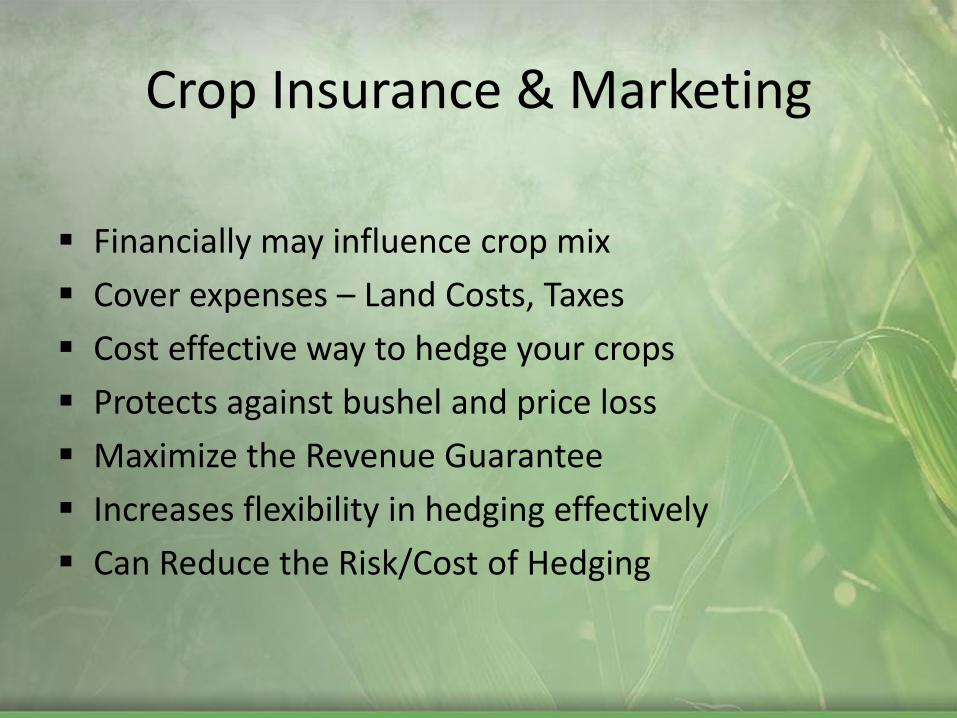
Crop Insurance & Marketing
Financially may influence crop mix
Cover expenses – Land Costs, Taxes
Cost effective way to hedge your crops
Protects against bushel and price loss
Maximize the Revenue Guarantee
Increases flexibility in hedging effectively
Can Reduce the Risk/Cost of Hedging
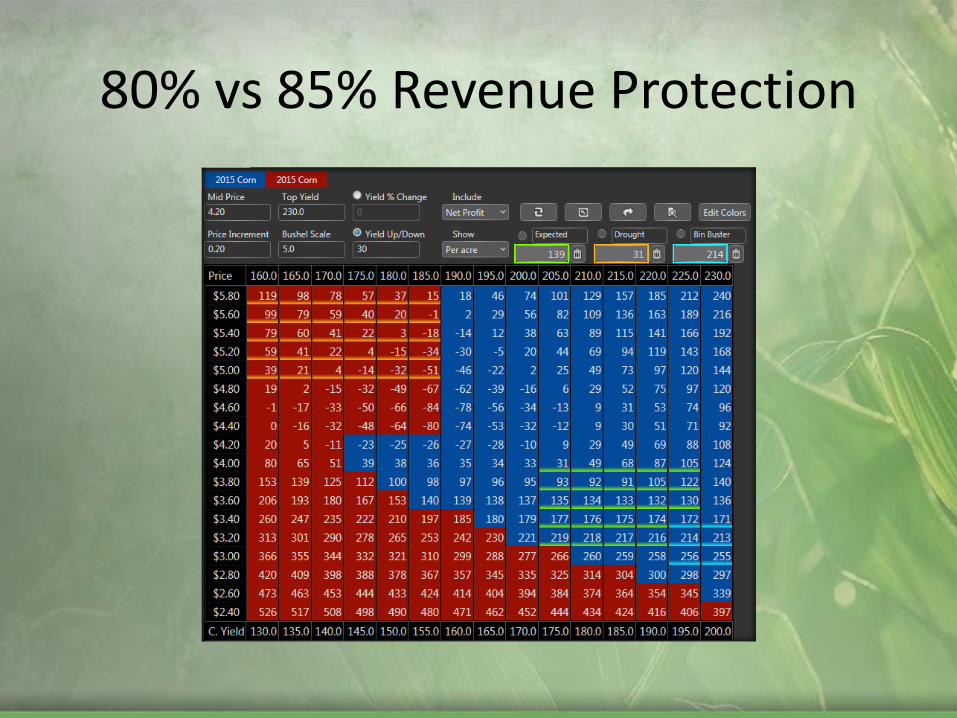
80% vs 85% Revenue Protection

No Risk Management

85% Revenue Protection

90% Area Risk Protection

CBOT Only

Insurance/Futures/Cash Sales

Combine Insurance & Marketing
The combination of insurance and marketing is a powerful tool in creating a marketing plan that will help maximize the profitability of a farmer’s operation.
Monitoring your hedging together with crop insurance gives you a better understanding of your revenue/risk position throughout the year.
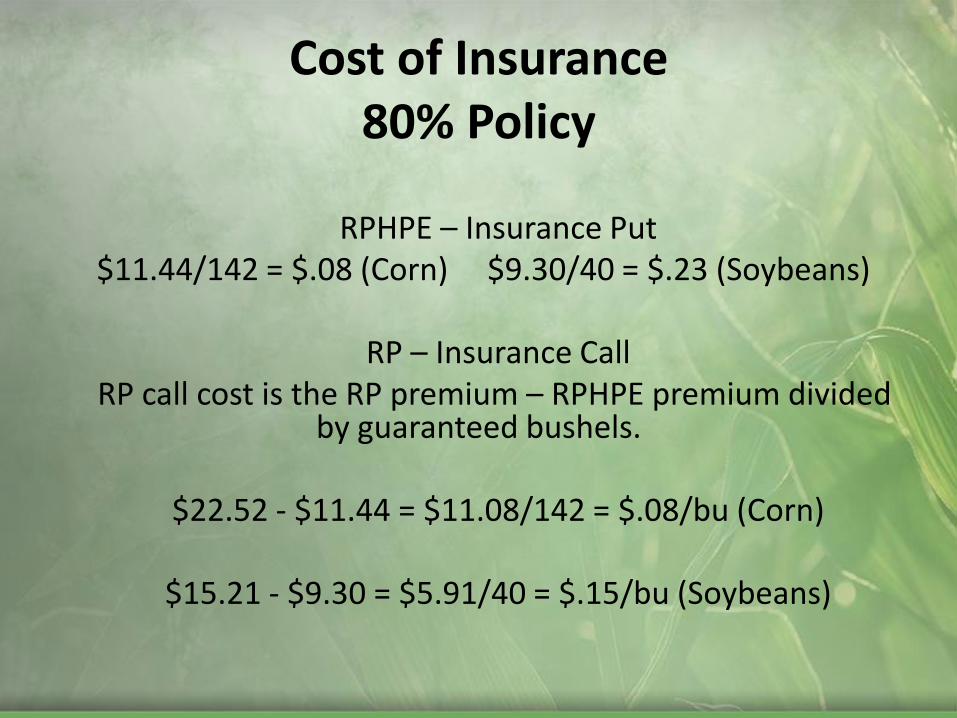
RPHPE – Insurance Put
$11.44/142 = $.08 (Corn) $9.30/40 = $.23 (Soybeans)
RP – Insurance Call RP call cost is the RP premium – RPHPE premium divided
by guaranteed bushels.
$22.52 - $11.44 = $11.08/142 = $.08/bu (Corn)
$15.21 - $9.30 = $5.91/40 = $.15/bu (Soybeans)
Cost of Insurance 80% Policy

Private Products
APC
APO
Enterprise Plus
HarvestMAX
HarvestPRO
HIP
HPA
MPD
PAR
PAR-flex
PARflex-PYO
PAR-PYO PRF O/U
PriceFlex
PriceFlex PRIME
Rainy Day
RAMP
SRC
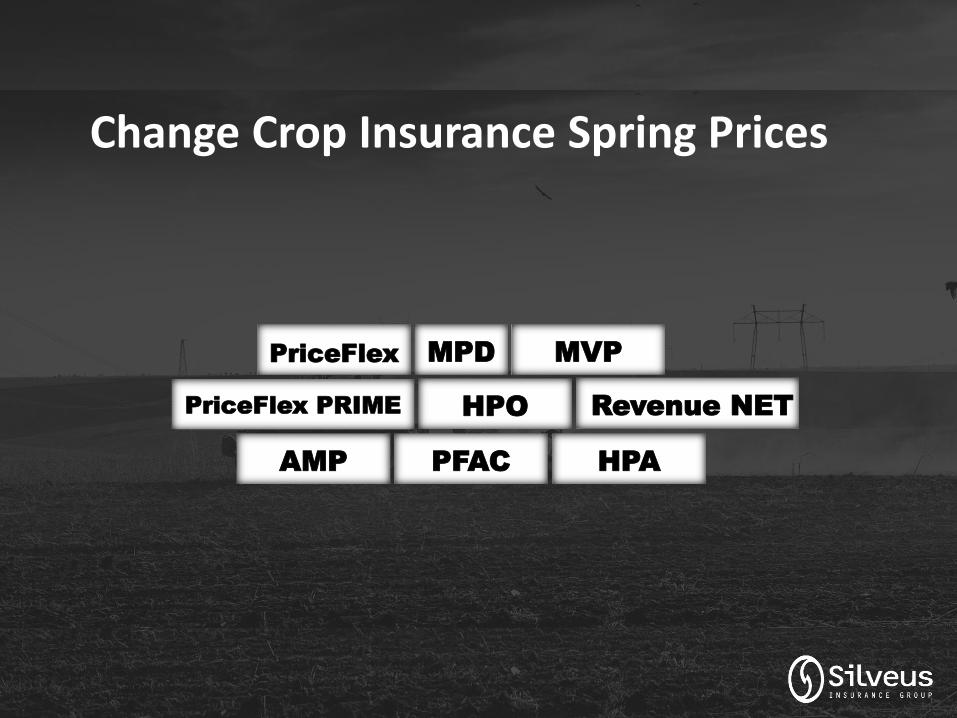
Change Crop Insurance Spring Prices
MPD
MVP
PriceFlex PRIME
AMP
PriceFlex
HPO
Revenue NET
PFAC
HPA
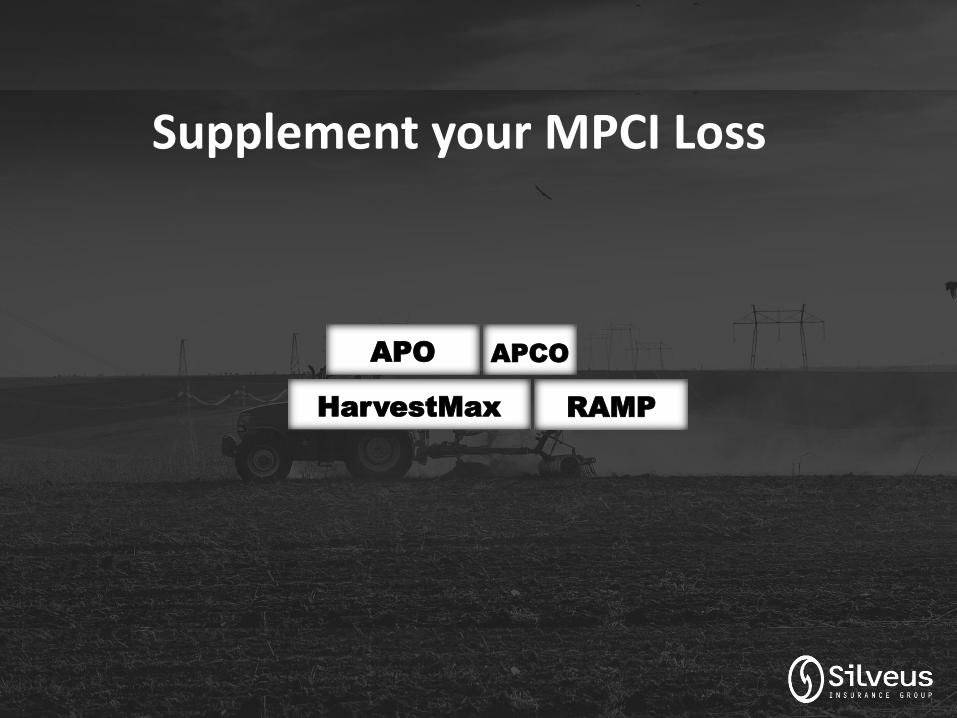
Supplement your MPCI Loss
APCO
RAMP
HarvestMax
APO

Private Area Revenue Coverage
PAR
PAR-flex
PYA-flex
PYA

Private Insurance Products Early Pricing
• Creates opportunity for a higher Spring Price which will increase your Revenue Guarantee
• Provides a way to protect year to year price drop • Producers gets the “higher of” • Approved by the RMA • Products not provided by all Underwriters • Buy Now Pay Later
Another tool in the tool box

Price Flex
• Has $1 cap for corn; $2 cap for soybeans; $1.50 for wheat and $.20 for cotton.
• Available July through July
• Can buy daily, bi-monthly or monthly
• Can make changes to insurance policy
• Multi-month pricing discount
• Compare them to an ATM Put at the “strike price”
• PF Prime – Add .20 to corn, .30 to soybeans, .25 to wheat, .20 to grain sorghum, .07 to cotton


2015 Revenue Insurance Comparisons
Year/Coverage Level 2015/80 2015/80 PF 2015/85 2015/85 PF
Actual Production History 48 bu. 48 bu. 48 bu. 48 bu.
38 bu. 38 bu. 41 bu. 41 bu.
Price $9.73 $11.27 $9.73 $11.27
Revenue Guarantee $370 $428 $399 $462
Actual Production History 187 bu. 187 bu. 187 bu. 187 bu.
150 bu. 150 bu. 159 bu. 159 bu.
Price $4.15 $4.45 $4.15 $4.45
Revenue Guarantee $623 $668 $660 $ 708

Weather Contracts
Insufficient Cumulative Precipitation
Weather Station(s) PEORIA GTR PEORIA AP
Total Coverage $100,000 $100,000 $100,000
Start Date 6/1/2016 6/1/2016 6/1/2016
End Date 8/31/2016 8/31/2016 8/31/2016
Historical Minimum Precipitation 3.04 3.04 3.04
Average Precipitation 11.67 11.67 11.67
Payment Trigger 75% of Avg 65% of Avg 55% of Avg
Payment Begins Below 8.75 7.58 6.41
Total Coverage Paid At 3.04 3.04 3.04
Payout Per Inch $17,513 $22,026 $29,674
Rate 24.96% 17.90% 12.63%
Premium $24,958 $17,895 $12,633
Premium Recovery At 7.32 6.77 5.98
Payment triggers when cumulative precipitation is less than Payment Begins Below.
Buy Sooner & Save! Discount Discount Discount
Purchase by 3/31/2016 & save 2.5% $624 $447 $316
Purchase by 3/3/2016 & save 5% $1,248 $895 $632
Purchase by 2/2/2016 & save 7.5% $1,872 $1,342 $947

My thoughts for 2016
• Whole Farm Insurance if you qualify – Consider WFRP and low level MPCI – Get signed up asap to create revenue floor now
• Do not shy away from high level Insurance – Cover as much of your input costs as possible
• Utilize APH Exclusion, TA yield • Insurance will not be good enough for most!
– Be careful of buying options this year
• Look into Private Products but be selective
