2015 managerial economics stefan markowski managerial economics stefan markowski how? when? what?...
TRANSCRIPT
2015
Managerial EconomicsStefan Markowski
Managerial EconomicsStefan Markowski
How? When?How? When?
WhatWhat??
0
20
40
60
80
100
1st Qtr 2nd Qtr 3rd Qtr 4th Qtr
East
West
North
The economics of competitive advantage
Why?Why?
Where?Where?
WhoWho??
Decision making under conditionsof uncertainty

Detailed course scheduleDay no
Topic Textbook ch.
1 (24 Nov; 3 hrs)
1. Introduction. Decision making process and its elements. The scope of economic decision making. Application of marginal analysis
Chs. 1-2
2 (25 Nov; 3 hrs)
2. Demand analysis and demand elasticities Ch. 3
3 (26 Nov; 3 hrs)
3. Buyer product valuation and choices. Consumer surplus. Buyer pricing decisions Ch. 4
4 (27 Nov; 2 hrs)
4. Production/transformation process. Production technologies and input-output structure
Ch. 5
5 (28 Nov; 2 hrs)
5. Cost structure and cost drivers of producer pricing strategies. Production scale and scope.
Chs. 5 and 7
6 (1 Dec; 3 hrs)
6. Structure-conduct-performance. Market structures: competition and contestability. Pricing strategies of buyers and sellers
Ch. 8
7 (2 Dec; 3 hrs)
7. Market structures: monopoly/monopsony, monopolistic competition and oligopoly. Pricing strategies and strategic behaviour
Chs. 9-10
8 (3 Dec; 3 hrs)
8. Input sourcing and investment. Chs. 6 and 11
9 (4 Dec; 2 hrs)
9. Decision making under conditions of uncertainty. Informational asymmetries and risk management. Pricing and market power
Ch. 12
10 (5 Dec; 2 hrs)
10. Market research and market analysis. Auction and rings. Strategic behaviour Ch. 13
11 (8 Dec; 2 hrs )
11. Public sector perspective Ch. 14
12 (9 Dec; 2 hrs)
12. Revision13. Examination
13 (11 Dec; 2 hrs)
Examination

Decision making under conditions of uncertainty
Informational asymmetries and risk management
Topic Contents9.1 Managerial perspective
9.2 Uncertainty and appetite for risk
9.3 Portfolio management
9.4 9.4 Profits maximisation rule
9.5 9.5 Optimal search
9.6 Asymmetric information9.6 Asymmetric information
9.7 Signaling and screening9.7 Signaling and screening
9.8 Further reading

9.1 Managerial perspective• Our knowledge is incomplete and what we do know
can only be accessed by boundedly rational boundedly rational individuals in a limited and patchy way so even if the underlying reality is deterministic in principle we can only, and at best, describe it statisticallystatistically
• At best we can quantify quantify our fragmented and highly incomplete knowledge of reality by adopting a degree of mathematical rigour when venturing propositions about how the world works the truth of which we are not certain
• For example, we can measure the likelihood that an event will occur under particular circumstances and call it probabilityprobability

9.2 Uncertainty and appetite for risk
• We can then ask How probable is this event? or How certain are we that this particular event will occur?
• This measure of certainty we can quantify, i.e., express it as a number contained between 0 and 1, where 0 stands for impossibility and 1 for certainty. (The higher the probability of an event, the measure of probability draws closer to 1 rather than 0, that is, the more certain we are that the event of interest will materialise.)
• One way of summarizing information about uncertain events is to use the statistical concepts of the mean and the variance of a random variable
9.2 Uncertainty and appetite for risk
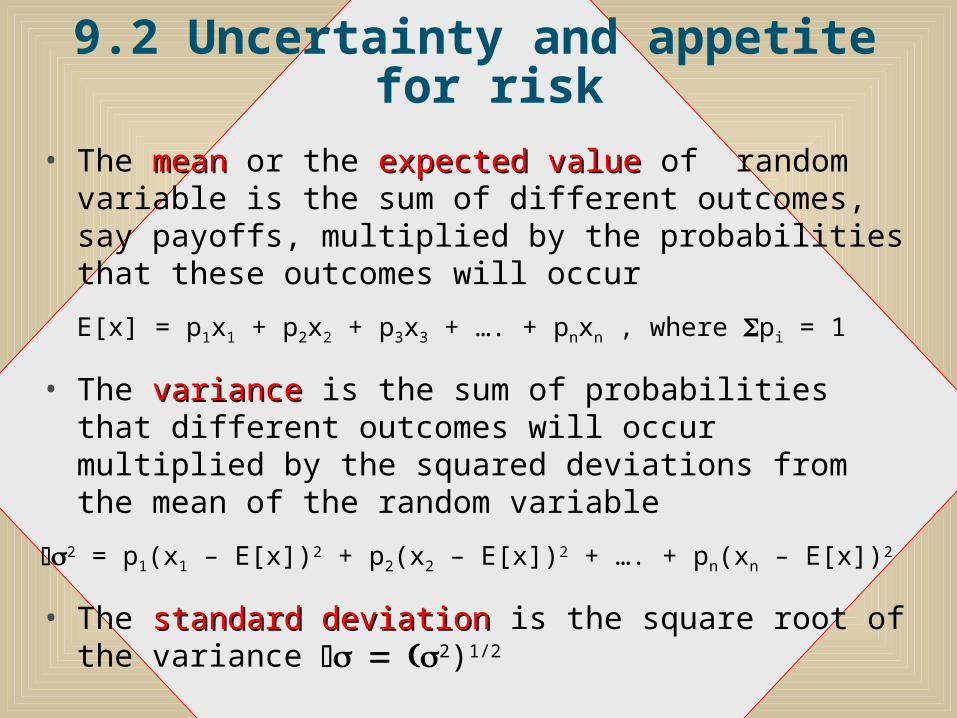
• The meanmean or the expected value expected value of random variable is the sum of different outcomes, say payoffs, multiplied by the probabilities that these outcomes will occur
E[x] = p1x1 + p2x2 + p3x3 + …. + pnxn , where pi = 1
• The variancevariance is the sum of probabilities that different outcomes will occur multiplied by the squared deviations from the mean of the random variable
2 = p1(x1 – E[x])2 + p2(x2 – E[x])2 + …. + pn(xn – E[x])2
• The standard deviationstandard deviation is the square root of the variance 2)1/2

9.2 Uncertainty and appetite for risk
Example
• Option 1: Flip a coin, if it comes up heads you get $1 if tails you pay $1
• Option 2: Flip a coin, if it comes up heads you get $10 if tails you pay $10
• E(x)1 = 0 ½ x $1 + ½ x -$1 = 0
• E(x)2 = 0 ½ x $10 + ½ x -$10 = 0
• But 21 ½ x (1 – 0)2 + ½ x (-1-0)2 = 1
22 ½ x (10 – 0)2 + ½ x (-10-0)2 = 1
9.2 Uncertainty and appetite for risk
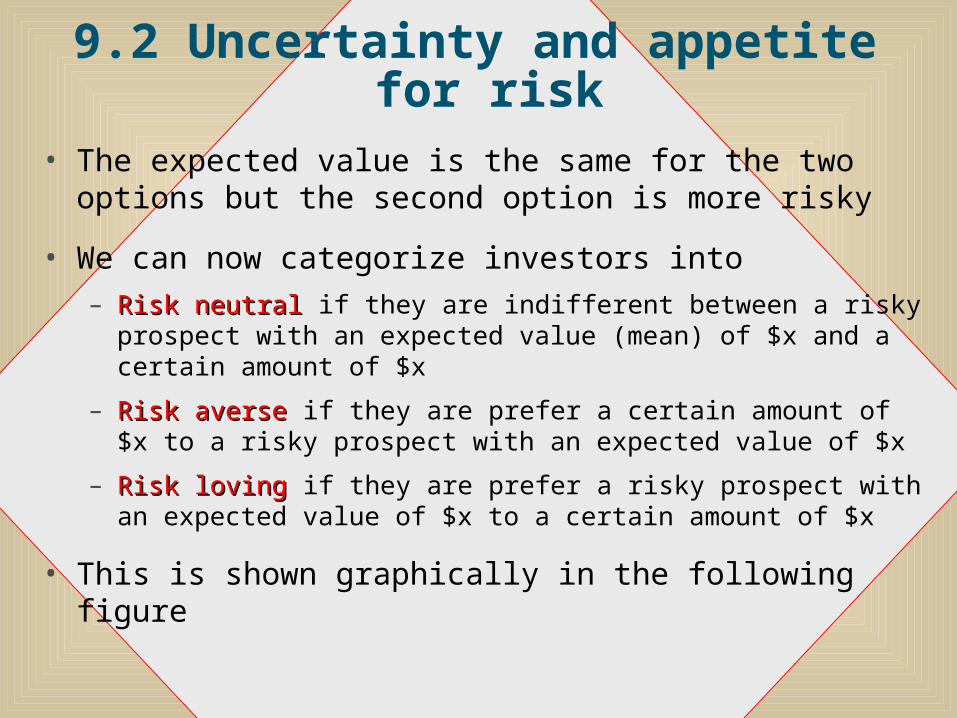
• The expected value is the same for the two options but the second option is more risky
• We can now categorize investors into – Risk neutral Risk neutral if they are indifferent between a risky prospect
with an expected value (mean) of $x and a certain amount of $x
– Risk averse Risk averse if they are prefer a certain amount of $x to a risky prospect with an expected value of $x
– Risk loving Risk loving if they are prefer a risky prospect with an expected value of $x to a certain amount of $x
• This is shown graphically in the following figure

9.2 Uncertainty and appetite for risk
Appetite for risk
E[x]
risk averse investor
risk neutral
risk loving
a2 ab
2 b2 2
9.2 Uncertainty and appetite for risk
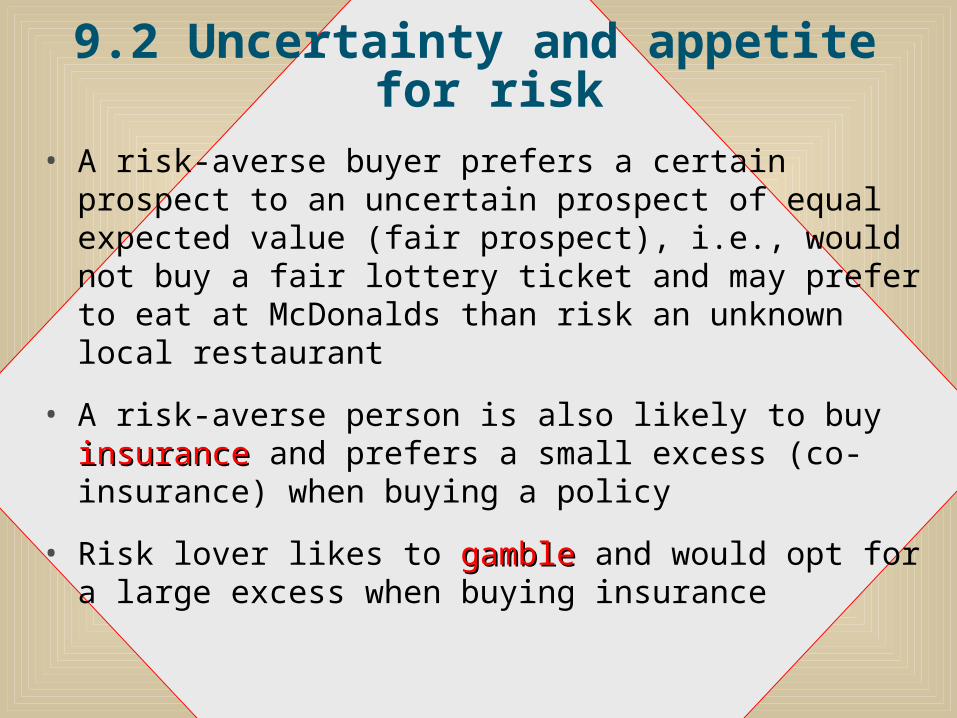
• A risk-averse buyer prefers a certain prospect to an uncertain prospect of equal expected value (fair prospect), i.e., would not buy a fair lottery ticket and may prefer to eat at McDonalds than risk an unknown local restaurant
• A risk-averse person is also likely to buy insuranceinsurance and prefers a small excess (co-insurance) when buying a policy
• Risk lover likes to gamblegamble and would opt for a large excess when buying insurance
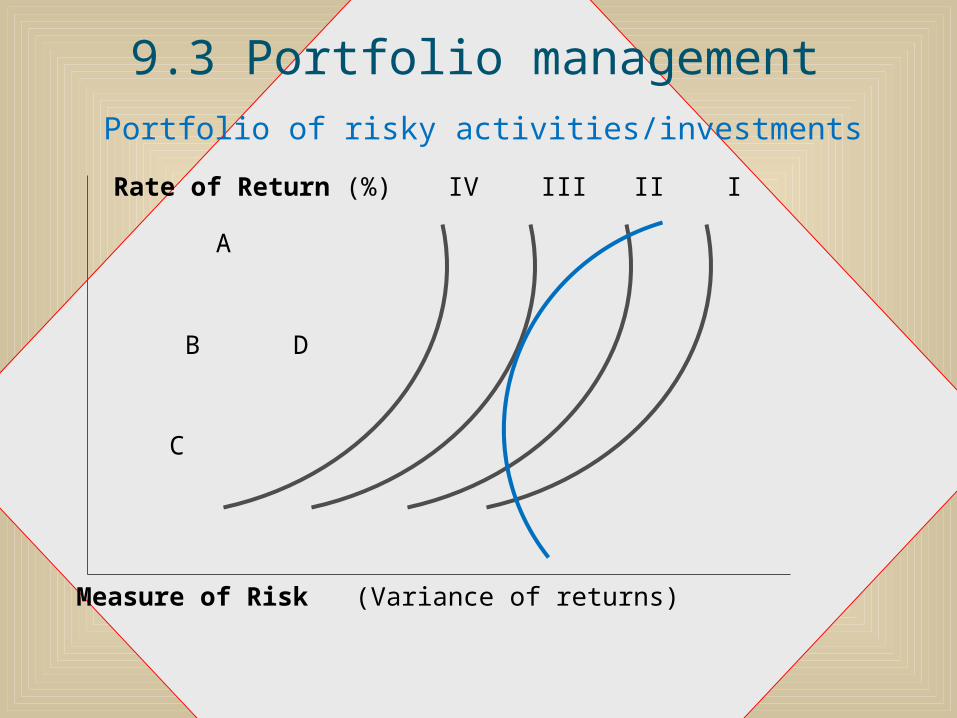
9.3 Portfolio management• In the Figure below, the investor's best investment
opportunities are shown as a curve linking the best available investment options, ABC. This curve is the investor's risk-return investment opportunity frontier investment opportunity frontier ABC
• Other available options, to the right of ABC, e.g., investment D, either offer more risk for any given rate of return or lower return for a given level of risk. Options to the north and west of ABC are unattainable
• The investor's appetite for risk appetite for risk is shown as the risk-return risk-return preference curvespreference curves I, II and III. Given the available investment opportunities, investors strive to reach their highest risk-return preference curve (e.g., this is III, since IV is beyond his/her reach and I and II are less preferable)
• We now consider the case of portfolio diversificationportfolio diversification
9.3 Portfolio managementPortfolio of risky activities/investments
Rate of Return (%) IV III II I
A
B D
C
Measure of Risk (Variance of
returns)
9.3 Portfolio management
• The shape of this curve shows the investor's preference for risk (in this case, the investor is risk averse so any increase in the riskiness of his investment must be compensated by an increase in the expected return at an increasing rate
• Suppose investment opportunities A and C are two (statistically) independent investment opportunities, say shares in companies A and C
• By investing all their investment resources in either A or C, investors can only achieve their lower (risk-return) preference objectives (I or II)
• Suppose B represents a combination of shares in C and A. This offers lower returns than C only but is also less risky than C only. It also offers more preferable combination of risk and return than A

9.3 Portfolio management
• By combining shares in A and C into a portfolio of investments, B, investors may achieve a preferred balance between risk and return compared with dedicating all their resources to one investment opportunity
• This explains why various portfolio arrangements are used to tailor risk-return combinations to the requirements of particular investors (e.g., pension funds, equity holding trusts)
• The application of portfolio analysis also enables companies to pool statistically independent risks and spread the cost of risk bearing over a large number of risk-averse individuals. This explains, in part, equity capital that is provided in the form of marketable shares, so that each share can be acquired or sold by an otherwise impecunious shareholder
9.3 Portfolio management
• The diversification strategy diversification strategy means that combining multiple investment options in one portfolio will allow investor to tailor the mean expected risk-return combination to his/her appetite for risk
• Generally, risk averse shareholders may prefer a risk-neutral manager who maximises the present value of their equity (of the firm as a stream of profits) or the expected value of a risky investment option and not the underlying risk (i.e., the manager would only accept a risky option if the expected profits are at least equal a safe investment of a similar outlay
9.3 Portfolio management• A risk averse shareholder does not need a risk
seeking manager. The latter should maximise the firm’s stream of profit while the shareholder may the shareholder may diversify risk by buying shares in different profit diversify risk by buying shares in different profit maximising companies maximising companies (offering different expected values) to create a portfolio of shares portfolio of shares to match his/her appetite for risk and return
• Also, if there are many companies posting the same expected shareholder value which are also statistically independent of each other, by building a portfolio of shares in these companies the actual average return from the investment comes closer to the expected return
9.4 Profits maximisation rule
• The profit maximisation rule can be modified to take into account expected revenue
E[MR] = MC or E[MR] = E[MC]
• You may look up Demonstration Problem 12-4 in Baye (2013):447 to see how this somewhat modified principle could be applied

9.5 Optimal search• A buyer (or seller) may shop around for the best
price but if shopping around is costly the benefit of finding a cheaper item to buy may be more than offset by the cost of search
• A good strategy is to set a reservation pricereservation price, which is a price at which the buyer is indifferent between purchasing at that price and searcher for a lower price
• The optimal search rule optimal search rule is to refuse price above the reservation price and stop searching when a price below the reservation price is found
• The reservation price is a function of the cost of search as they latter increase it also increases

9.6 Asymmetric information
• Knowledge and information Knowledge and information tend to be distributed distributed asymmetricallyasymmetrically, i.e., some people are better informed than others
• Knowledge is also costly to produce and information may be costly to access
• Thus, in business transactions there are hidden hidden characteristics characteristics when one party to a transaction knows something that the other party should but does not and hides that information
• Economic agents may also engage in hidden actionshidden actions or activities which are concealed from other interested parties
9.6 Asymmetric information•Hidden action is often a moral hazard moral hazard of activities that provide an incentive for one party to engage in activities which the other interested parties cannot observe or can only learn about later (e.g., hidden quality degradation)
• Informational asymmetries may also produce adverse selection adverse selection of people or assets with undesirable characteristics (e.g., if a company pays a generous sick leave it is likely to attract employees particularly likely to get sick). This is why no claims records attract lower insurance premia
• This is different from a moral hazard as they do not change their propensity to get sick in response to the sick leave it is that those with high propensity seek to get sick seek jobs that offer generous sick leave

9.7 Signaling and screening
• SignalingSignaling means that an informed party to a potential economic activity or a deal sends a signalsignal (observable indication, information) to the uniformed party to reveal a hidden action or a hidden characteristics either to enhance their confidence or to mislead them
• ScreeningScreening involves sorting out people or assets by the uninformed party to reveal their true characteristics
• This may take the form of self-selectionself-selection by setting tests for the informed parties that reveal their true characteristics or things they try to hide (e.g., risk lovers select risky options)

9.8 Further reading
Baye (2010): chs. 12