the economics of london 2012: some early indicators stefan
TRANSCRIPT
The Economics of London 2012: some early indicators
Stefan Szymanski
Department of Kinesiology
University of Michigan

London’s Olympic commitments
• From the outset, London put legacy at the heart of the bid and made an early commitment to delivering on key objectives
• to make London a world-leading sporting nation
• to transform the heart of East London
• to inspire a generation of young people
• to make the Olympic Park a blueprint for sustainable living
• to demonstrate the UK is a creative, inclusive and welcoming place to live in, visit and for business.
East London and Olympic Park legacy
• Classic inner city blight- decline of traditional industries
• Poor communication links
• Low quality housing stock
• Low quality services- health and education
• Poorly qualified workforce, low employment
• Social problems
• High population turnover- inward and outward migration
The scale of the problem
• The population of East London is around 2 million
• East London covers of around over 500 sq. kilometres (depending on definition)
• The Olympic Park covers an area of about 2.5 sq. kilometres
• Employment in the Olympic Park is expected to be around 8-10,000; it is expected to provide 11,000 new homes

Olympic site


97.8 96.1
103.9
97.4
101.1
122.3 97.7
151.9
139.6
113.3
81.4
82.0
126.3
67.1
107.0 112.3
103.5
149.2
98.8 167.5
104.4
163.7
81.8
90.7
110.4
141.4
124.7 128.4
101.6
147.6
96.1
118.4
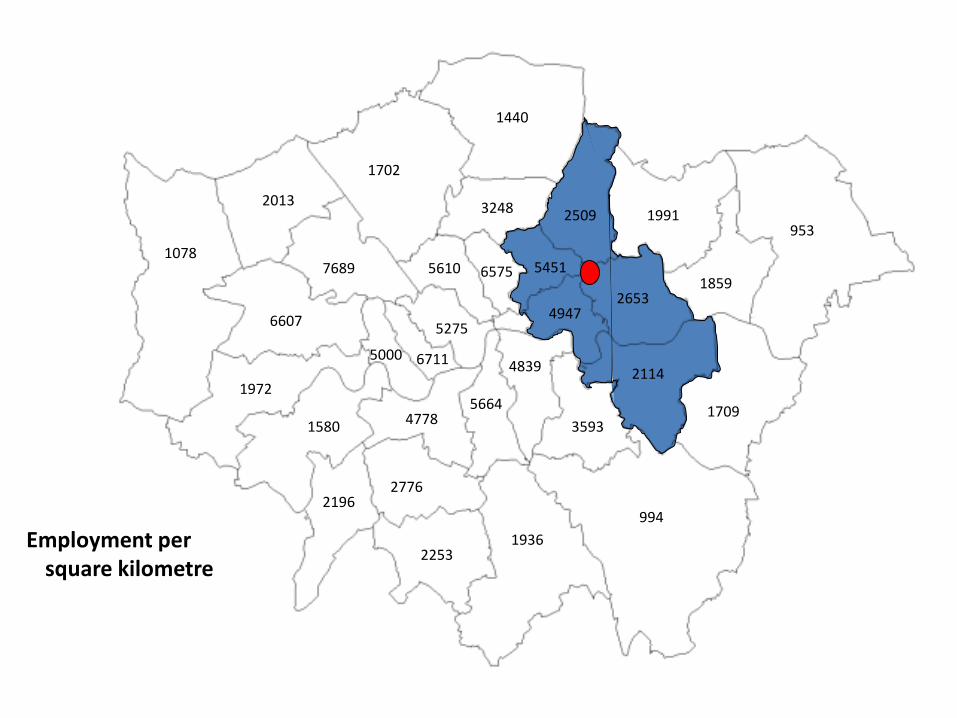
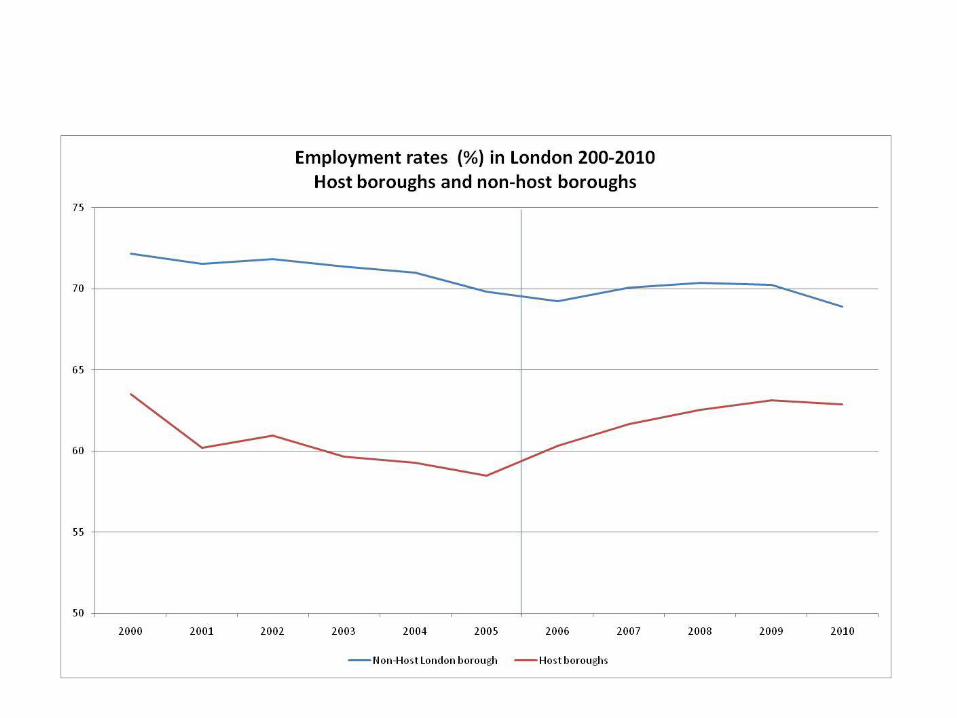
Employment levels by London Borough
4947 2653
5451
2509
2114
5610 6575
5664
4839
5275
6711 5000
3593
1859
953 1991
1709
994
2253 1936
2776
4778
2196
1580
1972
6607
1078 7689
2013
1702
3248
1440
Employment per square kilometre


Growth rates of
employment in London boroughs
Borough
Average annual growth rate of
employment 2000-2010
Average annual growth rate of
employment 2005-2010
Hackney (host) 2.91 5.66
Tower Hamlets (host) 2.42 4.39
Southwark 2.60 3.31
Lambeth 2.64 3.15
Camden 3.83 3.04
Islington 2.68 2.63
Hounslow 1.20 1.70
Westminster 3.94 1.53
Richmond upon Thames 1.78 1.47
Wandsworth 1.80 1.47
Brent 0.93 1.40 Sutton 0.18 1.35
Merton 0.84 1.17
Kingston upon Thames 1.86 1.11
Barking and Dagenham 0.17 1.05
Waltham Forest (host) 0.14 0.97
Greenwich (host) 0.85 0.86
Hillingdon 0.47 0.80
Kensington and Chelsea 2.76 0.75
Newham (host) 1.48 0.74
Bromley 0.86 0.66
Croydon 1.04 0.48
Barnet 0.04 0.20
Harrow 0.46 0.16
Havering -0.28 0.15
Lewisham 1.48 0.02
Haringey 0.44 -0.21
Hammersmith and Fulham 1.45 -0.27
Redbridge 0.48 -0.59
Bexley 0.34 -0.72
Enfield 0.12 -0.78
Ealing 1.00 -1.03
Non-Host London borough 1.25 0.88
Host boroughs 1.52 2.44

Changes in employment by sector 2005-2010
Greenwich Hackney NewhamTower
Hamlets
Waltham
Foresthost
Non-host
boroughs
Total 21,300 59,600 27,000 57,300 33,200 198,400 450,500
Manufacturing -5,000 -6,600 -2,300 6,900 3,100 -3,900 -15,500
Construction -16,200 -5,000 6,800 -1,900 7,000 -9,300 69,000
Distribution, hotels and restaurants 9,700 4,300 6,600 -3,200 12,500 29,900 -148,400
Transport and communications 8,800 -1,200 -9,400 1,500 -14,400 -14,700 -21,000
Banking, finance and insurance 36,200 32,300 9,500 29,400 -14,700 92,700 290,900
Public administration, education and health -13,700 29,000 18,300 29,600 24,800 88,000 185,600
Other services 4,500 -900 -6,400 -3,300 5,900 -200 14,000


Pre-games estimate of impact?
• Infrastructure will raise the level of amenities
• Buyers in the housing market will anticipate effects
• Kavetsos (2009) examined the impact of the Olympic announcement on property prices
• Estimates derived for properties in concentric rings around the Olympic site
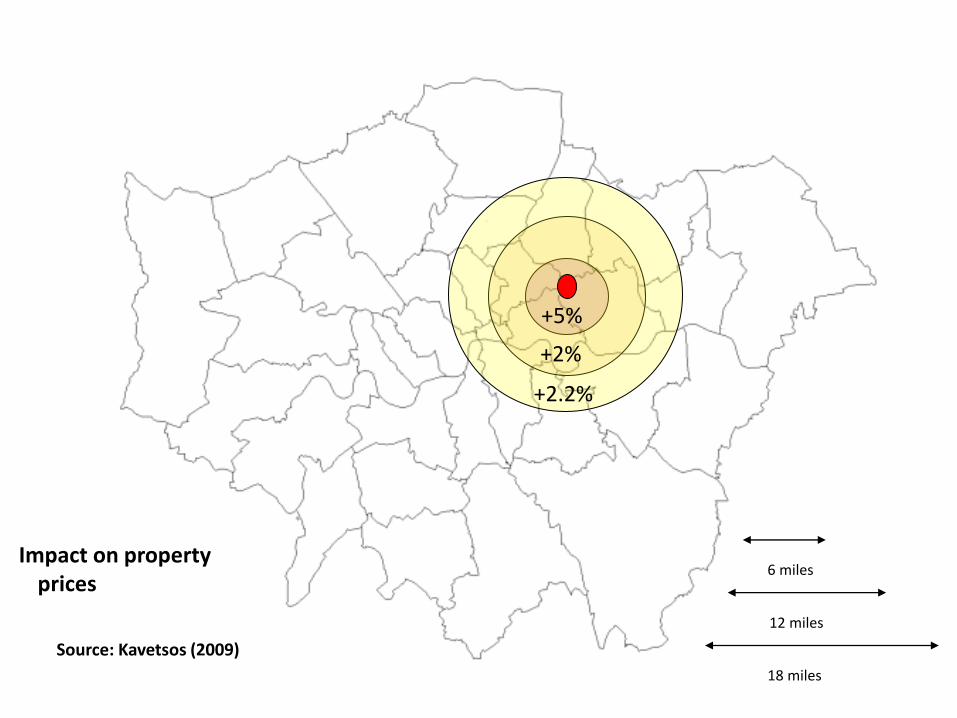
+5%
+2%
+2.2%
6 miles
12 miles
18 miles
Impact on property prices
Source: Kavetsos (2009)

Impact on property prices and the host boroughs
Economic value of impact = £1.4 billion
Source: Kavetsos (2009)