2015 national health care making the case for tb ... · 2015 national health care . for the...
TRANSCRIPT

2015 National Health Care
for the Homeless Conference and Policy
Symposium
May 7, 2015 Ed Zuroweste, MD
Migrant Clinicians Network Cynthia Tschampl, PhD Brandeis University
Making the Case for TB Continuity of Care Planning
for Homeless Patients

Do you regularly test for TB infection?
A. Yes
B. No
C. Sometimes
YesNo
50%50%

Do you actively treat TB infection once found positive skin or IGRA
test?
A. Yes
B. No
C. Sometimes 50% 50%
Yes No

Transmission and Pathogenesis

Transmission of M. tuberculosis
• Infectious disease caused by a bacteria, M. tuberculosis
• Transmitted through the air on water droplets
• Primarily affects the lungs (85%), though it can affect any organ

• Spread when someone who is sick with TB disease of the lungs coughs or sneezes, releasing bacteria – and a person nearby breathes in these infected droplets
• Untreated, a person with active TB can infect 10 to 15 people a year on average

What is the probability that TB will
be transmitted?
It depends on…
• Infectiousness of
person with TB
• Environment in which
exposure occurred
• Duration of exposure
• Virulence of the
organism

Active TB disease, 10%
TB infection, 90%
Lifetime Risk of Active Disease

Global Burden of TB, 2014 WHO Global TB Report, 2014
Estimated Number of Cases
Estimated Number of Deaths
All forms of TB 9 million 1.5 million*
HIV-Associated TB 1.1 million (13%)
360,000
Multidrug-resistant TB (MDR-TB) 480,000
~150,000
• Approx. 1/3 of the world (2 billion people) is infected with M.tb • Estimated that 37 million lives were saved between 2000 and 2013 through effective
diagnosis and treatment • **Fewer than 25% of those thought to have MDR TB were detected
*including deaths among PLHIV

TB Morbidity United States, 2002-2014
Year No. of Cases Rate (per 100,000)
2003 14, 837 5.1
2004 14, 501 4.9
2005 14, 065 4.7
2006 13, 754 4.6
2007 13, 299 4.4
2008 12, 898 4.2
2009 11, 540 3.8
2010 11, 181 3.6
2011 10, 521 3.4
2012 9,951 3.2
2013 9,588 3.0
2014 9,412* 2.95 2.2% decline
*Lowest since 1953
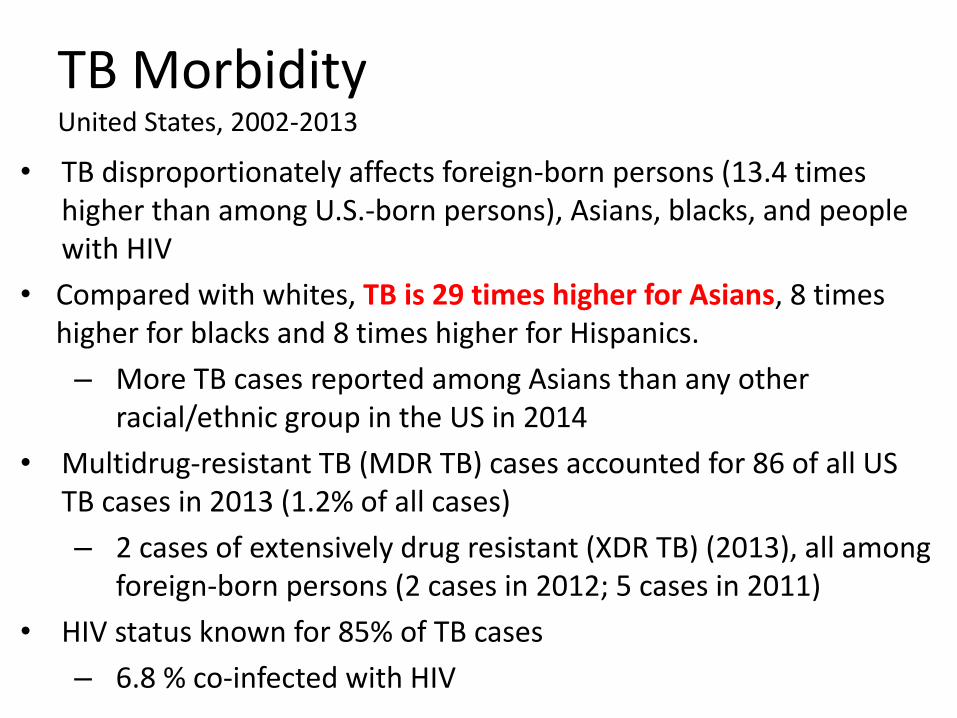
TB Morbidity United States, 2002-2013
• TB disproportionately affects foreign-born persons (13.4 times higher than among U.S.-born persons), Asians, blacks, and people with HIV
• Compared with whites, TB is 29 times higher for Asians, 8 times higher for blacks and 8 times higher for Hispanics.
– More TB cases reported among Asians than any other racial/ethnic group in the US in 2014
• Multidrug-resistant TB (MDR TB) cases accounted for 86 of all US TB cases in 2013 (1.2% of all cases)
– 2 cases of extensively drug resistant (XDR TB) (2013), all among foreign-born persons (2 cases in 2012; 5 cases in 2011)
• HIV status known for 85% of TB cases
– 6.8 % co-infected with HIV

TB Cases in US-born vs Non-US-born Persons United States, 2000-2014*
*Updated March 21, 2015 with provisional 2014 data 66.5% Foreign-born

What are the “Hidden Stats” on TB
• Active TB cases 9,588 • Contact investigation* identifies average of
17.9 contacts/active case; 1% new active case
identified; 20% LTBI; estimated over 170,000 individuals that need to be evaluated, tested and offered preventive treatment if infected.
• TB Infection (LTBI) at least 11,000,000 with
– ~ 10% risk of active TB in lifetime
*ARPE Report US, 2010 (CDC data 2/1/2013)

The burden of tuberculosis infection, the reservoir for active TB

WHO estimates that 2 billion persons (1/3 of the world’s population) have tuberculosis infection
• From this reservoir, millions of people will have active tuberculosis (TB) in coming decades
In the U.S., it is estimated by a recent NHANES survey that there are at least 11 million persons with TB infection
• >70% of TB disease in the US are re-activation TB

Horsburgh and Rubin NEJM 2011
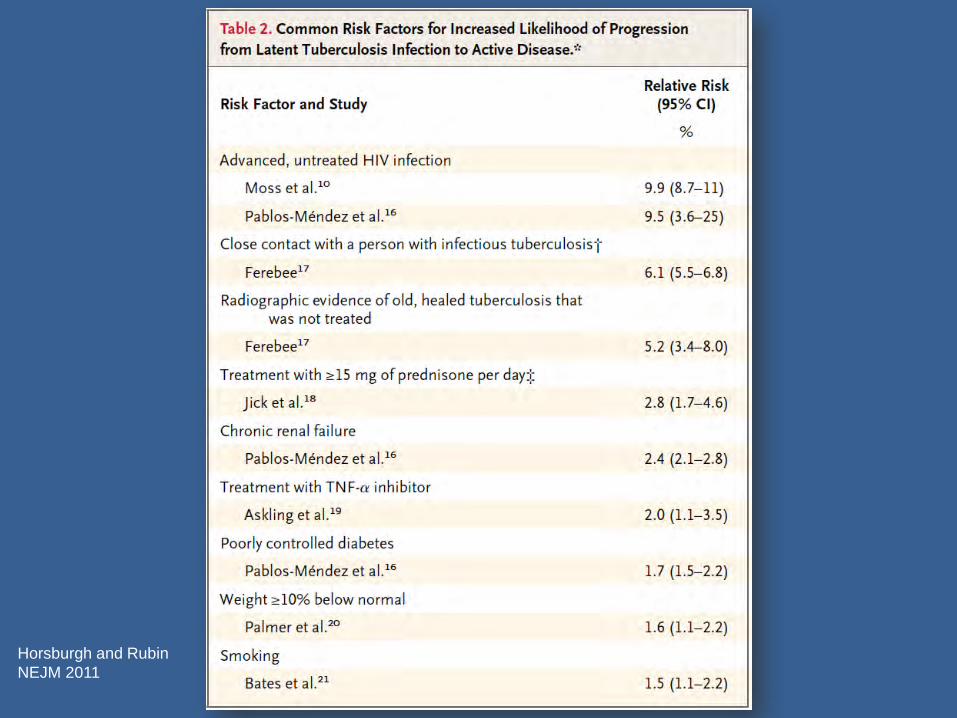
Horsburgh and Rubin
NEJM 2011
US 2010 IGRA CDC Guidelines

• “An IGRA may be used in place of (but not in addition to) a TST in all situations in which CDC recommends TSTs”
• IGRAs preferred:
– BCG vaccinated persons
– Persons unlikely to return for a TST reading
– Low risk individuals
• Like the TST, clinical judgment required when interpreting IGRA results in children <5yrs, immunocompromised persons, and TB suspects
• When maximum sensitivity needed → acceptable to use both TST and IGRA
• Lab should report quantitative results


Interferon Gamma Release Assays vs. Tuberculin Skin Test
IGRA • In vitro
• Single antigens
• Can be fully Automated
• Not affected by BCG
• Result with one patient visit
• Minimal inter-reader variability
• Outstanding surveillance tool if results electronic
• Results confidential
TST • In vivo
• Multiple antigens
• Manual reading and entry
• BCG may affect results
• Two patient visits required
• Significant inter-reader variability
• Poor surveillance tool
• Results not confidential

PUBLIC HEALTH: San Francisco TB Control
QFT+ results 2008-2011 vs historical TST+ rates
Kawamura et al, Lancet ID Correspondence, Volume 12, No. 8, p584, August 2012

Rule out TB disease • CXR (if abnormal—obtain sputum) • Assess/evaluate for symptoms (sputum) • Wait for culture result if specimen obtained
Prior history of treatment for TB infection or TB disease? TB exposure? Assess risks and benefits of treatment
Active liver disease (LFTs if indicated) Ascertain current and previous drug therapy and side
effects
Before initiating treatment for LTBI…

Treatment Regimens for TB Infection
Drugs Months of Duration
Interval Minimum
Doses Rating/
Evidence
INH 9* Daily 270
AII
2x wkly** 76 BII
INH 6
Daily 180 BI
2x wkly** 52
Avoid: HIV infected,
children (CII)
RIF 4 Daily 120 BII
*Preferred ** Intermittent treatment only with DOT
INH=isoniazid; RIF=rifampin

Rifampin Regimens RIF daily for 4 months is an
acceptable alternative when treatment with INH is not feasible (BII for HIV-, BIII for HIV +)
INH resistant or intolerant
Patient unlikely to be adherent for longer treatment period
In situations where RIF cannot be used (e.g., HIV-infected persons receiving protease inhibitors), rifabutin may be substituted
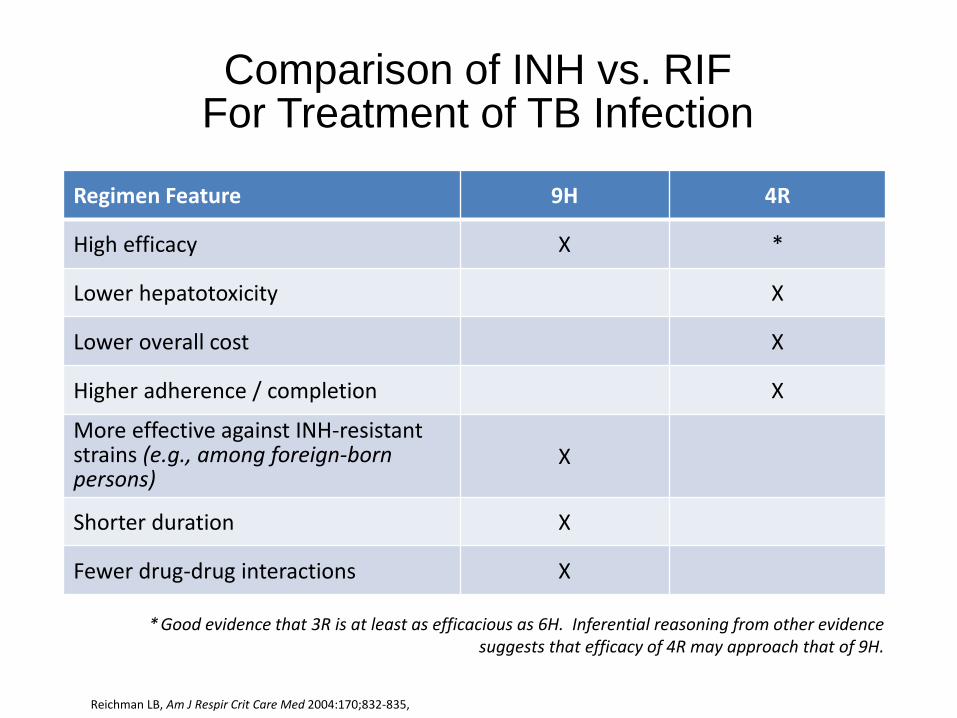
Comparison of INH vs. RIF For Treatment of TB Infection
Reichman LB, Am J Respir Crit Care Med 2004:170;832-835,
* Good evidence that 3R is at least as efficacious as 6H. Inferential reasoning from other evidence suggests that efficacy of 4R may approach that of 9H.
Regimen Feature 9H 4R
High efficacy X *
Lower hepatotoxicity X
Lower overall cost X
Higher adherence / completion X
More effective against INH-resistant strains (e.g., among foreign-born persons)
X
Shorter duration X
Fewer drug-drug interactions X

Shorter regimens appear to be associated with increased completion rates
Horsburgh CR Chest 2010:137:401-09

Completion with 4R compared to 9H: a randomized trial of 847 patients
78% completed 4R
60% completed 9H
Menzies et al. Ann Int Med 2008;149:689-697

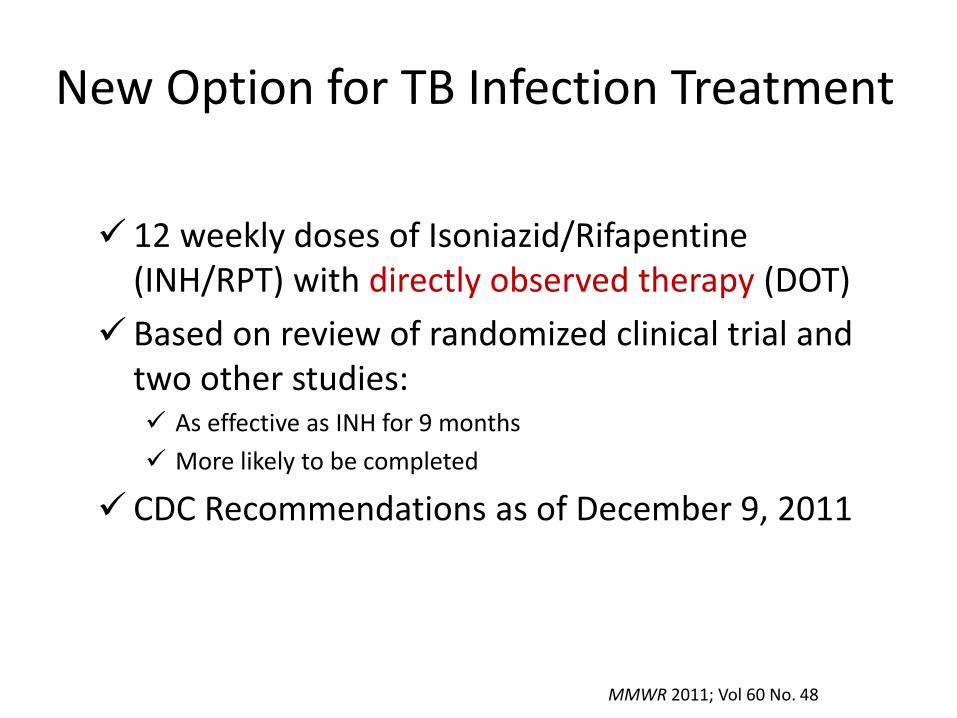
New Option for TB Infection Treatment
12 weekly doses of Isoniazid/Rifapentine (INH/RPT) with directly observed therapy (DOT)
Based on review of randomized clinical trial and two other studies: As effective as INH for 9 months
More likely to be completed
CDC Recommendations as of December 9, 2011
MMWR 2011; Vol 60 No. 48
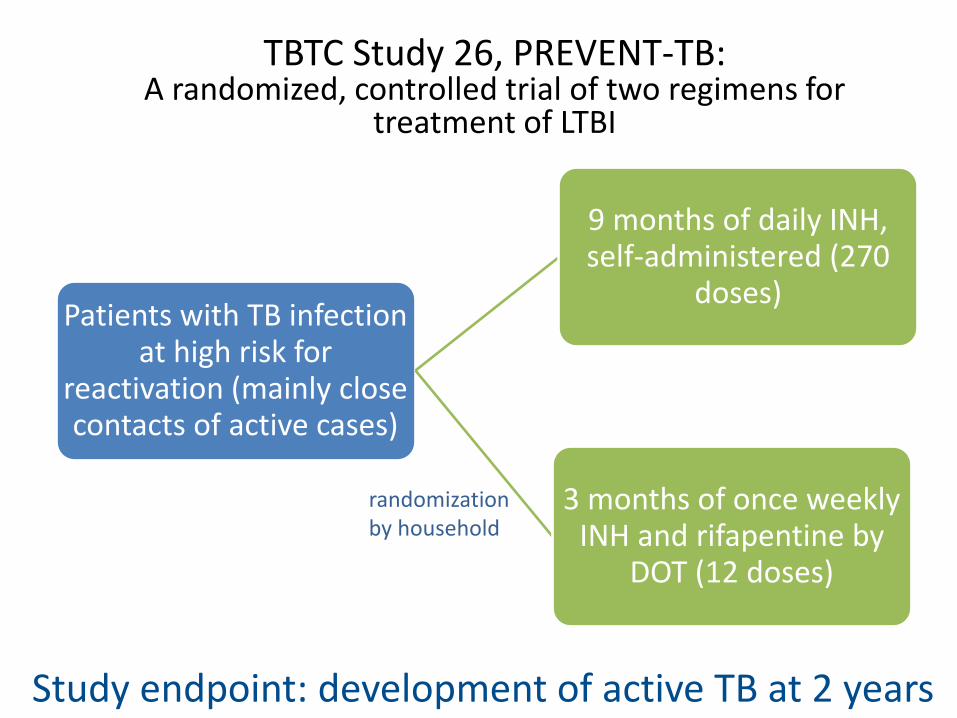
Patients with TB infection at high risk for
reactivation (mainly close contacts of active cases)
9 months of daily INH, self-administered (270
doses)
3 months of once weekly INH and rifapentine by
DOT (12 doses)
randomization by household
Study endpoint: development of active TB at 2 years
TBTC Study 26, PREVENT-TB: A randomized, controlled trial of two regimens for
treatment of LTBI

Primary Aim
• Evaluate the effectiveness of weekly INH-RPT vs daily 9H
• Primary endpoint: – Culture-confirmed TB in
persons > 18 y.o. and culture-confirmed or clinical TB in persons < 18 y.o.

Hepatotoxicity Among persons receiving > 1 dose
During treatment or within 60 days of the last dose
Toxicity 9H N=3,759
INH-RPT N=4,040
P-value
All hepatotoxicity
113 (3.0) 24 (0.6) <0.0001
Related to drug
103 (2.7) 18 (0.5) <0.0001
Not related
13 (0.4) 6 (0.2) 0.08

TBTC Study 26, PREVENT-TB: Outcomes

Cumulative TB Rate 33 months from enrollment—MITT
Log-rank P-value: 0.06

INH/RPT – Recommended Groups
Healthy persons ≥12 years old with at least one risk factor for TB progression
• Recent known contacts to TB
• Conversion from negative to positive on a TST or IGRA
• Radiographic findings of healed pulmonary TB
• HIV-infected patients NOT on anti-retroviral therapy
Case by case basis for other patients (individuals unlikely to complete longer regimens “migrant farmworkers” “homeless individuals”)

INH/RPT – Groups Not Recommended
• Children < 2 years old
• HIV-infected patients on antiretroviral therapy
• Pregnant women
• Patients exposed to TB resistant to either INH or rifampin

INH/RPT – Dosing/Cost
Drug costs (CT DOH; Lynn Sosa, MD) INH/RPT- $112 for 12 wk INH- $14 for 9 month

Limitations
•Few HIV-infected participants •Tolerability and effectiveness data pending
•Complete tolerability assessment in young children also pending

TBTC Study 26, PREVENT-TB Conclusions
INH-RPT was at least as effective as 9H The INH-RPT TB rate was less than half that of 9H
INH-RPT completion rate was significantly higher than 9H
82% vs. 69%
INH-RPT was safe relative to 9H Lower rates of:
• Any adverse event
• Hepatotoxicity attributable to study drug
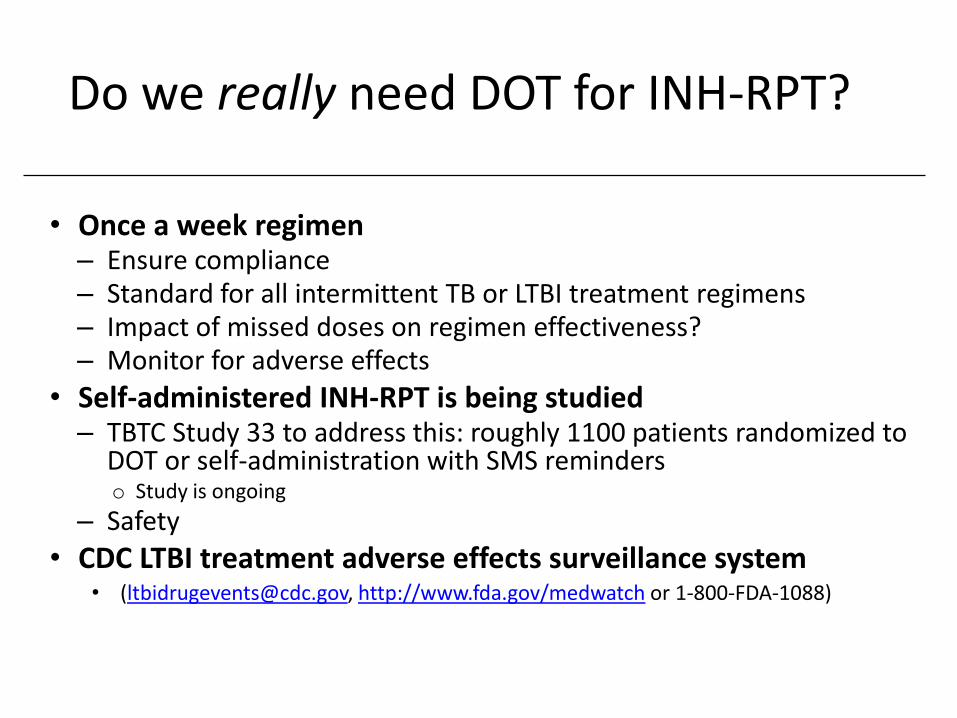
Do we really need DOT for INH-RPT?
• Once a week regimen – Ensure compliance – Standard for all intermittent TB or LTBI treatment regimens – Impact of missed doses on regimen effectiveness? – Monitor for adverse effects
• Self-administered INH-RPT is being studied – TBTC Study 33 to address this: roughly 1100 patients randomized to
DOT or self-administration with SMS reminders o Study is ongoing
– Safety
• CDC LTBI treatment adverse effects surveillance system • ([email protected], http://www.fda.gov/medwatch or 1-800-FDA-1088)

Completion of Therapy
Regimen Duration Doses Complete Within
Daily INH 9 months 270 12 months
Twice weekly INH 9 months 76 12 months
Daily INH 6 months 180 9 months
Twice weekly INH 6 months 52 9 months
Rifampin 4 months 120 6 months
INH-RPT 3 months 11-12 16 weeks

Priorities in Screening and Treatment of TB Infection
Photo: Bertha Almendariz

With new tools for the diagnosis and treatment of TB infection, we now have a chance to improve the effectiveness of TB control in the US by focusing on cost-effective priorities
IGRA was cost saving compared with TST in certain groups
TB Infection screening guidelines could make progress toward TB elimination by screening close contacts, HIV infected, foreign born regardless of time living in the US
Linas BP. Am J Respir Cri Care Med. 2011;184:590-601

Treatment of TB Infection 2015: Conclusions
TB Infection is common in the U.S.
Treatment of TB Infection is an important component of TB elimination strategies
Important to choose treatment regimen based on individual circumstance of each patient
Treatment with the standard regimen of 9H is associated with very low adherence and significant rates of adverse events
Treatment with 4 months Rif is associated with much higher adherence and fewer serious side effects when compared to 9H
Regimen of INH-RPT is as efficacious as 9H, and when administered by DOT
Self-administration of INH-RPT will be tested in a randomized controlled TBTC trial

Have you ever lost a patient to follow up?
A. Yes
B. No
YesNo
50%50%

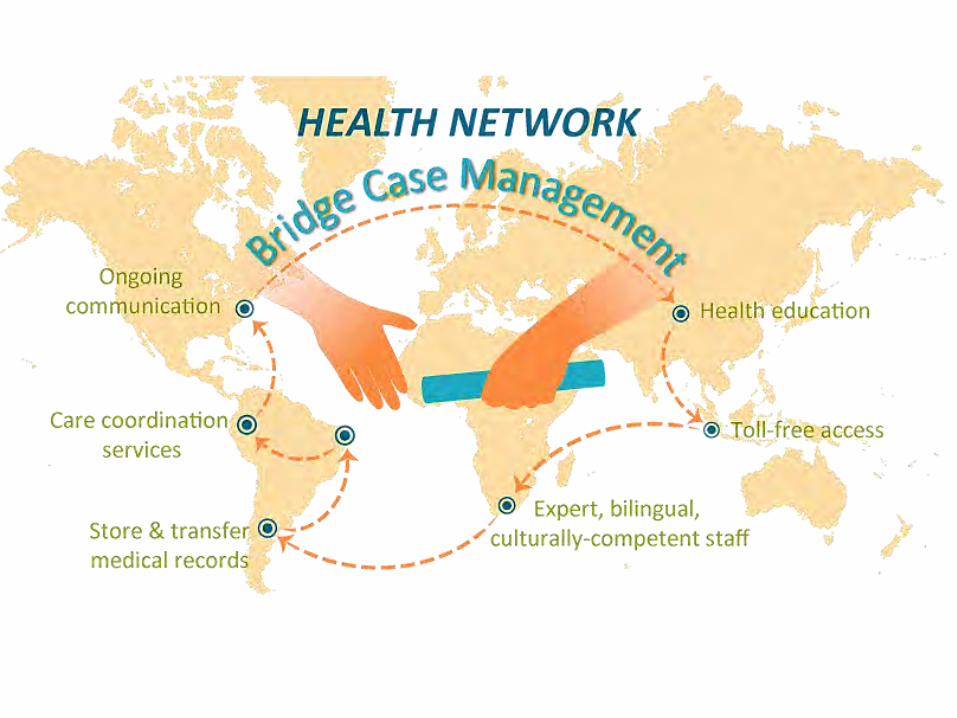
MCN Health Network
Goal: Eliminate health disparities due to patient mobility
Responds to challenges in providing continuity of care through patient navigation; medical record transfer and bridge case
management program

Forms Required for Enrollment
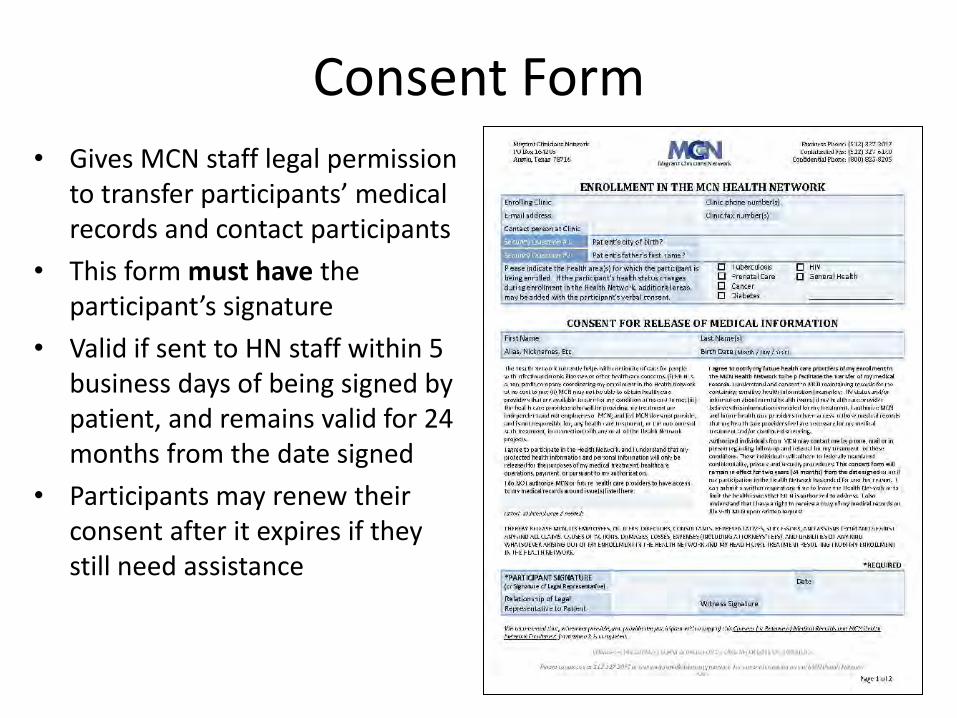
Consent Form • Gives MCN staff legal permission
to transfer participants’ medical records and contact participants
• This form must have the participant’s signature
• Valid if sent to HN staff within 5 business days of being signed by patient, and remains valid for 24 months from the date signed
• Participants may renew their consent after it expires if they still need assistance

1 Health Network Enrollment Criteria
Patient is:
• Already mobile OR
• Likely to move
2 Patient has:
• In need of a clinic for follow-up of ANY
health condition
3 Clinic Must:
• Complete Enrollment Registration
•Have patient sign Consent/Send
•Send Medical Records

Health Network Maintaining a Patient in Care
• Contacts patients on a scheduled basis, TB patients monthly
• Contacts TB clinics monthly
• Assists patients in locating clinics for services and resources (transportation)
• Reports back to the enrolling clinic and notifies them of patient status and final outcomes
Photo © Alan Pogue
Photo © Alan Pogue

Maintaining a Patient in Care
The Patient’s Role…
© Earl Dotter

1. Provide HN with as many phone numbers as possible
2. Contact HN after arriving to new area
3. Stay on treatment until indicated
4. Inform HN of address / Phone changes
5. Notify clinics of enrollment in HN
MCN Health Network
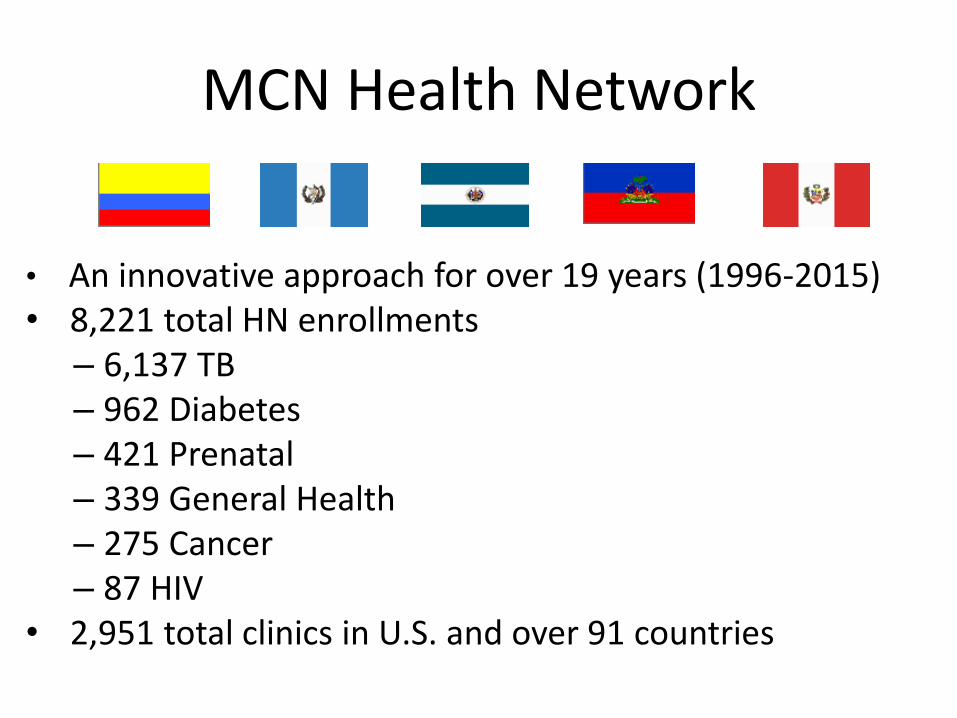
• An innovative approach for over 19 years (1996-2015) • 8,221 total HN enrollments
– 6,137 TB – 962 Diabetes – 421 Prenatal – 339 General Health – 275 Cancer – 87 HIV
• 2,951 total clinics in U.S. and over 91 countries

Nationality TBNet 2005-2013 Country
(91Total Countries)
Total Class 3 patients
(1,512 total patients)
Percent of total patients
Honduras 446 29.5%
Mexico 318 21.0%
Guatemala 245 16.2%
El Salvador 143 9.5%
India 35 2.3%
China 30 1.9%
Peru 29 1.9%
Nicaragua 28 1.9%
Phillipines 26 1.7%
United States 23 1.5%
Ecuador 23 1.5%
Haiti 21 1.4%
Viet Nam 12 0.8%
Honduras; Mexico;
Guatemala; El Salvador
1,152 76.2%

Class 3 Active TB: TBNet Treatment Success (2005-2013)
(91 Total Countries)
1,512 Class 3 Active TB Cases Referred – 37 not recommended by country
1,475 Treatment Recommended – 24 deceased
1,451 Followed by TBNet for Active TB – 147 lost to follow up
– 87 refused treatment
1,217 Complete Treatment = 83.9%

February, 2010
• Screened in an ICE
facility
• Negative smear
• RUL consolidation
• TST 20 mm
• Asymptomatic
• Medication was not
started
Enrolled in TBNet
prior to being
deported to Central
America
March, 2010 TBNet
notified of positive
culture results
Medical records sent
to his home country
and family notified May 2010, wife calls TBNet to say
that her husband is being held by
“coyotes” on the west coast of the
United States.
TBNet case manager calls and is
able to speak to the patient to
explain the need for treatment
TBNet staff then initiates a
human trafficking investigation
via ICE
June 2010 patient contacts
TBNet from the east coast
having been released by
“coyotes”
Medical records sent to clinic
by TBNet and patient started
on 4 drug regimen using DOT
September 2010 patient calls
TBNet to say he had moved to
another east coast state
• Clinic found
• Appointment made
• Medical records transferred
from both previous clinics
• Patient resumed DOT
• Wife in Central America
updated on his progress

TBNet Successes
• Treatment equal to that among geographically stable populations
• Disease surveillance role
• Consistency between international protocols
• Policy recommendations – identify difficult to treat populations
• Model for management of other diseases in mobile populations
Is "cost-effective" the same thing as ”cost-saving"?
A. Yes
B. No
YesNo
50%50%

Way to value cost per health outcome
Cost-effectiveness is not the same as cost -
saving
All things being equal, cost-saving > CE
Combined with “quality adjusted life year” or
QALY, it can be a useful way to compare
health interventions across the health/public
health spectrum
WHO guidelines: 3x gross national income
(GNI) per capita = CE, 1x or less = highly CE
Quick Primer: CEA
5/1/2015 61

Cost-effectiveness of
bridge case
management for
tuberculosis infection
treatment for mobile
patients within the
United States
CO
ST
-
EF
FE
CT
IVE
NE
SS
5/1/2015 62

Aim 1: Modeled incremental health benefits of
BCM
TB cases averted
QALYs saved
Aim 2: Determined the cost-effectiveness of the
BCM, compared to the status quo (ICERs)
Population: 162 individuals referred for LTBI
treatment with BCM, 2005-2012;
counterfactual cohort calculated using the
literature
Aims & Population
5/1/2015 63

Findings
5/1/2015 64
Incremental benefits of BCM cohort (n=162):
2 TB cases averted and 2.7 QALYs saved
Incremental costs of BCM:
$480 per unique client enrolled or about $97 per client per year
BCM for LTBI patients highly cost-effective
$28,662 per QALY gained; $39,629/averted case (1x GNI per capita = highly cost-effective, i.e., $50,120)
Sensitivity analyses: $33,009 (CI: $6,625-$90,056) per QALY saved; $45,678 (95% CI: $9,160-$124,514) per TB case averted

Would a system like the one just described work for your patient
population?
A. Yes
B. No
C. A subgroup of my patients
YesNo
50%50%
