2015 parks, recreation & cultural resources master plan
DESCRIPTION
ÂTRANSCRIPT

Parks, Recreation, and Cultural Resources Master Plan
May 2015


Parks, Recreation, and Cultural Resources Master Plan i
Acknowledgements
Town Board of Commissioners Vivian A. Jones, Mayor Zachary Donahue Greg Harrington Anne M. Reeve Margaret Stinnett Jim Thompson
Town of Wake Forest Administration Mark Williams, Town Manager Roe O’Donnell, Deputy Town Manager
Town of Wake Forest, Recreation Advisory Board Jeff Sank, Chairman Shinica Thomas, Vice Chairman Sandy Thomason Alecia Knowles Jeremy Farnham Tommy Lynch Einar Bohlin Dan Bulatek Dick Berger Commissioner Margaret Stinnett (Ex‐Officio)
Town of Wake Forest Parks, Recreation, and Cultural Resources Project Team Ruben Wall, Director Rosemary Pimentel, Office Assistant II Edward Austin, Athletics Superintendent Monica Lileton, Programs Superintendent Meghan Hawkins, Recreation Specialist Jennifer Rall, Urban Forestry Coordinator Pamela Stevens, Wake Forest Renaissance Centre Manager Cathy Gouge, Centre Specialist Jimmy Thrift, Maintenance Superintendent Randy Hoyle, Maintenance Crew Supervisor
Consultant Team GreenPlay, LLC Design Concepts DHM Design RRC Associates
For more information about this document, contact GreenPlay, LLC At: 1021 E. South Boulder Road, Suite N, Louisville, Colorado 80027 Telephone: 303‐439‐8369 Email: [email protected] | www.greenplayllc.com

THIS PAGE INTENTIONALLY LEFT BLANK

Parks, Recreation, and Cultural Resources Master Plan iii
Table of Contents I. EXECUTIVE SUMMARY ................................................................................................................ 1 PURPOSE OF THIS PLAN ..................................................................................................................... 1 PLANNING PROCESS SUMMARY .......................................................................................................... 1 KEY ISSUES SUMMARY ....................................................................................................................... 2 INVENTORY ASSESSMENT SUMMARY .................................................................................................... 3 RECOMMENDATIONS WITH CAPITAL COST ESTIMATES AND PRIORITIZATION ............................................... 4 GOAL 1: IMPROVE ORGANIZATIONAL CREDIBILITY AND OPERATIONAL EFFICIENCIES .................................... 4 GOAL 2: IMPROVE FINANCIAL SITUATIONS ............................................................................................ 5
II. PAST, PRESENT, AND FUTURE – THE PLANNING CONTEXT ................................................................. 9 A. PURPOSE OF THIS PLAN ................................................................................................................. 9 B. HISTORY OF WAKE FOREST PARKS AND RECREATION DEPARTMENT ...................................................... 9 C. WAKE FOREST PARKS AND RECREATION DEPARTMENT MISSION STATEMENT ......................................... 9 D. PARKS AND RECREATION DEPARTMENT OVERVIEW ............................................................................ 9 E. RELATED PLANNING EFFORTS AND INTEGRATION .............................................................................. 10 F. METHODOLOGY OF THIS PLANNING PROCESS .................................................................................. 10 G. TIMELINE FOR COMPLETING THE MASTER PLAN .............................................................................. 12
III. WHAT WE WANT – OUR COMMUNITY AND IDENTIFIED NEEDS ....................................................... 13 A. WAKE FOREST POPULATION AND DEMOGRAPHIC TRENDS ................................................................. 13 B. DEMOGRAPHIC ANALYSIS ............................................................................................................. 13 C. PARKS AND RECREATION INFLUENCING TRENDS ............................................................................... 19 D. COMMUNITY AND STAKEHOLDER INPUT SUMMARY .......................................................................... 28 E. OPERATIONAL AND MARKETING ANALYSIS ...................................................................................... 41
IV. WHAT WE HAVE NOW – AN ANALYSIS OF SPACES AND SERVICES .................................................... 55 A. INVENTORY ASSESSMENT AND LEVEL OF SERVICE ANALYSIS ............................................................... 55 B. GRASP® METHODOLOGY ............................................................................................................ 55 C. KEY LEVEL OF SERVICE FINDINGS ................................................................................................... 67
V. GREAT THINGS TO COME – RECOMMENDATIONS & ACTION PLANS ................................................... 89 A. IDENTIFICATION OF KEY ISSUES FOR FOCUS ..................................................................................... 89 B. RECOMMENDATIONS ................................................................................................................... 92 C. SUMMARY ACTION PLAN, COST ESTIMATES AND PRIORITIZATION ..................................................... 100
APPENDIX A – COMMUNITY INPUT SUMMARY ............................................................................... 105 APPENDIX B – GRASP® MAPS .................................................................................................... 111 APPENDIX C – GRASP® COMPOSITE VALUES METHOD FOR LEVEL OF SERVICE ANALYSIS ......................... 119 APPENDIX D – SAMPLE SPONSORSHIP POLICY ................................................................................ 125 APPENDIX E – SAMPLE PARTNERSHIP POLICY ................................................................................. 143 APPENDIX F – PYRAMID METHODOLOGY ...................................................................................... 163

iv The Town of Wake Forest, North Carolina
List of Tables
Table 1: Summary Demographics for Wake Forest, North Carolina – 2014 ............................................... 13 Table 2: Wake Forest Population Projections ............................................................................................. 14 Table 3: Town of Wake Forest, North Carolina – 2014 Educational Attainment ....................................... 17 Table 4: Wake Forest Housing Statistics ..................................................................................................... 18 Table 5: Low Scoring Components .............................................................................................................. 83 Table 6: Summary of Findings ‐ Key Issues Matrix ...................................................................................... 91
List of Figures
Figure 1: Wake Forest Population Growth Trend ....................................................................................... 14 Figure 2: Population Age Distribution for the Years 2010, 2014, and 2019 ............................................... 15 Figure 3: Ethnicity Statistics (2014) ............................................................................................................. 16 Figure 4: Snapshot of Wake Forest and North Carolina unemployment rates from 2008 ‐ 2014 .............. 17 Figure 5: Annual Household Income Distribution Comparison (2014 – 2019) ........................................... 18 Figure 6: Top Five Priorities Combined Invitation Sample vs. Open Link ................................................... 33 Figure 7: Importance of Facilities and Services – Average Rating Invitation Sample vs. Open Link ........... 36 Figure 8: Current Facilities and Services – Importance vs. Needs Met Matrix Invitation Sample Only ..... 39

Parks, Recreation, and Cultural Resources Master Plan 1
I. Executive Summary Purpose of this Plan
The Wake Forest Parks, Recreation, and Cultural Resources Master Plan is intended to help meet the needs of current and future residents by positioning Wake Forest to build on the community’s unique parks and recreation assets and identify new opportunities. The citizen‐driven plan establishes a clear direction to guide Town staff, advisory boards, and elected officials in their efforts to enhance the community’s Parks and Recreation services and facilities.
Planning Process Summary
This project has been guided by a Parks and Recreation project team made up of Town staff, with input from the Parks and Recreation Advisory Board and the Town Board of Commissioners. This team provided input to the GreenPlay consulting team throughout the planning process. A collaborative approach creates a plan that fully utilizes the consultant’s expertise and incorporates the local knowledge and institutional history that only community members can provide. The project consisted of the following tasks:
Community Engagement
Review of previous planning efforts, Town historical information.
Extensive community involvement effort including focus groups, meetings with key stakeholders, and a community‐wide public meeting.
Statistically‐valid community interest and opinion survey.
Online community engagement website – MindMixer.
Facility Inventory Inventory of parks and facilities using existing mapping, staff interviews, and on‐site visits to
verify amenities and assess the condition of the facilities and surrounding areas.
GRASP® Level of Service Analysis
Interviews with staff to provide information about parks and recreation facilities and services, along with insight regarding the current practices and experiences of the Town in serving its residents and visitors.
Identification of alternative providers of recreation services to provide insight regarding the market opportunities in the area for potential new facilities and services.
Analysis addressing recreation, parks, cultural resources, and related services.

2 The Town of Wake Forest, North Carolina
Assessment and Analysis Review and assessment of relevant plans.
Measurement of the current delivery of service for parks and recreation facilities using the GRASP® Level of Service Analysis and allowing for a target level of service to be determined that is both feasible and aligned with the desires of citizens as expressed through the citizen survey. This analysis is also represented graphically in GRASP® Perspectives.
Exploration of finance and funding mechanisms to support development and sustainability within the system.
Needs Assessment Consideration of the profile of the community and demographics, including population growth.
Research of trends related to the Wake Forest region and American lifestyles to help guide the efforts of Parks and Recreation over the next several years.
Operational and Marketing Analysis Analyze parks and recreation programming and service delivery.
Conduct an organizational Strengths, Weaknesses, Opportunities, and Threats (SWOT) Analysis.
Develop a broad assessment of the overall parks and recreation operations.
Recommendations: Goals, Objectives, and Action Plan Identification and categorization of recommendations into themes with goals, objectives, and an
action plan for implementation.
Development of an action plan for capital improvements including cost, funding source potentials, and timeframe to support the implementation of the plan.
Key Issues Summary
During the initial stages of the project, the following Key Issues were identified for focus:
Organizational: Need better marketing and communication of activities and facilities.
Increased staffing for operations and maintenance to keep up with demand.
Attract tourism and outdoor recreational opportunities.
Finance: Utilize equitable user fees.
Increase economic impact and revitalize downtown.
Utilize proceeds from 2014 Bond Referendum.
Pursue grant opportunities.
Programs and Service Delivery: Increase programming for families, seniors, and teens.
Increase programs in wellness/fitness, cultural, and special needs.
Increase the number of special events.
Increase aquatic opportunities.

Parks, Recreation, and Cultural Resources Master Plan 3
Facilities and Amenities: Maintain and improve existing facilities.
Develop connections with greenways and trails.
Meet future population demands through additional recreation facilities.
Explore an indoor aquatic facility.
Explore an outdoor amphitheater/special events venue.
Improve water access to river, lake, and ponds.
Key Level of Service (LOS) Analysis Findings:
Coverage for access to parks, trails, and facilities in Wake Forest is fairly good. Eighty‐six percent (86%) of the land area within the study area boundary has access to at least some Town‐provided amenity within a one‐mile proximity. If amenities provided by Wake County and other providers were included, the percentage would probably be even greater.
The LOS value (i.e. the measure of “how much” service there is from parks, trails, and facilities) varies across the study area and is highest in the area north of Dr. Calvin Jones Highway and east of Capital Boulevard. It is lowest in the southernmost part of town.
When LOS is examined compared to an assumed threshold value equal to a typical local park, it appears that the central parts of Wake Forest are at or above the threshold, with gaps occurring near Wake Forest Middle School (which is served by a Wake County school/park) and on the west side of Capital Boulevard. The eastern edge and southernmost parts of the study area also fall below the threshold.
Access to recreation opportunities by walking is less available to residents than may be desired; however, this does not take into account amenities offered by other providers, such as Wake County. It does, however, stress the need to work with other providers to ensure that the needs of all Wake Forest residents are met by at least one provider.
Some areas with walkable level of service below the threshold may be acceptable if they are commercial or industrial areas or more rural settings.
Wake Forest’s indoor facilities provide a good range of spaces and activities; however, these facilities are concentrated in a limited part of the Town. Consideration should be given to expanding the options by locating new facilities in other parts of town or partnering with other providers to make sure they are available to residents.
Inventory Assessment Summary
Parks are pleasant and well‐maintained throughout the system.
No components were found to be functioning below expectations due to condition.
The parks are used and enjoyed by residents.
Joyner Park is a particular gem, a signature park for Wake Forest and a model for future parks.
Wake County School parks offer additional facilities and features that serve residents of Wake Forest.
THEN AGAIN . . .
Some parks could use better circulation system within them, particularly paved walkways and loop walks.
Natural areas could be better integrated into the parks with transitional edges and pathways.
Parks could be better connected with the trail system.

4 The Town of Wake Forest, North Carolina
Parks tend to be concentrated in the sector of Wake Forest that lies east of Capital Boulevard and north of Dr. Calvin Jones Highway. Facilities of other providers, such as Wake County, may play a more important role in these outlying areas.
Recommendations with Capital Cost Estimates and Prioritization
The following Goals, Objectives, and Action Items for the recommendations are drawn from the public input, inventory, level of service analysis, findings feedback, and all of the information gathered during the master planning process, with a primary focus on maintaining, sustaining, and improving Town of Wake Forest parks, open space, cultural resources, and trails. All cost estimates are in 2015 figures. Timeframe to complete is designated as Short‐term (up to 3 years), Mid‐term (3‐6 years), and Long‐term (7‐10 years).
Goal 1: Improve Organizational Credibility and Operational Efficiencies Objective 1.1: Enhance and improve internal and external communication of activities and services
Actions Capital Cost Estimate
Operational Budget Impact
Timeframe to Complete
1.1.a Make use of the Town’s Marketing Plan to improve awareness.
$0 Staff Time Short‐Term
1.1.b Partner with the Communications Department and the Public Information Office to make the best use of the Town’s website and social media outlets.
$0 Staff, Partners Short‐Term
1.1.c Adopt open lines of communications and meetings with partners and potential partners.
$0 Staff Time Short‐Term
Objective 1.2: Create new staffing assignments and/or hire new employees for added responsibilities
1.2.a Add staff to the Maintenance Division to meet current and anticipated future demands.
$0 TBD Short to Mid‐Term
1.2.b Add staff for facility operations to meet demand for extended hours of operations for facilities.
$0 TBD Short‐Term
1.2.c Ensure that staffing resource levels can maintain existing and new facilities at or above acceptable standards as master plan is implemented.
$0 TBD Short to Long‐Term
1.2.d Add staff to the Urban Forestry Division to meet anticipated future demands with development and expansion of the parks and greenways system.
$0 TBD Short to Mid‐Term

Parks, Recreation, and Cultural Resources Master Plan 5
Goal 2: Improve Financial Situations Objective 2.1: Implement equitable user fees
Actions Capital Cost Estimate
Operational Budget Impact
Timeframe to Complete
2.1.a Develop a standardized philosophy for pricing programs and services that reflects our community. An example for developing a pricing philosophy is provided (Pyramid Pricing Methodology and Cost Recovery Policy, Appendix F).
$40,000 – $60,000
Staff time/ consultant
Short to Mid‐Term
Objective 2.2: Pursue grant opportunities
2.2.a Continue to research, submit, and track federal, regional, state, and local grants.
Matching Funds TBD
Staff Time Short‐Term
Objective 2.3: Implement Parks, Recreation, and Greenways Improvements from the 2014 Bond Referendum
2.3.a Develop a plan for the implementation of the Parks, Recreation, and Greenways Improvements from the 2014 Bond Referendum.
$18,800,000 Staff Time Mid‐Term
Objective 2.4: Consider Increase of Tax Increment Levels
2.4.a Campaign for community investment in long term Master Plan implementation.
$0 $0 Short‐Term
Goal 3: Improve Programs and Service Delivery Objective 3.1: Increase programming for families, seniors, and teens
Actions Capital Cost Estimate
Operational Budget Impact
Timeframe to Complete
3.1.a Expand program opportunities for teens, families, and seniors in all locations.
$0 TBD Short‐Term
Objective 3.2: Increase programs in wellness/fitness, cultural, and special needs
3.2.a Expand wellness/fitness, cultural, and special needs programming opportunities.
$0 TBD Short to Mid‐Term
3.2.b As new facilities are developed and constructed, include appropriate spaces for wellness/fitness, cultural, special needs, and aquatic opportunities.
TBD TBD Short to Mid‐Term

6 The Town of Wake Forest, North Carolina
Objective 3.3: Increase number of special events and festivals
Actions Capital Cost Estimate
Operational Budget Impact
Timeframe to Complete
3.3.a Expand neighborhood and community special event and festival opportunities at a variety of locations community wide with an emphasis in the downtown area.
$0 TBD Short‐Term
Objective 3.4: Create greater awareness for and increase participation at the Renaissance Centre
3.4.a Create a 3‐5 year Strategic Plan that focuses on creating awareness and increasing programming and develop a marketing strategy.
$0 TBD Short‐Term
Objective 3.5: Create greater awareness for the Urban Forestry Division
3.5.a Develop a marketing strategy for the Urban Forestry Division that creates a greater awareness and public interest in the goals and outcomes of the division.
$0 TBD Short‐Term
3.5.b Develop implementation strategies and educational opportunities for the Urban Forestry Management Plan.
$0 TBD Short‐Term
Goal 4: Improve Facilities and Amenities Objective 4.1: Maintain and improve existing facilities
Actions Capital Cost Estimate
Operational Budget Impact
Timeframe to Complete
4.1.a Continue to implement maintenance strategies that maintain and make improvements to existing facilities.
TBD TBD Ongoing
4.1.b Develop a plan to address the recommendations from the inventory as they relate to individual park improvements.
TBD TBD Long‐Term

Parks, Recreation, and Cultural Resources Master Plan 7
Objective 4.2: Expand trails & connectivity
4.2.a Complete Greenways System as identified in the 2014 Bond.
$4,600,000 TBD Mid‐Term
4.2.b Explore the development of Trail Heads at entrance points to the Greenway.
$332,827 TBD Long‐Term
Objective 4.3: Provide new facilities to meet growing demand
4.3.a Explore the opportunity to design and construct a 65,000 square foot Recreation Center in the downtown area that includes a competitive pool, water features, gymnasiums, fitness/wellness space, indoor track, and community space.
$25,653,857 TBD TBD
4.3.b Explore the opportunity to construct a dedicated Pickleball facility that could serve the region as a tournament and league play hub.
$232,186 TBD TBD
The total capital cost estimates for the Parks and Recreation Master Plan is in the range of approximately $45 million to $55 million with many variables depending on the types, size, and degree of improvements. Details on the improvements and new construction at parks and facilities have been provided in a staff resource document.

THIS PAGE INTENTIONALLY LEFT BLANK

Parks, Recreation, and Cultural Resources Master Plan 9
II. Past, Present, and Future – The Planning Context
A. Purpose of this Plan
The Wake Forest Parks, Recreation, and Cultural Resources Master Plan is intended to help meet the needs of current and future residents by positioning Wake Forest to build on the community’s unique parks and recreation assets and identify new opportunities. The citizen‐driven plan establishes a clear direction to guide Town staff, advisory boards, and elected officials in their efforts to enhance the community’s parks and recreation services and facilities.
B. History of Wake Forest Parks and Recreation Department
Parks, Recreation, and Cultural Resources was defined to include (but was not limited to) playgrounds; playfields; indoor recreation; museums; civic and Cultural Resources centers; and other parks, recreation, and cultural areas and facilities when owned or controlled by the Town. A Parks and Recreation Fund and an Advisory Board, composed of 11 members, was established in the late ‐1970s. The Parks, Recreation, and Cultural Resources Department has seen five Directors to date.
C. Wake Forest Parks and Recreation Department Mission Statement
D. Parks and Recreation Department Overview
Wake Forest is located in an area of scenic beauty and historical significance in North Carolina. The Town’s Parks, Recreation, and Cultural Resources Department is a source of community pride, and is responsible for the many parks, recreation facilities, and programs that are important factors in the quality of life in the community. The 12 parks have a total acreage of 691 (293 developed and 398 undeveloped), and the Department operates 3 community facilities, a 50 meter outdoor pool, and the Wake Forest Renaissance Centre, a new performing arts center that make up an outstanding park system. The Parks, Recreation, and Cultural Resources Department co‐hosts and/or participates in a number of special events, including concerts in the park, First Friday Flicks, Halloween Spooktacular, Six Sundays in Spring, and a full schedule at the Wake Forest Renaissance Centre.
The Wake Forest Parks and Recreation Department seeks to enhance the lives of the citizens of Wake Forest by offering a comprehensive system of parks, greenways, facilities, and open spaces coupled with cultural and athletic programs that promote education, health, and wellness.

10 The Town of Wake Forest, North Carolina
E. Related Planning Efforts and Integration
The Town of Wake Forest has undertaken several planning efforts in recent years that have helped inform the planning process for this plan. These documents include:
Town of Wake Forest Community Plan, 2009
Open Space and Greenways Plan, 2002
Parks and Recreation Master Plan, 2005
Transportation Plan Update, 2010
Bicycle Plan, 2008
Pedestrian Plan, 2006
Renaissance Plan, 2004
Urban Forestry Management Plan, 2013 These documents were reviewed by the consultant team and have been endorsed and integrated into the recommendations of the Parks, Recreation, and Cultural Resources Master Plan, where applicable, with no conflicts within any of these existing planning efforts.
F. Methodology of this Planning Process
This project has been guided by a project team made up of the Parks, Recreation, and Cultural Resources Department and Town staff, with the input from the Recreation Advisory Board, and the Town Board of Commissioners. This team provided input to the GreenPlay consulting team throughout the planning process. A collaborative approach creates a plan that fully utilizes the consultant’s expertise and incorporates the local knowledge and institutional history that only community members can provide. The project consisted of the following tasks:
Community EngagementFacility Inventory
GRASP® Level of Service Analysis Needs Assessment
Operational and Marketing Analysis Recommendations: Goals, Objectives, and Action Plan

Parks, Recreation, and Cultural Resources Master Plan 11
Community Engagement Review of previous planning
efforts, Town historical information.
Extensive community involvement effort including focus groups, meetings with key stakeholders, and community‐wide public meetings.
Statistically‐valid community interest and opinion survey.
Facility Inventory Inventory of parks and facilities
using existing mapping, staff interviews, and on‐site visits to verify amenities and assess the condition of the facilities and surrounding areas.
GRASP® Level of Service Analysis Interviews with staff to provide information about parks and recreation facilities and services,
along with insight regarding the current practices and experiences of the Town in serving its residents and visitors.
Identification of alternative providers of recreation services to provide insight regarding the market opportunities in the area for potential new facilities and services.
Analysis addressing recreation, parks, cultural resources, and related services.
Assessment and Analysis Review and assessment of relevant plans.
Measurement of the current delivery of service for parks and recreation facilities using the GRASP® Level of Service Analysis and allowing for a target level of service to be determined that is both feasible and aligned with the desires of citizens as expressed through the citizen survey. This analysis is also represented graphically in GRASP® Perspectives.
Exploration of finance and funding mechanisms to support development and sustainability within the system.
Needs Assessment Consideration of the profile of the community and demographics, including population growth.
Research of trends related to American lifestyles to help guide the efforts of Parks and Recreation over the next several years.
Priorities
Recreation Facilities Needs
Needs Assessment and Public
Input
Recreation Facilities Demand Analysis
Inventory
Citizens Survey

12 The Town of Wake Forest, North Carolina
Operational and Marketing Analysis Analyze parks and recreation programming and service delivery.
Conduct an organizational SWOT analysis.
Broad assessment of overall parks and recreation operations.
Recommendations: Goals, Objectives, and Action Plan Identification and categorization of recommendations into themes with goals, objectives, and an
action plan for implementation.
Development of an action plan for capital improvements including cost, funding source potentials, and timeframe to support the implementation of the plan.
Conceptual designs for the four major parks.
G. Timeline for Completing the Master Plan
Strategic Kick‐Off August 2014 Community Engagement September – November 2014 Inventory and Assessment of Existing Facilities September – November 2014 GRASP® Level of Service Analysis October – December 2014 Needs Assessment December 2014 Operational and Marketing Analysis November – December 2014 Findings Compilation Report November 2014 Recommendations and Action Plans November 2014 – January 2015 Draft Plan, Presentation February 2015 Final Plan, Presentation, and Deliverables May 2015

Parks, Recreation, and Cultural Resources Master Plan 13
III. What We Want – Our Community and Identified Needs Identification of current parks and recreation resources, as well as recreation trends, community demographics, and needs, help to better understand future recreational opportunities and identify the unique niche of the Town of Wake Forest. The historic values and standards that the Parks, Recreation, and Cultural Resources Department brings to the community, along with parks and recreation trends, work together to create a unique opportunity for Wake Forest to plan for and implement recommendations for future parks and recreation facilities. Following is an overview of the Wake Forest community and a needs assessment of parks and recreation facilities and services. This section first describes the key demographic information as well as national trends in parks and recreation services. Community input from stakeholder interviews, focus groups, and a community meeting is described and identifies satisfaction levels along with public needs for Wake Forest’s parks and recreation facilities and services. Results from a statistically‐valid community survey are summarized and highlighted. A compilation of the detailed survey data and cross tabulations has been provided separately as a staff resource document. All of this information provides a framework to understand Wake Forest’s context, parks and recreational needs, and direction for the future.
A. Wake Forest Population and Demographic Trends
Understanding community demographics is an important component of preparing a Parks and Recreation Master Plan. This chapter provides a demographic overview of the Town of Wake Forest. The population data used in this demographic profile comes from ESRI Business Information Solutions, based on the 2000 and 2010 U.S. Census data and the Town of Wake Forest Planning Department. Table 1: Summary Demographics for Wake Forest – 2014
Summary Demographics ‐ 2014
Population 37,046
Number of Households 14,036
Avg. Household Size 2.83
Median Age 35.2
Median Household Income $64,485
B. Demographic Analysis
Population Projections Although the future of population growth cannot be predicted with certainty, it is helpful to make assumptions about it for planning purposes. Table 1 contains population estimates and projections for Wake Forest in the years 2014, 2019, and 2024, based on the 2010 U.S. Census and the Town of Wake Forest Planning Department. The annual growth rate for the Town from 2000 through 2010 was 6.62 percent. ESRI’s projected annual growth rate for the Town for 2014 through 2019 is 3.18 percent, compared to a projected 2014 – 2019 annual growth rate of 1.06 percent for the State of North Carolina, and an annual growth rate of 0.73 percent for the United States as a whole. Wake Forest’s population growth trend is graphically represented in Figure 1.

14 The Town of Wake Forest, North Carolina
Table 2: Wake Forest Population Projections*
US Census (2000 and 2010 ) and ESRI Projections
2000 Population 15,864
2010 Population 30,117
2014 Estimated 37,046
2019 Projected 40,498
2024 Projected 46,682 Source: 2000 and 2010 Census and ESRI Business Information Solutions 2014 Demographic and Income Profile and the Town of Wake Forest Planning Department. *GreenPlay, LLC, calculated projected populations for 2024 based on ESRI growth multiplier of 3.18% for Wake Forest. The U.S. Census does not create projections for 2014, 2019, or 2024.
Figure 1: Wake Forest Population Growth Trend Source: ESRI Business Information Solutions.
Population Age Distribution A comparison of the estimated population break down by age for the Town of Wake Forest from 2010 to 2019 is shown in Figure 2. The gender distribution in 2014 is 48.2 percent male to 51.8 percent female. The median age is 35.2.
0
5,000
10,000
15,000
20,000
25,000
30,000
35,000
40,000
45,000
50,000
2000 2010 2014 2019 2024
Population

Parks, Recreation, and Cultural Resources Master Plan 15
Figure 2: Population Age Distribution for the Years 2010, 2014, and 2019 Source: 2010 U.S. Census; 2014 estimates and 2019 forecast provided by ESRI Business Information Solutions. The age demographics have undergone a number of changes in Wake Forest from 2010 to 2014 with these trends predicted to continue through 2019. The 0‐9 age range is predicted to drop by about four percent by 2019 to represent 15.7 percent of the population, while the 15‐24 age range is predicted to jump about three percent to 13.5 percent. Similarly, the 25‐34 age range is predicted to drop by six percent by 2019 to represent 26.3 percent of the population, while the 45‐74 age range is predicted to jump by six percent to 31.8 percent.
Race/Ethnicity Figure 3 reflects the racial/ethnic population distribution for Wake Forest:
The Caucasian population remains quite substantial, while on a slightly downward trend from 77.3 percent in 2010 to a predicted 72.7 percent in 2019.
Fifteen percent (15%) of the population was African American in 2010, and this population is trending upward to a predicted 17.4 percent in 2019.
The population of Hispanic origin (irrespective of race) has grown from 2010 (5.6 percent), and is expected to continue to grow to 8.5 percent of the population by 2019.
Wake Forest has small Asian and American Indian populations at about 3 percent and .5 percent in 2014, respectively.
0.0%
5.0%
10.0%
15.0%
20.0%
25.0%
0 ‐ 4 5 ‐ 9 10 ‐14
15 ‐19
20 ‐24
25 ‐34
35 ‐44
45 ‐54
55 ‐64
65 ‐74
75 ‐84
85+
2010
2014
2019

16 The Town of Wake Forest, North Carolina
Figure 3: Ethnicity Statistics (2014) Source: 2010 U.S. Census; 2014 estimates and 2019 forecast provided by ESRI Business Information Solutions.
Educational Attainment As shown in Table 3, the highest ranking educational cohorts in Wake Forest are those with a Bachelor’s degree (31.2%), those with some college education and no degree (21.2%), and those residents that are high school graduates (including equivalency) (16.7%). Those with a graduate or professional degree follow, comprising 13.1 percent of the population. According to a census study, education levels had more effect on earnings over a 40‐year span in the workforce than any other demographic factor, such as gender, race, and ethnic origin.1
1 Tiffany Julian and Robert Kominski, “Education and Synthetic Work‐Life Earnings Estimates” American Community Survey Reports, US Census Bureau, http://www.census.gov/prod/2011pubs/acs‐14.pdf, September 2011.
0.0%
10.0%
20.0%
30.0%
40.0%
50.0%
60.0%
70.0%
80.0%
90.0%
2010
2014
2019

Parks, Recreation, and Cultural Resources Master Plan 17
Table 3: Town of Wake Forest, North Carolina – 2014 Educational Attainment
Education Attainment Service Area Percentage
Less than 9th grade 2.1%
9th to 12th grade, no diploma 4.7%
High school graduate (includes equivalency) 16.7%
GED/Alternative Credential 1.7%
Some college, no degree 21.2%
Associate’s degree 9.3%
Bachelor’s degree 31.2%
Graduate or professional degree 13.1% Source: ESRI Business Information Solutions 2014 estimate based on the 2010 U.S. Census.
Employment Figure 4 provides a snapshot of the unemployment rate from August 2008 through August 2014 for the Town of Wake Forest and for the State of North Carolina as a whole. Wake Forest has a strong, resilient economy and weathered the recent recession quite well. Figure 4: Snapshot of Wake Forest and North Carolina unemployment rates from 2008 – 2014 Source: Bureau of Labor Statistics.
3.9%
6.1%5.4%
4.1%
6.6%
10.6%
9.3%
6.8%
0.0%
2.0%
4.0%
6.0%
8.0%
10.0%
12.0%
Aug. 2008 Aug. 2010 Aug. 2012 Aug. 2014
Wake Forest North Carolina

18 The Town of Wake Forest, North Carolina
Household Information As reflected in Table 4, in 2014, Wake Forest has 12,942 housing units with a 63.9 percent owner‐occupied housing rate, compared to a 29.4 percent renter occupied rate. The average household size in 2014 is 2.84. Table 4: Wake Forest Housing Statistics
Source: 2010 U.S. Census; 2014 estimates and 2019 forecasts provided by ESRI Business Information Solutions.
Household Income The estimated 2014 median household income for residents of Wake Forest is $64,485 and is
expected to grow to $75,844 by 2019. Figure 5 illustrates the full income distribution estimated for Wake Forest in 2014 and projected for 2019.
Most residents have an income in the $50,000 – $74,999 range (about 17.6%) followed by the $100,000 – $149,000 income range (16.8%).
Income distribution in the $75,000 – $99,999, $100,000 – $149,000, $150,000 – $199,999, and $200,000+ ranges is expected to rise by 1.4 percent, 3 percent, 1.4 percent, and .9 percent, respectively, from 2014 to 2019.
Figure 5: Annual Household Income Distribution Comparison (2014 – 2019)
Source: ESRI Business Information Solutions, 2014.
2010 2014 2019
Total housing units 11,370 12,942 15,085
Percent owner occupied 67.3% 63.9% 63.6%
Percent renter occupied 25.2% 29.4% 29.8%
Percent vacant 7.5% 6.7% 6.4%
0.0%
5.0%
10.0%
15.0%
20.0%
25.0%
2014
2019

Parks, Recreation, and Cultural Resources Master Plan 19
C. Parks and Recreation Influencing Trends
The following information highlights relevant regional and national outdoor recreation trends from various sources that may influence the Town of Wake Forest recreation planning for the next several years.
Administration Trends for Recreation and Parks Municipal parks and recreation structures and delivery systems have changed, and more alternative methods of delivering services are emerging. Certain services are being contracted out, and cooperative agreements with non‐profit groups and other public institutions are being developed. Newer partners include the health system, social services, justice system, education, the corporate sector, and community service agencies. These partnerships reflect both a broader interpretation of the mandate of parks and recreation agencies and the increased willingness of other sectors to work together to address community issues. The relationship with health agencies is vital in promoting wellness. The traditional relationship with education and the sharing of facilities through joint‐use agreements is evolving into cooperative planning and programming aimed at addressing youth inactivity levels and community needs. Listed below are additional administrative national trends:
Level of subsidy for programs is lessening, and more “enterprise” activities are being developed, thereby allowing subsidy to be used where deemed appropriate.
Information technology allows for better tracking and reporting.
Pricing is often determined by peak, off‐peak, and off‐season rates.
More agencies are partnering with private, public, and non‐profit groups.
Agency Accreditation Parks and Recreation agencies are affirming their competencies and value through accreditation. This is achieved by an agency’s commitment to 150 standards. There are currently 116 agencies around the nation that have received the Commission for Accreditation of Parks and Recreation Agencies (CAPRA) accreditation.
Accreditation is a distinguished mark of excellence that affords external recognition of an organization’s commitment to quality and improvement.
Accreditation has two fundamental purposes – to ensure quality and to ensure improvement.
The National Recreation and Parks Association administratively sponsors two distinct accreditation programs. The Council on Accreditation of Parks, Recreation, Tourism and Related Professions (COAPRT) approves academic institutions and the Commission for Accreditation of Parks and Recreation Agencies (CAPRA) approves agencies. It is the only national accreditation of parks and recreation agencies, and is a valuable measure of an agency’s overall quality of operation, management, and service to the community.

20 The Town of Wake Forest, North Carolina
Additional benefits of CAPRA accreditation include:
Boosts staff morale
Encourages collaboration
Improves program outcomes
Identifies agency and cost efficiencies
Builds high level of trust with the public
Demonstrates promise of quality
Identifies best management practices
Americans with Disabilities Act (ADA) ‐ Compliance On September 14, 2010, the U.S. Department of Justice (DOJ) issued an amended regulation implementing the Americans with Disabilities Act (ADA 2010 Standards).2 On March 15, 2011, the amended Act became effective, and for the first time in history, it includes recreation environment design requirements. Covered entities were to be compliant with design and construction requirements and the development of a three‐year transition plan by March 15, 2012. Implementation of the three‐year transition plan must be complete by March 15, 2015.
Aquatics/Water Recreation Trends According to the National Sporting Goods Association (NSGA), swimming ranked third nation‐wide in terms of participation in 2012.3 Outdoor swimming pools are not typically heated and open year round. Swimming for fitness is the top aspirational activity for “inactives” in six of eight age categories in the SFIA “2013 Sports, Fitness and Leisure Activities Topline Participation Report,” representing a significant opportunity to engage inactive populations. Nationally, there is an increasing trend toward indoor leisure and therapeutic pools. Additional indoor and outdoor amenities like “spray pads” are becoming increasingly popular as well. In some cities and counties, spray pools are popular in the summer months and are converted into ice rinks in the winter months.
Dog Parks Dog parks continue to see high popularity and have remained among the top planned additions to parks and recreational facilities over the past three years. The National Dog Park Association, a new association dedicated to providing informational resources for starting and maintaining dog parks, was established in 2014. Recreation Management magazine suggests that dog parks can represent a relatively low‐cost way to provide an oft‐visited, popular community amenity. 4 Dog parks can be as simple as a gated area, or more elaborate with “designed‐for‐dogs” amenities like water fountains, agility equipment, and pet wash stations.
2 U.S. Department of Justice, Americans with Disabilities Act, ADA Home Page, http://www.ada.gov/, accessed on November 15, 2012. 3 National Sporting Goods Association, “2012 Participation – Ranked by Total Participation”, 2013. 4 Emily Tipping, “2014 State of the Industry Report, Trends in Parks and Recreation”, Recreation Management, June 2014.

Parks, Recreation, and Cultural Resources Master Plan 21
Economic & Health Benefits of Parks There are numerous economic and health benefits of parks, including the following:
Trails, parks, and playgrounds are among the five most important community amenities considered when selecting a home.
Research from the University of Illinois shows that trees, parks, and green spaces have a profound impact on people’s health and mental outlook.5
U.S. Forest Service research indicates that when the economic benefits produced by trees are assessed, the total value can be two to six times the cost for tree planting and care.6
Fifty percent (50%) of Americans regard outdoor activities as their main source of exercise.7 The Trust for Public Land has published a report titled: “The Benefits of Parks: Why America Needs More City Parks and Open Space.” The report makes the following observations about the health, economic, environmental, and social benefits of parks and open space8:
Physical activity makes people healthier.
Physical activity increases with access to parks.
Contact with the natural world improves physical and physiological health.
Residential and commercial property values increase.
Value is added to community and economic development sustainability.
Benefits of tourism are enhanced.
Trees are effective in improving air quality and act as natural air conditioners.
Trees assist with storm water control and erosion.
Crime and juvenile delinquency are reduced.
Recreational opportunities for all ages are provided.
Stable neighborhoods and strong communities are created. Researchers have long touted the benefits of outdoor exercise. The United States is now catching up on this trend, as parks and recreation departments have begun installing “outdoor gyms.” Equipment that can be found in these outdoor gyms is comparable to what would be found in an indoor workout facility, such as leg and chest presses, elliptical trainers, pull down trainers, etc. With no additional equipment such as weights and resistance bands, the equipment is fairly easy to install. Outdoor fitness equipment provides a new opportunity for parks and recreation departments to increase the health of their communities, while offering them the opportunity to exercise outdoors. Such equipment can increase the usage of parks, trails, and other outdoor amenities while helping to fight the obesity epidemic and increase the community’s interaction with nature.
5 F.E. Kuo, “Environment and Crime in the Inner City: Does Vegetation Reduce Crime?” Environment and Behavior, Volume 33, pp 343‐367. 6 Nowak, David J., “Benefits of Community Trees”, (Brooklyn Trees, USDA Forest Service General Technical Report, in review). 7 “Outdoor Recreation Participation Report 2010”, Outdoor Foundation, 2010. 8 Paul M. Sherer, “The Benefits of Parks: Why America Needs More City Parks and Open Space,” The Trust for Public Land, San Francisco, CA, 2006.

22 The Town of Wake Forest, North Carolina
Facilities According to Recreation Management magazine’s “2014 State of the Industry Report,”9 national trends show an increased user‐base of recreation facilities (private and public). Additionally, parks and recreation providers responding to the survey indicated an average age of 23.8 years for their community recreation facilities. To meet that growing need, a majority of the parks and recreation survey respondents (69%) reported that they have plans to build new facilities or make additions or renovations to their existing facilities over the next three years. Nearly one‐third (33%) of parks respondents said that they have plans to build new facilities, and 29 percent said that they plan to add to their existing facilities. More than half (52%) are planning renovations to existing facilities. The current national trend is toward “one‐stop” indoor recreation facilities to serve all ages. Large, multi‐purpose regional centers help increase cost recovery, promote retention, and encourage cross‐use. Agencies across the U.S. are increasing revenue production and cost recovery. Multi‐use facilities versus specialized space is a trend, offering programming opportunities as well as free‐play opportunities. “One stop” facilities attract young families, teens, and adults of all ages.
Festivals and Events In the context of urban development, from the early 1980s, there has been a process that can be characterized as “festivalization,” which has been linked to the economic restructuring of towns and cities, and the drive to develop communities as large‐scale platforms for the creation and consumption of “cultural experience.”
There are also a growing number of smaller more local community‐based festivals and events, most often supported by local councils that have been spawned partly as a reaction to larger festivals that have become prime economic‐drivers. These community‐based festivals will often re‐claim cultural ground based on their social, educational, and participative value.
Fitness Programming There have been many changes in fitness programs in the last 15 years. What clients wanted in 2000 is not necessarily what they want today. Body weight training appeared as a developing trend in 2014 and is projected to stay strong in 2015, as is high‐intensity interval training. Yoga is regaining popularity after falling out of the top 20 in 2009 and staying out of the top 10 until 2014. Fitness programs for older adults will remain strong in 2014 and 2015.
9 Emily Tipping, “2014 State of the Industry Report, State of the Managed Recreation Industry”, Recreation Management, June 2014.

Parks, Recreation, and Cultural Resources Master Plan 23
Funding According to Recreation Management magazine’s “2014 State of the Industry Report,” survey respondents from parks and recreation departments/districts reporting about their revenues from 2011 through 2013 reveals the beginning of a recovery from the impact of the recession of 2008. From 2011 to 2012, 83 percent of respondents reported that their revenues had either stabilized or had increased. This number grew to 85 percent of respondents when reporting on the 2012 to 2013 time frame, and by 2015, 95 percent of parks and recreation department respondents are expecting revenues to either increase (49%) or remain stable (45%).
General Programming One of the most common concerns in the recreation industry is creating innovative programming to draw participants into facilities and services. Once in, participants recognize that the benefits are endless. According to Recreation Management magazine’s “2014 State of the Industry Report,”10 the most common programs offered by survey respondents include holiday events and other special events (78%), youth sports teams (69%), day camps and summer camps (65%), adult sports teams (61%), arts and crafts (61%), educational programs (61%), sports tournaments and races (57%), programs for active older adults (55%), fitness programs (61%), and festivals and concerts (53%).
General Sports and Recreation Trends The National Sporting Goods Association (NSGA) survey on sports participation in 201211 found that the top five athletic activities ranked by total participation included: exercise walking, exercising with equipment, swimming, camping, and aerobic exercising. Additionally, the following active, organized, or skill development activities remain popular: hiking, running/jogging, bicycle riding, basketball, golf, and soccer.
Marketing by Parks and Recreation Providers Niche marketing trends have experienced change more frequently than ever before, as technology affects the way the public receives information. Web 2.0 tools and now Web 3.0 tools are a trend for agencies to use as a means of marketing programs and services. Popular social media marketing tools include:
You Tube
LinkedIn Mobile marketing is a trend of the future. Young adults engage in mobile data applications at much higher rates than adults in age brackets 30 and older. Usage rates of mobile applications demonstrate that chronologically across four major age cohorts, Millennials tend to get information more frequently using mobile devices such as smart phones. For example, 95 percent of 18‐to‐29‐year‐old cell phone owners send and receive text messages, compared to 82 percent of 30‐to‐49‐year‐olds, 57 percent of 50‐to‐64‐year‐olds, and 19 percent of 65 and older.
10 Emily Tipping, “2014 State of the Industry Report, Trends in Parks and Recreation”, Recreation Management, June 2013. 11 2012 Sport/Recreation Activity Participation”, National Sporting Goods Association, 2013, http://www.nsga.org.

24 The Town of Wake Forest, North Carolina
It is also a fact that minority Americans lead the way when it comes to mobile internet access. Nearly two‐thirds of African‐Americans (64%) and Latinos (63%) are wireless internet users, and minority Americans are significantly more likely to own a cell phone than are their white counterparts (87 percent of Blacks and Hispanics own a cell phone, compared with 80 percent of whites).12 By 2015, mobile internet penetration is forecast to grow to 71 percent for Hispanics compared to 59 percent for whites.13
Multiculturalism Our country is becoming increasingly racially and ethnically diverse. In May 2012, the U.S. Census Bureau announced that non‐white babies now account for the majority of births in the United States. “This is an important tipping point,” said William H. Frey,14 the senior demographer at the Brookings Institution, describing the shift as, “a transformation from a mostly white Baby Boomer culture to the more globalized multi‐ethnic country that we are becoming.” Cultural and ethnic diversity adds a unique flavor to communities expressed through distinct neighborhoods, multicultural learning environments, restaurants, places of worship, museums, and nightlife. 15 In the United States, the Hispanic population increased by 43 percent over the last decade, compared to five percent for the non‐Hispanic portion, and accounted for more than half of all the population growth. According to Emilyn Sheffield, Professor of Recreation and Parks Management at the California State University at Chico, the growing racial and ethnic diversity is particularly important to recreation and leisure service providers, as family and individual recreation patterns and preferences are strongly shaped by cultural influences.16 Multiculturalism and Marketing Today the marketplace for consumers has dramatically evolved in the United States from a largely Anglo demographic to a large minority consumer base known as the “new majority.” The San Jose Group, a consortium of marketing communications companies specializing in reaching Hispanic and non‐Hispanic markets of the United States, suggests that today’s multicultural population of the United States, or the “new majority,” is 107.6 million, which translates to about 35.1 percent of the country’s total population. The United States’ multicultural population alone could essentially be the 12th largest country in the world.17 Parks and recreation trends in marketing leisure services continue to emerge and should be taken into consideration in all planning efforts, as different cultures respond differently to marketing techniques.
12Aaron Smith, “Mobile Access 2010”, Pew Internet and American Life Project, Pew Research Center, July 7, 2010, http://www.pewinternet.org/Reports/2010/Mobile‐Access‐2010/Summary‐of‐Findings.aspx, accessed on November 15, 2012. 13 Erik Sass, “Minority Groups Heaviest Users of Mobile Net”, Media Daily News, Nov. 18, 2011, http://www.mediapost.com/publications/article/162699/minority‐groups‐heaviest‐users‐of‐mobile‐net.html#axzz2CK9zYGFw, accessed on November 15, 2012. 14 Adam Serwer, “The End of White America,” Mother Jones, http://www.motherjones.com/kevin‐drum/2012/05/end‐white‐america, accessed on May 17, 2012. 15 Baldwin Ellis, “The Effects of Culture & Diversity on America”, http://www.ehow.com/facts_5512569_effects‐culture‐diversity‐america.html, accessed on Sept. 20, 2012. 16 Emilyn Sheffield, “Five Trends Shaping Tomorrow Today,” Parks and Recreation, July 2012 p. 16‐17. 17 “SJG Multicultural Facts & Trends”, San Jose Group, http://blog.thesanjosegroup.com/?p=275, posted October 25, 2010.
While Wake Forest has a significant Caucasian population (75 percent in 2014), the Wake Forest demographic profile indicates that more than 16 percent of the population is African American, and seven percent is Hispanic (any race).

Parks, Recreation, and Cultural Resources Master Plan 25
Natural Environments and Open Space Outdoor Recreation The Outdoor Foundation releases an annual “Participation in Outdoor Recreation” report. According to the 2013 report,18 while there continues to be fallout from the recent economic downturn, the number of outdoor recreation outings reached an all‐time high in 2012. The foundation reports that the top outdoor activities in 2012 were running, fishing, bicycling, camping, and hiking. Bird watching is also among the favorite outdoor activities by frequency of participation. The Outdoor Foundation’s research brought the following key findings. Participation in Outdoor Recreation
Return to Nature: Nearly 50 percent of Americans ages six and older participated in outdoor recreation in 2012. That equates to a total of 141.9 million Americans and a net gain of one million outdoor participants.
Top Five Biggest Participation Percentage Increase in Outdoor Activities in the Past three years (2014 Topline Report): Adventure racing, triathlon (off road), stand up paddle boarding, kayak fishing, and recreational kayaking.
Parks and Recreation’s Fit in Public Health Increasingly, governmental agencies and professionals in the public health realm are realizing that Parks, Recreation, and Cultural Resources agencies can be key public health providers, as in most communities, these agencies own and manage the majority of the public built and natural environment, and provide most of the recreation programs and facilities. There are several types of assessment tools that are available for a future detailed assessment of public health in the community. Obesity and Public Health According to the Centers for Disease Control (CDC), obesity continues to be a serious issue in America, growing at an epidemic rate—almost tripling since 1990. Overall, more than one‐third (35.7%) of adults and 17 percent of children in the United States are obese.19 These statistics illustrate the importance of intercepting the epidemic in youth. In an effort to educate Americans and encourage them to take steps toward a healthier future, the United Health Foundation annually presents America’s Health Rankings®: A Call to Action for Individuals & Their Communities. America’s Health Rankings has tracked the health of the nation for the past 22 years, providing a unique, comprehensive perspective on how the nation (and each state) measures up. The 2011 edition of the Rankings suggests that our nation is extremely adept at treating illness and disease. However, Americans are struggling to change unhealthy behaviors such as smoking and obesity, which cause many of these diseases.
18 “Outdoor Recreation Participation Report 2013”, Outdoor Foundation, 2013. 19 “Obesity and Overweight ‐ Facts”, Center for Disease Control and Prevention, http://www.cdc.gov/obesity/data/facts.html, accessed on October 3, 2012.

26 The Town of Wake Forest, North Carolina
Obesity continues to be one of the fastest growing health issues in our nation, and America is spending billions in direct health care costs associated with poor diet and physical inactivity. As obesity in the United States continues to be a topic of interest for legislators and our government, research suggests that activity levels remain stagnant among all age groups. The following are statistics that support this concern.
Only 25 percent of adults and 27 percent of youth (grades 9‐12) engage in recommended levels of physical activity.
Fifty‐nine percent (59%) of American adults are sedentary.
Children born now have a lower life expectancy than their parents.
Children nationally spend 4.5 – 8 hours daily (30‐56 hours per week) in front of a screen (television and/or computer).
Community‐Wide Health Assessment Tools for Parks and Recreation There are several types of health assessment tools available for community health assessment, specifically as it relates to management of parks and recreation. One is the use of the Healthy Communities Surveillance and Management Toolkit™ (www.gpred.org/hcrg).

Parks, Recreation, and Cultural Resources Master Plan 27
Another assessment process which is similar and can be incorporated into Multi‐Modal Transportation Planning is a Parks, Recreation, and Cultural Resources aligned analysis called Safe Routes to Play (www.saferoutestoplay.org). Additional methodologies that can be applied to specific sites or geographic areas are often called a “Health Impact Assessment” or a “Healthy Site Assessment.” These processes are not yet nationally standardized, but there are many communities and groups working toward that end.
Role and Response of Local Government
Collectively, these trends have created profound implications for the way in which local governments conduct business. Some local governments are now accepting the role of providing preventative health care through parks and recreation services. The following concepts are from the International County/County Management Association.20
Parks and Recreation departments should take the lead in developing communities conducive to active living.
There is growing support for recreation programs that encourage active living within their community.
One of the highest priorities is a cohesive system of parks and trails and accessible neighborhood parks.
Trail Recreation and Cycling Trends For trail‐related recreation activities, the 2013 “Outdoor Recreation Topline Report” indicates a positive three‐year trend for trail running, running/jogging, hiking, and mountain biking, but a slightly negative trend for road/surface bicycling. Bicycle friendly cities have been emerging over the last ten years. Cycling has become a popular mode of transportation as people consider the rising cost of fuel, desire for better health, and concern for the environment. Some people also use cycling as a mode of transportation just for the fun of it.
Therapeutic Recreation Nationally, therapeutic recreation as a service is experiencing many struggles and challenges. The changing face of health care is having a dramatic effect on therapeutic recreation (TR) services in many rehabilitation settings and specifically in physical rehabilitation settings, thus affecting community recreation programs.
20 www.ICMA.org, accessed in 2012.

28 The Town of Wake Forest, North Carolina
The fundamental goal of TR services is to enable participants to return successfully to their communities. This not only means that they need to have the functional skill but also that they have physical and social environments in the community that are receptive to the individual.
Youth Sports
The 2013 SFIA sports participation report indicates that in 2012 youth (ages 6‐12) participation was highest for outdoor (63%), team (53%), and individual sports (50%). Children in this age group have increased interest in camping, while young adults ages 18‐24 are becoming more interested in running/jogging. Youth Participation in Outdoor Recreation
Participation fairly steady from 2011: However, participation rates dropped among teens ages 13 to 17 (particularly teenage girls) and rose among adults ages 25 to 44.
The influence of family: Most youth are introduced to outdoor activities by parents, friends, family, and relatives.
Physical education in schools: The importance cannot be understated. Among adults ages 18 and older who are current outdoor participants, 75 percent say that they had P.E. in school between the ages of 6 and 12.
D. Community and Stakeholder Input Summary
Public Process for the Wake Forest Parks, Recreation, and Cultural Resources Master Plan was held September 2‐3, 2014 and consisted of 105 participants in six focus groups and a public forum. This section summarizes the key issues and input that was mentioned in several of the meetings. A full summary of all of the input can be found in Appendix B. The community input summary is categorized below with brief details of the input from the many focus group meetings. As the Key Issues Matrix demonstrates, these are the key issues that were common throughout the community input process, regardless of the method of communication.
Identified Key Issues from Stakeholder Input Key issues were identified using a number of tools – review of existing plans and documents, focus groups, stakeholder meetings, a community survey, inventory and level of service analysis, and MindMixer online community engagement. The information gathered from these sources was evaluated, and the following key issues were developed. Organizational Issues The marketing and communication of Parks, Recreation, and Cultural Resources activities and facilities was consistently brought up as a weakness that needs to be addressed, with many citing that they do not know what programs are being offered, when, and at what location. In addition, several citied that they did not know some parks existed or their locations. Many of the residents thought it was very difficult to find local Parks, Recreation, and Cultural Resources amenities based on the need for better signage (both Wayfinding and within parks). There was also a consensus for a need for directional and locational signage on the greenways.

Parks, Recreation, and Cultural Resources Master Plan 29
The need for additional staffing to both maintain current standards and to operate facilities to optimal capacities, was brought up as a way to address the identified weaknesses of inadequate hours of operations for facilities and maintenance of trails. Programs and Service Delivery When asked about what Parks, Recreation, and Cultural Resources programming needed to be expanded, the overwhelming response was to provide additional programs for families, seniors, and teenagers. Additional programs mentioned as needing to expand included wellness/fitness, cultural, special needs, and aquatics. The public would like to see an increase in the number of special events and festivals. Facilities and Amenities When the focus group attendees were asked what facilities and amenities need to be improved or potential new facilities that could be built, the overwhelming response was to make sure that Parks, Recreation, and Cultural Resources maintains and improves existing facilities to the greatest extent possible prior to building new facilities. Existing facilities mentioned most often included signage on the greenways, expanding the Senior Center, expanding hours at the facilities, and developing trailheads for the greenways. The number one amenity that the public would like to see improved (and new additions built) is the completion of the greenways to provide as much connectivity as possible to other amenities within the Town. The vast majority of input supported the construction of a multi‐purpose facility that incorporated an aquatic center, additional gymnasiums, fitness/wellness spaces, indoor walking track, and flexible spaces for teen and senior programming. There was consensus to increase ADA accessibility at all Parks, Recreation, and Cultural Resources facilities, especially since there is a federal mandate to do so. Other additional facilities that the public would like to see in Wake Forest included a dedicated Pickleball facility, exercise trails on the 80 acres, and an outdoor amphitheater/special event venue. The public would like to see the Department stock pile land for future parks. Level of Service In general, Wake Forest has a distribution of facilities that offers good general access to parks and recreation facilities. Areas of higher concentration are notable, particularly in the area that lies north of Dr. Calvin Jones Highway and east of Capital Boulevard. However, even most of the areas outside of that sector are still within the catchment area of at least some components provided by the Town. In fact, 86 percent of the land area within the study area boundary falls within the catchment area of at least one component from the inventory.
30 The Town of Wake Forest, North Carolina
Finance There seems to be a consensus to implement and utilize equitable user fees for Parks, Recreation, and Cultural Resources activities based on a value received by the participant for the services with a personal benefit. There was a local focus on revitalizing the downtown area of Wake Forest with the opening of the Wake Forest Renaissance Centre and by bringing more community‐wide special events and festivals to downtown Wake Forest. Most focus group attendees agreed that it would be wise to pursue any and all grant opportunities at the federal, state, regional, and local levels. In November of 2014, the citizens of Wake Forest passed a Bond Referendum to enhance current facilities, provide greenways improvements, and improve pedestrian travel throughout Wake Forest.
Community Survey Summary Survey Methodology The purpose of this study was to gather public feedback on Town of Wake Forest Parks, Recreation, and Cultural Resources facilities. This survey research effort and subsequent analysis was designed to assist the Town of Wake Forest in the creation of an updated Parks, Recreation, and Cultural Resources Master Plan for existing and possible future enhancements, facilities, and services. The survey was conducted using three primary methods: 1) a mail‐back survey, 2) an online, invitation‐only web survey to further encourage response from those residents already within the defined random sample, and 3) an open‐link online survey for members of the public who were not part of the random sample. The analysis herein focuses on the combined results of these methods. A close analysis revealed that demographics and response patterns among random sample and open link respondents were similar enough to permit the merging of these sources. Aggregating these data sources also contributes to a larger sample size, allowing for more meaningful segmentation of the data by variables of interest. The primary list source used for the mailing was a third party list purchased from Melissa Data Corp., a leading provider of data with emphasis on U.S., Canadian, and international address and phone verification and postal software. Use of the Melissa Data list also includes renters in the sample who are frequently missed in other list sources such as utility billing lists.
This community survey section is a summary of the survey results. Many survey result charts and statements are utilized throughout this document. The complete survey results including the open ended comments were provided as a separate staff resource document due to the large number of pages.

Parks, Recreation, and Cultural Resources Master Plan 31
A total of 3,500 surveys were mailed to a random sample of Wake Forest residents in October 2014. The final sample size for this statistically valid survey was 270, resulting in a margin of error of approximately +/‐ 6.0 percentage points calculated for questions at 50 percent response.21 The open link survey received an additional 71 responses. The underlying data were weighted by age to ensure appropriate representation of Wake Forest residents across different demographic cohorts in the sample. Due to variable response rates by some segments of the population, the underlying results, while weighted to best match the overall demographics of residents, may not be completely representative of some sub‐groups of the population, including those in the Latino community. Survey Respondent Profile This section of the report summarizes the respondent and household demographics of both the invitation and open link samples. By understanding how the characteristics of these two groups differ, it is easier to understand contrasting response patterns for various questions on the survey.
Gender. Most invitation sample respondents are female (65%), while just over a third of respondents are male (35%). Open link respondents also skewed female (62%).
Age. Just over a quarter of invitation respondents are under the age of 35 (26%), compared to just four percent of open link respondents. There was also notable representation among those in the 35 to 44 (24%) and 45 to 54 (22%) age cohorts within the invitation sample. These were also the most represented age cohorts within the open link sample, at 33 percent each, respectively.
Household Profile. The invitation and open link samples had similar proportions of the various household profile segments. Households with children at home comprised the largest share of invitation sample (61%) and open link (58%) respondents. Empty‐nesters were the next most represented, comprising 22 percent of the invitation sample and 24 percent of the open link sample. Couples without children (11 percent of invitation respondents and 13 percent of open link respondents) followed. Meanwhile, singles without children comprised a small share of the overall sample, both among invitation (5%) and open link (4%) respondents.
Ethnicity/Race. Two percent of invitation respondents and four percent of open link respondents consider themselves to be of Hispanic, Latino, or Spanish origin. A majority of respondents consider themselves to be white (89 percent of invitation respondents and 91 percent of open link respondents). The next most common race identified was Black or African American (7 percent of invitation respondents and 4 percent of open link respondents).
21 For the total invitation sample size of 270, margin of error is +/‐ 6.0 percent calculated for questions at 50% response (if the response for a particular question is “50%”—the standard way to generalize margin of error is to state the larger margin, which occurs for responses at 50%). Note that the margin of error is different for every single question response on the survey depending on the resultant sample sizes, proportion of responses, and number of answer categories for each question. Comparison of differences in the data between various segments, therefore, should take into consideration these factors. As a general comment, it is sometimes more appropriate to focus attention on the general trends and patterns in the data rather than on the individual percentages.

32 The Town of Wake Forest, North Carolina
Household Income. Half of all invitation sample households earn an annual income of less than $100,000, compared to 57 percent of open link households. An additional 26 percent of respondents from each sample earn between $100,000 and $150,000, while 24 percent of invitation households and 17 percent of open link households earn $150,000 or more per year. Overall, the income profile is highly similar between the two samples, with invitation households skewing just slightly more affluent.
Years in the Wake Forest Area. Invitation sample respondents have lived in the area for 9.2 years on average. Open link respondents have lived in the area for slightly more time, on average (11.4). Overall, resident results show that roughly 1 in 10 people from each sample are newer residents of Wake Forest, having lived in the area for less than a year.
Own or Rent. A majority of respondents own their residence, both in the invitation sample (90%) and open link sample (87%).
Voter Registration. The percentage of respondents who are registered to vote in Wake Forest is highly similar to the share of those who own their residence. Ninety percent (90%) of invitation respondents and 89 percent of open link respondents are registered to vote in Wake Forest.
Current Parks, Recreation, and Cultural Resources Programs and Facilities Importance of Recreational Amenities/Activities and Degree to Which Needs are Being Met Respondents were asked to indicate the top five community issues that Parks, Recreation, and Cultural Resources should focus on improving. Maintenance of parks, greenways, and facilities is the top priority among invitation respondents, with 69 percent of respondents including this category as one of their top five priorities. However, several other categories were also reported as top priorities, including connectivity of greenways and bikeways (57 percent of respondents including this category as one of their top five), youth athletics (44%), beautification of public areas (42%), promoting healthy active lifestyles (36%), and affordable programs (33%). With regard to the number one priority, connectivity had the highest share of respondents noting this was a top priority (25%), followed by youth athletics (18%) and maintenance of parks, greenways, and facilities (13%). Figure 6 explores the top five overall priorities between the invitation and open link samples. Among respondents of both samples, maintenance of parks, greenways, and facilities was identified as most important, with 69 percent of invitation respondents, and 63 percent of open link respondents noting this as one of their top five priorities. Connectivity was a close second among open link respondents (62%). Invitation respondents were more likely to prioritize youth athletics, beautification of public areas, aquatic facility/programming, enrichment programs for youth, communication with the public, and programming for citizens with special needs. Meanwhile, open link respondents were more likely to prioritize cultural resource programs, activities, and events by a large margin, as well as adult athletics. For all other areas, responses were highly similar between the two groups.

Parks, Recreation, and Cultural Resources Master Plan 33
Figure 6: Community Issues to Focus on Improving –Top Five Priorities Combined Invitation Sample vs. Open Link

34 The Town of Wake Forest, North Carolina
Satisfaction with Amenities and Services Respondents reported their satisfaction levels with 29 different Wake Forest parks and facilities on a scale of 1 to 5, with 1 meaning “not at all satisfied” and 5 meaning “extremely satisfied.” Respondents also had the opportunity to note if they were unaware of or do not use the park or facility. Respondents who are aware of or use the park or facility were asked to indicate their level of satisfaction. The following had the most frequently reported “4” or “5” ratings:
E. Carroll Joyner Park (72 percent of invitation respondents providing a rating of “4” or “5”)
J.B. Flaherty Park (38%)
Holding Park (34%)
Athletic fields (31%)
Flaherty Park Community Center (28%) Overall, satisfaction ratings were strong, with higher shares of satisfied respondents than dissatisfied respondents for each park or facility. Heritage High Park had the highest share of dissatisfied respondents (9%) relative to the shares recorded for other parks and facilities, but dissatisfaction was still quite low overall. A follow‐up question asked respondents to provide comments or suggestions for how the parks and facilities could be improved to better meet the needs of their household and/or the community. Both invitation and open link respondents provided a wide range of insightful comments, the full set of which are included in the final survey report. However, a few common themes did appear in the comments.
Comments/Suggestions Regarding Parks and Facilities A follow‐up question asked respondents to provide comments or suggestions for how the parks and facilities could be improved to better meet the needs of their household and/or the community. Both invitation and open link respondents provided a full range of insightful comments, the full set of which should be viewed to fully understand community member desires and needs. However, a few common themes did appear in the comments:
Expand greenways and enhance opportunities for connectivity. In particular, pay attention to Dunn Creek Greenway, Heritage Greenway, Smith Creek Burlington Mills Greenway, the Wake Forest Reservoir, access to downtown and to adjacent communities, and issues of flooding.
Better upkeep of current restroom facilities and addition of new ones.
Add and maintain playground facilities, particularly at E. Carroll Joyner Park.
However, many are in favor of keeping E. Carroll Joyner Park just as it is.
Improve communications to foster awareness of facilities and services.
Maintain current parks and facilities around the community.
Other comments touched upon improved accessibility, desire for adult programming, aquatics opportunities and Holding Park Pool in particular, athletic courts, dog parks, expanded hours, additional parking, safety, soft‐surface trails, special events, teen programs, and level of unawareness with current Town offerings.

Parks, Recreation, and Cultural Resources Master Plan 35
Importance of Facilities and Services Respondents rated the importance of 14 different facilities and services operated by the Wake Forest Parks, Recreation, and Cultural Resources Department to their household. These categories are general areas of Department operations, intended to provide high‐level insight into areas of greatest importance. Respondents used a 5‐point scale, with 1 meaning “not at all important” and 5 meaning “very important.” Figure 7 to follow shows the percentage of “4” and “5” ratings (indicating that the respondent feels the facility or service is important) versus the share of “1” and “2” ratings (suggesting the respondent does not feel that it is important) among invitation respondents. The following had the most frequently reported “4” or “5” ratings and highest averages:
Parks (with an average rating of 4.5, 93 percent of respondents provided a rating of “4” or “5”)
Greenways/Trails (4.4 average; 83% rated 4 or 5)
Special community events (4.0 average; 73% rated 4 or 5)
Access to water for recreation (4.0 average; 74% rated 4 or 5)
Programs for youth (3.9 average; 74% rated 4 or 5) Second tier of facilities and services include:
Community Center (3.7 average; 61% rated 4 or 5)
Cultural/historical resources (3.7 average; 63% rated 4 or 5)
Programs for adults (3.6 average; 74% rated 4 or 5)
Aquatic facilities (3.6 average; 60% rated 4 or 5)
Arts programs (3.4 average; 47% rated 4 or 5)
Programs for 55 and older (3.3 average; 51% rated 4 or 5)
Adult athletics (3.3 average; 45% rated 4 or 5)
Programs for special needs populations (3.1 average; 40% rated 4 or 5)

36 The Town of Wake Forest, North Carolina
Figure 7: Importance of Facilities and Services – Average Rating Invitation Sample vs. Open Link

Parks, Recreation, and Cultural Resources Master Plan 37
Top 3 Priorities for Amenities/Activities to be Added, Expanded, or Improved Respondents were asked to indicate their top three priorities for additions or improvements of indoor and outdoor facilities within Wake Forest using the list of 19 facilities. Connecting the greenways is by far the top priority, with 56 percent of invitation respondents including this category as one of their top three priorities. This also earned the highest share of respondents noting that it was their number one priority (37%). Roughly 1 in 4 respondents prioritized an outdoor amphitheater/special events venue (25%), playgrounds (24%), and an indoor aquatics facility (24%). On the other end of the spectrum, several facilities fell low on the list of priorities, with fewer than 1 in 10 respondents indicating them as one of their first, second, or third priorities. These included: parking at recreational facilities (3%), skateboard parks (3%), special needs population (5%), spray grounds (8%), disc golf (8%), and non‐school indoor gymnasium space (8%). Among both samples, connecting the greenways was the most prioritized area for future improvement. Additionally, outdoor amphitheater/special events venue, playgrounds, and indoor aquatics facilities topped the list among both samples as well. However, open link respondents were more likely to prioritize non‐school indoor gymnasium space (22%), expanded parking at existing parks and greenways (20%), spray grounds (18%), and disc golf (16%).
Programs, Activities, and Special Events Degree to Which Programs, Activities, and Special Events are Meeting Household Needs Using a 5‐point scale with 1 meaning “not at all” and 5 meaning “completely,” respondents indicated to what degree their needs were being met by the 14 categories of facilities and services offered in Wake Forest. The following had at least half of all respondents providing a rating of “4” or “5” (“needs met”):
Parks (82 percent of respondents providing a rating of “4” or “5”)
Special community events (71%)
Greenways/trails (70%)
Youth athletics (69%)
Programs for youth (68%)
Cultural/historical resources (62%)
Community Center (60%)
Adult athletics (53%)
Programs for adults (53%) Five facilities and services had fewer than half of all invitation respondents providing a rating of “4” or “5”: arts programs (49%), aquatic facilities (49%), access to water for recreation (47%), programs for 55 and older (46%), and programs for special needs populations (35%). Overall, results suggest that respondents have a high level of needs being met by current facilities and services in Wake Forest. In‐Need vs. Needs‐Met Matrix –Programs, Activities, and Special Events It is informative to plot and compare the facilities and services scores for level of importance and degree to which needs are being met by these facilities and services using an “Importance vs. Needs‐Met” matrix. In Figure 8, scores are displayed in this matrix using the mid‐points for both questions to divide into four quadrants. The Importance scale midpoint was 3.7 (the median rating for importance across all programs); the Needs‐Met midpoint was 3.5.

38 The Town of Wake Forest, North Carolina
The upper left quadrant shows the programs that had a high average rating of importance as well as higher level of needs being met. These programs are less of a priority for improvement, because needs are being met, but are important to maintain moving forward as they are perceived as important to resident households:
Greenways/trails
Parks
Programs for youth
Special community events
Youth athletics Programs located in the upper right quadrant are programs with relatively high importance but lower level of needs being met, which suggests that these programs could be improved. Improving these programs would have a strong impact on the degree to which needs are being met overall. There was only one item that fell into this category:
Access to water for recreation The lower left quadrant shows programs that are not important to many households, yet are meeting their needs very well. It would be beneficial to evaluate whether the resources supporting these programs outweigh the benefits. Reallocating these resources to the programs in the upper right quadrant could be a more efficient use of resources.
Arts programs
Community Center
Cultural/historical resources
Programs for adults Programs found in the lower right quadrant, further below the in‐need midpoint, are programs not meeting needs well; however, they are important to fewer members of the community. These “niche” programs may have a small but passionate following; therefore, there is merit to measuring participation and planning for potential future enhancements accordingly.
Adult athletics (this was on the cusp between meeting needs and not meeting needs, and therefore should be considered accordingly)
Aquatic facilities
Programs for 55 and older
Programs for special needs populations

Parks, Recreation, and Cultural Resources Master Plan 39
Figure 8: Current Facilities and Services – Importance vs. Needs Met Matrix Invitation Sample Only
ParksGreenways/Trails
Youth athletics
Arts programs
Programs for special needs populations
Programs for youth
Programs for adults
Adult athletics
Programs for 55 & older
Special community events
Cultural/Historical Resources
Community Center
Aquatic facilities
Access to water for recreation
2.5
3.0
3.5
4.0
4.5
5.0
2.53.03.54.04.5
Importan
ce to househ
hold (average
rating)
How well needs are currently being met (average rating)
High Importance/High Needs Met
High Importance/Low Needs Met
Low Importance/High Needs Met
Low Importance/Low Needs Met

40 The Town of Wake Forest, North Carolina
Importance of Aspects of Open Space Respondents noted how important six different aspects of open space were to them and their household using a 5‐point scale, with 1 meaning “not at all important” and 5 meaning “very important.” The ratings among invitation respondents, all aspects explored earned high importance ratings, with very few respondents providing a rating of “1” or “2” (not important). Protect historic character of Wake Forest (85 percent of respondents providing a rating of “4” or “5”), preserve wildlife habitat (80%), improve or provide access to natural areas (79%), and preserve existing open space (77%) were reported as most important among invitation respondents.
Future Facilities, Amenities, and Services Facilities/Amenities to be Added, Expanded, or Improved over Next 5 to 10 Years Using a 5‐point scale, with 1 meaning “not at all important” and 5 meaning “very important,” respondents rated the importance of adding or improving a list of 19 different indoor and outdoor facilities within Wake Forest over the next 5 to 10 years. The following had at least half of all invitation respondents providing a rating of “4” or “5” (“important”):
Connect the greenways (77 percent of respondents providing a rating of “4” or “5”)
Playgrounds (62%)
Picnic areas/pavilions (61%)
Expanded parking at existing parks and greenways (54%)
Outdoor amphitheater/special events venue (54%)
Weight/cardio/fitness space (53%)
Indoor aquatics facility (52%) Two facilities had higher shares of respondents noting that the facility was more unimportant (providing a rating of “1” or “2”) than important (“4” or “5”). These include a skateboard park (45 percent not important vs. 18 percent important) and disc golf (40 percent not important vs. 25 percent important). Meanwhile, spray grounds and dog parks had shares of “not important” ratings that came close to the shares of “important” ratings. Overall, open link respondents provided higher average importance ratings across‐the‐board, with the exception of connecting greenways which earned the highest average rating (4.2 each) among both samples. Open link respondents were particularly likely to note that parking at recreational facilities (3.9) and expanding the Senior Center (3.8) were very important as compared to invitation sample respondents.
Financial Choices Opinions Regarding Program and Facility Fees and Potential Impact of Fees Increases Program Fees. Most invitation respondents feel that program fees currently charged directly to them by Wake Forest are acceptable (40%). Three percent of invitation respondents reported that they were underpriced, and eight percent indicated that they were too high. If respondents who did not know/were unsure (49%) are removed, results show that six percent feel that program fees are underpriced, 77 percent feel they are acceptable, and 17 percent report they are too high.

Parks, Recreation, and Cultural Resources Master Plan 41
Facility Fees. Respondents were also prompted to assess the fees charged for facilities. Overall, invitation respondents noted that facility fees were acceptable (37 percent including don’t know/not applicable and 78 percent excluding those respondents). Two percent of respondents noted that the fees were underpriced (four percent when don’t know responses are removed), and eight percent noted that they were too high (18 percent when don’t know responses are removed). Fifty‐three percent (53%) of respondents noted that they did not know or were unsure. Potential Impact of Fee Increases. Respondents were asked what impact, if any, fee increases would have on their current level of participation in programs, services, or use of facilities. Among invitation respondents, results are split across‐the‐board: 27 percent of respondents said it would not limit their participation, 23 percent said it would limit their participation somewhat, and 17 percent noted that it would limit their participation significantly. Meanwhile, 33 percent of respondents were uncertain. Overall, a high share of don’t know/uncertain responses suggests that there are opportunities for further educating community members about current program and facility fees.
Communication A section of the survey had respondents indicate the methods by which they usually receive information on Wake Forest Parks, Recreation, and Cultural Resources facilities, services, and programs. Invitation respondents indicated that local newspapers such as the Wake Forest Weekly, Wake Forest Today, Wake Forest News, and North Raleigh News (65%) were their primary sources of receiving information on related facilities, services, and programs. Internet/website (44%) and word of mouth (34%) were also relatively common among invitation respondents. Meanwhile, open link respondents were much more likely to receive information through an email from the Town (64%) and RecConnect (45%). Considering that open link respondents skew much more currently active in Parks, Recreation, and Cultural Resources classes and programs, it makes sense that they would be heavier users of these particular information sources. Not surprisingly, younger age cohorts are more likely to rely on Internet/websites and social networking sites than do older age cohorts. Older age cohorts, meanwhile, are more reliant on local newspapers and direct communication from the Town.
E. Operational and Marketing Analysis
Athletics The Department offers adult softball, basketball, flag football, and Pickleball; youth baseball, softball, basketball, and track and field, as well as sports camps for soccer, baseball, and softball. The Department’s goal is to recover 100 percent of the cost of providing the programs through fees and charges for adult athletics and 60 percent for youth. Outside partnerships with youth sports associations provide programming to the community. The partners operate the programs and Parks, Recreation, and Cultural Resources provides the fields.
Economic Impact of Festivals and Cultural Events In the context of urban development, from the early 1980s, there has been a process that can be characterized as “festivalization,” which has been linked to the economic restructuring of towns and cities, and the drive to develop communities as large‐scale platforms for the creation and consumption of “cultural experience.”

42 The Town of Wake Forest, North Carolina
The success rate for festivals should not be evaluated simplistically solely on the basis of profit (sales), prestige (media profile), or size (numbers of events). Research by the European Festival Research Project (EFRP)22 indicates that there is evidence of local and city government supporting and even instigating and managing particular festivals themselves to achieve local or regional economic objectives, often defined very narrowly (sales, jobs, tourists, etc.). There are also a growing number of smaller more local community‐based festivals and events, most often supported by local councils that have been spawned partly as a reaction to larger festivals that have become prime economic‐drivers. These community‐based festivals often will re‐claim cultural ground based on their social, educational, and participative value. For more information on the values of festivals and events, see the CRC Sustainable Tourism research guide23 on this topic. It is important to recognize the financial impact that drives economy. When the cost of travel is more expensive, it will be more difficult to draw people from further distances, as people travel less due to a tightened economy. It is important to have a coordinated strategy, not only among the festivals/events, but also for other needs of the Department and the Town as a whole so as to avoid multiple requests to potential sponsors, and/or requests that do not maximize the potential opportunity. Opportunities exist to coordinate festivals on a regional basis, maximizing the potential to attract additional promotional efforts and grant funding by working through the Wake Forest Renaissance Centre to benefit from their promotion and funding opportunities. Other opportunities may come to light by working with other regional cities that offer similar festivals to coordinate schedules, and to discuss mutually beneficial promotional strategies and state level financial support. Evaluations In order to ensure the long‐term sustainability of festival and cultural arts offerings in Wake Forest, and to ensure that all festivals are working together to support overall Town goals, an ongoing evaluation of offerings should address the following areas:
Content – review the inventory of festivals and events offered by the Town and outside agencies to determine if there is a duplication of events, or a gap in types of events. If duplications are present, the Town should look at cooperative efforts to combine offerings. The Town could also explore combining several independent events into one longer event as a means to maximize resources within the Town or sponsorships.
Demographic – analyze what population is benefiting from the events and to what degree they should be supported financially or by other Town resources.
Geographic – evaluate where events are held in consideration of appropriateness, location, and sustainability of the physical resource. Map location of festival inventory to ensure that services go beyond the downtown area and Joyner Park, and do not exceed the physical resource of the downtown area and park.
22 EFRP is an international consortium seeking to understand the current explosion of festivals and its implications and perspective, http://www.efa‐aef.eu/en/activities/efrp/, accessed October 2012. 23 Ben Janeczko, Trevor Mules and Brent Ritchie, “Estimating the Economic Impacts of Festivals and Events: A Research Guide”, Cooperative Research Centre for Sustainable Tourism, 2002, http://www.sustainabletourismonline.com/1005/events/estimating‐the‐economic‐impacts‐of‐festivals‐and‐events‐a‐research‐guide, accessed October 2012.

Parks, Recreation, and Cultural Resources Master Plan 43
Festivals The majority of households indicated they had a need for the following programs, activities, and special events:
Special events (e.g., concerts, festivals) (74 percent of households indicated that they have a need; these households indicate this need as being 50 percent met on average).
Overview Festivals are defined as an event, usually staged by a local community, which centers on some unique aspect of that community.24 Role of Festivals in the Community Both Town‐produced and co‐sponsored festivals and events offer diverse cultural and recreational experiences to citizens and visitors while providing a strong economic impact on the region. Hotels, restaurants, retail shops, and convenience stores all benefit from the thousands of people that attend these events. Town‐produced festivals also provide opportunities for sponsorship and booth space, which helps to promote local businesses, merchants, and non‐profit organizations.25 Through co‐sponsored events, the Town has the opportunity to have a presence at each of them. Town produced festivals should work to support the local community through involvement in several other ways including: input to the operations of the events themselves; direct involvement along the lines of providing opportunity for local artists/exhibitors and non‐profit organizations; consideration of local businesses; and minimizing negative impact to the local community.
Financial Sustainability for Program Delivery It is important for the Town to develop a Resource Allocation and Pricing Philosophy that reflects the values of the community and the responsibility it has to the community. This philosophy will be especially important if the Town moves forward in the development of new programs and additional and/or expanded facilities, and as it strives for sustainability and determines how much it is willing to subsidize operations with tax dollars. One means of accomplishing this goal is applying a process using an industry tool called the “Pyramid Methodology.” This methodology develops and implements a refined cost recovery philosophy and pricing policy based on current “best practices” as determined by the mission of the agency and the program’s benefit to the community and/or individual. Critical to this philosophical undertaking is the support and understanding of elected officials, and ultimately, citizens. Whether or not significant changes are called for, the agency wants to be certain that it is philosophically aligned with its residents. The development of the core services and cost recovery philosophy and policy is built on a very logical foundation, using the understanding of who is benefitting from recreation services to determine how the costs for that service should be offset. Recreation programs and services are sorted along a continuum of what delivers the greatest individual benefit to what delivers the greatest community benefit. The amount of subsidy for each level (not necessarily each individual program) is then determined to create an overall cost recovery philosophy.
24 Wikipedia on Festivals 5.12.08, http//en.wikipedia.org/wiki/Festivals 25 AEA Consulting, Thundering Hooves Maintaining the Global Completive Edge of Edinburgh’s Festivals, Full Report May 2006

44 The Town of Wake Forest, North Carolina
Developing effective ongoing systems that help measure success in reaching cost recovery goals and anticipate potential pitfalls are dependent on the following:
Understanding of current revenue streams and their sustainability.
Tracking all expenses and revenues for programs, facilities, and services to understand their contributions to overall Department cost recovery.
Analyzing who is benefiting from programs, facilities, and services and to what degree they should be subsidized.
Acknowledging the full cost of each program (those direct and indirect costs associated with program delivery) and where the program fits on the continuum of who benefits from the program or service to determine appropriate cost recovery targets.
Defining direct costs as those that typically exist purely because of the program and the change with the program.
Defining indirect costs as those that would typically exist anyway (like full‐time staff, utilities, administration, debt service, etc.).
Program fees should not be based on ability to pay, but an objective program should be in place that allows for easy access for lower income participants, through availability of scholarships and/or discounts. In many instances qualification for scholarships and/or discounts can mirror requirements for free or reduce cost lunch in schools.
Marketing The main reason for not using Wake Forest program or amenities include:
Not aware of programs or facilities as indicated by Focus Groups participants.
Therefore, it is important that the Department improve communications with residents about program/event offerings and Department information.
Work closely with Communications Department and Marketing Plan to increase awareness.
Direct mail the RecConnect to all households in Wake Forest.
Organizational Analysis GreenPlay broadly assessed the organizational and management structure of the Parks, Recreation, and Cultural Resources Department and staffing to determine effectiveness and efficiency in meeting current and future departmental responsibilities as related to the community’s needs. The needs assessment – including input from staff interviews, community and key stakeholder engagement, and level of service analysis, along with the consultant’s expertise – has identified a few areas for operational enhancement. These key organizational issues identified and observed as areas for improvement include:
Better marketing and communication of activities.
Increase staffing for maintenance to meet current and future demands for services.
Increase staffing for facilities operations to meet demand for use of facilities.
Improve and update park and wayfinding signage and maps.
Develop connections with greenways and trails.

Parks, Recreation, and Cultural Resources Master Plan 45
Program and Service Delivery Analysis The Town of Wake Forest Parks, Recreation, and Cultural Resources Department has an array of recreation programs that seek to meet the needs of its diverse community. Programming consists of Administration, Athletics, Aquatics, Cultural Arts and Events, Park Maintenance, Recreation Programs, and Urban Forestry. Administration The Parks, Recreation, and Cultural Resources Director oversees the operation of the Department. Department staff are responsible for program development, urban forestry, the Renaissance Centre, athletics, and aquatics. The Department is also responsible for the maintenance of parks, greenways, and trails. Other program responsibilities include budget preparation and monitoring, preparation of the Department’s Capital Improvements Plan, preparation of grant applications, purchasing, work planning, and supervision of all employees. The Director and staff serve as support for the Recreation Advisory Board, Greenway Advisory Board, Urban Forestry Advisory Board, Public Arts Commission, Cultural Resources Advisory Board, Wake Forest Arts, and Youth in Government Advisory Board. Aquatics The Department operates one (1) swimming pool for public use during the summer months. Activities offered include recreational swimming, parent‐toddler swim time, swim lessons, and group parties. The pool is located at Holding Park. Renaissance Centre The Wake Forest Renaissance Centre is a multi‐purpose facility providing visual and performing arts programming for people of all ages, while also serving as a popular venue for a variety of community events. Located in the heart of Wake Forest’s Renaissance District, the Renaissance Centre endeavors to, “contribute to the revitalization of downtown, connect and engage our community through inspiring arts experiences, and contribute to the economic growth and quality of life in our region.” Through exhibitions, workshops, community theatre, classes, concerts, and related events, the Renaissance Centre will offer a variety of programming to achieve these goals. It will also provide an inclusive environment that enriches the lives of members of the community, while also encouraging and facilitating a flourishing arts community across cultures, generations, and disciplines. Recreation Programming The Department offers a variety of programs for youth and adults. Activities are held at the Flaherty Park Community Center, the Cottage at Olde Mill Stream, Alston‐Massenburg Center, and Wake Forest Community House. Urban Forestry Administered by the Urban Forestry Coordinator and the Wake Forest Urban Forestry Board, the program oversees the planting, removal, and maintenance of trees and other vegetation located on public property and rights‐of‐way. The urban forestry program provides opportunities for public education and participation through classes, tours, events, and volunteering opportunities.

46 The Town of Wake Forest, North Carolina
The Town’s tree canopy goal is 40 percent tree coverage26; parks, greenways, and natural areas play a large role in this number. New park development should look to maintain tree‐covered areas and utilize greenway connections between parks to maintain contiguous forested habitat. Ideas for meeting Urban Forest Management Plan recommendations include:
Implementing recommendations from the 80 Acre Tract Forest Management Plan.
Exploring the possibility of creating a nature center and/or a Nature Explore Outdoor Classroom. http://www.natureexplore.org/
Incorporating green infrastructure principals into the design and development of new park facilities.27
Use trees, shrubs, and other plants to delineate various uses within parks and to serve as visual and sound barriers between conflicting uses.
Special Events The Department provides a variety of special events for all ages and interest levels. Some popular events include the Community Easter Egg Hunt, Halloween Spooktacular, Calls from Santa, Six Sundays in Spring, and Concerts in the Park. Some activities are co‐sponsored with various businesses, agencies, and organizations. Park Maintenance The Park Maintenance division provides maintenance for twelve (12) parks, greenways/trails, grounds of the swimming pool, and various school facilities. Duties include ball field maintenance, landscaping, litter control, playground inspections, equipment repairs, mowing, and building maintenance. Program Development Understanding core services in the delivery of Parks, Recreation, and Cultural Resources services will allow the Department to improve upon those areas while developing strategies to assist in the delivery of other services. The basis of determining core services should come from the vision and mission developed by the Town and what brings the greatest community benefit in balance with the competencies of the Department and the competitive market. Staff program area experts should be assigned to develop and oversee specific areas in order to ensure consistent program characterizes instructor qualifications, training and evaluation, and fees. Experts will also be charged with program research and development. Program areas, at a minimum, should include fitness and wellness, aquatics, cultural arts and events, athletics, recreation programs, and therapeutic recreation.
26 Town of Wake Forest ‐ Forest Management Plan. http://www.wakeforestnc.gov/Data/Sites/1/media/urban%20forestry/uf‐mgt‐plan‐final.pdf 27 Karen Firehock, “Evaluating and Conserving Green Infrastructure Across the Landscape: A Practitioner’s Guide,” November 2012

Parks, Recreation, and Cultural Resources Master Plan 47
The Department should pursue program development around the priorities identified by customer feedback, program evaluation process, and research. Those following criteria should be examined when developing new programs.
Need: outgrowth of a current popular program, or enough demonstrated demand to successfully support a minimal start (one class for instance)
Budget: accounting for all costs and anticipated (conservative) revenues should meet cost recovery target established by the Department
Location: appropriate, available, and within budget
Instructor: qualified, available, and within budget
Materials and supplies: available and within budget
Marketing effort: adequate and timely opportunity to reach intended market, within budget (either existing marketing budget or as part of new program budget)
Further research needs to be done with regard to what types of programming would be successful. Successful programs utilize continuous creative assessments, research, and planning. The Department should create a process that evaluates the success of current program offerings and criteria to determine if new program ideas should be instituted or if changes should be made to current programs. Moreover, new leisure and recreation trends may drive different needs. It is very easy to focus on programs that have worked for a number of years, especially if they are still drawing enough interested participants to justify the program’s continuation. Starting new programs, based on community demand and/or trends, can be risky due to the inability to predict their success. If the program interest seems great, as with those identified in the citizen survey, then the programs should be expanded. Available space may hinder new or expanded opportunities in some cases. Program Evaluation All current programs should be evaluated annually to determine if they should be continued, changed (market segment focus, time/day offered, etc.), or discontinued. A few simple questions should be asked about each program that includes:
Is participation increasing or decreasing? If participation is increasing, then it could clearly mean that the program should be continued. If participation is decreasing, are there any steps to take to increase interest through marketing efforts, change the time/day the program is offered and change the format or instructor? If not, it may be time to discontinue the program.
Is there information contained in the participation feedback that can be used to improve the program?
Are cost recovery goals being met? If not, can fees be realistically increased?
Is there another provider of the program that is more suitable to offer it? If yes, the Department could provide referrals for its customers for the program it does not offer or is not willing or able to offer.
Is this program taking up facility space that could be used for expansion of more popular programs or new programs in demand by the community?
Senior Programming The Northern Wake Senior Center offers adults age 55 and older a full schedule of recreational activities, such as aerobics, line dancing, ballroom dancing, wood carving, painting, and craft making. The center also provides several social events each month, as well as educational classes on subjects including computers and ceramics and clay.

48 The Town of Wake Forest, North Carolina
Programming at the Northern Wake Senior Center is provided by Resources for Seniors, Inc. The organization serves seniors and adults with disabilities in Wake County by providing home and community‐based services and information, thereby allowing them to maximize their choices for independence, comfort, safety, security, and well‐being. Through its commitment to excellence in service and care for individuals and their families, Resources for Seniors provides information and support for decision‐making, and also direct services such as home care, adult day care, senior centers, home repair, and more.
Staffing Analysis GreenPlay broadly assessed the management structure and staffing levels of the Parks, Recreation, and Cultural Resources Department to determine effectiveness and efficiency in meeting current and future departmental responsibilities as related to the community’s needs. Many observations were taken into account to determine if the Parks, Recreation, and Cultural Resources Department had the right mix of staffing in the right places within the department. The staffing analysis process included the observations and assessments of:
Community input
Community satisfaction rates
Staff focus group
Facility tours
Observations of quality of maintenance
Full hours of operation
Professional knowledge in Parks, Recreation, and Cultural Resources organizations
SWOT Analysis
Organizational chart Staffing Considerations After considering all of the organizational observations and staffing assessment, the consultant team has determined that the Parks, Recreation, and Cultural Resources Department does not have an adequate number of staff to operate its current system with the right mix of staff in the right places within the Department. To operate more effectively in the future and to implement the Master Plan and the additions from the 2014 Bond, Parks, Recreation, and Cultural Resources should consider hiring the following positions to supplement existing staff.
Add park maintenance staff
Add facility operations staff
Add urban forestry staff
Add athletics staff
Ensure that staffing resource levels can maintain existing and new facilities at or above acceptable standards as the Master Plan is implemented
Strengths, Weaknesses, Opportunities, and Threats (SWOT) Analysis To develop a short and long‐term strategy for the future planning of Wake Forest’s Parks, Recreation, and Cultural Resources Department, a SWOT Analysis was conducted. A SWOT Analysis is an effective and realistic way of identifying the market Strengths and internal and external Weaknesses, and for examining the Opportunities and Threats faced by the organization. The result of this process helps identify any deficiencies in the organization and is described below along with definitions of terms.

Parks, Recreation, and Cultural Resources Master Plan 49
Definitions SWOT Analysis: Appreciative inquiry and analysis of internal strengths and weaknesses, and external opportunities and threats. Discussion includes the why and examples.
Internal Strengths: Major strengths of the Parks, Recreation, and Cultural Resources Department that should be capitalized upon. Strengths may include competencies in various areas.
Internal Weaknesses: Major weaknesses of the Parks, Recreation, and Cultural Resources Department that the agency has control over positively impacting, addressing, or changing. Weaknesses include any items that can be harmful, detrimental, and/or cause a negative impact.
External Opportunities: An opportunity is an attractive arena to take action in which the Parks, Recreation, and Cultural Resources Department would enjoy a competitive advantage, would further the agency in meeting its vision or fulfilling its mission, or enhance the development of its services. The agency should watch and plan for these if there is a high probability of occurrence.
External Threats: A challenge posed by an unfavorable trend, event, or development in the environment. In the absence of purposeful action, this threat might lead to the erosion of the quality of Parks, Recreation, and Cultural Resources service provision, financial and service sustainability, or the agency’s position or credibility. In some instances, this could also be detrimental to the Parks, Recreation, and Cultural Resources industry. Parks, Recreation, and Cultural Resources should identify and prepare to mitigate all foreseeable threats.
During a meeting with staff, the team began brainstorming to identify potential strengths, weaknesses, opportunities, and threats. As a group, the strengths, weaknesses, opportunities, and threats were listed, and then ranked them according to the following.

50 The Town of Wake Forest, North Carolina
After the brainstorming session regarding the strengths and weaknesses, a consensus was reached on ranking the performance and importance rating scale for each item.
Performance: rated as major strength, minor strength, neutral (neither major nor minor), minor weakness, or major weakness.
Importance: rated the importance of each item to the success of the Department. Rating is high, medium, or low.
After consensus was reached on each strength or weakness, a rating for performance and importance, a Performance‐Importance Matrix was developed.
The Parks, Recreation, and Cultural Resources Department’s Major/High and Minor/High strengths and weaknesses were plotted on a chart (below).
For each opportunity, a consensus rating for attractiveness (high or low) and success probability (high or low) was established.
Attractiveness refers to how attractive the opportunity is to the Department in furthering its mission, fulfilling its vision, improving its revenue generation, cost recovery, or decreasing expenses. Rating is either high or low.
Success probability relates to whether the Department’s strengths will enable it to be successful in this area. Rating is either high or low.

Parks, Recreation, and Cultural Resources Master Plan 51
The Parks, Recreation, and Cultural Resources Department’s consensus ratings were then charted for each opportunity for attractiveness and success probability into an Opportunity Matrix (below).
For each threat, a consensus rating to specify the likelihood that it will happen (probability of occurrence) and the seriousness of the threat was established.
Probability of occurrence relates to the likelihood that the threat will happen. Rating is either high or low.
Seriousness of the threat is rated either high or low.

52 The Town of Wake Forest, North Carolina
The Parks, Recreation, and Cultural Resources Department’s consensus ratings were then charted for each threat for probability of occurrence and seriousness into a Threat Matrix (below).
User Profile and Public Perception GreenPlay’s analysis of the public’s perception of facilities, programs, services, and maintenance is a critical component of this master planning effort. The documented results of the community input mechanisms feed directly into the formulas for level of service analysis. Demographic profiles of the current and projected population, along with trends analysis, allow for the characterization of existing and prospective park users, so the Town can determine appropriate marketing channels to reach them. The survey indicated that a high percentage of respondents rated them between very good and excellent on a scale of 1 to 5 (1=poor, 2=fair, 3=good, 4=very good, and 5=excellent). Overall, results point to a high degree of satisfaction – they are most satisfied with ease of registration (average rating of 4.3), followed by customer service (4.2), maintenance of facilities and parks (4.2), and value received for feed paid (4.0).

Parks, Recreation, and Cultural Resources Master Plan 53
Some key household characteristics that may influence Parks, Recreation, and Cultural Resources planning and marketing efforts in the Town of Wake Forest are summarized below.
Couples with children living at home comprised the largest percent, followed by couples with children no longer at home (empty nesters).
A much lower percent of respondents were single, either with or without children.
The majority of households earn an annual income between $50,000 and $150,000.
Most residents own their home as a primary residence, while a few rent at their current residence.
Resident results show that roughly 1 in 10 people from each sample are newer residents of Wake Forest, having lived in the area for less than a year.
Some key demographic trends that may influence planning and marketing efforts in the Town of Wake Forest are summarized below.
Estimated median household income for Wake Forest residents was $64,485 in 2014.
The median age for the Town in 2010 was 35.2, lower than the median age (37.1) for the United States.
The population is estimated to be 46,682 and to increase by 12,053 by the year 2024 – representing an increase of nearly 26 percent.
The 25‐34 age range is predicted to drop by 5.8 percent by 2019 to represent 26.3 percent of the population, while the 45‐74 age range is predicted to jump by 5.6 percent to 31.8 percent.
The population of Hispanic origin (irrespective of race) has grown from 2010 (5.6%) and is expected to continue to grow to 8.5 percent of the population by 2019.

THIS PAGE INTENTIONALLY LEFT BLANK

Parks, Recreation, and Cultural Resources Master Plan 55
IV. What We Have Now – An Analysis of Spaces and Services
A. Inventory Assessment and Level of Service Analysis
The purpose of this Inventory Assessment and Level of Service (LOS) analysis is to evaluate how facilities and parks in Wake Forest serve the community. The analysis may be used as a tool to benchmark current level of service and to direct future planning efforts. Combined with other findings, including survey results and focus group and stakeholder feedback, it is also intended to indicate the level of service anticipated by the community.
B. GRASP® Methodology
An analytical technique known as Composite‐Values Methodology (CVM) was used to analyze level of service (LOS) provided by assets in Wake Forest. The proprietary version of CVM used by GreenPlay and Design Concepts is known as GRASP® (Geo‐Referenced Amenities Standard Process). This process yields analytical maps and data that may be used to study LOS across the study area.
Why Level of Service? Level of Service for a community recreation system is important, as it is indicative of the ability of people to pursue active lifestyles. LOS can have implications on health and wellness, the local economy, and quality of life and tends to reflect community values. It is often emblematic of the manner and the extent to which people are connected to their communities.
Perspectives Maps and data quantifications produced using the GRASP® methodology are known as perspectives. Level of Service perspectives show how well the community is served by any given set of assets. Maps are utilized along with quantified measurement charts to provide a benchmark of what a community may use, and determine its success providing services both at present and over time. Each perspective is a model of the service being provided across the study area. The model can be further analyzed to derive statistical information about service in a variety of ways. Perspectives are produced based on processes that combine information from a detailed inventory of Wake Forest facilities that was conducted in October of 2014 with computerized Geographic Information System (GIS) technology. During the inventory process, a set of scores was assigned for each location (i.e. park) and the features within (components). The complete inventory of assets was provided as a separate staff‐level document to supplement this report. A general description of the facilities that were inventoried was provided in the previous section of this report.
Composite‐Values Level of Service (LOS) Analysis – This is the process used to inventory and analyze the assets, including quantity, location, and various qualities of each. The process utilizes MS Excel, MS Access, and common GIS software. The composite‐values based LOS analysis process used by GreenPlay and Design Concepts is proprietary, and known as “GRASP®” (Geo‐referenced Amenities Standards Process). It has been somewhat automated through creation of additional software code and template design for efficiency in data collection and analysis. A detailed history and overview of Composite‐Values Methodology (CVM) and description of GRASP® methodology is included in Appendix C.

56 The Town of Wake Forest, North Carolina
A GRASP® score ascribed to a catchment area yields a service area for a particular asset which reflects that score. When service areas for multiple components are plotted on a map, a picture emerges that represents the cumulative level of service provided by that set of components in a geographic area.
In planning for the delivery of parks and recreation services, it is useful to think of parks, trails, indoor facilities, and other public spaces as parts of an infrastructure. This infrastructure allows people to exercise, socialize, and maintain a healthy physical, mental, and social wellbeing. The infrastructure is made up of components that support this goal. Components include such amenities as playgrounds, picnic shelters, courts, fields, indoor facilities, and other elements that allow the system to meet its intended purpose. In the inventory of assets, the following information is collected:
Component type and location
Evaluation of component functionality
Evaluation of associated comfort and convenience features at a location
Evaluation of general design and ambience at a location
Site photos
General comments The immediate surroundings of a component affect how well it functions, so in addition to scoring components, each park site or indoor facility was given a set of scores to rate its comfort, convenience, and ambient qualities. This includes traits such as the availability of restrooms, drinking water, shade, scenery, etc. These modifier values are attributed to any component at a given location and serve to enhance component and location scores. For the purposes of scoring, each location is considered a component in and of itself. Thus reference to “components” also includes the site at which a component is located. All scoring is based on condition, size, site capacity, and overall quality. The inventory team used the following three tier rating system to evaluate these:
1 = Below Expectations 2 = Meets Expectations 3 = Exceeds Expectations

Parks, Recreation, and Cultural Resources Master Plan 57
Image A: Example of Town of Wake Forest GRASP® Level of Service (LOS)
On a map, darker shades results from the overlap of more service areas. Darker shades indicate areas served by more and/or higher quality components. All shades have GRASP® scoring values associated with them such that for any given spot on a perspective map there is a GRASP® Level of Service score that reflects cumulative scoring for nearby assets. Image A, above, provides an example to illustrate.

58 The Town of Wake Forest, North Carolina
Creating the Inventory The Level of Service analysis process involved assembly of a detailed inventory of public and semi‐public physical assets available for use by the Wake Forest community. This asset inventory was created to serve the Town in a number of ways. It can be used for a wide variety of planning and operations tasks such as asset management as well as future strategic and master plans. The assets inventory currently includes public parks, recreation, and trails assets managed by the Parks, Recreation, and Cultural Resources Department. Additionally, schools and several alternative providers were also identified, located, and scored during the inventory process. Parks Ailey Young Park E. Carroll Joyner Park H.L. Miller Park Heritage High Park Holding Park J.B. Flaherty Park Kiwanis Park Mill Bridge Nature Park Plummer Park R.H. Forrest Field Reservoir Rock Spring Park Smith Creek Soccer Center Taylor Street Park Tyler Run Park Wake Forest Middle School Park Schools Heritage Elementary Heritage High Heritage Middle Richland Creek Elementary Wake Forest Elementary Wake Forest High Wake Forest Middle Wake Forest Middle Pickleball Wakefield 9th Grade Center Civic Facilities Dubois Center Wake County Public Library Map A shows the study area and key locations of properties. Larger scale maps may be found in Appendix C.
E. Carroll Joyner Park

Parks, Recreation, and Cultural Resources Master Plan 59
Map A: Town of Wake Forest system map showing all Parks, Recreation and Cultural Resources inventory included for GRASP® analysis.
Asset Scoring A complete Inventory Atlas is provided as a staff level document. Wake Forest Existing Conditions As a place to live, Wake Forest offers the advantages of a traditional small town within the context of a dynamic, growing urban region. This compelling combination, along with the Raleigh‐Durham region’s reputation as one of the fastest‐growing metropolitan areas in the country, will draw more people to Wake Forest in the years to come. As the Town grows, its parks and recreation system will face new challenges. To prepare for these, it is important to take stock of its current assets and compare these to the current and future needs of residents. The parks in Wake Forest are a reflection of where the Town is in its life cycle. Wake Forest today is poised between its small‐town past and its future as a city. Some of its parks are remnants of that small town past: left‐over bits of green set aside and furnished with a variety of activities thrown together in an ad‐hoc fashion over time. Others are state‐of‐the art places that would be the pride of any city. Along with the Town’s properties, there are county lands, such as schools and parks that provide green space and recreational opportunities for residents. For the purposes of this project, the Town has chosen to focus on the properties that it owns or maintains, and therefore has the most control over. This includes about a dozen outdoor locations and nine indoor facilities. Also included are trails and greenways. Map A above shows the relative locations of key elements of this system of parks, trails and facilities. Following is a description of the Town’s parks.

60 The Town of Wake Forest, North Carolina
Ailey Young Park Ailey Young Park exudes a quiet elegance in its simplicity and well‐kept appearance. It offers a combination of active and passive recreation opportunities, and has a portion that is undeveloped woods. In a way, Ailey Young Park represents the small‐town past of Wake Forest. It is a place where the community has been able to gather for sports, picnics, and child‐play. However, new development of the area to the east may change the way people think about this park. In the past it may have been perceived as on the edge of town, but in the future, it will be central to multiple neighborhoods of differing demographics. It may be time to think about what Ailey Young Park’s role should be in the future of Wake Forest. Will it continue to serve the broader community at‐large as a destination park, or will it evolve to serve as a local park for the neighborhoods around it? Either way, Ailey Young Park has the potential to stitch together its corner of Wake Forest, connecting old with new, and past with future.
DuBois Center The DuBois Center is raw opportunity. In its current, state it is uninviting and underutilized. It has basketball courts that are used, but the rest of the site, including its playground, is mostly ignored. However, its historical significance offers the potential of connecting the past to the future in ways that build community pride, much like what has been done in Joyner Park. This site could become a focal point for this part of Wake Forest.

Parks, Recreation, and Cultural Resources Master Plan 61
E. Carroll Joyner Park This park is Wake Forest’s signature park. It offers a model that could inspire the community to bring all of its parks and public spaces up to a higher standard. It offers a wide variety of activities, from passive to active, that attract people from Wake Forest and beyond. With the passage of the recent bond, the offerings of Joyner Park will be expanded to include athletic fields, water play, and a community center. One of the best aspects of this park is that it merges a variety of landscapes together, including highly‐developed spaces, transitional zones with open meadows and wetlands, and forested areas. It also references local history to create a sense of place and timelessness. These ideas should be adapted to the Town’s other parks over time as they are upgraded.
H. L. Miller Park This is Wake Forest’s “downtown” park. It is a shady oasis in the center of town. It offers the opportunity to combine the feeling of a traditional park with a sense of civic pride. This could be done by highlighting the connection to the Town hall (perhaps with a commemorative walkway of some kind connecting the park to the Town hall), and adding art, sculpture, and interpretive signage to the park. It has some interpretive signage that explains the hydrology of the site, and this should be expanded and enhanced.

62 The Town of Wake Forest, North Carolina
J. B. Flaherty Park This is Wake Forest’s activity park. It includes lighted ballfields, a large dog park, a tennis complex, and an indoor community center. The park is divided into two main sections by a patch of forest and a pond, both of which could be better integrated into the design of site. With proper design to better mesh the various parts of this park, it could be as much of a signature park for Wake Forest as Joyner Park.
Kiwanis Park This is a very small but well‐used play space. Its location adjacent to the library offers easy access, with plenty of parking and the availability of restrooms and drinking water inside. The presence of lights in the parking lot adjacent suggests that this playground might see nighttime use on pleasant evenings. There is also a nearby greenway trail, but the connection to the trail is via sidewalk along the streets in an indirect way.

Parks, Recreation, and Cultural Resources Master Plan 63
Plummer Park As the only facility on the west side of Capital, this park plays a crucial role in serving that section of the community. However, the park is small and located in a somewhat obscure place. It is an attractive site, with a nice shelter, playground, and a natural spring. While there is a dirt drive into the park, it does not seem welcoming for vehicles.
R.H. Forrest Field and Holding Park These two sites are adjacent and may be thought of as one large park. The western side has a league‐play baseball diamond and batting cage. The eastern portion has an attractive playground with picnic tables. In between are the Community House, which offers a unique space for events, and the outdoor pool with concession stand. There is also a basketball court. Because of its central location and the combination of features found here, it is likely that this location is heavily used at times, particularly in the summer when the pool is open. In that sense, it seems to represent a “central park” of sorts for Wake Forest, and should be thought of as a primary identity feature for the community.

64 The Town of Wake Forest, North Carolina
Reservoir Though largely undeveloped, this site offers a lot of potential. The lake and surrounding woods are highly scenic and offer opportunities for boating and hiking. The existing development includes an access drive that is not well marked and a boat ramp that is in need of repairs. Parking is informal and not developed.
With improvements, this could be a true gem for Wake Forest. This site has the potential to support amenities like those found at Lake Johnson in Raleigh and Fred Bond Park in Cary. This could include a walking path around the lake, a boat house with rentals, and event space that could be used as a source of revenue. Other improvements could include a destination playground, picnic shelters (also as a revenue source), and other amenities. Smith Creek Soccer Center This facility offers several multi‐use fields, a playground, and picnic shelter. It is connected to the greenway system. With all of these features already going for it, a few minor improvements could further enhance its appeal, including such things as providing shade trees, more benches for seating, and bike racks.

Parks, Recreation, and Cultural Resources Master Plan 65
Taylor Street Park This small park packs a lot of value into a small space. It offers play equipment, picnic shelter, and a small area of open turf. Permanent restrooms are available in the adjacent building.
Tyler Run Park This park is approximately eight acres and is situated within a residential neighborhood. It is completely surrounded by the back yards of homes. However, it contains a ball diamond that serves more than just the immediate neighborhood. People may also come here to use the playground and large area of open turf.
This is a nice park, but could use some upgrading. The addition of comfort and convenience features such as more shade and seating in key locations, along with landscaping to enhance the vehicular entrance and separate vehicles from the rest of the park would enhance the value of this park.

66 The Town of Wake Forest, North Carolina
Inventory Summary Catchment Areas Catchment areas are used to determine how service looks from a given viewpoint or perspective. In this process, a radius is drawn around each feature found in a park – referred to here as a component. This radius represents the catchment area for that component, or essentially the area from within which the component can be conveniently reached by various means of travel. The score that was assigned to the component in the inventory process is then applied to its catchment area and overlapped with all other component catchment areas. This process yields the data used to create perspective maps and analytical charts. People use a variety of transit modes to reach a recreation destination: on foot, on a bike, in a car, via public transportation, or utilizing any combination of these or other alternatives. The mode is often determined, at least in part, by the distance to be travelled. The GRASP® system accounts for this by applying multiple catchment area distances to examine access to assets. Two different catchment area distances were used to calculate scoring totals, yielding two distinct perspectives used to examine the park system:
1. Overall Level of Service 2. Walkable Level of Service
A catchment distance of one mile was used for the Overall LOS. The one‐mile catchment is intended to capture recreational users travelling from home or elsewhere to a park or facility by way of bike, bus, or automobile. Walkable LOS analysis uses a more focused catchment distance intended to capture users within a ten minute walk. For Wake Forest, a one‐third mile radial catchment buffer was used for analyzing walkability. Within the area scribed by this radius, the origins of virtually all potential trips with a maximum walking time of 10 minutes to reach the component are captured.
Inventory Assessment
Parks are pleasant and well‐maintained throughout the system.
No components were found to be functioning below expectations due to condition.
The parks are used and enjoyed by residents. Joyner Park is a particular gem, a signature park for Wake Forest and a model for future parks.
Wake County School Parks offer additional facilities and features that serve residents of Wake Forest.
NONETHELESS. . .
Some parks could use better circulation system within them, particularly paved walkways and loop walks.
Natural areas could be better integrated into the parks with transitional edges and pathways.
Parks could be better connected with the trail system.
Parks tend to be concentrated in the sector of Wake Forest that lies east of Capital Boulevard and north of Dr. Calvin Jones Highway. Facilities of other providers, such as Wake County, may play a more important role in these outlying areas.
Academic and professional research on catchment distances for walkability is lacking. Other studies have used distances ranging from 1/8 mile to one mile or one kilometer (.62 miles) as walkable distances. Blanck et al., Let’s Go to the Park Today: The Role of Parks in Obesity Prevention and Improving the Public’s Health, Childhood Obesity, Oct 2012

Parks, Recreation, and Cultural Resources Master Plan 67
C. Key Level of Service Findings
Summary of Findings from the LOS Analysis Perspective analyses were generated to evaluate the assets available to residents. For purposes of this study, Wake Forest’s Extra‐territorial Jurisdiction (ETJ) line was used as the extent of the study area. The population within this area was estimated to be 35,839 in 2014, and is projected to be 41,921 in 2019. These figures were also used to calculate the population/acre as a measure of population density to be used in additional LOS calculations.
Table 5: Study Area Population*/Density Data
Total Acres
2014 Population*
2019 Population*
2014 Pop/Acre
2019 Pop/Acre
Wake Forest GRASP® Study Area
13,740 37,046 40,498 2.61 3.05
* Population data source: ESRI ArcGIS OnlineOverall Level of Service For this perspective of service, everything provided by the Town in its parks, trails, and indoor facilities is combined together and viewed from the standpoint of someone who can access it by a choice of automobile, bike, or walking. All things in the inventory are valued according to the scores given to them in the assessment, but when something is within walking distance, its score is doubled. This is what is displayed in Map B and Map B‐1.
Key Level of Service Findings
Coverage for access to parks, trails, and facilities in Wake Forest is fairly good. Eighty‐six percent (86%) of the land area within the study area boundary has access to at least some town‐provided amenity within a one‐mile proximity. If amenities provided by Wake County and other providers were included, the percentage would probably be even greater.
The LOS value, i.e. the measure of “how much” service there is from parks, trails, and facilities varies across the study area and is highest in the area north of Dr. Calvin Jones Highway and east of Capital Boulevard. It is lowest in the southernmost part of town.
When LOS is evaluated compared to an assumed threshold value equal to a typical local park, it appears that the central parts of Wake Forest are at or above the threshold, with gaps occurring near Wake Forest Middle School (which is served by a Wake County school/park) and on the west side of Capital Boulevard. The eastern edge and southernmost parts of the study area also fall below the threshold.
Access to recreation opportunities by walking is less available to residents than may be desired; however, this does not take into account amenities offered by other providers, such as Wake County. It does, however, stress the need to work with other providers to ensure that the needs of all Wake Forest residents are met by at least one provider.
Some areas with walkable level of service below the threshold may be acceptable if they are commercial or industrial areas or more rural settings.
Wake Forest’s indoor facilities provide a good range of spaces and activities; however, these facilities are concentrated in a limited part of the Town. Consideration should be given to expanding the options by locating new facilities in other parts of town or partnering with other providers to make sure these are available to residents.
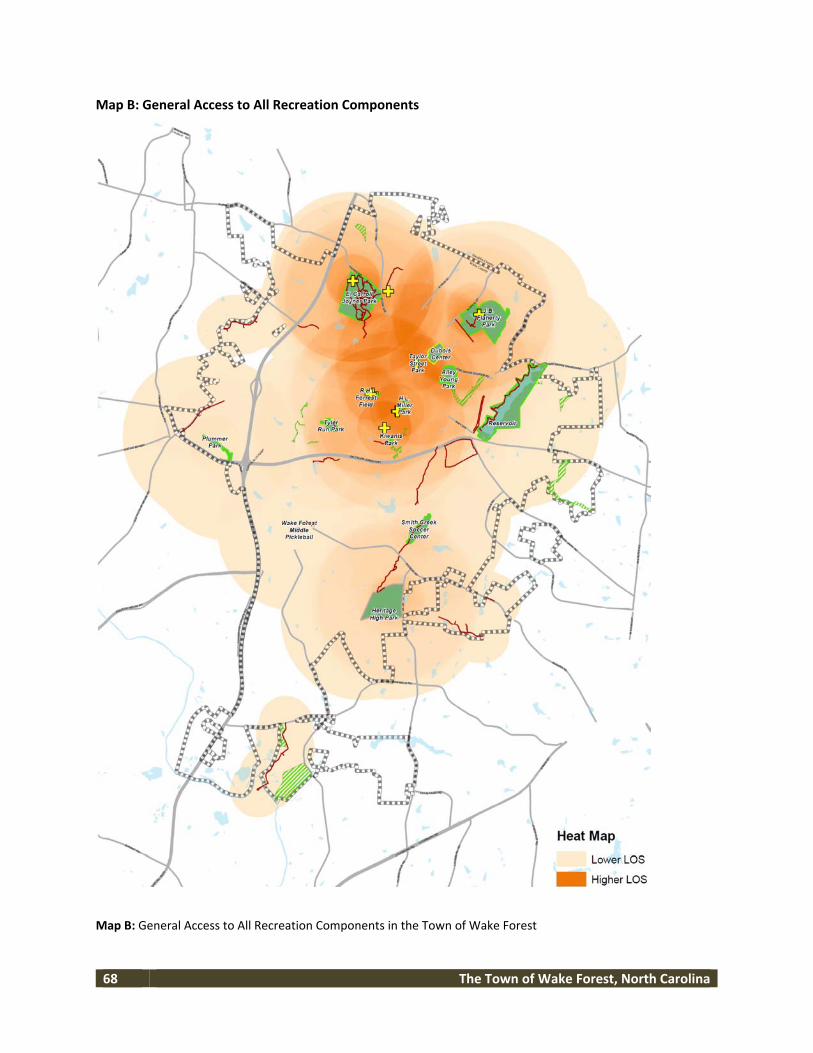
68 The Town of Wake Forest, North Carolina
Map B: General Access to All Recreation Components
Map B: General Access to All Recreation Components in the Town of Wake Forest

Parks, Recreation, and Cultural Resources Master Plan 69
In general, Map B indicates that Wake Forest has a distribution of facilities that offers good general access to parks and recreation facilities. Areas of higher concentration are notable, particularly in the area that lies north of Dr. Calvin Jones Highway and east of Capital Boulevard. However, even most of the areas outside that sector are still within the catchment area of at least some components provided by the Town. In fact, 86 percent of the land within the study area boundary falls within the catchment area of at least one component from the inventory. Threshold Analyses – Maps B‐1 and B‐2 The information in Map B can be evaluated another way by assuming that it is desirable to be within proximity (i.e. within the catchments) to a set of components that are at or above an assumed value. In this case, a value of 1 is used, which equals a “typical” park with four components in it and a trail or greenway. Map B‐1 shows where service falls above (in purple) or below (in yellow) this threshold, and where there is no service at all (no color). The results show that most of the core area of Wake Forest falls above the assumed threshold, meaning that most of Wake Forest has proximity to a “typical” set of park amenities or some combination of amenities that equate to a typical park in value. The primary gaps in service appear around Wake Forest Middle School (which has a Wake County school/park) and the area west of Capital Boulevard, which has limited facilities located in Plummer Park.

70 The Town of Wake Forest, North Carolina
Map B‐1 – Assumed LOS Value Threshold

Parks, Recreation, and Cultural Resources Master Plan 71
Map B‐2 – Median LOS Value Threshold Another threshold that can be examined is the median value of service. When the range of LOS value is measured across the study area and locations are sorted into whether they are in the top half or bottom half of the measured service value, the results are as shown in Map B‐2. It looks similar to the previous threshold map (Map B‐1), in that areas with higher service (i.e. in the upper half of all service values) are concentrated in the core of the area north of Dr. Calvin Jones Highway and east of Capital Boulevard. However, in this analysis, the areas around Smith Creek Soccer Center and Heritage High drop below the threshold, meaning that the LOS there is in the bottom half of all values. This is not necessarily a problem, it simply indicates where the concentrations of service are presently located and where areas with less service occur. Map B‐2 – Median LOS Threshold

72 The Town of Wake Forest, North Carolina
Walkable Level of Service Another point of view from which to look at service is that of someone who, by choice or necessity, only accesses parks and other facilities by walking. In the resulting walkable level of service perspective analysis, Capital Boulevard was considered to be a pedestrian barrier at which the service coverage for all features was clipped. Dr. Calvin Jones Highway was not considered a barrier, because of crossings that have been installed or will be installed in the near future. Map C: Walkable Access to All Recreation Components Map C shows access to all recreation components by walking. One‐third mile catchment radii have been placed around each component and shaded relative to the component’s GRASP® score. This represents a distance from which convenient access to the component can be achieved by an average person within a ten minute walk. Scores are doubled within this catchment to reflect the added value of walkable proximity, allowing direct comparisons to be made between Map B and Map C.

Parks, Recreation, and Cultural Resources Master Plan 73
Map C: Walkable Access to All Recreation Components

74 The Town of Wake Forest, North Carolina
Map C is intended to show the LOS available if walking is the only way used to reach assets. Compared to Map B, there is a lot less area with service coverage. The area north of Dr. Calvin Jones Highway and east of Capital Boulevard continues to have higher levels of service and greater coverage than other parts of town, and the presence of trails becomes a more important factor in service. Overall, 54 percent of the land within the study area boundary has walkable service coverage. As in the previous perspective, the walkability perspective can be analyzed further to determine areas where proximity to a set of components that are above or below an assumed threshold exists. Using the same assumptions of proximity to a set of components equal in value to a typical local park as in the previous perspective B‐1, Map C‐1 shows where this occurs, along with areas where it falls below the threshold or there is no service at all. It shows that areas within walking distance to one of Wake Forest’s developed parks meet the threshold. While this seems like an obvious outcome, it would not necessarily be true if any of Wake Forest’s existing parks were performing below‐par, or if barriers were creating access problems. This information demonstrates that Wake Forest parks are performing well in terms of meeting the needs of people who live within walking distance. However, there are large parts of the community that do not have walkable access to threshold service value offered by a typical local park. Though if the amenities offered by other providers, particularly Wake County, are taken into consideration, the picture would likely improve. This suggests that partnering with Wake County to ensure that schools, school/parks, and other facilities meet a basic threshold or standard to serve Wake Forest residents could be an effective way to ensure that Wake Forest is a more walkable community.

Parks, Recreation, and Cultural Resources Master Plan 75
Map C‐1 – Walkability Assumed LOS Value Threshold
Also, consider that areas shown in yellow on Map C‐1 are areas of opportunity. These are areas where land and assets that provide service are currently available but do not meet the minimum standard threshold value. It may be possible to improve the quantity and quality of those assets to raise the LOS without the need for acquiring new lands. For example, enhancing the value of trails through the addition of trailheads, waysides, interpretive signage, art, play features, or other amenities could move the areas around these trails from yellow to purple, putting them above the threshold. Map C‐2 shows the effects of plotting areas that are above the median service value, as described for Map B‐2. It reinforces the information in Map C‐1 and this suggests the same actions that were just described in order to improve walkable service throughout Wake Forest.

76 The Town of Wake Forest, North Carolina
Map C‐2 – Walkability Median LOS Value Threshold

Parks, Recreation, and Cultural Resources Master Plan 77
Indoor Facilities The following facilities were included in the inventory of assets: Alston Massenburg Center This recently‐renovated facility features a large meeting room with stage and a kitchen, which is available for rent. The facility sits adjacent to Taylor Street Park, which offers a playground and outdoor gathering space. Cottage at Olde Mill Stream This one‐room building is used for Parks, Recreation, and Cultural Resources programs. Flaherty Park Community Center This center includes a gymnasium, meeting room, and open area that are all reservable. The meeting room includes an adjoining kitchen. Holding Park Lockers and Concessions This recently‐renovated facility supports the aquatics center and other amenities associated with Holding park. Joyner Park Center This facility is planned and funded but not yet constructed. Northern Wake Senior Center This facility offers adults 55 and over a full schedule of recreational activities, social events, and educational classes. Renaissance Center and Arts Annex This is a multi‐purpose facility that provides visual and performing arts activities as well as community events. It is also available for rental for special events. Wake Forest Community House This historic structure provides a large gathering space with an adjacent kitchen and large porch that overlooks the Holding Park Pool and playground. It is available to rent for special events. The two following maps (Maps D and D‐1) show two different catchment areas for all of Wake Forest’s indoor facilities. The first shows a one‐mile catchment and the second a one‐third of a mile catchment.

78 The Town of Wake Forest, North Carolina
Map D‐1: One Mile Access to Indoor Facilities Map D‐2: 1/3 Mile Access to Indoor Facilities
From these maps, it is evident that indoor space in Wake Forest is not currenlty well‐distributed outside of the core area north of Dr. Calvin Jones Highway and east of Capital Bouldvard. Consideration should be given to whether or not additional indoor facilities are needed to serve the outlying areas. To provide further insight, Table 6 shows the population living within the catchment areas of each current (and proposed in the case of Joyner Center) indoor facility. It shows that, compared to other indoor locations, the proposed Joyner Park site provides relatively low access for residents, especially from a walking perspective. In addition, it falls within a part of the Town that already has access to indoor facilities. While this is just one of many factors affecting the location of a new community center, consideration may be given to exploring other options for its location.

Parks, Recreation, and Cultural Resources Master Plan 79
Table 6: Population Within One Mile and One‐Third Mile of Current Indoor Facilities
GRASP® Index Another way to look at service is to ignore the distribution of features within the Town and simply measure their net value in comparison to the number of people served. This very simplified measure assumes that everyone has equal access to everything that the Town offers, regardless of where they are located, and shares equally in the ability to make use of them. By itself, this number may not mean a lot, but when monitored over time, as the population increases and as components are added, removed, replaced, or allowed to age or degrade, it can be used to track the agency’s progress toward its overall service goals. For example, at the time of this report, the GRASP® Index for Wake Forest is a numerical value of 42. Assuming that the physical inventory of assets does not change between now and 2019, when 6,082 people are expected to be added to the community and begin using the park and trail system, the GRASP® Index would fall to a value of 36, or a net drop in LOS to only 85 percent of what it is today. To offset this population increase, Wake Forest would need to add more amenities or upgrade those existing to increase the overall value of its physical assets. Table 7 shows how this value is currently distributed across existing facilities and how much increase in value would be needed within each category to maintain existing levels of service according to the GRASP® Index. However, an alternative would be to focus on maintaining existing features to retain their value and adding new features that are in high demand rather than simply keeping the proportions among features the same as they are currently. This is the approach taken in the Recommendations section of this plan, which suggests the upgrading of specific parks rather than across‐the‐board improvements to all parks. Upgrading existing parks, even if new components are not added, can have the same effect on GRASP® Index as creating new parks or adding new features.

80 The Town of Wake Forest, North Carolina
Also, the addition of trails and greenways is likely to cover a large portion of the additional service needed to address population growth. In general, following the suggestions in the Recommendations section should assure that the GRASP® Index is maintained at a desirable level in Wake Forest, and this can be easily monitored as implementation of the plan proceeds. Table 7: Projected Community Components GRASP® Index 2019
Current Population 2014
35,839 Projected Population 2019
41,921
Total GRASP® Community Score by
Component Type
GRASP® Index (GRASP®
Score/1,000 Population)
Total GRASP® Score Needed At
Projected Population
Additional GRASP® Score
Needed
Ballfield 64.4 1.8 75.3 10.9
Basketball 38.7 1.1 45.3 6.6
Educational Experience 16.1 0.4 18.8 2.7
Event Space 32.2 0.9 37.7 5.5
Garden, Display 32.1 0.9 37.5 5.4
Loop Walk 62.9 1.8 73.6 10.7
MP Field, All Sizes 87.6 2.4 102.5 14.9
Natural Area 39.3 1.1 46.0 6.7
Open Water 19.2 0.5 22.5 3.3
Playground, Destination 16.1 0.4 18.8 2.7
Playground, Local 35.6 1.0 41.6 6.0
Shelter, Group 28 0.8 32.8 4.8
Tennis 100.8 2.8 117.9 17.1
Capacities Analysis Capacities analysis is a somewhat outdated method of measuring service, but can be useful when combined with the other analytics presented here to look at how growth affects Level of Service. Table 8, on the following page, shows the number of additional components that would be needed for certain component types if the goal is to maintain the current ratio of components to population. This assumes that the current ratio is the “correct” one, and does not take into account changing needs, trends, or other factors. For example, Pickleball is not shown on the chart (in part because it is currently being played on gym courts and other non‐dedicated sites, which would skew the table), but Pickleball is a growing sport with evolving needs. Using a table such as this one alone would not provide all of the information to project the needs for Pickleball. Similarly, the projections shown in the chart for features like tennis courts and open water may need to be adjusted based on other input that was obtained in the needs assessment and public process for this plan. Summary and Comparison of Analysis Data with other Communities Table 9 provides a comparison between Wake Forest and other communities on a variety of metrics. It should be understood that there is no standard or “correct” value for any of these metrics, and that they are provided simply for the purpose of showing how these values range across a number of different communities and situations.

Table 8: Capacity Analysis – Components per Population
All C
ompo
nents
Aqua
tic F
eatur
e: Po
ol
Aqua
tic F
eatur
e: Sp
ray
Ball F
ield
Bask
etball
Battin
g Cag
e
Bocc
e Ball
Comp
lex, B
allfie
ld
Comp
lex, T
ennis
Dog P
ark
Even
t Spa
ce
Gard
en D
isplay
Loop
Walk
MP F
ield L
arge
MP F
ield S
mall
Multiu
se C
ourt
Natur
al Ar
ea
Open
Tur
f
Open
Wate
r
Picn
ic Gr
ound
s
Play
grou
nd,
Desti
natio
n
Play
grou
nd, L
ocal
Shelt
er
Shelt
er, G
roup
Tenn
is
Trac
k, Co
mpeti
tion
Total Study Area 134.5 1 1 12 8.5 3 1 1 1 1 5 4 6 15 2 1 10 6 4 3 2 9 1 7 15 3 Population 2014 37,046 Ratio/1,000 Population 3.75 0.03 0.03 0.33 0.24 0.08 0.03 0.03 0.03 0.03 0.14 0.11 0.17 0.42 0.06 0.03 0.28 0.17 0.11 0.08 0.06 0.25 0.03 0.20 0.42 0.08 Population/Component 266 35,839 35,839 2,987 4,216 11,946 35,839 35,839 35,389 35,839 7,168 8,960 5,973 2,389 17,920 35,839 3,584 5,973 8,960 11,946 17,920 3,982 35,839 5,120 2,389 11,946 2019 40,498 Total # Components to meet current ratio in 2019
157 1 1 14 10 4 1 1 1 1 6 5 7 18 2 1 12 7 5 4 2 11 1 8 18 4
# Additional Components to meet current ratio in 2019
23 0 0 2 1 1 0 0 0 0 1 1 1 3 0 0 2 1 1 1 0 2 0 1 3 1
Table 9: GRASP® Comparative Data
STATE CITY YEAR POPULATION
Stud
y Are
a (Ac
res)
Tota
l # S
ites
Tota
l # C
ompo
nent
s
Avg.
# Co
mp/
Site
Tota
l GRA
SP®
Valu
e (En
tire
Syst
em)
GRAS
P In
dex
Aver
age G
RASP
® Sc
ore/S
ite
% T
otal
Area
with
Co
mpo
site S
ervic
e
Num
ber o
f Co
mpo
nent
s p/
Popu
latio
n
Popu
latio
n/Ac
re
Comments
VT Essex 2011 28,858 25,230 47 153 3.3 895 31 19.0 72% 5 1.1 ½ mile, 1 Mile Catchment areas ID Post Falls 2011 29,062 24,928 35 271 7.7 1,005 35 28.7 71% 9 1.2 OR Oregon City 2006 29,540 5,944 51 215 4.2 N/A N/A N/A 86% 7 5.0 ½ mile, 1 mile catchment areas CO Commerce City 2006 36,049 26,270 90 357 4.0 1,047 29.0 11.6 73% 10 1.4 CA La Quinta 2006 39,614 22,829 27 143 5.3 611 15 22.6 79% 4 1.7 UT South Jordan 2006 44,276 14,081 48 172 3.6 1,578 36 32.9 44% 4 3.1 CA Palm Springs 2013 44,468 60,442 16 162 10.1 1,149 26 71.8 69% 4 0.7 ½ mile, 1 mile catchment areas OR Corvallis 2011 54,462 18,006 54 309 5.7 2,217 41 41.1 93% 6 3.0 1/3 mile, 1 mile, and 10 mile catchment areas MO Liberty 2013 56,041 53,161 39 298 7.6 607 11 15.6 57% 5 1.1 MA Brookline 2009 60,000 NA 74 128 1.7 551 9 7.4 NA 2 NA NM Farmington 2014 46,815 21,179 98 354 3.6 2,204 48 22.5 97% 8 2.2 ½ mile, 1 mile catchment areas NC Wake Forest 2014 37,046 13,740 37 159 4 1,491 42 40 86% 4 3 1/3 mile, 1 mile catchment areas


Parks, Recreation, and Cultural Resources Master Plan 83
Recommendations Table 10 shows components that were assigned low scores during the inventory process. Most of the items represent an opportunity rather than an existing problem. For example, the lack of access to the creek at Ailey Young Park is not a problem of poor maintenance or disrepair, but rather a feature that exists but which has not been utilized to its full potential. Others, such as the small size of the turf areas at Taylor Street Park, are simply making the best of an existing situation and are acceptable as‐is. A few, such as the playground at Dubois Center and the picnic grounds at Holding Park, can be addressed as part of a new overall master plan for those sites, as explained further below. This table shows that, unlike many communities today, Wake Forest is in a good position to move forward with its park system rather than having a lot of deferred‐maintenance issues to deal with. This is reflected in the recommendations that follow, which focus on taking Wake Forest’s parks, trails, and facilities into the future rather than restoring them to some past condition. Table 10: Low Scoring Components
LOCATION COMPONENT CLASS QUANTITY N_SCORE C_SCORE COMMENTS
Ailey Young Park Open Water Y 1 1 1 Not really accessible
Dubois Center Playground, Local
Y 1 1 1 Appeared to be off limits at time of inventory on a Sunday.
H.L. Miller Park Natural Area Y 1 1 1 No forest, but the area around the stream is a natural area.
Heritage High Park
Natural Area Y 1 1 1 Seems to have limited access.
Heritage High Park
Open Water Y 1 1 1 Unattractive. Could be made more of an asset.
Holding Park Picnic Grounds Y 1 1 1 Small, but great location near the pool and playground.
R.H. Forest Field Batting Cage Y 1 1 1 Locked. Off limits without coach.
Reservoir Water Access, Developed
Y 1 1 1 Boat ramp is in poor condition.
Smith Creek Soccer Center
Natural Area Y 1 1 1 Small, not accessed.
Taylor Street Park Open Turf Y 1 1 1 Small.
Wake Forest Suggestions for Improvements The challenge for the near future will be to respond to growth and rapid changes in ways that retain the small‐town flavor of Wake Forest’s parks while bringing them up to a level of aesthetic and functional sophistication that reflects the character that Wake Forest wants to project for its future. The suggestions below are not prioritized, and are offered as a starting point for the discussion of setting priorities.

84 The Town of Wake Forest, North Carolina
General Recommendations
Where portable restrooms are provided, consider adding screen enclosures to improve their appearance and give them a more permanent look.
Natural play and exposing people (especially children) to nature is a growing trend. Wake Forest is in a good position to respond to this trend by incorporating natural areas that are already found at its parks into the overall design of the parks in a cohesive way. Where forested areas are found in parks, create transition zones that integrate the forest into the overall design of the park. Joyner Park is a good model, with its meadow areas, wetlands, and variety of habitats, instead of an abrupt line where woods meet mowed lawns. Also, provide opportunities for natural play spaces to augment developed playgrounds throughout the Town.
Walking is one of the most frequent and healthful activities that occurs in parks. It is engaged in by people of all ages and a wide range of abilities. Connected, looping walkways in parks facilitate and encourage walking. Create a variety of walking loops in parks. Have these wind through a variety of spaces, including open areas, woods, etc.
Find suitable locations for facilities that meet the needs of active and involved constituencies (both current and future ones) such as Pickleball and tennis enthusiasts.
Consider the impact of the proposed new community center and weigh options and opportunities to make it a true center of the community. While Joyner Park is an attractive location for the center, it will become a drive‐to facility and place an even higher burden on parking. Locating it in the center of Wake Forest would give the facility more walkable and bike‐able access, and make downtown a true center of the community.
Provide trailheads to access trails throughout the Town. This may be done in partnership with other entities that have space for parking and support amenities in appropriate locations.
Continue to fill gaps in the greenway system and to connect across barriers such as Capital Boulevard.
Create a better wayfinding and identity system for parks. Include facilities of other providers, such as county/school parks within this wayfinding system, to make it integrated to facilitate easy navigation to parks, trails, and green spaces throughout town.
Improve service west of Capital Boulevard. Ways to do this might include expanding/improving Plummer Park and improving access to it from the surrounding neighborhoods. Service to this side of town might also be improved by creating safe and desirable crossings of Capital Boulevard at key locations, and by adding trailheads and connections to the Neuse River Trail system.
The following is a brief description of suggested improvements at each location. Some are modifications to the existing site, such as adding walkways or creating transition area between the developed parts of the site and forested areas. New master plans for the entire site are suggested for the Dubois Center, Miller Park, and Reservoir. New master plans may be in order for Ailey Young Park and Holding Park as well, given the potential for these sites to take on dramatic new roles. Ailey Young Park This park could be enhanced by creating transition zones that blend the forest gradually into the developed part of the site and invite exploration of its natural areas in a way that feels safe and inviting. This might be accomplished by opening up views and extending paths through broad swaths of open areas through the natural area. These paths should connect to the new development happening east of the park. This park could be a good place to create a playground focused on nature play.

Parks, Recreation, and Cultural Resources Master Plan 85
The development of the area east of this park may change the way people think about it. Rather than being somewhat isolated or perceived as on the edge of town, it will now be central to multiple neighborhoods. It should be connected to the new neighborhoods by trails that link to the overall greenway system that is shaping up along Traditions Grande Boulevard, and by extension, to Reservoir and the larger greenway system. Suggested Improvements:
Add walkways to connect all parts of the site.
Use selective clearing to create open areas that invite people into the natural parts of the park, provide access to access the stream corridor, and connect to new development east of the park.
Consider a new master plan for the park that integrates these new parts of the park into the existing.
Dubois Center A master planning process for this site is recommended to determine the ways in which it can best serve the community for the future. Suggested Improvements:
Conduct a public process and prepare a long‐range master plan for the site. E. Carroll Joyner Park This park should serve as a model and inspiration for improvements throughout Wake Forest. Suggested Improvements:
None. Simply ensure that future development in this park maintains the spirit that it exhibits and incorporates the concepts listed above.
H. L. Miller Park This park should combine the feeling of a traditional park with a sense of civic pride. This could be done by highlighting the connection to the Town hall (perhaps with a commemorative walkway of some kind connecting the park to the Town hall), and adding art, sculpture, and interpretive signage. It has some interpretive signage that explains the hydrology of the site, and this should be expanded and enhanced. Suggested Improvements:
Create well‐designed interpretive signage to explain the natural and cultural qualities of this site, and position it as a civic space.
Upgrade the furnishings to reflect a sense of civic importance and pride and make this park feel like part of the overall civic campus.
Connect to downtown through the civic campus so that it truly feels like Wake Forest’s “downtown park.”
Consider preparing an overall master plan for redevelopment of this site. J. B. Flaherty Park With proper design to better mesh the various parts of this park, it could be as impressive as Joyner Park. If the existing walkway system was extended and connected to form a loop walk that circumnavigated the pond, tennis courts, and dog park, it would likely become a popular walking route. An additional loop could be created around the ball diamonds, offering an even longer walking route.
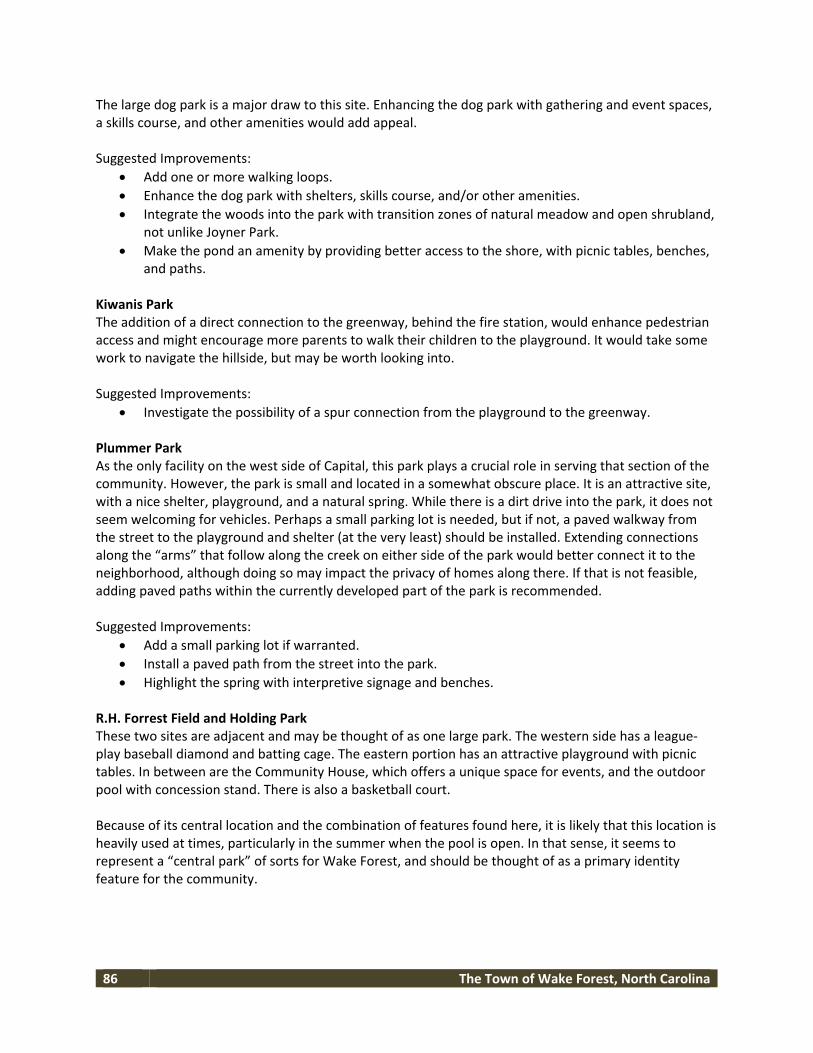
86 The Town of Wake Forest, North Carolina
The large dog park is a major draw to this site. Enhancing the dog park with gathering and event spaces, a skills course, and other amenities would add appeal. Suggested Improvements:
Add one or more walking loops.
Enhance the dog park with shelters, skills course, and/or other amenities.
Integrate the woods into the park with transition zones of natural meadow and open shrubland, not unlike Joyner Park.
Make the pond an amenity by providing better access to the shore, with picnic tables, benches, and paths.
Kiwanis Park The addition of a direct connection to the greenway, behind the fire station, would enhance pedestrian access and might encourage more parents to walk their children to the playground. It would take some work to navigate the hillside, but may be worth looking into. Suggested Improvements:
Investigate the possibility of a spur connection from the playground to the greenway. Plummer Park As the only facility on the west side of Capital, this park plays a crucial role in serving that section of the community. However, the park is small and located in a somewhat obscure place. It is an attractive site, with a nice shelter, playground, and a natural spring. While there is a dirt drive into the park, it does not seem welcoming for vehicles. Perhaps a small parking lot is needed, but if not, a paved walkway from the street to the playground and shelter (at the very least) should be installed. Extending connections along the “arms” that follow along the creek on either side of the park would better connect it to the neighborhood, although doing so may impact the privacy of homes along there. If that is not feasible, adding paved paths within the currently developed part of the park is recommended. Suggested Improvements:
Add a small parking lot if warranted.
Install a paved path from the street into the park.
Highlight the spring with interpretive signage and benches. R.H. Forrest Field and Holding Park These two sites are adjacent and may be thought of as one large park. The western side has a league‐play baseball diamond and batting cage. The eastern portion has an attractive playground with picnic tables. In between are the Community House, which offers a unique space for events, and the outdoor pool with concession stand. There is also a basketball court. Because of its central location and the combination of features found here, it is likely that this location is heavily used at times, particularly in the summer when the pool is open. In that sense, it seems to represent a “central park” of sorts for Wake Forest, and should be thought of as a primary identity feature for the community.

Parks, Recreation, and Cultural Resources Master Plan 87
Suggested Improvements:
This location lends itself to being a “destination playground,” with a variety of play spaces and picnic sites that could be used for birthday parties, etc. The topography lends itself to the creation of an exciting playground on multiple levels that would be accessible to all abilities (Centennial Center Park and Westlands Park in Colorado are examples).
Consider a long‐range vision for this site that makes it an identity site and a destination that leverages the pool, event space, and a major play space into a unique facility.
Reservoir Though largely undeveloped, this site offers lots of potential. The lake and surrounding woods are highly scenic and offer opportunities for boating and hiking. The existing development includes an access drive that is not well marked and a boat ramp that is in need of repairs. Parking is informal and is not developed. With improvements, this could be a true gem for Wake Forest. This site has the potential to support amenities like those found at Lake Johnson in Raleigh and Fred Bond Park in Cary. This could include a walking path around the lake, a boat house with rentals, and event space that could be used as a source of revenue. Other improvements could include a destination playground, picnic shelters (also as a revenue source), and other amenities. Suggested Improvements:
Given the potential of this site, it is recommended that a master planning process be conducted to determine how much development and of what type is desired at this location.
Smith Creek Soccer Center This facility offers several multi‐use fields, a playground, and a picnic shelter. It is connected to the greenway system. Given this, and its potential as a destination for people on bicycles, it seems appropriate to add bike racks here. Adding shade trees and benches along the paved path, especially near the playground, would enhance the user experience for visitors. The addition of permanent restrooms may also be justified, given the size and use of the site. Also, the vehicle entrance for this park is not well‐marked, particularly for those arriving from the North. Suggested Improvements:
Relocate entry signage for better visibility.
Add trees for shade along paved path.
Add benches along paved path.
Add bicycle racks. Taylor Street Park This small park packs a lot of value into a small space. It offers play equipment, a picnic shelter, and a small area of open turf. Permanent restrooms are available in the adjacent building. Suggested Improvements:
(None needed)

88 The Town of Wake Forest, North Carolina
Tyler Run Park This park is approximately eight acres and is situated within a residential neighborhood. It is completely surrounded by the back yards of homes. However, it contains a ball diamond that serves more than just the immediate neighborhood. People may also come here to use the playground and large area of open turf. This is a nice park, but it could use some upgrading. The addition of comfort and convenience features such as more shade and seating in key locations, along with landscaping to enhance the vehicular entrance and separate vehicles from the rest of the park would enhance its value. Suggested Improvements:
Create a loop walk around the perimeter of the park, but not too close to adjacent yards, that would allow for better pedestrian access and circulation, and for walking as a healthy activity. Distance markers along the loop would further enhance its value here.
Add benches and waysides at key locations along the loop walk.
Add planting beds with shrubs and trees to separate the parking from the park.
Consider adding a permanent restrooms to replace the portable toilets.
Add drinking fountain.
More on Utilizing the GRASP® Perspectives Different Perspectives can be used to determine levels of service throughout the community from a variety of views. These Perspectives can show a specific set of components, depict estimated travel time to services, highlight a particular geographic area, or display facilities that accommodate specific programming. It is not necessarily beneficial for all parts of the community to score equally in the analyses. The desired level of service for any particular location will depend on the type of service being analyzed and the characteristics of the particular location. Commercial, institutional, and industrial areas might reasonably be expected to have lower levels of service for Parks, Recreation, and Cultural Resources opportunities than residential areas. Levels of service for retail services in high density residential areas should probably be different than those for lower density areas. Each Perspective shows the cumulative levels of service across the study area when the catchment areas for a particular set of components are plotted together. As previously stated, darker shades represent areas in which the level of service is higher for that particular Perspective. It is important to note that the shade overlaying any given point on the Perspective represents the cumulative value offered by the surrounding Parks, Recreation, and Cultural Resources system to an individual situated in that specific location, rather than the service being provided by components at that location to the areas around it.
Used in conjunction with other needs assessment tools (such as needs surveys and a public process), Perspectives can be used to determine if current levels of service are appropriate in a given location. If so, plans can then be developed that provide similar levels of service to new neighborhoods. Conversely, if it is determined that different levels of service are desired, new planning can differ from the existing community patterns to provide the desired LOS.

Parks, Recreation, and Cultural Resources Master Plan 89
V. Great Things to Come – Recommendations & Action Plans The recommendations for this plan are focused around the following areas:
Improve Organizational Creditability and Operational Efficiencies
Improve Financial Situation
Improve Programming and Service Delivery
Improve Facilities and Amenities In the body of the report, there is an in‐depth analysis of each area described above. Immediately following each area are the recommendations (goals, objectives, and action items) that pertain to that subject. A summary of subject areas follows.
A. Identification of Key Issues for Focus
Key issues were identified using a number of tools; review of existing plans and documents, focus groups, stakeholder meetings, a community survey, inventory and level of service analysis, and MindMixer. The information gathered from these sources was evaluated, and the following recommendations and action plans were developed. The findings are summarized on the Key Issues Matrix (Table 11), which captures all of the key issues that surfaced during the Master Plan process and prioritizes them on one matrix. The key issues were placed into four categories on the matrix:
a) Priority b) Opportunity to Improve c) Minor or Future Issue Left blank means the issue did not come up or wasn’t addressed in that venue
The qualitative data planning tools used to determine the priority of key issues include:
1. Existing planning documents 2. Consultant team’s expertise 3. Parks and Recreation staff input 4. Public forum input
The quantitative data planning tools used to determine the priority of the key issues include:
1. Community Survey 2. 2014 Bond Initiatives 3. Facility Assessment and Level of Service Analysis
The key issues were organized into four areas including:
1. Organizational issues 2. Programs and Service Delivery issues 3. Facility and Amenities issues 4. Level of Service issues 5. Finance issues

90 The Town of Wake Forest, North Carolina
Preliminary recommendations are listed for each key issue and presented to the Parks and Recreation project team to gather input on the prioritization of the final recommendations and action plans. The Key Issues Matrix summarizes the areas that need immediate attention and determine the direction of the implementation of recommendations in the Master Plan.

Table 11: Summary of Findings ‐ Key Issues Matrix

92 The Town of Wake Forest, North Carolina
B. Recommendations
Findings of input gathered throughout this process, the qualitative and quantitative data, and the GRASP® LOS analyses provide some guidance when considering how to improve Parks, Recreation, and Cultural Resources opportunities in the Town of Wake Forest. This section describes ways to enhance the level of service and the quality of life through improvement of existing sites, future development of new facilities, organizational enhancements, financial improvements, increased programming, improved safety, and potential partnerships. Note: Any reference to level of service scoring throughout this recommendation discussion relies on walkable level of service analysis. Overall level of service scoring from a driving standpoint was high and thus offered minimal need for improvement. Despite the fact that walkable coverage provided is generally good, an examination of walkable level of service does reveal areas on which to focus improvement efforts.
Improve Organizational Credibility and Operational Efficiencies Enhance and Improve Internal and External Communications The current Town of Wake Forest Marketing Plan needs to be used by the Parks, Recreation, and Cultural Resources Department to create great awareness and should include all of the recommendations in the Master Plan for programs, services, and facility upgrades. The Parks, Recreation, and Cultural Resources Department should partner with the Communications Department and the Public Information Officer to make the best use of the Town’s website and social media outlets. The marketing and communication of Parks, Recreation, and Cultural Resources activities should be enhanced with a focused effort on adopting open lines of communication and meetings with partners and potential partners within the community. Create New Staffing Assignments and/or Hire New Employees for Added Responsibilities The Parks, Recreation, and Cultural Resources Department needs to add staff to the Maintenance Division to meet current and anticipated future demands of new parks, miles of Greenway, and new facilities. The Parks, Recreation, and Cultural Resources Department needs to add staff for facility operations to meet demand for extended hours of operations for current facilities and as new facilities are added to the Town’s inventory. Ensure that staffing resource levels can maintain existing and new facilities at or above acceptable standards as the master plan is implemented.

Parks, Recreation, and Cultural Resources Master Plan 93
Recreational Connectivity – Provide Easier and More Convenient Connections for Users to Parks and Facilities The definition of recreation has evolved in recent years to include aspects of the built environment that are more important today than they were in the past. These days, people are more inclined to integrate recreational opportunities within their daily lives. The infrastructure available to get people to and from destinations is of greater importance than ever before, as more and more people have started to prefer a leisurely walk or bike ride to a trip in the car. People increasingly expect that parks, recreation centers, and other community resources be easy destinations to access for a variety of users employing different modes of travel to include walking and bicycling. This concept of may be referred to as recreational connectivity. Recreational connectivity may be defined as the extent to which community recreational resources are transitionally linked to allow for easy and enjoyable travel between them. In addition to recreational trails, this may also include town sidewalks, bicycle paths, bicycle routes, and public transit infrastructure. Of course, the scope of creating and maintaining such a network is a substantial undertaking that involves many players. Along with a community expectation for this type of user‐friendly network infrastructure comes the expectation that stakeholders work together in the interest of the public good. At the municipal level, this might include public works, law enforcement, private land‐owners, public transit operators, and user groups as well as the local Parks, Recreation, and Cultural Resources Department. This concept of recreational connectivity is important within the scope of Parks, Recreation, and Cultural Resources planning but also has deeper implications for public health, the local economy, and public safety among other considerations. As more and more people look for non‐automotive alternatives to get to and from local destinations, a complete network of various transportation options is in greater demand than ever to include walking trails, bicycle paths, bicycle routes, and public transit. Other elements of this infrastructure might include street/railroad crossings, sidewalk landscaping, lighting, drainage, and even bike‐share and car‐share availability. Many of the residents thought it was very difficult to find local Parks, Recreation, and Cultural Resources amenities based on current signage (both wayfinding and within parks). The Department should conduct a park identification sign inventory and condition assessment and ensure that all parks are clearly and consistently signed as Wake Forest Parks, Recreation, and Cultural Resources facilities. There is also a need to improve directional/wayfinding signage as well as maps to facilities on roadways and within parks. Trail maps with distances and local leisure amenities should also be created and distributed to users. Parks, Recreation, and Cultural Resources should improve partner agency relationships within Wake Forest, the state of North Carolina, and the region to create some positive outcomes of establishing partnerships. Parks, Recreation, and Cultural Resources should work with partners such as the Convention and Visitors Bureau to create a central clearing house (one stop shop) for distribution of Parks, Recreation, and Cultural Resources materials and opportunities. For a Sample Partnership Policy see Appendix E.

94 The Town of Wake Forest, North Carolina
Improve Financial Situations Implement Equitable User Fees and Assessment Fees There is a consensus to implement and utilize equitable user fees and assessment fees for Parks, Recreation, and Cultural Resources activities based on a value received by the participant for the services with a personal benefit. Parks, Recreation, and Cultural Resources should create a Cost Recovery Policy such as the Pyramid Pricing Methodology (Appendix F) to determine a consistent method of pricing Parks, Recreation, and Cultural Resources activities throughout the Department. Consider Increase of Tax Increment Levels The community appears willing to increase tax increment levels to pay for the improvements that come out of this Parks, Recreation, and Cultural Resources Master Plan over the next several years. A campaign for a community investment may be a successful way of implementing the long term recommendations in the Master Plan. Pursue Grant Opportunities It would be wise for Parks, Recreation, and Cultural Resources to pursue any and all grant opportunities at the federal, state, regional, and local levels. There are still numerous grants available to the Town of Wake Forest at all levels to assist in the funding of recommendations made in this Master Plan and continuous operational expenses.
Improve Programs and Service Delivery Increase Programming for Families, Youth, and Teens The public would like to see Parks, Recreation, and Cultural Resources provide additional programs for families, youth, and teenagers in all sectors of the Town. As the Town of Wake Forest updates, improves, or repurposes existing parks, it should take into consideration the demand for additional family, teen, and youth programming opportunities. Other opportunities include adding splash pads in other park locations throughout the Town. Splash pads have a low operational cost and provide a great free neighborhood activity.

Parks, Recreation, and Cultural Resources Master Plan 95
Increase Programs in Wellness/Fitness, Cultural, and Special Needs Parks, Recreation, and Cultural Resources should expand programs in wellness/fitness, cultural, and special needs programs such as Pickleball, arts, dance, exercise, therapeutic recreation, etc. As the Town of Wake Forest updates, improves, or repurposes existing parks, it should take into consideration the demand for wellness/fitness, cultural, special needs programs, and access to water such as kayaking, canoeing, and standup paddle boarding programming opportunities. Parks, Recreation, and Cultural Resources should consider adding loop walks, mileage markers, and fitness course equipment to existing park locations across the community to increase the activity on trails. Increase the Number of Special Events and Festivals The opening of the Wake Forest Renaissance Centre, along with distribution and variety of existing parks and facilities, provides many opportunities to host special events and festivals throughout the community. In addition, strategic use of special events, festivals, and programming may help increase use of some spaces, and therefore, help to promote activities in some lesser used parks. Maintain and Improve Existing Facilities There was an overwhelming public response to make sure that Parks, Recreation, and Cultural Resources maintains and improves existing facilities. Many of these needs may be addressed within the existing system by upgrading facilities, retrofitting less used assets, and by establishing or strengthening partnerships. Parks, Recreation, and Cultural Resources should continue the development of system wide self‐evaluation to identify low scoring assets and amenities and implement a strategy for repair, repurpose, or replacement (see Staff Resource Document for examples of current issues).
Level of Service Improvements Areas of the Town that either fall below the minimum standard threshold or provide no service at all, called low‐service areas and no‐service areas, often provide opportunities for improvement. This might involve fixing up a tired picnic shelter or updating playground structures or safety surfacing. Such efforts to improve level of service are more attainable than alternatives that require land acquisition and large‐scale capital investment. Several such opportunities exist to improve walkable level of service in Wake Forest. Low‐Score Components Maintaining and improving existing facilities was ranked highest in public input with regard to goals for the next 5 to 10 years. Developing a method or process for continued assessment of existing facilities is key to monitoring existing resources. The assessment process used for this plan involves scoring of all included assets. This scoring takes into account condition and functionality. Those components with low‐scores may be addressed one by one and will serve to improve level of service. The easiest and most obvious way to raise level of service is to improve low‐score components – those that were scored down because they do not meet expectations. This entails repair, refurbishment, or replacement of existing components at a site that are in need of some attention.

96 The Town of Wake Forest, North Carolina
Low‐Score Modifiers In scoring inventory locations, additional consideration was also given to basic site amenities, called modifiers. These are mechanisms that support users during their visit such as design and ambience, drinking fountains, seating, BBQ grills, security lighting, bike racks, restrooms, shade, access, and parking, among others. These help inform overall GRASP® scoring. Modifiers that do not meet expectations are scored down, including those that are in need of attention such as repair, refurbishment, or replacement. Booster Components Another way to enhance existing assets is through the addition of booster components intended to “boost” the level of service at specific existing park sites or recreation facilities through their addition. These are most effective in low‐service areas in which park sites already exist that have space for additional components. Based on the isolation analysis that displayed needed areas based on population, several such locations exist. High Demand Components The statistically‐valid survey asked respondents to rank facilities by importance based on those they felt the Town needed to add or improve. These high demand components should be considered in any efforts to add new components to the Wake Forest recreation system. The highest priority for added, expanded, or improved outdoor activities listed by survey respondents are:
1. Completing the Greenways 2. Trails and Connectivity 3. Water Access (River and Lake) 4. Family, Senior, and Teen Programming 5. Large Special Events
Expand Trails and Connectivity Paved and unpaved trails were indicated as one of the most important desired types of facilities or amenities. Completion of the Greenways Trail is one of the keys to fulfilling this public need. Parks, Recreation, and Cultural Resources needs to develop a Greenways Master Plan that includes a recreational trails component with Complete Streets features for further development of the trail system in Wake Forest. The Greenways Recreational connectivity in most American cities usually starts with trails. A trail may be defined as any off‐street or on‐street connection dedicated to pedestrian or bicycle users. Recreational trails, as distinguished from transportation trails, typically pass through park lands or natural areas and can be soft or hard surface. Recreational trails are the only elements of an alternative transit network that traditionally fall to Parks, Recreation, and Cultural Resources professionals. They are intended mostly for leisure and enjoyment of resources. Transportation trails, the sidewalks or paved trails found in street right‐of‐ways in most municipalities, are intended more for utility in getting from one place to another. Yet these two types of town infrastructure must work together to create a well‐connected community. The resulting trail system includes all trails that serve pedestrian and bicycle users in a community for purposes of both recreation and transportation.

Parks, Recreation, and Cultural Resources Master Plan 97
As a trail system matures, the need emerges to address barriers such as roadways, rivers, and railroad crossings that separate distinct trail networks in order to create a truly connected trail system. A trail network is a part of a trail system within which major barrier crossings have been addressed and all trails are connected. Trail networks within a trail system are typically separated from each other by such barriers or by missing trail connections. Crosswalks, pedestrian underpasses, and bridges can be used to help users navigate barriers. New trails may be added to merge trail networks and improve overall connectivity. Most cities have several trail networks that connect users to common destinations such as schools, shops, restaurants, and civic and religious institutions in addition to Parks, Recreation, and Cultural Resources facilities. The more integrated these networks, the more connected a town. Building a trail system involves many considerations beyond the control of Parks, Recreation, and Cultural Resources managers. Vacant lands, utility easements, street right‐of‐ways, and existing social trails may be worth investigating for trail feasibility and to determine how trail development in these areas might impact overall connectivity. However, other departments and agencies will need to be consulted and partnered with to address issues such as land acquisition, street crossings, and utility maintenance. To complicate matters, the distinction between a recreational trail and a transportation trail can be hazy. Further, on‐street connections via usable, comfortable bicycle lanes and routes are also critical to establishing good recreational connectivity. Though these connections can be invaluable to a town’s infrastructure, as they supplement a trail system, they introduce another set of stakeholders and complications. The types of collaboration necessary to build a trail system are not without their challenges, yet can yield lasting partnerships that benefit the community. The sooner the discussion is started, the better. Potential partners can include school districts, public works departments, county offices, state entities, federal agencies, and/or private land owners among others. It is important to convince stakeholders that their cooperation is critical to the public good. It can be helpful to remind them of the economic boost that often results from investment in recreational infrastructure like a trail system. Of course, not all players stand to gain from trail development. It is essential that land managers and planners be aware of all possible implications inherent in their efforts. Wake Forest has potential for an outstanding trail system. Here are a few general strategies to use in planning efforts as this system is established:
Work with a variety of departments, offices, and agencies to obtain assistance and access in creating trail links.
Look for ways to relieve cost burdens for property maintenance presently borne by other utilities by adapting these properties to create recreation opportunities.
Create connections that blend recreation opportunities with restaurants and retail opportunities for greater economic impact.
Create connections that allow safe, comfortable routes between homes, schools, and civic and religious institutions for user convenience.
Look at existing utility areas such as power line easements, drainages, and detention ponds for options to improve connectivity.
Use wide, under‐utilized, or non‐used street corridors for best pedestrian and bike routes within developed parts of the Town.

98 The Town of Wake Forest, North Carolina
Connecting People to Trails As the Wake Forest Greenways system continues to develop, additional resources will be desirable to support users. It may be worthwhile to consider signage and wayfinding strategies, trailheads and access points, public trail maps, and smart phone applications as strategies to connect people to trails and affect a positive user experience. Signage and Wayfinding Signage and wayfinding strategies should be employed to enhance the Wake Forest trail system by promoting ease of use and improved access to recreational resources. An important aspect of effective signage and wayfinding markers is branding. An easily identifiable hierarchy of signage for different types of users assists residents and visitors as they navigate between recreation destinations. Further, a strong brand can imply investment and commitment to alternative transit which can positively impact town identity and open up economic opportunities. Trailheads & Access Points It is also important to provide users access to trails. There are two ways to approach this. First, formal trailheads may be developed to include parking, bike racks, signage, restrooms, drinking water, a trail map, and other amenities. A trailhead is most appropriate to provide access to trails that serve a higher volume of users at destinations reached by automobile. The second approach involves simply providing a trail access point, usually without the extensive amenities found at a trailhead. Trail access points such as this are more appropriate in residential or commercial areas where users are more likely to walk or ride a bicycle to reach the trail. Map & App Resources By making trail maps available, users may enjoy Wake Forest trails with greater confidence and with a better understanding of distances, access points, amenities, and the system as a whole. Even with a developing trail system, such a trail map can provide valuable information to users. For example, the Town of Wake Forest created a bike map (see the following graphic) for the community, which includes various trail types to include bike paths and bike routes. In addition to showing streets with bicycle paths and safe on‐street bike routes, the Wake Forest map also includes information about trail ownership, which is helpful, as it displays some trails within easements or even on private land with use agreements. As the trail system evolves, this map should be updated to produce newer versions for distribution to users. The Town of Wake Forest provides a trail and bicycle map to users with a host of information about trails, bike paths, and bike routes. Another way to provide a trail map to users is through web based smart phone technologies. Maps made available on this type of platform are more dynamic for users, always on hand, and can be easily updated. The upfront investment needed for this type of resource may be cost prohibitive at the present time. However, it is likely that as technologies advance, these costs will become more manageable in the future. It may be worth considering development of web based maps in long term planning decisions.

Parks, Recreation, and Cultural Resources Master Plan 99
Ensure ADA Accessibility at All Facilities ADA Transition Plan and Compliance According to the ADA.gov website, “Access to civic life by people with disabilities is a fundamental goal of the Americans with Disabilities Act (ADA). To ensure that this goal is met, Title II of the ADA requires State and local governments to make their programs and services accessible to persons with disabilities… One important way to ensure that Title II's requirements are being met in cities of all sizes is through self‐evaluation, which is required by the ADA regulations. Self‐evaluation enables local governments to pinpoint the facilities, programs, and services that must be modified or relocated to ensure that local governments are complying with the ADA.” Parks, Recreation, and Cultural Resources needs to develop an ADA Transition Plan which is also required to implement needed changes identified during the self‐evaluation process. Ongoing self‐evaluation and development of a comprehensive transition plan must be a high priority of the Parks, Recreation, and Cultural Resources Department.
Improve Restroom Availability and Maintenance Parks, Recreation, and Cultural Resources should continue to monitor restroom use and vandalism while assessing the need for additional restrooms. The maintenance standards should be elevated where needed to ensure the cleanliness of the restrooms and to keep them vandal free. The restrooms could be open for longer hours to improve customer satisfaction.

100 The Town of Wake Forest, North Carolina
C. Summary Action Plan, Cost Estimates and Prioritization
The following Goals, Objectives, and Action Items for recommendations are drawn from the public input, inventory, level of service analysis, findings feedback, and all information gathered during the master planning process with a primary focus on maintaining, sustaining, and improving Town of Wake Forest parks, open space, cultural resources, and trails. All cost estimates are in 2015 figures. Timeframe to complete is designated as Short‐term (up to 3 years), Mid‐term (3‐6 years), and Long‐term (7‐10 years).
Goal 1: Improve Organizational Credibility and Operational Efficiencies Objective 1.1: Enhance and improve internal and external communication of activities and services
Actions Capital Cost Estimate
Operational Budget Impact
Timeframe to Complete
1.1.a Make use of the Town’s Marketing Plan to improve awareness.
$0 Staff Time Short‐Term
1.1.b Partner with the Communications Department and the Public Information Office to make the best use of the Town’s website and social media outlets.
$0 Staff, Partners Short‐Term
1.1.c Adopt open lines of communications and meetings with partners and potential partners.
$0 Staff Time Short‐Term
Objective 1.2: Create new staffing assignments and/or hire new employees for added responsibilities
1.2.a Add staff to the Maintenance Division to meet current and anticipated future demands.
$0 TBD Short to Mid‐Term
1.2.b Add staff for facility operations to meet demand for extended hours of operations for facilities.
$0 TBD Short‐Term
1.2.c Ensure that staffing resource levels can maintain existing and new facilities at or above acceptable standards as master plan is implemented.
$0 TBD Short to Long‐Term
1.2.d Add staff to the Urban Forestry Division to meet anticipated future demands with development and expansion of the parks and greenways system.
$0 TBD Short to Mid‐Term

Parks, Recreation, and Cultural Resources Master Plan 101
Goal 2: Improve Financial Situations Objective 2.1: Implement equitable user fees
Actions Capital Cost Estimate
Operational Budget Impact
Timeframe to Complete
2.1.a Develop a standardized philosophy for pricing programs and services that reflects the Wake Forest community. An example for developing a pricing philosophy is provided in Appendix F).
$40,000 – $60,000
Staff Time/ Consultant
Short‐Term/ Mid‐Term
Objective 2.2: Pursue grant opportunities
2.2.a Continue to research, submit, and track federal, regional, state, and local grants.
Matching Funds TBD
Staff Time Short‐Term
Objective 2.3: Implement Parks, Recreation, and Greenways Improvements from the 2014 Bond Referendum
2.3.a Develop a plan for the implementation of the Parks, Recreation, and Greenways Improvements from the 2014 Bond Referendum.
$18,800,000 Staff Time Mid‐Term
Objective 2.4: Consider Increase of Tax Increment Levels
2.4.a Campaign for community investment in long term Master Plan implementation.
$0 $0 Short‐Term
Goal 3: Improve Programs and Service Delivery Objective 3.1: Increase programming for families, seniors, and teens
Actions Capital Cost Estimate
Operational Budget Impact
Timeframe to Complete
3.1.a Expand program opportunities for teens, families, and seniors in all locations.
$0 TBD Short‐Term
Objective 3.2: Increase programs in wellness/fitness, cultural, and special needs
3.2.a Expand wellness/fitness, cultural, and special needs programming opportunities.
$0 TBD Short to Mid‐Term
3.2.b As new facilities are developed and constructed, include appropriate spaces for wellness/fitness, cultural, special needs, and aquatic opportunities.
TBD TBD Short to Mid‐Term

102 The Town of Wake Forest, North Carolina
Objective 3.3: Increase number of special events and festivals
Actions Capital Cost Estimate
Operational Budget Impact
Timeframe to Complete
3.3.a Expand neighborhood and community special event and festival opportunities at a variety of locations community wide with an emphasis in the downtown area.
$0 TBD Short‐Term
Objective 3.4: Create greater awareness for and increase participation at the Renaissance Centre
3.4.a Create a 3‐5 year Strategic Plan that focuses on creating awareness and increasing programming, and develop a marketing strategy.
$0 TBD Short‐Term
Objective 3.5: Create greater awareness for the Urban Forestry Division
3.5.a Develop a marketing strategy for the Urban Forestry Division that creates a greater awareness and public interest in the goals and outcomes of the Division.
$0 TBD Short‐Term
3.5.b Develop implementation strategies and educational opportunities for the Urban Forestry Management Plan.
$0 TBD Short‐Term

Parks, Recreation, and Cultural Resources Master Plan 103
Goal 4: Improve Facilities and Amenities Objective 4.1: Maintain and improve existing facilities
Actions Capital Cost Estimate
Operational Budget Impact
Timeframe to Complete
4.1.a Continue to implement maintenance strategies that both sustain and make improvements to existing facilities.
TBD TBD Ongoing
4.1.b Develop a plan to address the recommendations from the inventory as they relate to individual park improvements.
TBD TBD Long‐Term
Objective 4.2: Expand trails & connectivity
4.2.a Complete Greenways System as identified in the 2014 Bond.
$4,600,000 TBD Mid‐Term
4.2.b Explore the development of trail heads at entrance points to the Greenway.
$332,827 TBD Long‐Term
Objective 4.3: Provide new facilities to meet growing demand
4.3.a Explore the opportunity to design and construct a 65,000 square foot Recreation Center in the downtown area that includes a competitive pool, water features, gymnasiums, fitness/wellness space, indoor track, and community space.
$25,653,857 TBD TBD
4.3.b Explore the opportunity to construct a dedicated Pickleball facility that could serve the region as a tournament and league play hub.
$232,186 TBD TBD

THIS PAGE INTENTIONALLY LEFT BLANK

Parks, Recreation, and Cultural Resources Master Plan 105
Appendix A – Community Input Summary
Wake Forest Parks, Recreation, and Cultural Arts Master Plan 9/3: Public Meeting Strengths
Ball programs are excellent.
Senior center.
Addition of Cultural Arts within the Department.
Joyner Park – Trails, stage, pond.
Trails.
Connectivity to trails.
Grown significantly – change at top of P&R, looking at youth and also seniors.
Maintenance. Weaknesses
Not enough tennis courts.
Too many tennis courts – fully lit courts even when not being used.
Not enough Pickleball courts – need more that are not constrained by in school session need more dedicated courts.
How are you distributing info out to community? Not enough communication?
Need to make sure RecConnect goes to all homes.
Need indoor facilities – Flaherty is booked solid.
Yoga/Pilates space.
Need cover over amphitheater at Joyner Park – or performing arts facility?
May need staff for facilities/security?
Parking so that you can use greenways – need accessible sections of parks and parking.
Need parking for events at Joyner Park.
Safety issues with families walking in traffic when parking isn’t available.
Need to be able to walk to parks safely – could have commuter bus. Issues/Gaps
Get partners involved.
Communication to all parts of the City.
Transportation issue – Wake Forest could become a biking community – bikeability/walkability, multi‐modal. P&R should be partners in this.
Parents make kids ride on the sidewalks, but there are no bike lanes.
Mow. Other Partners/opportunities
NE Neighborhood – community organization that feels left out – They have two parks, but often need better representation.
Community service organizations – civic clubs.
Youth groups.
Torc – local mtn. biking clubs.

106 The Town of Wake Forest, North Carolina
Retired professionals.
Need monthly meeting for Principals/Schools and Athletics personnel. Especially Wake Forest High School.
Corporate business partners – could be a recruiting point for businesses. Economic driver and attracting employees. Impact of quality of life.
Host a Dixie Lee BB tournaments – need facilities for tournaments for economic impact.
Joint use agreements with private Ammons family/Great North Wake BB association, came together as non‐profit and could work with them.
IBM is strong on physical activities – partner with them – and get $$. Most Essential Services
Sports for youth – keeps them out of trouble and active, helps solve childhood obesity.
Senior programs.
Multi‐generational activities
Not all kids like sports – dancing, science, math, other offerings.
Lots of seniors who would volunteer with science – partner with businesses.
Language Arts as part of cultural arts?
Do you want to draw in people from around the region.
Cultural arts is now essential – need to be profit centers.
Olympic size swimming pool – for competitive, need more pools, lake, etc.
Maintenance.
5 years
Clean up and shine what we have now, mow the grass, repairs.
Spray parks.
6 more tennis courts – would love to turn this into a sanctioned tournament facility. Would like to see a tennis hub, but if they have to be in Joyner, OK – need 16 total.
Pickleball courts – 38 courts needed now.
Seniors want to see things yesterday – may not be here in 10 years.
Plan for gym in the works? Need a gym – more courts than available now – can’t teach four teams on one court.
Indoor walking track.
Need baseball/soccer – have facilities for CASL.
New park off Rogers Road – 80 acres of natural land, paths, disc golf, exercise trail.
Finishing connectivity of trails.
Need signage for trails and mileage.
Need to have P&R part of planning.
Need to have the services for grandparents of the professionals moving here.
Schools are 7,500 kids above ability to provide for them.
Will need places to put things and staff to maintain.
Need to be integrated with.

Parks, Recreation, and Cultural Resources Master Plan 107
Best Way to be Heard
Yell! ;‐)
Surveys ‐ and seeing the results of the surveys. Can be good if get knowledge of feedback – include in feedback.
Website – is anyone reading it?
TV/Newspaper, emails, volunteer for.
Recreation Advisory Board – could be advertised more often and let people know that they are there and representatives.
Reconnect is now going out to the Our Town list – 27,000 2 x year rather than 8,000 3 x per year.
Need to accurately and aggressively get out the Bond Referendum info.

108 The Town of Wake Forest, North Carolina
PRCR Master Plan – Focus Group Location: Renaissance Centre September 3, 2014 2:00pm Introduction: Ruben Wall Facilitator: Art Thatcher Attendance: 21 Notes taken by: Cathy Gouge Questions asked by community members at after the introduction:
When will this start being implemented?
How will Mind Mixer be presented to the public?
Question #1 Access – easy to parks and facilities.
Joyner Park wonderful example of open space.
Facilities well maintained, open and inviting.
Landscaping is beautiful. Scenery and flowers are good.
Programs provided – summer music concerts at Joyner and a great cross section of programs.
Nice mix of family oriented parks and quiet natural space at Joyner and things to do.
Nice stage at Joyner. Great music and cultural arts.
Renaissance Centre investment in more cultural arts. Cities investment in cultural arts.
Walking trails and greenways you can walk and connect on.
Greenway a major asset. Want to see it expanded.
Good variety of classes and team sports.
Holden Park – park pool hires and trains high school students as lifeguards.
Urban Forestry – great investment, but people don’t know it exists.
In Wake Forest you can see history of the area. Space of the Town reflects that.
Historic buildings at Joyner Park are not found elsewhere.
Question #2 Lack of connectivity of trails.
Don’t have adults working at pool and early closing. Close before Labor Day – no staff. More employability of adults at pool.
Keep facilities open for full season.
Surprised that pool closed early in the season.
Opportunities to connect Joyner Park to northern neighborhoods.
New bike riders do not need to be on streets. Important to have backway access to parks.
Tennis courts – not enough.
Courts fill up so quickly. Capacity for programs and lack of facilities to meet demand.
Things for teenagers to do. No basketball courts or areas to play games. Lack of playground equipment in Joyner Park for young kids.
Improve upon recreation programs for special needs children.
Limited play areas for special needs kids. No fence in Holden Park for special needs kids – they will run out onto street. Need for all inclusive playground. Separate program at Egg Hunt for special needs kids.
New places to play and other indoor sports like table tennis.

Parks, Recreation, and Cultural Resources Master Plan 109
Partnership between county schools and town is week for spaces.
Lack of parking at Joyner Park.
Not able to use school tennis courts.
Holden Park not accessible to kids with special needs.
Another pool needed. Indoor pool needed.
Partnerships – enrichment to educational programs within current facilities: a. Room in centers where laptops can be plugged in so people can work. b. Computer lab for public.
Difficult to get into Holden Park. Not good for strollers.
More bike lanes and sidewalks.
Sidewalks and greenway trails to connect to schools.
Ecological groups look at Joyner Park as a model. More concern needed when moving and taking care of grounds.
Garden Club – partner with town to put forth an effort to plant native plants in town and education.
Programs – educate on gardens.
Hours of operation – facilities are closed on weekends.
Utilize the Wake Forest Reservoir. Horse trails and cross county trails.
Getting word out that the programs exist. Marketing and advertise programs.
Question #3 Completing greenway as a mode of transportation for commuters.
Safety of greenways – phones, parks and facilities. Concealed guns.
Park can stay open longer.
Expand ban on fire arms on greenway.
Not enough activities for teen and tweens. PRCR can help with programs, enrichment, educational and cultural programs.
Henderson community has good programs.
Teen aspect a huge gap.
Events – drop in opportunities, i.e., soccer demonstration economical – $5.00.
Greater drop in opportunities for adults programs – cooking, flower arranging, etc.
Question #4 Essential services. Facilities, parks and maintenance safety.
Provide opportunities for exercises and healthy living – all generations
More leagues on Saturdays and Sundays.
Cultural aspects now available.
Athletics.
Preserving historical culture.
Question #5 More inclusive programs, parks and playgrounds.
Policies more eco‐friendly.
Completing greenways.
Utilize space and expand hours.
Special needs faculties.
Expanding programs.

110 The Town of Wake Forest, North Carolina
More programs that include health and wellness education.
A park that has animals and agricultural programs.
4‐H Club
Improve the communication with public. Increase better avenues for communication.
Indoor pool
Another Rec Center
Frisbee, golf course
Archery
Better parking at parks and around greenways.
Question #6 Wake Forest Garden Club
University – NC State
Seminary
Wake Country Master Gardens
WCPSS – facilities need to be better utilized.
YMCA
Boys and Girls Club
Small Miracle Organization
Wake Tech – Wake Forest branch
Question #7 Website
E‐News Blast
Calling director
Provide link on website comments page where people can leave a comment.

Parks, Recreation, and Cultural Resources Master Plan 111
Appendix B – GRASP® Maps

THIS PAGE INTENTIONALLY LEFT BLANK

Map LegendGF Indoor Facility
Trail
Water_Bodies
Inventory Location
Park
School
Community Center
Public Library
Future Town Land
Extraterritorial Jurisdiction
´0 ½ 1 1½ 2
Miles
Wake Forest Parks, Recreation & Cultural Resources Master Plan
Map Produced For Town of Wake Forest - By The GRASP® TeamThis Map Is Intended For Planning & Discussion Purposes Only
Please Refer To The Project Document For Map DetailsLegend Elements May Vary Slightly In Size, Color And Transparency From Those Shown On Map
GIS Data Sources May Include: Town of Wake Forest, ESRI, GRASP® Team - December 2014Copyright© 2014 Town of Wake Forest, December 2013
Town of Wake Forest
CA
PITA
L BLV
D
LIG
ON
MIL
LR
D
DR CALVIN JONES HWY
ROGERS RD
JON
ES
VILL
ER
D
LOUISBURG RD
WAIT AVE
BURLINGTON MILLS RD
JONES
DAIRYRD
DURANT RD
W Y
OU
NG
ST
LILLIE LILES RD
CAM
PK
AN
AT
AR
D
S M
AIN
ST
PURNELL RD
ROG
ER
SRD
WA
LL
RD
OAK GROVE CHURCH RD
HARRIS RD
WO
AK
AVE
LOUISBURG RD
CA
PITA
LBLVD
RAM
P
CAPITAL
BLVD
FALLS OF NEUSE RD
JENKINS RD
OLD
FALL
SO
FN
EU
SE
RD
CAPITAL BLVD RAM
P
OLD NC 98 HWY
OAKGROVE CHURCH RD
N MAIN
ST
NW
HITE
ST
WOODLANDCHURCH
RD
WAIT AVE
BOLDR
UN
HIL L
RD
GIL
CR
ESTFA
RM
RD
PO
ND
ER
OS
AS
ER
VIC
ER
D
LOU
ISB
UR
YR
D
AV
ER
ET
TE
RD
AVERETTE RD
STA
RR
D
CH
ALK
RD
CH
AL
K R
D
BU
DS
MIT
HR
D
TH
OM
PS
ON
MILL
RD
TH
OM
PS
ON
MIL
LR
D
FO
RE
ST
VIL
LER
D
FOR
ES
TV
ILL
ER
D
J AC
KS
ON
RD
Wake ForestMiddle
Pickleball
AileyYoungPark
J.B.Flaherty
Park
E. CarrollJoyner Park
TaylorStreetPark
Smith CreekSoccerCenter
KiwanisPark
TylerRun Park
H.L.MillerPark
PlummerPark
Reservoir
HeritageHigh Park
R.H.Forrest
Field
DuboisCenter
Wake County
Franklin County
CA
PITA
L BLV
D
DR CALVIN JONES HWY
ROGERS RD
CA
MP
KA
NAT
AR
D
JON
ES
VILLE
RD
DURANT RD
WAIT AVE
BURLINGTON MILLS RD
JO
NESDAIRY
RD
W Y
OU
NG
ST
LILLIE LILES RD
S M
AIN
ST
ROG
ERS
RD
WA
LLR
D
OAK GROVE CHURCH RD
PURNELL RD
HARRIS RD
WO
AK
AVE
LOUISBURG RD
CA
PIT
AL BLVD
RAMP
FALLS OF NEUSE RD
JENKINS RD
OLD
FALL
SO
FN
EU
SE
RD
CAPITAL BLVDRAM
P
OLD NC 98 HWY
OAK GROVE CHURCH RD
N MAIN
ST
CAPI
TAL
BLVD
NW
HITE
ST
WAIT AVE
GIL
CREST
FAR
MR
D
LIG
ON
MIL
L R
D
LIGO
N
MILLRD
PO
ND
ER
OS
AS
ER
VIC
ER
D
LOU
ISB
UR
YR
D
AV
ER
ET
TE
RD
AVERETTE RD
STA
RR
D
CH
ALK
RD
CH
AL
K R
D
BU
DS
MIT
HR
D
TH
OM
PS
ON
MILL
RD
TH
OM
PS
ON
MIL
LR
D
FO
RE
ST
VILL
ER
D
CA
PIT
AL
BLV
DR
AM
P
FOR
ES
TV
ILL
ER
D
JAC
KS
ON
RD
Wake ForestMiddle
Pickleball
AileyYoungPark
J.B.Flaherty
Park
E. CarrollJoyner
Park
TaylorStreetPark
Smith CreekSoccerCenter
KiwanisPark
TylerRun Park
H.L.MillerPark
PlummerPark
Reservoir
R.H.Forrest
Field
HeritageHigh
DuboisCenter
Heat MapLower LOS
Higher LOS
Wake County
Franklin County
Threshold MapNo Service
Below Median Threshold
Above Median Threshold
Map B: Composite Level of Service PerspectiveB


Map LegendGF Indoor Facility
Trail
Water_Bodies
Inventory Location
Park
School
Community Center
Public Library
Future Town Land
Extraterritorial Jurisdiction
´0 ½ 1 1½ 2
Miles
Wake Forest Parks, Recreation & Cultural Resources Master Plan
Map Produced For Town of Wake Forest - By The GRASP® TeamThis Map Is Intended For Planning & Discussion Purposes Only
Please Refer To The Project Document For Map DetailsLegend Elements May Vary Slightly In Size, Color And Transparency From Those Shown On Map
GIS Data Sources May Include: Town of Wake Forest, ESRI, GRASP® Team - December 2014Copyright© 2014 Town of Wake Forest, December 2013
Town of Wake Forest
CA
PITA
L BLV
D
LIG
ON
MIL
LR
D
DR CALVIN JONES HWY
ROGERS RD
JON
ES
VILL
ER
D
LOUISBURG RD
WAIT AVE
BURLINGTON MILLS RD
JONES
DAIRYRD
DURANT RD
W Y
OU
NG
ST
LILLIE LILES RD
CAM
PK
AN
AT
AR
D
S M
AIN
ST
PURNELL RD
ROG
ER
SRD
WA
LL
RD
OAK GROVE CHURCH RD
HARRIS RD
WO
AK
AVE
LOUISBURG RD
CA
PITA
LBLVD
RAM
P
CAPITAL
BLVD
FALLS OF NEUSE RD
JENKINS RD
OLD
FALL
SO
FN
EU
SE
RD
CAPITAL BLVD RAM
P
OLD NC 98 HWY
OAKGROVE CHURCH RD
N MAIN
ST
NW
HITE
ST
WOODLANDCHURCH
RD
WAIT AVE
BOLDR
UN
HIL L
RD
GIL
CR
ESTFA
RM
RD
PO
ND
ER
OS
AS
ER
VIC
ER
D
LOU
ISB
UR
YR
D
AV
ER
ET
TE
RD
AVERETTE RD
STA
RR
D
CH
ALK
RD
CH
AL
K R
D
BU
DS
MIT
HR
D
TH
OM
PS
ON
MILL
RD
TH
OM
PS
ON
MIL
LR
D
FO
RE
ST
VIL
LER
D
FOR
ES
TV
ILL
ER
D
J AC
KS
ON
RD
Wake ForestMiddle
Pickleball
AileyYoungPark
J.B.Flaherty
Park
E. CarrollJoyner Park
TaylorStreetPark
Smith CreekSoccerCenter
KiwanisPark
TylerRun Park
H.L.MillerPark
PlummerPark
Reservoir
HeritageHigh Park
R.H.Forrest
Field
DuboisCenter
Wake County
Franklin County
CA
PITA
L BLV
D
DR CALVIN JONES HWY
ROGERS RD
CA
MP
KA
NAT
AR
D
JON
ES
VILLE
RD
DURANT RD
WAIT AVE
BURLINGTON MILLS RD
JO
NESDAIRY
RD
W Y
OU
NG
ST
LILLIE LILES RD
S M
AIN
ST
ROG
ERS
RD
WA
LLR
D
OAK GROVE CHURCH RD
PURNELL RD
HARRIS RD
WO
AK
AVE
LOUISBURG RD
CA
PIT
AL BLVD
RAMP
FALLS OF NEUSE RD
JENKINS RD
OLD
FALL
SO
FN
EU
SE
RD
CAPITAL BLVDRAM
P
OLD NC 98 HWY
OAK GROVE CHURCH RD
N MAIN
ST
CAPI
TAL
BLVD
NW
HITE
ST
WAIT AVE
GIL
CREST
FAR
MR
D
LIG
ON
MIL
L R
D
LIGO
N
MILLRD
PO
ND
ER
OS
AS
ER
VIC
ER
D
LOU
ISB
UR
YR
D
AV
ER
ET
TE
RD
AVERETTE RD
STA
RR
D
CH
ALK
RD
CH
AL
K R
D
BU
DS
MIT
HR
D
TH
OM
PS
ON
MILL
RD
TH
OM
PS
ON
MIL
LR
D
FO
RE
ST
VILL
ER
D
CA
PIT
AL
BLV
DR
AM
P
FOR
ES
TV
ILL
ER
D
JAC
KS
ON
RD
Wake ForestMiddle
Pickleball
AileyYoungPark
J.B.Flaherty
Park
E. CarrollJoyner
Park
TaylorStreetPark
Smith CreekSoccerCenter
KiwanisPark
TylerRun Park
H.L.MillerPark
PlummerPark
Reservoir
R.H.Forrest
Field
HeritageHigh
DuboisCenter
Heat MapLower LOS
Higher LOS
Wake County
Franklin County
Map C: Walkability Level of Service Perspective
Threshold MapNo Service
Below Median Threshold
Above Median Threshold
C


Map LegendGF Indoor Facility
Trail
Water_Bodies
Inventory Location
Park
School
Community Center
Public Library
Future Town Land
Extraterritorial Jurisdiction
´0 ½ 1 1½ 2
Miles
Wake Forest Parks, Recreation & Cultural Resources Master Plan
Map Produced For Town of Wake Forest - By The GRASP® TeamThis Map Is Intended For Planning & Discussion Purposes Only
Please Refer To The Project Document For Map DetailsLegend Elements May Vary Slightly In Size, Color And Transparency From Those Shown On Map
GIS Data Sources May Include: Town of Wake Forest, ESRI, GRASP® Team - December 2014Copyright© 2014 Town of Wake Forest, December 2013
Town of Wake Forest
CA
PITA
L BLV
D
LIG
ON
MIL
LR
D
DR CALVIN JONES HWY
ROGERS RD
JON
ES
VILL
ER
D
LOUISBURG RD
WAIT AVE
BURLINGTON MILLS RD
JONES
DAIRYRD
DURANT RD
W Y
OU
NG
ST
LILLIE LILES RD
CAM
PK
AN
AT
AR
D
S M
AIN
ST
PURNELL RD
ROG
ER
SRD
WA
LL
RD
OAK GROVE CHURCH RD
HARRIS RD
WO
AK
AVE
LOUISBURG RD
CA
PITA
LBLVD
RAM
P
CAPITAL
BLVD
FALLS OF NEUSE RD
JENKINS RD
OLD
FALL
SO
FN
EU
SE
RD
CAPITAL BLVD RAM
P
OLD NC 98 HWY
OAKGROVE CHURCH RD
N MAIN
ST
NW
HITE
ST
WOODLANDCHURCH
RD
WAIT AVE
BOLDR
UN
HIL L
RD
GIL
CR
ESTFA
RM
RD
PO
ND
ER
OS
AS
ER
VIC
ER
D
LOU
ISB
UR
YR
D
AV
ER
ET
TE
RD
AVERETTE RD
STA
RR
D
CH
ALK
RD
CH
AL
K R
D
BU
DS
MIT
HR
D
TH
OM
PS
ON
MILL
RD
TH
OM
PS
ON
MIL
LR
D
FO
RE
ST
VIL
LER
D
FOR
ES
TV
ILL
ER
D
J AC
KS
ON
RD
Wake ForestMiddle
Pickleball
AileyYoungPark
J.B.Flaherty
Park
E. CarrollJoyner Park
TaylorStreet Park
Smith CreekSoccerCenter
KiwanisPark
TylerRun Park
H.L.MillerPark
PlummerPark
HoldingPark
Reservoir
HeritageHigh Park
DuboisCenter
JoynerPark
Center
AlstonMassenburg
Center
Wake ForestCommunity House
Cottage atOlde MillStream
Flaherty ParkCommunity
Center
Holding ParkLockers and
Concessions
Renaissance Center ArtsAnnex
Northern WakeSenior Center
Wake County
Franklin County
PURNELL RD
CA
PITA
L BLV
D
LIG
ON
MIL
LR
D
DR CALVIN JONES HWY
ROGERS RD
JON
ES
VIL
LER
D
LOUISBURG RD
WAIT AVE
BURLINGTON MILLS RD
JONES
DAIRYRD
DURANT RD
W Y
OU
NG
ST
LILLIE LILES RD
E YO
UN
G S
T
CA
MP
KA
NAT
A R
D
S M
AIN
ST
RO
GER
SRD
WA
LL
RD
OAK GROVE CHURCH RD
HARRIS RD
WO
AK
AVE
PERRY
CR
EE
KR
D
LOUISBURG RD
CA
PITA
L BLVD
RAMP
JENKINS RD
CAPITAL
BLVD
OLD
FALL
SO
FN
EU
SE
RD
CAPITAL BLVD RAM
P
OLD NC 98 HWY
OAK GROVE CHURCH RD
FALLS OF NEUSE RD
N MAIN
ST
JACKJONES
RD
NW
HITE
ST
OLDPEARCERD
WOODLANDCHURCH
RD
WAIT AVE
GIL
CR
ESTFA
RM
RD
PO
ND
ER
OS
AS
ER
VIC
ER
D
LOU
ISB
UR
YR
D
AV
ER
ET
TE
RD
AVERETTERD
STA
RR
D
CH
ALK
RD
CH
AL
K R
D
BU
DS
MIT
HR
D
TH
OM
PS
ON
MILL
RD
TH
OM
PS
ON
MIL
LR
D
FO
RE
ST
VIL
LER
D
FOR
ES
TV
ILL
ER
D
JAC
KS
ON
RD
Wake ForestMiddle
Pickleball
AileyYoungPark
J.B.Flaherty
Park
E. CarrollJoyner Park
TaylorStreet Park
Smith CreekSoccerCenter
KiwanisPark
TylerRun Park
H.L.MillerPark
PlummerPark
HoldingPark
Reservoir
HeritageHigh Park
DuboisCenter
JoynerPark
Center
AlstonMassenburg
Center
Wake ForestCommunity House
Cottage atOlde MillStream
Flaherty ParkCommunity
Center
Holding ParkLockers and
Concessions
Renaissance Center ArtsAnnex
Northern WakeSenior Center
1/3 Mile Access1/3 Mile Indoor Access
One Mile Access1 Mile Indoor Access
Wake County
Franklin County
Map D: Access to Indoor Recreation FacilitiesD


Parks, Recreation, and Cultural Resources Master Plan 119
Appendix C – GRASP® Composite Values Method for Level of Service Analysis
A. GRASP® History and Methodology
GRASP® Glossary Buffer: see catchment area. Catchment area: a circular map overlay that radiates outward in all directions from an asset and represents a reasonable travel distance from the edge of the circle to the asset. Used to indicate access to an asset in a level of service assessment. Component: an amenity such as a playground, picnic shelter, basketball court, or athletic field that allows people to exercise, socialize, and maintain a healthy physical, mental, and social wellbeing. Isolation analysis: an examination on a map of places within a study area that meet specific criteria, often included as part of a level of service assessment. Geo‐Referenced Amenities Standards Process® (GRASP®): a proprietary composite‐values methodology that takes quality and functionality of assets and amenities into account in a level of service assessment. Level of service (LOS): the extent to which a recreation system provides a community access to recreational assets and amenities. Low‐score component: a component given a GRASP® score of “1” or “0” as it fails to meet expectations. Low‐service area: an area of a town that has some GRASP® level of service but falls below the minimum standard threshold for overall level of service. Modifier: a basic site amenity that supports users during a visit to a park or recreation site, to include elements such as restrooms, shade, parking, drinking fountains, seating, BBQ grills, security lighting, and bicycle racks among others. No‐service area: an area of a town with no GRASP® level of service. Perspective: a map or data quantification, such as a table or chart, produced using the GRASP® methodology that helps illustrate how well a community is served by a given set of recreational assets. Radius: see catchment area. Recreational connectivity: the extent to which community recreational resources are transitionally linked to allow for easy and enjoyable travel between them. Recreational trail: a soft or hard surface trail intended mostly for leisure and enjoyment of resources. Typically passes through park lands or natural areas and usually falls to Parks, Recreation, and Cultural Resources professionals for planning and management.

120 The Town of Wake Forest, North Carolina
Service area: all or part of a catchment area ascribed a particular GRASP® score that reflects level of service provided by a particular recreational asset, a set of assets, or an entire recreation system. Threshold: a minimum level of service standard typically determined based on community expectations. Trail: any off‐street or on‐street connection dedicated to pedestrian, bicycle, or other non‐motorized users. Trail network: a part of a greater trail system within which major barrier crossings have been addressed and all trails are functionally connected by such things as crosswalks, pedestrian underpasses, and/or bridges. Typically separated from other trail networks by missing trail connections or by such barriers as roadways, rivers, or railroad tracks. Trail system: all trails in a community that serve pedestrian, bicycle, and alternative transportation users for purposes of both recreation and transportation. Transportation trail: a hard surface trail, such as a town sidewalk, intended mostly for utility in traveling from one place to another in a community or region. Typically runs outside of park lands and is managed by Public Works or other town utility department.
Composite‐Values Level of Service Analysis Methodology Analysis of the existing parks, open space, trails, and recreation systems are often conducted in order to try and determine how the systems are serving the public. A Level of Service (LOS) has been typically defined in Parks, Recreation, and Cultural Resources master plans as the capacity of the various components and facilities that make up the system to meet the needs of the public. This is often expressed in terms of the size or quantity of a given facility per unit of population.
Brief History of Level of Service Analysis In order to help standardize Parks and Recreation planning, universities, agencies and Parks and Recreation professionals have long been looking for ways to benchmark and provide “national standards” for how much acreage, how many ball fields, pools, playgrounds, etc., a community should have. In 1906, the fledgling “Playground Association of America” called for playground space equal to 30 square feet per child. In the 1970s and early 1980s, the first detailed published works on these topics began emerging (Gold, 1973, Lancaster, 1983). In time “rule of thumb” ratios emerged with 10 acres of parklands per thousand population becoming the most widely accepted norm. Other normative guides also have been cited as “traditional standards,” but have been less widely accepted. In 1983, Roger Lancaster compiled a book called Recreation, Park and Open Space Standards and Guidelines that was published by the National Parks and Recreation Association (NRPA). In this publication, Mr. Lancaster centered on a recommendation “that a park system, at minimum, be composed of a core system of parklands, with a total of 6.25 to 10.5 acres of developed open space per 1,000 population.” (Lancaster, 1983, p. 56) The guidelines went further to make recommendations regarding an appropriate mix of park types, sizes, service areas, acreages, and standards regarding the number of available recreational facilities per thousand people. While the book was published by NRPA and the table of standards became widely known as “the NRPA standards,” these standards were never formally adopted for use by NRPA.

Parks, Recreation, and Cultural Resources Master Plan 121
Since that time, various publications have updated and expanded upon possible “standards,” several of which have been published by NRPA. Many of these publications did benchmarking and other normative research to try and determine what an “average LOS” should be. It is important to note that NRPA and the prestigious American Academy for Parks and Recreation Administration, as organizations, have focused in recent years on accreditation standards for agencies, which are less directed toward outputs, outcomes, and performance, and more on planning, organizational structure, and management processes. In essence, the popularly referred to “NRPA standards” for LOS, as such, do not exist. The following table gives some of the more commonly used capacity “standards” today. Commonly Referenced LOS Capacity “Standards”
Activity/ Facility
Recommended Space Requirements
Service Radius and Location Notes
Number of Units per Population
Baseball Official Little League
3.0 to 3.85 acre minimum 1.2 acre minimum
¼ to ½ mile Unlighted part of neighborhood complex; lighted fields part of community complex
1 per 5,000; lighted 1 per 30,000
Basketball Youth High school
2,400 – 3,036 vs. 5,040 – 7,280 s.f.
¼ to ½ mile Usually in school, recreation center or church facility; safe walking or bide access; outdoor courts in neighborhood and community parks, plus active recreation areas in other park settings
1 per 5,000
Football Minimum 1.5 acres
15 – 30 minute travel time Usually part of sports complex in community park or adjacent to school
1 per 20,000
Soccer 1.7 to 2.1 acres 1 to 2 miles Youth soccer on smaller fields adjacent to larger soccer fields or neighborhood parks
1 per 10,000
Softball 1.5 to 2.0 acres ¼ to ½ mile May also be used for youth baseball
1 per 5,000 (if also used for youth baseball)
Swimming Pools
Varies on size of pool & amenities; usually ½ to 2‐acre site
15 – 30 minutes travel time Pools for general community use should be planned for teaching, competitive & recreational purposes with enough depth (3.4m) to accommodate 1m to 3m diving boards; located in community park or school site
1 per 20,000 (pools should accommodate 3% to 5% of total population at a time)
Tennis Minimum of 7,200 s.f. single court area (2 acres per complex
¼ to ½ mile Best in groups of 2 to 4 courts; located in neighborhood community park or near school site
1 court per 2,000
Volleyball Minimum 4,000 s.f.
½ to 1 mile Usually in school, recreation center or church facility; safe walking or bide access; outdoor courts in neighborhood and community parks, plus active recreation areas in other park settings
1 court per 5,000
Total land Acreage
Various types of parks ‐ mini, neighborhood, community, regional, conservation, etc.
10 acres per 1,000

122 The Town of Wake Forest, North Carolina
Sources: David N. Ammons, Municipal Benchmarks ‐ Assessing Local Performance and Establishing Community
Standards, 2nd Ed., 2002 Roger A. Lancaster (Ed.), Recreation, Park and Open Space Standards and Guidelines (Alexandria, VA: National
Recreation and Park Association, 1983), pp. 56‐57. James D. Mertes and James R. Hall, Park, Recreation, Open Space and Greenways Guidelines, (Alexandria, VA:
National Recreation and Park Association, 1996), pp. 94‐103.
In conducting planning work, it is key to realize that the above standards can be valuable when referenced as “norms” for capacity, but are not necessarily the target standards for which a community should strive. Each community is different and there are many varying factors which are not addressed by the standards above. For example:
Does “developed acreage” include golf courses? What about indoor and passive facilities?
What are the standards for skate parks? Ice Arenas? Public Art? Etc.?
What if it’s an urban land‐locked community? What if it’s a small town surrounded by open Federal lands?
What about quality and condition? What if there is a high number of ball fields, but they haven’t been maintained in the last ten years?
And many other questions….
GRASP® (Geo‐Referenced Amenities Standards Program) In order to address these and other relevant questions, a new methodology for determining Level of Service was developed. It is called a composite‐values methodology and has been applied in communities across the nation in recent years to provide a better way of measuring and portraying the service provided by Parks, Recreation, and Cultural Resources systems. Primary research and development on this methodology was funded jointly by GreenPlay, LLC, a management consulting firm for parks, open space and related agencies, Design Concepts, a landscape architecture and planning firm, and Geowest, a spatial information management firm. The trademarked name for the composite‐values methodology process that these three firms use is called GRASP® (Geo‐Referenced Amenities Standards Program). For this methodology, capacity is only part of the LOS equation. Other factors are brought into consideration, including quality, condition, location, comfort, convenience, and ambience. To do this, parks, trails, recreation, and open space are looked at as part of an overall infrastructure for a community made up of various components, such as playgrounds, multi‐purpose fields, passive areas, etc. The ways in which the characteristics listed above affect the amount of service provided by the components of the system are explained in the following text.
Quality – The service provided by anything, whether it is a playground, soccer field, or swimming pool is determined in part by its quality. A playground with a variety of features, such as climbers, slides, and swings provides a higher degree of service than one with nothing but an old teeter‐totter and some “monkey‐bars.”
Condition – The condition of a component within the park system also affects the amount of
service it provides. A playground in disrepair with unsafe equipment does not offer the same service as one in good condition. Similarly, a soccer field with a smooth surface of well‐maintained grass certainly offers a higher degree of service than one that is full of weeds, ruts, and other hazards.

Parks, Recreation, and Cultural Resources Master Plan 123
Location – To be served by something, you need to be able to get to it. The typical park playground is of more service to people who live within easy reach of it than it is to someone living all the way across town. Therefore, service is dependent upon proximity and access.
Comfort – The service provided by a component, such as a playground, is increased by having
amenities such as shade, seating, and a restroom nearby. Comfort enhances the experience of using a component.
Convenience – Convenience encourages people to use a component, which increases the
amount of service that it offers. Easy access and the availability of trash receptacles, bike racks, or nearby parking are examples of conveniences that enhance the service provided by a component.
Ambience – Simple observation will prove that people are drawn to places that “feel” good. This
includes a sense of safety and security, as well as pleasant surroundings, attractive views, and a sense of place. A well‐designed park is preferable to poorly‐designed one, and this enhances the degree of service provided by the components within it.
In this methodology, the geographic location of the component is also recorded. Capacity is still part of the LOS analysis (described below) and the quantity of each component is recorded as well. The methodology uses comfort, convenience, and ambience as characteristics that are part of the context and setting of a component. They are not characteristics of the component itself, but when they exist in proximity to a component they enhance the value of the component.
By combining and analyzing the composite values of each component, it is possible to measure the service provided by a Parks, Recreation, and Cultural Resources system from a variety of perspectives and for any given location. Typically this begins with a decision on “relevant components” for the analysis, collection of an accurate inventory of those components, analysis and then the results are presented in a series of maps and tables that make up the GRASP® analysis of the study area.
Making Justifiable Decisions All of the data generated from the GRASP® evaluation is compiled into an electronic database that is then available and owned by the agency for use in a variety of ways. The database can help keep track of facilities and programs, and can be used to schedule services, maintenance, and the replacement of components. In addition to determining LOS, it can be used to project long‐term capital and life‐cycle costing needs. All portions of the information are in standard available software and can be produced in a variety of ways for future planning or sharing with the public. It is important to note that the GRASP® methodology provides not only accurate LOS and facility inventory information, but also works with and integrates with other tools to help agencies make decisions. It is relatively easy to maintain, updatable, and creates easily understood graphic depictions of issues. Combined with a needs assessment, public and staff involvement, program and financial assessment, GRASP® allows an agency to defensibly make recommendations on priorities for ongoing resource allocations along with capital and operational funding.

THIS PAGE INTENTIONALLY LEFT BLANK

Parks, Recreation, and Cultural Resources Master Plan 125
Appendix D – Sample Sponsorship Policy

THIS PAGE INTENTIONALLY LEFT BLANK

Sample
XX Parks & Recreation Department
Sponsorship Policy
Created for XX by:
211 N. Public Road, Suite 225 Lafayette, CO 80026 Phone: (303) 439‐8369 Fax: (303) 664‐5313
[email protected] www.GreenPlayLLC.com
© 2003, 2008, 2012

© 2003, 2008, 2012 GreenPlay LLC ‐ Sample Parks & Recreation Department –Sample Sponsorship Policy 2
XX Parks & Recreation Department Sponsorship Policy
Introduction The following guidelines in this Sponsorship Policy have been specifically designed for the XX Parks & Recreation Department, while considering that these guidelines may be later adapted and implemented on a city‐wide basis. Some assumptions regarding this policy are: Partnerships for recreation and parks facilities and program development may be
pursued based on the XX Partnership Policy, encouraging the development of partnerships for the benefit of the city, its citizens, and potential partners. Sponsorships are one type of partnership, and one avenue of procurement for alternative funding resources. The Sponsorship Policy may evolve as the needs of new projects and other City departments are incorporated into its usage.
Broad guidelines are offered in this policy primarily to delineate which types of sponsors and approval levels are currently acceptable for the XX Parks & Recreation Department.
The policy should ensure that the definition of potential sponsors may include non‐commercial community organizations (for example: YMCAs and Universities), but does not include a forum for non‐commercial speech or advertising.
Sponsorships are clearly defined and are different from advertisements. Advertisements are one type of benefit that may be offered to a sponsor in exchange for cash or in‐kind sponsorship.
The difference between sponsors and donors must be clarified, as some staff and the public often confuse and misuse these terms.
Structure Part A of this document gives the Sponsorship Policy Part B gives the Levels of Sponsorship Tiers and Benefits Part C provides the vocabulary and Glossary of Sponsorship Terms

© 2003, 2008, 2012 GreenPlay LLC ‐ Sample Parks & Recreation Department –Sample Sponsorship Policy 3
Part A. Sponsorship Policy
XX Parks & Recreation Department I. Purpose In an effort to utilize and maximize the community’s resources, it is in the best interest of the City’s Parks & Recreation Department to create and enhance relationship‐based sponsorships. This may be accomplished by providing local, regional, and national commercial businesses and non‐profit groups a method for becoming involved with the many opportunities provided by the Parks & Recreation Department. The Department delivers quality, life‐enriching activities to the broadest base of the community. This translates into exceptional visibility for sponsors and supporters. It is the goal of the Department to create relationships and partnerships with sponsors for the financial benefit of the Department. Sponsorships vs. Donations It is important to note that there is a difference between a sponsorship and a philanthropic donation. Basically, sponsorships are cash or in‐kind products and services offered by sponsors with the clear expectation that an obligation is created. The recipient is obliged to return something of value to the sponsor. The value is typically public recognition and publicity or advertising highlighting the contribution of the sponsor and/or the sponsor’s name, logo, message, products, or services. The Sponsor usually has clear marketing objectives that they are trying to achieve, including but not limited to the ability to drive sales directly based on the sponsorship, and/or quite often, the right to be the exclusive sponsor in a specific category of sales. The arrangement is typically consummated by a letter of agreement or contractual arrangement that details the particulars of the exchange. In contrast, a donation comes with no restrictions on how the money or in‐kind resources are used. This policy specifically addresses sponsorships, the agreements for the procurement of the resources, and the benefits provided in return for securing those resources. Since donations or gifts come with no restrictions or expected benefits for the donor, a policy is generally not needed.

© 2003, 2008, 2012 GreenPlay LLC ‐ Sample Parks & Recreation Department –Sample Sponsorship Policy 4
II. Guidelines for Acceptable Sponsorships Sponsors should be businesses, non‐profit groups, or individuals that promote mutually beneficial relationships for the Parks & Recreation Department. All potentially sponsored properties (facilities, events, or programs) should be reviewed in terms of creating synergistic working relationships with regard to benefits, community contributions, knowledge, and political sensitivity. All sponsored properties should promote the goals and mission of the Parks & Recreation Department as follows: NEED SPECIFIC MISSION STATEMENT Sample XX Parks & Recreation Mission Statement: NEED SPECIFIC GOALS Sample Goals of the Park & Recreation Department: III. Sponsorship Selection Criteria A. Relationship of Sponsorship to Mission and Goals The first major criterion is the appropriate relationship of a sponsorship to the above outlined Parks & Recreation Department’s Mission and Goals. While objective analysis is ideal, the appropriateness of a relationship may sometimes be necessarily subjective. This policy addresses this necessity by including Approval Levels from various levels of City management staff and elected officials, outlined in Section B, to help assist with decisions involving larger amounts and benefits for sponsorship. The following questions are the major guiding components of this policy and should be addressed prior to soliciting potential sponsors: Is the sponsorship reasonably related to the purpose of the facility or programs as
exemplified by the Mission Statement and Goals of the Department? Will the sponsorship help generate more revenue and/or less cost per participant
than the City can provide without it? What are the real costs, including staff time, for procuring the amount of cash or in‐
kind resources that come with the generation of the sponsorship? Sponsorships which shall NOT be considered are those which: Promote environmental, work, or other practices that, if they took place in the City,
would violate U.S. or state law (i.e., dumping of hazardous waste, exploitation of child labor, etc.), or promote drugs, alcohol, or tobacco, or that constitute violations of law.
Duplicate or mimic the identity or programs of the Parks & Recreation Department or any of its divisions.

© 2003, 2008, 2012 GreenPlay LLC ‐ Sample Parks & Recreation Department –Sample Sponsorship Policy 5
Exploit participants or staff members of the Department. Offer benefits which may violate other accepted policies or the Sign Code. DO YOU
HAVE A SIGN CODE? B. Sponsorship Plan and Approval Levels Each project or program that involves solicitation of Sponsors should, PRIOR to procurement, create a Sponsorship Plan specific to that project or program that is in line with the Sponsorship Levels given in Part B. This plan needs to be approved by the Management Team Members supervising the project and in accordance to City Partnership, Sponsorship, and Sign Code policies. In addition, each sponsorship will need separate approval if they exceed pre‐specified limits. The Approval Levels are outlined below: Under $1,000 The program or project staff may approve this level of
Agreement, with review by their supervising Management Team Member.
$1,001 to $10,000 The Agreement needs approval of a Management Team Member.
$10,001 to $25,000 The Agreement needs approval of the entire Senior Management Team and Department Director.
Over $25,000 The Agreement needs approval of the City Supervisor (the City Supervisor may recommend a City Council or Board of Trustees review).
C. No Non‐Commercial Forum is Permitted This criterion deals with the commercial character of a sponsorship message. The City intends to create a limited forum, focused on advertisements incidental to commercial sponsorships of Parks & Recreation facilities and programs. While non‐commercial community organizations or individuals may wish to sponsor Department activities or facilities for various reasons, no non‐commercial speech is permitted in the limited forum created by this policy. Advertisements incidental to commercial sponsorship must primarily propose a commercial transaction, either directly, through the text, or indirectly, through the association of the sponsor’s name with the commercial transaction of purchasing the commercial goods or services which the sponsor sells. The reasons for this portion of the Policy include: (1) The desirability of avoiding non‐commercial proselytizing of a “captive
audience” of event spectators and participants. (2) The constitutional prohibition on any view‐point related decisions about
permitted advertising coupled with the danger that the City and the Parks & Recreation Department would be associated with advertising anyway.

© 2003, 2008, 2012 GreenPlay LLC ‐ Sample Parks & Recreation Department –Sample Sponsorship Policy 6
(3) The desire of the City to maximize income from sponsorship, weighed against the likelihood that commercial sponsors would be dissuaded from using the same forum commonly used by persons wishing to communicate non‐commercial messages, some of which could be offensive to the public.
(4) The desire of the City to maintain a position of neutrality on political and religious issues.
(5) In the case of religious advertising and political advertising, specific concerns about the danger of “excessive entanglement” with religion (and resultant constitutional violations) and the danger of election campaign law violations, respectively.
Guidelines for calculating the Levels of Sponsorship Tiers and Benefits are provided and outlined in Part B. IV. Additional Guidelines for Implementation A. Equitable Offerings It is important that all sponsorships of equal levels across divisions within Parks & Recreation yield the same value of benefits for potential sponsors. B. Sponsorship Contact Database A designated staff person or representative of the Parks & Recreation Department will keep an updated list of all current sponsors, sponsored activities, and contacts related to sponsorship. Purpose of Maintaining the Database: Limit duplicate solicitations of one sponsor Allow management to make decisions based on most appropriate solicitations and
levels of benefits offered Keep a current list of all Department supporters and contacts Help provide leads for new sponsorships, if appropriate For staff below Management Team level, access to the database will be limited to printouts of listings of names of sponsors and their sponsored events. This limited access will provide information to help limit duplicated solicitations, and will also protect existing sponsor relationships, while allowing the evaluation of future sponsorships to occur at a management level.

© 2003, 2008, 2012 GreenPlay LLC ‐ Sample Parks & Recreation Department –Sample Sponsorship Policy 7
If a potential sponsor is already listed, staff should not pursue a sponsorship without researching the sponsor’s history with the most recently sponsored division. If more than one division wishes to pursue sponsorship by the same company, the Management Team shall make a decision based on several variables, including but not limited to: History of sponsorship, relationships, and types of sponsorship needed. Amount of funding available. Best use of funding based on departmental priorities. C. Sponsorship Committee A committee consisting of the supervisors of each program using sponsorships and other management team designees shall meet twice per year to review the database, exchange current contract samples, and recommend adjusting benefit levels and policy as needed. Changes shall not take effect before approval by the Management Team.

THIS PAGE INTENTIONALLY LEFT BLANK

© 2003, 2008, 2012 GreenPlay LLC ‐ Sample Parks & Recreation Department –Sample Sponsorship Policy 9
Part B. Levels of Sponsorship Tiers and Benefits
The following tiers are presented as a guideline for types of benefits that may be presented as opportunities for potential sponsors. Each sponsorship will most likely need to be individually negotiated. One purpose for these guidelines is to create equity in exchanges across sponsorship arrangements. While for the sake of ease the examples given for levels are based on amount of sponsorship requested, the level of approval needed from City staff is really based on the amount of benefits exchanged for the resources. The levels of approval are necessary because the costs and values for different levels of benefits may vary, depending on the sponsorship. It is important to note that these values may be very different. Sponsors will not typically offer to contribute resources that cost them more than the value of resources that they will gain and, typically, seek at least a 2‐1 return on their investment. Likewise, the City should not pursue sponsorships unless the total value the City receives is greater than its real costs. A hierarchy of Sponsors for events, programs, or facilities with more than one sponsor is listed below from the highest level to the lowest. Not all Levels will necessarily be used in each Sponsorship Plan. Note that the hierarchy is not dependent on specific levels or amounts of sponsorship. Specific levels and amounts should be designed for each property before sponsorships are procured within the approved Sponsorship Plan. Complete definitions of terms are included in Part C.
Hierarchy of Sponsorship Levels (highest to lowest)
Parks and Recreation Department‐Wide Sponsor Facility/Park Title or Primary Sponsor
Event/Program Title or Primary Sponsor Presenting Sponsor (Facility, Event, or Program)
Facility/Park Sponsor Program/Event Sponsor Media Sponsor Official Supplier
Co‐sponsor

© 2003, 2008, 2012 GreenPlay LLC ‐ Sample Parks & Recreation Department –Sample Sponsorship Policy 10
This hierarchy will help decide the amounts to ask various sponsors for, and will determine what levels of benefits to provide. It is important to build flexibility and choice into each level so that sponsors can have the ability to choose options that will best fit their objectives. Note that the benefits listed under each level are examples of value. The listing does not mean that all of the benefits should be offered. It is a menu of options for possible benefits, depending on the circumstances. These are listed primarily as a guideline for maximum benefit values. It is recommended that each project create a project‐specific Sponsorship Plan for approval in advance of Sponsorship procurement, based on the benefits available and the values specific to the project. I. Sponsorship Assets and Related Benefits Inventory
TO BE DETERMINED FOR EACH AGENCY BASED ON OFFERINGS
(PROPERTIES), VALUATION, AND DETERMINED BENEFITS
A tiered structure of actual values and approval levels should be determined as part of a Sponsorship Plan.

© 2003, 2008, 2012 GreenPlay LLC ‐ Sample Parks & Recreation Department –Sample Sponsorship Policy 11
Part C. Glossary of Sponsorship Terms
Activation The marketing activity a company conducts to promote its sponsorship. Money spent on activation is over and above the rights fee paid to the sponsored property. Also known as leverage.
Advertising The direct sale of print or some other types of City communication medium to provide access to a select target market.
Ambush Marketing A promotional strategy whereby a non‐sponsor attempts to capitalize on the popularity/prestige of a property by giving the false impression that it is a sponsor. Often employed by the competitors of a property’s official sponsors.
Audio Mention The mention of a sponsor during a TV or radio broadcast.
Business‐to‐Business Sponsorship Programs intended to influence corporate purchase/awareness, as opposed to individual consumers.
Category Exclusivity The right of a sponsor to be the only company within its product or service category associated with the sponsored property.
Cause Marketing Promotional strategy that links a company’s sales campaign directly to a non‐profit organization. Generally includes an offer by the sponsor to make a donation to the cause with purchase of its product or service. Unlike philanthropy, money spent on cause marketing is a business expense, not a donation, and is expected to show a return on investment.
Co‐sponsors Sponsors of the same property.
CPM (Cost per Thousand) The cost to deliver an ad message to a thousand people.
Cross‐Promotions A joint marketing effort conducted by two or more co‐sponsors using the sponsored property as the central theme.

© 2003, 2008, 2012 GreenPlay LLC ‐ Sample Parks & Recreation Department –Sample Sponsorship Policy 12
Donations Cash or in‐kind gifts that do not include any additional negotiated conditions in return. Synonyms: Philanthropy, Patronage.
Editorial Coverage Exposure that is generated by media coverage of the sponsored property that includes mention of the sponsor.
Emblem A graphic symbol unique to a property. Also called a mark.
Escalator An annual percentage increase built into the sponsorship fee for multi‐year contracts. Escalators are typically tied to inflation.
Exclusive Rights A company pays a premium or provides economic benefit in exchange for the right to be the sole advertised provider, at the most competitive prices, of goods purchased by consumers within Parks & Recreation Department facilities and parks.
Fulfillment The delivery of benefits promised to the sponsor in the contract.
Hospitality Hosting key customers, clients, government officials, employees, and other VIPs at an event or facility. Usually involves tickets, parking, dining, and other amenities, often in a specially designated area, and may include interaction with athletes.
In‐Kind Sponsorship Payment (full or partial) of sponsorship fee in goods or services rather than cash.
Licensed Merchandise Goods produced by a manufacturer (the licensee) who has obtained a license to produce and distribute the official Marks on products such as clothing and souvenirs.
Licensee Manufacturer which has obtained a license to produce and distribute Licensed Merchandise.
Licensing Right to use a property’s logos and terminology on products for retail sale. Note: While a sponsor will typically receive the right to include a property’s marks on its packaging and advertising, sponsors are not automatically licensees.
Mark Any official visual representation of a property, including emblems and mascots.

© 2003, 2008, 2012 GreenPlay LLC ‐ Sample Parks & Recreation Department –Sample Sponsorship Policy 13
Mascot A graphic illustration of a character, usually a cartoon figure, used to promote the identity of a property.
Media Equivalencies Measuring the exposure value of a sponsorship by adding up all the coverage it generated and calculating what it would have cost to buy a like amount of ad time or space in those outlets based on media rate cards.
Media Sponsor TV and radio stations, print media, and outdoor advertising companies that provide either cash, or more frequently advertising time or space, to a property in exchange for official designation.
Municipal Marketing Promotional strategy linking a company to community services and activities (sponsorship of parks and recreation programs, libraries, etc.)
Option to Renew Contractual right to renew a sponsorship on specified terms.
Philanthropy Support for a non‐profit property where no commercial advantage is expected. Synonym: Patronage.
Perimeter Advertising Stationary advertising around the perimeter of an arena or event site, often reserved for sponsors.
Premiums Souvenir merchandise, produced to promote a sponsor’s involvement with a property (customized with the names/logos of the sponsor and the property).
Presenting Sponsor The sponsor that has its name presented just below that of the sponsored property. In presenting arrangements, the event/facility name and the sponsor name are not fully integrated since the word(s) “presents” or “presented by” always come between them.
Primary Sponsor The sponsor paying the largest fee and receiving the most prominent identification (Would be naming rights or title sponsor if sponsored property sold name or title).
Property A unique, commercially exploitable entity (could be a facility, site, event, or program) Synonyms: sponsee, rightsholder, seller.

© 2003, 2008, 2012 GreenPlay LLC ‐ Sample Parks & Recreation Department –Sample Sponsorship Policy 14
Right of First Refusal Contractual right granting a sponsor the right to match any offer the property receives during a specific period of time in the sponsor’s product category.
Selling Rights The ability of a sponsor to earn back some or all of its sponsorship fee selling its product or service to the property or its attendees or members.
Signage Banners, billboards, electronic messages, decals, etc., displayed on‐site and containing sponsors ID.
Sole Sponsor A company that has paid to be the only sponsor of a property.
Sponsee A property available for sponsorship.
Sponsor An entity that pays a property for the right to promote itself and its products or services in association with the property.
Sponsor ID Visual and audio recognition of sponsor in property’s publications and advertising; public‐address and on‐air broadcast mentions.
Sponsorship The relationship between a sponsor and a property, in which the sponsor pays a cash or in‐kind fee in return for access to the commercial potential associated with the property.
Sponsorship Agency A firm which specializes in advising on, managing, brokering, or organizing sponsored properties. The agency may be employed by either the sponsor or property.
Sponsorship Fee Payment made by a sponsor to a property.
Sports Marketing Promotional strategy linking a company to sports (sponsorship of competitions, teams, leagues, etc.).
Supplier Official provider of goods or services in exchange for designated recognition. This level is below official sponsor, and the benefits provided are limited accordingly.
Title Sponsor The sponsor that has its name incorporated into the name of the sponsored property.

© 2003, 2008, 2012 GreenPlay LLC ‐ Sample Parks & Recreation Department –Sample Sponsorship Policy 15
Venue Marketing Promotional strategy linking a sponsor to a physical site (sponsorship of stadiums, arenas, auditoriums, amphitheaters, racetracks, fairgrounds, etc.)
Web Sponsorship The purchase (in cash or trade) of the right to utilize the commercial potential associated with a site on the World Wide Web, including integrated relationship building and branding.

THIS PAGE INTENTIONALLY LEFT BLANK

Parks, Recreation, and Cultural Resources Master Plan 143
Appendix E – Sample Partnership Policy

THIS PAGE INTENTIONALLY LEFT BLANK

Sample
Partnership Policy and
Proposal Format
Created By:
www.greenplayllc.com 211 N. Public Road, Suite 225
Lafayette, CO 80026 Phone: 303‐439‐8369 Fax: 303‐664‐5313
Email: [email protected] www.greenplayllc.com
© 2003, 2008, 2012 GreenPlay LLC

Sample Partnership Policy – ©2003, 2008, 2012 GreenPlay LLC Page 2
Sample Parks and Recreation Department Partnership Policy
And Proposal Format
Table of Contents Part One Page I. The Sample Parks and Recreation Department
Partnership Policy A. Purpose 3 B. Background and Assumptions 4 C. Partnership Definition 5 D. Possible Types of Partners 6 E. Sponsorships 7 F. Limited Decision‐Making Partnerships 8 G. Benefits of Partnerships 8
II. The Partnering Process 9 III. The Partnership Evaluation Process A. Mission and Goals 13 B. Other Considerations 13 C. Selection Criteria 15 D. Additional Assistance 16 Part Two The “Proposed Partnership Outline Format” 17

Sample Partnership Policy – ©2003, 2008, 2012 GreenPlay LLC Page 3
I. Sample Parks and Recreation Department Partnership Policy A. Purpose This policy is designed to guide the process for XX Parks and Recreation Department in their desire to partner with private, non‐profit, or other governmental entities for the development, design, construction, and operation of possibly partnered recreational facilities and/or programs that may occur on City property. The XX Parks and Recreation Department would like to identify for‐profit, non‐profit, and governmental entities that are interested in proposing to partner with the City to develop recreational facilities and/or programs. A major component in exploring any potential partnership will be to identify additional collaborating partners that may help provide a synergistic working relationship in terms of resources, community contributions, knowledge, and political sensitivity. These partnerships should be mutually beneficial for all proposing partners including the City, and particularly beneficial for the citizens of the community. This policy document is designed to: • Provide essential background information. • Provide parameters for gathering information regarding the needs and contributions of
potential partners. • Identify how the partnerships will benefit the Sample Parks and Recreation Department and
the community. Part Two: The “Proposed Partnership Outline Format,” provides a format that is intended to help guide Proposing Partners in creating a proposal for review by Sample Parks and Recreation Department staff.

Sample Partnership Policy – ©2003, 2008, 2012 GreenPlay LLC Page 4
B. Background and Assumptions Partnerships are being used across the nation by governmental agencies in order to utilize additional resources for their community’s benefit. Examples of partnerships abound, and encompass a broad spectrum of agreements and implementation. The most commonly described partnership is between a public and a private entity, but partnerships also occur between public entities and non‐profit organizations and/or other governmental agencies.
Note on Privatization: This application is specific for proposed partnering for new facilities or programs. This information does not intend to address the issue of privatization, or transferring existing City functions to a non‐City entity for improved efficiency and/or competitive cost concerns. An example of privatization would be a contract for a landscaping company to provide mowing services in a park. The City is always open to suggestions for improving services and cost savings through contractual arrangements. If you have an idea for privatization of current City functions, please call or outline your ideas in a letter for the City’s consideration.
In order for partnerships to be successful, research has shown that the following elements should be in place prior to partnership procurement: There must be support for the concept and process of partnering from the very highest
organizational level – i.e.: the Board or Trustees, a council, and/or department head. The most successful agencies have high‐ranking officials that believe that they owe it to
their citizens to explore partnering opportunities whenever presented, those communities both solicit partners and consider partnering requests brought to them.
It is very important to have a Partnership Policy in place before partner procurement
begins. This allows the agency to be proactive rather than reactive when presented with a partnership opportunity. It also sets a “level playing field” for all potential partners, so that they can know and understand in advance the parameters and selection criteria for a proposed partnership.
A partnership policy and process should set development priorities and incorporate
multiple points for go/no‐go decisions. The partnership creation process should be a public process, with both Partners and the
Partnering Agency well aware in advance of the upcoming steps.

Sample Partnership Policy – ©2003, 2008, 2012 GreenPlay LLC Page 5
C. Partnership Definition For purposes of this document and policy, a Proposed Partnership is defined as: "An identified idea or concept involving Sample Parks and Recreation Department and for‐profit, non‐profit, and/or governmental entities, outlining the application of combined resources to develop facilities, programs, and/or amenities for the City and its citizens." A partnership is a cooperative venture between two or more parties with a common goal, who combine complementary resources to establish a mutual direction or complete a mutually beneficial project. Partnerships can be facility‐based or program‐specific. The main goal for XX Parks and Recreation Department partnerships is enhancing public offerings to meet the mission and goals of the City. The XX Parks and Recreation Department is interested in promoting partnerships which involve cooperation among many partners, bringing resources together to accomplish goals in a synergistic manner. Proposals that incorporate such collaborative efforts will receive priority status. Partnerships can accomplish tasks with limited resources, respond to compelling issues, encourage cooperative interaction and conflict resolution, involve outside interests, and serve as an education and outreach tool. Partnerships broaden ownership in various projects and increase public support for community recreation goals. Partners often have flexibility to obtain and invest resources/dollars on products or activities where municipal government may be limited. Partnerships can take the form of (1) cash gifts and donor programs, (2) improved access to alternative funding, (3) property investments, (4) charitable trust funds, (5) labor, (6) materials, (7) equipment, (8) sponsorships, (9) technical skills and/or management skills, and other forms of value. The effective use of volunteers also can figure significantly into developing partnerships. Some partnerships involve active decision making, while in others, certain partners take a more passive role. The following schematic shows the types of possible partnerships discussed in this policy:
Types of Partnerships
Active Partnerships Management Agreements
Program Partnerships Facility Leases
Intergovernmental Agreements (IGAs)
Semi‐Limited Decision Making Partnerships
Sponsorships
Limited Decision Making Partnerships
Grant Programs Donor Programs
Volunteer Programs

Sample Partnership Policy – ©2003, 2008, 2012 GreenPlay LLC Page 6
D. Possible Types of Active Partnerships The XX Parks and Recreation Department is interested in promoting collaborative partnerships among multiple community organizations. Types of agreements for Proposed “Active” Partnerships may include leases, contracts, sponsorship agreements, marketing agreements, management agreements, joint‐use agreements, inter‐governmental agreements, or a combination of these. An innovative and mutually beneficial partnership that does not fit into any of the following categories may also be considered. Proposed partnerships will be considered for facility, service, operations, and/or program development including associated needs, such as parking, paving, fencing, drainage systems, signage, outdoor restrooms, lighting, utility infrastructure, etc. The following examples are provided only to illustrate possible types of partnerships. They are not necessarily examples that would be approved and/or implemented. Examples of Public/Private Partnerships A private business seeing the need for more/different community fitness and wellness
activities wants to build a facility on City land, negotiate a management contract, provide the needed programs, and make a profit.
A private group interested in environmental conservation obtains a grant from a foundation
to build an educational kiosk, providing all materials and labor, and is in need of a spot to place it.
Several neighboring businesses see the need for a place for their employees to work out
during the work day. They group together to fund initial facilities and an operating subsidy and give the facility to the City to operate for additional public users.
A biking club wants to fund the building of a race course through a park. The races would be
held one night per week, but otherwise the path would be open for public biking and in‐line skating.
A large corporate community relations office wants to provide a skatepark, but doesn't
want to run it. They give a check to the City in exchange for publicizing their underwriting of the park's cost.
A private restaurant operator sees the need for a concessions stand in a park and funds the
building of one, operates it, and provides a share of revenue back to the City. A garden club wants land to build unique butterfly gardens. They will tend the gardens and
just need a location and irrigation water.

Sample Partnership Policy – ©2003, 2008, 2012 GreenPlay LLC Page 7
Examples of Public/Non‐Profit Partnerships A group of participants for a particular sport or hobby sees a need for more playing space
and forms a non‐profit entity to raise funds for a facility for their priority use that is open to the public during other hours.
A non‐profit baseball association needs fields for community programs and wants to obtain
grants for the building of the fields. They would get priority use of the fields, which would be open for the City to schedule use during other times.
A museum funds and constructs a new building, dedicating some space and time for
community meetings and paying a portion of revenues to the City to lease its land. Examples of Public/Public Partnerships Two governmental entities contribute financially to the development and construction of a
recreational facility to serve residents of both entities. One entity, through an IGA, is responsible for the operation of the facility, while the other entity contributes operating subsidy through a formula based on population or some other appropriate factor.
Two governmental public safety agencies see the need for more physical training space for
their employees. They jointly build a gym adjacent to City facilities to share for their training during the day. The gyms would be open for the City to schedule for other users at night.
A school district sees the need for a climbing wall for their athletes. The district funds the
wall and subsidizes operating costs, and the City manages and maintains the wall to provide public use during non‐school hours.
A university needs meeting rooms. They fund a multi‐use building on City land that can be
used for City community programs at night. E. Sponsorships The XX Parks and Recreation Department is interested in actively procuring sponsorships for facilities and programs as one type of beneficial partnership. Please see the Sample Parks and Recreation Department Sponsorship Policy for more information.

Sample Partnership Policy – ©2003, 2008, 2012 GreenPlay LLC Page 8
F. Limited‐Decision Making Partnerships: Donor, Volunteer, and Granting Programs While this policy document focuses on the parameters for more active types of partnerships, the City is interested in, and will be happy to discuss, a proposal for any of these types of partnerships, and may create specific plans for such in the future. G. Benefits of Partnerships with Sample Parks and Recreation Department The City expects that any Proposed Partnership will have benefits for all involved parties. Some general expected benefits are: Benefits for the City and the Community: Merging of resources to create a higher level of service and facility availability for
community members. Making alternative funding sources available for public community amenities. Tapping into the dynamic and entrepreneurial traits of private industry. Delivering services and facilities more efficiently by allowing for collaborative business
solutions to public organizational challenges. Meeting the needs of specific groups of users through the availability of land for
development and community use. Benefits for the Partners: Land and/or facility availability at a subsidized level for specific facility and/or program
needs. Sharing of the risk with an established stable governmental entity. Becoming part of a larger network of support for management and promotion of facilities
and programs. Availability of professional City recreation and planning experts to maximize the facilities
and programs that may result. Availability of City staff facilitation to help streamline the planning and operational efforts.

Sample Partnership Policy – ©2003, 2008, 2012 GreenPlay LLC Page 9
II. The Partnering Process The steps for creation of a partnership with the XX Parks and Recreation Department are as follows: A. XX Parks and Recreation Department will create a public notification process that will help
inform any and all interested partners of the availability of partnerships with the City. This will be done through notification in area newspapers, listing in the brochure, or through any other notification method that is feasible.
B. The proposing partner takes the first step to propose partnering with the City. To help in
reviewing both the partnerships proposed, and the project to be developed in partnership, the City asks for a Preliminary Proposal according to a specific format as outlined in Part Two ‐ Proposed Partnership Outline Format.
C. If initial review of a Preliminary Proposal yields interest and appears to be mutually
beneficial based on the City Mission and Goals, and the Selection Criteria, a City staff member or appointed representative will be assigned to work with potential partners.
D. The City representative is available to answer questions related to the creation of an initial
proposal, and after initial interest has been indicated, will work with the proposing partner to create a checklist of what actions need to take place next. Each project will have distinctive planning, design, review, and support issues. The City representative will facilitate the process of determining how the partnership will address these issues. This representative can also facilitate approvals and input from any involved City departments, providing guidance for the partners as to necessary steps.
E. An additional focus at this point will be determining whether this project is appropriate for
additional collaborative partnering, and whether this project should prompt the City to seek a Request for Proposal (RFP) from competing/collaborating organizations.
Request for Proposal (RFP) Trigger: In order to reduce concerns of unfair private competition, if a proposed project involves partnering with a private "for‐profit" entity and a dollar amount greater than $5,000, and the City has not already undergone a public process for solicitation of that particular type of partnership, the City will request Partnership Proposals from other interested private entities for identical and/or complementary facilities, programs, or services. A selection of appropriate partners will be part of the process.

Sample Partnership Policy – ©2003, 2008, 2012 GreenPlay LLC Page 10
F. For most projects, a Formal Proposal from the partners for their desired development project will need to be presented for the City’s official development review processes and approvals. The project may require approval by the Legal, Planning, Fire and Safety, Finance, and/or other City Departments, Parks and Recreation Advisory Board, Planning Board, The Board of Trustees, and/or the City Supervisor’s Office, depending on project complexity and applicable City Charter provisions, ordinances or regulations. If these reviews are necessary, provision to reimburse the City for its costs incurred in having a representative facilitate the partnered project’s passage through Development Review should be included in the partnership proposal.
G. Depending on project complexity and anticipated benefits, responsibilities for all action
points are negotiable, within the framework established by law, to ensure the most efficient and mutually beneficial outcome. Some projects may require that all technical and professional expertise and staff resources come from outside the City’s staff, while some projects may proceed most efficiently if the City contributes staff resources to the partnership.
H. The partnership must cover the costs the partnership incurs, regardless of how the
partnered project is staffed, and reflect those costs in its project proposal and budget. The proposal for the partnered project should also discuss how staffing and expertise will be provided, and what documents will be produced. If City staff resources are to be used by the partnership, those costs should be allocated to the partnered project and charged to it.
I. Specific Partnership Agreements appropriate to the project will be drafted jointly. There is
no specifically prescribed format for Partnership Agreements, which may take any of several forms depending on what will accomplish the desired relationships among partners. The agreements may be in the form of: Lease Agreements Management and/or Operating Agreements Maintenance Agreements Intergovernmental Agreements (IGAs) Or a combination of these and/or other appropriate agreements
Proposed partnership agreements might include oversight of the development of the partnership, concept plans and project master plans, environmental assessments, architectural designs, development and design review, project management, and construction documents, inspections, contracting, monitoring, etc. Provision to fund the costs and for reimbursing the City for its costs incurred in creating the partnership, facilitating the project’s passage through the Development Review Processes, and completing the required documents should be considered.

Sample Partnership Policy – ©2003, 2008, 2012 GreenPlay LLC Page 11
J. If all is approved, the Partnership begins. The City is committed to upholding its responsibilities to Partners from the initiation through the continuation of a partnership. Evaluation will be an integral component of all Partnerships. The agreements should outline who is responsible for evaluation and what types of measures will be used, and should detail what will occur should the evaluations reveal Partners are not meeting their Partnership obligations.

THIS PAGE INTENTIONALLY LEFT BLANK

Sample Partnership Policy – ©2003, 2008, 2012 GreenPlay LLC Page 13
III. The Partnership Evaluation Process A. Mission Statements and Goals All partnerships with Sample Parks and Recreation Department should be in accord with the City’s and the Parks and Recreation Department’s Mission and Goals to indicate how a proposed partnership for that Department would be preliminarily evaluated.
SAMPLE MISSION STATEMENT
The XX Parks and Recreation Department will provide a variety of parks, recreation facilities, and program experiences equitably throughout the community. Programs will be developed and maintained to the highest quality, ensuring a safe environment with exceptional service
while developing a lifetime customer. Services will demonstrate a positive economic investment through partnerships with other service providers, both public and private, ensuring
a high quality of life for citizens of XX. (Sample) GOALS –
Promote physical and mental health and fitness Nourish the development of children and youth Help to build strong communities and neighborhoods Promote environmental stewardship Provide beautiful, safe, and functional parks and facilities that improve the lives of all
citizens Preserve cultural and historic features within the City’s parks and recreation systems Provide a work environment for the Parks & Recreation Department staff that encourages
initiative, professional development, high morale, productivity, teamwork, innovation, and excellence in management
B. Other Considerations 1. Costs for the Proposal Approval Process For most proposed partnerships, there will be considerable staff time spent on the review and approval process once a project passes the initial review stage. This time includes discussions with Proposing Partners, exploration of synergistic partnering opportunities, possible RFP processes, facilitation of the approval process, assistance in writing and negotiating agreements, contracting, etc. There may also be costs for construction and planning documents, design work, and related needs and development review processes mandated by City ordinances.

Sample Partnership Policy – ©2003, 2008, 2012 GreenPlay LLC Page 14
Successful Partnerships will take these costs into account and may plan for City recovery of some or all of these costs within the proposal framework. Some of these costs could be considered as construction expenses, reimbursed through a negotiated agreement once operations begin, or covered through some other creative means. 2. Land Use and/or Site Improvements Some proposed partnerships may include facility and/or land use. Necessary site improvements cannot be automatically assumed. Costs and responsibility for these improvements should be considered in any Proposal. Some of the general and usual needs for public facilities that may not be included as City contributions and may need to be negotiated for a project include: Any facilities or non‐existent
infrastructure construction Outdoor restrooms Water fountains
Roads or street improvements Complementary uses of the site Maintenance to specified standards Staffing Parking
Utility improvements (phone, cable, storm drainage, electricity, water, gas, sewer, etc.)
Snow removal Custodial services Lighting Trash removal 3. Need The nature of provision of public services determines that certain activities will have a higher need than others. Some activities serve a relatively small number of users and have a high facility cost. Others serve a large number of users and are widely available from the private sector because they are profitable. The determination of need for facilities and programs is an ongoing discussion in public provision of programs and amenities. The project will be evaluated based on how the project fulfills a public need. 4. Funding Only when a Partnership Proposal demonstrates high unmet needs and high benefits for City citizens, will the City consider contributing resources to a project. The City recommends that Proposing Partners consider sources of potential funding. The more successful partnerships will have funding secured in advance. In most cases, Proposing Partners should consider funding and cash flow for initial capital development, staffing, and ongoing operation and maintenance. The details of approved and pending funding sources should be clearly identified in a proposal. For many partners, especially small private user groups, non‐profit groups, and governmental agencies, cash resources may be a limiting factor in the proposal. It may be a necessity for partners to utilize alternative funding sources for resources to complete a proposed project. Obtaining alternative funding often demands creativity, ingenuity, and persistence, but many forms of funding are available.

Sample Partnership Policy – ©2003, 2008, 2012 GreenPlay LLC Page 15
Alternative funding can come from many sources, e.g. Sponsorships, Grants, and Donor Programs. A local librarian and/or internet searches can help with foundation and grant resources. Developing a solid leadership team for a partnering organization will help find funding sources. In‐kind contributions can, in some cases, add additional funding. All plans for using alternative funding should be clearly identified. The City has an established Sponsorship Policy, and partnered projects will be expected to adhere to the Policy. This includes the necessity of having an Approved Sponsorship Plan in place prior to procurement of sponsorships for a Partnered Project. C. Selection Criteria In assessing a partnership opportunity to provide facilities and services, the City will consider (as appropriate) the following criteria. The Proposed Partnership Outline Format in Part Two provides a structure to use in creating a proposal. City staff and representatives will make an evaluation by attempting to answer each of the following Guiding Questions. How does the project align with the City and affected Department’s Mission Statement and
Goals? How does the proposed facility fit into the current City and the affected Department’s
Master Plan? How does the facility/program meet the needs of City residents? How will the project generate more revenue and/or less cost per participant than the City
can provide with its own staff or facilities? What are the alternatives that currently exist, or have been considered, to serve the users
identified in this project? How much of the existing need is now being met within the City borders and within
adjacent cities? What is the number and demographic profile of participants who will be served? How can the proposing partner assure the City of the long‐term stability of the proposed
partnership, both for operations and for maintenance standards? How will the partnered project meet the Americans with Disabilities Act (ADA) and Equal
Employment Opportunity Commission (EEOC) requirements? How will the organization offer programs at reasonable and competitive costs for
participants What are the overall benefits for both the City and the Proposing Partners?

Sample Partnership Policy – ©2003, 2008, 2012 GreenPlay LLC Page 16
D. Additional Assistance The XX Parks and Recreation Department is aware that the partnership process does entail a great deal of background work on the part of the Proposing Partner. The following list of resources may be helpful in preparing a proposal: Courses are available through local colleges and universities to help organizations develop
a business plan and/or operational pro‐formas. The Chamber of Commerce offers a variety of courses and assistance for business owners
and for those contemplating starting new ventures. There are consultants who specialize in facilitating these types of partnerships. For one
example, contact GreenPlay LLC at 303‐439‐8369 or [email protected].
Reference Librarians at libraries and internet searches can be very helpful in identifying possible funding sources and partners, including grants, foundations, financing, etc.
Relevant information including the City of XX Comprehensive Plan, the Parks and
Recreation Master Plan, site maps, and other documents are available at the _______. These documents may be copied or reviewed, but may not be taken off‐site.
The XX Parks and Recreation Department Web Site (www.XXXX.com) has additional
information. If additional help or information is needed, please call 000‐000‐0000.

Sample Partnership Policy – ©2003, 2008, 2012 GreenPlay LLC Page 17
Part Two
Sample Proposed Partnership Outline Format Please provide as much information as possible in the following outline form. I. Description of Proposing Organization:
Name of Organization Years in Business Contact Name, Mailing
Address, Physical Address, Phone, Fax, Email
Purpose of Organization Services
Provided/Member/User/Customer Profiles
Accomplishments Legal Status
II. Decision Making Authority Who is authorized to negotiate on behalf of the organization? Who or what group (i.e. Council/Commission/Board) is the final decision maker and can authorize the funding commitment? What is the timeframe for decision making? Summary of Proposal (100 words or less) What is being proposed in terms of capital development, and program needs? III. Benefits to the Partnering Organization Why is your organization interested in partnering with the XX Parks and Recreation Department? Please individually list and discuss the benefits (monetary and non‐monetary) for your organization. IV. Benefits to the Sample Parks and Recreation Department Please individually list and discuss the benefits (monetary and non‐monetary) for the XX Parks and Recreation Department and residents of the City. V. Details (as currently known) The following page lists a series of Guiding Questions to help you address details that can help outline the benefits of a possible partnership. Please try to answer as many as possible with currently known information. Please include what your organization proposes to provide and what is requested of XX Parks and Recreation Department. Please include (as known) initial plans for your concept, operations, projected costs and revenues, staffing, and/or any scheduling or maintenance needs, etc.

Sample Partnership Policy – ©2003, 2008, 2012 GreenPlay LLC Page 18
Guiding Questions Meeting the Needs of our Community: In your experience, how does the project align with park and recreation goals? How does the proposed program or facility meet a need for City residents? Who will be the users? What is the projected number and profile of participants who will be
served? What alternatives currently exist to serve the users identified in this project? How much of the existing need is now being met? What is the availability of similar
programs elsewhere in the community? Do the programs provide opportunities for entry‐level, intermediate, and/or expert skill
levels? How does this project incorporate environmentally sustainable practices? The Financial Aspect: Can the project generate more revenue and/or less cost per participant than the City can
provide with its own staff or facilities? If not, why should the City partner on this project? Will your organization offer programs at reasonable and competitive costs for all
participants? What are the anticipated prices for participants? What resources are expected to come from the Parks & Recreation Department? Will there be a monetary benefit for the City, and if so, how and how much? Logistics: How much space do you need? What type of space? What is critical related to location? What is your proposed timeline? What are your projected hours of operations? What are your initial staffing projections? Are there any mutually‐beneficial cooperative marketing benefits? What types of insurance will be needed and who will be responsible for acquiring and
paying premiums on the policies? What is your organization's experience in providing this type of facility/program? How will your organization meet ADA and EEOC requirements? Agreements and Evaluation: How, by whom, and at what intervals should the project be evaluated? How can you assure the City of long‐term stability of your organization? What types and length of agreements should be used for this project? What types of “exit strategies” should we include? What should be done if the project does not meet the conditions of the original
agreements?

Parks, Recreation, and Cultural Resources Master Plan 163
Appendix F – Pyramid Methodology

THIS PAGE INTENTIONALLY LEFT BLANK

THE PYRAMID METHODOLOGY: COST RECOVERY AND SUBSIDY ALLOCATION PHILOSOPHY
The creation of a cost recovery and subsidy allocation philosophy and policy is a key component to maintaining an agency’s financial control, equitably pricing offerings, and helping to identify core services including programs and facilities. Critical to this philosophical undertaking is the support and buy‐in of elected officials and advisory boards, staff, and ultimately, citizens. Whether or not significant changes are called for, the organization should be certain that it philosophically aligns with its constituents. The development of a financial resource allocation philosophy and policy is built upon a very logical foundation, based upon the theory that those who benefit from parks and recreation services ultimately pay for services.
The development of a financial resource allocation philosophy can be separated into the following steps:
Step 1 – Building on Your Organization’s Values, Vision, and Mission
The premise of this process is to align agency services with organizational values, vision, and mission. It is important that organizational values are reflected in the vision and mission. Oftentimes, mission statements are a starting point and further work needs to occur to create a more detailed common understanding of the interpretation of the mission and a vision for the future. This is accomplished by engaging staff and community members in a discussion about a variety of Filters.
Step 2 – Understanding the Pyramid Methodology, the Benefits Filter, and Secondary Filters
Filters are a series of continuums covering different ways of viewing service provision. Filters influence the final positioning of services as they relate to each other and are summarized below. The Benefits Filter, however; forms the foundation of the Pyramid Model and is used in this discussion to illustrate a cost recovery philosophy and policies for parks and recreation organizations.
Filter Definition
Benefit Who receives the benefit of the service? (Skill development, education, physical health, mental health, safety)
Access/Type of Service Is the service available to everyone equally? Is participation or eligibility restricted by diversity factors (i.e., age, ability, skill, financial)?
Organizational Responsibility Is it the organization’s responsibility or obligation to provide the service based upon mission, legal mandate, or other obligation or requirement?
Historical Expectations What have we always done that we cannot change?
Anticipated Impacts What is the anticipated impact of the service on existing resources? On other users? On the environment? What is the anticipated impact of not providing the service?
Social Value What is the perceived social value of the service by constituents, city staff and leadership, and policy makers? Is it a community builder?

THE BENEFITS FILTER The principal foundation of the Pyramid is the Benefits Filter. Conceptually, the base level of the pyramid represents the mainstay of a public parks and recreation system. Services appropriate to higher levels of the pyramid should only be offered when the preceding levels below are comprehensive enough to provide a foundation for the next level. This foundation and upward progression is intended to represent public parks and recreation’s core mission, while also reflecting the growth and maturity of an organization as it enhances its service offerings. It is often easier to integrate the values of the organization with its mission if they can be visualized. An ideal philosophical model for this purpose is the pyramid. In addition to a physical structure, pyramid is defined by Webster’s Dictionary as “an immaterial structure built on a broad supporting base and narrowing gradually to an apex.” Parks and recreation programs are built with a broad supporting base of core services, enhanced with more specialized services as resources allow. Envision a pyramid sectioned horizontally into five levels.
MOSTLY COMMUNITY Benefit The foundational level of the Pyramid is the largest, and includes those services including programs and facilities which MOSTLY benefit the COMMUNITY as a whole. These services may increase property values, provide safety, address social needs, and enhance quality of life for residents. The community generally pays for these basic services via tax support. These services are generally offered to residents at a minimal charge or with no fee. A large percentage of the agency’s tax support would fund this level of the Pyramid. Examples of these services could include: the existence of the community parks and recreation system, the ability for youngsters to visit facilities on an informal basis, low‐income or scholarship programs, park and facility planning and design, park maintenance, or others. NOTE: All examples above are generic – individual agencies vary in their determination of which services belong in the foundation level of the Pyramid based upon agency values, vision, mission, demographics, goals, etc.
CONSIDERABLE COMMUNITY Benefit The second and smaller level of the Pyramid represents services which promote individual physical and mental well‐being, and may begin to provide skill development. They are generally traditionally expected services and/or beginner instructional levels. These services are typically assigned fees based upon a specified percentage of direct (and may also include indirect) costs. These costs are partially offset by both a tax subsidy to account for CONSIDERABLE COMMUNITY benefit and participant fees to account for the Individual benefit received from the service. Examples of these services could include: the capacity for teens and adults to visit facilities on an informal basis, ranger led interpretive programs, beginning level instructional programs and classes, etc.

BALANCED INDIVIDUAL/COMMUNITY Benefit The third and even smaller level of the Pyramid represents services that promote individual physical and mental well‐being, and provide an intermediate level of skill development. This level provides balanced INDIVIDUAL and COMMUNITY benefit and should be priced accordingly. The individual fee is set to recover a higher percentage of cost than those services that fall within lower Pyramid levels. Examples of these services could include: summer recreational day camp, summer sports leagues, year‐round swim team, etc.
CONSIDERABLE INDIVIDUAL Benefit The fourth and still smaller Pyramid level represents specialized services generally for specific groups, and those which may have a competitive focus. Services in this level may be priced to recover full cost, including all direct and indirect expenses. Examples of these services could include: specialty classes, golf, and outdoor adventure programs.
MOSTLY INDIVIDUAL Benefit At the top of the Pyramid, the fifth and smallest level represents services which have profit center potential, may be in an enterprise fund, may be in the same market space as the private sector, or may fall outside the core mission of the agency. In this level, services should be priced to recover full cost in addition to a designated profit percentage. Examples of these activities could include: elite diving teams, golf lessons, food concessions, company picnic rentals, and other facility rentals such as for weddings or other services.
Step 3 – Developing the Organization’s Categories of Service
In order to avoid trying to determine cost recovery or subsidy allocation levels for each individual agency service including every program, facility, or property, it is advantageous to categorize agency services into like categories. This step also includes the development of category definitions that detail and define each category and service inventory “checks and balances” to ensure that all agency services belong within a developed category. Examples of Categories of Service could include: Beginner Instructional Classes, Special Events, and Concessions/Vending.
Step 4 – Sorting the Categories of Service onto the Pyramid
It is critical that this sorting step be done with staff, governing body, and citizen representatives involved. This is where ownership is created for the philosophy, while participants discover the current and possibly varied operating histories, cultures, and organizational values, vision, and mission. It is the time to develop consensus and get everyone on the same page − the page that is written together. Remember, this effort must reflect the community and must align with the thinking of policy makers.

Sample Policy Development Language: XXX community brought together staff from across the department, agency leadership, and citizens to sort existing programs into each level of the Pyramid. The process was facilitated by an objective and impartial facilitator in order to hear all viewpoints. It generated discussion and debate as participants discovered what different people had to say about serving culturally and economically varied segments of the community, about historic versus active‐use parks, about the importance of adult versus youth versus senior activities, and other philosophical and values‐based discussions. This process gets at both the “what” and “why” with the intention of identifying common ground and consensus.
Step 5 – Defining Direct and Indirect Costs
The definition of direct and indirect costs can vary from agency to agency. What is important is that all costs associated with directly running a program or providing a service are identified and consistently applied across the system. Direct costs typically include all the specific, identifiable expenses (fixed and variable) associated with providing a service. These expenses would not exist without the service and may be variable costs. Defining direct costs, along with examples and relative formulas is necessary during this step. Indirect costs typically encompass overhead (fixed and variable) including the administrative costs of the agency. These costs would exist without any specific service but may also be attributed to a specific agency operation (in which case they are direct expenses of that operation). If desired, all or a portion of indirect costs can be allocated, in which case they become a direct cost allocation.
Step 6 – Determining (or Confirming) Current Subsidy/Cost Recovery Levels
This step establishes the expectation that the agency will confirm or determine current cost recovery and subsidy allocation levels by service area based on the new or revised definition of direct and in‐direct costs. This will include consideration of revenues sources and services costs or expenses. Typically, staff may not be cost accounting consistently, and these inconsistencies will become apparent. Results of this step will identify whether staff members know what it costs to provide services to the community, whether staff have the capacity or resources necessary to account for and track costs, whether accurate cost recovery levels can be identified, and whether cost centers or general ledger line items align with how the agency may want to track these costs in the future.
Step 7 – Establishing Cost Recovery/Subsidy Goals
Subsidy and cost recovery are complementary. If a program is subsidized at 75%, it has a 25% cost recovery, and vice‐versa. It is more powerful to work through this exercise thinking about where the tax subsidy is used rather than what is the cost recovery. When it is complete, you can reverse thinking to articulate the cost recovery philosophy, as necessary. The overall subsidy/cost recovery level is comprised of the average of everything in all of the levels together as a whole. This step identifies what the current subsidy level is for the programs sorted into each level. There may be quite a range within each level, and some programs could overlap with other levels of the pyramid. This will be rectified in the final steps. This step must reflect your community and must align with the thinking of policy makers regarding the broad picture financial goals and objectives.

Examples Categories in the bottom level of the Pyramid may be completely or mostly subsidized, with the agency having established limited cost recovery to convey the value of the experience to the user. An established 90‐100% subsidy articulates the significant community benefit resulting from these categories. The top level of the Pyramid may range from 0% subsidy to 50% excess revenues above all costs, or more. Or, the agency may not have any Categories of Service in the top level.
Step 8 – Understanding and Preparing for Influential Factors and Considerations
Inherent to sorting programs onto the Pyramid model using the Benefits and other filters is the realization that other factors come into play. This can result in decisions to place services in other levels than might first be thought. These factors also follow a continuum; however, do not necessarily follow the five levels like the Benefits Filter. In other words, a specific continuum may fall completely within the first two levels of the Pyramid. These factors can aid in determining core versus ancillary services. These factors represent a layering effect and should be used to make adjustments to an initial placement on the Pyramid. THE COMMITMENT FACTOR: What is the intensity of the program; what is the commitment of the participant?
Drop‐In
Opportunities Instructional –
Basic Instructional –Intermediate
Competitive – Not Recreational
Specialized
THE TRENDS FACTOR: Is the program or service tried and true, or is it a fad?
Basic Traditionally Expected
Staying Current with Trends
Cool, Cutting Edge Far Out
THE POLITICAL FILTER: What is out of our control? This filter does not operate on a continuum, but is a reality, and will dictate from time to time where certain programs fit in the pyramid THE MARKETING FACTOR: What is the effect of the program in attracting customers?
Loss Leader Popular – High Willingness to Pay
THE RELATIVE COST TO PROVIDE FACTOR: What is the cost per participant?
Low Cost per Participant
Medium Cost per
Participant
High Cost per Participant
THE ECONOMIC CONDITIONS FACTOR: What are the financial realities of the community?
Low Ability to Pay Pay to Play

FINANCIAL GOALS FACTOR: Are we targeting a financial goal such as increasing sustainability, decreasing subsidy reliance?
100% Subsidized
Generates Excess
Revenue over Direct Expenditures
Step 9 – Implementation
Across the country, ranges in overall cost recovery levels can vary from less than 10% to over 100%. The agency sets their goals based upon values, vision, mission, stakeholder input, funding, and/or other criteria. This process may have been completed to determine present cost recovery levels, or the agency may have needed to increase cost recovery levels in order to meet budget targets. Sometimes, simply implementing a policy to develop equity is enough without a concerted effort to increase revenues. Upon completion of steps 1‐8, the agency is positioned to illustrate and articulate where it has been and where it is heading from a financial perspective.
Step 10 – Evaluation
The results of this process may be used to: articulate and illustrate a comprehensive cost recovery and subsidy allocation philosophy train staff at all levels as to why and how things are priced the way they are shift subsidy to where is it most appropriately needed benchmark future financial performance enhance financial sustainability recommend service reductions to meet budget subsidy targets, or show how revenues can be
increased as an alternative justifiably price new services
This Cost Recovery/Subsidy Allocation Philosophy: The Pyramid Methodology Outline is provided by:
GreenPlay, LLC, 211 North Public Road, Suite 225, Lafayette, Colorado 80026 (303) 439‐8369; Fax: 303‐664‐5313; [email protected]; www.GreenPlayLLC.com
All rights reserved. Please contact GreenPlay for more information. Copyright 2001, 2008, 2009, 2011, 2013