2015 results - acea · 3/14/2016 · acea group 2015 results . acea group . 8 . status of...
TRANSCRIPT

2015 Results 2016-2020 Business Plan Rome, 14 March 2016 ’’The future is now’’

2 Acea Group: 2015-2019 Business Plan
Agenda
2015 Results
2016-2020 Business Plan highlights
Business Plan: Key Takeaways
Closing remarks

3 Acea Group: 2016-2020 Business Plan
2015 Results
Acea Group 2015 Results

4 Acea Group: 2016-2020 Business Plan
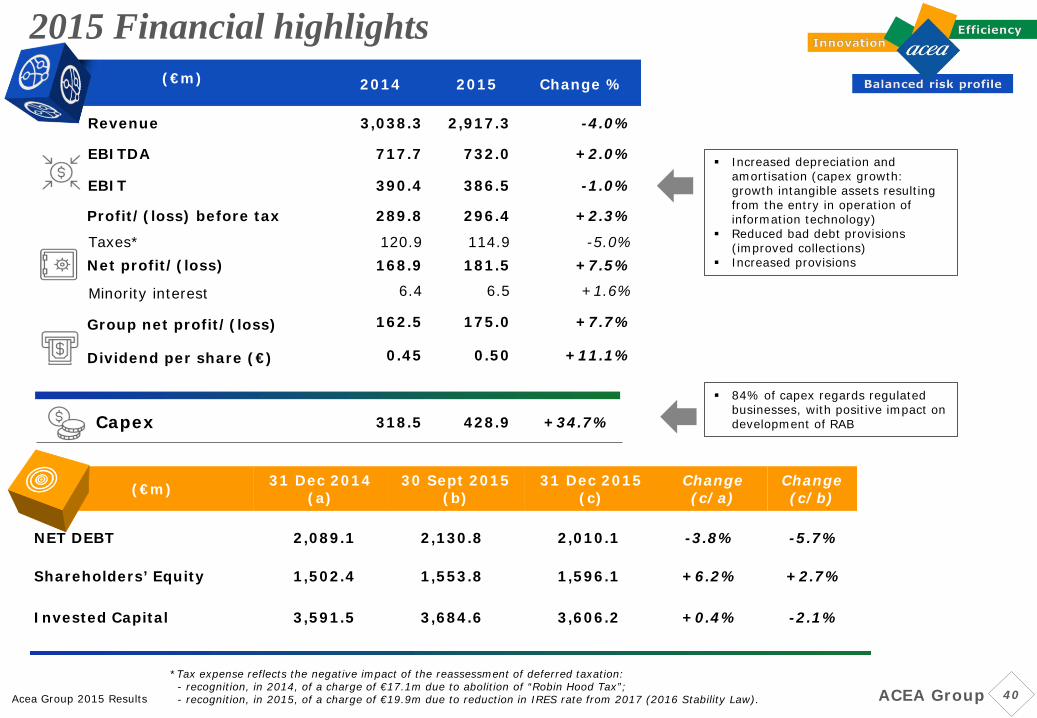
(€m)
2014
2015
Change %
Revenue 3,038.3 2,917.3 -4.0%
EBITDA 717.7 732.0 +2.0%
EBIT 390.4 386.5 -1.0%
Profit/(loss) before tax 289.8 296.4 +2.3%
Taxes* 120.9 114.9 -5.0% Net profit/(loss) 168.9 181.5 +7.5%
Minority interest 6.4 6.5 +1.6%
Group net profit/(loss) 162.5 175.0 +7.7%
Dividend per share (€) 0.45 0.50 +11.1%
2015 Financial highlights
NET DEBT 2,089.1 2,130.8 2,010.1 -3.8% -5.7%
Shareholders’ Equity 1,502.4 1,553.8 1,596.1 +6.2% +2.7%
Invested Capital 3,591.5 3,684.6 3,606.2 +0.4% -2.1%
(€m) 31 Dec 2014 (a)
30 Sept 2015 (b)
31 Dec 2015 (c)
Change (c/a)
Change (c/b)
Capex 318.5 428.9 +34.7%
Acea Group 2015 Results
Increased depreciation and amortisation (capex growth; growth intangible assets resulting from the entry in operation of information technology)
Reduced bad debt provisions (improved collections)
Increased provisions
84% of capex regards regulated businesses, with positive impact on development of RAB
*Tax expense reflects the negative impact of the reassessment of deferred taxation: - recognition, in 2014, of a charge of €17.1m due to abolition of “Robin Hood Tax”; - recognition, in 2015, of a charge of €19.9m due to reduction in IRES rate from 2017 (2016 Stability Law). ACEA Group

Acea Group 2015 Results 5
2015 EBITDA
717.7 732.0
€m
2014 2015
54.5 57.4
111.6 107.9
292.2 310.8
253.3 255.7
6.1 0.2
EBITDA
Environment Energy Water Grids Corporate
Energy: -3.3% Main drivers
Electricity production: +€0.4m.
Fall in energy prices and reduced volumes.
Consolidation of photovoltaic activity.
Electricity sales: -€4.1 m.
Recognition of non-recurring item.
Increased margin from enhanced protection
market due to revised retail price.
Reduced margin from free market (lower
volumes).
Water: +6.4% Main drivers
Efficiency.
Acea Ato2: tariff increase +16.7€m.
Growth at companies consolidated using
equity method: +9.6€m.
Overseas water operations: +€0.4m.
Recognition, in 2014 , of non-recurring
items attributable to Acea Ato2 due to
adjustments.
Grids: +0.9% Main drivers
Operational efficiency and new technologies.
Acea Distribuzione margin increase.
Public Lighting margin increase.
Deconsolidation of photovoltaic business.
Environment: +5.3% Main drivers
Aria’s plants: increase in volumes of
electricity sold +€3.8m.
Aquaser: +€1.7m.
Kyklos: shutdown of plant -€2.2m.
(€m)
ACEA Group

Acea Group 2015 Results 6
2015 Results: financial highlights
NET DEBT 2,089.1 2,130.8 2,010.1 (79.0) (120.7)
Medium/Long-term 3,006.4 2,656.0 2,657.0 (349.4) 1.0
Short-term (917.3) (525.2) (646.9) 270.4 (121.7)
(€m) 31 Dec 2014 (a)
30 Sept 2015 (b)
31 Dec 2015 (c)
Change (c-a)
Change (c-b)
Rating
BBB- Stable Outlook
BBB+ Stable Outlook
Baa2 Stable Outlook
NET DEBT/ SHAREHOLDER’S EQUITY
31 Dec 2014
NET DEBT/ SHAREHOLDER’S EQUITY
31 Dec 2015
1.4x 1.3x
Debt structure (maturity and interest rates at 31 Dec 2015)
> 72% Fixed rate > Average overall cost
3.3% > Average term to
maturity ~ 6.9 years 2016-2017
29% 3%
97% 71%
Floating Rate Fixed Rate
NET DEBT /EBITDA 31 Dec 2014
NET DEBT/EBITDA 31 Dec 2015
2.9x 2.7x
From 2018 onwards
318.5
2014 2015
13.3 25.9 19.7
30.6
148.9
204.4
122.4
156.2
14.2 11.8
Environment Energy Water Grids Corporate
CAPEX (€m)
428.9
72%
28%
ACEA Group

Acea Group 2015 Results 7
Status of receivables
ACEA Group
-€129m (-22%)
-€96m (-6%)
-11 days (-9%)
-€73m (-25%)
+16% (+€158m)
Billing Fewer bills to issue
Gross receivables Reduction in total amount
Receivables turnover Improved average DSO
Performance of collections Reduction in past due <12M
Coverage ratio* Increased coverage ratio
Highlights from results 2013-2015 The process of improving the receivable management, begun in 2014, is currently in progress, but has brought significant results as of 31 December 2015.
* Ratio of bad debt provisions to past due trade receivables
ACEA Group receivables 2015 vs 2013
Receivables 2015
-8% vs. 2014
1,418
-6% vs. 2013
Trade receivables 2015
-8% vs. 2014
1,325
-6% vs. 2013
+6% vs. 2014
+16% vs. 2013
Coverage ratio (%)
44% -98% vs. 2014
-98% vs. 2013
Exposure to Comune di Roma 2015
1.3

Acea Group 2015 Results 8 ACEA Group
Status of receivables
Apr 2014
Principal improvements already completed and implemented, such as to enable a significant increase in Group’s ability to generate cash, an objective partially met in 2015
PROCESSES
GOVERNANCE
IT SYSTEMS
Initiatives COMPLETED
Initiatives LAUNCHED (Ongoing)
• Efficiencies in billing process • Introduction of online Credit Checks
for customers for Mass Market, Small & Large Business
• Complete Re-engineering of Water segment processes
• Review of debt collection strategies for existing and former customers
• Complete re-engineering of electricity sales and distribution processes
• Clean-up of customer database to support new billing systems
• Digital Transformation & Self-care
• Start Monitoring performance of receivables
• Centralisation at holding co. of management of credit checks and debt collection from former customers of Energy segment
• Launch of Project ACEA
2puntozero to change applications map
• Go-live of new billing system at Acea Ato2
• Reorganisation of Group’s receivables management to obtain further efficiencies and synergies
• New control & treasury models
• Addition of data from info providers for customer profiling in relation to credit risk
• Launch of new billing systems for Enhanced Protection Market and Distribution
• Launch of new application for collection of debts from former customers
• Completion of new applications map
Date Go-live/Status
Oct 2014
Jan 2015
Sep 2015
Apr 2014
Jan 2015
Sep 2015
Apr 2016
Jul 2016
Jul 2016
Mar 2016
Jul 2016
Jul 2016
Jul 2016
Jul 2016
Apr 2016
Jun 2017

Acea Group 14 Energy 23 Environment 20 Water 26 Grids 30
2016-2020 Business Plan highlights Corporate 33
9

10 Acea Group: 2016-2020 Business Plan
51.00%
18.64%
2.02%
12.48%
15.86%
City of RomeCaltagirone GroupSuezNorges BankOther
Acea today
Well-positioned to capture opportunities in all business areas
WATER
Source: CONSOB (March 2016)
GRIDS ENVIRONMENT
ENERGY Leading operator in Italy ~ 42% of Group EBITDA Lazio, Tuscany, Umbria and Campania Water sold: 527 million m3 Customers: nearly 9 million Engineering, procurement, construction and management
of integrated water services, laboratory analysis Water Management services in Latin American countries
Number 6 Italian operator ~ 8% of Group EBITDA Umbria, Lazio and Tuscany Waste treated: ~ 770,000 Tons Electricity produced (WTE): 265 GWh
One of the main Italian energy retailers ~ 15% of Group EBITDA Electricity sold: over 9.4TWh Customers: ~ 1.4 million 7 hydroelectric power plants (122 MW) 3 thermo/cogen plants (243 MW).
One of the leading operators in Italy ~ 35% of Group EBITDA Electricity distributed: ~ 11 TWh in the city of Rome Public lighting and floodlighting managed: over 217,000
lighting points Energy efficiency projects.
EBITDA from Regulated activities Acea’s Ownership Structure
77%
23% 2015
EBITDA fromRegulatedBusinesses
EBITDA fromUnregulatedBusinesses
2015 data
ACEA Group

11 Acea Group: 2016-2020 Business Plan
Strategic Pillars
Maintaining our strategic pillars…..
Balanced risk profile 74% of EBITDA from regulated
businesses at the end of the Plan 80% of investment in regulated
businesses
Organic growth Focus on regulated businesses New regulatory framework for
electricity distribution and water Upgrade/development of WTE and
composting plants
Efficiencies and innovation ~94 €m of efficiencies relates to
Acea 2.0 (billing, WFM, insourcing) Corporate rationalisation Operational efficiency
Financial strength Improving financial ratios: Net
Debt/Ebitda 2020 2.5x Working capital optimization
…. increasing shareholder returns: Dividend Per Share CAGR: 3%-6%
Further opportunities not included in the Plan targets Acquisitions of water companies in existing areas of operation Consolidation in core areas Acquisitions in Latin America
ACEA Group

12 Acea Group: 2016-2020 Business Plan
Acea 2.0 – digital and technological transformation
~140,000 KM OF NETWORKS
~831 PLANTS
~7,000 EMPLOYEES
Acea is revolutionising the way it goes about its business, making sizeable investments in digital technologies
~8,000,000 CUSTOMERS
Faced with the arduous task of ensuring the integrity, univocity and quality of data handled, ACEA has chosen SAP solutions (world leader in the sphere of management systems for Utilities).
ACEA 2.0 Programme: an ambitious strategic initiative, and a crucial stage in the Group’s growth process.
New corporate culture open to change
ORGANISATION BY PROCESS
INTEGRATED AND EFFICIENT INFORMATION SYSTEMS
RE-ENGINEERING OF PROCESSES
NEW OPERATING
MODEL
Total uniformity
Real time Use in mobility
The drivers of technological innovation
ACEA Group

13 Acea Group: 2016-2020 Business Plan
Acea 2.0
ACEA ATO2
•Other Water Companies
•ACEA Distribuzione
•ACEA Public Lighting
•ACEA Energia
Customers
Walk-in office App WEB Call Center
SAP
IS-U
O
pera
tion
SAP
WFM
SAP
CRM
INTEGRATED Processes
REAL-TIME Operation
Metering and Billing WorkForce Management
Social
TARGET
ACEA Group
14 Acea Group: 2016-2020 Business Plan
2016-2020 Business Plan Acea Group

15 Acea Group: 2016-2020 Business Plan
74%
26% 2020
2015 2020 Plan
EBITDA (€m) 732 890
NET PROFIT before non-controlling interests (€m) 182 276
NET DEBT (€m) 2,010 2,252
NET DEBT/EBITDA 2.7x 2.5x
INVESTED CAPITAL (€m) 3,606 4,244
Key highlights
2020 Pre-tax ROIC: ~12%
77%
23%
2015
EBITDA fromRegulatedBusinesses
EBITDA fromUnregulatedBusinesses
10%
16%
43%
31%
2020
8% 15%
42%
35%
2015
Environment
Energy
Water
Grids
EBITDA CAGR 2015-2020: +4.0%
DPS CAGR 2015-2020: 3%-6%
All Acea employees are committed to the successful execution of the Group’s Strategic Plan
EBITDA breakdown by Business Area EBITDA from Regulated Activities
ACEA Group
CONSOLIDATED TRACK RECORD OF EXCEEDING PREVIOUSLY ANNOUNCED TARGETS

16 Acea Group: 2016-2020 Business Plan
732
864
890
2015 2019 Plan 2020 Plan
2016-2020 Business Plan
3 34
30
69 21
Corporate Environment Energy Water Grids
Old Plan
EBITDA growth by business area
CAGR: +4.0%
EBITDA trend €m
€m
Grids Revised WACC Introducton of Acea 2.0- WFM Renewal of Public Lighting contract Growth in Public Lighting (Campania)
Water Revised WACC Bonus for quality Acea 2.0-WFM
Energy Introduction of Acea 2.0 Customers: consolidation of customer base in
2017 and growth in 2020
Environment Completion of San Vittore plant Revamping of WTE in Lazio region Growth in composting market
Holding Roll-in Acea 2.0 Insourcing of activities Redundancy plan Corporate rationalisation Optimisation of real estate
57
108
311
256 2015 Ebitda
732
91
138
380
277
3
2020 Ebitda 890
ACEA Group
882

17 Acea Group: 2016-2020 Business Plan
5.5
2015 2020
0
25.6 21.1
2015 2020
14.9 11.5
2015 2020
2015 2020
-100%
-18%
-23%
-12%
Process costs in €m
€ per POD Efficiency-sensitive costs
€ per inhabitant Efficiency-sensitive costs
Staff cost savings
Total efficiencies over the period of the Plan: €94m from 2020: ~ €40m on a recurring basis
2016-2020 Business Plan Acceleration of efficiencies identified
~ €6m
~ €11m
~ €15m
~ €8m
Energy Launch of Acea2.0: Redesign of
complaints process
Grids Digitalisation of network Work Force Management Single Tender
Water Digitalisation of network Work Force Management Single Tender
Holding Standardisation of Acea 2.0 processes Insourcing Redundancies
ACEA Group
18 Acea Group: 2016-2020 Business Plan
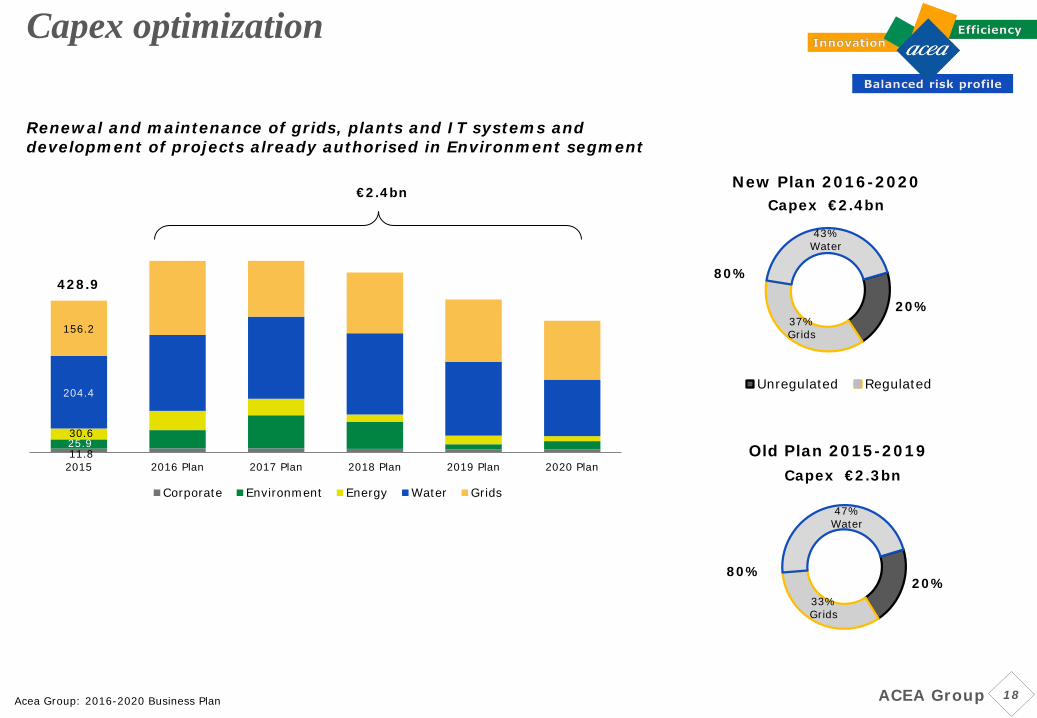
11.8 25.9 30.6
204.4
156.2
2015 2016 Plan 2017 Plan 2018 Plan 2019 Plan 2020 Plan
Corporate Environment Energy Water Grids
428.9
Capex optimization
Renewal and maintenance of grids, plants and IT systems and development of projects already authorised in Environment segment
€2.4bn
20% 37% Grids
43% Water
New Plan 2016-2020
Unregulated Regulated
Capex €2.4bn
ACEA Group
80%
20% 33% Grids
47% Water
Old Plan 2015-2019 Capex €2.3bn
80%

19 Acea Group: 2016-2020 Business Plan
2,089.1 2,010.1 2,252
2014 2015 Plan 2020
Long-term debt life and a solid liquidity position
Medium/Long-term 3,006.4 2,656.0 2,657.0 (349.4)
Short-term (917.3) (525.2) (646.9) 270.4
Net Debt 2,089.1 2,130.8 2,010.1 (79.0)
(€m)
31 Dec 2014 (a)
30 Sept 2015
31 Dec 2015 (b)
Change (b-a)
Debt Structure
Net Debt (€m)
2.7x2.9x2.5x
Net Debt/EBITDA
Payout ratio of 50%-60% DPS CAGR 3%-6%
Dividend Policy: consistent and sustainable
Rating
BBB- Stable Outlook
BBB+ Stable Outlook
Baa2 Stable Outlook
SOLID FINANCIAL STRUCTURE TO SERVE YIELD AND GROWTH
Debt structure (maturity and interest rates at 31 Dec 2015)
> 72% Fixed rate > Average overall cost
3.3% > Average term to
maturity ~ 6.9 years 2016-2017
29% 3%
97% 71%
Floating Rate Fixed Rate From 2018 onwards
72%
28%
ACEA Group

20 Acea Group: 2016-2020 Business Plan
2016-2020 Business Plan Environment

21 Acea Group: 2016-2020 Business Plan
2016-2020 Business Plan Strategies, opportunities and risks
Environment
Regulatory: Completion of management of waste cycle in Lazio region Competitors: Number 6 operator in Italy in Environment sector by
volume of waste treated, with 2.4% share of Italian market
Leading Italian operator of composting plants Growth: Insourcing of sludge treatment at Group level Average IRR for acquisitions / new constructions approx.
14%
Opportunities Risks
Plants: Delays in investment in construction or revamping of
plants Regulatory: Changes to regulatory framework and authorisation
process Environmental: Environmental risks Local relations (administrative challenges, protest groups)
• Number 3 operator in Italy in 2020 • Completion of previously approved initiatives: Revamping line 1 of San Vittore WTE plant in Lazio Construction of new composting plant with anaerobic digestion Expansion of Orvieto landfill Development of composting and sludge conditioning plants
• Consolidation in regions where present, with potential for synergies with other areas of business
2015 2020 WTE 354 553
Mechanical treatment - 355
Landfill 94 133
Composting/anaerobic digestion 7 310
Chemical conditioning of sludge for use in agriculture 29 196
Sludge management 224 241
Liquid waste - 295
Total 708* 2,083
(‘000 tons)
* The figure does not include 57,000 tonnes of waste disposed

22 Acea Group: 2016-2020 Business Plan
26
235
262
2015 Old Plan 2015-2019 New Plan 2016-2020
Targets and Results
765
2,083
2015 Plan 2020
Volume of waste treated (‘000 tons)
Capex (€m)
2020 Invested Capital €360m
2020 pre-tax ROIC 15.9%
Net Debt (€m)
188
302
2015 Plan 2020
Environment
CAGR +9.8%
Ebitda (€m)
57
(27)
14 23
13 11 91
2015 Cessation CIP6incentives
Like for likebasis
Developmentof exiting plants
AceaGreenfield
Acquisitions Plan 2020
57
113 91
2015 Plan 2019 Plan 2020
114 Old Plan

23 Acea Group: 2016-2020 Business Plan
2016-2020 Business Plan Energy

24 Acea Group: 2016-2020 Business Plan
2016-2020 Business Plan Strategies, opportunities and risks
Opportunities
Energy
Regulatory: Complete revision of RCV (Remuneration
commercialisation retail) Systems: Improved billing performance
Risks
Regulatory: Failure to revise RCV Competitors: Increase in churn rate Systems: Migration of data and ‘‘go-live’’ of new billing system
Retail • Moderate growth of customer base, with focus on existing areas of operation • Improved service quality • Acea 2.0: new billing and CRM system • Efficiency of processes and overheads, including via insourcing
Production • Plants modernisation: Castel Madama and Mandela • Devolopment of energy efficiency initiatives

25 Acea Group: 2016-2020 Business Plan
2015 2020
Gas
FreeMarket
EnhancedProtectionMarket
31
133
159
2015 Old Plan 2015-2019
New Plan 2016-2020
Targets and Results
Number of customers (‘000 ) Capex (€m)
2020 Invested Capital €491m
2020 pre-tax ROIC 13.9%
Net Debt (€m)
287
152
2015 Plan 2020
1,439 1,327
Energy
10
108 8 3 3 6 138
2015 Like for likeProduction
Energyefficiency
RCV - Tariff Customers andmargins
Acea 2.0 Plan 2020
CAGR +5.0%
Ebitda (€m)
123
108 138
2015 Plan 2019 Plan 2020
Old Plan
127

26 Acea Group: 2016-2020 Business Plan
2016-2020 Business Plan Water

27 Acea Group: 2016-2020 Business Plan
2016-2020 Business Plan Strategies, opportunities and risks
Opportunities Risks
Water
Regulatory: Recognition of FoNI component (to finance new
investment) Introduction of a component linked to quality factor Systems: Improved billing performance External growth: Acquisition opportunities
Systems: Roll out new IT platform
• New Regulation: cycle 2016-2019 • Acea 2.0 project: radical transformation,
standardisation and integration of all IT systems, obtaining operating cost and process efficiencies (WFM and new billing system started on 28 Sept 2015)
• Overseas growth (Latin America)
ATO2-Roma (expiry 2032) ATO5 Frosinone (exp. 2032) Other ATOs:
• ATO3 Firenze (exp. 2021) • ATO6 Siena-Grosseto (exp. 2026) • ATO2 Pisa (exp. 2021) • ATO1 Perugia (exp. 2027) • ATO3 Sarnese V. (exp. 2032)

28 Acea Group: 2016-2020 Business Plan
2016-2020 Business Plan Regulatory Opportunities
Water
The new MTI-2 tariff method also provides incentive mechanisms for the improvement of the contractual and technical quality of the service, by introducing two different mechanisms of awards/penalties. 1. The first one involves an award for performance improvements compared to the minimum standards defined by
the national Authority. This mechanism is defined with the local Authority and the maximum amount of the premium is a function of the operator's efficiency in comparison to the national average. In fact the premium is higher, the more the operator is efficient compared to the national average operating cost per customer served, set by the national Authority at 109 € per customer. The award is not subject to the tariff increase limit.
2. The second mechanism, which is valid throughout the entire Country, is supplied by a specific tariff component,
mandatory for all operators, to be allocated to a specific fund for the quality. During the first activation this mechanism promotes, rewarding the best practices, the growth of the contractual quality levels with respect to the parameters defined by the resolution on the contractual quality (655/2015/R/idr).
Not included in Business Plan targets
Introduction of a component linked to quality factor
ATO2 - Quality Awards (€m) 2017-2020 Total
Annual impact from 2019 on
Maximun Value 104 35
Impact included in BP targets 62 24
ATO 5
No awards, operating cost for customer served is higher than national avarage
Recognition of FoNI component FoNI component (€m) 2016 2017 2018 2019 2020
ATO2 21 23 19 9 6
ATO5 7 5 2 2 2

29 Acea Group: 2016-2020 Business Plan
95%
5%
22 24 15 8 380
2015 Tariff effect Quality factor Acea 2.0 Overseasdevelopment
Plan 2020
537
653
2015 Plan 20202014 2015 2020
204
1,073
1,042
2015 Old Plan 2015-2019
New Plan 2016-2020
Targets and Results
RAB Capex (€m)
CAGR +4.1% 2020 pre-tax ROIC 11.5%
Ebitda (€m)
Net Debt (€m)
RAB: ATO2 Lazio Centrale and ATO5 Frosinone
1.5 (€bn)
RAB: Companies consolidated using equity method
93%
7%
1,075 (€m)
433 (€m) 487 (€m)
0.6(€bn)
1,111 (€m)
Water
311
EBITDA from Regulated Business EBIDA from Deregulated Business
357
311 370 380
2015 Plan 2019 Plan 2020
Old Plan

30 Acea Group: 2016-2020 Business Plan
2016-2020 Business Plan Grids
31 Acea Group: 2016-2020 Business Plan
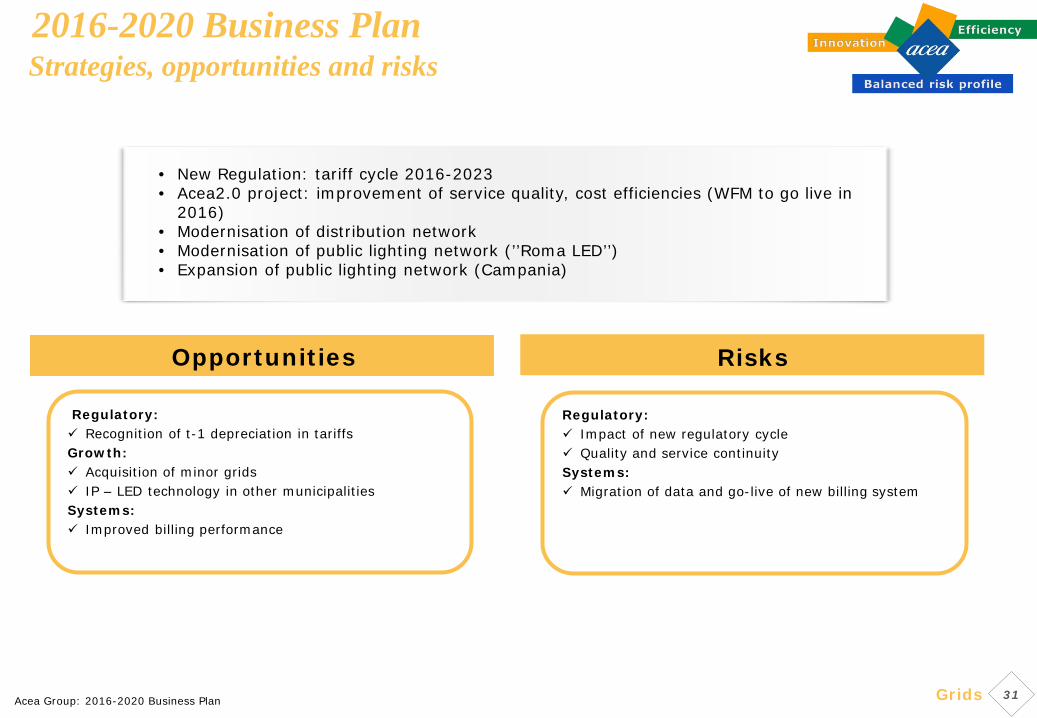
2016-2020 Business Plan Strategies, opportunities and risks
Opportunities Risks
Grids
• New Regulation: tariff cycle 2016-2023 • Acea2.0 project: improvement of service quality, cost efficiencies (WFM to go live in
2016) • Modernisation of distribution network • Modernisation of public lighting network (’’Roma LED’’) • Expansion of public lighting network (Campania)
Regulatory: Recognition of t-1 depreciation in tariffs Growth: Acquisition of minor grids IP – LED technology in other municipalities Systems: Improved billing performance
Regulatory: Impact of new regulatory cycle Quality and service continuity Systems: Migration of data and go-live of new billing system

32 Acea Group: 2016-2020 Business Plan
2014 2015 2020
582
900
2015 Plan 2020
Targets and Results CAGR +1.6% 2020 pre-tax ROIC 9.3%
Ebitda (€m)
Net Debt (€m) RAB
1,605(€m)
1.9 (€bn)
156
763
878
2015 Old Plan 2015-2019 New Plan 2016-2020
97%
3%
Grids
Capex (€m)
256
(3) (1)
14 11 277
2015 Organic growth Public lighting Tariff effect Acea 2.0 Plan 2020
EBITDA from Regulated Business EBIDA from Deregulated Business
98%
2%
270
256 269 277
2015 Plan 2019 Plan 2020
Old Plan
RAB: Distribution activity
1.7 (€bn)
RAB: Metering, commercialisation and transport.
1,462 (€m)
143 (€m) 138 (€m)
0.2(€bn)
1,433 (€m)
1,571 (€m)
33 Acea Group: 2016-2020 Business Plan
2016-2020 Business Plan Corporate

34 Acea Group: 2016-2020 Business Plan
Targets and results
2016-2020 Capex: €54m
2020 EBITDA: ~€3m
Corporate
• Further simplify the corporate structure
• Facilitate synergies through Project Acea 2.0
• Greater operational efficiency - insourcing

35 Acea Group: 2016-2020 Business Plan
Additional initiatives
Potential impact
Acquisition
of investments in Italy (in areas in which already present)
and overseas investments
Lazio* Campania* Tuscany* Umbria* Latin America
~€26m EBITDA
A solid base for the future Additional initiatives not included in Business Plan
PROCESS SUBJECT TO LOCAL
AUTHORITIES’ AND PUBLIC SHAREHOLDERS’ DECISIONS
Corporate
MARKET GROWTH OPPORTUNITIES 3 previously set targets
CONSOLIDATION INITIATIVES Taking full control of subsidiaries
Additional initiatives
Potential impact
Consolidation initiatives (in areas in which already present)
Lazio Tuscany Umbria (investee water companies)
~€500m EBITDA
ACQUISITIONS
SUBJECT TO BoD DECISIONS
* Consolidated using the equity method

36 Acea Group: 2016-2020 Business Plan
Business Plan: Key Takeaways Environment 2020 EBITDA: €91m 2016-2020 CAPEX: €262m 2020 Pre-tax ROIC: 15.9% ACEA GROUP
2020 EBITDA: €890m
2016-2020 CAPEX: €2.4bn Energy 2020 EBITDA: €138m 2016-2020 CAPEX: €159m 2020 Pre-tax ROIC: 13.9%
Water 2020 EBITDA: €380m 2016-2020 CAPEX: €1,042m 2020 Pre-tax ROIC: 11.5%
Grids 2020 EBITDA: €277m 2016-2020 CAPEX: €878m 2020 Pre-tax ROIC: 9.3%
DPS CAGR: 3%-6%
CAGR EBITDA: +4.0%
2020 NET DEBT: €2,252m
ACEA Group

37 Acea Group: 2016-2020 Business Plan
Conclusions
Significant investment ensuring the Company’s future growth
Continued efforts in operating efficiency
Attractive shareholder returns as main strategic priority
Stable and predictable regulatory framework
Strong financial position
ACEA Group

38 Acea Group: 2016-2020 Business Plan
Appendix
38

39 Acea Group: 2016-2020 Business Plan
Appendix 2015 Results Water regulatory framework Electricity Distribution regulatory framework Main assumptions and sensitivity analysis Environmental Sustainability
Acea Group Presentation
40 Acea Group: 2016-2020 Business Plan
(€m)
2014
2015
Change %
Revenue 3,038.3 2,917.3 -4.0%
EBITDA 717.7 732.0 +2.0%
EBIT 390.4 386.5 -1.0%
Profit/(loss) before tax 289.8 296.4 +2.3%
Taxes* 120.9 114.9 -5.0% Net profit/(loss) 168.9 181.5 +7.5%
Minority interest 6.4 6.5 +1.6%
Group net profit/(loss) 162.5 175.0 +7.7%
Dividend per share (€) 0.45 0.50 +11.1%
2015 Financial highlights
NET DEBT 2,089.1 2,130.8 2,010.1 -3.8% -5.7%
Shareholders’ Equity 1,502.4 1,553.8 1,596.1 +6.2% +2.7%
Invested Capital 3,591.5 3,684.6 3,606.2 +0.4% -2.1%
(€m) 31 Dec 2014 (a)
30 Sept 2015 (b)
31 Dec 2015 (c)
Change (c/a)
Change (c/b)
Capex 318.5 428.9 +34.7%
Acea Group 2015 Results
Increased depreciation and amortisation (capex growth: growth intangible assets resulting from the entry in operation of information technology)
Reduced bad debt provisions (improved collections)
Increased provisions
84% of capex regards regulated businesses, with positive impact on development of RAB
ACEA Group *Tax expense reflects the negative impact of the reassessment of deferred taxation: - recognition, in 2014, of a charge of €17.1m due to abolition of “Robin Hood Tax”; - recognition, in 2015, of a charge of €19.9m due to reduction in IRES rate from 2017 (2016 Stability Law).

41 Acea Group: 2016-2020 Business Plan
77%
23% EBITDA fromRegulatedBusinesses
EBITDA fromDeregulatedBusinesses
718 3
(4)
19 2
(6)
732
2015 Environment Energy Water Grids Corporate 2015
EBITDA
° Figures do not include:
- 2014 Overseas water operations: 412
- 2015 Overseas water operations: 268
Acea Spa 661 636
Environment 221 227
Energy 522 549
Water ° 1,954 1,983
Network 1,335 1,315
Total 4,693 4,710
Energy sales margin increase
Efficiency Tariff increase Growth at companies
consolidated using equity method
+ €14m +2.0%
8% 15%
42%
35%
Environment
Energy
Water
Grids
Total number of employees 2014 2015
EBITDA €m
Acea Distribuzione margin increase (efficiency)
EBITDA 2015
Acea Group 2015 Results ACEA Group

42 Acea Group: 2016-2020 Business Plan
Key quantitative data 2014 2015
Treatment and disposal
(‘000s of tonnes) 774 765
WTE electricity sold (GWh) 249 265
EBITDA and Key quantitative data
Environment Aria’s plants: increase in volume of electricity sold +€3.8m
EBITDA main drivers
(€m) 2014 2015 % change
EBITDA 54.5 57.4 +5.3%
Capex 13.3 25.9 +94.7%
Kyklos: shutdown of plant -€2.2m
Aquaser: +€1.7m
Acea Group 2015 Results ACEA Group
43 Acea Group: 2016-2020 Business Plan
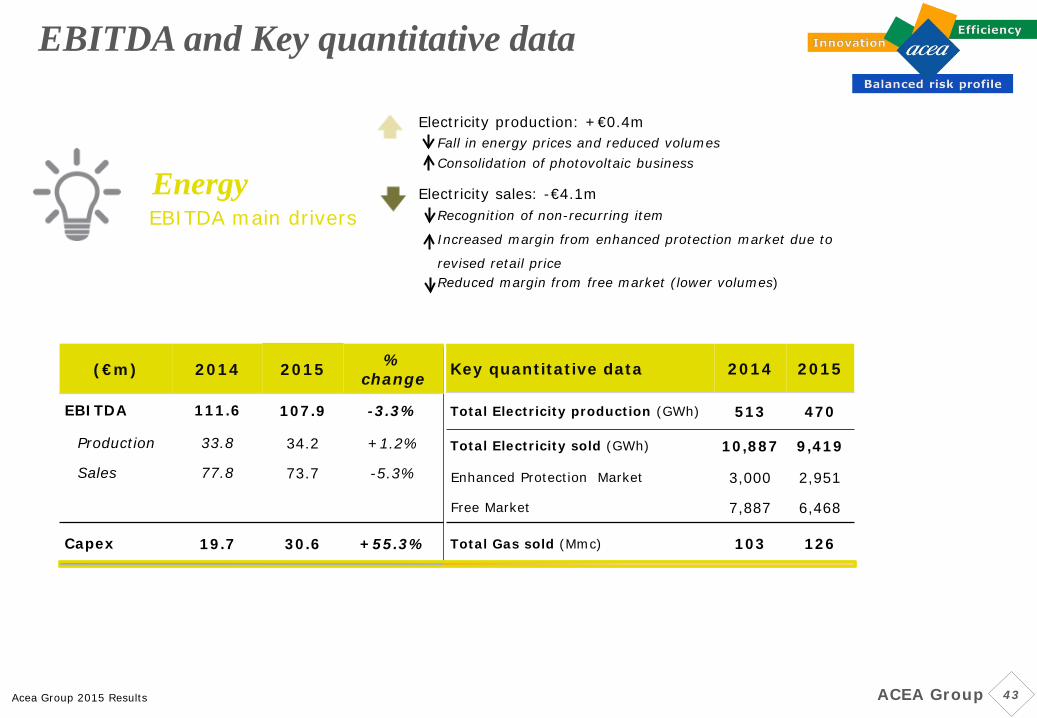
EBITDA and Key quantitative data
Energy
Electricity production: +€0.4m Fall in energy prices and reduced volumes Consolidation of photovoltaic business
EBITDA main drivers Electricity sales: -€4.1m
Recognition of non-recurring item
Increased margin from enhanced protection market due to
revised retail price Reduced margin from free market (lower volumes)
Key quantitative data 2014 2015
Total Electricity production (GWh) 513 470
Total Electricity sold (GWh) 10,887 9,419
Enhanced Protection Market 3,000 2,951
Free Market 7,887 6,468
Total Gas sold (Mmc) 103 126
(€m) 2014 2015 % change
EBITDA 111.6 107.9 -3.3%
Production 33.8 34.2 +1.2%
Sales 77.8 73.7 -5.3%
Capex 19.7 30.6 +55.3%
Acea Group 2015 Results ACEA Group

44 Acea Group: 2016-2020 Business Plan
EBITDA and Key quantitative data
Water EBITDA main drivers
(€m) 2014 2015 % change
EBITDA 292.2 310.8 +6.4%
of which: Profit/(Loss) on investments consolidated under IFRS 11
19.0 28.6 +50.5%
Capex 148.9 204.4 +37.3%
Growth at companies consolidated using the equity method +€9.6m
Key quantitative data 2014 2015
Total volume of water sold 540 527
(Mmc)
Overseas water operations: +€0.4m
Efficiency
Acea ATO2: tariff increase +€16.7m
Tariff increase composition
2014 2015
Adjustment VRG
≅ 6%
≅ 6% ≅ 3%
≅ 3%
Acea Group 2015 Results
Recognition, in 2014, of non-recurring items by Acea Ato2 for adjustments
2014 Revenueincrease
Efficiency Companiesconsolidated
using the equitymethod
Extraordinaryitems
2015
+6.4%
292 311
EBITDA €m
Positive impact Negative impact ACEA Group

45 Acea Group: 2016-2020 Business Plan
EBITDA and Key quantitative data
Grids Operational efficiency and new technologies
(€m) 2014 2015 % change
EBITDA 6.1 0.2 n.s.
Capex 14.2 11.8 -16.9%
Corporate
EBITDA main drivers
Key quantitative data 2014 2015
Total Electricity distributed 10,294 10,557
(GWh)
Acea Group 2015 Results
Deconsolidation of photovoltaic business
Pubblic Lighting margin increase
(€m) 2014 2015 % change
EBITDA 253.3 255.7 +0.9%
Capex 122.4 156.2 +27.6%
Acea Distribuzione margin increase
ACEA Group

46 Acea Group: 2016-2020 Business Plan
2014 20152014 2015
EBIT and Net Profit
162.5 175.0
390.4 386.5
EBIT €m NET PROFIT €m
-€3.9m (-1.0%)
Depreciation 203.5 234.0 +15.0%
Write-offs 110.2 59.0 -46.5%
Provision 13.6 52.5 n.s.
Total 327.3 345.5 +5.6%
+€12.5m (+7.7%)
2014 2015 % change
€m Higher depreciation:
capex growth
growth in intangible assets resulting from entry into operation of IT systems
Decrease in write-offs mainly in Water and Energy segments
Elimination of one-off hike in IRES corporation tax (‘‘Robin Hood Tax’’)
Deductibility for the purposes of IRAP of the cost of staff hired on permanent contracts
TAX RATE 38.7%
Acea Group 2015 Results
Recalculation of deferred taxation: Recognition, in 2014, of a charge
of €17.1m due to abolition of ‘‘Robin Hood Tax’’ Recognition, in 2015, of a charge
of €19.9m due to reduction in IRES rate from 2017 (2016 Stability Law)
ACEA Group
Acea Group 2015 Results 47
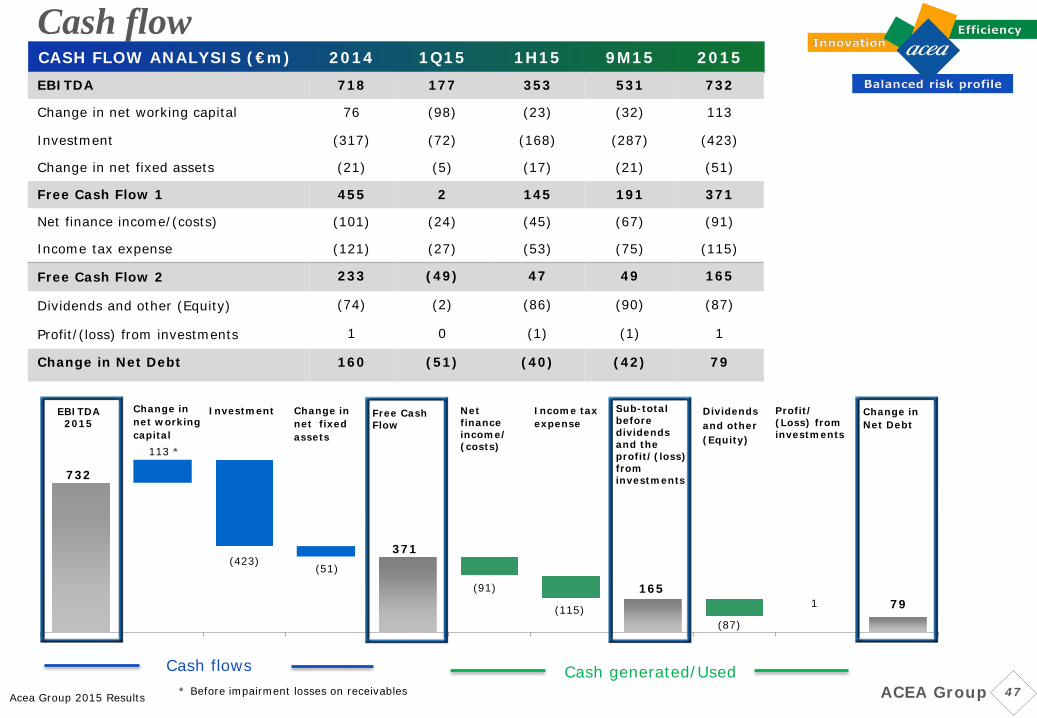
Cash flow CASH FLOW ANALYSIS (€m) 2014 1Q15 1H15 9M15 2015 EBITDA 718 177 353 531 732
Change in net working capital 76 (98) (23) (32) 113
Investment (317) (72) (168) (287) (423)
Change in net fixed assets (21) (5) (17) (21) (51)
Free Cash Flow 1 455 2 145 191 371
Net finance income/(costs) (101) (24) (45) (67) (91)
Income tax expense (121) (27) (53) (75) (115)
Free Cash Flow 2 233 (49) 47 49 165
Dividends and other (Equity) (74) (2) (86) (90) (87)
Profit/(loss) from investments 1 0 (1) (1) 1
Change in Net Debt 160 (51) (40) (42) 79
732
113 *
(423) (51)
371
(91)
(115)
165
(87)
79
Cash flows Cash generated/Used * Before impairment losses on receivables
1
Change in net working capital
EBITDA 2015
Investment Change in net fixed assets
Free Cash Flow
Net finance income/ (costs)
Income tax expense
Sub-total before dividends and the profit/(loss) from investments
Dividends and other (Equity)
Change in Net Debt
Profit/ (Loss) from investments
ACEA Group
Acea Group 2015 Results 48
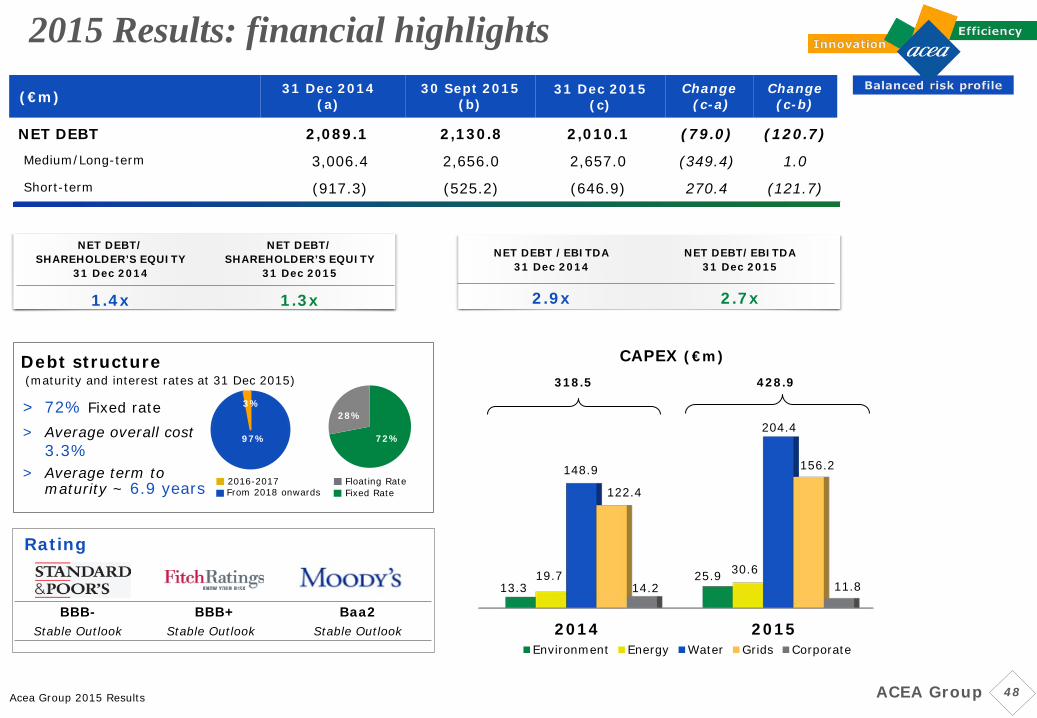
2015 Results: financial highlights
NET DEBT 2,089.1 2,130.8 2,010.1 (79.0) (120.7)
Medium/Long-term 3,006.4 2,656.0 2,657.0 (349.4) 1.0
Short-term (917.3) (525.2) (646.9) 270.4 (121.7)
(€m) 31 Dec 2014 (a)
30 Sept 2015 (b)
31 Dec 2015 (c)
Change (c-a)
Change (c-b)
Rating
BBB- Stable Outlook
BBB+ Stable Outlook
Baa2 Stable Outlook
NET DEBT/ SHAREHOLDER’S EQUITY
31 Dec 2014
NET DEBT/ SHAREHOLDER’S EQUITY
31 Dec 2015
1.4x 1.3x
Debt structure (maturity and interest rates at 31 Dec 2015)
> 72% Fixed rate > Average overall cost
3.3% > Average term to
maturity ~ 6.9 years 2016-2017
29% 3%
97% 71%
Floating Rate Fixed Rate
NET DEBT /EBITDA 31 Dec 2014
NET DEBT/EBITDA 31 Dec 2015
2.9x 2.7x
From 2018 onwards
318.5
2014 2015
13.3 25.9 19.7 30.6
148.9
204.4
122.4
156.2
14.2 11.8
Environment Energy Water Grids Corporate
CAPEX (€m) 428.9
72%
28%
ACEA Group
49 Acea Group: 2016-2020 Business Plan Water
Water regulatory framework
Acea Group Presentation
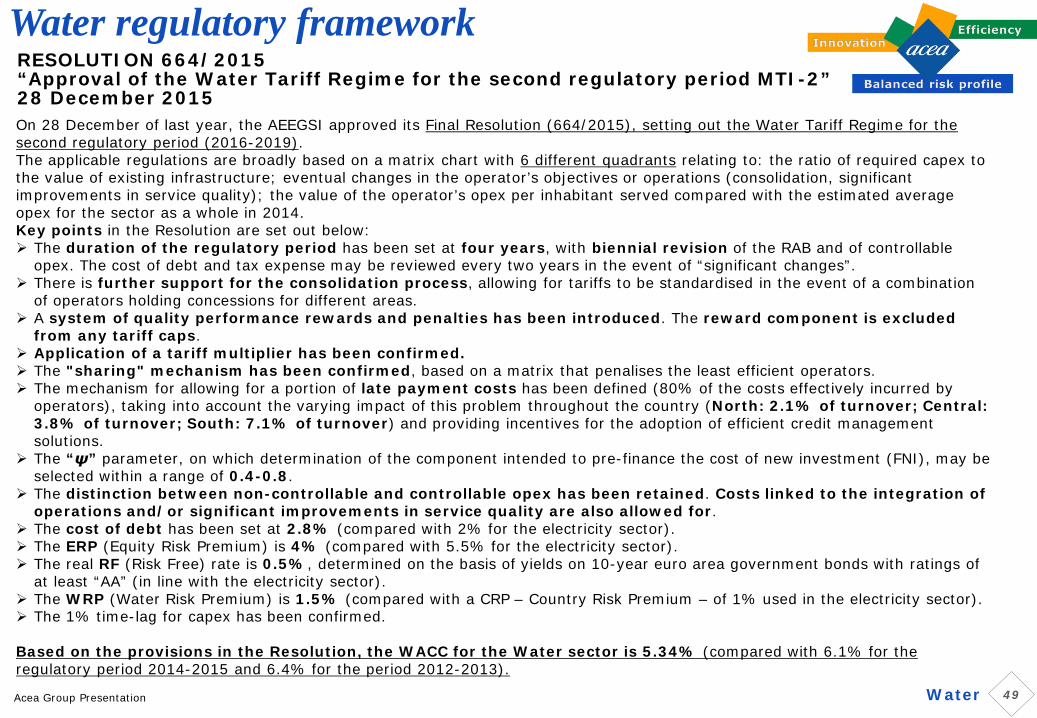
RESOLUTION 664/2015 “Approval of the Water Tariff Regime for the second regulatory period MTI-2” 28 December 2015 On 28 December of last year, the AEEGSI approved its Final Resolution (664/2015), setting out the Water Tariff Regime for the second regulatory period (2016-2019). The applicable regulations are broadly based on a matrix chart with 6 different quadrants relating to: the ratio of required capex to the value of existing infrastructure; eventual changes in the operator’s objectives or operations (consolidation, significant improvements in service quality); the value of the operator’s opex per inhabitant served compared with the estimated average opex for the sector as a whole in 2014. Key points in the Resolution are set out below: The duration of the regulatory period has been set at four years, with biennial revision of the RAB and of controllable
opex. The cost of debt and tax expense may be reviewed every two years in the event of “significant changes”. There is further support for the consolidation process, allowing for tariffs to be standardised in the event of a combination
of operators holding concessions for different areas. A system of quality performance rewards and penalties has been introduced. The reward component is excluded
from any tariff caps. Application of a tariff multiplier has been confirmed. The "sharing" mechanism has been confirmed, based on a matrix that penalises the least efficient operators. The mechanism for allowing for a portion of late payment costs has been defined (80% of the costs effectively incurred by
operators), taking into account the varying impact of this problem throughout the country (North: 2.1% of turnover; Central: 3.8% of turnover; South: 7.1% of turnover) and providing incentives for the adoption of efficient credit management solutions.
The “ψ” parameter, on which determination of the component intended to pre-finance the cost of new investment (FNI), may be selected within a range of 0.4-0.8.
The distinction between non-controllable and controllable opex has been retained. Costs linked to the integration of operations and/or significant improvements in service quality are also allowed for.
The cost of debt has been set at 2.8% (compared with 2% for the electricity sector). The ERP (Equity Risk Premium) is 4% (compared with 5.5% for the electricity sector). The real RF (Risk Free) rate is 0.5%, determined on the basis of yields on 10-year euro area government bonds with ratings of
at least “AA” (in line with the electricity sector). The WRP (Water Risk Premium) is 1.5% (compared with a CRP – Country Risk Premium – of 1% used in the electricity sector). The 1% time-lag for capex has been confirmed. Based on the provisions in the Resolution, the WACC for the Water sector is 5.34% (compared with 6.1% for the regulatory period 2014-2015 and 6.4% for the period 2012-2013).

50 Acea Group: 2016-2020 Business Plan Grids
Electricity Distribution regulatory framework
Acea Group Presentation
RESOLUTION 654/2015 and 583/2015 “Tariff regulation for the supply of electricity transmission, distribution and metering services in the regulatory period 2016-2023” (December, 2015) “Rate of return on capital invested in infrastructure services in the electricity and gas sectors: criteria for determination and revision” (December, 2015)
The Regulator has extended the duration of the regulatory period to eight years, dividing it into two sub-periods, each lasting four years. In the second sub-period (2020-2023), a Totex-based approach will be introduced. Key points in the Resolution are set out below: • Opex based on 2014 figures. • Equal allocation of productivity improvements (sharing) among users and operators (50%-50%). • Greater selectivity applied to capex, with particular attention paid to service quality. • A reduction in the time-lag from 2 to 1 year. • Confirmation of the determination of net working capital with reference to parameters based on net fixed assets, applying a lower
percentage than the one applied in previous regulatory periods.
GAS GRIDS
The WACC is fixed for two years (2016-2017) for the transmission service and for three years (2016-2018) for gas distribution
and storage:
Gas transmission: 5.4% (compared with the previous 6.3%);
Gas distribution: 6.1% (compared with the previous 6.9%);
Storage: 6.5% (compared with the previous 6.0%).
ELECTRICITY GRIDS
The WACC is fixed for three years (2016-2018) for the electricity transmission and distribution
Electricity transmission: 5.3% (compared with the previous 6.3%)
Electricity distribution: 5.6% (compared with the previous 6.4%)

51 Acea Group: 2016-2020 Business Plan
Main assumptions 2015
2016 Plan
2017 Plan
2018 Plan
2019 Plan
2020 Plan
Exchange $/€ 1.110 1.119 1.031 1.082 1.180 1.220
Brent $/Bbl 52.4 53.6 61.8 66.9 69.0 75.0
PUN €/MWh 52.3 47.7 45.8 46.8 47.6 48.6
Green certificates €/MWh 100.1 102.0 104.7 103.9 103.3 102.5
EU-ETS €/tons of CO2 7.7 10.8 10.3 12.2 13.3 14.5
CIP6 €/MWh 224.6 217.9 225.6 227.0 224.4 226.8
Main assumptions
ACEA Group

52 Acea Group: 2016-2020 Business Plan ACEA Group
Sensitivity to oil prices (dollar per barrel impact in €m on Group EBITDA) GROUP EBITDA +1$/Barrel 0.14€m
Sensitivity to PUN prices (impact in €m on Group EBITDA) GROUP EBITDA +1€/MWh 0.7€m
Sensitivity analysis on key drivers

53 Acea Group: 2016-2020 Business Plan Acea Group Presentation ACEA Group
Benchmark, Index, Assessment: positive evaluations of Acea’s sustainability performances
ACEA – SUSTAINABILITY Acea is assessed by leading analysts, rating Agencies and ESG asset managers: • Oekom Research • Vigeo • KeplerCheuvreux • Forum Ethibel • Kempen SNS
Environmental sustainability
54 Acea Group: 2016-2020 Business Plan Acea Group Presentation ACEA Group
Environmental sustainability
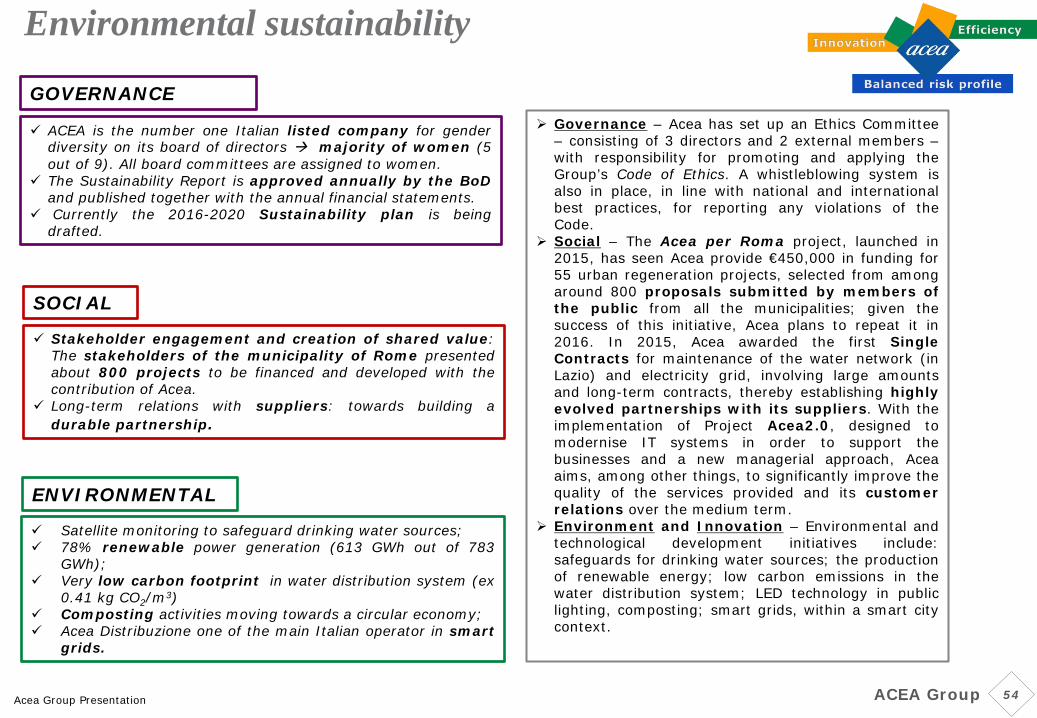
ACEA is the number one Italian listed company for gender diversity on its board of directors majority of women (5 out of 9). All board committees are assigned to women.
The Sustainability Report is approved annually by the BoD and published together with the annual financial statements.
Currently the 2016-2020 Sustainability plan is being drafted.
Stakeholder engagement and creation of shared value: The stakeholders of the municipality of Rome presented about 800 projects to be financed and developed with the contribution of Acea.
Long-term relations with suppliers: towards building a durable partnership.
GOVERNANCE
SOCIAL
ENVIRONMENTAL
Governance – Acea has set up an Ethics Committee – consisting of 3 directors and 2 external members – with responsibility for promoting and applying the Group’s Code of Ethics. A whistleblowing system is also in place, in line with national and international best practices, for reporting any violations of the Code.
Social – The Acea per Roma project, launched in 2015, has seen Acea provide €450,000 in funding for 55 urban regeneration projects, selected from among around 800 proposals submitted by members of the public from all the municipalities; given the success of this initiative, Acea plans to repeat it in 2016. In 2015, Acea awarded the first Single Contracts for maintenance of the water network (in Lazio) and electricity grid, involving large amounts and long-term contracts, thereby establishing highly evolved partnerships with its suppliers. With the implementation of Project Acea2.0, designed to modernise IT systems in order to support the businesses and a new managerial approach, Acea aims, among other things, to significantly improve the quality of the services provided and its customer relations over the medium term.
Environment and Innovation – Environmental and technological development initiatives include: safeguards for drinking water sources; the production of renewable energy; low carbon emissions in the water distribution system; LED technology in public lighting, composting; smart grids, within a smart city context.
Satellite monitoring to safeguard drinking water sources; 78% renewable power generation (613 GWh out of 783
GWh); Very low carbon footprint in water distribution system (ex
0.41 kg CO2/m3) Composting activities moving towards a circular economy; Acea Distribuzione one of the main Italian operator in smart
grids.
55 Acea Group: 2016-2020 Business Plan Acea Group Presentation ACEA Group
Environmental sustainability
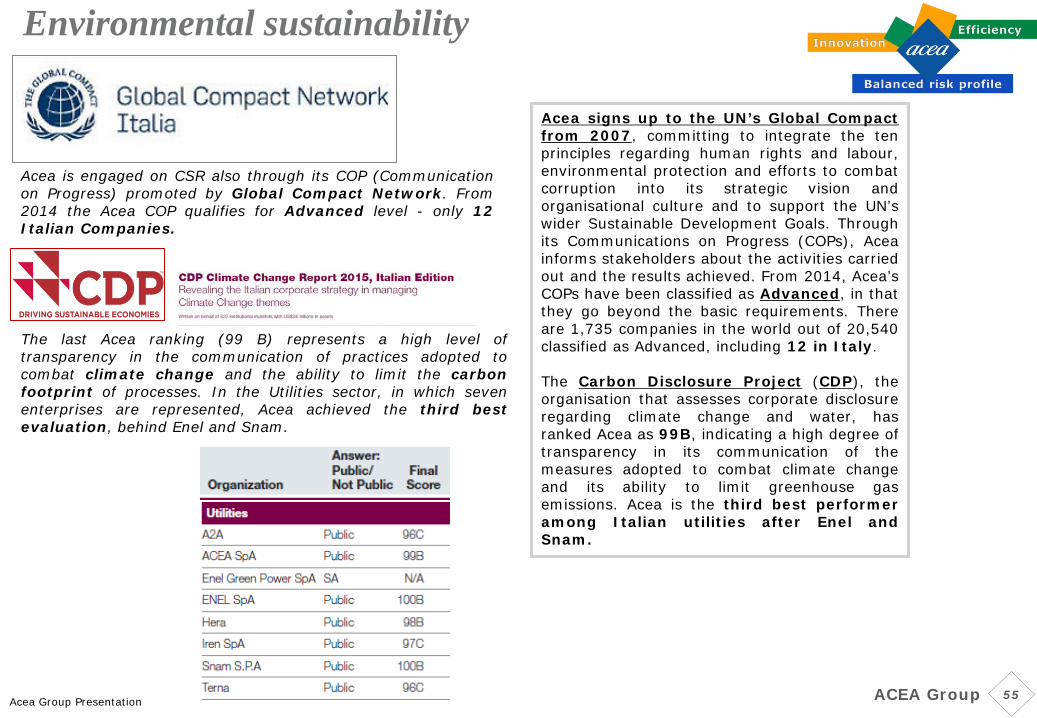
Acea is engaged on CSR also through its COP (Communication on Progress) promoted by Global Compact Network. From 2014 the Acea COP qualifies for Advanced level - only 12 Italian Companies.
Acea signs up to the UN’s Global Compact from 2007, committing to integrate the ten principles regarding human rights and labour, environmental protection and efforts to combat corruption into its strategic vision and organisational culture and to support the UN’s wider Sustainable Development Goals. Through its Communications on Progress (COPs), Acea informs stakeholders about the activities carried out and the results achieved. From 2014, Acea’s COPs have been classified as Advanced, in that they go beyond the basic requirements. There are 1,735 companies in the world out of 20,540 classified as Advanced, including 12 in Italy. The Carbon Disclosure Project (CDP), the organisation that assesses corporate disclosure regarding climate change and water, has ranked Acea as 99B, indicating a high degree of transparency in its communication of the measures adopted to combat climate change and its ability to limit greenhouse gas emissions. Acea is the third best performer among Italian utilities after Enel and Snam.
The last Acea ranking (99 B) represents a high level of transparency in the communication of practices adopted to combat climate change and the ability to limit the carbon footprint of processes. In the Utilities sector, in which seven enterprises are represented, Acea achieved the third best evaluation, behind Enel and Snam.

56 Acea Group: 2016-2020 Business Plan Acea Group Presentation ACEA Group
Environmental sustainability
Acea is ready to comply with upcoming disclosure obligations and grasp the opportunities arising from the strategic management of
aspects of ESG in its operations, to ensure the sustainable creation of shared value
2017 EU Directive 95/2014 as regards
disclosure of non-financial and diversity information
2016 Corporate Governance Code for Listed
Companies and application of corporate social responsibility principles
Coming soon: next challenges concerning Sustainability

57 Acea Group: 2016-2020 Business Plan
Disclaimer
Acea Group Presentation
THIS PRESENTATION CONTAINS CERTAIN FORWARD-LOOKING STATEMENTS THAT REFLECT THE COMPANY’S MANAGEMENT’S CURRENT VIEWS WHIT RESPECT TO FUTURE EVENTS AND FINANCIAL AND OPERATIONAL PERFORMANCE OF THE COMPANY AND ITS SUBSIDIARIES.
THESE FORWARD-LOOKING STATEMENTS ARE BASED ON ACEA S.P.A.’S CURRENT EXPECTATIONS AND PROJECTIONS ABOUT FUTURE EVENTS. BECAUSE THESE FORWARD-LOOKING STATEMENTS ARE SUBJECT TO RISKS AND UNCERTAINTIES, ACTUAL FUTURE RESULTS OR PERFORMANCE MAY DIFFER MATERIALLY FROM THOSE EXPRESSED IN OR IMPLIED BY THESE STATEMENTS DUE TO ANY NUMBER OF DIFFERENT FACTORS, MANY OF WHICH ARE BEYOND THE ABILITY OF ACEA S.P.A. TO CONTROL OR ESTIMATE PRECISELY, INCLUDING CHANGES IN THE REGULATORY ENVIRONMENT, FUTURE MARKET DEVELOPMENTS, FLUCTUATIONS IN THE PRICE AND AVAILABILITY OF FUEL AND OTHER RISKS.
YOU ARE CAUTIONED NOT TO PLACE UNDUE RELIANCE ON THE FORWARD-LOOKING STATEMENTS CONTAINED HEREIN, WHICH ARE MADE ONLY AS OF THE DATE OF THIS PRESENTATION. ACEA S.P.A. DOES NOT UNDERTAKE ANY OBLIGATION TO PUBLICLY RELEASE ANY UPDATES OR REVISIONS TO ANY FORWARD-LOOKING STATEMENTS TO REFLECT EVENTS OR CIRCUMSTANCES AFTER THE DATE OF THIS PRESENTATION.
THIS PRESENTATION DOES NOT CONSTITUTE A RECOMMENDATION REGARDING THE SECURITIES OF THE COMPANY.
***
PURSUANT TO ART. 154-BIS, PAR. 2, OF THE UNIFIED FINANCIAL ACT OF FEBRUARY 24, 1998, THE EXECUTIVE IN CHARGE OF PREPARING THE CORPORATE ACCOUNTING DOCUMENTS AT ACEA, DEMETRIO MAURO – CFO OF THE COMPANY - DECLARES THAT THE ACCOUNTING INFORMATION CONTAINED HEREIN CORRESPOND TO DOCUMENT RESULTS, BOOKS AND ACCOUNTING RECORDS.
ACEA Group
