2015 - sharedata
TRANSCRIPT

2015AUDITED RESULTS
Brait SE (Registered in Malta as a European Company)(Registration No. SE1)Share code: BAT ISIN: LU0011857645Share code: BATPISIN: MT0000680208(“Brait”, the “Company” or “Group”)
FOR THE YEAR ENDED31 MARCH 2015

Audited results for the year ended 31 March 2015
DisclaimerThis booklet may contain certain forward-looking statements with respect to the financial condition and results of operations of the Group, which by their nature, involve risk and uncertainty as they relate to events and depend on circumstances that may occur in the future.
Item Page reference
Section 1: Brait results presentation FYE 31 March 2015 3• Agenda 4• Highlights FYE 31 March 2015 5• BraitNAVanalysis As at 31 March 2015 8• Brait’sauditedresults FYE 31 March 2015 13• Pepkor Investment returns 17• Premier Results: 9 months ended 31 March 2015 18• Brait’snewacquisitions: – VirginActive Introductory presentation 36 – NewLook Introductory presentation 55 – Attractions to Brait 78• IcelandFoods Results: FYE 31 March 2015 79• Conclusion 113
Section 2: Appendices 114• Braitoverview 115• Summarisedfinancialinformation: – Premier 120 – Iceland Foods 123 – Other investments 127
Section 3: Brait audited results announcement FYE 31 March 2015 134

4 Audited results for the year ended 31 March 2015
Results presentation FYE 31 March 2015
4
Agenda
Welcome
Brait Audited results: FYE 31 March 2015
Pepkor Investment returns
Premier Results: 9 months ended 31 March 2015
Virgin Active Introductory presentation
New Look Introductory presentation
Iceland Foods Results: FYE 31 March 2015
Conclusion

5 Audited results for the year ended 31 March 2015
Highlights FYE 31 March 2015
5
NAV per share
R77.12
Increase on FY2014’s R31.95 NAV per share • 141.4%
Uplift primarily due to the realisation of Pepkor • 7.0x cost multiple• 69.5% IRR
3 year CAGR (benchmark of 15%)• 55.3% on reported NAV per share• 55.8% including bonus shares issued / cash dividend paid
Dividends
Proposed ordinary share bonus issue (with cash dividend alternative) • 77.12 cents per share (141.4% increase on FY2014)
Preference share dividend declared (for the six months ended 31 March 2015) • 479.68 cents per share (R95.9m in total)
Investment portfolio flows
Pepkor realised on 30 March 2015• R30.010bn total consideration received:
− R15.086bn cash− R14.924bn value for 200m Steinhoff shares (1)
Rest of portfolio • R746m received • R841m invested
(1) Valued at the 30 March 2015 closing Steinhoff share price of R74.62

6 Audited results for the year ended 31 March 2015
Highlights FYE 31 March 2015
6
Virgin Active
• Brait announced on 16 April 2015 the acquisition of a c.80% interest in Virgin Active, a leading international health club operator, for c.£682m (1)
• Brait will partner alongside an experienced management team, the founder and the Virgin Group
New Look
• Brait announced on 15 May 2015 the acquisition of a c.90% interest in New Look, a leading fast fashion multichannel retailer operating in the value segment, for c.£780m (expected completion date of 25 June 2015)
• Brait will partner alongside an experienced management team and the founder
• New Look raised £1.2 billion in Bonds (12 June 2015) • Proceeds raised will refinance existing debt resulting in average cost (pre-FX hedging) reducing from 9.42% to 6.25%
Brait’s inclusionin indices
• MSCI Emerging Markets Index on 28 August 2014
• FTSE / JSE Africa Series Top 40 Index on 22 June 2015
(1) Virgin Active acquisition remains subject to approval by the South African and Namibian competition authorities

7 Audited results for the year ended 31 March 2015
Highlights FYE 31 March 2015
7
Performance against targets
Performance metric Position at 31 March 2015
1 NAV CAGR > 15% per year over any 3 year period a • 55.3% CAGR since 31 March 2012 ‒ 55.8% CAGR including bonus shares issued / dividends paid
2 Dividend: 1% - 2.5% of closing NAV ‒ (bonus shares or cash election) a • FY15: 1% of R77.12 NAV proposed (141% up on FY14)
‒ FY14: 1% of R31.95 (92% of shareholders elected bonus shares)
3 Operating costs: < 0.85% of Brait AUM a• 0.44% of Brait AUM (1)
• 0.27% net after fee income (1)
4 Minimal cash drag: < 25% of NAV X• 34.7% of NAV (33.0% of total assets)
‒ Ratio distorted by Pepkor cash consideration received 30 March 2015 ‒ Normalises post Virgin Active and New Look acquisitions
5 Primarily unlisted investments X• Target remains a primarily unlisted investment portfolio
‒ Steinhoff shareholding received as consideration for the Pepkor realisation‒ Brait will seek opportunities to reduce holding in an orderly manner
6 Demonstrate cash flow within underlying investments a • Strong EBITDA cash flow conversion across portfolio
(1) AUM represents the aggregate of the Group’s total assets and Brait IV invested capital under management. Percentages quoted based on closing FY15 AUM. Using average AUM as the reference basis, operating costs are 0.60% and net after fee income 0.36%

8 Audited results for the year ended 31 March 2015
Brait NAV Analysis
8(1) Restated as a result of adoption of IFRS 10 Consolidated Financial Statements. No impact on reported NAV per share; reclassifications not material
Restated (1)
AuditedRestated (1)
Audited Audited
Amounts in R'm 31 March 2013 31 March 2014 31 March 2015
Investments 13,151 87% 17,229 93% 27,144 66%Pepkor 9,278 61% 11,145 60% - -Steinhoff - - - - 15,206 37%Premier 1,463 10% 3,053 17% 8,241 20%Iceland Foods 1,449 10% 1,513 8% 1,259 3%Other investments 961 6% 1,518 8% 2,438 6%
Loan receivable 1,399 9% 523 3% 574 1%Cash and equivalents 493 3% 320 2% 13,689 33%Property and equipment 10 - 8 - - -Accounts receivable 88 1% 342 2% 12 -
Total assets 15,141 100% 18,422 100% 41,419 100%
Borrowings (141) (164) -Accounts payable and other liabilities (73) (47) (86)
Total liabilities (214) (211) (86)
Preference share equity (1,469) (1,964) (1,964)
NAV: ordinary shareholders 13,458 16,247 39,369
Number of issued ordinary shares ('m) excluding treasury 505.2 508.5 510.5
NAV per share R26.64 R31.95 R77.12

9 Audited results for the year ended 31 March 2015
Brait NAV Analysis
9
Rolling CAGR: reported NAV
Commencing 1 April 2011, Brait’s performance benchmark for NAV growth is to exceed 15% CAGR over any three year period
1-Apr-11 FY 2012 FY 2013 FY 2014 FY 2015
Reported NAV per ordinary share R16.50 R20.59 R26.64 R31.95 R77.12
Rolling 3-year CAGR (1) - 24.8% 27.1% 24.6% 55.3%
Adjustment: ordinary share dividend (2) - - R0.2059 R0.4723 R0.7918
• 1% of March 2012 NAV of R20.59 - - R0.2059 R0.2059 R0.2059
• 1% of March 2013 NAV of R26.64 - - - R0.2664 R0.2664
• 1% of March 2014 NAV of R31.95 - - - - R0.3195
Adjusted NAV per ordinary share R16.50 R20.59 R26.85 R32.42 R77.91
Rolling 3-year CAGR (including dividends) (1) - 24.8% 27.6% 25.2% 55.8%
(1) Period for which quoted CAGR calculated 1-Apr-11 to 31-Mar-12 1-Apr-11 to 31-Mar-13 1-Apr-11 to 31-Mar-14 1-Apr-12 to 31-Mar-15
(2) Percentage of ordinary shareholders that elected the receipt of bonus shares for respective year’s dividend Not applicable 85% 91% 92%
Note: The four year CAGR (1-Apr-11 to 31-Mar-15) for Reported NAV per share is 47.0%; including dividends is 47.4%

10 Audited results for the year ended 31 March 2015
Brait NAV analysis
10
Reported assets and % weighting
(1) Reported NAV per share(2) The Other investments category in the above chart includes accounts receivable
50%57%
61%60%
37%
11%10%
10%
17%
20%
8%
10%
8%
3%
14%
9%
7%
10%
6%
12%
12%
9%
3%
1%
13%
4%
3%
2%
33%
R9,789R11,794
R15,141
R18,422
R41,419
-
5,000
10,000
15,000
20,000
25,000
30,000
35,000
40,000
Rights-offer Mar-12 Mar-13 Mar-14 Mar-15
R'm
Pepkor Steinhoff Premier Iceland Foods Other investments Loan receivable Cash and equivalents(2)
(1) R16.50 R20.59 R26.64 R31.95 R77.12(1) (1) (1) (1)

11 Audited results for the year ended 31 March 2015
Brait NAV analysis
11
Pro forma assets and % weighting
Pro forma assumptions applied
AuditedMar-15
R’m
Pro forma adjustments
R’m
Pro forma carrying
valueR’m
% of Total
Assets
Steinhoff 15,206 (15,206) 1 - -
Premier 8,241 - 8,241 20%
Virgin Active - 12,549 2 12,549 30%
New Look - 14,352 3 14,352 35%
Iceland Foods 1,259 - 1,259 3%
Other investments 2,450 - 2,450 6%
Loan receivable 574 - 574 1%
Cash 13,689 (11,695) 4 1,994 5%
Total assets 41,419 - 41,419 100%
Notes:
1 On the basis that Steinhoff is not a long term holding for Brait, pro forma assumption is to reflect this holding as realised
2 Pro forma carrying value for Virgin Active based on estimated cost of £682m (16-Apr-2015 announcement) translated using assumed £/R exchange rate of R18.40
3 Pro forma carrying value for New Look based on estimated cost of £780m (15-May-2015 announcement) translated using assumed £/R exchange rate of R18.40
4 Pro forma decrease in carrying value for cash is based on assumption of maintaining Total Assets at the 31-Mar-2015 reported total R41,419m for comparability
37%
20%
20%
3%
3%
6%
6%
1%
1%
33%
5%
30%
35%
R41,419 R41,419
-
5,000
10,000
15,000
20,000
25,000
30,000
35,000
40,000
Audited Mar-15 Pro forma
Steinhoff Premier Iceland FoodsOther Investments Loan receivable Cash and equivalentsVirgin Active New Look
R’m

12 Audited results for the year ended 31 March 2015
Brait NAV analysis
12
EV/EBITDA multiples to 31 March 2015
Peer group for Premier
Tiger Brands
Pioneer Foods
Peer group for Iceland Foods
Tesco
Sainsbury
WM Morrison
Booker
Poundland (included from Jun-14)
Legend Brait valuation multiple discount
Brait valuation multiple Premier Iceland Foods
Trailing 3 year peer average multiple - 21%
Peer average multiple at reporting date 16% 30%
6.5 x 6.5 x 6.5 x 7.5 x12.3 x9.5 x 10.3 x 11.0 x 11.5 x
12.3 x10.9 x12.8 x 12.4 x
13.4 x 14.6 x
3.0 x
6.0 x
9.0 x
12.0 x
15.0 x
Mar-13 Sep-13 Mar-14 Sep-14 Mar-15
MultiplePremier
6.5 x 6.5 x 6.5 x 6.5 x 7.5 x8.4 x 8.8 x 9.1 x 9.2 x 9.5 x
9.8 x10.5 x 10.6 x
9.3 x10.7 x
3.0 x
6.0 x
9.0 x
12.0 x
Mar-13 Sep-13 Mar-14 Sep-14 Mar-15
Multiple Iceland Foods

13 Audited results for the year ended 31 March 2015
Brait’s audited results: FYE 31 March 2015
13
Summarised statement of comprehensive incomeRestated
March 2015 March 2014
R’m R’m
Investment gains (1) 22,979 2,683Interest 261 225Dividend income 147 83Fees 80 93Foreign exchange gains 123 48
Income 23,590 3,132
Operating expenses (201) (143)
Profit from operations 23,389 2,989
Finance costs and taxation (55) (44)
Profit for the year 23,334 2,945
Translation adjustments (1) 9 16
Comprehensive income for the year 23,343 2,961
(1) The March-14 reported values have been restated as a result of the adoption of IFRS 10: Consolidated Financial Statements. The primary effect of the restatement is to reclassify the Translation Adjustment on the GBP investment in Iceland Foods to Investment Gains. This results in a corresponding restatement to Profit for the year, with no impact to the reported Comprehensive Income for the year

14 Audited results for the year ended 31 March 2015
Brait’s audited results: FYE 31 March 2015
Operating expenses to AUM: Performance metric <0.85%
14
March 2015 March 2014
R’m R’m
Total assets 41,419 18,423
Brait IV invested capital under management 3,867 3,471
Total closing AUM 45,286 21,894
Operating costs 201 144
Fee income (80) (72)
Operating costs after fee income 121 72
Ratios based on closing AUM:
- Operating costs to AUM 0.44% 0.66%
- Operating costs after fee income to AUM 0.27% 0.33%
Note: Using average AUM as the reference basis, FY2015 operating costs are 0.60% and net after fee income 0.36%

15 Audited results for the year ended 31 March 2015
Brait’s audited results: FYE 31 March 2015
15
Investment proceeds 14,671Pepkor realisation: Cash proceeds received 15,086
Less: settlement of SPV gearing (1,161)Portfolio inflows 746
Share of Pepkor’s June 2014 dividend received (1) 228Premier 424
Repayment of short term loan receivable 330Interest received 94
Other investments 94Realisation proceeds 64Fees received 30
Other fees received 54Interest received - bank 19Operating expenses paid (214)Interest and taxation paid (56)Operating cash flow (excluding purchase of investments) 14,474Purchase of investments (841)
Premier (shareholder loan funding for acquisitions and exercise of put and call options) (596)Southern View Finance (“SVF” capital raise by way of specific share issue during November 2014) (234)Other investments (11)
Net cash flow from operating activities 13,633Net repayment of long term borrowings (164)Net purchase of treasury shares (22)Ordinary dividend paid (cash election) (14)Preference dividend paid (185)
Net increase in cash and cash equivalents 13,248
(1) Dividend income in the statement of comprehensive income reflects the R147m relating to Brait’s direct shareholding in Pepkor. Brait’s indirect share of R81m was received by way of capital distribution from the Pepkor SPV and is thus recognised under investment gains
Summarised cash flows (R’m)

16 Audited results for the year ended 31 March 2015
Brait’s audited results: FYE 31 March 2015
16
(1) RestatedMarch
2015R’m
March 2014R’m
Net increase / (decrease) in cash and cash equivalents 13,248 (219)Effects of exchange rate changes on cash and cash equivalents 121 46Cash and cash equivalents at beginning of year 320 493
Cash and cash equivalents at end of year 13,689 320
Comprising:
ZAR cash 3,034 161USD cash 178 159GBP cash (2) 10,477 -
Cash and cash equivalents 13,689 320
Available from undrawn gearing facilities (3) 16,500 2,311
Total cash and available facilities 30,189 2,631
(1) Comparatives restated as a result of adoption of IFRS 10. The effect is to reclassify cash held by subsidiaries designated as ‘Investment Entities at fair value through profit and loss’ to the investments line of the statement of financial position
(2) GBP cash holding at 31 March 2015 is placed with five banks, each having an investment grade credit rating
(3) Gearing facilities increased post year-end to facilitate the funding of New Look and Virgin Active acquisitions
Analysis of cash position

17 Audited results for the year ended 31 March 2015
Steinhoff offer25-Nov-2014
Per the 25 November 2015 detailed terms announcement, Steinhoff International Holdings (“Steinhoff”) offered a total consideration of R26.4 billion for Brait’s effective 37.06% interest in Pepkor, to be settled through a combination of:
• Cash amount of R15 billion • 200 million Steinhoff ordinary shares issued at a price of R57 per share (such price guaranteed by Steinhoff for 12 months to 30 March 2016)
Shareholder vote
The ordinary resolutions necessary to authorise the transaction were passed by a 99.8% majority of Brait’s shareholders present and voting at the Extraordinary General Meeting held on 27 January 2015
Effective date30-Mar-2015
All conditions precedent to the disposal of Brait’s effective 37.06% interest in Pepkor to Steinhoff were fulfilled by 30 March 2015Brait received a total consideration from Steinhoff of R30.010 billion, comprising:• Cash of R15.086 billion (which included a purchase price escalation calculated from 1 March 2015)• Value of R14.924 billion for the 200 million Steinhoff ordinary shares received (closing Steinhoff share price on 30 March 2015 was R74.62)
Pepkor
17
Investment returns
Implied metrics Based on Steinhoff offer price R’m
Based on total consideration receivedR’m
Consideration to Brait 26,400 30,010
Brait’s effective interest in Pepkor 37.06% 37.06%
Implied Equity Value for Pepkor 71,242 80,985
Pepkor net debt (1) 2,140 2,140
Implied Enterprise Value for Pepkor 73,382 83,125
Pepkor EBITDA (1) 3,994 3,994
Implied EV/EBITDA multiple (2) 18.4x 20.8x
Implied PE multiple (3) 37.4x 42.5x
(1) Per Pepkor audited Jun-14 financial statements(2) Calculated as Implied Enterprise Value for Pepkor; divided by Pepkor’s FY14 EBITDA from Continuing Operations of R3.994 billion(3) Calculated as Implied Equity Value for Pepkor; divided by Pepkor’s FY14 Net Profit from Continuing Operations of R1.906 billion

19 Audited results for the year ended 31 March 2015
Premier
19
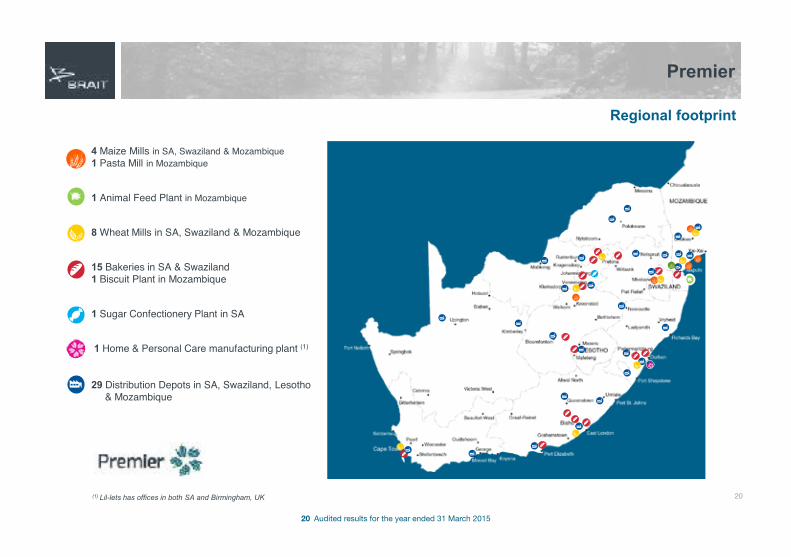
Business overview
• A leading staple foods producer with the strategic intent to be a FMCG manufacturer offering branded and
private label FMCG solutions
• Strong heritage brands dating back to 1852
− Snowflake (wheat flour), Iwisa No 1 (maize meal), Blue Ribbon (bread)
− Lil-lets (feminine hygiene), Manhattan and Super C (sugar confectionery)
• Operates through a wide footprint
− 15 bakeries, 8 wheat mills, 4 maize mills, a sugar confectionery plant, a feminine hygiene manufacturing plant, a
biscuit plant, a pasta plant and an animal feeds plant
− 29 distribution depots in South Africa, Swaziland, Lesotho and Mozambique, with a Lil-lets sales office in the UK
• On a large scale
− Sells c.550 million loaves of bread and 1 million tons of maize and wheat per year
− Makes over 45,000 deliveries daily with a fleet of c.930 bakery trucks and
− Employs 8,650 people
• Serves all channels to the market with significant exposure to the informal market which accounts for 70% of
bread sales volumes
20 Audited results for the year ended 31 March 2015
Premier
20
Regional footprint
29 Distribution Depots in SA, Swaziland, Lesotho & Mozambique
8 Wheat Mills in SA, Swaziland & Mozambique
15 Bakeries in SA & Swaziland1 Biscuit Plant in Mozambique
4 Maize Mills in SA, Swaziland & Mozambique1 Pasta Mill in Mozambique
1 Sugar Confectionery Plant in SA
1 Home & Personal Care manufacturing plant (1)
(1) Lil-lets has offices in both SA and Birmingham, UK
1 Animal Feed Plant in Mozambique

21 Audited results for the year ended 31 March 2015
Premier
21
(R’m)(1) YTD FY15 Growth
(1) YTD FY14
FY2014 Commentary
Net revenue 6,720 31% 5,141 7,750• Revenue growth of 31%; LFL growth of 21% (excluding acquisitions)• Volumes increase on prior period: 27% for bread (9% LFL (excluding Star Bakeries));
4% for maize; 3% for wheat; 39% for sugar confectionery; 12% for Lil-lets
EBITDA (2)
% Margin6149.1% 70% 362
7.0%5737.4%
• EBITDA margin expansion continues due to:‒ repositioning bread quality and brand has enabled Premier to lift prices‒ focus on manufacturing and distribution efficiency‒ introduction of higher margin FMCG products
• Reinvested profits in brands and people to build business: ‒ marketing expenditure up 67% on the prior period‒ in-sourcing labour at all sites
EBIT (2)
% Margin4196.2% 51% 277
5.4%4385.7%
(1) Results for 9 months YTD FY15 exclude CIM (acquired in March 2015); 9 months YTD FY14 exclude Lil-lets and Star Bakeries (2) Before non-recurring costs (YTD FY15: R7m; YTD FY14: R13m; FY14: R53m)
YTD 9 months ended 31 March 2015
(R’m) YTD FY15 Growth YTD
FY14FY
2014 Commentary
Cash from operations% EBITDA
33555% 33% 251
69%52491%
• Rising commodity prices in YTD FY15 led to a higher working capital absorption of R241m (YTD FY14: R148m)
Capex (425) 51% (281) (408)
• Focus continues on funding capex programme from operational cash flows• c.60% is expansionary capex. Major projects invested in during YTD FY15 include:
‒ a new bakery line in Durban (commissioned in Nov-14); ‒ a new bakery line in Cape Town (commissioned in Feb 15); and ‒ work on a new wheat mill in Durban (to be commissioned in H1 of FY16)
• Significant investment into vehicle fleet to improve efficiencies
Operating cash flow post capex% EBITDA
(90)(15%)
(200%) (30)(8%)
11620%
• Function of above

22 Audited results for the year ended 31 March 2015
Premier
22
Trading performance since implementation of five year strategic plan
4,896
5,731
6,272
7,750
8,531
222
289
422
573
775
4.5%
5.0%
6.7%
7.4%
4%
5%
6%
7%
8%
9%
10%
4,000
5,000
6,000
7,000
8,000
9,000
2011 2012 2013 2014 2015 LTM
Rm
Revenue(LHS) EBITDA(LHS) EBITDA margin(RHS)
9.1%
For the three years to 30 June 2014, Premier has:• Grown revenue by 58% at a CAGR of 17%
• Grown EBITDA by 158% at a CAGR of 37%
• Expanded its EBITDA margin from 4.5% in FY11 to 7.4% in FY14
• Tracking 9.1% based on the Last Twelve Months (LTM) to March 2015
This strong trading performance is attributable to the 3 pillars of Premier’s growth strategy:• Optimising milling and baking operations by investing in people, brands and assets
• Converting from a staple foods producer to an FMCG branded business
• Geographic expansion

23 Audited results for the year ended 31 March 2015
Premier
23
Acquisitions to date (1)
Company Date acquired Business description
1. Acquired assets of SwazilandUnited Bakeries andMister Bread in Swaziland
Feb 2012 Acquired a controlling stake in in the two leading bakeries in Swaziland and created Premier Swazi Bakeries. Bought out minorities during March 2015
2. Manhattan and Super C May 2013 Entry into sugar confectionery sub-categories of gums & jellies, marshmallows and compressed tablets
3. Star Bakeries Nov 2013Bakeries in Eastern Cape giving Premier a national SA bread footprint; ‘Mister Bread’ and ‘Star’ brands
4. Lil-lets Nov 2013 Leading brand in feminine hygiene with operations in the UK and SA
5. Ngwane Mills April 2014Largest wheat and maize miller in Swaziland to complement Premier Swazi Bakeries’ operations
6. Mister Bread Milling March 2015An Eastern Cape flour mill currently supplying c.50% of the Eastern Cape bakeries’ flour requirements
7. La Femme March 2015Durban based business manufacturing tampons for Lil-lets SA. Provides entry into in-sourcing all tampon production in SA and the UK
8. Companhia Industrial daMatola S.A. (CIM) March 2015
Acquired a controlling stake in the leading food producer in Mozambique with a diversified product range; maize, wheat, pasta, biscuit and animal feeds
(1) Premier has invested R2.2bn to date in these acquisitions at an average EV / EBITDA multiple of 7x

24 Audited results for the year ended 31 March 2015
Flagship national brands
Other national brands
Regional brands
Premier
24
South African milling and baking brands

25 Audited results for the year ended 31 March 2015
Acquired maize and
wheat milling operations in
Swaziland
New TV and social media
campaign launched for Blue
Ribbon
Commissioned 3rd
bakery line at Durban bakery (R120m project which increasedcapacity by 50%)
All mills and 3 of Premier’s
bakeries obtain
FSSC 2200 accreditation (a first in SA)
Premier commences
refinance and restructure of bakery fleet;in-sources
milling distribution
Premier
25
Pillar 1 – Optimising milling and baking operations by investing in people, brands and assetsFocus has been on:
‒ Changing bread positioning (packaging, range, recipe) from a “price fighter” brand to a strong “challenger” brand
‒ Developing people to build a winning team and bolster the company leadership
‒ Upgrading assets to use latest technology to have “best of breed” equipment in bakeries
Acquired twobakeries in
Swaziland and formed Premier Swazi Bakeries
Recruited new
executive to head
bakeries
Re-launched “Blue Ribbon”
brand and added a range of “value add”
loaves
July2011
Feb2012
Nov2012
Sept2013
Nov 2013
Dec2013
April2014
Aug2014
Aug2014
Nov2014
Feb2015
Feb2015
Mar2015
Acquired Star Bakeries in the Eastern
Cape
Launched new recipe
and pan-size for Blue
Ribbon and BB bread
Commissioned 3rd
line at Cape Town bakery
(R250m project which increased capacity by 36%)
Acquired Mr Bread Milling, a wheat mill in
the Eastern Cape
Re-launched “Iwisa” maize
brand

26 Audited results for the year ended 31 March 2015
Premier
26
Pillar 1 – Optimising milling and baking operations by investing in people, brands and assetsCategory Premier brand Trading update: 9 months ended 31 March 2015
Bread
• Blue Ribbon
• BB Bread
• Star Bread
• Mister Bread
• SUB Bread
• Bread sales volumes up 27%; 9% LFL (excluding Star Bakeries which was acquired in November 2013)
• Despite aggressive competition in the formal channel, Premier has retained its formal market share to March 2015 and
grown LFL informal sales volumes by 11%
• Improved depth of distribution in retail channel (e.g. strike rate for Spar increased from c.50% to c.70%)
• Grew volumes in KZN by 16% despite a fire in the Durban bakery in February 2015 which has been mitigated by the
acquisition of an independent bakery in Durban (Masterbake)
Maize
• Iwisa
• Invicta
• Nyala
• Super Sun
• Maize sales volumes up 4% (including Ngwane Mills acquisition in April 2014)
• Maize value market share in the formal sector in line with the prior year
• Improved margin management by linking selling prices to commodity prices
Wheat• Snowflake
• Blue Ribbon
• Wheat sales volumes up 3% (including Ngwane Mills acquisition in April 2014)
• Consumer flour sales only account for 33% of Premier’s total flour sales. Focus on margin management means that
Snowflake trades at a significant value / volume premium
• Snowflake won 2015 Product of the Year Innovation Awards for its Corn flour and Treats range
• Continued range extension in baking category (e.g. cake mixes, baking powder, corn flour) has reinforced Snowflake’s
leading position in the category

27 Audited results for the year ended 31 March 2015
Premier
27
Pillar 1 – InnovationsRe-launched Iwisa maize brand (Jul-11) Re-launched Blue Ribbon bread and added a range of “value-add” loaves (Sep-13)
New TV and social media campaign launched for Blue Ribbon (Feb-15)Re-launch of BB bread in Kwa Zulu Natal (Nov 2014)

28 Audited results for the year ended 31 March 2015
Acquired the assets and
operations of La Femme from Libstar Operations (Pty) Ltd, a
tampon manufacturer that supplies
Lil-lets SA tampons
Premier
28
Pillar 2 – Conversion from a staple food producer to an FMCG branded businessFocus has been on:
‒ Establishing a new business unit to house the non-staple foods FMCG products
‒ Acquiring businesses operating in other FMCG categories
‒ Organic expansion through innovation
Acquired Lil-lets, a feminine
hygiene business in the UK and SA
Recruited new
executive to head
Groceries
July2011
April 2013
May 2013
Nov2013
Nov 2013
Aug2014
Sept 2014
Mar2015
Mar2015
Acquired sugar
confectionery operations and brands (Manhattan, Super C and Romantics)
Re-launched Super C and extended the
range
Launched new
“Bubbles” range under Manhattan
Extended Snowflake
by launching dessert
range and baking aids
Launched Lil-lets
Feminine Hygiene Solutions
range

29 Audited results for the year ended 31 March 2015
Premier
29
Pillar 2 – Conversion from a staple food producer to an FMCG branded businessCategory Premier brand Trading update: 9 months ended 31 March 2015
Sugar
confectionery
• Manhattan
• Super C
• Grown volumes (39%) and market share by filling sales gaps in formal and informal sectors
• Focus on innovation:
− Sales from innovation (products launched in last 12 months) accounted for 22% of March 2015 sales
− New Manhattan Bubbles range has led to 2% market share gain in the formal sector
• Since acquisition in May 2013, market share has doubled to c.9%
Home &
Personal Care
(“HPC”)
• Lil-lets
• Dove (1)
• Vulco (2)
• South Africa:
− Stable market share (c.24% of formal Femcare sales by value)
− Won SA 2015 Product of the Year awards for sanitary pad range and feminine hygiene wipes
• United Kingdom:
− While the overall tampon market declined 5.5%, Lil-lets UK tampon sales down 0.7%
− Focus on Lil-lets’ teen range to recruit new customers in the UK
− Started selling products through distributors into China and the Middle East
(1) Licenced from Unilever Plc for cotton wool products in South Africa(2) Vulco is the No. 1 household glove brand in SA

30 Audited results for the year ended 31 March 2015
Premier
30
Pillar 2 – Innovations
Launched Lil-lets Feminine Hygiene Solutions range (Sept-14)
Launch of new Bubbles range under Manhattan (Aug-14)
Re-launched Super C and extended the range (Mar-15)
Extended Snowflake by launching dessert range and baking aids (Nov-13)

31 Audited results for the year ended 31 March 2015
Premier
31
Focus has been on:
‒ Expansion by acquisitions:
• Premier acquired two bakeries in Swaziland in February 2012 to create Premier Swazi
Bakeries and then integrated these with a milling operation (acquired in April 2014) to
form the leading milling and baking business in that country
• In March 2015, acquired controlling interest in CIM, the leading food manufacturer in
Mozambique
‒ Driving export sales of products from SA into other African countries:
• Export sales (1) YTD FY15 are R73.8m (135% up on prior period)
‒ In the current year Lil-lets (UK) has started selling products through distributors into China and
the Middle East
Pillar 3 – Geographic expansion
(1) Comprise direct export sales, sales through agents and sales to SA retailers for sale outside SA

32 Audited results for the year ended 31 March 2015
Premier
32
Pillar 3 – Geographic expansion
Acquired 68% of the shares in issue in CIM during March 2015
• CIM is a leading food manufacturer in Mozambique in operation since the mid-1940’s
• Revenue of R1.2bn and EBITDA of R115m
• Diversified product range of maize, wheat, pasta, biscuits and animal feed products
• Brands include:
‒ Maize: the leading maize brand in Mozambique “Top Score”, as well as “Celeste” and
“Matabicho”
‒ Wheat: “Florbela” cake flour and “Favorita” bread flour sold mainly to bakeries
‒ Biscuits: CIM is the market leading biscuit brand
‒ Pasta: The number 2 pasta brand “Polana”
• Facilities in Matola near Maputo comprise a wheat and maize mill, as well as a biscuit, pasta
and animal feeds plant
• Operates 5 depots across Mozambique
• Employs c.650 people
• Potential for synergies with Premier on procurement and CIM to benefit from Premier’s
milling technical assistance
• New sales and marketing plan to accelerate growth of brands in the country
• In the process of acquiring the balance of CIM’s shares in issue
Maputo City
Beira
Tete
Quelimane
Nampula
Chimoio

33 Audited results for the year ended 31 March 2015
Premier
33
Outlook
Milling and baking:
• Comfortable with steps taken to secure maize supply given outlook of rising
commodity prices and risk of maize shortages in 2015/16
• Commission new Durban wheat mill in November 2015
• Restore the Durban bakery damaged by the fire and continue with the bakery
upgrade programme
• Blue Ribbon bread is well positioned in terms of quality and brand to compete in the
market on a national basis
FMCG:
• Stretch existing brands by launching new products in related categories
• Acquisitions made to date have been integrated into Premier and the focus on
achieving the targeted investment returns and maximising synergies and revenue
opportunities
• Evaluating FMCG acquisition opportunities
Geographic expansion:
• At an advanced stage of negotiating an acquisition in East Africa

34 Audited results for the year ended 31 March 2015
Premier
34
Brait’s audited valuation31-Mar-15 31-Mar-14
R'm R'mMaintainable EBITDA 829 497
EBITDA multiple (1) 12.3 x 6.5 x
Enterprise value 10,197 3,227
Less: net debt considered in valuation (3,187) (1,226)
Net debt (including shareholder loans) (3,738) (2,793)Adjustment for acquisitions and capex (2) 551 1,567
Equity value 7,010 2,001
Brait’s shareholding in Premier (3) 86.5% 84.6%
Fair value of Brait’s investment in Premier 8,241 3,053Equity value 6,061 1,692Shareholder loans (4) 1,989 1,334Financial derivative asset (5) 191 27
Notes(1) FY15 valuation multiple used of 12.3x represents the peer trailing three year average EV/EBITDA multiple. This 12.3x multiple is at a 16% discount to the 31 March 2015 peer average EV/EBITDA
multiple of 14.6x(2) Adjustment is made to normalise net debt for the cost of those acquisitions and capex that are not yet generating EBITDA. For the current year, this comprises (i) capex on the new Cape Town bakery
line (commissioned in February 2015); (ii) capex spend to date on the new wheat mill in Durban (to be commissioned in H1 FY16) and (iii) the cost of acquiring CIM in March 2015. The March 2014 adjustment was to recognise the November 2013 acquisitions of Lil-lets and Star Bakeries at their cost; as well as capex spend to date on the Cape Town bakery line
(3) Increase in Brait’s shareholding due to the exercise of options under agreements with former Premier shareholders(4) Increase in shareholder loans to fund the March 2015 acquisitions of La Femme, Mister Bread Milling and CIM. Note that Premier serviced R94m interest on Brait’s shareholder loans during FY15
(Premier has repaid Brait a total of R166m interest since July 2012) (5) Fair value of remaining options held with former Premier shareholders. Exercise of the remaining options over the next 2 years enables Brait to increase its shareholding to c.90%

35 Audited results for the year ended 31 March 2015
Premier
35
Attractions to Brait
Cash flow generative • Strong cash flow characteristics due to nature of the product basket that is focused on cash sales into the informal market
Market leader • Market leading staple food brands• Includes some of the oldest brands in the country
Clear strategy• Optimising core operations by investing in people, brands and assets• Investing in a number of internal projects with attractive returns• Target acquisitions in a wide range of adjacent and FMCG categories
• Distribution platform – opportunity for other product sets• Sizeable footprint and reach – not easy to build / replicate• Operating leverage – ability to expand margins and improve production efficiencies
Well positioned
• Well exposed to cash consumer in higher growth LSM 1 – 6 categories• CIM acquisition enhances exposure to neighbouring countries Cash consumer
Demonstrated throughAttractions
Management team • Deep bench with significant industry experience across all categories
Alignment • Shareholders are Brait and management • Management increased their stake in Premier in October 2014, acquiring a further c.3.5% shareholding

38 Audited results for the year ended 31 March 2015
Virgin Active
38
The world’s leading international health club operator
Overview
An outstanding business across South Africa and market-leading positions in Europe
Platform for further growth, particularly in Africa and Asia
Over 1.3m adult members worldwide
£639m revenue in 2014
267 clubs in nine countries across four continents
Exclusive rights to use the Virgin Active brand globally for 30 years
7
146
114 43%55%
2%
Geographic mix(1)
Asia Pacific <1%Clubs Members Revenue
Southern Africa Europe Asia Pacific
267 1.3m £639m
Notes 1. As of 31 December 2014
28%
69%
4%

39 Audited results for the year ended 31 March 2015
Virgin Active
39
Geographic diversity of operations and earnings
Current locations
Southern Africa
No. Clubs(1) 114
No. Adult Members(1) 722k
VA Market Position (SA)(4) No. 1
2014 Revenue(3) £176m
UK
No. Clubs(1) 101
No. Adult Members(1) 380k
VA Market Position(2) No. 1
2014 Revenue(3) £324m
Continental Europe(5)
No. Clubs(1) 45
No. Adult Members(1) 183k
VA Market Position No.1 in Italy
2014 Revenue(3) £114m
Asia Pacific
No. Clubs(1) 7
No. Adult Members(1) 25k
2014 Revenue(3) £25m
Notes:1. As at 31 December 2014; 2. Based on UK revenues, source: IHRSA; 3. Audited financial results; 4. Based on revenues of private health clubs; 5. Continental Europe presence includes Italy, Spain and Portugal

40 Audited results for the year ended 31 March 2015
Bernado De VicenteIberia
Virgin Active
40
Highly experienced management team
Mark BurrowsGroup
Chief Financial Officer
Ross Faragher-ThomasAfrica
Paul WoolfGroup
Chief Executive Officer
Matthew BucknallGroup
President & Founder
Matthew MerrickUK
Luca ValottaItaly

41 Audited results for the year ended 31 March 2015
Why the Virgin Brand People Brand
Brand Pioneer Opportunity Brand
Virgin Active
The VA story
41

42 Audited results for the year ended 31 March 2015
Virgin Active
42
Key investment highlights
A proven model that is repeatable, flexible and resilient3
4 An outstanding business in South Africa
Targeted exposure to positive macro health & wellness trends
1
2
Aspirational global consumer brand
A market-leading premium focused operator in Europe5
Multiple channels of growth, including an exciting growth platform in Asia Pacific6
Experienced management team 8
Excellent financial track record, strong returns and cash flow, and earnings visibility7

43 Audited results for the year ended 31 March 2015
Virgin Active
43
Targeted exposure to positive macro and health & wellness trends
6.87.7
9.3
1990 2000 20121,179
1,881
3,478
1990 2000 2012
3
10
1
14
72
69
27
3
2319
6
13
Africa Americas S.E. Asia Europe East. Med. West.Pacific
Global
1980 2008
Rise in life expectancyLife expectancy at birth globally(1)
4859
64 6973 76
1950-1955 1970-1975 1990-1995 2010-2015 2030-2035 2050-2055
13%25%
~3x increase
Growing healthcare costs OECD average US $ per capita spend(5)
Notes:1. United Nations 2010 2. Data shows age-standardised prevalence and obesity is defined as BMI>30kg.m2; 3. Approximated numbers based on World Health Organisation (2012); 4. International Diabetes Federation 2013; 5. OECD 2014 health statistics; 6. The Global Burden of Disease Update Geneva, WHO
Governments under increasing pressureOECD countries average healthcare cost % of GDP(5)
Increase in diabetes prevalenceNumber of people affected by diabetes (m)(4)
37 24 20 3556
72
138
50 39 4268 69
123
202
N America& Carrib.
S&CAmerica
Africa MENA Europe SE Asia W Pacific
2013 2035
c. 17%
c. 19%
c. 24%
2008 2015 2030
Cardiovascular Diseases
Projected mortality trend of cardiovascular diseasesDeaths by cause (%)(6)
Growing prevalence of obesityAdults aged 20+ by region (%)(2,3)

44 Audited results for the year ended 31 March 2015
Virgin Active
44
A proven model that is repeatable, flexible and resilient
Market selection criteria
Large and growing middle class
Strong or growing fitness culture
Opportunity to become leading scale premium focused operator in market
Site selection criteria
Strong member demand
• Detailed demographic analysis focusing on population density and socioeconomic factors such as incomes and family orientation
• Clearly identified catchments based on market relevant drive times in suburban locations and walk times in CBD locations
Strategic networks
• Focus on complementary networks in major cities
• Reciprocal rights highly valued by members
• Strong work and home club combinations
• Ability to offer a range of facilities and price points
Financial feasibility
• Affordable property deal• Attractive yield / rent relationship• Large formats can trade on volumes and
/ or price• Ability to leverage economies of scale in
major cities
Convenience, access & exposure
• Convenience and exposure critical to attract and retain members
• Sufficient secure car parking essential in suburban locations
• Enabling infrastructure such as arterial roads and transport hubs
Development pipeline available for expansion
Favourable competitive dynamics
Goal is to reach scale quickly in each market as scale provides a fantastic
consumer proposition and key defensive qualities

45 Audited results for the year ended 31 March 2015
841 967
1,113 1,284
1,412 1,599
1,811 2,107
2,436
2,783
3,125
2004 2005 2006 2007 2008 2009 2010 2011 2012 2013 2014
Virgin Active
45
An outstanding business in South Africa
Partnerships with wellness incentive schemes
Subsidised VA membership key customer acquisition tool
Gym subsidy drives both acquisitionand retention
Higher profits: maintains healthy lives
Benefits to Virgin Active Benefits to providers
A successful relationship with Discovery since 2001
Bias to higher LSMs
Schemes attract and retain stickier members with subsidies
Schemes market on VA’s behalf
Schemes incentivise regular usage
Estimated market share by revenue(3,4,5)
60%15%
5%
7%
13%
Revenue (1)Highlights
Notes:1. Revenue on a Current Club Portfolio basis; 2. FY2012- FY2014 average; 3. Market defined as commercial indoor gym market; 4. Leading international consultancy; 5. Virgin Active has 114 (or 24%) of a total of 482 comparable clubs in South Africa –leading international consultancy
Strong and sustained leadership position: 4x larger than nearest competitor
Unique national network of 114 well-invested, high-quality clubs
Market segmentation through use of flexible club formats
Best in class brand awareness and member loyalty(4)
Strong member base profile with 83% of our members being LSM 9-10 resulting in low credit risk and supporting resilience through the economic cycle
Substantial new club roll-out potential of 8-10 clubs p.a. in the medium term
Excellent financial profile with strong growth, margins and operating cash conversion (c.85%)(2)
Small chains
Independents
ZARMM
46 Audited results for the year ended 31 March 2015
Virgin Active
46
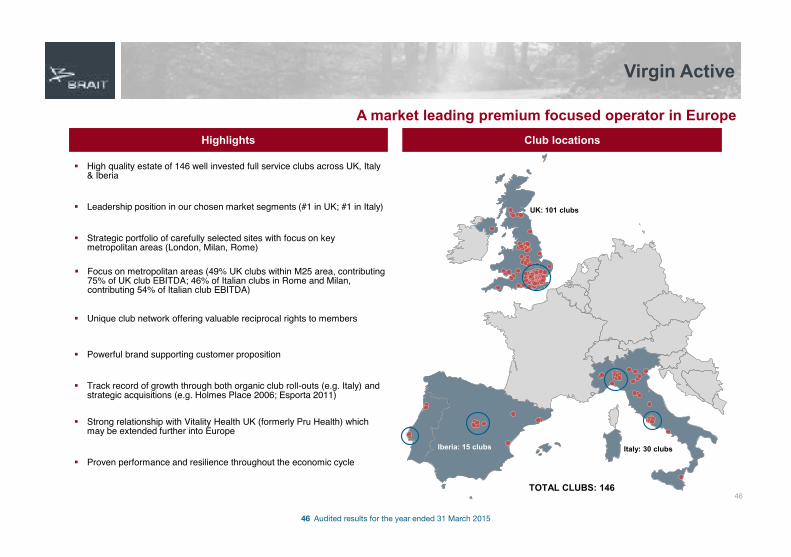
A market leading premium focused operator in EuropeClub locations Highlights
Leadership position in our chosen market segments (#1 in UK; #1 in Italy)
Strategic portfolio of carefully selected sites with focus on key metropolitan areas (London, Milan, Rome)
High quality estate of 146 well invested full service clubs across UK, Italy & Iberia
Unique club network offering valuable reciprocal rights to members
Powerful brand supporting customer proposition
Focus on metropolitan areas (49% UK clubs within M25 area, contributing 75% of UK club EBITDA; 46% of Italian clubs in Rome and Milan, contributing 54% of Italian club EBITDA)
Track record of growth through both organic club roll-outs (e.g. Italy) and strategic acquisitions (e.g. Holmes Place 2006; Esporta 2011)
Proven performance and resilience throughout the economic cycle
Strong relationship with Vitality Health UK (formerly Pru Health) which may be extended further into Europe
TOTAL CLUBS: 146
UK: 101 clubs
Iberia: 15 clubs Italy: 30 clubs

47 Audited results for the year ended 31 March 2015
Virgin Active
Multiple channels of growth
Manage to revenue
Manage price and volume to maximise revenue, rather than either measure in isolation
High capacity large club format facilitates a flexible approach which few competitors can match
Continual focus on retention initiatives
CPI + LFL revenue growth
1
Our growth & value creation drivers
Secondary revenue
Better monetise member base by driving secondary revenue
Market-by-market assessment of opportunities
Technology used to engage members within and outside of clubs
Secondary streams assist member retention (e.g. PT, swim)
Increase contribution from
secondary revenue each year
2
Existing estate Expansion
Margin enhancement
Leverage existing cost base in clubs and central support structures
New clubs layered into existing central cost base
Shared best practice across the business
Purchasing efficiencies from scale
50-100bps improvement in
Underlying EBITDA margin each year
3Premiumise the estate
and manage the portfolio
Disciplined ongoing capital expenditure to maintain quality estate
Strategic investment in refurbishments to premiumise clubs and differentiate from competitors where demographics are supportive
Select portfolio management of underperforming clubs
UK premiumisation programme peaking
in 2014/15
4
New club roll-out pipeline
Clear roll-out pipeline confirmed in South Africa & wider Africa
Selective pipeline in leading European cities
Roll-out pipeline established in Asia Pacific
Global brand rights to support further growth into new territories
Grow estate by 13-15 clubs p.a. over the medium term
5
Strategic & tactical M&A
Strategic & tactical M&A building on successful track record
Disciplined approach based on ability to improve operating performance through implementation of the proven Virgin Active model
Opportunity for further consolidation in existing markets
Key global targets under continual
review
6
47

48 Audited results for the year ended 31 March 2015
6 57
7
221
2
13
8
11
14-1612-14
0
5
10
15
20
25
2012A 2013A 2014A 2015P 2016PSouth Africa Europe Asia Pacific Pipeline
Virgin Active
A strong roll out pipeline including an exciting growth platform in Asia PacificGroup roll out strategy
An attractive market - Growing health and fitness demand, attractive demographics and highly attractive club profitability dynamics
where we are ideally positioned to succeed - Brand aspiration supportive of premium yields and strong margins and strong developer relationships established with high affinity to the brand
has been successfully established - Five clubs in Australia and successfully launched into both Singapore and Thailand
is poised to capitalise on recent investment - Significant start-up costs on new clubs in 2014, Underlying EBITDA expected to be broadly breakeven in 2015, significant embedded EBITDA from recently opened clubs
and has significant growth potential- Opportunity to leverage brand to expand across broader Asia Pacific, expected roll-out of 4-6 clubs over the next 2 years
Disciplined and return focused roll-out
# clubs
Asia Pacific highlights
Rigorous approach to market and site selection
Seek to become leading scale premium focused operator in any market
Continue successful track record of new club roll-outs:
- >10 new clubs opened on average per annum 2012-14
- Attractive ROCE profiles across geographies – historical club openings have achieved an average 3yr ROCE of >40%(2)
- South Africa: leverage market position to seize on market opportunities across multiple segments and extend to other African countries (e.g. Namibia, Kenya, Botswana)
- Europe: focus on prime metropolitan locations in key cities
- Asia Pacific: build network in Thailand, Singapore and Australia and explore opportunities to launch in other Asian markets (e.g. Manila, Jakarta, Beijing, Shanghai)
Focused property team with unique execution capabilities
- Development team comprises of three former territory MD’s, including group founder
- Excellent track record of meeting projected member targets for each new club
Future rollout plans broadly in line with historical trajectory, plus new RED format
Notes:1. Pipeline defined as sites for which a lease or Letter of Intent has been signed or the site is under advanced discussion; 2. Includes 2 clubs under construction
(1)
48

49 Audited results for the year ended 31 March 2015
2030
38
6574 81 83
9199
111124
2004 2005 2006 2007 2008 2009 2010 2011 2012 2013 2014
Virgin Active
Excellent track record of long term growth
Underlying EBITDA
Clubs
96 115
164 169 180 189 194235 248 256 267
2004 2005 2006 2007 2008 2009 2010 2011 2012 2013 2014
Members
506625
832 873 881 921 9781,160
1,242 1,298 1,321
2004 2005 2006 2007 2008 2009 2010 2011 2012 2013 2014
000s(1)
£m(1)
Units(1)
Constant FX
Revenue
£m(1)
Constant FX
Notes:1. Clubs and members as at 31 December and 2011-2014 on a Current Club Portfolio basis, FY2012 – FY2014 revenues on a Current Club Portfolio basis, translated at 2014 average actual FX rates (£1: ZAR 17.8; £1: €1.2; £1: A$1.8; £1: S$2.1; £: THB B53.5)
88 123
186
302 328 352 381 466
586 616 639
2004 2005 2006 2007 2008 2009 2010 2011 2012 2013 2014
49

51 Audited results for the year ended 31 March 2015
Virgin Active
Virgin Active has highly attractive financial characteristics
Strong cash generation
Majority of member fees received in advance via direct debit
Operating Cash conversion of c.70%(2)
Strong cash generation supports investment into attractive growth opportunities
5
High visibility:
− ~75% of annual revenues generated by opening membership base
Attrition rates – stable for the last decade
Earnings visibility – subscription-based model3
Notes:1. Year 3 EBITDA ROCE, 2. Average FY2012-2014; 3. CAGR for 2004-2014 Underlying EBITDA translated at 2014 average actual FX rates; 4. Defined as projected incremental EBITDA at maturity of clubs that, at the end of the relevant period, had been open for less than three full years plus premiumisation returns
Significant embedded EBITDA(4) from:
− New club maturity ramp up
− Premiumisation programme
Embedded EBITDA as at 31 Dec 2014 of £23m, which supports attractive near term growth
- Provides visibility on future growth
Earnings visibility – embedded EBITDA4
Manage to revenue
Secondary revenue
Margin enhancement
Premiumise the estate and manage the portfolio
New club roll-out pipeline
Strategic & tactical M&A
Long-term track record of strong growth (20% CAGR)(3)
Excellent future prospects via six growth drivers:
1
2
3
5
4
6
High growth1
Track record of performance through the economic cycle:
− Revenue and Underlying EBITDA growth in every one of the past ten years
Earnings spread across multiple geographies
Resilient performance ¤cy diversification2
3 year club ROCE of ~40% for new club openings across the Group
Higher returns in South Africa (over 100%)(1)
Attractive new club returns 6
51
52 Audited results for the year ended 31 March 2015
Virgin Active
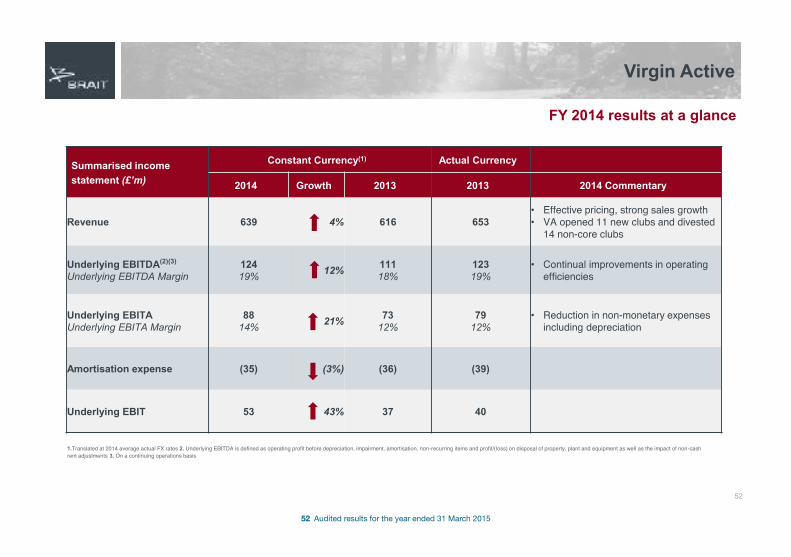
FY 2014 results at a glance
Summarised income statement (£’m)
Constant Currency(1) Actual Currency
2014 Growth 2013 2013 2014 Commentary
Revenue 639 4% 616 653• Effective pricing, strong sales growth• VA opened 11 new clubs and divested
14 non-core clubs
Underlying EBITDA(2)(3)
Underlying EBITDA Margin12419% 12% 111
18%12319%
• Continual improvements in operatingefficiencies
Underlying EBITAUnderlying EBITA Margin
8814% 21% 73
12%79
12%• Reduction in non-monetary expenses
including depreciation
Amortisation expense (35) (3%) (36) (39)
Underlying EBIT 53 43% 37 40
1.Translated at 2014 average actual FX rates 2. Underlying EBITDA is defined as operating profit before depreciation, impairment, amortisation, non-recurring items and profit/(loss) on disposal of property, plant and equipment as well as the impact of non-cash rent adjustments 3. On a continuing operations basis
52

53 Audited results for the year ended 31 March 2015
Virgin Active
Strong cash flow conversion
Strong cash flow generation reflects good EBITDA growth profile and disciplined capital expenditure
schedule
Maintenance capex relates to all capital expenditure
other than new clubs and premiumisation programme
2012-14 operating cash conversion(8) of c.70%
Cash generation supports self-funded growth
opportunities in new attractive regions
Premiumisation programme expected to peak in 2014 and 2015
Commentary Cash Flow
Notes:1. Group level Operating Cash flow conversion excluding new club capex and Premiumisation capex; 2. Translated at 2014 average actual FX rates; 3. Working capital excludes non-recurring cost cash flows; 4. Working capital adjusted to reflect full licence fee payment within each year (2012 and 2013 incremental licence fee was paid in 2014); 5. Fixed asset disposal proceeds excluded from capex cash flow; 6. Maintenance capex includes head office and IT capex 7. Non-recurring IT and rebranding capex; 8. Defined as (Operating cashflow / Underlying EBITDA (Actual FX)); Based on actual exchange rates; 9. Primarily relates to accrued license fee charges being expensed through the P&L with one-off payment in 2014; 10. On a continuing operations basis
Unlevered cash flow (£m) 2012 2013 2014
Underlying EBITDA(2,10) 99 111 124
Forex adjustment to actual exchange rates 22 12 -
Underlying EBITDA (Actual FX)(10) 122 123 124
Working capital movement(3,4) and discontinued operations (3) (2) (3)
Underlying cash flow from operations 119 121 121
Maintenance and head office capex(5,6) (33) (38) (31)
Operating cashflow(1) 86 83 90
Operating cash conversion(8) 70% 67% 73%
Investments - new clubs, acquisitions and premiumisation (29) (30) (46)
Non-recurring capex(7) (17) - (5)
Exceptional, one off items and proceeds on disposal of assets(4,9) 6 6 (13)
Free cash flow before financing, interest and tax 46 59 26
53

54 Audited results for the year ended 31 March 2015
Virgin Active
54
Update: Q1 FY 2015
Operations
2 new clubs opened in APAC
Completion of the premiumisation of 12 further clubs in the UK
A further 8 non-core clubs divested in the UK
Successful launch of a new UK membership system
New website and app launch soon
Financial
Total revenue up 2%
EBITDA up 16%

56 Audited results for the year ended 31 March 2015
New Look
Consistent delivery of proven strategy
Proven fashion brand with a differentiated product offer
Disciplined financial model and strong track record
Focused international growth
Clear momentum with multiple growth drivers
56

57 Audited results for the year ended 31 March 2015
Managing Director UK & ROIDanny Barrasso
Chief Executive OfficerAnders Kristiansen
New Look CEO since January 2013
Former Vice CEO of Bestseller China, President of Staples China
Previously held senior positions at Lyreco, Herlitz and GBC Corp
Chief Financial OfficerMike Iddon
New Look CFO since September 2014
Former roles at Tesco of Group Planning, Treasury and Tax Director and UK Finance Director
Previously held senior positions at Kingfisher Plc and Whitbread Plc
Chief Creative OfficerRoger Wightman
New Look since February 1990
Previously Group Buying Director for Womenswear and Brands
New Look
Executive Directors
57
New Look since August 2012
Previously at Hilton and Thomas Cook

58 Audited results for the year ended 31 March 2015
New Look
New Look at a glance
Founded in 1969
The UK’s largest total womenswear retailer for under 35’s²
No. 2 for womenswear in the UK² (6.0%)
569 UK stores
Fast growing multichannel operations
Targeted approach to International
Note: All financials to March year end, excluding Mim and on a 52 week basis except for FY13 on a 53 week basisAdjusted EBITDA is a non-IFRS measure, calculated as underlying operating profit before depreciation of tangible fixed assets and amortisation of intangible assets. Adjusted EBITDA margin is Adjusted EBITDA as a percentage of revenue. Adjusted EBITDA and Adjusted EBITDA related measures are not a measurement of performance or liquidity under IFRS or US GAAP and should not be considered by investors in isolation or as a substitute for measures of profit, or as an indicator of the Group’s operating performance or cash flows from operating activities as determined in accordance with IFRS or US GAAP¹ Sales are based on Gross Transactional Value excluding adjustment for concession income on a net basis for statutory reporting purposes² Kantar Worldpanel, 52 weeks ending 15 March 2015; by value³ Kantar Worldpanel, 52 weeks ending 15 March 2015
FY15 Revenue£1,415m
FY15 Adjusted EBITDA£212m
FY12-15 Revenue CAGR3.2%
FY12-15 Adjusted EBITDA CAGR
13.8%
no. of stores as at FY15809
unique UKcustomers in FY15³
13.6m
of UK women shopat New Look³
42%
UK 73%
E-commerce14%
International13%
Sales¹ (FY15) Product mix (FY15)
key 3rd Party E-commerce(“3PE”) partners
11
Fast-fashion74%
Wardrobe essentials
14%
High-fashion12%
58

59 Audited results for the year ended 31 March 2015
• Refresh of brand and customer engagement
• Greater control of margin, inventory and costs
• Refurbishment of store portfolio driving 5.3% gross profit uplift¹
• c.300 stores completed to date
• International strategy focused on 4 priority markets
• China roll-out underway
• Mim disposed in 2014
• Strong multichannel and 3rd party E-commerce expansion
Source: Company information¹ vs. unconverted stores to end FY15, measurable refurbishments only (290 stores)
New Look
Strong momentum underpinned by consistent execution
59

61 Audited results for the year ended 31 March 2015
6.8 10.0 12.6 16.1
24.825.3
28.635.131.6
35.341.2
51.2
2004 2009 2014 2019F
Rest ofMarket
ValueMarket
UK clothing market 1
Value share of UK clothing 1
New Look UK womenswear share 3
No. 2 in UK womenswear 2
11.2
6.0 5.5 5.3 5.13.8
2.5 2.5 2.3 2.3
Mar
ks &
Spen
cer
New
Look
Next
Prim
ark
Debe
nham
s
Geo
rge
Tesc
o
Tops
hop
Mat
alan
Rive
r Isl
and
Valu
e %
Sha
re
1 © 2014 Verdict, reproduced with permission; 2 Kantar Worldpanel (by value) 52 weeks ended March 2015; 3 Kantar Worldpanel; 4 © 2014 Verdict Clothing & Footwear Quarterly Forecasts, reproduced with permission; 5 Company information FY15; 6 Includes girlswear, boyswear and infantswear
Total market size £41.2bn 4
Accessories7%
Childrenswear 6
12%
Menswear 25%
Womenswear 56%
By value (£bn)
21.5%
2004
30.6%
2014
3.2%
FY04
5.8%
FY14
New Look product sales mix 5
New Look
Longstanding and leading position in the value fashion sector
61
Womenswear61%
Footwear16%
Accessories10%
Teenswear6%
Menswear3%
Other4%
* Total market
*

62 Audited results for the year ended 31 March 2015
Source: Company information; Verdict¹ TNS UK Brand Tracker, 9 months to March Note: Mean Net Promoter Score is the average rating that people give when asked how likely they are to recommend the brand to a friend. The score is out of 10 at an individual level and this is then expressed as a %
Brand Awareness¹
91%Prompted awareness
NPS – Recommendation¹
77%Our customers continue to respond positively
and consistently to the brand with strong advocacy levels
MID MARKET BRANDSTraditional UK brands. Higher price, lower fashion content
HIGH FASHIONFashion driven brand. High price points, high fashion
content
VALUE ORIENTED MASS MARKETSupermarkets and value focused
retailers. Low price points low fashion content
VALUE FASHIONCombination of value and fashion content
New Look
Our distinctive brand positioning
62
Low Price
High Price
Trad
ition
al
Hig
h-Fa
shio
n
VeryTopshop
River Island
H&M
Primark
ASOS
boohoo
Debenhams NextM&S
Dorothy Perkins
Asda (George)
PeacocksMatalan
Zara
Online pure-play

63 Audited results for the year ended 31 March 2015
Our price positioning STRATEGY
Inclusive customer profile
1 Source: Kantar Worldpanel, 52 weeks ending March 2015
Price architecture to offer true choice
From EARLY TEENS TO OVER
45’s, with an average customer
age of 33 YEARS
13.6m¹ unique UK CUSTOMERS
in FY15
42%¹ OF UK WOMEN shop at New Look
and we had over 506m VISITS to our
stores and websites
New Look
Fast fashion at value price points maximising our customer appeal
63
HIGH-FASHION
80% cheaper than high-fashion brands; e.g.
MID MARKET BRANDS
40% cheaper than mid market brands; e.g.
FAST-FASHION
Prices to match our competitors;e.g.
MASSMARKET
Wider range of fast-fashion products than value-led mass market brands; e.g.

64 Audited results for the year ended 31 March 2015
New Look
Our extensive fashion media coverage
We’re an award winning fashion retailer
Fabulous High Street AwardsFabulous for footwear
Lorraine High Street Awards Best Shoes
Cosmopolitan #fashfestAwards Best hot for heels
World Retail Awards 2014 Best store design
White City, >1,200 sq m
Topshop 1New Look 2M&S 3River Island 4ASOS 5Zara 6H&M 7Next 8Primark 9Dorothy Perkins 10
245kFollowers on Twitter1
300kWeibo fans1
538kFollowers on Instagram1
3.0mFans on Facebook1
1 End of March 20152 vs. key competitors3 Source: MyMarketMonitor, March 2015 Share of shout based on PR value (£)
£78m PR value in UK and ROI in FY15 3
£15m PR value in China in FY15 3
Our social media mission is to be the “Friendliest Fashion Brand”
We’re a social brand with engaged fans and followers
64
We’re number 2 in the UK for PR value 2

65 Audited results for the year ended 31 March 2015
• 244 suppliers from 778 factories in 29 countries
• Strong relationships based on 40+ years experience
• Our flexible supply chain means we can book orders later and therefore make less investments in stock
• Markdown and discount minimised to maximise margin
New look’s tactical approach to successful trends: Kimono
Initial quantity delivered in February had strong reaction. Buy increased by 60k units in March
Trading and trends indicate bestseller. Total buy increased by nearly 700k units from April to June
We generated £9.7 million of kimono sales in the 13 week period ended June 28, 2014Kimonos
identified as a key trend for spring/summer in January. 40k units sold across January and February 2014
From design to shop floor in 13 weeks... for certain products it’s just 2 weeks
• Directly operated, highly automated distribution centre in Stoke-on-Trent
• c.£100m investment; upgrade programme complete
• 75,000 sq m (0.8m sq ft) with a capacity of c.180m units p.a.
• 3.1 deliveries per UK store per week
• We currently achieve a 98% delivery accuracy
• Outsourced distribution hubs in Singapore and Shanghai serve our markets in Asia
Fast Fashion 74%
High Fashion12%
Wardrobe Essentials
14%
Product intake mix
Source: Company information
New Look
Flexible fast fashion supply chain
65

66 Audited results for the year ended 31 March 2015
• 569 stores, 98% profitable
• 371,000 sq m (4.0m sq ft) footprint
• Successful across a range of locations: shopping centres, prime high street and local markets
• Flexible with average remaining lease length less than 5 years
Store numbers ¹
Well established store presence in the UK
United Kingdom 569Asia China 19Europe France 28
Germany 23²Poland 13Republic of Ireland 29Netherlands and Belgium 23²
Total Owned 704
Franchise 105
Total Owned and Franchise 809
A growing global footprint
Continued investment in refreshing our owned stores
Growth is focused on 4 markets
• China
• Poland
• France
• Germany
New Look
Proven multichannel platform: integrated store base
¹ As at FY15² Includes concessions 66

67 Audited results for the year ended 31 March 2015
New Look
Proven multichannel platform: E-commerce
Fully integrated with store base• Multichannel spend continues to rise• Drives ATV and customer spend• Click & Collect and Returns both proven processes across the estate
E-commerce• Average of 4.5m visits a week2
• 3rd most visited website³ with a share of 4.3% by visits³• In house pick & pack and DC• France and Germany local language websites
M-commerce• Now accounting for c.45% of online visits• Core future focus, especially via apps
New Look own website sales¹ (£m)
c.26% of E-commerce orders
E-commerce M-commerce Click & Collect Order In Store28% use Click & Collect 9% of E-commerceProven ATG/Oracle platform
62.7
89.8
127.8
166.7
FY12 FY13 FY14 FY15
Source: Company informationNote: All financials to March year end1 Sales based on Gross Transactional Value excluding adjustment for concession income on a net basis for statutory reporting purposes; 2 Company information; 3 Experian, March 2015, Hitwise category “Shopping and Classifieds-Apparel and Accessories” 67

68 Audited results for the year ended 31 March 2015
Launched in 2013 with select partners
• 11 supply partnerships
Attractive financial model
• Profitable wholesale commercial arrangements
• Low capital employed
• Minimal stock risk
International reach
• Over 240 countries served
• Strong menswear participation (c.16%)0.0
1.6
22.0
34.0
FY12 FY13 FY14 FY15
3rd party E-commerce sales 1 (£m)
Source: Company informationNote: All financials to March year end1 Sales based on Gross Transactional Value excluding adjustment for concession income on a net basis for statutory reporting purposes
(Europe)
New Look
Proven multichannel platform: 3rd party E-commerce
68

69 Audited results for the year ended 31 March 2015
KPI commentary Key financials ¹
• Robust sales growth with UK business driving LFL sales growth and improving market share3
• Expanding gross margins driven by full price sales and focused promotions
• Productivity improvements and tight management of the cost base supporting adjusted EBITDA margin growth
• Strong cash generative business model
• Disciplined capital investment throughout the period
Source: Company information* Restated to reflect the divestment of Mim in FY15 1 All financials on a 52 week basis except for 2013 on a 53 week basis2 FCF defined as cash flow from continuing operating activities (pre tax) less net investing activities; FCF conversion defined as FCF/adjusted EBITDA3 Womenswear (Kantar Worldpanel (by value) 52 weeks to end March 2015)
March YE (£m) 2012* 2013* 2014* 2015 CAGR 2012-2015
Revenue 1,286 1,330 1,368 1,415 3.2%
% growth (0.5)% 3.4% 2.9% 3.4%
UK LFL sales growth (5.7)% (0.5)% 3.0% 5.0%
Gross profit 652 700 722 746 4.6%
% margin 50.7% 52.6% 52.8% 52.7%
Adjusted EBITDA 144 184 204 212 13.8%
% margin 11.2% 13.8% 14.9% 15.0%
Underlying operating profit 75 118 141 153 26.8%
% margin 5.8% 8.9% 10.3% 10.8%
Free Cash Flow (FCF) 2 80 99 145 147 22.5%
% conversion 2 55.6% 53.8% 71.1% 69.3%
Total capex 47 60 49 60 8.5%
% revenue 3.7% 4.5% 3.6% 4.2%
New Look
A track record of growth
69

70 Audited results for the year ended 31 March 2015
New Look
Focused strategy for growth
Product Development
International ExpansionBrand
E-commerce Menswear
Our strategy is based
upon 5 key pillars
70

71 Audited results for the year ended 31 March 2015
New Look
Brand
Consistent global brand identity now established across:
Stores
E-commerce
Product
Concept store refurbishment programme being rolled-out
Dual-gender approach to be created to develop Menswear identity
CRM strategy to drive long term loyalty and leverage profit
71

72 Audited results for the year ended 31 March 2015
8 1983
157278
312 342
6,340
2012 2014 2010 2006 2007 2006Excl.Zara
2005(Re-
launch)
1996 19 stores trading at end March 2015
A range of Tier 1, 2 & 3 cities and malls
Aggregate positive store contribution
Experienced local management team based in Shanghai
Rapid development of local skills and supply chain
Tmall E-commerce presence
New Look
International expansion
Significant growth opportunityChina
Launch
Source: Retailer websites
72
73 Audited results for the year ended 31 March 2015
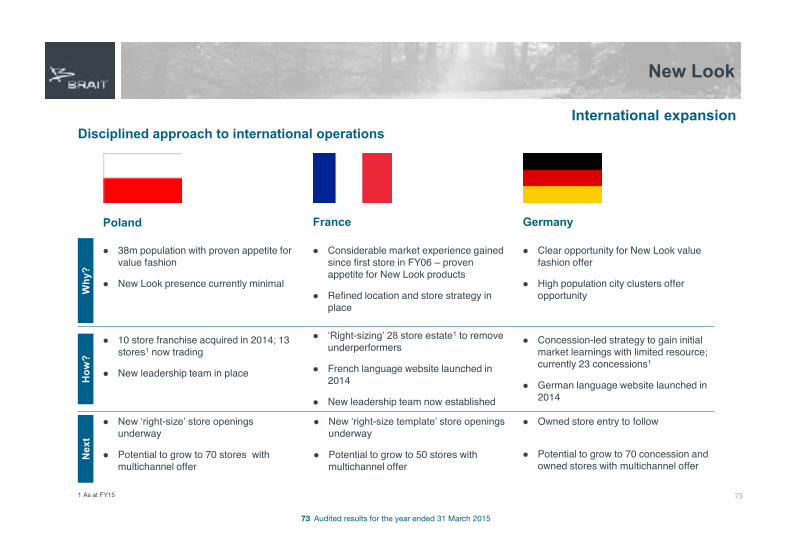
Disciplined approach to international operations
Poland Germany
38m population with proven appetite for value fashion
New Look presence currently minimal
Clear opportunity for New Look value fashion offer
High population city clusters offer opportunity
10 store franchise acquired in 2014; 13 stores1 now trading
New leadership team in place
New ‘right-size’ store openings underway
Potential to grow to 70 stores with multichannel offer
France
Considerable market experience gained since first store in FY06 – proven appetite for New Look products
Refined location and store strategy in place
‘Right-sizing’ 28 store estate1 to remove underperformers
French language website launched in 2014
New leadership team now established
New ‘right-size template’ store openings underway
Potential to grow to 50 stores with multichannel offer
Concession-led strategy to gain initial market learnings with limited resource; currently 23 concessions1
German language website launched in 2014
Owned store entry to follow
Potential to grow to 70 concession and owned stores with multichannel offer
New Look
International expansion
Why
?H
ow?
Nex
t
1 As at FY15 73

74 Audited results for the year ended 31 March 2015
Multichannel customers are our best customers
3x more spend than in-store only 1
1 in 10 store visits is a result of a visit to the website 2
1 in 5 Click and Collect customers make an additional purchase when collecting 2
Local language websites rolling out internationally
France and Germany already live
97%77%3%
23%
FY12 FY15
Desktop sales Mobile / Tablet sales
Online sales (£m)
£62.7m
£166.7m
New Look
E-commerce
Already shipping to over 240 countries globally
New Look brand embodies British fashion to global consumers
Lifts brand awareness ahead of potential market entry
Resource light, low capital intensity
Looking to seal further wholesale partnerships
New opportunities are currently being explored in Europe, Africa, South & North America and Asia
We already have 11 partnerships with selected 3rd party e-tailers
Multichannel 3rd party E-commerce
Multichannel makes our product available any way our customers want to shop
1 Kantar Worldpanel data, 52 weeks ending March 20152 Company information
74

75 Audited results for the year ended 31 March 2015
Consistent delivery across ranges building on our track record and brand signature
“Selling a look” concept to drive incremental profit
Broader range construction to offer maximum choice
Drive sales and margins1 Kantar Worldpanel, 52 weeks to March 20152 Verdict, 2015
New categories and improved range construction
UK market grew by 26.3%1 YOY; our share is currently only 0.5%1
Launched in August 2014 with 10 store trial
Rolled out to 150 UK stores in January 2015
Trialling in international markets
Activewear case study Cosmetics and fragrance case studyUK market forecast to grow by 24% in the 5 years to 2019 2
Launched in October 2014 across 200 stores
Now rolled out across UK and Europe
Fragrance now in 520+ stores
Cosmetics now in 450+ stores
Further potential expansion into body care and bath products
New Look
Product development
75

76 Audited results for the year ended 31 March 2015
New Look
Menswear
Menswear accounts for 25% of UK clothing market worth c.£10bn by value1
Refurbished stores have doubled the mix in menswear
16% of stock sold to our largest 3rd party partner is Menswear
Strengthened management team and approach:
Dual gender homepage launched in 2014
New men’s shop-in-shop trial in March 2015
Menswear brand awareness campaign planned from Summer 2015
New Menswear Director joining from H&M in Summer 2015
Driving menswear mix from 3%
16%menswear mix
to ASOS
761 Verdict, 2015

77 Audited results for the year ended 31 March 2015
New Look
New look is well positioned for future growth
Increasingly global dual gender fashion brand
Flexible fast fashion operating model
Differentiated multichannel capabilities
In the fastest growing market segment
Disciplined financial model and strong track record
Focused international growth
Clear momentum with multiple growth drivers
77

78 Audited results for the year ended 31 March 2015
Brait’s attraction to new acquisitions
78
Attractions Demonstrated through
Alignment • Brait is the controlling shareholder alongside management, the founder and Virgin Group
• Brait is the controlling shareholder alongside management and the founder
Management • Experienced, aligned and proven team • Experienced, aligned and proven team
Market leader
• Outstanding business in South Africa• No. 1 in UK and Italy
• Strong brand awareness in particular amongst women in the UK• No. 2 UK overall womenswear; No. 1 UK under-35 womenswear
Clear strategy
• A proven model that is repeatable, flexible and resilient• Exposure to positive macro health and wellness trends• A strong roll-out pipeline; exciting platform in Asia Pacific
• Fast fashion operating model: average lead time just 13 weeks• Established UK footprint well positioned in the higher growth value
segment of the apparel and accessories market• Strong growth prospects in France, Germany, Poland and
especially China which is a priority market
Well positioned
• Geographical diversification that is able to leverage the best practices of the group
• Aspirational global consumer brand is a key differentiator supporting the customer proposition
• Strong relationships with healthcare providers
• Solid brand, well developed multichannel offering via traditional stores and fast growing e-commerce platform
• Scale and efficiency of fast fashion operating model from source to customer is difficult to replicate
• Well-invested infrastructure and systems
Financial track record
• Double digit CAGR in revenue and EBITDA over past 10 years• High earnings visibility from subscription based model • Demonstrated double digit EBITDA growth in recent years
Cash flow generative
• Strong cash flow generation with a large proportion of membership fees received in advance
• Provides capital for expansion or returns to shareholders
• Solid cash flow generation to be used for deleverage and to fund growth
• Group capex tightly controlled and focused on supporting key strategic growth drivers

80 Audited results for the year ended 31 March 2015
Iceland Foods
80
Business overviewIntroduction
‒ UK based national food retailer focused on frozen food‒ Founded in 1970 by Malcolm Walker, current CEO‒ Management hold 43% of shareholding ‒ Over 24,000 employees
Defensible market position‒ 2.1% of UK grocery market (1)
− 15.9% share of the UK frozen market (1)
− Focused differentiated customer proposition of quality, value and convenience− Not a direct competitor to Big 4, but aim to take share of customer wallet
Diversified product mix− Sales are split 36% frozen, 32% chilled & 32% grocery− Frozen-led secondary shop, with over half of sales from top-up shoppers− Iconic private label offering delivering higher margins and product innovation− Unique home delivery service for those customers who use Iceland as their primary shop (spend at least £25 to qualify;
average basket spend is over £50) − c.2,500 SKU’s
Extensive store portfolio− 872 stores (FY14: 844) of which 859 in the UK (2) (FY14: 833) in convenient high street locations − New concept store “The Food Warehouse” launched Sept 2014: offers bulk buying; extended ranges of luxury and specialty
frozen food, chilled meat and fresh produce; operates at a substantially lower cost to sell than a traditional Iceland store model − Online service available in 520 stores; offers free delivery to customers spending at least £35; average basket spend £53− Delivered sales (both in-store and online purchases) average 200,000 deliveries per week
Attractive customer demographic‒ Targets value seeking families, providing compelling ‘value for money’ proposition
Cash generative business model‒ Proven track record of high cash generation and de-leveraging
(1) Kantar Worldpanel: 12 weeks ending 24th May 2015(2) Includes 6 “The Food Warehouse” stores

81 Audited results for the year ended 31 March 2015
Iceland Foods
81
FYE March 2015 results at a glance
(£’m) 2015Audited
2014Audited Commentary
Sales 2,697 2,711• LFL sales down 4.4% driven by food price deflation (1), a decline in customer transactions and
cannibalisation effect of new store openings• YoY sales down 0.5%; net 28 new stores opened during year (26 in UK, 2 international)
EBITDA% Margin
1505.6%
2027.5%
• EBITDA margin of 5.6% down (1.9%) on prior year • Driven by a reduction in gross margin (1.0%), sales performance (0.7%) and costs (0.2%)
DepreciationAmortisationExceptional items
(38)(81)(59)
(39)(83)(8)
• Depreciation charge in line with prior year• Amortisation of goodwill (2) and loan fees in line with prior year• Exceptional items: costs associated with July 2014 debt refinance of £54m(3) and restructure
costs of £5m (FY14: £8m)
EBIT% Margin
(28)(1.0%)
722.7% • Current year impacted by reduced EBITDA margin and exceptional items
Net interest expense (32) (49) • Underlying interest charge of £54m offset by Bond buyback discount, early redemption discount on debt, currency gain on euro dominated syndicated bank debt and interest income
EBT% Margin
(60)(2.2%)
230.9% • Function of above
Tax charge (6) (19) • Reduced tax charge driven by underlying profitability
PAT% Margin
(66)(2.5%)
40.2% • Function of above
(1) UK food prices fell by (3.0%) in the year to April 2015 (ONS: Consumer Price Inflation April 2015)(2) Iceland Foods’ financial statements are prepared in terms of UK GAAP which requires the amortisation of goodwill (£1.5 billion over 20 years)(3) £17.5m related to the issuance of new debt and £36.3m due to fees from earlier financings now written off

82 Audited results for the year ended 31 March 2015
Iceland Foods
82
(£’m) 2015 2014 Commentary
Cash from operations % EBITDA
189126.0%
19697.0%
• Business has remained highly cash generative• Reduction in EBITDA offset by better management of working capital
Capex (29) (1) (49) • Reduction driven by underlying lower number of new stores and refits than FY2014
Operating cash flow post capex % EBITDA
160106.7%
14772.8% • Function of above
Tax paid (19) (27) • Reduction driven by trading performance offset by tax settlements
Net interest paid (28) (33) • Net interest paid includes underlying net interest paid on Bonds and old debt, discount on Bond buybacks and interest income
Refinancing fees paid (12) - • Refinancing Fees relate to the July 2014 bond refinance
Operating cash flow post capex, tax and interest paid
% EBITDA101
67.3%87
43.1%• Aggregate of above
FYE March 2015 results at a glance
(1) FY2014 capex total quoted excludes proceeds on sale of tangible fixed assets of £4m

83 Audited results for the year ended 31 March 2015
Iceland Foods
83
Gearing analysis
Term debt facilities Interest rate Term (yrs) Currency Mar 2015 £’m
Mar 2014£’m
Total term debt 912 1,003
Senior Secured Note - Floating Libor + 425 bps 6 GBP 331
Senior Secured Note - Fixed 6.25% 7 GBP 381
Senior Secured Note - Fixed 6.75% 10 GBP 200
Revolving Credit Facility (“RCF”) 6 GBP (1) 30 25
Reconciliation to net debt quoted in Brait's valuation of Iceland Foods Mar 2015£’m
Mar 2014 £’m
Total debt (including finance leases) (2) (3) 912 1,003
Add: Bond buybacks in last week of financial year 10
Less: available cash (2) (166) (145)
Net debt per Brait's valuation of Iceland Foods 756 858
In July 2014, Iceland refinanced its entire debt (including the VLN) via a GBP High Yield Bond• Largest GBP HYB in the year and the second largest ever• Blended rate is 5.825%
(1) HSBC Superior Senior “RCF” increased to £30m in FY2015(2) Net debt considered in Brait’s valuation of Iceland Foods used latest management estimates at the date of finalising the valuation(3) Total of £912m reflected in balance sheet as £909m debt; £3m included in line item “Current liabilities”

85 Audited results for the year ended 31 March 2015
Iceland Foods
85
What’s happening in food retail is much more than just a price war

86 Audited results for the year ended 31 March 2015
Iceland Foods
86
For 44 years we’ve been a budget supermarket

87 Audited results for the year ended 31 March 2015
Iceland Foods
87
Last Year
Sales declineTried everything – tacticalUncertainty
Headless chickens!

88 Audited results for the year ended 31 March 2015
Iceland Foods
88
Price is no longer a weapon….
Everyone is cheap

89 Audited results for the year ended 31 March 2015
Iceland Foods
89
If price is no longer a differentiator
How do we stand apart from the competitors?

90 Audited results for the year ended 31 March 2015
Iceland Foods
90
Iceland is still competitive on those key products
Competitive on pavement package
Source: Brand view data (27th March ‘15)
15 Mixed Weight Fresh Eggs £1.25 £1.19 £1.25 £1.29 £1.59 £1.45 £1.20
Semi Skimmed Milk 4 Pints / 2.27L £0.89 £0.89 £0.89 £0.89 £1.00 £1.00 £1.00
Whitworths Granulated Sugar 1kg £0.49 £0.59 £0.59 £0.59 £0.60 £0.65 £0.59
Kingsmill Soft White Bread Medium 800G £0.75 £0.80 £0.79 £0.75 £0.75 £1.00 £1.35
Total £3.38 £3.47 £3.52 £3.52 £3.94 £4.10 £4.14

91 Audited results for the year ended 31 March 2015
Iceland Foods
91
Price gaps have not significantly changed
Source: Iceland Net price index (185 key value lines)

92 Audited results for the year ended 31 March 2015
Iceland Foods
92
Sales Split
35.7%
31.8%
32.5%
FY15: Turnover by Category
Frozen
Grocery
Chilled

93 Audited results for the year ended 31 March 2015
Iceland Foods
93
ButFrozen is our point of difference, our speciality

94 Audited results for the year ended 31 March 2015
Iceland Foods
94
The way forward…
Better packagingBetter products
Change everythingNew POSNew cabinets
New productsNew fascia
New advertisingNew PR

95 Audited results for the year ended 31 March 2015
Iceland Foods
95
The way forward has to be…
- The long haul
- Emphasise different products
- Emphasise quality
- Change perception
#PowerofFrozen

96 Audited results for the year ended 31 March 2015
Iceland Foods
96
InnovationWe have to be different!

97 Audited results for the year ended 31 March 2015
Iceland Foods
97
New Products

98 Audited results for the year ended 31 March 2015
Iceland Foods
98
New Products
99 Audited results for the year ended 31 March 2015
Iceland Foods
99
Quality

100 Audited results for the year ended 31 March 2015
Iceland Foods
100
Improved Products

101 Audited results for the year ended 31 March 2015
Iceland Foods
101
Packaging

102 Audited results for the year ended 31 March 2015
Iceland Foods
102
Advertising

103 Audited results for the year ended 31 March 2015
Iceland Foods
103
PR

104 Audited results for the year ended 31 March 2015
Iceland Foods
104
In store look and feel

105 Audited results for the year ended 31 March 2015
Iceland Foods
105
New fascia

106 Audited results for the year ended 31 March 2015
Iceland Foods
106
Online
• Refreshed website
• Dedicated delivered sales team looking at the whole
operation

107 Audited results for the year ended 31 March 2015
Iceland Foods
107
Online
Pre re-launch Post re-launch

108 Audited results for the year ended 31 March 2015
Iceland Foods
108
Productivity
• New appointment – Productivity Director• Shelf ready packaging• New scanners• New checkouts• Availability• Self scan tills
• However… Customer service still keyStaff motivation still key

109 Audited results for the year ended 31 March 2015
Iceland Foods
109
Next generation of Iceland stores
The Food Warehouse

110 Audited results for the year ended 31 March 2015
Iceland Foods
110
Summary
• Buying (the products / Innovation)
• Marketing (The Power Of Frozen)
• Operations (Productivity plans not cost cutting)
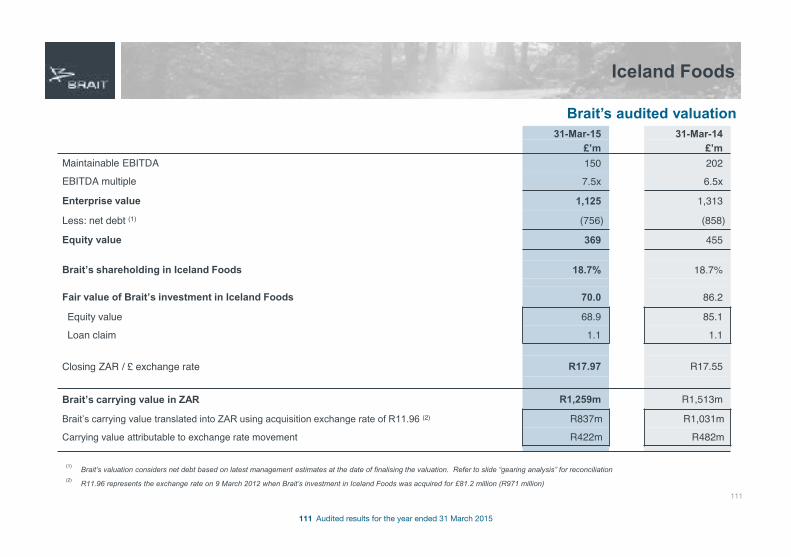
111 Audited results for the year ended 31 March 2015
Iceland Foods
111
Brait’s audited valuation31-Mar-15 31-Mar-14
£’m £’mMaintainable EBITDA 150 202EBITDA multiple 7.5x 6.5x
Enterprise value 1,125 1,313
Less: net debt (1) (756) (858)
Equity value 369 455
Brait’s shareholding in Iceland Foods 18.7% 18.7%
Fair value of Brait’s investment in Iceland Foods 70.0 86.2
Equity value 68.9 85.1
Loan claim 1.1 1.1
Closing ZAR / £ exchange rate R17.97 R17.55
Brait’s carrying value in ZAR R1,259m R1,513m
Brait’s carrying value translated into ZAR using acquisition exchange rate of R11.96 (2) R837m R1,031mCarrying value attributable to exchange rate movement R422m R482m
(1) Brait’s valuation considers net debt based on latest management estimates at the date of finalising the valuation. Refer to slide “gearing analysis” for reconciliation(2) R11.96 represents the exchange rate on 9 March 2012 when Brait’s investment in Iceland Foods was acquired for £81.2 million (R971 million)

112 Audited results for the year ended 31 March 2015
Iceland Foods
112
Attractions to Brait
Cash flow generative
• Strong cash flow generation from operations – average over past three years:− Pre capex: 109% of EBITDA− Post capex: 89% of EBITDA− Post capex, tax and interest: 54% of EBITDA
Market leader • Market leader in frozen foods that focuses on the cash consumer by providing value for money• Quality and innovative private label products at attractive prices, driving superior margins
Well positioned• Extensive footprint of 859 UK stores (including 6 Warehouse stores)• Well positioned to perform in current and medium-term economic climate prevailing in the UK• The Iceland Foods brand and services such as home delivery considered strong competitive differentiators
• Customers are low LSM equivalent Cash consumer
• Targeted procurement strategy allows Iceland Foods to be relevant to specific brands, leveraging buying power• Clear value message through round sum pricing• Highly effective streamlined business model
Clear strategy
Demonstrated throughAttractions
Management team• Entrepreneurial management style and positive culture permeates throughout the organisation• Since their return in 2006, the management team has demonstrated its ability to deliver significant value
creation through earnings growth, cash flow conversion and loyalty from customers and employees
Alignment• Strong, experienced management team aligned with Brait through equity ownership (management hold 43%)− largest shareholder is founder at 19.9%− quality investment partners with significant international retail experience

113 Audited results for the year ended 31 March 2015
Conclusion
113
Chapter OneAn active period 4 July 2011 to 31 March 2015
Brait• NAV grown from R16.50 to R77.12 (4.7x; with 4 year CAGR of 47%) • Share price risen from R16.50 to R83.50 at 31 March 2015 (5.1x; with 4 year CAGR of 50%)• Inclusion in MSCI Emerging Markets and FTSE/JSE Africa Series Top 40 indices
Pepkor • Investment realised returning 7x cost and 69.5% IRR• Solid profit growth, healthy cash flow generation and significant entry to exit multiple expansion
Premier• Significant investment made in people, brand building, product innovation and efficiencies• 3 year CAGR to June 2014: Revenue 17%; EBITDA 37%. Current EBITDA more than 3.5x FY2011• Building on FMCG offering with geographic expansion through 8 attractive acquisitions investing c.R2.2 billion at
an average EV/EBITDA multiple of 7x
Iceland Foods • Great job in “fighting the fight”• Strong cash flow generation, enhanced in FY2015, serves as bedrock to valuation
Chapter Two
Entering an exciting period working off a
solid base
Premier • Solid platform off which to grow organically, expand margins and enhance innovation• Continue to deliver attractive acquisitions
Iceland Foods • Positioned well to deal with the tough climate within the UK food retail sector post substantial focus on value proposition, product differentiation, stringent cost management and increased marketing
Virgin Active• Well-positioned defensive consumer business • Highly predictable EBITDA and cash flow generation from its subscription based model• Global lifestyle brand and leadership position in UK and SA markets provide strong platform for growth in its
chosen markets
New Look
• Established UK footprint well positioned in the higher growth value segment of the apparel and accessories market with market leading e-commerce strategy
• UK’s largest retailer in under 35’s womenswear; number 2 for womenswear • Fast fashion operating model; flexible and reactive supply chain• Strong growth prospects in its prioritised markets and well developed multichannel offering
Brait • Deal capacity: more to come; similar investment criteria; ability to tap a number of varied pools of capital

115 Audited results for the year ended 31 March 2015
Brait overview
115
Brait is an investment holding company focused on driving sustainable long-term growth and value creation in its investment portfolio of sizeable unlisted businesses operating in the broad consumer sector. Brait’s shares are listed on the EURO MTF market of the Luxembourg Stock Exchange and also on the JSE
ObjectiveAchieve superior long-term capital appreciation through majority or significant minority stakes in investments across a portfolio of primarily unlisted companies, while raising capital in the most efficient manner
Investmentcriteria
Timeline
• Investment size that ‘moves the dial’• Solid track record demonstrating strong growth in earnings, good margins and high cash flow conversion • Strong, aligned and experienced management team• Market leader in chosen segments• Well developed platform in local market with ability to move geographically into high growth territories• Clear coherent strategy that is flexible in order to be sustainable over the long term• Sensible acquisition multiple• Deep understanding of customers / clients• Relevant products
• Target a portfolio of 5 - 6 large quality assets• Whilst opportunistic on exit, ability to hold investments for long timeframes (open ended)• Ability to execute transactions quickly
Transparency
• Disclosure of valuation metrics and summarised audited financial statements for all significant investments to enable investors to formulate their own valuations
• Quarterly NAV reporting• Interim and year-end results presentations, with portfolio company management present

116 Audited results for the year ended 31 March 2015
Brait overview
116
Shareholders have liquidity through listed Brait share
Solid underpin to profit growth
Achieve effective and proactive communication with stakeholdersBalanced disclosure
Listed share as the vehicle
Provide superior return to shareholders
Minimal leakages; operating costs to AUM <0.85%
Responsible long term shareholders help drive value
All focused on same goal, team oriented approach
Enhance shareholder returns
Rationale
Continue to build on Brait’s historic investment return profile through growth in NAV
Invest in 5 – 6 quality, market leading, growth oriented, entrepreneurially managed, privately owned businesses
Efficient structure
Shareholder of reference in businesses with strong, aligned management teams, relevant products, cash generative
Alignment of interests amongst Brait, stakeholders and portfolio company management teams
Raise efficient capital
Demonstrate cash flow generation within underlying assets
Objectives
Single entry point to quality investments driving superior NAV growthOpen ended investment horizon removes short term bias from decisions
Efficient use of capitalMinimal cash drag on balance sheet with prudent use of investment company and portfolio gearing

117 Audited results for the year ended 31 March 2015
Brait overview
117
Brait’s valuation policyGiven the nature of its operations, investments are accounted for at fair value through profit and loss (in terms of IAS 39). The Group's reported NAV is thus equivalent to a 'sum-of-the-parts' valuation.
Listed investments:• Quoted closing market price at reporting date• Where the listed share is either thinly traded and / or the market is inactive, the valuation applied to determine carrying value is based on the
applicable unlisted investment valuation methodology set out below
Unlisted investments:Primary basis used is the Maintainable Earnings model:
• Maintainable earnings are derived with reference to the mix of prior year audited and latest available current year forecast EBITDA per the portfolio company, adjusted for any non-recurring income/expenditure. As the year progresses, so the weighting is increased towards the portfolio company’s forecast
• The average multiple of the peer quoted companies, derived as at date of valuation, is adjusted for points of difference to the portfolio company being valued. The valuation multiple for Premier and Iceland Foods is referenced to their respective peer trailing three year average EV/EBITDA multiples(1). This approach recognises market changes, whilst retaining cognisance of Brait’s long term investment horizon.
• The equity valuation takes consideration of the portfolio company’s net debt/cash on hand as per its latest available financial results
Where appropriate, alternative methodologies such as the Price-to-Book valuation model are appliedCross-check: Discounted Cash Flow, NAV and recent transaction prices are used as a validation check
(1) This approach for Premier and Iceland Foods was implemented in FY2015 and represents a change in estimate which, in accordance with IFRS 8, does not require retrospective adjustment

118 Audited results for the year ended 31 March 2015
Brait overview
118
Perpetual preference share capital
Salient termsInstrument Cumulative, non-participating, perpetual preference shares issued at R100 per share
Programme sizeR2 billion• 1st issuance of R1.5 billion on 6 August 2012 (applications received in excess of R2 billion)• 2nd tap issue of R0.5 billion via private placement on 25 June 2013
Listing Primary listing on the LuxSE with secondary listing on the JSE
Dividend rate Floating rate of 104% of RSA prime lending rate, with default rate at 144% of prime
Dividend terms • Cumulative calculated 31 March (year end) and 30 September (interim) of each year• Payable semi-annually, earlier of 5 days prior to payment of ordinary dividend or within 90 days from 31 March and 30 Sep
Preference shareholder protection
• Ordinary dividends withheld should the preference dividend not be declared and paid • If the preference share dividend remains outstanding for >90 days, the default rate applies• Should tax laws change affecting a SA corporate, Brait shall increase the dividend equal to the differential caused.
Thereafter, Brait has the election to voluntarily redeem the shares
Voting rights
Non-voting, unless:• dividend unpaid for >90 days • resolution proposal which affects rights • proposed corporate action:
− which will reduce Brait’s NAV <R10 billion; or − will cause preference share capital to be >10% of NAV; or− has the effect of delisting Brait

119 Audited results for the year ended 31 March 2015
Brait overview
119
Preference dividends to date:
• R1.469 billion net proceeds raised from first issuance 6-Aug-2012• R495 million net proceeds raised from 25-Jun-2013 tap issue
R1.964 billion net proceeds raised from Brait’s preference share programme:
(1) Excludes effect of any dividend withholding taxes
Perpetual preference share capital
Declarationdate
Dividend period
Dividend payment date
Preference share dividend declared (1)
# of preference shares in issue
Total Preference dividend
R’m
31-Oct-12 6-Aug-12 to 30-Sep-13 3-Dec-12 R1.3563 15,000,000 R20.3
28-May-13 1-Oct-12 to 31-Mar-13 24-Jun-13 R4.4079 15,000,000 R66.1
24-Oct-13 1-Apr-13 to 30-Sep-13 2-Dec-13 R4.4321 20,000,000 R88.6
27-May-14 1-Oct-13 to 31-Mar-14 23-Jun-14 R4.4934 20,000,000 R89.9
16-Oct-14 1-Apr-14 to 30-Sep-14 1-Dec-14 R4.7470 20,000,000 R94.9
29-May-15 1-Oct-14 to 31-Mar-15 29-Jun-15 R4.7968 20,000,000 R95.9
R455.7

120 Audited results for the year ended 31 March 2015
Premier
120
Summarised financial information

121 Audited results for the year ended 31 March 2015
Premier
121
Summarised income statement (Amounts in R’m)
(1) June 2014Audited
June 2013Audited
(2) June 2012Pro forma
April 2011Audited
Net revenue% Growth
7,75023.6%
6,2729.4%
5,73117.1%
4,896(7.6%)
EBITDA (3)
% Margin573
7.4%422
6.7%289
5.0%222
4.5%
Depreciation and amortisation (135) (86) (79) (87)
EBIT (3)
% margin438
5.7%336
5.4%210
3.7%135
2.8%
Net interest charge (227) (120) (136) (108)
EBT 211 216 74 27
PAT 153 137 80 57(1) The audited results for FY14 include the acquisitions made at various stages during the year (2) Following change in year-end to June, audited results for FY12 covered a 14 month period. For comparability, pro forma results for 12 months to Jun-12 shown(3) Excludes non recurring costs
Summarised cash flow information (Amounts in R’m)
June 2014 June 2013 (2) June 2012 April 2011
Cash flow from operations before working capital (4) 555 406 280 289
Working capital (31) (9) (197) (77)
Cash flow from operations% EBITDA
52491.4%
39794.1%
8328.7%
21295.5%
Capital expenditure (408) (203) (80) (152)
Operating cash flow post capex and tax% EBITDA
11620.2%
19446.0%
31.0%
6027.0%
Interest paid (235) (124) (136) (111)
Operating cash flow post capex, tax and interest% EBITDA
(119)(20.8%)
7016.6%
(133)(46.0%)
(51)(23.0%)
(4) Cash flow before non recurring gains and losses, post tax paid
Summarised financial information

122 Audited results for the year ended 31 March 2015
Premier
122
(1) Following change in year-end to June, audited results for FY12 covered a 14 month period. For comparability, pro forma results for 12 months to Jun-12 shown(2) Net IFRS 3 adjustment of R50m to account for final values of plant and machinery acquired in FY13(3) Shareholder loans are included in Shareholders Equity
Summarised financial information
Summarised balance sheet(Amounts in R’m)
June 2014Audited
June 2013Audited
(1) June 2012Pro forma
April 2011Audited
Total Assets 5,206 3,209 2,669 2,259
Property and equipmentIntangiblesCurrent AssetsCash
1,3632,3351,436
72
(2) 951949972337
689900982
98
634866 695
64
Total Liabilities 2,738 1,990 1,964 1,584
Trade creditorsCurrent liabilitiesDebt Other
1,02819
1,252439
673-
1,082(2) 235
717-
1,106141
710-
733141
Shareholders Equity (3) 2,468 1,219 705 675

124 Audited results for the year ended 31 March 2015
Iceland Foods
124
Summarised income statement(March year-end – results in £’m)
2015Audited
2014Audited
(1) 2013Pro forma
2012Audited
2011Audited
Revenue% growth
2,697(0.5%)
2,7112.7%
2,6401.0%
2,6149.4%
2,389 5.9%
EBITDA% margin
1505.6%
2027.5%
2268.5%
2338.9%
188 7.9%
EBIT% margin
(2) (28)(1.0%)
(2) 722.7%
(2) 1124.2%
1445.5%
130 5.4%
EBT% margin
(60)(2.2%)
230.9%
441.7%
148 5.7%
129 5.4%
PAT % margin
(66)(2.5%)
40.2%
160.6%
963.7%
82 3.4%
(1) The audited FY2013 financial statements are Group accounts which include operating results from the acquisition date 9 March 2012 to 31 March 2013. For comparability, pro forma results for the 52 weeks to 31 March 2013 have been shown
(2) EBIT FY2015 includes exceptional items of £59m (FY2014: £8m). FY2015 amortisation charge is £81m (FY2014: £83m) and depreciation is £38m (FY2014: £39m)
Summarised cash flow (£’m) 2015 2014 2013 2012 2011Cash flow from operations% EBITDA
189126.0%
19697.0%
234103.5%
236101.3%
191101.6%
Capital expenditure (29) (3) (49) (37) (25) (25)
Operating cash flow post capex% EBITDA
160106.7%
14772.8%
19787.2%
21190.6%
16688.3%
Tax paid (19) (27) (32) (46) (42)Interest paid (4) (40) (33) (48) (1) (1)
Operating cash flow post capex, tax and interest% EBITDA
10167.3%
8743.1%
11751.8%
16470.4%
12365.4%
(3) The increase in FY2014 capex driven by a gross 46 Iceland Foods outlets opened (FY13: gross 36 Iceland stores opened). Total shown excludes proceeds on sale of tangible fixed assets of £4m(4) FY15 interest paid includes the £12m refinancing fees relating to July 2014 bond refinance
Summarised financial information

125 Audited results for the year ended 31 March 2015
Iceland Foods
125
Summarised balance sheet(March year-end – results in £’m)
2015Audited
2014Audited
2013Audited
2012Audited
2011Audited
Total Assets 1,798 1,874 1,891 1,933 819 Property and equipmentIntangiblesCurrent AssetsCash
1651,271
198164
1741,346
202152
1661,421
176128
161 1,493
194 85
167 409 176 67
Total Liabilities 1,426 1,436 1,456 1,538 430
Trade creditorsCurrent liabilitiesDebt Other
38711290918
34569
1,00319
31665
1,05025
300100
1,11028
278875015
Shareholders Equity 372 438 435 395 389
Trading information (as at March year-end) 2015 2014 2013 2012 2011
Number of UK retail outlets 859 833 790 814 796 IcelandCooltrader (1)
859-
833-
790-
75757
74254
Retail space ('000 m2) 397 385 362 360 353IcelandCooltrader (1)
397-
385-
362-
34713
34013
(1) Cooltrader sold during Sept-12
Summarised financial information

126 Audited results for the year ended 31 March 2015
Iceland Foods
126
UK footprint

127 Audited results for the year ended 31 March 2015
Other investments
127
Audited Audited
March -15 March-14
R’m% total assets R’m
% total assets
Carrying value 2,438 6% 1,500 8%Restatement for IFRS 10 (1) - - 18 -
Restated carrying value 2,438 6% 1,518 8%
The ‘Other investments’ portfolio on Brait’s balance sheet comprises:• Brait’s effective c.10% interest in Brait IV; carrying value largely attributable to:
o Consol - largest manufacturer of glass packaging products on the African continent o Primedia - leading South African media groupo Buildmax - one of the largest opencast mining contractors in the South African coal mining industryo Nature’s Garden – integrated South African food producer and perishable logistics provider
• Proprietary investments; carrying value mostly relating to:o DGB - leading South African producer and exporter of local wine and importer of spirit brandso Southern View Finance (SVF) - international financial services business, looking to offer affordable and appropriate access to
financial services products aimed at the mass marketo Other assets include: investment in Mezzanine Funds; Chamber Lane Properties
• Realisation proceeds:o FYE 31 March 2015: R94 million mainly arising from SVF and Mezzanine Fundso FYE 31 March 2014: R191 million from SVF, Mezzanine Funds and realisation of Brait’s hedge fund operations
(1) The adoption of IFRS 10 has resulted in certain of the group’s subsidiary companies now accounted for in the Brait Group balance sheet at their fair value; whereas previously they were consolidated on a line-by-line basis. This results in any cash, accounts receivable/payable and provisions held by such subsidiaries to be reclassified to the investments line of the Group’s balance sheet. March-14’s net R18m reclassification comprises cash of R19m and provisions of R1m.

128 Audited results for the year ended 31 March 2015
Other investments
128
SVF overview
Southern View Finance Limited (1) (SVF) is an international financial services business, looking to offer affordable and appropriate access to financial services products aimed at the mass market:
Low cost financial services products will include:• small and affordable loans • mobile banking • money transfers and • micro insurance products
Partnering with and leveraging established retail and other networks:• SVF holds the right to originate unsecured loans across the extensive Pepkor footprint
‒ Initial focus is South Africa and specifically the Pep store platform, offering loans in return for an origination fee per loan application to Pepkor
• Intention to expand into other jurisdictions, including Australia, the UK and Eastern Europe
Key characteristics:• High monthly cash yield characteristics given the short term nature of loans advanced• Exposed to cash consumer in higher growth LSM 1 - 6 categories• Low cost operating model with centralised capital and credit capabilities combined with proven call
centre expertise and innovative software and mobile technology solutions• Target growth through geographic expansion rather than market share, maintaining discipline in offering
short term, small size loans• Funding via a mix of shareholder capital and bank financing
(1) SVF is listed on the Bermuda and JSE Alternative stock exchanges

129 Audited results for the year ended 31 March 2015
Other investments
129
SVF overview
Key business metrics for loan productMarch-15
status Comments
1 Average loan size R3,000 for the 6 month product • 6 month: rolling 3 month average new loan size R3,300
2 Loan term of 6 months • 6 month product comprises 89% of portfolio value
3 Target monthly cash yield percentage >20% • Rolling 3 month average cash yield for portfolio of 23%
4 Target Cumulative Write-Offs (1) of Cumulative Gross Advances (2) <12%
• Cumulative Write-Offs of R617m against Cumulative Gross Advances of R8.2 billion (7.5%) • Note that this calculation is not yet meaningful due to the lack of maturity of the portfolio
5 Target Bad Debt Provision of <= 20%
• SVF measures the required bad debt provision on the portfolio using a 12 month average roll-rate model:
‒ 6 month product currently provided for at 17% ‒ 12 month product currently provided for at 12%‒ 24 month product currently provided for at 10% ‒ Results in overall NPL(3) cover (4) of 159%
6 In excess of 100,000 new loan applications per month • Rolling 3 month average new applications exceeded target by c.14%• Recent trends and regulatory changes have resulted in tightening in application volumes
(1) Cumulative Write-Offs defined as cumulative written off capital, interest and fees in aggregate and by monthly vintage since SVF’s inception(2) Cumulative Gross Advances defined as cumulative aggregate total of all capital advanced plus cumulative interest and fees earned since SVF’s inception(3) “NPL” represents Non-Performing Loans. SVF defines NPL’s as those loans for which there are three or more instalments outstanding(4) NPL cover represents the extent of cover provided by the bad debt provision relative to NPL balances

130 Audited results for the year ended 31 March 2015
Other investments
130
SVF overview
Amounts in R’m As at 31 March 2015
Book size
• Number of active customers: 538 792
Arrears(1)
• Arrears are defined as the full loan balance of accounts where one or more instalment is outstanding • Arrears Cover represents the ratio of bad debt provision to Arrears
NPL cover(1)
• For comparative purposes, the NPL ratios are shown assuming an NPL definition of loans for which there are two (Delinquency 2+)or three (Delinquency 3+) instalments outstanding
Write-Offs(2)
• Accounts are written off upon reaching five consecutive missed instalments
Gross Book: 1,942Provisions (329)Net book 1,612
Arrears: 491Arrears as % of loan book: 26.3%Bad debt provision 320Arrears Cover 65%
Delinquency 3+ Delinquency 2+
Non-performing loans 201 296NPL as % of loan book 10.8% 15.8%NPL Cover 159% 108%
Cumulative Gross Write-Offs: 617Cumulative Bad debt recoveries: (37)Cumulative Write-Offs: 580
(1) Certain portfolio metrics (including NPL and Arrears) require the debtors’ book to go through a cycle in order to generate the data required. The cycle runs on the 7th of each month and therefore the latest cycle data availableis 7 April 2015, being the trading data for March 2015. These ratios therefore use book size and provision as at the 7th of April for ratio purposes
(2) Cumulative since SVF inception

131 Audited results for the year ended 31 March 2015
Other investments
131
Brait IV investments overview
Headquartered in Johannesburg, Consol employs around 1,650 staffConsol is the largest manufacturer of glass packaging products on the African continent Operates 4 manufacturing sites, which comprise 11 furnaces and 29 production lines which are strategically located in close proximity to its customersPrincipal supplier to all leading beverage and food companies in South Africa Recent acquisitions include #2 glass producer in Nigeria (Mar 2014) and #1 glass producer in Kenya ( subject to regulatory approval)Manufactures and markets an extensive range of standard and premium glass packaging products in a variety of shapes, sizes, colours and weights
Headquartered in Johannesburg, Primedia employs around 3,000 staffPrimedia is a leading media group with significant reach across the entire South African consumer spectrum With more than 40 brands on offer across a range of media and entertainment platforms, Primedia’s interests include broadcasting, advertising, marketing, promotions, entertainment and digital media in both the traditional and non-traditional media sectorsThe group’s reach extends to over three million radio listeners, 15 million cinemagoers, four million daily commuters and more than ten million digitally connected South Africans through 69 platforms – Primedia Online represents the largest base of unique digital consumers in the countryThe group’s strategy is to ensure exclusive rights to advertising media or products wherever possible, reaching critical mass, and providing composite media solutions which cover diverse audiences
---
-
-
---
---

132 Audited results for the year ended 31 March 2015
Other investments
132
− Leading SA producer and exporter of local wine and importer of international spirit brands− Formally founded in 1990, although winemaking history extends over 300 years− Headquartered in Midrand, Johannesburg. Production facilities in Western Cape (Wellington and Franschhoek)− Largest employer in the Wellington area, employing 370 staff and a number of seasonal workers− State of the art production, bottling, storage and warehousing facilities− 28 company owned wine brands, 5 agency wine brands − 10 company owned spirit brands, 24 agency spirit and allied beverage brands− Extensive distribution network with 16 national depots ensuring good coverage across SA− Logistics platform to drive growth into new brands− Entrepreneurial management team− SA agent for all Bacardi products
DGB

133 Audited results for the year ended 31 March 2015
Other investments
133
Predecessor funds (fully realized) Investments Gross returns
Fund Vintage Pioneering feats # CostR’m
ProceedsR’m
Multiple of cost IRR
Brait I 1991 1st closed-end 3rd party funded private equity (PE) fund raised in RSA
22 228 417 1.8x 29%
Brait II 1995 1st PE fund in RSA to have raised international capital (mainly N. America)
12 695 1,528 2.2x 46%
Brait III 1999 $409m capital raised was the largest at the time on African continent
14 2,301 10,043 4.4x 32%
Total: Realised funds 48 3,224 11,988 3.7x n/m
Brait III:• The New York State Common Retirement Fund ranked Brait III joint 3rd out of 246 PE funds (vintage years 1999 to 2004) • 80% of Brait III value creation sourced from EBITDA growth
Active fund Investments
Fund Vintage Pioneering feat # Cost to date (R’m)
Brait IV 2006 $880m capital raised was the largest at the time on African continent 7 4,317
Brait’s heritage in private equity
• Brait has an effective c.10% look-through interest in Brait IV; with the carrying value, largely attributable to Consol and Primedia, included within the ‘other investments’ classification

BRAIT AUDITED RESULTS ANNOUNCEMENT
FYE 31 MARCH 2015

136 Audited results for the year ended 31 March 2015
Salient features for the year ended 31 March 2015
Restated^ Restated^Audited Audited Audited Audited
31 March 31 March 31 March 31 March2014 2015 2015 2014R’m R’m €’m €’m
PERFORMANCE MEASURES 3 195 7 712 Net asset value (NAV) per share (cents) 592 220
20% 141% NAV per share increase for the year 169% (2%)25% 55% NAV per share three year CAGR# 43% 9%
0.66% 0.44% Operatingcost:AssetsUnderManagement(AUM)* 0.44% 0.66%0.33% 0.27% Operatingcostafterfeeincome:AUM 0.27% 0.33%
346 14 671 Cash inflow from investment portfolio 1 127 24
DIVIDENDS 31.95 77.12 Proposed/paid ordinary dividends per share (cents) 5.79 2.24
443.21 474.70 Interim preference dividend per share paid (cents) 33.3052 32.8723 449.34 479.68 Final preference dividend per share declared/paid (cents) 35.9842 31.5439
FINANCIAL STATISTICS 27 330 43 127 Market capitalisation 3 309 1 835
5 321 8 350 Closing ordinary share price (cents) 641 357
514 516 Ordinary shares in issue (m) 516 514 (5) (6) Treasury shares (m) (6) (5)
509 510 Ordinary shares outstanding (m) 510 509 # Compound Annual Growth Rate “CAGR”* AUM represents the aggregate of the Group’s total assets and Brait IV invested capital under management^ Restated due to the adoption of IFRS 10 – see note 2 for further details

137 Audited results for the year ended 31 March 2015
Summary consolidated statement of financial position as at 31 March
Restated RestatedAudited Audited Audited Audited
31 March 31 March 31 March 31 March2014 2015 2015 2014R’m R’m Notes €’m €’m
ASSETS 17 760 27 718 Non-current assets 2 129 1 225
17 229 27 144 Investments 3 2 085 1 188 523 574 Loan receivable 4 44 36
8 – Property and equipment – 1
662 13 701 Current assets 1 052 45
342 12 Accounts receivable 1 23 320 13 689 Cash and cash equivalents 5 1 051 22
18 422 41 419 Total assets 3 181 1 270
EQUITY AND LIABILITIES 16 247 39 369 Ordinary shareholders equity and reserves 6 3 023 1 120
1 964 1 964 Preference shareholders equity 7 151 135
164 – Non-current liabilities – 11
164 – Borrowings 8 – 11
47 86 Current liabilities 7 4
47 86 Accounts payable and other liabilities 7 4
18 422 41 419 Total equity and liabilities 3 181 1 270
514 516 Ordinary shares in issue (m) 516 514 (5) (6) Treasury shares (m) (6) (5)
509 510 Outstanding shares for NAV calculation (m) 510 509 3 195 7 712 Net asset value per share (cents) 592 220

138 Audited results for the year ended 31 March 2015
Summary consolidated statement of comprehensive income for the year ended 31 March
Restated RestatedAudited Audited Audited Audited
31 March 31 March 31 March 31 March2014 2015 2015 2014R’m R’m Notes €’m €’m
2 683 22 979 Investment gains 1 686 196 449 611 Other investment income 45 34
(143) (201) Operating expenses (15) (11) (57) (48) Finance costs (3) (5) 13 (7) Taxation (1) 1
2 945 23 334 Profit for the year 1 712 215
Comprehensive income for the year 16 9 Translation adjustments 208 (220)
2 961 23 343 Comprehensive income/(loss) for the year 1 920 (5)
545 4 527 Earnings/Headline earnings per share (cents) – basic and diluted 9 332 35
Summary consolidated statement of changes in equity for the year ended 31 March
13 458 16 247 Ordinary shareholders’ balance at beginning of the year 1 120 1 1372 945 23 334 Profit for the year 1 712 215
16 9 Translation adjustments 208 (220)(5) (22) Net purchase of treasury shares (2) –
(12) (14) Ordinary dividends paid (cash election) 6 (1) (1)(155) (185) Earnings attributed to preference shares (14) (11)
16 247 39 369 Ordinary shareholders’ balance at end of the year 3 023 1 120
1 469 1 964 Preference shareholders’ balance at beginning of the year 135 124495 – Preference share issue net of cost – 36
– – Translation adjustments 16 (25)155 185 Earnings attributed to preference shares 14 11(155) (185) Preference dividend paid (14) (11)
1 964 1 964 Preference shareholders’ balance at end of the year 151 135

139 Audited results for the year ended 31 March 2015
Summary consolidated statement of cash flows for the year ended 31 March
Restated RestatedAudited Audited Audited Audited
31 March 31 March 31 March 31 March2014 2015 2015 2014R’m R’m €’m €’m
Cash flows from operating activities: 211 14 400 Investment proceeds 1 106 15
98 84 Fees received 6 7 57 113 Interest received 9 4 83 147 Dividends received 11 6
(151) (214) Operating expenses paid (16) (10) (10) (10) Taxation paid (1) (1) (19) (46) Interest paid (4) (1)
269 14 474 Operating cash flow before purchase of investments 1 111 20 (1 805) (841) Purchase of investments (65) (124)
(1 536) 13 633 Net cash from/(used) in operating activities 1 046 (104) (2) – Acquisition of property and equipment – –
(2) – Net cash used in investing activities – –495 – Preference share issue net of cost – 34
1 000 – Loan received from Fleet – 69 (4) (164) Net repayment of long-term borrowings (13) – (5) (22) Net purchase of treasury shares (2) –
(12) (14) Ordinary dividend paid (cash election) (1) (1) (155) (185) Preference dividend paid (14) (11)
1 319 (385) Net cash (used)/from financing activities (30) 91 (219) 13 248 Net increase/(decrease) in cash and cash equivalents 1 016 (13)
46 121 Effects of exchange rate changes on cash and cash equivalents 13 1 493 320 Cash and cash equivalents at beginning of year 22 34
320 13 689 Cash and cash equivalents at end of year 1 051 22

140 Audited results for the year ended 31 March 2015
Notes to the summary consolidated financial statements for the year ended 31 March1. ACCOUNTING POLICIES 1.1 Basis for preparation The financial statements of the Group are prepared on the going concern principle, in accordance with International Financial Reporting
Standards(IFRS)asadoptedbytheEuropeanUnion.ThesesummaryconsolidatedfinancialstatementsarepresentedinaccordancewithIAS 34:InterimFinancialReporting.Exceptasdetailedbelow(innotes1.2and1.3),theaccountingpoliciesandmethodsofcomputationareconsistent with those applied in the consolidated annual financial statements for the year ended 31 March 2014.
TheGroup’sfinancialstatementsarepreparedusingboththeEuro(€/EUR)andSARand(R/ZAR)asitspresentationcurrencies.TheGrouphasthreefunctionalcurrencies:USD(US$),GBP(£/GBP)andSARandfortherespectivejurisdictionsinwhichitoperates.Thefinancialstatementshavebeenpreparedusingthefollowingexchangerates:
2015 2014
Closing Average Closing Average
USD/ZAR 12.1321 11.4826 10.5325 10.1178
GBP/ZAR 17.9746 17.7794 17.5500 16.1108
EUR/ZAR 13.0196 13.6291 14.5028 13.5779
USD/EUR 0.9318 0.8425 0.7262 0.7451
GBP/EUR 1.3806 1.3045 1.2101 1.1866
1.2 Adoption of new and revised standards and interpretations Inthecurrentperiod,allthenewandrevisedstandardsandinterpretationsissuedbytheInternationalAccountingStandardsBoard(“IASB”)and
theIFRSInterpretationsCommittee(“IFRIC”)oftheIASB,asadoptedbytheEuropeanUnion,thatarerelevanttotheGroup’soperationsandeffective for annual reporting periods commencing on 1 April 2014 have been adopted. Their adoption has not had a significant impact on the presentation of the financial statements, except as described below.
TheadoptionoftheinvestmententityexemptioninIFRS10:ConsolidatedFinancialStatements(“IFRS10”)hasresultedintheholdingcompanyandcertainsubsidiariesbeingclassifiedasInvestmentEntities.SubsidiariesthatmainlyperformaninvestmentholdingfunctionareaccountedforasInvestmentEntitiesatFairValuethroughprofitandloss(InvestmentEntitiesatFVTPL).SubsidiariesthatprovideservicestotheGrouportothirdpartiesanddonotholdinvestmentscontinuetobeconsolidated.Subsidiaries thatarebothinvestmentholdingandserviceprovidersareaccounted as Investment Entities at FVTPL.
UnderthetransitionalprovisionsofIFRS10,thechangeinaccountingforthosesubsidiariesnowmeasuredatFVTPListreatedretrospectively.The resulting restatements to the prior periods are set out in the Restatement note (see note 2). These restatements do not result in any change totheGroup’sNetAssetValuepershareorShareholderEquityreportedfortheprior periods.

141 Audited results for the year ended 31 March 2015
1. BASIS FOR PREPARATION (continued) 1.3 Principles of consolidation 1.3.1 Accounting for subsidiaries, joint ventures and associates GiventhenatureoftheGroup’soperations,allportfolioinvestmentsareaccountedforatFVTPLintermsofIAS 39:FinancialInstruments:
RecognitionandMeasurement(IAS39),irrespectiveofwhethertheyaresubsidiaries,jointventuresor associatesasexplainedbelow.
SubsidiariesareentitiesthattheGroupcontrolsbybeingexposedto,orhavingrightsto,variablereturnsfromitsinvolvementwiththatentity and, where the Group has the ability to affect those returns through its power over the entity.
TheGroupsubsidiariesconsistofentitiesthat: i. hold portfolio investments; ii. provide services to third parties and related companies; and iii. do both (i) and (ii). Subsidiariesclassifiedas(i)or(iii)areclassifiedasInvestmentEntitiesunderIFRS 10.InvestmentEntitiesareexemptfromconsolidation
andmeasuredatFVTPLintermsofIAS 39.Changesinfairvalue,primarilydrivenbyrevaluationofportfolioinvestments,arerecognisedinprofitandlossintheperiodofchange.Subsidiariesclassifiedas(ii)arenotInvestmentEntitiesandcontinuetobeconsolidated(“ConsolidatedSubsidiaries”).
Where the Group does not have control, but has significant influence, these are classified as associates. The group does not have any jointventures.GiventhenatureoftheGroup’soperations,associatesareaccountedforatFVTPL(scopedoutofIAS 28:InvestmentsinAssociatesandJointVenturesandintoIAS 39).Changesinfairvaluearerecognisedinprofitorlossintheperiodofchange.
1.3.2 Basis of consolidation for consolidated Subsidiaries On acquisition date, the assets and liabilities and contingent liabilities of a subsidiary are measured at their fair values. Any excess
of acquisition cost over fair value of the identifiable net assets acquired, is recognised as goodwill. Any shortfall in the acquisition cost below the fair value of the identifiable net assets acquired (ie discount), is credited to profit and loss in the period of acquisition. Minority shareholders are stated at their proportion of the fair value of the assets and liabilities recognised.
TheresultsofConsolidatedSubsidiariesacquiredordisposedofduringtheperiodareincludedinthestatementofcomprehensiveincome from their effective date of acquisition up to their effective date of disposal. Where necessary, adjustments are made to the financialstatementsofConsolidatedSubsidiariestoaligntheirpolicieswiththoseusedbytheGroup.Allintra-grouptransactions,balances, income and expenses are eliminated on consolidation.
Notes to the summary consolidated financial statements for the year ended 31 March (continued)

142 Audited results for the year ended 31 March 2015
2. RESTATEMENTUnderthetransitionalprovisionsfortheadoptionofIFRS10,thecomparativedisclosuresforInvestmentEntitiesatFVTPLarerequiredtobeappliedretrospectively. The Group’s valuation methodology remains unchanged. The impact to the Group of the resulting restatements to the prior year are set out below. As the restatements are not considered to be significant, with no change to the Group’s key reporting metric of Net Asset Value per shareorShareholderEquitypreviouslyreported,theireffectisshownforthe31March2014comparativeperiod only.
2.1 Restatement impact on summary consolidated statement of financial position TheIFRS10adjustmentstocashandcashequivalentsreflecttheaggregatecashpositionheldbytheGroup’sInvestmentEntitiesatFVTPL.Previously,thesecashbalanceswereconsolidatedwiththerestoftheGroup’scashholdings.PosttheadoptionofIFRS10,thesecashbalancesnow form part of the fair value recognised for these Investment Entities at FVTPL in the Investment line of the statement of financial position.
Previously reported
IFRS10Adjustment Restated Restated
IFRS10Adjustment
Previously reported
R’m R’m R’m 31 March 2014 €’m €’m €’m
17 211 18 17 229 Investments 1 188 1 1 187
339 (19) 320 Cash and cash equivalents 22 (1) 23
(1) 1 – Deferred tax liability – – –
17 549 – 17 549 Total for above items 1 210 – 1 210
Notes to the summary consolidated financial statements for the year ended 31 March (continued)

143 Audited results for the year ended 31 March 2015
Notes to the summary consolidated financial statements for the year ended 31 March (continued)2. RESTATEMENT (continued)
2.2 Restatement impact on summary consolidated statement of comprehensive incomeTheGroup’sinvestmentinIcelandFoodsisdenominatedinGBP.Resultingforeignexchangerategainsandlosseswerepreviouslyrecognisedin comprehensive income as translation adjustments. The subsidiary that holds the investment in Iceland Foods is classified as an Investment Entity at FVTPL. As a result, foreign currency exchange rate gains and losses are restated and now recognised as part of investment gains in profit for the year. The results in a corresponding restatement of Earnings/Headline earnings per share.
Previously reported
IFRS10Adjustment Restated Restated
IFRS10Adjustment
Previously reported
R’m R’m R’m 31 March 2014 €’m €’m €’m
2 348 335 2 683 Investment gains 196 23 173 452 (3) 449 Other Investment income 34 – 34
(144) 1 (143) Operating expenses (11) – (11) (44) – (44) Finance costs and taxation (4) – (4)
2 612 333 2 945 Profit for the year 215 23 192 349 (333) 16 Translation adjustments (220) (23) (197)
2 961 – 2 961 Comprehensive income/(loss) (5) – (5)
480 65 545 Earnings/Headline earnings per share (cents) 40 5 35
2.3 Restatement impact on summary consolidated statement of cash flowsThe change to the Group’s reported cash and cash equivalents arises from the reclassification discussed in note 2.1 above.
219 (8) 211 Investment proceeds 15 – 15 99 (1) 98 Fees received 7 – 7
(152) 1 (151) Operating expenses paid (10) – (10) (11) 1 (10) Taxation paid (1) – (1)
(367) – (367) Total for unaffected cash flow items (24) – (24)
(212) (7) (219) Net decrease in cash and cash equivalents (13) – (13) 48 (2) 46 Effects of exchange rates on cash 1 8 (7)
503 (10) 493 Cash and cash equivalents at beginning of year 34 (9) 43
339 (19) 320 Cash and cash equivalents at end of year 22 (1) 23

144 Audited results for the year ended 31 March 2015
Notes to the summary consolidated financial statements for the year ended 31 March (continued)3. INVESTMENTS TheGroupappliesanumberofmethodologiestodetermineandassessthereasonablenessoffairvalue,whichmayincludethe following: • Earningsmultiple • Recenttransactionprices • Netassetvalue • Pricetobookmultiple
Listed investments are held at recent quoted transaction prices. Where the listed investment is either thinly traded and/or the market is inactive, the valuation applied to determine carrying value is based on the applicable unlisted investment valuation methodology set out below.
Theprimaryvaluationmodelutilisedforvaluingunlistedinvesteecompaniesisthemaintainableearningsmultiplemodel:
MaintainableearningsarederivedwithreferencetothemixofprioryearauditedandlatestavailablecurrentyearforecastEBITDApertheportfoliocompany,adjusted for any non-recurring income/expenditure. As the year progresses, so the weighting is increased towards the portfolio company’s forecast.
ThedirectorsdecideonanappropriategroupofcomparablequotedcompaniesfromwhichtobasetheEV/EBITDAmultiple.Theaveragemultipleofthe comparable quoted companies, is adjusted for points of difference to the portfolio company being valued. The equity valuation takes consideration of the portfolio company’s net debt/cash on hand as per its latest available financial results. Further valuation information can be obtained from the 31 March 2015 investor presentation on the Group’s website, www.brait.com.
RestatedAudited Audited Audited
RestatedAudited
31 March 2014
31 March 2015 Valuation metrics used @ 31 March 2015
31 March 2015
31 March 2014
R’m R’m EBITDA Multiple Net Debt €’m €’m
11 145 – Pepkor – 768
– 15 206 Steinhoff (200 million shares at 31 March 2015 closing price of R76.03 per share) 1 168 –
3 053 8 241 Premier (R’m) 829 12.3 3 187 633 211
1 513 1 259 IcelandFoods(GBP’m) 150 7.5 756 97 104
1 518 2 438 Other Investments Varied 187 105
17 229 27 144 Total investments 2 085 1 188

145 Audited results for the year ended 31 March 2015
Notes to the summary consolidated financial statements for the year ended 31 March (continued)3. INVESTMENTS (continued) Fair Value Hierarchy IFRS13providesahierarchythatclassifiesinputsusedtodeterminefairvalue.Investmentsmeasuredandreportedatfairvalueareclassifiedand
disclosedinoneofthefollowingcategories:
Level 1 Unadjustedquotedpricesinactivemarketsforidenticalassetsorliabilities.
Level 2 Inputs other than quoted prices included within Level 1 that are observable for the asset or liability, either directly (i.e. as quoted prices) or indirectly (i.e. derived from quoted prices).
Level 3 Inputs for the assets or liability that are not based on observable market data
There are no financial assets that are categorised as Level 2 and no transfers between levels in the current or prior year.
Level 1 Level 3 Total Total Level 1 Level 3R’m R’m R’m 31 March 2015 €’m €’m €’m
15 206 – 15 206 Steinhoff 1 168 1 168 –– 6 252 6 252 Premier 480 – 480– 1 238 1 238 Iceland Foods 95 – 955 2 150 2 155 Other Investments 166 – 166
15 211 9 640 24 851 Investment in equity instruments# 1 909 1 168 741
# Excludes loan investments. The amortised costs valuation for investment loans approximate fair value as these loans are at market related rates.

146 Audited results for the year ended 31 March 2015
Notes to the summary consolidated financial statements for the year ended 31 March (continued)
RestatedAudited Audited Audited
RestatedAudited
31 March 31 March 31 March 31 March2014 2015 2015 2014R’m R’m €’m €’m
4. LOAN RECEIVABLE
1 523 1 672 Loan to Fleet Holding Ltd (Fleet) 128 104(1 000) (1 098) Loan from Fleet (84) (68)
523 574 Net loan to Fleet 44 36
Bothloansbearinterestatthe3monthJohannesburgInterBankAcceptanceRate(“JIBAR”)plus3.45%,withtherighttorollupinterest.Theloansarerepayable at the end of their term (4 July 2016) with an option to extend for a further five years.
SharespledgedbyFleetaresubjecttoajointandseveralpledgetoboththeGroupandLenderswhofinancedtheloanfromFleet(The StandardBankofSA LimitedandFirstRandBankLimited,tradingthroughitsRandMerchantBankdivision).Thepledgedsharesat31March2015were92.3million(2014:92.3 million).The closingBraitsharepriceofR83.50on31March2015resultsinacoverratioontheR1672million/€128millionloanof461%(2014:300%).
5. CASH AND CASH EQUIVALENTS 320 13 689 Balanceswithbanks 1 051 22
161 3 034 – ZARcash 233 11159 178 – USDcash 14 11
– 10 477 – GBPcash(1) 804 –
(1) Cash placed across five banks with an investment grade credit rating.

147 Audited results for the year ended 31 March 2015
Notes to the summary consolidated financial statements for the year ended 31 March (continued)
Audited Audited Audited Audited31 March 31 March 31 March 31 March
2014 2015 2015 2014R’m R’m €’m €’m
6. SHARE CAPITAL AND PREMIUMAuthorised share capital1 500 000 000 at par value of €0.22 per share
Issued share capital31 March 2014 513 632 676Bonusshareissue 2857293*
31 March 2015 516 489 969
Dividend(12) (14) 8% of ordinary shareholders elected to receive the cash alternative (1) (1)
* The par value of the bonus shares issued are accounted for in Ordinary Share Premium. The August 2014 bonus share issue was converted at 60 day Volume Weighted Average Price (VWAP) of R52.62 per share translating into 0.60718 shares for every 100 shares held.
7. PREFERENCE SHARES1 964 1 964 Authorised 151 135
20 000 000 cumulative, non-participating perpetual preference shares with a nominal value of €0.01 each.
Issued20 000 000 cumulative, non-participating perpetual preference shares issued at €9.50/R100.00 per share with a nominal value of €0.01 each with a primary listingontheLuxSEandsecondarylistingonJSE.
The discretionary preference dividend is calculated on a daily basis at 104% oftheSAPrimeinterestrateandispayableaftereachreportingdate.Arrearpreferencedividendsshallaccrueinterestat144%oftheSAPrimeinterestrate.

148 Audited results for the year ended 31 March 2015
RestatedAudited Audited Audited
RestatedAudited
31 March 31 March 31 March 31 March2014 2015 2015 2014R’m R’m €’m €’m
8. BORROwINGS
164 –
LoanfromFirstRandBankLimited(tradingthroughitsRandMerchantBankdivision)andTheStandardBankofSouthAfricaLimitedisRanddenominated,bearsinterestatJohannesburgInterBankAcceptanceRate(JIBAR)plus2.5%and interest is repayable quarterly, with a right to rollup. The facility amount outstanding is repayable on maturity of the facility on 4 July 2016, with an option to extend for a further 5 years. This facility is secured by Group Assets. The facility outstanding balance was repaid on 31 March 2015 from the cash consideration received from the Pepkor realisation. – 11
9. HEADLINE EARNINGS PER SHARE 2 945 23 334 Profit for the year 1 712 215
(89) (95) Interim Preference dividend paid (7) (7) (90) (96) Final Preference dividend declared/paid (7) (7)
2 766 23 143 Earnings/Headline Earnings 1 698 201507 511 Weighted average ordinary shares in issue (m) – basic & diluted 511 507
545 4 527 Earnings/headline earnings per share (cents) – basic & diluted 332 40
Notes to the summary consolidated financial statements for the year ended 31 March (continued)

149 Audited results for the year ended 31 March 2015
Notes to the summary consolidated financial statements for the year ended 31 March (continued)
Audited Audited Audited Audited31 March 31 March 31 March 31 March
2014 2015 2015 2014R’m R’m €’m €’m
10 CONTINGENT LIABILITIES AND COMMITMENTS10.1 Contingencies
33 69 Sureties 5 31 024 397 Guarantees(1) 30 71
(1) The guarantee total of €30 million/R397 million is provided to the lenders to Southern View Finance Limited in order to reduce the interest paid on certain tranches of its borrowings. The guarantees in respect of the Pepkor SPV (2014: €33 million/R472 million) were released on disposal of the Group’s interest in Pepkor.
1 057 466 Total contingencies 35 74
10.2 Commitments111 114 Private equity funding commitments 9 8
Rental commitments (Malta and Mauritius)2 2 – Within one year – –3 3 – Betweenoneandfiveyears – –
116 119 Total commitments 9 8
10.3 OtherThe Group has rights and obligations in terms of shareholder or purchase and sale agreements relating to its present or former investments.

150 Audited results for the year ended 31 March 2015
Notes to the summary consolidated financial statements for the year ended 31 March (continued)
Audited Audited Audited Audited31 March 31 March 31 March 31 March
2014 2015 2015 2014R’m R’m €’m €’m
11. RELATED PARTY BALANCESTransactions between the Company and its subsidiaries have been eliminated on consolidation or on fair value of subsidiaries and are not disclosed in this note. Transactions between the Company and its subsidiaries are disclosed in the Company’s separate financial statements. Following the change in shareholding of the Group’s contracted Corporate Advisor on 1 April 2014, the loan receivable from Fleet is no longer classified as a related party balance. During the year, Group companies entered into the following transactions with relatedpartieswhoarenotmembersofthe Group:
Profit from operations include: (8) (9) Non-executive directors’ fees (1) (1)
– (4) Professionalfees–MPartnersS.àr.l – –(1) (1) Professional fees – Maitland International Holdings Plc – –
12. NON-ADJUSTING POST-BALANCE SHEET EVENTS– Braitannouncedon16April2015theproposedacquisition,subjecttotheapprovaloftheSouthAfricanandNamibiancompetitionauthorities,
ofac.80%interestinVirginActive,oneoftheworld’sleadinginternationalhealthcluboperators,forc.GBP682million.Theacquisitioncostwillincrease at a rate of 5% per annum from 31 December 2014 (the effective date of acquisition) to closing and be reduced by certain pre-acquisition expenses.Braitwillfundtheacquisitioncostusingcashonhand.
– Braitannouncedon15May2015theacquisitionofac.90%interestinNewLook,aleadingfastfashionmultichannelretaileroperatinginthevaluesegmentoftheUKclothingandfootwearmarketwithagrowinginternationalpresence.TheestimatedpurchaseconsiderationpayablebyBraitofc.GBP780milliontakesintoaccounttransactioncosts,butmaybeadjustedupordowndependingonactualtransactionscosts.Braitwillfund the purchase consideration using facilities and cash on hand. This acquisition is unconditional and the date of completion is 25 June 2015.
– Gearing facilities increased post year end to R16.5 billion to facilitate funding of the New Look and Virgin Active acquisitions.
AUDITOR’S OPINIONThese summary consolidated financial statements for the year ended 31 March 2015 have been audited by Deloitte Audit Limited who expressed an unmodified opinion thereon. The auditor also expressed an unmodified opinion on the annual consolidated financial statements from which these summary consolidated financial statements were derived.
A copy of the auditor’s report on the summary consolidated financial statements and of the auditor’s report on the annual consolidated financial statements are available for inspection at the Company’s registered office, together with the financial statements identified in the respective auditor’s reports.

151 Audited results for the year ended 31 March 2015
Review of operationsTheBoardofDirectorsispleasedtoreporttoshareholderstheGroupresultsforthefinancialyearended31March2015.
VALUE DRIVERSGrowth in Net Asset Value (NAV) is the Group’s key performance measure with the following additional factors together comprising the core value drivers ofthebusiness:• LowcosttoAssetsUnderManagement(AUM)ratio;• Minimalbalancesheetcashdrag;• Significantcashflowwithintheinvestmentportfolio;and• PredictableandconsistentordinarydividendtoclosingNAVyield.
Growth in NAVBraittargetsgrowthinitsNAVpershareatacompoundrateofatleast15%perannumoveranythree-yearperiod.TheCompoundAnnualGrowthRate(CAGR) for the increase in reported NAV for the three years to 31 March 2015 is 55.3%. Including ordinary share bonus issues and alternative election cashdividendspaidduringthisperiod,thereturnCAGRoverthesameperiodtoshareholdersis55.8%.The Group’sNAVpershareofZAR77.12at31 March2015,representsa141.4%increaseontheZAR31.95at31March2014.
Duringtheyearunderreview,BraithaschangedthereferencemultipleforthePremierandIcelandFoodsvaluationstothetrailingthreeyearpeeraveragemultiple,inordertobetteralignthereportedNAVwiththemarket,whilstretainingcognizanceofBrait’slongterminvestmenthorizon.Atreportingdate,theEV/EBITDAvaluationmultiplesusedare12.3xforPremier(representingthepeergroup’strailingthreeyearaveragemultiple)and7.5xforIcelandFoods(discountof21%tothepeergrouptrailingthreeyearaveragemultipleof9.5x).For comparison,peergroupaverageEV/EBITDAmultiplesatreporting date are 14.6x for Premier and 10.7x for Iceland Foods.

152 Audited results for the year ended 31 March 2015
Review of operations (continued)ThereportedNAVbreak-downisasfollows:
Restated#
Audited 31 March
2014
Audited 31 March
2015
Audited 31 March
2015
Restated#
Audited 31 March
2014ZAR’m ZAR’m % EUR’m EUR’m
17 229 27 144 Investments 66 2 085 1 188
11 145 – Pepkor – 768– 15 206 Steinhoff 37 1 168 –
3 053 8 241 Premier 20 633 2111 513 1 259 Iceland Foods 3 97 1041 518 2 438 Other investments 6 187 105
523 574 Loan receivable 1 44 36320 13 689 Cash and cash equivalents 33 1 051 22
8 – Property and equipment – 1342 12 Accounts receivable 1 23
18 422 41 419 Total assets 100 3 181 1 270211 86 Total liabilities 7 15
164 – Borrowings – 1147 86 Accounts payable and provisions 7 4
1 964 1 964 Preference share equity 151 135
16 247 39 369 Net asset value 3 023 1 120
509 510 Number of issued ordinary shares (’mil‚ excluding treasury shares) 510 5093 195 7 712 Net asset value per share (cents) 592 220
# The March 2014 reported values have been restated as a result of the current year adoption of IFRS 10 Consolidated Financial Statements. No impact on reported NAV per share; reclassifications are not material

153 Audited results for the year ended 31 March 2015
Review of operations (continued)Key highlights for the Group’s investment portfolio are:• Duringthe2015financialyear,theGrouprealisedits37%interestinPepkor,generatingreturnsof7.0xmultipleofcostanda69.5%IRRfromthe
acquisitiondateof4July2011.Intermsofthesaleagreement,BraitreceivedatotalconsiderationofZAR30.010billionon30 March2015,comprisingcashofZAR15.086billionand200millionSteinhoffshares(valueofZAR14.924billionusingthe30March2015closingsharepriceofZAR74.62).SteinhoffhasprovidedBraitanunderpinforthese200millionsharesthroughaguaranteedminimumpriceofZAR57pershareuntil30 March 2016.The 31March2015closingsharepriceforSteinhoffwasZAR76.03,resultinginayear-endcarryingvalueofZAR15.206 billion.
• Braitannouncedon16April2015theacquisitionofc.80%ofVirginActive,subjecttotheapprovalbytheSouthAfricanandNamibiancompetitionauthorities. Virgin Active is one of the world’s leading international health club operators. Virgin Active has demonstrated a strong financial track recordwhichincludes(i)a10yearCAGRforrevenueandEBITDAof22%and20%respectively;(ii)ahighdegreeofearningsvisibility;and(iii)strongcashflowgeneration.Furthermore,VirginActivehasexcitinggrowthprospectsinbothemerginganddevelopedmarkets.Braitwillinvestalongsideanexperiencedmanagementteam,thefounderandtheVirginGroupTheacquisitioncostofc.GBP682millionwillbefundedfromthePepkorcash proceeds.
• Braitannouncedon15May2015theacquisitionofc.90%ofNewLook,aleadingfastfashionmultichannelretaileroperatinginthevaluesegmentoftheUKclothingandfootwearmarketwithagrowinginternationalpresence.Thecompletiondateforthisacquisitionisexpectedtobe25June2015.New Look has in excess of 800 stores operating in 21 countries and a fast growing e-commerce platform which includes its own online platform as wellaspartneringwiththirdpartye-commerceretailers.AccordingtoKantarWorldpanel,forthe24weeksendingMarch2015,NewLookhastheleadingUKmarketshareintheunder35’swomenswearcategoryandisnumbertwooverallinwomenswear.NewLookhasdemonstrateddoubledigitEBITDAgrowthinrecentyears,solidcashflowgenerationandhasstronggrowthprospectsinFrance,Germany,PolandandChinawhichisaprioritymarket.Braitispartneringwithanexperiencedandprovenmanagementteamwhoarereinvestingwiththefounder’sfamilyinterestsalongsideBraitforc.10%shareholding.Theacquisitioncostofc.GBP780millionwillbefundedusingfacilitiesandcashonhand.NewLookraised£1.2billioninBondson12 June 2015, with proceeds used to refinance its existing debt resulting in the average cost thereof (pre-FX hedging) reducing from c.9.42% to 6.25%.
• Premier’srevenuefortheninemonthsending31March2015,whichincludestheacquisitionsofStarBakeriesandLil-letsGroup,increased31%onthecomparativeperiod.GroupEBITDAmarginimprovedto9.1%,generatinganincreaseinEBITDAof70%fortheperiod.Bakeriesgrewbreadsales volumes by 27% (c.9% like-for-like), largely in the informal market. Milling sales volumes grew by 4% for maize and 3% for wheat. During March2015,theacquisitionof68%ofthesharesinissueofCompanhiaIndustrialdaMatolaS.A.(“CIM”)wascompleted.CIMistheleadingfoodproducing company in Mozambique with a diversified product range of market leading brands in wheat flour, maize meal, pasta, biscuits and animal feeds.CIM’s currentrevenueisinexcessofZAR1.2billionwithEBITDAofZAR115million.AlsoinMarch2015,Premierconcluded(i)theacquisitionoftheassetsofLaFemme,aDurbanbasedtamponmanufacturer,whichhasenabledLil-letstoconsolidateitstamponsupplychaininSouthAfrica;and(ii)thesharesofMrBreadMilling(Pty)Ltd,anindependentEasternCapeflourmiller,whichfacilitatesPremieroperatingasanintegratedmill-bakeoperationintheprovince.TheseacquisitionswerefundedbyBraitandarerecognisedinthePremiervaluationattheiraggregatecostofZAR411 million.Braitcontinuestoexerciseexistingputandcallagreementswithformershareholders,holding86.5%ofPremierat31March2015(FY2014:84.6%).Thestrongoperationalperformance,combinedwiththechangeinvaluationmultipletothatofthepeergroup’sthreeyeartrailingaverage,resultedinthecarryingvalueforPremierincreasingby169.9%fortheyeartoZAR8.241billion(2014:ZAR3.053billion).

154 Audited results for the year ended 31 March 2015
Review of operations (continued)• TheUKfoodretailmarketcontinuestobechallenging,leadingtocontinuedpressureonprofitsassalesgrowthhasslowedandinvestmentinto
the value proposition and marketing spend has increased. Iceland Foods’ net sales for FY2015 decreased by 0.5%, with like-for-like sales down 4.4%inamarketexperiencingfooddeflationofc.3.0%.ReportedFY2015EBITDAofGBP150.2millionreflectsa25.7%downgradeonFY2014’sGBP202.2 million.Freecashflow(postcapex)ofGBP160 millionreflectsan8.8%increaseonFY2014’sGBP147million,whichtranslatesintoasignificantlyimprovedEBITDAcashconversionratioof106.7%(FY2014:72.8%).WhenrecognizingthepositiveeffectfromtheweakeningoftheGBP/ZARexchangeratetoZAR17.97(FY2014:ZAR17.55)andthechangeinvaluationmultiplediscussedearlier,Iceland’scarryingvaluehasdecreasedby16.8%fortheyeartoZAR1.259billion(2014: ZAR1.513 billion).
• Withintheotherinvestmentsportfolio,DGBdemonstratedverystrongEBITDAgrowthandcashflowgeneration.SouthernViewFinance(“SVF”)traded well and raised captial during November 2014 to refinance a portion of existing debt as well as providing it with additional facilities for future acquisitions. These combined factors were the primary drivers of the 62.5% increase for the year in the carrying value of this portfolio to ZAR2.438 billion(2014:ZAR1.518billion).
Low cost to AUM ratioOperatingexpenditurefortheyearofZAR201millionrepresentsafavourableratioof0.44%toAUM(FY2014:0.66%)comparedtothetargetof0.85%orless.NetoperatingcostsafterfeeincomeofZAR121milliontoAUMis0.27%(FY2014:0.33%).UsingaverageAUMasthereferencebasis,operatingcostsare0.60%andnetafterfeeincome0.36%(FY2014usingaverageAUM:0.72%and0.36%respectively).
Minimal balance sheet cash dragThe Group targets minimal cash holdings on balance sheet to avoid diluting overall returns. The cash consideration from the sale of Pepkor of ZAR15.1 billionwasreceivedon30March2015.ZAR2.1billionwasimmediatelyappliedtosettlingtheGroup’sdrawnborrowings.TheGroup’scashandequivalentspositionatyear-endofZAR13.689billionrepresents33%oftotalassets(FY2014:2%).Thiscashpositionwillnormalizetoalevelsimilartothat of the prior year, once payment for the Virgin Active and New Look acquisitions has been made.
Significant cash flow within the underlying assetsBraitreceivednetinvestmentcashinflowsofZAR14.671billionduringtheyearcomprising:(i)ZAR15.086billioncashconsiderationreceivedonrealisationofPepkor;(ii)lessZAR1.161billionsettlementofPepkorSPVgearing;and(iii)portfolioinflowsofZAR746million.
Predictable and consistent ordinary dividend to NAV yieldTheGroup’spolicyisanordinarybonusshareissueordividendof1%to2.5%ofclosingNAV.Bonussharesanddividendsareconsideredannuallywhen the results for each year are published. The extent of any bonus shares and cash dividends are determined relative to net operating cash flows which includes proceeds received on the realisation of loans and investments from time to time and which are not earmarked for new projects or required forliquidity.TheBoardhasproposedabonusshareissue(withacashdividendalternative)of1%ofNAVequalto77.12ZARcents/5.89EURcents(FY2014:31.95ZARcents/2.24EURcents).Furtherdetailsregardingthebonusshareissuewithcashdividendalternativecanbefoundbelow.InAugust2014, 92% of shareholders elected to receive bonus shares, resulting in issued share capital (net of treasury shares) increasing to 510.5 million shares at year end.

155 Audited results for the year ended 31 March 2015
Review of operations (continued)GROUP FUNDING POSITIONBraitwillfundtheacquisitionofVirginActiveusingPepkorcashproceeds.InanticipationoftheNewLookacquisition,theGrouphasincreaseditsdebtfacilities and will fund this purchase cost through a combination of debt and cash on hand.
The Group remains adequately capitalised with sufficient cash and low cost facilities. The Group continues to explore new sources of funding through raising cheaper and more permanent forms of capital to achieve a more efficient capital structure.
PREFERENCE DIVIDEND DECLAREDTheBoarddeclaredon29May2015apreferencedividendofZAR4.7968/EUR0.359842persharefortheperiodfrom1October2014to31March2015.Theissuedcumulative,non-participatingpreferencesharecapitalatthedateofthisdeclarationis20000000preferencesharesofEUR0.01each.
A separate announcement setting out the salient dates was released to the market on Monday, 1 June 2015.
PROPOSED BONUS SHARE ISSUE OR, ALTERNATIVELY, CASH DIVIDENDTheBoardhasproposedabonusshareissueofnew,fullypaid,ordinaryBraitShareswithaparvalueofEUR0.22each(“NewShares”)inproportiontotheshareholdingofeachrespectiveshareholderinBrait,payabletoshareholdersrecordedintheregisterontheFriday,7 August2015(the“BonusShareIssue”).Shareholderswillbeentitled,inrespectofallorpartoftheirshareholdingasofFriday,7 August2015(the“RecordDate”),toelecttoreceiveacashdividendof77.12ZARcents/5.89EURcentsperordinaryshare(the“CashDividendAlternative”)heldinlieuofallorpartoftheNewSharestowhichthey would have been entitled, which will be paid only to those shareholders whose election forms to receive the Cash Dividend Alternative, in respect ofallorpartoftheirshareholdingarereceivedbythetransfersecretariesonorbefore12:00p.m.ontheRecordDate.TheBonusShareIssueandCashDividendAlternativeare,however,subjecttoshareholderapprovalattheCompany’sAGMon22July2015.IfallshareholdersreceiveNewShares,anapproximateaggregatenumberof4378544NewSharesareexpectedtobeissued.IfallshareholderselecttoreceivetheCashDividendAlternative,thiswouldamounttoanaggregateofZAR398317064/EUR29880578forthefinancialyearending31March2015.
ShareholdersnotelectingtoreceivetheCashDividendAlternativeinrespectofallorpartoftheirshareholdingwill,withoutanyactionontheirpart,beissuedwithNewSharesinaccordancewiththeirshareholdingpursuanttotheBonusShareIssue.
ThenumberofNewSharestowhichshareholderswillbeentitledpursuanttotheBonusShareIssuewillbedeterminedbysuchshareholder’sshareholdinginBraitasof7 August2015inrelationtotheratiothat77.12ZARcentsbears(5.89EURcents)bearstoZAR90.97,beingthe60-dayvolumeweightedaverageprice(“VWAP”)ofordinaryBraitsharesontheLuxembourgStockExchange(“LuxSE”)andtheJohannesburgSecuritiesExchange(“JSE”)duringthetradingperiodendingonFriday,29May2015.Thisconversionratioamountsto0.84775NewSharesper100Braitsharesheld by the shareholder at the Record Date. Fractions and fractional entitlements are not possible due to various corporate law and listing requirements. Accordingly, whereashareholder’sentitlementtoNewSharescalculatedinaccordancewiththeaboveformulagivesrisetoafractionofanordinaryshare,such fraction of an ordinary share will be rounded up to the nearest whole number where the fraction is greater than or equal to 0.5 and rounded down to the nearest whole number where the fraction is less than 0.5.

156 Audited results for the year ended 31 March 2015
Review of operations (continued)AcircularandanelectionformwillbesenttoallshareholdersonFriday,26June2015containingfulldetailsoftheBonusShareIssueandCashDividend Alternative.
TherationalefortheBonusShareIssueistoaffordshareholderstheopportunitytoincreasetheirshareholdinginBraitandretaintheCompany’sflexibilityon cash holdings.
TheBonusShareIssueandtheCashDividendAlternativemayhavetaximplicationsforshareholders.
ThereceiptofNewSharesbySouthAfricanresidentshareholdersshouldnotbeclassifiedasadividendoraforeigndividendforSouthAfricantaxpurposesandhencedividendstaxshouldnotbeleviedontheNewShares.ForthoseSouthAfricanresidentshareholderselectingtheCashDividendAlternativeinlieuoftheNewShares,suchamountwillberegardedasaforeigndividend,butmaybesubjecttoSouthAfricandividendstaxattherateof15%,unlessanexemptionassetoutintheSouthAfricanincometaxlegislationapplies.
Ifdividendstaxdoesapply,thenetdividendwillbe65.5520ZARcentspershare.
Shareholdersarethereforeencouragedtoconsultwiththeirprofessionaladvisorsshouldtheybeinanydoubtastotheappropriateactiontotake.
Theissuedordinarysharecapitalatthedateofthisannouncementis516489969ordinarysharesofEUR0.22each.

157 Audited results for the year ended 31 March 2015
Review of operations (continued)Thesalientdatesareasfollows:
EVENT 2015
Announcement of the applicable ratio, based on the 60-day volume weighted average price ending on Friday 29 May 2015, releasedontheLuxSEandJSE Wednesday, 17 June
Bonussharecircularandformofelectionpostedtoshareholderson: Friday, 26 June
AGMapprovingtheBonusShareIssue/CashDividendAlternativeon: Wednesday, 22 July
LastdaytotradeinordertobeeligiblefortheBonusShareIssueor,alternatively,theCashDividendAlternativeon: Friday, 31 July
Ordinarysharestrade“ex”theBonusShareIssue/CashDividendAlternativeon: Monday, 3 August
LastdayforelectionformstoreceivetheCashDividendAlternativeinsteadoftheBonusShareIssuetoreachtheTransferSecretariesby12:00pmon: Friday, 7 August
RecordDateinrespectoftheBonusShareIssue/CashDividendAlternativeon: Friday, 7 August
ShareCertificatesanddividendchequesposted,CSDP/participant/brokeraccountscredited/updatedandNewShareslistedontheLuxSEandJSEon: Tuesday, 11 August
Sharecertificatesmaynotbedematerialisedorrematerialized,betweencloseofbusinessFriday,31July2015andFriday,7 August2015,bothdays inclusive.
PleasenotethattheNewSharestobeissuedintermsoftheBonusShareIssuemaynotbetradeduntilTuesday,11August2015.

158 Audited results for the year ended 31 March 2015
Review of operations (continued)GROUP OUTLOOK• Premierhastradedwellduringitsninemonthsto31March2015,deliveringonitsstrategyofbrandbuilding,productinnovationandoperational
efficiencies to increase margins on its core staple foods business. The acquisitions concluded in March 2015 represent both geographic and strategic opportunities to enhance profits and are well advanced in the process of integration;
• VirginActiveisawell-positioneddefensiveconsumerbusinesswithhighlyvisibleandpredictableEBITDAandcashgenerationfromitssubscriptionbasedmodel.ItsgloballifestylebrandandleadershippositionintheUKandSouthAfricanmarketsprovideastrongplatformforgrowthinitschosenmarkets;
• NewLook’sfastfashionapparelofferingispositionedinthevaluesegment,whichhasoutperformedtheoverallUKclothingmarketformorethana decade. This has been driven by increasing demand for more affordable fashion clothing, supply chain improvements and growing popularity of e-commerce. The scale and efficiency of New Look’s fast fashion operating model and well-developed multi channel offering sees it well placed to execute on its growth strategies in its prioritised markets;
• IcelandFoodscontinuestogeneratestrongcashflows.FY2015sawsubstantialfocusonthepropositionincludingenhancedinnovationandimprovedpackaging to differentiate the product offering. This, coupled with increased marketing spend and a stringent focus on costs to affirm its value offering shouldpositionthebusinesswellfortheexpectedcontinuedchallengingUKfoodretailsector.
The 2015 financial year has been significant given the value creation from the realisation of Pepkor. Virgin Active and New Look represent exciting acquisitions for the Group going forward and together with Premier, enhance the portfolio’s defensive nature, strong cash flow generation and geographic diversification.
ForandonbehalfoftheBoard
PJ MoleketiNon-Executive Chairman
17 June 2015
Directors (all non-executive)PJMoleketi(Chairman)*,ASJacobs##,CDKeogh##, Dr LL Porter##,CSSeabrooke*,HRWTroskie**,DrCHWiese*
##British **Dutch *SouthAfrican

Administration and contact detailsINDEPENDENT AUDITORSDeloitte Audit LimitedDeloitte Place, Mriehel BypassMriehel, BKR3000, Malta
SUBSIDIARY OFFICEBrait Mauritius LimitedSuite 520, 5th Floor, Barkly WharfLe caudan Waterfront, Port Louis MauritiusTel: +230 213 6909 Fax: +230 213 6913
CORPORATE ADVISORBrait South Africa Proprietary Limited2nd Floor, The Zone II 177 Oxford RoadRosebank, Johannesburg, 2196South AfricaTel: +27 11 507 1000Fax: +27 11 507 1001
INVESTOR RELATIONSwww.brait.comEmail: [email protected]: +27 11 507 1000
LUxEMBOURG REGISTRAR AND TRANSFER AGENTMaitland Luxembourg SA58, rue charles MartelL-2134 LuxembourgTel: +352 402 5051Fax: +352 402 505 66
SOUTH AFRICAN TRANSFER SECRETARIEScomputershare Investor Services Proprietary Limited70 Marshall Street Johannesburg, 2001Tel: +27 11 370 5000Fax: +27 11 668 5200
JSE SPONSORRand Merchant Bank(A division of FirstRand Bank Limited) 1 Merchant Placecorner Fredman Drive and Rivonia Road Sandton, 2196South Africa
BRAIT SERegistration No: SE1
ISSUER NAME AND CODEIssuer long name: BRAIT SEIssuer code: BRAITShare code: BAT ISIN: LU0011857645Share code: BATP ISIN: MT0000680208
COMPANY SECRETARY AND REGISTERED OFFICEMaria Angela Stivala4th Floor, Avantech BuildingSt. Julian’s Road, San GwannSGN 2805, MaltaTel: +356 2248 6203Fax: +356 2144 6330
COUNSELM Partners S.à r.l(a Member of Maitland Legal)56, rue charles MartelL-2134 LuxembourgTel: +352 263 868Fax: +352 263 868 66