2015•2016 faculteit geneeskunde en … geneeskunde en levenswetenschappen ... promotor : dr....
TRANSCRIPT

Universiteit Hasselt | Campus Hasselt | Martelarenlaan 42 | BE-3500 Hasselt
Universiteit Hasselt | Campus Diepenbeek | Agoralaan Gebouw D | BE-3590 Diepenbeek
2015•2016FACULTEIT GENEESKUNDE EN LEVENSWETENSCHAPPENmaster in de biomedische wetenschappen
MasterproefCellular and molecular effects of iodine deficiency and ionizing radiation on non-cancerous thyroid cells
Promotor :dr. Patrick VANDORMAEL
Promotor :Dr.ir. HANANE DERRADJI
Noami Daems Scriptie ingediend tot het behalen van de graad van master in de biomedischewetenschappen
De transnationale Universiteit Limburg is een uniek samenwerkingsverband van twee universiteitenin twee landen: de Universiteit Hasselt en Maastricht University.

2015•2016FACULTEIT GENEESKUNDE ENLEVENSWETENSCHAPPENmaster in de biomedische wetenschappen
MasterproefCellular and molecular effects of iodine deficiency andionizing radiation on non-cancerous thyroid cells
Promotor :dr. Patrick VANDORMAEL
Promotor :Dr.ir. HANANE DERRADJI
Noami Daems Scriptie ingediend tot het behalen van de graad van master in de biomedischewetenschappen


I
TABLE OF CONTENTS
LIST OF ABBREVIATIONS III
ACKNOWLEDGEMENTS V
SAMENVATTING VII
SUMMARY IX
INTRODUCTION 1
1. THE THYROID GLAND AND THYROID CANCER 1
2. IMPORTANT RISK FACTORS FOR THYROID CANCER 2
2.1 IONIZING RADIATION 2
2.1.1 Biological effects of ionizing radiation 2
2.1.2 Thyroid cancer risks following exposure to high and low doses of radiation 3
2.2 IODINE DEFICIENCY 5
3. THE COMBINED EFFECT OF IONIZING RADIATION AND IODINE DEFICIENCY ON THE THYROID 7
4. POSSIBLE MOLECULAR MECHANISMS INDUCED BY IONIZING RADIATION AND IODINE
DEFICIENCY IN THE THYROID 7
4.1. OXIDATIVE STRESS AND THYROID CANCER 7
4.2 DNA DAMAGE RESPONSE 8
4.3 ALTERED SIGNALING PATHWAYS 9
4.3.1 PI3K/AKT pathway 9
4.3.2 NFκB pathway 10
4.3.3 JAK/STAT pathway 10
5. RESEARCH PLAN 11
MATERIAL AND METHODS 13
1. CELL CULTURE AND IRRADIATION 13
2. RNA ISOLATION AND REVERSE TRANSCRIPTION 13
3. WESTERN BLOT ANALYSIS 14
4. ROS ASSAY 15
5. YH2AX/53BP1 IMMUNOFLUORESCENCE STAINING 16
6. CELL CYCLE ANALYSIS 16
7. TUNEL ASSAY 17
8. STATISTICAL ANALYSIS 18
RESULTS 19
1. ROS PRODUCTION. 19

II
2. ANTIOXIDANT DEFENSE 20
3. APOPTOSIS 21
4. DNA DAMAGE: DOUBLE STRAND BREAKS 21
5. CELL CYCLE ANALYSIS 27
6. MODULATIONS IN SIGNALING PATHWAYS 30
6.1 THE NOS3/HIF-1Α/VEGF-A SIGNALING PATHWAY. 30
6.2 CELLULAR PROLIFERATION AND SURVIVAL. 32
DISCUSSION AND OUTLOOK 35
REFERENCES 43
SUPPLEMENTAL FIGURES AND TABLES 49

III
LIST OF ABBREVIATIONS
7-AAD 7-aminoactinomycin D
ATC Anaplastic thyroid cancer
ATM Ataxia telangiectasia mutated protein
ATR Ataxia telangiectasia and Rad3-related protein
BAD Bcl-2-associated death promoter
BCA Bicinchoninic acid assay
BCL-2 B-cell lymphoma 2
BCL-XL B-cell lymphoma-extra large
BRCA1 Breast cancer 1
BrdU 5-bromo-2'-deoxyuridine
CHAPS 3-[(3-cholamidopropyl)dimethylammonio]-1-propanesulfonate
CHK Checkpoint kinase
CM-H2DCFDA chloromethyl-2'7'- dichlorodihydrofluorescein diacetate acetyl ester
Cs137 Caesium-137
CT Computed tomography
CTNNB1 β-catenin
DAPI 4',6-diamidino-2-phenylindole
DDR DNA damage response
DSB Double strand breaks
EDTA Ethylenediaminetetraacetic acid
EGFR Epidermal growth factor receptor
ERK Extracellular-signal-regulated kinases
FBS Fetal bovine serum
FTC Follicular thyroid cancer
gp-130 Glycoprotein 130
GSK Glycogen synthase kinase
Gy Gray
HB-HBSS HEPES-buffered Hank’s balanced salt solution
HCl Hydrogen chloride
HIF Hypoxia inducible factor
HRE Hypoxia response element
H2O2 Hydrogen peroxide
I131 Iodine-131
IAP Inhibitors of apoptosis proteins
ID Iodine deficiency
IKKα IκB kinase
IL Interleukin
IL-6R Interleukin-6 Receptor
IR Ionizing radiation
JAK Janus kinase
JNK c-Jun N-terminal kinase
kV kilo voltage
LET Linear energy transfer
LNT Linear no threshold

IV
MAPK Mitogen-activated protein kinase
Mcl-1 Myeloid Cell Leukemia 1
MDC1 Mediator of DNA damage checkpoint protein 1
MDM2 Mouse double minute 2 homolog
MEK Mitogen-activated protein kinase kinase
MgCl2 Magnesium dichloride
MKK MAP kinase kinase kinase
MTC Medullary thyroid cancer
mTOR Mechanistic target of rapamycin
NaI Sodium iodide
NBS1 Nibrin
NFκB nuclear factor kappa-light-chain-enhancer of activated B cells
NO Nitrogen oxide
NOS3 Nitrogen oxide synthase 3
PPARγ Peroxisome proliferator-activated receptor γ
PAX8 Paired box gene 8
PBS Phosphate-buffered saline
PFA paraformaldehyde
PI3K Phosphatidylinositide 3-kinases
PIK3CA phosphatidylinositol-4,5-bisphosphate 3-kinase catalytic subunit alpha
PTC Papillary thyroid cancer
PTEN Phosphatase and tensin homolog
QDot Quantum dots
RIN RNA integrity number
ROS Reactive oxygen species
RT Reverse transcriptase
RYR Ryanodine receptor
SAPK Stress-activated protein kinase
SD Standard deviation
SDS Sodium-dodecyl-sulfate
SEM Standard error of the mean
Sr90 Strontium-90
SSB Single strand breaks
STAT Signal transducer and activator of transcription
Sv Sievert
T3 Triiodothyronine
T4 Tetraiodothyronine
tBHP tert-butylhydroperoxide
TBP Tributyl phosphate
TBS Tris-buffered saline
TMRM Tetramethylrhodamine
TNFα Tumor necrosis factor α
TPO Thyroid peroxidase
TRAF TNF receptor associated factors
TRK Tyrosine protein kinase receptors
TSC Tuberous Sclerosis Complex 2
TSH Thyroid-stimulating hormone
VEGF-A Vascular endothelial growth factor-A

V
ACKNOWLEDGEMENTS
Coming to the end of writing this thesis, I would like to thank the people who helped me during
my practical work in the lab and during the writing process of this thesis. First of all, I would like to
express my sincere gratitude towards my SCKCEN promotor dr. ir. Hanane Deraddji, my
institutional promotor dr. Patrick Vandormael and my second examiner dr. ir.Liesbet Peeters for
their continuous support and advice throughout the duration of the thesis. In addition, I would like
to thank Prof. dr. Sarah Baatout for the opportunity to work in the lab of the SCKCEN Radiobiology
Unit. Furthermore, I had a lot of help from the PhD students Bjorn Baselet and Niels Belmans and
from MSc student Emma Coninx in my practical experiments and result analyses. They were always
prepared to answer my questions and to support me at all times during my thesis. Without their
help, this thesis would not have been possible. My personal gratitude also goes out to all other PhD
students in the Radiobiology and Microbiology unit of SCKCEN for their warm welcome, friendship
and support. Finally, I also want to thank my family and friends outside the workspace of SCKCEN
for their love, friendship and support.

VI

VII
SAMENVATTING
Introductie: Uit Post-Chernobyl epidemiologische studies blijkt dat blootstelling aan ioniserende straling
(IR) een belangrijk risicofactor is in schildklierkankerontwikkeling. De algemene populatie wordt steeds
meer blootgesteld aan IR afkomstig van natuurlijke en kunstmatige bronnen. Vooral lage
stralingsdosissen zijn van belang. Bovendien toont de epidemiologie ook aan dat jodiumtekort (ID), waar
meer dan 2 miljoen mensen aan lijden, ook een invloed uitoefent op de schildklierkankerontwikkeling. Er
is nog steeds onduidelijkheid over het gecombineerd effect van IR en ID op schildkliercellen. We
hypothetiseren dat IR en ID stress veroorzaken in schildkliercellen door een verhoogde productie van
reactieve zuurstofsoorten (ROS) wat de deling en overleving van de schildkliercellen kan beïnvloeden.
Materiaal & methoden: Rat PCCL3 schildkliercellen werden gekweekt in de aan- of afwezigheid van
jodium voor 6u, 24u en 48u en werden bestraald met lage (0 Gy, 0.05 Gy, 0.1 Gy), gemiddelde (0.5 Gy)
of hoge (3 Gy) stralingsdosissen. De proteïne expressie van catalase, (p)AKT1, (p)STAT3, NFκB p52
werd bepaald door middel van Western blot. ROS productie en γH2AX/53BP1 foci werden gedetecteerd
door respectievelijk CM-H2DCFDA fluorescerende beeldvorming en immunocytochemie, gevisualiseerd
door een fluorescentie microscoop. De cel cyclus werd onderzocht door middel van een BrdU/7-AAD
assay en flow cytometrie. Statistische significantie (p<0.05) werd geëvalueerd met een two-way ANOVA.
Resultaten: Jodium-deficiënte cellen bestraald met 0.5 Gy en 3 Gy vertoonde een versterkte ROS
productie 24u na de behandeling in vergelijking met jodium-sufficiënte cellen. Bovendien was er een
algemeen significant effect van de jodiumstatus op de catalase proteïne expressie 6u na de behandeling.
Cellen bestraald met 0.5 Gy en 3 Gy vertoonde een significant verhoogd aantal γH2AX foci vergeleken
met niet-bestraalde cellen op 30 min na de behandeling, waarna het aantal terug daalt tot 24u na de
behandeling. Het aantal 53BP1 foci na een bestraling van 0.1 Gy, 0.5 Gy en 3 Gy was significant hoger
vergeleken met niet-bestraalde cellen en bereikte hun piek na 1-4u, waarna het aantal daalde tot 24u na
de behandeling. Cellen bestraald met 0.05 Gy en 0.1 Gy vertoonde een continue stijging in het aantal
γH2AX foci tot 24u na de behandeling. Het aantal 53BP1 foci veranderde niet tussen 0.05 Gy-bestraalde
cellen en niet-bestraalde cellen. Er was ook geen verschil in het aantal foci tussen jodium-sufficiënte en
jodium-deficiënte cellen. Op 24u na de behandeling was er een significante verhoging in de hoeveelheid
cellen in de G0/G1 fase na bestraling met 3 Gy vergeleken met niet-bestraalde cellen. Bovendien was het
aantal jodium-deficiënte cellen blootgesteld aan lage, gemiddelde en hoge stralingsdosissen significant
verlaagd in de G0/G1 fase en verhoogd in de G2/M fase en S fase vergeleken met jodium-sufficiënte
cellen. Op 48u na de behandeling werden er geen significante verschillen meer gezien in de cel cyclus
tussen jodium-deficiënte en jodium-sufficiënte cellen. Tot slot, er werden geen significante verschillen
gezien op proteïne niveau 6u na de behandeling voor proliferatie- en overlevingsmediatoren.
Discussie & conclusie: Blootstelling aan 0.5 Gy en 3 Gy veroorzaakt stress in de schildkliercellen tot
een bepaald niveau waardoor ze de bijkomende stress van jodiumtekort niet kunnen opvangen, wat leidt
tot een versterkte ROS productie in vergelijking met jodium-sufficiënte cellen. Het DNA herstel verloopt
bovendien anders na blootstelling aan lage stralingsdosis dan na een hoge stralingsdosis. Dit suggereert
dat er een drempelwaarde van DNA schade overschreden moet worden om een efficiënte activatie te
verkrijgen van de DDR pathway. PCCL3 cellen zijn relatief radioresistent. Een gecombineerde
behandeling van ID en IR maakt de cellen minder gevoelig voor een G1 stop en versterkt de proliferatie
24u na behandeling. Dit kan duiden op een vergankelijke stressreactie met veranderingen in de
proliferatie pathways wat nog niet detecteerbaar was 6u na de behandeling. De veranderde catalase
proteïne expressie kan ter compensatie dienen voor onvoldoende H2O2-detoxificatie dankzij jodiumtekort.

VIII

IX
SUMMARY
Introduction: Post-Chernobyl epidemiological studies appointed ionizing radiation (IR) exposure as
high-risk factor for thyroid cancer development. Currently, the general population is increasingly exposed
to IR deriving from natural and human-made sources. In particular, low-dose IR is of major concern. On
the other hand, epidemiological studies demonstrated that iodine deficiency (ID), affecting more than 2
billion individuals worldwide, is also a determinant in thyroid cancer development. However, there are
still uncertainties about the combined effects of ID and low-dose IR exposure on thyroid cells. We
hypothesize that low-dose IR and ID both stress thyroid cells by an enhanced production of reactive
oxygen species (ROS), affecting proliferation and survival.
Material & methods: Rat thyroid PCCL3 cells were cultured in iodine-deficient or iodine-sufficient
conditions for 6h, 24h or 48h and were irradiated with low (0 Gy, 0.05 Gy, 0.1 Gy), intermediate (0.5
Gy) or high (3 Gy) X-ray doses. Protein expressions of Catalase, (p)AKT1, (p)STAT3, NFκB p52 were
determined by Western blot. ROS production and γH2AX/53BP1 foci were dtected by respectively CM-
H2DCFDA fluorescent imaging and immunocytochemistry visualized using fluorescence microscopy.
Finally, cell cycle distribution was examined by a BrdU/7-AAD assay using flow cytometry. Statistical
significance (p<0.05) was evaluated with two-way ANOVA.
Results: There was an enhanced ROS production at 24h post-treatment in iodine-deficient cells
irradiated with 0.5 Gy and 3 Gy compared to iodine-sufficient cells. Furthermore, there was an overall
significant effect of the iodine state on the catalase protein expression 6h post-treatment. PCCL3 cells
irradiated with 0.5 Gy and 3 Gy exhibited a significantly increased number of γH2AX foci compared to
sham-irradiated cells at 30 min post-treatment, after which it decreased up to 24h post-treatment. The
number of 53BP1 foci after irradiation with 0.1 Gy, 0.5 Gy and 3 Gy was significantly higher compared to
sham-irradiated cells and reached its peak around 1-4h, after which it decreased up to 24h post-
treatment. PCCL3 cells irradiated with 0.05 Gy and 0.1 Gy showed a continuously increasing number of
γH2AX foci up to 24h post-treatment. The number of 53BP1 foci did not significantly differ between 0.05
Gy-irradiated cells and sham-irradiated cells. There were no major differences in the number of DSBs
between iodine-sufficient and iodine-deficient cells. At 24h post-treatment, the percentage of cells in the
G0/G1 phase significantly increased after irradiation with 3 Gy compared to sham-irradiated cells.
Furthermore, the amount of iodine-deficient cells exposed to low-, intermediate- and high-dose IR was
significantly lower in the G0/G1 phase and higher in the G2/M phase and S phase compared to iodine-
sufficient cells. At 48h post-treatment, there were no longer significant differences in cell cycle
distribution between iodine-deficient and iodine-sufficient cells. No significant differences were observed
at protein level 6h post-treatment for proliferation (STAT3, AKT1) and survival (NFkBp52) mediators.
Discussion & conclusions: Irradiation with 0.5 Gy or 3 Gy stresses thyroid cells to a certain extent
which makes them unable to cope with the additional stress of ID, leading to an enhanced ROS
production compared to iodine-sufficient cells. Furthermore, The DNA repair of thyroid cells after low-
dose exposure is different than after high-dose exposure, suggesting the presence of a DNA damage
threshold level required for efficient activation of the DDR pathway. Thyroid cells are relatively
radioresistant. However, a combined treatment with ID and IR makes thyroid cells less sensitive for a
p53-dependent G1 arrest and enhances proliferation 24h post-treatment. This could represent a
transient stress response with subtle changes in the proliferation pathways, which was not detected yet
at 6h post-treatment and was disappeared at 48h post-treatment. The altered catalase protein
expression could be a response to compensate for insufficient detoxification of H2O2 by ID.

X

1
INTRODUCTION
1. THE THYROID GLAND AND THYROID CANCER
The thyroid gland is one of the largest endocrine glands in the human body and comprises
two connected lobes, located anterolaterally to the upper trachea. The functional unit of the thyroid
gland is the thyroid follicle, which produces the thyroid pro-hormone, tetraiodothyronine (T4) and
the active thyroid hormone, triiodothyronine (T3), using the precursors thyroglobulin and iodide.
The produced thyroid hormones are then released into the blood stream via rich capillary networks
closely surrounding the thyroid follicles. The active, circulating thyroid hormones are essential for
normal fetal brain development and regulate many physiological processes in the human body such
as the metabolism, cardiovascular function, respiration, mental processing, growth, maturation and
reproduction (1).
Thyroid cancer is a common malignancy of the endocrine system and can originate from
two different cell types. Most thyroid cancers originate from the follicular thyroid cells and are
classified in different subtypes depending on their morphological and clinical characteristics. They
encompass the well-differentiated papillary and follicular thyroid carcinomas (PTC and FTC
respectively), as well as the undifferentiated, anaplastic thyroid carcinoma (ATC). PTC is the most
frequent tumor type of the thyroid gland, accounting for 80% of all cases and can be associated
with ionizing radiation (IR) exposure. Common mutations found in thyroid cancers are point
mutation of the BRAF and RAS genes as well as RET/PTC and PAX8/PPARγ chromosomal
rearrangements (2) (Supplemental Table 1). The characteristic chromosomal rearrangements of
the receptor tyrosine kinase RET gene are specific for PTC. The most common rearrangement types
are RET/PTC1 and RET/PTC3. As a result from these rearrangements, the portion of the RET gene
encoding for the intact tyrosine kinase domain is fused to an active promoter of another gene,
stimulating the expression and ligand-independent dimerization of the RET/PTC protein. This, in
turn, leads to constitutive activation of the MAPK signaling pathway, promoting tumorigenesis of
the thyroid cells (Supplemental Figure 1). RET/PTC rearrangements are commonly found in
pediatric PTCs and in PTCs of individuals exposed to IR. The accidental radiation exposure after the
Chernobyl accident particularly increased the frequency of the RET/PTC3 rearrangement type. FTC
represents only 15% of all thyroid cancers and harbor mostly RAS mutations and PAX8-PPARγ
rearrangements. PTC and, to a lesser extent, FTC have a good clinical prognosis if adequately
treated. In contrast, ATC is a rare (Only 5% of all cases) but aggressive malignancy, associated
with a highly lethal clinical course despite therapeutic intervention. Genetic mutations known to
occur in ATC involve the RAS, BRAF, TP53 and CTNNB1 genes as well as alterations in the
PI3K/AKT signaling pathway (Supplemental Figure 1). Finally, Medullary thyroid cancer (MTC)
originates from the para-follicular C cells and accounts for only 3% of all thyroid cancers. MTCs
frequently harbor point mutations of the RET gene (2, 3).
Although the contribution of thyroid cancer to global cancer burden is small, thyroid cancer
incidence has rapidly increased worldwide in the recent few decades, including in the Flemish
region of Belgium (Figure 1) (4-6). The increased incidence is limited to the papillary type of

2
thyroid cancer. It is suggested that advances in medical diagnostic techniques, which increase the
detection rate of small thyroid tumors (<1cm), contribute to this worldwide increasing trend.
However, whether this can account entirely for this continuous trend, or whether environmental
factors also contribute, remains unclear. Since IR is a well-known risk factor for the development of
thyroid cancer, concerns remain that the rising incidence might, in part, result from the increased
population exposure to medical radiation (2, 7). In addition, imbalanced dietary iodine intake is
also associated with the development of thyroid disorders. Since there is little knowledge about the
exact etiology of thyroid cancer and many individuals are simultaneously affected by low-dose IR
and iodine deficiency (ID), it is relevant to investigate the biological effect of IR and ID on non-
cancerous thyroid cells (5, 8, 9).
Figure 1: Thyroid cancer incidence and mortality in Belgium (Flemish region). (A) Incidence rate
significantly increases in both sexes between 1999-2008 (M: p=0.00; F: p = 0,0). However, mortality
decreases (M: p=0.03; F: p=0.07). (B) Papillary carcinoma shows a large significant increase (M: p=0.01; F:
p=0.00). Other main histological subtypes increase as well, but no significant trend is observed. Due to
improved registration practices, a significant decrease is observed in unspecified tumors (M: p=0.05; F:
p=0.00). Adapted from the Belgian Cancer Registry, Cancer Incidence in Belgium, 2008 (6).
2. IMPORTANT RISK FACTORS FOR THYROID CANCER
2.1 IONIZING RADIATION
2.1.1 Biological effects of ionizing radiation
Currently, the general population is increasingly exposed to IR, originating from natural
and manmade sources (10). Ionizing radiation can be classified into two major categories:
electromagnetic IR including X-rays and γ-rays and particulate IR including alpha particles, beta
particles, neutrons and protons. When passing through a medium, IR can interact with atoms,
losing energy along its track. The average energy deposited per unit length is called linear energy
transfer (LET) and indicates the efficiency of IR to cause ionizations by ejection of atomic electrons.
Alpha particles, beta particles, neutrons and protons are considered as high-LET radiation inducing
dense ionizations along their track. Therefore, high-LET radiation is likely to interact directly with
essential cellular structures, which makes it highly destructive to biological tissues. Since high-LET
radiation rapidly exhausts its energy, it has a low penetrating ability. As a result, high-LET
radiation is only of major concern during internal exposure. On the other hand, electromagnetic X-
rays and γ-rays are classified as low-LET radiation. The latter primarily acts indirectly through
A B

3
interaction with the abundant water molecules inside the cell, which results in the generation of a
variety of reactive oxygen species (ROS), including hydroxyl radicals, superoxide, singlet oxygen,
and hydrogen peroxide (H2O2). These produced ROS are able to diffuse over a distance and will in
turn interact with critical cellular components such as DNA, proteins and lipids which eventually can
result in tissue damage. Low-LET radiation is sparsely ionizing and interacts only randomly along
the length of its track. Therefore, low-LET radiation is able to deeply penetrate into biological tissue
and is especially of concern during external exposure. The direct and indirect biological effects of IR
on the DNA are of major concern since IR can lead to genetic lesions, especially double strand
breaks (DSB) (11, 12). These genetic lesions can enhance the mutation rate, which is in turn
considered as the underlying basis for radiation-associated carcinogenesis (13, 14). In addition, IR-
induced DNA damage and ROS generation are able to induce alterations in intracellular signaling
pathways involved in proliferation, survival and apoptosis.
The incidence and severity of IR-induced biological effects depends on several parameters
such as the type of radiation, the exposure time, the distance to the radiation source, the type of
the exposed biological tissue, the applied radiation dose, the subject’s health condition and age,
etc. (15). The applied radiation dose can be expressed as ‘absorbed dose’, measured in grays (Gy)
which quantifies the energy deposited per unit mass. The energy deposition of 1 Joule/Kg equals 1
Gy. However, not all types of IR result in the same biological effect after exposure. Therefore, the
‘dose equivalent’ is mostly used, expressed in Sievert (Sv). The dose equivalent is the product of
the absorbed dose and a radiation type-specific weighting factor. The weighting factor for X-rays is
1,0. As a result, 1 Gy is equal to 1 Sv when using X-rays for medical applications. Finally, to assess
health risks of IR exposure, the ‘effective dose’ is used. The effective dose cannot be measured
directly since it is a theoretical calculated dose. It is based on which tissues or organs are exposed
to the applied radiation by using a tissue specific-weighting factor. These tissue specific-weighting
factors can be changed when new research results are available (14, 16).
2.1.2 Thyroid cancer risks following exposure to high and low doses of radiation
Epidemiological studies based on Japanese atomic bomb survivors and the Chernobyl
accident in 1986 provide strong evidence of a significantly increased risk of thyroid cancer after
exposure to radiation doses above 100 mSv. Thyroid cancer risks are well described by a linear
dose-response function and strongly depends on age of exposure (17-19). Indeed, the thyroid
gland of children is more radiosensitive than of adults due to their smaller size, rapid growth and
the differences in metabolic rate. Furthermore, children have a longer life expectancy than adults
which increases the opportunity to develop cancer (20, 21). As a result, thyroid cancer incidence
markedly increased in individuals who were exposed to IR as children or adolescents. This has
especially been reported in the contaminated areas of Belarus, Ukraine and Russia as early as 4
years after the Chernobyl accident as well as by a data analysis of thyroid cancer incidence from
1958 to 2005 among members of the Life Span Study Cohort of Japanese atomic bomb survivors.
Furthermore, also after the more recent Fukushima earthquake in 2011, an excess of thyroid
cancer has been detected in children and adolescents who lived in the Fukushima Prefecture within
4 years of the release (22). The data related to thyroid cancer following the Fukushima earthquake
need more careful investigations and cannot be ignored. After the Chernobyl accident, most cases

4
of thyroid cancer occurred in children who were younger than 5 years at the time of the accident,
while the risk decreased sharply for adults exposed after age 20 (19, 23, 24). The Chernobyl
accident mainly caused internal exposure to radioactive iodine-131 (I131), caesium-137 (Cs137) and
strontium-90 (Sr90), by-products of uranium fission, which is used for energy production in the
nuclear reactor. The major contribution to radiation dose was exposure to short-lived I131, which
was released in large amounts into the environment and primarily accumulated in the thyroid gland
after inhalation or ingestion of contaminated food and drinks. Particularly children continued to
consume I131-contaminated milk, leading to a median thyroid radiation dose of 0,35 Gy and
maximum doses upto 2 Gy. In contrast, survivors of atomic bombing in Hiroshima and Nagasaki
were mainly exposed to external radiation. However, the excess relative risks estimated by several
case-control and cohort studies indicate that thyroid cancer risks after internal exposure to I131 are
similar to the well-known risks after external radiation exposure (25-28).
Another extensive body of literature is available about the use of IR for medical diagnostic
and therapeutic procedures which continues to expand rapidly as techniques further develop (29).
The use of IR for therapeutic purposes involves the delivery of high, fractionated doses to specified
tissue volumes of patients while minimizing the irradiation of normal healthy tissue. Conventional
fractionation usually consists of daily fractions of 1.8-2 Gy, building up to a total radiation dose of
40 Gy or more dependent on the specific condition to be treated (30, 31). Several studies have
linked the use of radiotherapy to treat malignant or benign head and neck conditions, including
Hodgkin’s disease, with an increased risk to develop secondary malignant thyroid cancer, especially
among children (32-36). In contrast to the strong evidence of a linear increase in thyroid cancer
risk at radiation doses higher than 100 mSv, radiation-induced cancer risk is less clear at lower
doses. This is relevant for medical diagnostic exposures such as X-rays and computed tomography
(CT) scans. Medical diagnostic procedures represent the most significant source of artificial
exposure to IR (Figure 2A) (30). In addition, radiation doses are cumulative. As a result, patients
undergoing multiple high-dose diagnostic procedures in a short time period could reach effective
radiation doses higher than 100 mSv. Since the number of CT procedures is increasing, there is an
upward trend in the contribution of CT scans to the total collective dose from medical examinations
(Figure 2B) (16, 30, 37, 38). Furthermore, over one third of all CT scans are performed in the
head and neck region, exposing the thyroid gland to IR (39). M. Mazonakis, et al. estimated the
risk for thyroid cancer induction in pediatric patients undergoing head and neck CT scans. They
concluded that exposure of the thyroid gland to the primary CT radiation beam resulted in a thyroid
absorbed dose range of 15.2-52.0 mGy, which was related to an increased risk on cancer induction
up to 390 thyroid malignancies per one million patients (40).

5
Figure 2: Contribution of medical diagnostic radiation. (A) Average annual effective dose (mSv) in
Belgium from 1895 and 2006. (B) Trends in annual effective dose (in mSv per year) from diagnostic
radiological examinations in Belgium (1997-2006). The large and increasing share (77%) from CT is given
separately. Adapted from Vanmarcke et al. IRPA proceedings. 2010;3(1):2216-25 (38).
It is difficult to precisely quantify the risks of low-dose IR exposure. Low-dose risks are
likely to be lower compared to high-dose risks. As a result, the signal-to-noise ratio declines and
the expected low number of radiation-induced thyroid cancers may be masked by the natural
incidence of sporadic thyroid cancers. Therefore, to maintain sufficient statistical power, large
epidemiological studies are required (41, 42). Currently, in order to estimate the risks of cancer
development at intermediate and low radiation doses, the linear no-threshold (LNT) theory is used
(Supplemental Figure 2). This model implies a linear extrapolation of low-dose health risks from
high-dose data and thereby indicates that even the lowest radiation doses increase the probability
to develop cancer (14). A pooled analysis of 5 cohort studies and 2 case-control studies suggested
an increased risk on thyroid cancer at a mean external radiation dose to the thyroid of 50mSv
(19). In contrast, several studies believe that low-dose irradiation is stimulatory and beneficial for
reproduction, immunity, and average lifespan and decreased cancer death rates (43-47). Indeed,
There is still a lot of controversy about the health effects of low-dose IR.
2.2 IODINE DEFICIENCY
Normal thyroid functioning depends on the continuous supply of iodine, the key element for
thyroid hormone synthesis. However, iodine is a scarce trace element in the environment and can
only be acquired through the diet (48). As a consequence, ID remains a significant public health
problem affecting more than 2 billion individuals worldwide (49, 50). Several epidemiological
studies demonstrated an association between iodine intake and clinically evident thyroid nodules
and benign goitres, occurring more frequently in iodine-deficient populations (51-54). Although
nodularity and goitres may precede the development of malignant thyroid cancer, epidemiological
data remain controversial about the association between ID and an increased risk to develop
thyroid cancer (55-57). Defining this association in certain populations or geographical areas is
challenging, since thyroid cancer is relatively rare. As a result, long study periods in large
populations are required. In addition, the lag-time between changes in iodine intake and changes
in thyroid cancer incidence is unclear and can take several decades (8). However, there are some
ecological studies performed in different countries of Europe which describe a significant decrease

6
in the incidence of ATC and a shift towards more differentiated and less malignant forms of thyroid
cancer after correcting ID with iodized salt (58-61). Next to epidemiological and ecological data,
several early animal experiments showed an increased development of thyroid tumors, particularly
of the follicular and papillary type, in female rats and mice which were fed on a low-iodine diet.
Furthermore, the number and size of the thyroid tumors appeared to increase with an increased
duration of ID (62-65). Similar results were found in hamsters (66).
A suggested mechanism for the effects of ID is the chronic elevated release of the thyroid-
stimulating hormone (TSH) by the pituitary gland as part of the regulating hypothalamus-pituitary-
thyroid axis. Short-term actions of TSH include the induction of gene expression and protein
synthesis involved in iodine trapping and thyroid hormone production. In addition, TSH promotes
the release of thyroid hormones from the thyroid gland. Sustained TSH stimulation due to chronic
ID results in hypertrophy and hyperplasia of the follicular thyroid cells combined with an extension
of the thyroid vascular network and an increased thyroid blood flow (1). Abdul A. Al-Saadi et al.
demonstrated that the development of ID-induced thyroid hyperplasia is associated with
chromosomal abnormalities and an increased number of aneuploid rat thyroid cells with an
increased duration of ID (67). However, beyond the well-known effects of this delayed phase of
increased TSH levels in cases of severe and prolonged ID, thyrocytes are also able to rapidly react
to acute mild and moderate decreases in iodine supply without TSH involvement. This early TSH-
independent phase is characterised by endothelial cell proliferation and pericyte activation resulting
in adaptation of the local microvasculature, an increased blood flow and an enhanced iodine uptake
from the blood (68). It has already been demonstrated that an acute intracellular iodine
deprivation in thyrocytes induces a rapid and massive production of intracellular ROS, which in turn
stabilize hypoxia inducible factor (HIF)-1α. Subsequently, HIF-1 binds to the hypoxia-response
element (HRE) site in the promoter region of the vascular endothelial growth factor-A (VEGF-A)
gene, stimulating VEGF-A protein synthesis and release (68, 69). Furthermore, J. Craps, et al.
(2015) showed that ID activates ryanodine receptors (RYRs) located in the endoplasmic reticulum,
leading to intracellular Ca2+ release, which in turn phosphorylates and activates nitrogen oxide
synthase 3 (NOS3). Subsequently, activated NOS3 produces nitrogen oxide (NO), a reactive
nitrogen species with well-known vasodilatory properties, which can induce VEGF synthesis through
the activation of the HIF-1/VEGF-A pathway (Supplemental Figure 3) (70).
Besides the role of iodine in thyroid functioning, iodine is also involved in other, extra-
thyroidal organs, particularly in the stomach and mammary gland. The stomach and the thyroid
gland share many morphological and functional similarities, including the capacity to concentrate
iodine from the blood by means of the sodium/iodide symporter (NIS). This is probably due to the
common embryonic origin of both organs. On the other hand, the mammary gland is highly
effective in capturing iodine from the blood during pregnancy and lactation to provide the neonate
with sufficient levels of iodine. Then the neonate can produce its own thyroid hormones, which is
essential for normal neural development. Several studies reported that iodine deficiency constitutes
a risk factor for gastric cancer and breast cancer (71-74). It has been suggested that iodine is a
potent antioxidant, which acts as an electron donor, neutralizing free radicals such as H2O2 and
hydroxyl radicals. Furthermore, iodine inhibits lipid peroxidation and reduces the reactivity of
cellular biomolecules with ROS by means of iodination. As a result, iodine protects cells against

7
damage from oxidative stress. In addition, anti-proliferative, apoptotic and differentiation-
promoting effects of iodine have also been observed in several tumor cell lines. These results
support that iodine has a protective role against cancer development (75). However, it should be
mentioned that an excess of iodine should be avoided as well since iodine excess is also associated
with thyroid anomalies such as thyroiditis, hyperthyroidism, hypothyroidism and even thyroid
cancer (76).
3. THE COMBINED EFFECT OF IONIZING RADIATION AND IODINE DEFICIENCY
ON THE THYROID
Following the Chernobyl accident, it is suggested that ID is a co-factor, which could modify
the effects of IR on the thyroid gland. The radioactive isotope I131 was the chief component of the
accident fallout. Iodine-deficient thyroid glands have a stronger uptake of radioiodine, leading to
higher thyroid radiation doses, combined with the continuing effects of ID which may impact the
progression of thyroid cancer development (27). Several epidemiological studies focusing on the
Chernobyl accident and the link with thyroid cancer indicated that thyroid cancer incidence,
especially in children, was higher in territories with severe iodine deficiency than in areas of normal
iodine intake (77, 78). These findings suggest that low-iodine diets could potentiate the risk to
develop radiation-induced thyroid cancer and that elimination of ID may be important in reducing
the effects of radiation exposure on the thyroid (79). Furthermore, Cardis E, et al. even observed a
three-fold reduction in thyroid cancer risk among children taking iodine supplements months after
exposure to the radioactive fallout from the Chernobyl accident compared to children without
iodine supplementation. It is speculated that continuous administration of iodine supplements
reduces the size of the thyroid gland, which leads to less cellular proliferation and thus a reduced
thyroid cancer risk. Prophylaxis with iodine supplementation could be a favorable approach after
exposure to radioactive iodine (78, 79). However, this is more questionable after external thyroid
radiation exposure. In a long-term in vivo study of Carsten Boltze, et al. it was demonstrated that
a low-iodine intake significantly increase the proliferation rate of the thyroid cells and induced
thyroid adenomas in rats. However, no malignancies were detected after 110 weeks. When rats
were irradiated with an acute exposure of 4 Gy, they observed a significant destruction of the
thyroid follicular structure. However, rats under normal iodine supply developed no thyroid
malignancies. In contrast, thyroid cancer was detected in rats with ID (80). These results support
the idea that ID is an effective tumor promoter, which can enhance thyroid cancer development
when a carcinogenic factor like IR is present (8, 80, 81). Therefore, it is interesting to investigate a
potential additional effect of the enhanced stress induced by ID and IR on the molecular level of
thyroid cells.
4. POSSIBLE MOLECULAR MECHANISMS INDUCED BY IONIZING RADIATION
AND IODINE DEFICIENCY IN THE THYROID
4.1. OXIDATIVE STRESS AND THYROID CANCER
As described above, both IR and ID are stress factors for thyroid cells due to the increased
generation of reactive oxygen species. Under physiological conditions, ROS are produced in low
levels as part of normal cellular biochemical processes such as the defense system against

8
infectious agents and intracellular signaling. Furthermore, thyroid epithelial cells produce a
moderate amount of H2O2, which is a co-substrate required for thyroid hormone synthesis. The
generated ROS are continuously detoxified during the process of hormone synthesis or by
endogenous antioxidant systems including enzymes such as catalase, glutathione peroxidase and
peroxiredoxins (82). However, in case of excessive ROS accumulation, ROS levels may exceed the
cellular antioxidant defense mechanisms causing oxidative stress, which can result in damage to
DNA, proteins and lipids. Oxidative stress and elevated levels of ROS have been considered to be
involved in the pathophysiology of many cancers, including thyroid carcinogenesis (83). Several
studies already demonstrated an increased generation of ROS and an impairment of the
antioxidant system in patients with hyperthyroidism, hypothyroidism and thyroiditis (82, 84-87).
Interestingly, Dong Wang, et al. found a stronger association between oxidative stress and thyroid
cancer compared to other thyroid disorders. They assessed the total oxidant and antioxidant status
and calculated the oxidative stress index of 82 patients who were recently diagnoses with thyroid
cancer. The total oxidative status and oxidative stress index were significantly higher, and the total
antioxidant status was significantly lower in patients with thyroid cancer compared to healthy
controls and patients with benign thyroid diseases (88). These results support the role of oxidative
stress in the pathogenesis of thyroid disorders, including thyroid cancer.
4.2 DNA DAMAGE RESPONSE
Ionizing radiation damages DNA through direct ionization but more frequently through
indirect actions of water radiolysis. Therefore, it is assumed that the extent of DNA damage is
proportional to the received radiation dose. IR-induced DNA damage constitutes a broad range of
lesions including single-and double-strand breakages, base modifications, deoxyribose
modifications, intra-and inter-DNA cross-linking and promoted DNA-protein cross-linking. These
damages overlap substantially with DNA lesions induced by oxidative stress, which can be
generated by IR and ID. Therefore, the DNA damage response in thyroid cells could increase when
IR and ID are combined, due to the enhanced production of reactive oxygen species. The most
deleterious lesion is the DSB (14). Several studies provided data supporting a linear relationship
between DSB induction and increasing radiation dose in cultured cells starting from 1 mGy as well
as in vivo starting from 100 mGy (10, 89, 90). DSBs can be detected by the phosphorylation of the
histone variant H2AX (γH2AX). H2AX is a component of the histone octomer in nucleosomes, which
compact DNA into chromatin (91). DSBs initiate the phosphorylation of H2AX by ATM and ATR
kinases, which are part of the PI3K/AKT pathway. Subsequently, γH2AX is crucial in recruiting and
localizing DNA repair proteins and will be dephosphorylated as DNA repair completes. γH2AX foci
together with 53BP1 foci are good biomarkers for DSBs (10, 91). To protect the cell against the
deleterious effects of DNA damage and to maintain genomic stability, a network of DNA damage
response (DDR) pathways are triggered, resulting in several different outcomes (Supplemental
Figure 4). DNA damage activates checkpoint pathways, which inhibit the normal progression
through the cell cycle. Cell cycle arrest mostly occurs in the G1 or G2 phase so the cell can cope
with the induced damage by facilitating repair processes. Besides H2AX, activated ATM
phosphorylates several other key proteins of the global DDR such as the tumor suppressor proteins
p53 and BRCA1, the negative regulator of P53 MDM2, the checkpoint kinases CHK1 and CHK2, the

9
regulator of damage-induced cell cycle arrest checkpoints MDC1, and the DNA repair protein NBS1
which is recruited to DSBs in complex with MRE11/RAD50 by direct binding to γH2AX. These
events promote cell cycle arrest, chromatin remodeling and up-regulation of DNA repair (14, 92,
93). When the extent of DNA damage is too large, damaged cells will be eliminated by induction of
apoptosis, in which p53 plays an important role in the regulation of this process. Conversely,
failure of the cell cycle checkpoints or inefficient DNA repair in cells may lead to accumulation of
genetic damage and genomic instability. In particular DSBs can lead to genetic mutation which play
an important role in the process of carcinogenesis in humans. In addition, IR-induced DNA lesions
typically occur in clusters, increasing the complexity. This may compromise DNA repair and
contribute to cancer risk (14, 94).
4.3 ALTERED SIGNALING PATHWAYS
There is still a limited understanding about the effects and molecular mechanisms of IR-and
ROS-induced alterations in signaling pathways. For instance, the duration of activation of kinases -
transient or persistent - may lead to a different decisive outcome in regard to proliferation, cell
cycle arrest or cell death (95). Deregulation of these key pathways controlling cellular proliferation
and survival together with a suppressed apoptosis constitute the minimal underlying platform for
neoplastic evolution and are part of the hallmarks of cancer cells (96). DNA damage, IR and
oxidative stress are reported to alter these cellular responses and signaling transduction pathways
such as the MAPK/ERK, PI3K/AKT, NFκB and the JAK/STAT pathways (97). These signaling
pathways may be more strongly modified in thyroid cells when they are affected by a combination
of IR and ID due to enhanced oxidative stress.
4.3.1 PI3K/AKT pathway
The PI3K/AKT signaling pathway is a cytoprotective response with anti-apoptotic effects,
downstream of the EGFR family receptors (Supplemental Figure 5). It is reported that cellular
exposure to low-dose IR (0,1 Gy) may promote PI3K/AKT signaling by rapid activation of
transcription factors and tyrosine kinases (98). In addition, reactive oxygen species induced by IR
and ID can function as intracellular messenger molecules. In particular H2O2 is able to induce AKT
phosphorylation at the Ser473 and Thr308 residues by inhibiting the activity of PTEN. This dually
phosphorylated, active AKT protein is then able to directly phosphorylate and inactivate the pro-
apoptotic BAD protein, which controls the release of cytochrome c from mitochondria. In addition,
AKT also controls apoptosis through indirect inhibition of pro-apoptotic gene expression and
increasing expression of anti-apoptotic genes by phosphorylation of various transcription factors.
Interestingly, AKT also indirectly regulates p53. Indeed, AKT specifically phosphorylates the MDM2
protein, an important negative regulator of p53, promoting its translocation to the nucleus and
targeting p53 for degradation. As a result, AKT impairs the cellular stress response and thereby
increases cellular survival. In addition, the PI3K/AKT pathway cross-talks with the NFκB pathway
by phosphorylating and activating IκB kinase α (IKKα), which in turn pshorphorylates IκB,
targeting it for degradation. This leads to the nuclear translocation and activation of NFκB, inducing
expression of NFκB-dependent pro-survival genes, such as the anti-apoptotic proteins BCL-XL,
BCL-2 and Mcl-1 as well as caspase inhibitor proteins. Furthermore, cross-talk between PI3K/AKT

10
pathway and the MAPK/ERK pathway is reported in which AKT co-operates with ERKs to shift the
apoptotic threshold in cells to higher inputs by both inactivating BAD. In addition, AKT inhibits the
cytotoxic-activation of the non-classical JNK pathway. Besides the anti-apoptotic effects, activated
AKT is also able to modulate the function of various substrates, which play a role in the regulation
of cell cycle progression, such as GSK-3, mTOR, TSC2 and the cyclin-dependent kinase inhibitors
p21 and P27. The PI3K/AKT pathway is frequently disrupted in human cancers and is a major
contributor to tumor radio-resistance (99, 100). Therefore, it is of interest to investigate the
combined effect of IR and ID on the PI3K/AKT pathway in non-cancerous rat thyroid cells.
4.3.2 NFκB pathway
NFκB is able to activate a wide variety of genes, which are involved in the regulation of
stress responses, inflammation and apoptosis (Supplemental Figure 6). The NFκB family
comprises five members: RelA (p65), RelB, c-REL, p50/p105 (NFκB1) and p52/p100 (NFκB2).
Activated NFκB typically occurs as a dimeric protein, which possesses both a DNA binding domain
and a transactivation domain. Different combinations of homo-and heterodimers can be formed to
modulate the intrinsic properties of NFκB and its regulation. However, p50/p65 is the most
abundant heterodimer (101). Under non-stimulated conditions, the activity of the NFκB complex is
suppressed by binding to members of the NFκB inhibitors (the IκB family), which sterically hinder
the NFκB nuclear translocation sequence, and thereby causing NFκB cytoplasmic retention (101,
102). IκB phosphorylation is the key event in NFκB activation and is catalyzed by the IKK complex.
IR is able to induce NFκB activation by directly damaging the DNA, causing DSBs and SSBs. The
damaged DNA activates nuclear ATM, which in turn regulates IKK activity. On the other hand, ROS
generated by IR as well as ID in thyroid cells not only induce DNA damage but also activate NFκB
via the TRAFs pathway. Furthermore, IR and ROS induce the release of cytokines such as TNFα and
IL-1, which also stimulates the activation of NFκB. Phosphorylation of the IκB proteins by activated
IKK leads to rapid IκB degradation, allowing the NFκB complex to translocate to the nucleus where
it regulates the transcription of various genes (101). Expression of the NFκB effector genes, which
include both anti-apoptotic and cell cycle elements, is required for an enhanced cellular survival to
allow stressed cells to repair their damaged DNA. NFκB regulates the cell cycle by promoting
expression of cyclin D1 and B1, which is required for cell cycle progression through the G1/S phase
and G2/M phase transition respectively. In combination with the expression of anti-apoptotic genes
such as Bcl-2, Bcl-XL and inhibitors of apoptosis proteins (IAPs), sustained activation of NFκB could
permit cells with accumulated DNA damage to proliferate and to escape apoptosis, increasing the
risk on malignant transformation (101, 103). Elevated levels of NFκB activation has been linked to
increased radio-resistance of tumor cells. Furthermore, activation of NFκB has been demonstrated
following high and low doses of IR (104, 105). Therefore, modulations of the NFκB pathway will be
investigated in thyroid cells treated with different doses of IR combined with ID.
4.3.3 JAK/STAT pathway
The JAK/STAT pathway mediates signaling transduction via cytokine and growth factor
receptors. Upon receptor stimulation, activated JAK phosphorylates and thereby activates the
latent, cytoplasmic members of the STAT proteins (Supplemental Figure 7). STAT3 is a critical

11
factor in the JAK/STAT pathway and has been acknowledged as a prominent oncogenic protein. The
major mechanism of STAT3 activation is mediated by the IL-6/IL-6R/gp-130 signaling which leads
to the activation of JAKs. In turn, JAKs induce phosphorylation of STAT3, which then forms homo-
or hetero dimers. In this activated form, STAT3 translocates to the nucleus where it regulates the
expression of various target genes involved in cellular survival, proliferation, differentiation,
invasion and angiogenesis (106-108). On the other hand, unphosphorylated STAT3 is also able to
regulate gene expression in complex with NFκB, in which STAT3 enables nuclear translocation,
while NFκB provides DNA binding and transactivation domains (108). It has been demonstrated
that STAT3 and its phosphorylated form, pSTAT3, was present in low levels in benign thyroid
disorders, while it was ubiquitous in PTC and in lymph nodes of patients with lymphatic thyroid
cancer metastases. These findings suggest that a constitutive activated JAK/STAT3 pathway is
involved in the development, progression, and metastasis of thyroid cancer (109). IR and ROS can
lead to the activation of STAT3. Furthermore blockage of STAT3 signaling using JAK inhibitors was
able to abrogate radiation-induced malignant progression of glioma cells (110). Preliminary data
demonstrated that the protein expression level of pSTAT3/STAT3 was significantly increased in rat
FRTL5 thyroid cells exposed to a radiation dose of 3 Gy combined with ID as compared to iodine-
sufficient, rat FRTL5 thyroid cells solely exposed to a radiation dose of 3 Gy. Therefore, it is of
interest to monitor the changes in STAT3 and pSTAT3 protein expression levels in rat PCCL3
thyroid cells treated with ID and low-dose IR and compare them to the available preliminary data
in rat FRTL5 cells.
5. RESEARCH PLAN
The main goal of this research was to monitor the basic cellular and molecular responses of
thyrocytes to ID and low-dose IR. Since both ID and IR are important stress factors for the thyroid
gland, we hypothesized that ID and low-dose IR would both stress thyrocytes due to an enhanced
production of reactive oxygen species, which would eventually affect cellular proliferation, survival
and resistance to apoptosis. In order to investigate this, non-cancerous rat PCCL3 cells were
cultured under the presence or absence of a physiological level of sodium iodide (10-8M NaI). The
latter created iodine-deficient thyrocytes. In each condition, thyrocytes were subdivided in different
groups depending on the X-ray radiation dose they received, i.e. the sham-irradiated cells which
were used as controls, the low-dose irradiated cells (0,05 Gy and 0,1 Gy), the intermediate-dose
irradiated cells (0,5 Gy) and the high-dose irradiated cells (3 Gy) (Supplemental Figure 8). We
investigated changes in gene expression and the modulations on protein levels using quantitative
RT-PCR and Western blot respectively. We focused especially on genes and proteins involved in
signaling pathways important for cellular survival, proliferation, DNA repair and antioxidant
defense. The extent of DNA damage, more specifically DSBs, was visualized with γH2AX fluorescent
staining. On the other hand, apoptosis of thyroid cells and their cell cycle profile was measured by
means of a TUNEL assay and a 7-AAD/BrdU assay respectively flow cytometry. Finally, the cellular
redox state was assessed under the fluorescence microscope using the cell-permeable, non-
fluorescent CM-H2DCFDA probe.

12

13
MATERIAL AND METHODS
1. CELL CULTURE AND IRRADIATION
Rat PCCL3 thyroid cells were a gift from Professor F. Miot (Université Libre de Bruxelles,
institute de Recherche Interdisciplinaire en Biologie Humaine et Moléculaire, Brussels, Belgium).
PCCL3 cells were cultured in Coon’s modified Ham’s F12 medium (Life Technologies, Merelbeke,
Belgium) supplemented with 5% fetal bovine serum (FBS) (Gibco, Ghent, Belgium), 2.4 mM
glutamine (Sigma-Aldrich, Diegem, Belgium), 1mU/mL TSH (Sigma-Aldrich, Diegem, Belgium), 100
U/mL penicillin-streptomycin (Invitrogen, Ninove, Belgium), 2.5 μg/mL Fungizone (Invitrogen,
Ninove, Belgium), 1 μg/mL insulin (Sigma-Aldrich, Diegem, Belgium) and 5 μg/mL transferrin
(Sigma-Aldrich, Diegem, Belgium) in a humidified atmosphere of 37°C and 5% CO2
(Supplemental Figure 9). At least seven days before the start of the experiments, the cells were
grown in fresh media containing a physiological concentration of 10-8M NaI. On the day of the
experiment, the culture media were removed, cells were washed with 1x PBS (Gibco, Ghent,
Belgium) and fresh media were added, containing or lacking NaI to create iodine-sufficient or
iodine-deficient thyroid cells respectively. Following media replacement, the cells were irradiated
with low (0.05 Gy and 0.1 Gy), intermediate (0.5 Gy) or high (3 Gy) radiation doses at a dose rate
of 8.5 Gy/hour using the Xstrahl 320 kV generator. Non-exposed control cells were sham-
irradiated. The cells were then returned to the humidified incubator until the start of the
experiments.
2. RNA ISOLATION AND REVERSE TRANSCRIPTION
Three days before induction of ID and irradiation, cells were seeded in five 6-well plates at a
density of 2 x 10⁵ cells/well for cell lysis 6 and 24 hours after induction of ID, and 1.5 x 10⁵
cells/well for cell lysis 24 hours after ID and irradiation. Each 6-well plate corresponded to a single
radiation dose and comprised three biological replicates of iodine-sufficient thyroid cells and three
biological replicates of iodine-deficient thyroid cells. The cells were washed twice with 1x PBS and
lysed in 350 μl of RNeasy Lysis Buffer Plus from the Qiagen RNeasy Plus Mini Kit (Qiagen, Antwerp,
Belgium). Then, total RNA was purified according to the manufacturer’s instructions and
resuspended in 30 μl of nuclease-free water. RNA quantification and RNA quality control was
assessed using the DropSense 16 spectrometer (Trinean, Ghentbrugge, Belgium) and the RNA
integrity number (RIN) number (Agilent’s lab-on-chip Bioanalyzer 2100, Agilent Technologies,
Diegem, Belgium) respectively. Subsequently, one microgram of total extracted RNA was reversed
transcribed to first-strand cDNA by using the GoScript Reverse Transcription System (Promega,
Leiden, The Netherlands) according to the manufacturer’s instructions. Briefly, 1 μg of total RNA
was mixed with 0.5 μg of random primers and 0.5 μg of oligo(dT)15 primers, thermally denatured
at 70°C for 5 minutes, and chilled on ice for 5 minutes. Subsequently, GoScript 5X reaction buffer,
1.5 mM MgCl2, the PCR nucleotide mix (0.5 mM of each dNTP), the recombinant RNasin
ribonuclease inhibitor and the GoScript reverse transcriptase were added. This final mixture was

14
incubated at 25°C for 5 minutes to allow primer annealing, at 42°C for 60 minutes to allow first-
strand cDNA synthesis and finally at 70°C for 15 minutes to inactivate reverse transcriptase. The
obtained cDNA samples were then stored at -20°C until their use in quantitative PCR.
3. WESTERN BLOT ANALYSIS
Three days before induction of ID and irradiation, cells were plated in 75-cm2 tissue culture
flasks at a density of 2 x 10⁶ cells/flask. We included three biological replicates per condition. Six
hours after ID and irradiation, cells were collected by trypsinization (0.05% Trypsin-EDTA) and the
cell pellet was frozen at -80°C until protein extractions. Proteins were isolated from the PCCL3 cells
using Bio-Rad’s ReadyPrep II including 8M urea, 4% CHAPS, 40 mM Tris and 0.2% Bio-Lyte 3/10
ampholyte (Bio-Rad, Temse, Belgium) supplemented with ½ cOmpleteTM Mini Protease Inhibitor
Cocktail Tablet (Roche Diagnostics, Brussels, Belgium) and 1% tributyl phosphate (TBP) (Sigma-
Aldrich, Diegem, Belgium). Thryoid cells were suspended in 100 μl of the extraction buffer and
homogenized by means of 1.4 mm ceramic beads (Labconsult, Brussels, Belgium) and the
TissueLyser II (Qiagen, Antwerp, Belgium). Subsequently, the protein samples were quantified,
using the bicinchoninic acid (BCA) protein assay kit (Sigma-Aldrich, Diegem, Belgium) according to
the manufacturer’s instructions with standard protein solutions of 0.125 mg/mL, 0.25 mg/mL, 0.5
mg/mL, 0.75 mg/mL, 1 mg/mL, 1.5 mg/mL and 2 mg/mL (Bio-Rad, Temse, Belgium). Absorbance
of the Cu-BCA chelate formed in the presence of protein was measured at 562 nm and normalized
at 750nm by means of the Nanodrop spectrophotometer (Thermo Scientific, Ghent, Belgium).
Twenty µg of the sample proteins were mixed with 4X Laemmli buffer (25% of the total volume)
(Bio-Rad, Temse, Belgium), Beta-Mercapto-ethanol (Sigma-Aldrich, Diegem, Belgium) (2.5% of the
total volume) and MilliQ to get a final volume of 20 µl. Samples were heated at 95°C for 5 minutes
and were separated by a horizontal 15-well 10% (Amersham ECLTM Gel, GE healthcare Life
Sciences, Diegem, Belgium) or a vertical 26-well 4-15% (TGX Stain-free Precast Protein Gel, Bio-
Rad, Temse, Belgium) sodium-dodecyl-sulfate (SDS) polyacrylamide gel at 160V for 60 minutes or
at 300V for 25 minutes respectively. Then, proteins were transferred onto a nitrocellulose
membrane using the iBlot dry gel transfer system (Invitrogen, Ninove, Belgium) for the horizontal
15-well western blot and the Trans-Blot Turbo Transfer System (Bio-Rad, Temse, Belgium) for the
vertical 26-well western blot. Membranes were blocked for 1 hour at room temperature in blocking
buffer (WesternDotTM blocking buffer, component A of the WesternDotTM 625 Western Blot Kit or
SuperBlockTM Blocking buffer, Invitrogen, Ninove, Belgium). Then, membranes were incubated with
the primary antibody diluted in blocking buffer at 4°C overnight (Table 1) and washed three times
for 5 minutes in 1X washing buffer (0.05M Tris-HCl, 0.15M NaCl, 0.05% Tween 20, pH 7.4;
Component B of the WesternDotTM 625 Western Blot Kit, Invitrogen, Ninove, Belgium).
Subsequently, a biotinylated secondary antibody (Component C of the WesternDotTM 625 Western
Blot Kit, Invitrogen, Ninove, Belgium), 1/4000 times diluted in 1X washing buffer (Table 1), was
added and incubated for 1 hour at room temperature, followed by three times 5 minutes of
washing. The antibody complexes were visualized using QDot® 625 streptavidin conjugates
(Component D of the WesternDotTM 625 Western Blot Kit, Invitrogen, Ninove, Belgium), 1/4000
times diluted in blocking buffer and incubated for 1 hour at room temperature. After three times 5

15
minutes of washing, protein bands were detected by exposing the membranes to UV-light by
means of the Fusion FX Imager (Vilber Lourmat, Eberhardzell, Germany). Protein bands were
quantified by densitometry using the Bio1D analysis software (Vilber Lourmat, Eberhardzell,
Germany). In order to verify equal loading, the protein levels were normalized against the level of
the housekeeping proteins ß-actin or viniculin, which were always probed on the same membrane
of the proteins of interest.
Table 1: Characteristics of the used primary antibodies for Western blot.
Primary antibody Host species Supplier Clonality Dilution
Akt1 (B-1) (sc-5298) Mouse Santa Cruz Monoclonal 1/500
B-actin (C4) (sc-47778) Mouse Santa Cruz Monoclonal 1/2000
Catalase (H-300) sc-50508 Rabbit Santa Cruz Polyclonal 1/500
eNOS/NOS Type III (610296) Mouse BD Biosciences Monoclonal 1/800
HIF-1α (MAB1536) Mouse R&D Systems Monoclonal 1/800
NFκB p52 (K-27) (sc-298) Rabbit Santa Cruz Polyclonal 1/1000
p-Akt1 (Thr308) (sc-135650) Rabbit Santa Cruz Polyclonal 1/500
p-eNOS (S1177) (9571S) Rabbit Cell Signaling Polyclonal 1/800
p-STAT3 (B-7) (sc-8059) Mouse Santa Cruz Monoclonal 1/800, 1/1000
p-STAT3 (Y705) (9145P) Rabbit Cell Signaling Monoclonal 1/800
STAT3 (C-20) (sc-482) Rabbit Santa Cruz Polyclonal 1/800
Viniculin (7F9) (sc- 73614) Mouse Santa Cruz Monoclonal 1/2000
Secondary antibody Host species Supplier Clonality Dilution
Biotin XX anti-rabbit Goat Invitrogen Polyclonal 1/4000
Biotin XX anti-mouse Goat Invitrogen Polyclonal 1/4000
4. ROS ASSAY
One day before induction of ID and irradiation, cells were seeded in transparent bottom 96-well
plates with dark rims at a density of 1 x 10³ cells/well. Each 96-well plate corresponded to a single
dose and comprised 12 biological replicates of iodine-sufficient thyroid cells and 12 replicates of
iodine-deficient thyroid cells. 24 hours after ID and irradiation, culture media were removed and
cells were washed twice in 37°C-preheated HEPES-buffered Hank’s balanced salt solution (HB-
HBSS; Thermo Scientific, Ghent, Belgium, 1X HBSS + Ca2+ + Mg2+ + 20 mM HEPES, pH: 7.2).
Then, to detect general intracellular ROS levels, the cells were incubated for 25 minutes at room
temperature and protected from light with a staining solution containing a final concentration of 2
µM CM-H2DCFDA (Thermo Scientific, Ghent, Belgium) dissolved in DMSO after a 1/500 dilution in
HB-HBSS buffer. After washing the cells twice in HB-HBSS, the cells were imaged using the
inverted fluorescence Nikon Eclipse Ti microscope. The CM-H2DCFDA signal was detected under the
Green Fluorescent Protein (GFP) channel. Exposure time and gain were optimized and kept
constant among all experimental groups during the imaging procedures. The fluorescent signal was
quantified and analyzed using a macro developed by Drs. Winnok de Vos and Tom Sieprath from
UGhent.

16
5. YH2AX/53BP1 IMMUNOFLUORESCENCE STAINING
One day before induction of ID and irradiation, cells were plated in 8-well lab-teks (Thermo
scientific, Ghent, Belgium) at a density of 5 x 10⁴ cells/well. Each labtek corresponded to a single
dose and comprised three biological replicates of iodine-sufficient thyroid cells and three biological
replicates of iodine-deficient thyroid cells. 30 minutes, 1 hour, 4 hours and 24 hours after ID and
irradiation, culture media were removed and cells were washed in 1X PBS before fixation in 2%
paraformaldeyhde (PFA) (Life Technologies, Merelbeke, Belgium) for 15 minutes at room
temperature. Then, cells were washed twice and permeabilized by incubation in 1X PBS containing
0.25% Triton-X for 3 minutes at room temperature. After two washing periods of 15 minutes, cells
were blocked in pre-immunized goat serum (Invitrogen, Ninove, Belgium), diluted 1/5 times in TNB
blocking buffer (0.5% w/v blocking reagent in 1X TBS-0.05%Tween, Perkin Elmer, Zaventem,
Belgium), for 1 hour at room temperature. This was followed by incubation with primary mouse
monoclonal anti-γH2AX antibody (Millipore, Overijse, Belgium) and rabbit polyclonal anti-53BP1
antibody (Novus Biologicals, Abingdon, UK), respectively 1/300 times and 1/1000 times diluted in
TNB blocking buffer, for 1 hour at 37°C. After two washing periods of 15 minutes, cells were
incubated with Alexa fluor 488-labeled secondary goat anti-mouse antibody and Alexa fluor 568-
labeled secondary goat anti-rabbit antibody (Life Technologies, Merelbeke, Belgium), respectively
1/300 times and 1/1000 times diluted in TNB blocking buffer containing 4',6-diamidino-2-
phenylindole (DAPI) (Sigma-Aldrich, Diegem, Belgium), for 1 hour at 37°C and protected from
light. Following two washing periods of 15 minutes, glass coverslips were mounted using ProLong
Diamond Antifade mountant with DAPI (Invitrogen, Ninove, Belgium) which was dried overnight at
4°C. Up to 150 to 250 cells/well were visualized and captured using the inverted fluorescence
Nikon Eclipse Ti microscope. The laser exposure time and gain were optimized and kept constant
among all experimental groups. γH2AX foci were analyzed using a macro developed by Drs.
Winnok de Vos from UGhent.
6. CELL CYCLE ANALYSIS
Two days before induction of ID and irradiation, cells were seeded in 25-cm2 culture flasks at a
density of 5 x 10⁵ cells/flask. We included three biological replicates per condition. Five, 23 hours
and 47 hours after ID and irradiation, 10 µM of BrdU (Thermo Scientific, Gent, Belgium) was added
to the culture media for 1 hour. Then, cells were harvested by trypsinization (0.05% trypsin-EDTA)
and fixed in ice-cold ethanol with a final concentration of 70%. After centrifuging the cells at 500g
for 5 minutes, acidic antigen recovery was achieved by treating the cells with 2M HCl for 30
minutes at room temperature, followed by washing twice with 1X PFT buffer (1X PBS supplemented
with 5% FBS and 0.25% Triton X-100). Subsequently, cells were blocked with 1X PFT buffer for 1
hour at room temperature and were incubated with the primary rat monoclonal anti-BrdU antibody
(AbD Serotec, Bio-Rad, Temse, Belgium), 1/300 times diluted in 1X PFT buffer, overnight at 4°C,
protected from light. After washing twice with 1X PFT buffer, cells were incubated with Alexa fluor
488-labeled secondary goat anti-rat antibody (Life Technologies, Merelbeke, Belgium), 1/200 times
diluted in 1X PFT buffer, for two hours at room temperature, followed by washing twice with 1X PFT

17
buffer. Then, cells were resuspended in 10 µg/mL 7-amino-actinomycin D (7-AAD) (Sigma-Aldrich,
Diegem, Belgium) in 1X PFT buffer for 15 minutes at room temperature and were applied on a 5
mL Falcon Polystyrene tube with a cell-strainer snap cap (Corning Science, Wiesbaden, Germany)
for centrifugation at 500G for 2 minutes. The samples were stored on ice, protected from light, and
were analyzed using the Becton Dickinson Accuri C6 flow cytometer (BD Biosciences,
Erembodegem, Belgium). First, singlet cells were identified according to their forward scatter and
their fluorescence area to height ratio. Then, gates were set to identify the cells in the G1 phase,
the G2/M phase and the S phase which were expressed as percentage of the total cell number
acquired.
7. TUNEL ASSAY
One day before induction of ID and irradiation, cells were seeded in 25-cm2 culture flasks at a
density of 4 x 10⁵ cells/flask. We included three biological replicates per condition. 48 hours after
ID and irradiation, cells were harvested by trypsinization (0.05% trypsin-EDTA) and fixed in ice-
cold ethanol with a final concentration of 70%. After centrifuging the cells at 500g for 5 minutes
and removal of ethanol, cells were washed in 1X PFT buffer (1x PBS supplemented with 5% FBS
and 0.25% Triton X-100). Then, positive control samples were treated with DNase 1 (Qiagen,
Antwerp, Belgium) in DNase 1 buffer solution (50 nM Tris-HCl pH 7.5, 1 mg/ml BSA) for 10
minutes at room temperature to induce DNA strand breaks. Negative control samples were
incubated in DNase 1 buffer solution lacking DNase 1. After incubation, control cells were washed
in 1X PFT buffer. Subsequently, all sample pellets were resuspended in 50 µl of 20% TdT 5X
reaction buffer (125 mM Tris-HCl, 1 M Sodium Cacodylate, 1.25 mg/ml BSA, pH 6.6, Roche
Diagnostics, Brussels, Belgium), 4% BrdUTP stock solution (2 mM Br-dUTP in 50 mM Tris-HCl, pH
7.5, Sigma-Aldrich, Diegem, Belgium), 1% TdT in TdT storage solution (4% TdT in 60 mM K-
phophate, 150 nM KCl, 1 mM 2-Mercaptoethanol, 0.5% Triton X-100, 50% glycerol, Roche
Diagnostics, Brussels, Belgium), 4% 25 mM cobalt chloride stock solution (Roche Diagnostics,
Brussels, Belgium), and 71% distilled H2O for 60 minutes at 37°C. After washing with 1X PFT, the
cell pellets were incubated with the primary rat monoclonal anti-BrdU antibody (AbD Serotec, Bio-
Rad, Temse, Belgium) and the primary rabbit monoclonal anti-cleaved caspase 3 (Asp175)
antibody (Cell Signaling, Leiden, The Netherlands), both 1/300 times diluted in 1X PFT buffer,
overnight at 4°C, protected from light. After washing twice with 1X PFT buffer, cells were incubated
with Alexa fluor 488-labeled secondary goat anti-rat antibody (Life Technologies, Merelbeke,
Belgium) and Alexa fluor 568-labeled secondary goat anti-rabbit antibody (Life Technologies,
Merelbeke, Belgium), both 1/200 times diluted in 1X PFT buffer, for two hours at room
temperature. Subsequently, cells were washed twice with 1X PFT buffer and were applied on a 5
mL Falcon Polystyrene tube with a cell-strainer snap cap (Corning Science, Wiesbaden, Germany)
for centrifugation at 500G for 2 minutes. The samples were stored on ice, protected from light, and
were analyzed using the Becton Dickinson Accuri C6 flow cytometer (BD Biosciences,
Erembodegem, Belgium).

18
8. STATISTICAL ANALYSIS
GraphPad Prism 5.01 was used to perform statistical analysis of the results. All experiments
included at least three biological replicates. Therefore, results are presented as mean ± Standard
deviation (SD). To test for significant differences between iodine-sufficient and iodine-deficient
conditions and among different radiation doses, a two-way Anova was performed, followed by a
Bonferonni or a Tukey-Kramer post hoc test. The results are considered statistically significant
when p< 0.05.

19
RESULTS
1. ROS PRODUCTION.
Our hypothesis states that ID and IR would both stress thyroid cells due to enhanced
generation of reactive oxygen species. To assess the production of reactive oxygen species upon
irradiation and ID, non-cancerous rat PCCL3 cells were cultured in an iodine-sufficient or iodine-
deficient condition for 24 hours and exposed to low, intermediate or high radiation doses.
Subsequently, the cell-permeable, non-fluorescent CM-H2DCFDA probe was used to indicate
general oxidative stress. Reactive oxygen species oxidize the probe yielding a fluorescent adduct
captured inside the cells. The fluorescent signal was then quantified and normalized against the
total cell number.
There was a significant, radiation dose-dependent increase in the production of reactive oxygen
species compared to lower irradiation doses and to non-irradiated control cells, both in iodine-
sufficient as in iodine-deficient conditions (Table 2). Furthermore, the production of reactive
oxygen species was significantly upregulated in iodine-deficient PCCL3 cells that were irradiated
with 0.5 Gy and 3 Gy, compared to the corresponding irradiated, iodine-sufficient PCCL3 cells (0.5
Gy: P<0.001; 3 Gy: P=0.012) (Figure 3).
These results suggest that starting from an intermediate radiation dose of 0.5 Gy and higher
upto 3 Gy, thyroid cells are stressed to this extent, so that the additional stress of ID leads to an
enhanced production of reactive oxygen species, compared to iodine-sufficient thyroid cells.
Figure 3: ROS production significantly increased with increasing radiation doses and is enhanced
under iodine-deficient conditions at 0.5 Gy and 3 Gy. ROS production was analyzed using the cell-
permeable, non-fluorescent CM-H2DCFDA probe in PCCL3 cells that were iodine deprived for 24 hours and
irradiated at low, intermediate and high radiation doses. Results are expressed as mean fluorescent signal
intensity ± standard error of the mean and are normalized against the number of cells. ns, not significant, *,
p<0.05; **, p<0.002, ***, p<0.001.
0 G
y
0.1
Gy
0.5
Gy
3 G
y
0
1 0 0 0
2 0 0 0
3 0 0 0
4 0 0 0
Iodine
Iodine Deficiency
Dose
RO
S s
ign
al
***
*

20
Table 2: Table of significance of the ROS assay 24 hours after iodine deficiency and ionizing
radiation, comparing changes between the different radiation doses in iodine-sufficient and iodine-
deficient PCCL3 cells.
2. ANTIOXIDANT DEFENSE
Preliminary data showed that rat thyroid FRTL5 cells exhibited a resistant profile to DNA
damage and apoptosis after exposure to high doses of IR and iodine deprivation. A possible
explanation is the presence of effective mechanisms to regulate antioxidant responses in thyroid
cells, limiting cellular damage and apoptosis induced by ROS, such as H2O2, a required co-substrate
together with iodide in the synthesis of thyroid hormones. Therefore, together with our previously
described ROS assay, an increased protein expression of antioxidant enzymes, such as catalase, an
enzyme that detoxifies H2O2, could be expected when exposing thyroid cells to IR and ID, both
factors leading to ROS production. To examine the change in catalase protein expression upon
irradiation and iodine deprivation, non-cancerous rat thyroid PCCL3 cells were cultured in an
iodine-sufficient or iodine-deficient state for 6 hours and exposed to low, intermediate or high
radiation doses. Protein expression of catalase was analyzed using Western blot.
Bands were detected at approximately 60 kDa and 120 kDa for catalase protein expression
(Supplemental Figure 10C). The predicted band size of a catalase monomer is 60 kDa. A two-
way Anova statistical analysis indicates that there was an overall significant effect of the PCCL3
iodine state on the results we observe (P=0.0242). However, post-hoc testing could not define a
specific significant difference between groups. We can see a trend of an increased catalase protein
expression in iodine-deficient thyroid cells compared to iodine-sufficient thyroid cells. In contrast,
irradiation, even with high IR doses, did not significantly change catalase protein expression in the
exposed thyroid cells. As a result, there was no enhanced effect observed when combining IR and
ID (Figure 4). Under iodine-deficient conditions, the production of H2O2 cannot be sufficiently
detoxified by the thyroid peroxidase (TPO)-catalyzed oxidation of iodide to iodine during the
process of thyroid hormone synthesis. These data indicate that deprivation of iodine activates
antioxidant protein expression of catalase, which could represent an acute compensatory response
to the decreased presence of iodide as a H2O2 antioxidant-scavenging agent.
There are relatively high standard deviations observed at n=3 for each condition. This could
mask potential significant effects of IR and a potential enhanced effect of IR and ID on catalase
protein expression. Reconsidering optimization of the Western blot protocol and including more
Iodine Iodine deficiency
Comparisons test Significance P-value Comparisons test Significance P-value
0 Gy vs 0.1 Gy *** <0.001 0 Gy vs 0.1 Gy *** <0.001
0 Gy vs 0.5 Gy *** <0.001 0 Gy vs 0.5 Gy *** <0.001
0 Gy vs 3 Gy *** <0.001 0 Gy vs 3 Gy *** <0.001
0.1 Gy vs 0.5 Gy ns 0.09 0.1 Gy vs 0.5 Gy ns 0.42
0.1 Gy vs 3 Gy ** 0.005 0.1 Gy vs 3 Gy *** <0.001
0.5 Gy vs 3 Gy *** <0.001 0.5 Gy vs 3 Gy *** <0.001

21
biological replicates could reduce the SD values of the observed results and could increase the
reproducibility of the experiment.
Figure 4: ID had an overall significant effect increasing catalase protein expression (p=0.0242). In
contrast, there were no significant differences observed in catalase protein expression among the different
radiation doses and after combined exposure to IR and ID. Catalase protein expressing was analyzed by
Western blotting in PCCL3 cells that were iodine deprived for 6 hours and irradiated with low, intermediate or
high radiation doses. Densitometric values were normalized against ß-actin. Results are expressed as the mean
fold change relative to non-irradiation, iodine-sufficient thyroid cells ± standard deviation (SD) of 3 biological
replicates (n=3) from 1 representative experiment.
3. APOPTOSIS
In order to investigate the effect of a combined treatment with ID and low-, intermediate- and
high-dose irradiation on the induction of apoptosis in thyroid cells, we wanted to measure the
proportion of living, early and late apoptotic rat PCCL3 cells, 48 hours post-treatment. We
performed a TUNEL assay using BrdUTP and cleaved caspase-3 fluorescent immunocytochemistry,
followed by flow cytometry analysis. However, during this assay, we encountered complications in
pellet formation after centrifugation of the samples, causing cell loss in many treated samples.
Furthermore, we were not able to visualize clearly separated cellular populations of living and
apoptotic cells, questioning the quality of the staining protocol (Supplemental Figure 11).
4. DNA DAMAGE: DOUBLE STRAND BREAKS
DNA damage is intrinsic to cells and is aggravated by genotoxic events such as exposure to
ionizing radiation and oxidative stress. Cells are able to sense and react on damaged DNA through
activation of the DDR pathway, causing cell cycle arrest, allowing cells to repair the damaged DNA.
Repair proteins rapidly assemble around the damaged sites. γH2AX and 53BP1 are often used as
markers representing sites of DSBs, which can be detected as foci. Preliminary data showed that
rat thyroid FRTL5 cells exhibited resistance to DNA damage following high-dose irradiation and
iodine deprivation. Therefore, in order to evaluate the extent of DNA damage and the subsequent
Catalase
0 G
y
0.0
5 G
y
0.1
Gy
0.5
Gy
3 G
y
0 .0
0 .5
1 .0
1 .5
2 .0Iodine
Iodine deficiency
Radiat ion dose
Fo
ld c
ha
ng
e

22
DNA repair kinetics, a fluorescent immunocytochemistry double staining was performed, targeting
γH2AX and 53BP1 foci in rat thyroid PCCL3 cells that were iodine deprived for 30 min, 1 hour, 4
hours or 24 hours and were irradiated with low, intermediate or high irradiation doses
(Supplemental Figure 12). The mean number of γH2AX and 53BP1 foci per nucleus was
calculated for at least 250 cells per biological replicate in each condition (Figure 5 and Figure 6).
H2AX phosphorylation appears immediately after irradiation, typically reaching its maximal
number of γH2AX foci around 10-30 minutes post-irradiation, after which it continuously decreases
up to 24 hours. This specific trend is observed in both iodine-sufficient and iodine-deficient cells
exposed to sham-irradiation, 0.5 Gy and 3 Gy. In contrast, PCCL3 cells that were exposed to low
irradiation doses (0.05 Gy and 0.1 Gy) showed a continuous increase in the number of γH2AX foci
over time. When comparing iodine-sufficient, sham-irradiated control cells to the corresponding
irradiated cells, we observed a significantly increased number of γH2AX foci after exposure to
intermediate and high irradiation doses (0.5 Gy and 3 Gy) at all measured time points. This also
counts for iodine-deficient conditions, except for the 3 Gy-irradiated, iodine-deficient cells at 24
hours after the co-treatment, in which the cells showed a strong DNA repair and thus no longer
significantly differentiated in the amount of γH2AX foci from the control cells at this specific time
point. Unexpectedly, PCCL3 cells that were exposed to low-dose irradiation (0.05 Gy and 0.1 Gy)
showed significantly less γH2AX foci compared to the control cells at the early time point of 30
minutes after the co-treatment up to approximately 4 hours. This also counts for both iodine-
sufficient and iodine-deficient conditions. However, at 24 hours post-irradiation and ID, the low-
dose irradiated cells accumulated significantly more γH2AX foci than the corresponding control cells
due to their continuously increasing trend over time (Figure 5A and B, Table 3A). When
comparing between iodine-sufficient and iodine-deficient thyroid cells per radiation dose, they
clearly follow the same trend over time with only significantly more γH2AX foci under iodine-
deficient conditions in sham-irradiated control cells at 24 hours post-treatment (Figure 5C;
P=0.005), in 0.1 Gy-irradiated cells at 4 hours and 24 hours (Figure 5E; P<0.001 and P=0.04
respectively) and in 3 Gy-irradiated cells at 30 minutes (Figure 5G; P=0.022). There were
significantly more γH2AX foci under iodine-sufficient conditions in 0.5 Gy-irradiated (Figure 5F;
P=0.011) and 3 Gy-irradiated cells (Figure 5G; P<0.001 ) respectively at 1 hour and 4 hour post-
treatment.
Kinetically, the appearance of 53BP1 foci and their hyper-phosphorylation occur later than the
appearance of γH2AX foci, since 53BP1 first need to be recruited to the sites of DNA damage in
contrast to H2AX, which is already present at the DSBs. In our results, there is no significant
difference in the number of 53BP1 foci between sham-irradiated control cells and cells exposed to
0.05 Gy. This counts for both iodine-sufficient and iodine-deficient conditions, except for a small
significant higher number of 53BP1 foci in 0.05 Gy-irradiated iodine-deficient cells compared to the
corresponding control cells at 30 minutes post-ID and -irradiation (P=0.01). The control cells and
0.05 Gy-irradiated cells both exhibit their maximal number of 53BP1 foci after 30 minutes post-ID
and –irradiation after which it continuously decreases over time. This is in contrast to the cells
exposed to higher irradiation doses from 0.1 Gy up to 3 Gy, reaching their peak of 53BP1 foci

23
between 1 hour and 4 hours after ID and irradiation. More specifically, iodine-sufficient cells
exposed to 0.1 Gy started to significantly differ from the sham-irradiated control cells in their
number of 53BP1 foci at 1 hour post-irradiation, reaching their peak at this time point. Then, their
number of 53BP1 foci continuously decreased up to 24 hours post-irradiation and thus no longer
significantly differentiated from the control cells. Their counterparts, the iodine-deficient, 0.1 Gy-
irradiated cells also started to significantly differ from the sham-irradiated control cells in their
number of 53BP1 foci after 1 hour post-ID and -irradiation, but reached their peak at 4 hours
instead of 1 hour. In case of the 0.5Gy-irradiated cells, the number of 53BP1 foci was already
significantly higher compared to the 53BP1 foci in the sham-irradiated control cells at 30 minutes
post-treatment in both iodine-deficient and iodine-sufficient conditions. Both cell groups reached
their peak in 53BP1 foci at 1 hour post-treatment, after which the number of 53BP1 foci decreases
over time up to 24 hours, but still remains significantly higher compared to the control cells at 4
hours post-treatment. 24 hours post-treatment, the number of 53BP1 foci in the 0.5 Gy-irradiated
iodine-sufficient cells no longer significantly differentiated from the number of 53BP1 foci in the
control cells, in contrast to the iodine-deficient cells which still exhibited a small significant increase
in 53BP1 foci compared to the control cells (P=0.035). Finally, in case of the 3 Gy-irradiated cells,
the number of 53BP1 foci started to significantly differ from the sham-irradiated control cells at 1
hour post-treatment, but reaches their peak at 4 hours post-treatment in both iodine-sufficient and
iodine-deficient conditions. After 4 hours, the number of 53BP1 foci strongly decreased up to 24
hours post-treatment in both conditions, but was still significantly higher compared to the number
of 53BP1 foci in the control cells (Figure 6A and B, and Table 3B). When comparing the
differences between iodine-sufficient and iodine-deficient cells per radiation dose, they follow the
same trend over time (Figure 6C, D, G) with only significantly more 53BP1 foci in iodine-deficient,
0.1 Gy-irradiated cells at 4 hours post-treatment (Figure 6E; P<0.001) and in iodine-sufficient 0.5
Gy-irradiated cells at 1 hour post-treatment (Figure 6F; P=0.003).
Taken together, these results suggest that exposure of thyroid cells to low irradiation doses of
only 0.05 Gy and 0.1 Gy result in a slower induction of γH2AX foci compared to exposure to
intermediate and high irradiation doses (0.5 Gy and 3 Gy) which reach their maximum number of
γH2AX foci at 30 minutes or even earlier post-irradiation, suggesting a reduced efficiency of the
DDR system after low-dose radiation exposure. This could also indicate that phosphorylation of
H2AX is not robust enough to trigger DDR activation and initiate subsequent DNA repair, which
could explain the continuous increase in γH2AX foci over time after low-dose radiation exposure in
contrast to the strong disappearance of foci at 24 hours after intermediate- and high-dose radiation
exposure. The reason for the high baseline presence of γH2AX foci and the DNA repair at 24 hours
in sham-irradiated cells is not clear. Furthermore, low-dose irradiation with 0.05 Gy does not
trigger the late 53BP1 recruitment to DSBs and its hyper-phosphorylation compared to sham-
irradiated control cells, even though γH2AX foci are increasingly induced over time. This effect can
be observed starting from a low-dose irradiation with 0.1 Gy upto 3 Gy. Finally, there are no major
differences observed between iodine-sufficient and iodine-deficient conditions in the extent of DNA
damage and their subsequent DNA repair kinetics.

24
3 0 m in 1 h 4 h 2 4 h0
5
1 0
1 5
Tim e after irradiat ion
Me
an
nu
mb
er o
f s
po
ts p
er n
uc
leu
s
yH2AX I odine
0.05 Gy
0.1 Gy
0 Gy
0.5 Gy
3 Gy
3 0 m in 1 h 4 h 2 4 h0
5
10
15
Tim e after irradiat ion and iodine deficiency
Me
an
nu
mb
er o
f s
po
ts p
er n
uc
leu
s
yH2 AX I odine deficiency
0.05 Gy
0.1 Gy
0 Gy
0.5 Gy
3 Gy
3 0 m in 1 h 4 h 2 4 h0
2
4
6
8
Tim e after irradiat ion and iodine deficiency
Me
an
nu
mb
er o
f s
po
ts p
er n
uc
leu
s
yH2AX: 0 Gy
0 Gy Iodine
0 Gy Iodine deficiency
**
3 0 m in 1 h 4 h 2 4 h0
2
4
6
8
Tim e after irradiat ion and iodine deficiency
Me
an
nu
mb
er o
f s
po
ts p
er n
uc
leu
s
yH2AX: 0 .05 Gy
0.05 Gy Iodine
0.05 Gy Iodine deficiency
3 0 m in 1 h 4 h 2 4 h0
2
4
6
8
1 0
Tim e after irradiat ion and iodine deficiency
Me
an
nu
mb
er o
f s
po
ts p
er n
uc
leu
s
yH2 AX: 0 .1 Gy
0.1 Gy Iodine
0.1 Gy Iodine deficiency
*** *
3 0 m in 1 h 4 h 2 4 h0
5
1 0
1 5
Tim e after irradiat ion and iodine deficiency
Me
an
nu
mb
er o
f s
po
ts p
er n
uc
leu
s
yH2 AX: 0 .5 Gy
0.5 Gy Iodine
0.5 Gy Iodine deficiency
*
3 0 m in 1 h 4 h 2 4 h0
5
1 0
1 5
Tim e after irradiat ion and iodine deficiency
Me
an
nu
mb
er o
f s
po
ts p
er n
uc
leu
s
yH2AX: 3 Gy
3 Gy Iodine
3 Gy Iodine deficiency
* ***
A
B
C D E
F G
Figure 5: Intermediate and high irradiation doses induce double strand breaks leading to γH2AX foci in iodine-sufficient and iodine-deficient PCCL3 cells with a maximal
number at 30 min post-irradiation and ID, and decreasing over time with a minimal number at 24 hours post-irradiation and ID. This is in contrast to exposure to low
irradiation doses of 0.05 Gy and 0.1 Gy, increasing in γH2AX foci over time. γH2AX foci were detected using immunocytochemistry staining of PCCL3 cells that were iodine deprived
for 30 min, 1hour, 4 hours and 24 hours and irradiated with low, intermediate and high radiation doses. Results are expressed as mean number of foci per nucleus at each time point in
iodine-sufficient conditions (A) and iodine-deficient conditions (B) ± standard deviation (SD) of three biological replicates (n=3) from 1 representative experiment. Furthermore, the
differences between iodine-sufficient and iodine-deficient conditions per radiation dose is visualized for 0 Gy (C), 0.05 Gy (D), 0.1 Gy (E), 0.5 Gy (F) and 3 Gy (G). Per biological replicate of
each condition, at least 250 nuclei were investigated.

25
3 0 m in 1 h 4 h 2 4 h0
2
4
6
Tim e after irradiat ion
Me
an
nu
mb
er o
f s
po
ts p
er n
uc
leu
s
5 3BP1 I odine
0 Gy
0.05 Gy
0.1 Gy
0.5 Gy
3 Gy
3 0 m in 1 h 4 h 2 4 h0
2
4
6
Tim e after irradiat ion and iodine deficiency
Me
an
nu
mb
er o
f s
po
ts p
er n
uc
leu
s
5 3BP1 I odine deficiency
0 Gy
0.05 Gy
0.1 Gy
0.5 Gy
3 Gy
3 0 m in 1 h 4 h 2 4 h0
1
2
3
4
Tim e after irradiat ion and iodine deficiency
Me
an
nu
mb
er o
f s
po
ts p
er n
uc
leu
s
5 3BP1: 0 Gy
Iodine
Iodine deficiency
3 0 m in 1 h 4 h 2 4 h0
1
2
3
4
Tim e after irradiat ion and iodine deficiency
Me
an
nu
mb
er o
f s
po
ts p
er n
uc
leu
s
5 3BP1: 0 .05 Gy
Iodine
Iodine deficiency
3 0 m in 1 h 4 h 2 4 h0
1
2
3
4
Tim e after irradiat ion and iodine deficiency
Me
an
nu
mb
er o
f s
po
ts p
er n
uc
leu
s
5 3BP1: 0 .1 Gy
Iodine
Iodine deficiency
***
3 0 m in 1 h 4 h 2 4 h0
2
4
6
Tim e after irradiat ion and iodine deficiency
Me
an
nu
mb
er o
f s
po
ts p
er n
uc
leu
s
5 3 BP1 : 0 .5 Gy
Iodine
Iodine deficiency
**
3 0 m in 1 h 4 h 2 4 h0
2
4
6
Tim e after irradiat ion and iodine deficiency
Me
an
nu
mb
er o
f s
po
ts p
er n
uc
leu
s
5 3BP1: 3 Gy
Iodine
Iodine deficiency
A
B
C D E
F G
Figure 6: Intermediate and high irradiation doses induce double strand breaks leading to 53BP1 foci in iodine-sufficient and iodine-deficient PCCL3 cells with a maximal
number between 30 minutes and 4 hours post-irradiation and ID, and with a minimal number after 24 hours. 53BP1 foci were detected using immunocytochemistry staining of
PCCL3 cells that were iodine deprived for 30 min, 1hour, 4 hours and 24 hours and irradiated with low, intermediate and high radiation doses. Results are expressed as mean number of foci
per nucleus at each time point in iodine-sufficient conditions (A) and iodine-deficient conditions (B) ± standard deviation (SD) of three biological replicates (n=3) from 1 representative
experiment. Furthermore, the differences between iodine-sufficient and iodine-deficient conditions per radiation dose is visualized for 0 Gy (C), 0.05 Gy (D), 0.1 Gy (E), 0.5 Gy (F) and 3 Gy
(G). Per biological replicate of each condition, at least 250 nuclei were investigated.

26
Table 3: Table of significance of the γH2AX (A) and 53BP1 (B) immunostaining in iodine-sufficient and iodine-deficient PCCL3 cells at 30 min, 1 hour, 4
hours or 24 hours after iodine deficiency and ionizing radiation, comparing the different radiation doses to sham-irradiated control cells.
Comparison tests γH2AX: Iodine γH2AX: Iodine deficiency
30 min Significance P-value Significance P-value
0 Gy vs. 0.05 Gy *** <,001 *** <,001
0 Gy vs. 0.1 Gy *** <,001 *** <,001
0 Gy vs. 0.5 Gy *** <,001 *** <,001
0 Gy vs. 3 Gy *** <,001 *** <,001
1h
0 Gy vs. 0.05 Gy *** <,001 *** <,001
0 Gy vs. 0.1 Gy * 0,011 *** <,001
0 Gy vs. 0.5 Gy *** <,001 *** <,001
0 Gy vs. 3 Gy *** <,001 *** <,001
4h
0 Gy vs. 0.05 Gy *** <,001 *** <,001
0 Gy vs. 0.1 Gy ns >,999 *** <,001
0 Gy vs. 0.5 Gy ** 0,006 *** <,001
0 Gy vs. 3 Gy *** <,001 *** <,001
24h
0 Gy vs. 0.05 Gy *** <,001 *** <,001
0 Gy vs. 0.1 Gy *** <,001 *** <,001
0 Gy vs. 0.5 Gy *** <,001 *** <,001
0 Gy vs. 3 Gy * 0,019 ns 0,092
Comparison tests 53BP1: Iodine 53BP1: Iodine deficiency
30 min Significance P-value Significance P-value
0 Gy vs. 0.05 Gy ns 0,91 * 0,01
0 Gy vs. 0.1 Gy ns >,999 ns 0,676
0 Gy vs. 0.5 Gy *** <,001 *** <,001
0 Gy vs. 3 Gy ns 0,282 ns 0,457
1h
0 Gy vs. 0.05 Gy ns >,999 ns >,999
0 Gy vs. 0.1 Gy *** <,001 *** <,001
0 Gy vs. 0.5 Gy *** <,001 *** <,001
0 Gy vs. 3 Gy *** <,001 *** <,001
4h
0 Gy vs. 0.05 Gy ns >,999 ns >,999
0 Gy vs. 0.1 Gy ns 0,16 *** <,001
0 Gy vs. 0.5 Gy *** <,001 *** <,001
0 Gy vs. 3 Gy *** <,001 *** <,001
24h
0 Gy vs. 0.05 Gy ns >,999 ns 0,14
0 Gy vs. 0.1 Gy ns >,999 ** 0,009
0 Gy vs. 0.5 Gy ns >,999 * 0,011
0 Gy vs. 3 Gy * 0,035 *** <,001
A B

27
5. CELL CYCLE ANALYSIS
To investigate the effects of IR and ID on the cell cycle distribution of the thyroid cells, non-
cancerous rat PCCL3 cells were cultured in an iodine-sufficient or iodine-deficient state for 6, 24 or
48 hours and exposed to low, intermediate or high radiation doses. To determine the percentages
of cells in each phase of the cell cycle, a BrdU/7-AAD staining assay was performed
(Supplemental Figure 13).
Six hours after irradiation and ID, the amount of non-irradiated and 0.05 Gy-irradiated, iodine-
sufficient cells in the G0/G1 phase was significantly higher compared to the amount of 3 Gy-
irradiated, iodine-sufficient cells in the G0/G1 phase (respectively P=0.005 and P=0.024). There
were no significant differences observed in the amount of cells in all phases of the cell cycle
between the different radiation doses for both iodine-sufficient and iodine-deficient conditions.
Furthermore, there were no significant differences detected between iodine-sufficient and iodine-
deficient cells (Figure 7A).
24 hours after irradiation and ID, there is a significant increase in the amount of iodine-
sufficient cells in the G0/G1 phase after irradiation with a radiation dose of 3 Gy, compared to
lower radiation doses. The same counts for iodine-deficient cells (Table 4, G0/G1 phase).
However, the percentage of iodine-deficient cells in the G0/G1 phase is significantly lower
compared to the percentage of iodine-sufficient cells in the G0/G1 phase for all radiation doses
except for the non-irradiated control cells (P<0.001) (Figure 7B). The amount of iodine-sufficient
cells in the G2/M phase significantly decreased after irradiation with a radiation dose of 3 Gy,
compared to lower radiation doses. In contrast, this change is less pronounced in iodine-deficient
conditions, only significant comparing 3 Gy to 0.1 Gy, and 0 Gy to 0.1 Gy (Table 4, G2/M
phase). Furthermore, the amount of iodine-deficient cells in the G2/M phase is significantly higher
compared to the amount of iodine-sufficient cells in the G2/M phase after irradiation with radiation
doses of 0.1 Gy (P=0.003) and 3 Gy (P<0.001) (Figure 7B). Finally, the percentage of iodine-
sufficient cells in the S phase started to significantly decrease after irradiation with a radiation dose
of 0.5 Gy compared to non-irradiated and 0.1 Gy-irradiated, iodine-sufficient cells. This change was
most pronounced after irradiation with 3 Gy, compared to lower irradiation doses. The latter counts
for iodine-deficient cells as well (Table 4, S phase). However, the amount of iodine-deficient cells
in S phase is higher compared to iodine-sufficient cells for each radiation dose, with a significant
difference at 0.05 Gy (P=0.002) and 0.5 Gy (P<0.001) (Figure 7B).
48 hours after irradiation and ID, there are no longer significant differences observed between
iodine-sufficient and iodine-deficient cells (Figure 7C). On the other hand, there is still a small
significant decrease in the amount of iodine-sufficient cells in the S phase after irradiation with a
radiation dose of 3 Gy, compared to lower irradiation doses (0 Gy P=0.01; 0.05 Gy P=0.05; and
0.1 Gy P=0.035). Furthermore, the percentage of iodine-sufficient cells in the G0/G1 phase is still
significantly increased after irradiation with 3 Gy compared to sham-irradiated (P=0.019) and 0.1
Gy-irradiated (P=0.047), iodine-sufficient cells. For iodine-deficient cells, there is only a significant
decrease in the amount of cells in the S-phase after irradiation with 3 Gy compared to sham-
irradiated cells (P=0.041).

28
Taken together, these results suggest that the cell cycle of PCCL3 cells do not yet change 6
hours after ID and irradiation, even after exposure to high radiation doses. However, the response
on these applied stress factors can be detected 24 hours after ID and irradiation. Irradiation with 3
Gy leads to a significant G0/G1 cell cycle arrest in both iodine-sufficient and iodine-deficient cells
compared to lower irradiation doses, most likely to repair the DNA damage caused by IR and the
generated oxidative stress. Iodine-deficient PCCL3 cells still appear to be less sensitive for this
G0/G1 cell cycle arrest even at low irradiation doses and are also more proliferating compared to
iodine-sufficient cells. This could represent a stress-response in iodine-deficient cells with subtle
changes in their proliferation pathways, which could be triggered by the enhanced ROS production
of the co-treatment, with ID as a promoting factor enhancing the effects of IR. This could promote
the mutation rate and subsequent pre-cancerous transformation when genetic lesions are not
repaired in proliferating iodine-deficient thyroid cells. However, 48 hours after ID and irradiation,
the cell cycle profile of iodine-deficient cells no longer significantly differentiates from iodine-
sufficient cells. Only following irradiation with 3 Gy, there was still a small significant decrease in
the amount of iodine-sufficient and iodine-deficient cells in the S-phase and G0/G1 phase
compared to sham-irradiated control cells. This indicates that thyroid cells are able to restore their
cell cycle profile to normal conditions 48 hours after ID and irradiation, regardless of their iodine
state.

29
Figure 7: Six hours after irradiation
combined with iodine deficiency, the
cell cycle of iodine-deficient and iodine-
sufficient PCCL3 cells are not altered
compared to the control cells. After 24
hours, the cell cycle of iodine-deficient
PCCL3 cells altered compared to iodine-
sufficient PCCL3 cells, but no longer
differentiated after 48 hours. Cell cycle
analysis was performed with a BrdU/7-AAD
assay on PCCL3 cells that were iodine
deprived for 6 hours (A), 24 hours (B) or
48 hours (C) and irradiated with low,
intermediate or high radiation doses.
Results are expressed as the mean
percentage of cells of the total cell
population ± SD of three biological
replicates from 1 representative
experiment. The cell cycle analysis 6 hours
and 24 hours after IR and ID were
performed in parallel. The cell cycle analysis
48 hours after IR and ID was performed as
a separate experiment, causing technical
variation compared to the 6h and 24h
experiments.
24 h after irradiat ion and iodine deficiency
0 Gy 0 .0 5 Gy 0 .1 Gy 0 .5 Gy 3 Gy0
5 0
1 0 0
1 5 0
% o
f t
he
po
pu
latio
n
G0/G1 iodine
G2/M iodine
S iodine
G0/G1 iodine deficiency
G2/M iodine deficiency
S iodine deficiency
****** *** ***
** ***
** ***
Radiat ion dose
0 Gy 0 .0 5 Gy 0 .1 Gy 0 .5 Gy 3 Gy0
5 0
1 0 0
1 5 0
Radiat ion dose
% o
f th
e p
op
ula
tio
n
4 8 h after irradiat ion and iodine deficiency
G0/G1 iodine
G2/M iodine
S iodine
G0/G1 iodine deficiency
G2/M iodine deficiency
S iodine deficiency
*
*
*
*
*
*
A
B
C
0 Gy 0 .0 5 Gy 0 .1 Gy 0 .5 Gy 3 Gy0
5 0
1 0 0
1 5 0
% o
f th
e p
op
ula
tio
n
G0/G1 Iodine Deficiency
G2/M Iodine Deficiency
S Iodine Deficiency
G0/G1 Iodine
G2/M Iodine
S Iodine
**
6h after irradiat ion and iodine deficiency
Radiat ion dose
*
48 h after irradiat ion and iodine deficiency
0 Gy 0 .0 5 Gy 0 .1 Gy 0 .5 Gy 3 Gy0
5 0
1 0 0
1 5 0
Radiat ion dose
% o
f t
he
po
pu
latio
n
G0/G1 iodine
G2/M iodine
S iodine
G0/G1 iodine deficiency
G2/M iodine deficiency
S iodine deficiency
*
*
*
*
*
*

30
Table 4: Table of significance of the cell cycle analysis, 24 hours after iodine deficiency and ionizing
radiation, comparing changes between the different radiation doses in iodine-sufficient and iodine-
deficient PCCL3 cells in the different cell cycle phases (G0/G1 phase, S phase, G2/M phase).
6. MODULATIONS IN SIGNALING PATHWAYS
6.1 THE NOS3/HIF-1Α/VEGF-A SIGNALING PATHWAY.
A previous study demonstrated that ID induces NOS3 activation through phosphorylation of
Ser1177 (maximal at 4 hours post-ID, but still significant at 6 hours post-ID), thereby increasing
NO synthesis and subsequent HIF-1α stabilization leading to VEGF-A release in PCCL3 cells. In an
attempt to reproduce these data and to examine a potential enhanced effect of IR and ID on NOS3
activation and HIF-1α stabilization due to increased ROS production, non-cancerous rat thyroid
PCCL3 cells were cultured in an iodine-sufficient or iodine-deficient state for 6 hours and exposed
to low, intermediate or high radiation doses. Subsequently, protein expressions of NOS3, Ser1177-
phosphorylated NOS3 and HIF-1α were analyzed by Western blot (Figure 8).
Bands were detected at approximately ≈140 kDa and ≈70 kDa for (pSer1177) NOS3 protein
expression and around ≈120 kDa and ≈80 kDa for HIF-1α protein expression (Supplemental
Figure 10A and B). For the (pSer1177) NOS3 protein, the expected band size is ≈140 kDa. For
the HIF-1α protein, the expected band size is ≈120 kDa. According to our results, neither ID nor IR
or a combined treatment induced a significantly increased activation of NOS3 (Figure 8A) and
stabilization of HIF-1α (Figure 8B) compared to the sham-irradiated, iodine-sufficient thyroid
cells. So, despite the same rat cell line used under the same culture conditions, we were not able
to reproduce the results from the previous study. Since high standard deviations (SD) occur at n =
3 for each condition, it is difficult to detect a potential small, true effect. Reconsidering optimization
of the Western blot protocol and including more biological replicates could reduce the SD values of
the observed results and could increase the reproducibility of the experiment.
G0/G1 phase S phase G2/M phase
Dose
(Gy)
I P-value ID P-value I P-value ID P-value I P-value ID P-value
0 - 0.05 Ns >0.999 Ns 0.475 Ns >0.999 Ns >0.999 Ns >0.999 Ns 0.398
0 - 0.1 Ns >0.999 Ns 0.117 Ns >0.999 Ns >0.999 Ns >0.999 * 0.024
0 - 0.5 Ns 0.160 Ns >0.999 ** 0.005 Ns >0.999 Ns >0.999 Ns >0.999
0 - 3 *** <0.001 *** <0.001 *** <0.001 *** <0.001 *** <0.001 Ns >0.999
0.05 - 0.1 Ns >0.999 Ns >0.999 Ns 0.635 Ns >0.999 Ns >0.999 Ns >0.999
0.05 - 0.5 Ns 0.513 Ns >0.999 Ns 0.082 Ns >0.999 Ns >0.999 Ns >0.999
0.05 - 3 *** <0.001 *** <0.001 *** <0.001 *** <0.001 *** <0.001 Ns 0.530
0.1 - 0.5 * 0.028 Ns >0.999 *** <0.001 Ns >0.999 Ns >0.999 Ns 0.214
0.1 - 3 *** <0.001 *** <0.001 *** <0.001 *** <0.001 *** <0.001 * 0.033
0.5 - 3 *** <0.001 *** <0.001 *** <0.001 *** <0.001 *** <0.001 Ns >0.999

31
pNOS-3 / N OS-3
0 G
y
0.0
5 G
y
0.1
Gy
0.5
Gy
3 G
y
0 .0
0 .5
1 .0
1 .5
2 .0
2 .5Iodine
Iodine deficiency
Radiat ion dose
Fo
ld c
ha
ng
e
HI F-1 a
0 G
y
0.0
5 G
y
0.1
Gy
0.5
Gy
3 G
y
0.0
0.5
1.0
1.5
2.0Iodine
Iodine deficiency
Radiat ion dose
Fo
ld c
ha
ng
e
HI F-1 a
0 G
y
0.0
5 G
y
0.1
Gy
0.5
Gy
3 G
y
0 .0
0 .5
1 .0
1 .5
2 .0Iodine
Iodine deficiency
Radiat ion dose
Fo
ld c
ha
ng
e
HI F-1 a
0 G
y
0.0
5 G
y
0.1
Gy
0.5
Gy
3 G
y
0 .0
0 .5
1 .0
1 .5
2 .0Iodine
Iodine deficiency
Radiat ion dose
Fo
ld c
ha
ng
e
HI F-1 a
0 G
y
0.0
5 G
y
0.1
Gy
0.5
Gy
3 G
y
0 .0
0 .5
1 .0
1 .5
2 .0Iodine
Iodine deficiency
Radiat ion dose
Fo
ld c
ha
ng
e
Figure 8: ID, IR or a combined
treatment did not significantly changes
NOS3 activation and HIF-1α
stabilization compared to sham-
irradiated, iodine-sufficient PCCL3
cells. NOS3 and pSer1177 NOS3 expression
(A) and HIF-1α expression (B) were
analyzed by Western blotting in PCCL3 cells
that were iodine deprived for 6 hours and
irradiated with low, intermediate or high
radiation doses. Densitometric values were
normalized against ß-actin. Furthermore,
pSer1177 NOS3 protein expression was
normalized against total NOS3 protein
levels. Results are expressed as the mean
fold change relative to non-irradiation,
iodine-sufficient thyroid cells ± standard
deviation (SD) of 3 biological replicates
(n=3) from 1 representative experiment
.
pNOS-3 / N OS-3
0 G
y
0.0
5 G
y
0.1
Gy
0.5
Gy
3 G
y
0 .0
0 .5
1 .0
1 .5
2 .0
2 .5Iodine
Iodine deficiency
Radiat ion dose
Fo
ld c
ha
ng
eA
B

32
6.2 CELLULAR PROLIFERATION AND SURVIVAL.
It has been reported that oxidative stress and DNA damage alters signaling pathways involved
in cellular proliferation and survival. IR can directly damage DNA but more frequently acts
indirectly through the production of ROS, along with ID in thyroid cells. To examine changes in
proliferation and survival pathways upon ID and IR, non-cancerous rat thyroid PCCL3 cells were
cultured in an iodine-sufficient or iodine-deficient state for 6 hours and exposed to low,
intermediate or high radiation doses. Subsequently, protein expression of AKT1, pThr308 AKT1,
STAT3, pY705 STAT3 and NFκB p52 were analyzed using Western blot (Figure 9).
Bands were detected at approximately 55 kDa and 62 kDa for AKT1, at 62 kDa for pThr308
AKT1 (Supplemental Figure 10D), at 86 kDa and 91 kDa for STAT3, at 86 kDa and 160 kDa for
pY705 STAT3 (Supplemental Figure 10F) and at 52 kDa for NFkB p52 protein expression
(Supplemental Figure 10E). The predicted band size of (pThr308) AKT1 is 62 kDa. Finally, the
predicted band size for NFkB p52 protein expression is 52 kDa which we specifically visualised.
There were no significant changes observed in the expression and phosphorylated Thr308
activation of AKT1 upon irradiation or induced ID (Figure 9A). The same counts for NFkB p52
protein expression (Figure 9B). Consequently, there was no enhanced effect observed after
combined treatment with ID and IR. These results are consistent with preliminary data on rat
FRTL5 cells. However, STAT3 and activated pY705 STAT3 were significantly increased after
irradiation with a radiation dose of 3 Gy in FRTL5 cells. Furthermore, there was a significant
enhanced effect of combined treatment with IR and ID at 3 Gy. This is in contrast with our results
in PCCL3 cells, in which there was no significant change observed in STAT3 and pY705 STAT3
protein expression after irradiation, even with high radiation doses, and induction of ID (Figure
9C). These results indicate that PCCL3 cells and FRTL5 cells are different in their molecular
responses on the induction of stress, suggesting that PCCL3 cells are more resistant to changes in
their signaling pathways, even at high doses of IR.
There are relatively high standard deviations observed at n=3 for each condition. This could
mask small but true significant effects of IR, ID or a potential enhanced effect of IR and ID on the
protein expression of (pThr308)AKT1, NFκB p52 and especially (pY705)STAT3. Reconsidering
optimization of the Western blot protocol and including more biological replicates could reduce the
SD values of the observed results and could increase the reproducibility and in particular the
comparability of the experiment with preliminary data on FRTL5 cells.

33
pAKT-1 / AKT-1
0 G
y
0.0
5 G
y
0.1
Gy
0.5
Gy
3 G
y
0
1
2
3
4Iodine
Iodine deficiency
Radiat ion dose
Fo
ld c
ha
ng
e
pStat -3 / Stat-3
0 G
y
0.0
5 G
y
0.1
Gy
0.5
Gy
3 G
y
0 .0
0 .5
1 .0
1 .5
2 .0Iodine
Iodine deficiency
Radiat ion dose
Fo
ld c
ha
ng
e
NFkB p52
0 G
y
0.0
5 G
y
0.1
Gy
0.5
Gy
3 G
y
0 .0
0 .5
1 .0
1 .5
2 .0Iodine
Iodine deficiency
Radiat ion dose
Fo
ld c
ha
ng
eFigure 9: ID, IR or a combined
treatment did not alter signaling
pathways involved in cellular
proliferation and survival. AKT1 and
pThr308 AKT1 (A) STAT3 and pY705
STAT3 (B) and NFB p52 protein expressions
(C) were analyzed by Western blotting in
PCCL3 cells that were iodine deprived for 6
hours and irradiated with low, intermediate
or high radiation doses. Densitometric
values were normalized against ß-actin.
Furthermore, pThr308 AKT1 and pY705
STAT3 protein expressions were normalized
against total AKT1 and STAT3 protein levels
respectively. Results are expressed as the
mean fold change relative to non-
irradiation, iodine-sufficient thyroid cells ±
standard deviation (SD) of 3 biological
replicates (n=3) from 1 representative
experiment.
A
B
C
pAKT-1 / AKT-1
0 G
y
0.0
5 G
y
0.1
Gy
0.5
Gy
3 G
y
0
1
2
3
4Iodine
Iodine deficiency
Radiat ion dose
Fo
ld c
ha
ng
e

34

35
DISCUSSION AND OUTLOOK
Nowadays, the general population is increasingly exposed to IR originating from natural and
human-made sources. The latter can range from nuclear power generation to medical uses of
radiation for diagnosis or treatment, which is the most common human-made source of IR,
representing 20% of the total population exposure (111). Post-Chernobyl epidemiological studies
appointed IR as high-risk factor for thyroid cancer at doses above 100 mSv. On the other hand, an
inadequate supply of iodine, an important element for normal thyroid functioning and thyroid
hormone synthesis, affects more than two billion individuals worldwide. It is not only the main
cause of some thyroid abnormalities such as goitrogenesis, but it is also a potential risk factor for
thyroid cancer development (70). There is still little knowledge about the combined effect of ID and
IR exposure on thyroid cells, especially when considering exposure to low-dose IR, which is of
major concern for the general public and for the research community. Therefore, our research
group at SCKCEN investigated the molecular effects of a combined treatment with iodine
deprivation and X-ray exposure to low, intermediate and high radiation doses on rat thyroid cells.
Preliminary research was performed on the FRTL5 thyroid cell line, while in this project the PCCL3
thyroid cell line is used to validate and compare results with preliminary data.
Ionizing radiation is well known for its genotoxic effects on biological systems due to their
direct interaction and damage to DNA molecules, but more frequently due to water radiolysis
leading to ROS production and subsequent damage to cellular biomolecules, including DNA. In
addition, previous studies demonstrated that ID triggers VEGF-A secretion from thyroid cells, which
also involves intracellular production of ROS (70). Here, we showed that iodine-deficient PCCL3
cells irradiated with 0.5 Gy up to 3 Gy resulted in an enhanced ROS production 24 hours post-
treatment, compared to the irradiated, iodine-sufficient PCCL3 cells. These results suggest that
PCCL3 cells irradiated with intermediate and high radiation doses are stressed to a certain extent,
which makes them unable to cope with the additional oxidative stress originating from ID, leading
to a higher accumulation of ROS compared to irradiated PCCL3 cells cultured in the presence of
iodine. In preliminary data, there was also a significantly increased ROS production observed in
iodine-deficient FRTL5 cells exposed to a high irradiation dose of 3 Gy compared to the
corresponding iodine-sufficient cells. This is an interesting observation since extensive oxidative
stress in the thyroid is related to several thyroid abnormalities such as hyperthyroidism,
hypothyroidism, thyroiditis and also thyroid cancer.
Although we were unable to observe significant differences in catalase protein expression
between iodine-sufficient and iodine-deficient PCCL3 cells, a two-way Anova statistical analysis
showed that the iodine state of PCCL3 cells had a significant overall effect on the response we
observed. However, post-hoc testing could not indicate a defined significance between groups,
probably due to lack of power. A higher number of biological replicates could increase the power of
the Western blot analysis, which then could result in a more defined indication of significance
between groups. Since catalase has a tetrameric conformation consisting of four 60 kDa
monomers, each containing a porphyrin heme group under physiological conditions, the additional

36
120 kDa protein band that we detected could correspond to a catalase dimer of two subunits.
Catalase is an antioxidant enzyme known for its detoxification of H2O2. Under adequate iodine
supply, iodide is oxidized in thyroid cells by TPO using H2O2 as a substrate during the process of
thyroid hormone synthesis. However, when thyroid cells are iodine deprived, this detoxification
process of H2O2 is diminished, leading to H2O2 accumulation. Therefore, it could be possible that
thyroid cells respond by adjusting their catalase protein expression as a compensatory mechanism.
This antioxidant defense topic could be further investigated by examining other antioxidant
proteins such as the selenoproteins glutathione peroxidases and thioredoxin reductase. Nadolnik,
et al., and Valentyukevich, et al. demonstrated that the thyroid gland was characterized by low
activities of catalase and superoxide dismutase, while there was a considerable high concentration
of reduced glutathione and a high enzymatic activity of glutathione peroxidase and glutathione
reductase (112, 113). Furthermore, there is no thyroid phenotype associated to acatalasemia,
while selenium deficiency leads to increased ROS production and even thyroidal damage. As
selenium is required for glutathione peroxidase and thioredoxin enzyme activity, it is suggested
that these enzymes play a significant role in thyroidal antioxidant defense mechanisms (114). On
the other hand, C. Massart, et al. and Ulla Bjijrkman, et al. showed that catalase represents a
major H2O2-detoxification pathway in respectively PCCL3 and FRTL5 cells exposed to high
concentrations of H2O2 (115, 116). Taken together, these data suggest that the glutathione
peroxidase defense system plays a major role at physiological levels of H2O2, while catalase, which
has a much higher Km and Vmax, is more important to detoxify large and toxic levels of H2O2 (114).
Another possibility to investigate is peroxiredoxin 5 (PRDX5), which is also expressed in high levels
in the thyroid gland and is up-regulated in Graves’ disease, a disease associated with the release of
large amounts of ROS (117).
The generation of H2O2 in stimulated PCCL3 cells is approximately 6 nmol/10 minutes. In
activated human leukocytes around 17 nmol/10 minutes. However, activated leukocytes live a few
hours, while the life of thyroid cells in adults is 7 years. Thus, thyroid cells may be exposed to high
doses of H2O2. Hydrogen peroxide exerts the same cytotoxic effect on thyroid cells as on other cell
types (114). At concentrations higher than 0.05-0.1 mM, H2O2 is able to induce DNA DSBs in
PCCL3 cells and in human primary thyroid cells, demonstrated by N Driessens, et al. using Commet
assays and Western blot detection of γH2AX (118). Here, we measured the general ROS production
in PCCL3 cells and the induction of DNA DSBs at different time points post-treatment by
immunocytochemistry against γH2AX and 53BP1. We demonstrated that irradiation of PCCL3 cells
with intermediate and high radiation doses (0.5 Gy and 3 Gy) significantly increased the number of
γH2AX foci compared to sham-irradiated cells already at 30 minutes post-treatment, after which
the number of γH2AX foci decreased due to DNA repair up to 24 hours post-treatment. These are
normal γH2AX kinetics seen in literature (119-121). In contrast, after irradiation of PCCL3 cells
with 0.05 Gy and 0.1 Gy, we observed a continuous increase in γH2AX foci even up to 24 hours,
which is mostly not seen in literature. These data suggest that low-dose irradiated cells failed to
repair their DNA damage, which lead to accumulation of γH2AX foci. There are some research
groups, which also detect persistence of γH2AX foci after irradiation of cells with low radiation
doses. Saskia Grudzenski, et al. used human fibroblasts and showed that the kinetics of γH2AX foci
loss are substantially disturbed after an irradiation dose of 10 mGy and even failed to show any

37
foci loss after irradiation with 2.5 mGy. Furthermore, they performed an in vivo study and showed
efficient γH2AX and 53BP1 foci removal during 24 hours after irradiation of mice with 1 Gy, but
barely observed any γH2AX and 53BP1 foci loss after irradiation with 10 mGy (122). A possible
model to explain these findings is that irradiation with low radiation doses induce damage or a
stress level which is insufficient to allow an efficient activation of the DDR pathway and subsequent
DNA repair. For PCCL3 cells, this could correspond to a radiation dose in the range of 0.05 – 0.1 Gy
or lower inducing a mean foci number around 6-8 foci per nucleus at 24 hours post-treatment,
while irradiation with intermediate and high irradiation doses lead to a mean foci number of 10 foci
per nucleus already at 30 minutes post-treatment. This suggests that an acute induction of 10 foci
per nucleus post-irradiation could represent the threshold of DNA damage to activate the DDR
pathway. Interestingly, Saskia Grudzenski, et al. also demonstrated that cells irradiated with 10
mGy efficiently started to remove all γH2AX foci when the cells were exposed to an extra stress of
10 µM H2O2 (122). At these concentrations, H2O2 produces in particularly SSBs and base damages
but no DSBs. According to this, it would be the level of radiation damage other than DSBs or
cellular lesions, which determine whether or not efficient DNA repair occurs. In addition, they also
observed that one gene (Nek1) is up-regulated after high-dose irradiation, but not after low doses.
Interestingly, Nek1 appears to be involved in the DNA damage response after irradiation and loss
of function is associated with radiosensitivity and impaired DSB repair. The question how the repair
of DSBs is associated to the repair of SSB or base damage is interesting to investigate but is out of
the scope of this project. A possible explanation could be that the repair of DSBs needs end-
processing before ligation which involves factors that are also involved in the repair of SSB and
first have to be induced (122). The health risk estimates for low-dose IR is based on a linear
extrapolation of high-dose data, assuming a similar DNA repair capacity of IR damage after low
dose irradiation as after high dose irradiation. However, if low-dose irradiation leads to persistent
DSBs, this could lead to genomic instability promoting malignant transformation. In this case,
these data do not support the linear extrapolation assumption and even suggest that it is an
underestimation of the carcinogenic risks of low-dose IR. However, this is only of interest when
unrepaired DSBs are present in actively proliferating cells. Kai Rothkamn, et al. evaluated the
cellular consequences of persistent DSBs by irradiating human primary fibroblasts and then allowed
them to proliferate. They observed a similar level of γH2AX foci in the irradiated cells compared to
the non-irradiated cells, but detected substantially more micro-nucleated and apoptotic cells,
suggesting that the cells exhibiting persistent DSBs are eliminated from the culture. Therefore,
they speculated that the observed DSB persistence in low-dose irradiated cells does not increase
the carcinogenic risk of low-dose irradiation but rather represents a protective biological
mechanism by eliminating these cells. It could be more beneficial for a biological system to remove
the damaged cell and replace it by a healthy neighbor cell, instead of repairing the DSBs with the
risk of causing genomic instability (10). This model would be of interest when only a small fraction
of cells exhibit DSBs, so repair is only necessary at higher levels of damage, for example following
high-dose irradiation.
Strikingly, the PCCL3 cells exposed to low-dose irradiation with 0.05 Gy and 0.1 Gy exhibited
a significantly lower number of γH2AX foci at early time points of 30 minutes and 1 hour post-
treatment compared to sham-irradiated PCCL3 cells. These results indicate hormesis, a hypothesis

38
suggesting that low-dose irradiation is beneficial. However, approximately around 4 hours post-
treatment the number of γH2AX foci in low-dose irradiated cells exceeds the number of γH2AX in
sham-irradiated cells, which contradicts the hormesis hypothesis. On the other hand, the number
of γH2AX foci in the sham-irradiated cells could be relatively high. Indeed, R. Runge, et al. counted
the number of γH2AX foci per nucleus of non-irradiated PCCL3 cells using an automated method
(The Aklides algorithms) and measured approximately a mean number of 3 γH2AX foci per cell,
while we counted approximately around 6 γH2AX foci per cell (123). The reason for this high mean
number is not known. However, it should be mentioned that the presence γH2AX foci is not
radiation specific and can also be induced by other stress factors. In contrast to γH2AX foci, the
mean number of 53BP1 foci and their kinetics over time is relatively normal. There are no
significant differences observed in the mean number of 53BP1 foci and its kinetics between 0.05
Gy-irradiated cells and sham-irradiated cells which could correspond to the basal cellular levels of
53BP1. In contrast, the number of 53BP1 foci reached a peak in cells irradiated with 0.1 Gy or
higher up to 3 Gy around 1-4h post-treatment after which the number of 53BP1 foci decreased
again to almost basal levels after 24 hours due to DNA repair. It could be possible that irradiation
with 0.1 Gy is the threshold level in which PCCL3 cells still accumulate γH2AX foci but are also able
to partially recruit 53BP1 to the sites of DNA damage. Another possible model for the increasing
γH2AX foci after low-dose irradiation (0.05 Gy and 0.1 Gy) but the decreased 53BP1 foci response
after 0.1 Gy could be the failure of dephosphorylation of γH2AX following repair. However, no
literature is describing this phenomenon. Finally, although ROS production was enhanced 24h post-
treatment in iodine-deficient cells compared to iodine-sufficient cells, there were no major
differences observed between iodine-sufficient and iodine-deficient conditions regarding the
number of ΥH2AX and 53BP1 foci at different time points post-treatment.
In conclusion, in order to verify these data, in particularly the continuous increase in γH2AX
foci after low-dose irradiation, we could repeat this experiment. Furthermore, it is of interest to
investigate the number of γH2AX foci in PCCL3 cells at 48h and 72h after irradiation with low
radiation doses (0.05 Gy and 0.1 Gy) to test our speculation of the presence of a DNA damage
threshold level (approximately 10 foci per nucleus) required to activate the DDR pathway and
induce DNA repair. In addition, in order to test the above described speculations regarding a
protective elimination of low-dose irradiated cells with persistent DSBs as a low-dose hyper-
radiosensitivity response, it would be of interest to examine apoptosis e.g. by performing TUNEL
analysis, and clonogenic assays to investigate the viability and proliferation capacity after
irradiation.
Exposure to IR causes perturbations in the cell cycle progression. Ionizing radiation-induced
DNA damage activates the DDR pathway which in turn interacts with checkpoint proteins involved
in cell cycle arrest at the G0/G1 phase, the S phase or the G2/M phase. These delays provide the
required time to repair the damage. An arrest in the G1 phase prevents aberrant replication of
damaged DNA, while arrest in the G2 phase avoids cells to segregate defective chromosomes. Cells
are most sensitive for the effects of ionizing radiation when they are actively proliferating and thus
reside in the M phase or in the G1/S interface (124). In our study, measurements of the cell cycle
distribution at 6h, 24h and 48h post-treatment indicated that PCCL3 cells irradiated with low,

39
intermediate and high radiation doses did not majorly differ in their cell cycle distribution and
progression at 6h post-treatment, except for a small significant decrease of iodine-sufficient cells in
the G0/G1 phase after irradiation with 3 Gy compared to sham-irradiated control cells. In addition,
at this time point, there were no significant differences observed between iodine-deficient and
iodine-sufficient cells. However, at 24h post-treatment, the percentage of cells in the G0/G1 phase
significantly increased, while the amount of cells in the G2/M phase and S phase significantly
decreased after irradiation with 3 Gy compared to sham-irradiated cells for both iodine-sufficient as
iodine-deficient cells. These results are in line with Kostic, et al. who also observed a significant G1
block with a decreased amount of cells in the S phase in human thyroid cells at 24 hours after
irradiation with short-wavelength ultraviolet light (UVC), the most damaging and energetic type of
UV light (125). According to Jiri Bartek, et al., there exist two distinctive waves of checkpoint
responses at the G1/S interface (Supplemental Figure 14). The initial transient respond is very
rapid and inhibits cyclin-dependent kinase 2 within 20 to 30 minutes and can last for several hours.
This prompt cell cycle delay is independent of p53 and protein transcription. It temporarily slows
down the cell cycle progression to provide more time for DNA repair. The second response is
delayed and considerable more sustained. This response is activated by the classical p53/p21
cascade, which is a multistep process involving induction of effector proteins which requires several
hours. This delay is more suitable for repair of highly complex DNA damages or for elimination of
cells with severely damaged DNA. The latter is supported by the ability of the p53-pathway to
induce apoptosis (126). Although we observed γH2AX and 53BP1 foci, associated with DSBs,
around respectively 30 minutes to 4 hours post-treatment, we did not observe a cell cycle arrest 6
hours post-treatment. It could be possible that we missed an early wave of cell cycle arrest at this
time point. On the other hand, a significant but not a complete loss of γH2AX and 53BP1 foci,
associated with DNA repair, was observed 24 hours post-treatment. At this point, we detected a
significant G1 arrest. This could represent the delayed p53-dependent G1 arrest in response to
severe and complex DNA damage induced by high irradiation doses. This is supported by William
G. Nelson, et al. who demonstrated that DNA strand breaks, especially DSBs, which are typically
induced by IR, appeared to be very efficient at triggering p53 protein up-regulation compared to
other types of genomic insults (127). However, to ensure the G1 arrest is p53-dependent, we could
knockdown p53 in thyroid cells and examine if the G1 arrest will still occur 24 hours after
irradiation with 3 Gy. The occurrence of a G1 arrest in irradiated cells is correlated with their
radiosensitivity.
Following low-dose and intermediate-dose exposure, there is no significant G1 arrest compared
to sham-irradiated cells. This indicates that the PCCL3 cells are relatively radioresistance, since
there only occurs a G1 arrest after irradiation with 3 Gy. However, there are differences observed
between iodine-sufficient and iodine-deficient cells in which there is a decreased number of cells in
the G0/G1 phase and an increased number of cells in the G2/M phase and S phase under iodine-
deficient conditions. This trend is observed after irradiation with low, intermediate and high
radiation doses, but not in sham-irradiated cells. Therefore, this could indicate that a treatment
with low-dose or intermediate-dose irradiation alone, or ID alone does not majorly change the cell
cycle progression, while a combined treatment with IR and ID makes PCCL3 cells less sensitive for
a G1 arrest and even enhance their proliferation. This could represent a stress-response with

40
subtle changes in the cellular proliferation pathways, which could be triggered by the enhanced
ROS production of the co-treatment as indicated by the ROS assay 24 hours post-treatment, with
ID as a promoting factor stimulating the effects of IR. Since there was no complete loss of γH2AX
and 53BP1 foci yet at 24h post-treatment, an enhanced proliferation could potentially lead to
accumulation of DNA damage increasing the mutation rate and the risk on malignant
transformation. Finally, 48h post-treatment, PCCL3 cells irradiated with 3 Gy still exhibited a
disturbed cell cycle with a small but significant decreased number of iodine-sufficient and iodine-
deficient cells in the S phase compared to the corresponding sham-irradiated cells. Furthermore,
there were significantly more iodine-sufficient cells in the G0/G1 phase after irradiation with 3 Gy
compared to sham-irradiated cells. However, there were no longer significant differences detected
between iodine-deficient and iodine-sufficient cells. This suggests that PCCL3 cells exposed to a
combined treatment of low-dose or intermediate-dose irradiation and ID are able to restore their
normal cell cycle progression after 48h post-treatment, indicating a transient stress response.
Since the ROS/HIF-1/VEGF-A pathway is activated approximately around 2-6 hours post-ID in
PCCL3 cells and since changes in protein expression were observed in FRTL5 cells already at 6
hours post-treatment, we investigated the combined effect of IR and ID on the protein expression
in PCCL3 cells at 6 hours post-treatment by performing Western blot analysis. In this study, we
first focused on the ROS/HIF-1/VEGF-A pathway. Craps, et al. demonstrated that NO, which is
produced by NOS3, is able to stabilize HIF-1α. Indeed, they observed an increased activated
phosphorylation of NOS3 and HIF-1α protein expression in human thyroid cells, FRTL5 cells and
PCCL3 cells at 4-6 hours post-ID. In this study, we tried to verify these data in PCCL3 cells that
were iodine deprived for 6 hours and we tried to find a possible enhanced effect on HIF-1α and
NOS3 protein expression when combined with irradiation with low, intermediate or high irradiation
doses. The identity of the additional ≈80 kDa protein band that we detected for HIF-1α protein
expression is unknown. However, this band is also detected in Western blot results from Life
science companies Abcam and Cell Signaling. We used the primary anti-HIF-1α antibody of Cell
Signaling. Although this band is not fully characterized, it is suggested to be a degradation or
cleavage product of HIF-1α in samples that have experienced multiple freeze-thaw cycles. The
identity of the additional ≈70 kDa band that we detected for (pSer1177) NOS3 protein expression
is also unknown, but is detected as well in Western blot results from Life science company Abcam.
Furthermore, A. Persu, et al. also observed a 70 kDa protein band using primary antibodies from
Santa Cruz on endothelial cell lysates submitted to repeated freeze-thaw cycles. They suggested
that it might correspond to a proteolytic cleavage product of eNOS containing its C-terminus (128).
We used the primary anti-eNOS3 antibody of BD Biosciences which is also directed against the C-
terminus of eNOS type III, and thus may also bind to this potential 70 kDa cleavage product.
Although we used the same cell line and the same culture method as the research group of J
Craps, we were unable to reproduce the described data.
To investigate the effects of IR and ID on the proliferation and survival of PCCL3 cells, we
investigated the protein expression of major key factors involved in proliferation and survival
pathways at 6 hours post-treatment performing Western blot analysis. We specifically investigated
(pY705)STAT3, (pThr308)AKT1 and NFκB p52. The additional 55 kDa protein band that we

41
detected for AKT1 expression is not identified. This could represent an alternative splice variant or
a putative isoform. The 86 kDa and 91 kDa protein bands detected for STAT3 protein expression
correspond to respectively the STAT3β and STAT3α isoforms. Furthermore, the additional 160 kDa
protein band detected for pY705 STAT3 protein expression could represent a putative dimerisation
of activated pSTAT3 in order to enable nuclear translocation, DNA binding and transcriptional
activation. We were unable to detect significant differences in protein expressions between the
radiation doses and between iodine-sufficient and iodine-deficient cells. Since we did not observe
any differences in the cell cycle distribution between sham-, low-, intermediate- and high-dose
irradiated PCCL3 cells and between iodine-sufficient and iodine-deficient PCCL3 cells at 6h post-
treatment, it is assumable that there are also no differences detected in the expression of proteins
which stimulate proliferation at this time point post-treatment. However, a significant increase was
detected in the amount of iodine-deficient, irradiated PCCL3 cells in the S phase and G2/M phase at
24 hours post-treatment compared to iodine-sufficient, irradiated PCCL3 cells. Therefore, it would
be of interest also to investigate the protein expressions in PCCL3 cells at 24 hours post-treatment.
We cannot ignore the high standard deviations present in the Western blot results. This also
contributes to the absence of significance between the different treatment groups and the controls,
especially when the effects on protein expression are small. First of all, it would be beneficial to
increase the number of the biological replicates per condition to increase the statistical power of
the experiments. However, it would also be of interest to investigate if we observe these data
because there is no real effect present of IR and ID on protein expression at this time point
representing only the variance in the cell cultures or due to variances in the Western blot protocol
and/or experimental environment. The following experimental design could investigate this
(Supplemental Figure 15). Three to six biological replicates could be treated with ID and/or IR
of different radiation doses to create the experimental conditions. Then, in order to determine if the
variance is deriving from the Western blot protocol, Western blotting of one specific biological
replicate could be performed three times in parallel on one day. If the Western blot protocol is
reproducible, then one can expect to obtain the same results from each Western blot experiment.
In order to assess if the variance is deriving from environmental factors such as temperature,
incubation times, content of the washing buffer and blocking buffer, etc. Western blotting of three
to six biological replicates could be performed on three different days. If environmental factors do
not affect the results, then one could expect to obtain the same results for each Western blot
experiment per biological replicate. If these experiments rule out the origin of the variance from
environmental factors or the Western blot protocol, then it can be concluded that there is no real
effect of IR and ID on the protein expression in treated PCCL3 cells on that specific time point post-
treatment. Optimization of the Western blot protocol is possible by examining the effects on the
results by changing the blocking buffer (e.g. BSA or non-fat dry milk), the washing buffer (e.g.
PBS-T or TBT-T) and the protein detection method (e.g. with quantum dots or with ECL
chemiluminscence) or by changing the incubation times of the blots in the washing buffer and
blocking buffer. There are also other techniques to investigate protein expression such as
immunocytochemistry and ELISA. The latter is a very sensitive techniques and easy to quantify.

42
Finally, along with alterations in the cell cycle progression and protein expression, changes in
gene expression are also a major component in stress responses. The control of gene expression is
tightly regulated and enables the cell to change its transcriptional capacity with much faster
response kinetics compared to de novo protein synthesis. Therefore, it might be a more initial
adaptive response to stress which can be visualized at earlier time points post-treatment compared
to changes in protein expression (129). It could be possible that at 6 hours post-treatment,
changes in gene expression can be detected by RT-qPCR. However, due to a lack of time, it was
not possible to investigate real-time gene expression in PCCL3 cells in response to IR and ID.
However, an interesting gene to examine is NQO1, which appears to be up-regulated in primary
human thyroid cells from microarray data. NQO1 is known as a multifunctional cytoprotective and
antioxidant enzyme. On the other hand, Selmansberger, et al. showed that CLIP2 is up-regulated
in post-Chernobyl pediatric PTCs. They suggest the involvement of CLIP2 in fundamental
carcinogenic processes including apoptosis, MAPK signaling and genomic instability (130). Other
interesting genes to examine are genes, which are involved in DNA repair, antioxidant defense,
apoptosis, cellular proliferation and survival.
At the start of this project, we hypothesized that a combined treatment of PCCL3 thyroid cells
to ID and IR leads to an enhanced ROS production, which will eventually affect cellular
proliferation, survival and resistance to apoptosis. The findings of these studies indicate that
iodine-deficient thyroid cells exposed to intermediate and high irradiation doses (0.05 Gy and 3 Gy)
showed a significantly increased ROS production 24 hours post-treatment compared to iodine-
sufficient cells. This suggests that irradiation with a dose of 0.5 Gy or higher stress the thyroid cells
to a certain extent which makes them unable to cope with the additional oxidative stress
originating from ID, leading to a significant higher accumulation of ROS compared to irradiated
PCCL3 cells cultured in the presence of iodine. When we then examined the extent of DSBs induced
by the co-treatment of IR and ID and their repair kinetics, we can conclude that the extent of DNA
damage is radiation dose dependent and is not enhanced by iodine deficiency. Furthermore, we can
also conclude that the response of PCCL3 cells after low-dose radiation exposure regarding DNA
damage repair is different from PCCL3 cells exposed to high-dose radiation, suggesting the
presence of a DNA damage threshold level required for an efficient activation of the DDR pathway
and subsequent DSB repair. Finally, from the cell cycle data, we can summarize that PCCL3 cells
are relatively radioresistance since only after irradiation with 3 Gy, a significant delayed p53-
dependent G1 arrest is induced when compared to sham-irradiated cells. Furthermore, a co-
treatment of ID and irradiation with low-, intermediate- and high-radiation doses enhances
proliferation of the PCCL3 and makes them less sensitive for a G1 arrest. This is an important
observation, since this can increase the mutation rate and the risk on carcinogenic transformation
when DNA damage is not fully repaired in the actively proliferating PCCL3 cells. Finally, expanding
upon the current study with the use of primary human thyroid cells would help to extrapolate the
effects of IR exposure and iodine deficiency in humans.

43
REFERENCES
1. White BA, Porterfield SP. Endocrine and Reproductive Physiology. 4th ed. ed. Philadelphia:
Elsevier Mosby; 2013. 2. Nikiforov YE, Nikiforova MN. Molecular genetics and diagnosis of thyroid cancer. Nature reviews Endocrinology. 2011;7(10):569-80. 3. Nikiforova MN, Nikiforov YE. Molecular diagnostics and predictors in thyroid cancer. Thyroid : official journal of the American Thyroid Association. 2009;19(12):1351-61. 4. Xing M. Molecular pathogenesis and mechanisms of thyroid cancer. Nature reviews Cancer. 2013;13(3):184-99.
5. LiVolsi VA. Papillary thyroid carcinoma: an update. Modern pathology : an official journal of the United States and Canadian Academy of Pathology, Inc. 2011;24 Suppl 2:S1-9.
6. Registry BC. Cancer Incidence in Belgium, 2008. Brussels2011. 7. Yu GP, Li JC, Branovan D, McCormick S, Schantz SP. Thyroid cancer incidence and survival in the national cancer institute surveillance, epidemiology, and end results race/ethnicity groups. Thyroid : official journal of the American Thyroid Association. 2010;20(5):465-73. 8. Zimmermann MB, Galetti V. Iodine intake as a risk factor for thyroid cancer: a
comprehensive review of animal and human studies. Thyroid research. 2015;8:8. 9. Navarro Silvera SA, Miller AB, Rohan TE. Risk factors for thyroid cancer: a prospective cohort study. International journal of cancer Journal international du cancer. 2005;116(3):433-8. 10. Rothkamm K, Lobrich M. Evidence for a lack of DNA double-strand break repair in human cells exposed to very low x-ray doses. Proceedings of the National Academy of Sciences of the United States of America. 2003;100(9):5057-62.
11. Statkiewicz Sherer MA, Visconti PJ, Ritenour ER, Haynes K. Radiation Protection in Medical Radiography. 7th ed. Elsevier Mosby; 2015. 12. Wei H, K N Y. Ionizing Radiation, DNA Double Strand Break and Mutation In: Urbano KV,
editor. Advances in Genetics Research 4: Nova Science Publishers 2010. 13. Chen CC, Motegi A, Hasegawa Y, Myung K, Kolodner R, D'Andrea A. Genetic analysis of ionizing radiation-induced mutagenesis in Saccharomyces cerevisiae reveals TransLesion Synthesis (TLS) independent of PCNA K164 SUMOylation and ubiquitination. DNA repair. 2006;5(12):1475-
88. 14. Mullenders L, Atkinson M, Paretzke H, Sabatier L, Bouffler S. Assessing cancer risks of low-dose radiation. Nature reviews Cancer. 2009;9(8):596-604. 15. Miron SD, Astarastoae V. Long-term biological effects induced by ionizing radiation--implications for dose mediated risk. Revista medico-chirurgicala a Societatii de Medici si Naturalisti din Iasi. 2014;118(3):717-23. 16. Lin EC. Radiation risk from medical imaging. Mayo Clinic proceedings. 2010;85(12):1142-
6; quiz 6. 17. Little MP, Wakeford R, Tawn EJ, Bouffler SD, Berrington de Gonzalez A. Risks associated with low doses and low dose rates of ionizing radiation: why linearity may be (almost) the best we
can do. Radiology. 2009;251(1):6-12. 18. Imaizumi M, Usa T, Tominaga T, Neriishi K, Akahoshi M, Nakashima E, et al. Radiation dose-response relationships for thyroid nodules and autoimmune thyroid diseases in Hiroshima and
Nagasaki atomic bomb survivors 55-58 years after radiation exposure. Jama. 2006;295(9):1011-22. 19. Ron E, Lubin JH, Shore RE, Mabuchi K, Modan B, Pottern LM, et al. Thyroid cancer after exposure to external radiation: a pooled analysis of seven studies. Radiation research. 1995;141(3):259-77. 20. Committee to Assess Health Risks from Exposure to Low Levels of Ionizing Radiation BoRER, Division on Earth and Life Studies, National Research Council. Health Risks from Exposure
to Low Levels of Ionizing Radiation:: BEIR VII Phase 2: National Academies Press; 2006. 424 p. 21. Su YP, Niu HW, Chen JB, Fu YH, Xiao GB, Sun QF. Radiation dose in the thyroid and the thyroid cancer risk attributable to CT scans for pediatric patients in one general hospital of China. International journal of environmental research and public health. 2014;11(3):2793-803.
22. Tsuda T, Tokinobu A, Yamamoto E, Suzuki E. Thyroid Cancer Detection by Ultrasound Among Residents Ages 18 Years and Younger in Fukushima, Japan: 2011 to 2014. Epidemiology (Cambridge, Mass). 2016;27(3):316-22.
23. Furukawa K, Preston D, Funamoto S, Yonehara S, Ito M, Tokuoka S, et al. Long-term trend of thyroid cancer risk among Japanese atomic-bomb survivors: 60 years after exposure. International journal of cancer Journal international du cancer. 2013;132(5):1222-6.

44
24. Zablotska LB, Ron E, Rozhko AV, Hatch M, Polyanskaya ON, Brenner AV, et al. Thyroid
cancer risk in Belarus among children and adolescents exposed to radioiodine after the Chornobyl accident. British journal of cancer. 2011;104(1):181-7. 25. Yamashita S, Suzuki S. Risk of thyroid cancer after the Fukushima nuclear power plant accident. Respiratory investigation. 2013;51(3):128-33. 26. Dreger S, Pfinder M, Christianson L, Lhachimi SK, Zeeb H. The effects of iodine blocking following nuclear accidents on thyroid cancer, hypothyroidism, and benign thyroid nodules: design of a systematic review. Systematic reviews. 2015;4:126.
27. Cardis E, Hatch M. The Chernobyl accident--an epidemiological perspective. Clinical oncology (Royal College of Radiologists (Great Britain)). 2011;23(4):251-60. 28. Reiners C. Clinical experiences with radiation induced thyroid cancer after chernobyl. Genes. 2011;2(2):374-83. 29. White SC, Mallya SM. Update on the biological effects of ionizing radiation, relative dose factors and radiation hygiene. Australian dental journal. 2012;57 Suppl 1:2-8.
30. UNSCEAR. Sources of Ionizing Radiation: Medical radiation exposures. New York: 2008 Contract No.: Annex A. 31. Lee NY, Le QT. New developments in radiation therapy for head and neck cancer: intensity-modulated radiation therapy and hypoxia targeting. Seminars in oncology. 2008;35(3):236-50. 32. Inskip PD. Thyroid cancer after radiotherapy for childhood cancer. Medical and pediatric oncology. 2001;36(5):568-73. 33. Green DM, Hyland A, Barcos MP, Reynolds JA, Lee RJ, Hall BC, et al. Second malignant
neoplasms after treatment for Hodgkin's disease in childhood or adolescence. Journal of clinical oncology : official journal of the American Society of Clinical Oncology. 2000;18(7):1492-9. 34. Bhatia S, Yasui Y, Robison LL, Birch JM, Bogue MK, Diller L, et al. High risk of subsequent neoplasms continues with extended follow-up of childhood Hodgkin's disease: report from the Late Effects Study Group. Journal of clinical oncology : official journal of the American Society of Clinical Oncology. 2003;21(23):4386-94. 35. Somerville HM, Steinbeck KS, Stevens G, Delbridge LW, Lam AH, Stevens MM. Thyroid
neoplasia following irradiation in adolescent and young adult survivors of childhood cancer. The Medical journal of Australia. 2002;176(12):584-7. 36. Sigurdson AJ, Ronckers CM, Mertens AC, Stovall M, Smith SA, Liu Y, et al. Primary thyroid cancer after a first tumour in childhood (the Childhood Cancer Survivor Study): a nested case-control study. Lancet (London, England). 2005;365(9476):2014-23. 37. Lawrence L, Kwan-Hoong N. Radiological Safety and Quality: Paradigms in Leadership and
Innovation. Springer Science & Business Media; 2013. p. 471. 38. Vanmarcke H, Bosmans H, Eggermont G, editors. Ionizing radiation exposure of the Belgian population in 2006. Proceedings of Third European IRPA Congress; 2010; Helsinki, Finland. 39. Mettler FA, Jr., Wiest PW, Locken JA, Kelsey CA. CT scanning: patterns of use and dose. Journal of radiological protection : official journal of the Society for Radiological Protection. 2000;20(4):353-9. 40. Mazonakis M, Tzedakis A, Damilakis J, Gourtsoyiannis N. Thyroid dose from common head
and neck CT examinations in children: is there an excess risk for thyroid cancer induction?
European radiology. 2007;17(5):1352-7. 41. Brenner DJ, Doll R, Goodhead DT, Hall EJ, Land CE, Little JB, et al. Cancer risks attributable to low doses of ionizing radiation: assessing what we really know. Proceedings of the National Academy of Sciences of the United States of America. 2003;100(24):13761-6. 42. Ory C, Ugolin N, Schlumberger M, Hofman P, Chevillard S. Discriminating gene expression signature of radiation-induced thyroid tumors after either external exposure or internal
contamination. Genes. 2011;3(1):19-34. 43. Luckey TD. Radiation hormesis: the good, the bad, and the ugly. Dose-response : a publication of International Hormesis Society. 2006;4(3):169-90. 44. Ina Y, Sakai K. Prolongation of life span associated with immunological modification by chronic low-dose-rate irradiation in MRL-lpr/lpr mice. Radiation research. 2004;161(2):168-73. 45. Feinendegen LE. Evidence for beneficial low level radiation effects and radiation hormesis.
The British journal of radiology. 2005;78(925):3-7. 46. Kaiser J. Hormesis. A healthful dab of radiation? Science (New York, NY). 302. United
States2003. p. 378. 47. Redpath JL. Radiation-induced neoplastic transformation in vitro: evidence for a protective effect at low doses of low LET radiation. Cancer metastasis reviews. 2004;23(3-4):333-9. 48. Portulano C, Paroder-Belenitsky M, Carrasco N. The Na+/I- symporter (NIS): mechanism and medical impact. Endocrine reviews. 2014;35(1):106-49.
49. Gerard AC, Humblet K, Wilvers C, Poncin S, Derradji H, de Ville de Goyet C, et al. Iodine-deficiency-induced long lasting angiogenic reaction in thyroid cancers occurs via a vascular endothelial growth factor-hypoxia inducible factor-1-dependent, but not a reactive oxygen species-

45
dependent, pathway. Thyroid : official journal of the American Thyroid Association.
2012;22(7):699-708. 50. Pearce EN, Andersson M, Zimmermann MB. Global iodine nutrition: Where do we stand in 2013? Thyroid : official journal of the American Thyroid Association. 2013;23(5):523-8. 51. Dal Maso L, Bosetti C, La Vecchia C, Franceschi S. Risk factors for thyroid cancer: an epidemiological review focused on nutritional factors. Cancer causes & control : CCC. 2009;20(1):75-86. 52. Knudsen N, Bulow I, Jorgensen T, Laurberg P, Ovesen L, Perrild H. Goitre prevalence and
thyroid abnormalities at ultrasonography: a comparative epidemiological study in two regions with slightly different iodine status. Clinical endocrinology. 2000;53(4):479-85. 53. Knudsen N, Laurberg P, Perrild H, Bulow I, Ovesen L, Jorgensen T. Risk factors for goiter and thyroid nodules. Thyroid : official journal of the American Thyroid Association. 2002;12(10):879-88. 54. Carle A, Krejbjerg A, Laurberg P. Epidemiology of nodular goitre. Influence of iodine intake.
Best practice & research Clinical endocrinology & metabolism. 2014;28(4):465-79. 55. Campbell MJ, Seib CD, Candell L, Gosnell JE, Duh QY, Clark OH, et al. The underestimated risk of cancer in patients with multinodular goiters after a benign fine needle aspiration. World journal of surgery. 2015;39(3):695-700. 56. La Vecchia C, Malvezzi M, Bosetti C, Garavello W, Bertuccio P, Levi F, et al. Thyroid cancer mortality and incidence: a global overview. International journal of cancer Journal international du cancer. 2015;136(9):2187-95.
57. Feldt-Rasmussen U. Iodine and cancer. Thyroid : official journal of the American Thyroid Association. 2001;11(5):483-6. 58. Bacher-Stier C, Riccabona G, Totsch M, Kemmler G, Oberaigner W, Moncayo R. Incidence and clinical characteristics of thyroid carcinoma after iodine prophylaxis in an endemic goiter country. Thyroid : official journal of the American Thyroid Association. 1997;7(5):733-41. 59. Besic N, Hocevar M, Zgajnar J. Lower incidence of anaplastic carcinoma after higher iodination of salt in Slovenia. Thyroid : official journal of the American Thyroid Association.
2010;20(6):623-6. 60. Farahati J, Geling M, Mader U, Mortl M, Luster M, Muller JG, et al. Changing trends of incidence and prognosis of thyroid carcinoma in lower Franconia, Germany, from 1981-1995. Thyroid : official journal of the American Thyroid Association. 2004;14(2):141-7. 61. Pettersson B, Coleman MP, Ron E, Adami HO. Iodine supplementation in Sweden and regional trends in thyroid cancer incidence by histopathologic type. International journal of cancer
Journal international du cancer. 1996;65(1):13-9. 62. Axelrad AA, Leblond CP. Induction of thyroid tumors in rats by a low iodine diet. Cancer. 1955;8(2):339-67. 63. Isler H, Leblond CP, Axelrad AA. Influence of age and of iodine intake on the production of thyroid tumors in the rat. Journal of the National Cancer Institute. 1958;21(6):1065-81. 64. Isler H. Effect of iodine on thyroid tumors induced in the rat by a low-iodine diet. Journal of the National Cancer Institute. 1959;23:675-93.
65. Schaller RT, Jr., Stevenson JK. Development of carcinoma of the thyroid in iodine-deficient
mice. Cancer. 1966;19(8):1063-80. 66. Fortner JG, George PA, Sternberg SS. The development of thyroid cancer and other abnormalities in Syrian hamsters maintained on an iodine deficient diet. Surgical forum. 1958;9:646-50. 67. al-Saadi AA, Beierwaltes WH. Chromosomal changes in rat thyroid cells during iodine depletion and repletion. Cancer research. 1966;26(4):676-88.
68. Gerard AC, Poncin S, Caetano B, Sonveaux P, Audinot JN, Feron O, et al. Iodine deficiency induces a thyroid stimulating hormone-independent early phase of microvascular reshaping in the thyroid. The American journal of pathology. 2008;172(3):748-60. 69. Gerard AC, Poncin S, Audinot JN, Denef JF, Colin IM. Iodide deficiency-induced angiogenic stimulus in the thyroid occurs via HIF- and ROS-dependent VEGF-A secretion from thyrocytes. American journal of physiology Endocrinology and metabolism. 2009;296(6):E1414-22.
70. Craps J, Wilvers C, Joris V, De Jongh B, Vanderstraeten J, Lobysheva I, et al. Involvement of nitric oxide in iodine deficiency-induced microvascular remodeling in the thyroid gland: role of
nitric oxide synthase 3 and ryanodine receptors. Endocrinology. 2015;156(2):707-20. 71. Golkowski F, Szybinski Z, Rachtan J, Sokolowski A, Buziak-Bereza M, Trofimiuk M, et al. Iodine prophylaxis--the protective factor against stomach cancer in iodine deficient areas. European journal of nutrition. 2007;46(5):251-6. 72. Aceves C, Anguiano B, Delgado G. Is iodine a gatekeeper of the integrity of the mammary
gland? Journal of mammary gland biology and neoplasia. 2005;10(2):189-96.

46
73. Venturi S, Donati FM, Venturi A, Venturi M, Grossi L, Guidi A. Role of iodine in evolution
and carcinogenesis of thyroid, breast and stomach. Advances in clinical pathology : the official journal of Adriatic Society of Pathology. 2000;4(1):11-7. 74. Tabaeizadeh M, Haghpanah V, Keshtkar A, Semnani S, Roshandel G, Adabi K, et al. Goiter frequency is more strongly associated with gastric adenocarcinoma than urine iodine level. Journal of gastric cancer. 2013;13(2):106-10. 75. Aceves C, Anguiano B, Delgado G. The extrathyronine actions of iodine as antioxidant, apoptotic, and differentiation factor in various tissues. Thyroid : official journal of the American
Thyroid Association. 2013;23(8):938-46. 76. Leung AM, Braverman LE. Consequences of excess iodine. Nature reviews Endocrinology. 2014;10(3):136-42. 77. Shakhtarin VV, Tsyb AF, Stepanenko VF, Orlov MY, Kopecky KJ, Davis S. Iodine deficiency, radiation dose, and the risk of thyroid cancer among children and adolescents in the Bryansk region of Russia following the Chernobyl power station accident. International journal of
epidemiology. 2003;32(4):584-91. 78. Cardis E, Kesminiene A, Ivanov V, Malakhova I, Shibata Y, Khrouch V, et al. Risk of thyroid cancer after exposure to 131I in childhood. Journal of the National Cancer Institute. 2005;97(10):724-32. 79. Boice JD, Jr. Radiation-induced thyroid cancer--what's new? Journal of the National Cancer Institute. 97. United States2005. p. 703-5. 80. Boltze C, Brabant G, Dralle H, Gerlach R, Roessner A, Hoang-Vu C. Radiation-induced
thyroid carcinogenesis as a function of time and dietary iodine supply: an in vivo model of tumorigenesis in the rat. Endocrinology. 2002;143(7):2584-92. 81. Ward JM, Ohshima M. The role of iodine in carcinogenesis. Advances in experimental medicine and biology. 1986;206:529-42. 82. Poncin S, Gerard AC, Boucquey M, Senou M, Calderon PB, Knoops B, et al. Oxidative stress in the thyroid gland: from harmlessness to hazard depending on the iodine content. Endocrinology. 2008;149(1):424-33.
83. Xing M. Oxidative stress: a new risk factor for thyroid cancer. Endocrine-related cancer. 2012;19(1):C7-11. 84. Aslan M, Cosar N, Celik H, Aksoy N, Dulger AC, Begenik H, et al. Evaluation of oxidative status in patients with hyperthyroidism. Endocrine. 2011;40(2):285-9. 85. Torun AN, Kulaksizoglu S, Kulaksizoglu M, Pamuk BO, Isbilen E, Tutuncu NB. Serum total antioxidant status and lipid peroxidation marker malondialdehyde levels in overt and subclinical
hypothyroidism. Clinical endocrinology. 2009;70(3):469-74. 86. Erdamar H, Demirci H, Yaman H, Erbil MK, Yakar T, Sancak B, et al. The effect of hypothyroidism, hyperthyroidism, and their treatment on parameters of oxidative stress and antioxidant status. Clinical chemistry and laboratory medicine. 2008;46(7):1004-10. 87. Erdamar H, Cimen B, Gulcemal H, Saraymen R, Yerer B, Demirci H. Increased lipid peroxidation and impaired enzymatic antioxidant defense mechanism in thyroid tissue with multinodular goiter and papillary carcinoma. Clinical biochemistry. 2010;43(7-8):650-4.
88. Wang D, Feng JF, Zeng P, Yang YH, Luo J, Yang YW. Total oxidant/antioxidant status in
sera of patients with thyroid cancers. Endocrine-related cancer. 2011;18(6):773-82. 89. Lobrich M, Rief N, Kuhne M, Heckmann M, Fleckenstein J, Rube C, et al. In vivo formation and repair of DNA double-strand breaks after computed tomography examinations. Proceedings of the National Academy of Sciences of the United States of America. 2005;102(25):8984-9. 90. Rube CE, Grudzenski S, Kuhne M, Dong X, Rief N, Lobrich M, et al. DNA double-strand break repair of blood lymphocytes and normal tissues analysed in a preclinical mouse model:
implications for radiosensitivity testing. Clinical cancer research : an official journal of the American Association for Cancer Research. 2008;14(20):6546-55. 91. Kuo LJ, Yang LX. Gamma-H2AX - a novel biomarker for DNA double-strand breaks. In vivo (Athens, Greece). 2008;22(3):305-9. 92. Iliakis G, Wang Y, Guan J, Wang H. DNA damage checkpoint control in cells exposed to ionizing radiation. Oncogene. 2003;22(37):5834-47.
93. Norbury CJ, Zhivotovsky B. DNA damage-induced apoptosis. Oncogene. 2004;23(16):2797-808.
94. Lomax ME, Folkes LK, O'Neill P. Biological consequences of radiation-induced DNA damage: relevance to radiotherapy. Clinical oncology (Royal College of Radiologists (Great Britain)). 2013;25(10):578-85. 95. Narang H, Krishna M. Mitogen-activated protein kinases: specificity of response to dose of ionizing radiation in liver. Journal of radiation research. 2004;45(2):213-20.
96. Evan GI, Vousden KH. Proliferation, cell cycle and apoptosis in cancer. Nature. 2001;411(6835):342-8.

47
97. Reuter S, Gupta SC, Chaturvedi MM, Aggarwal BB. Oxidative stress, inflammation, and
cancer: how are they linked? Free radical biology & medicine. 2010;49(11):1603-16. 98. Sofia Vala I, Martins LR, Imaizumi N, Nunes RJ, Rino J, Kuonen F, et al. Low doses of ionizing radiation promote tumor growth and metastasis by enhancing angiogenesis. PloS one. 2010;5(6):e11222. 99. Osaki M, Oshimura M, Ito H. PI3K-Akt pathway: its functions and alterations in human cancer. Apoptosis : an international journal on programmed cell death. 2004;9(6):667-76. 100. Zhan M, Han ZC. Phosphatidylinositide 3-kinase/AKT in radiation responses. Histology and
histopathology. 2004;19(3):915-23. 101. Ahmed KM, Li JJ. NF-kappa B-mediated adaptive resistance to ionizing radiation. Free radical biology & medicine. 2008;44(1):1-13. 102. Karin M. How NF-kappaB is activated: the role of the IkappaB kinase (IKK) complex. Oncogene. 1999;18(49):6867-74. 103. Basseres DS, Baldwin AS. Nuclear factor-kappaB and inhibitor of kappaB kinase pathways
in oncogenic initiation and progression. Oncogene. 2006;25(51):6817-30. 104. Criswell T, Leskov K, Miyamoto S, Luo G, Boothman DA. Transcription factors activated in mammalian cells after clinically relevant doses of ionizing radiation. Oncogene. 2003;22(37):5813-27. 105. Brach MA, Hass R, Sherman ML, Gunji H, Weichselbaum R, Kufe D. Ionizing radiation induces expression and binding activity of the nuclear factor kappa B. The Journal of clinical investigation. 1991;88(2):691-5.
106. Jin S, Borkhuu O, Bao W, Yang YT. Signaling Pathways in Thyroid Cancer and Their Therapeutic Implications. Journal of clinical medicine research. 2016;8(4):284-96. 107. Trovato M, Grosso M, Vitarelli E, Ruggeri RM, Alesci S, Trimarchi F, et al. Distinctive expression of STAT3 in papillary thyroid carcinomas and a subset of follicular adenomas. Histology and histopathology. 2003;18(2):393-9. 108. Sosonkina N, Starenki D, Park JI. The Role of STAT3 in Thyroid Cancer. Cancers. 2014;6(1):526-44.
109. Zhang J, Gill A, Atmore B, Johns A, Delbridge L, Lai R, et al. Upregulation of the signal transducers and activators of transcription 3 (STAT3) pathway in lymphatic metastases of papillary thyroid cancer. International journal of clinical and experimental pathology. 2011;4(4):356-62. 110. Lau J, Ilkhanizadeh S, Wang S, Miroshnikova YA, Salvatierra NA, Wong RA, et al. STAT3 Blockade Inhibits Radiation-Induced Malignant Progression in Glioma. Cancer research. 2015;75(20):4302-11.
111. (WH0) WHO. Ionizing radiation, health effects and protective measures. 2016. 112. Nadolnik LI, Valentyukevich OI. Peculiarities of the antioxidant status of the thyroid gland. Bulletin of experimental biology and medicine. 2007;144(4):529-31. 113. Poncin S, Colin IM, Gerard AC. Minimal oxidative load: a prerequisite for thyroid cell function. The Journal of endocrinology. 2009;201(1):161-7. 114. Song Y, Driessens N, Costa M, De Deken X, Detours V, Corvilain B, et al. Roles of hydrogen peroxide in thyroid physiology and disease. The Journal of clinical endocrinology and metabolism.
2007;92(10):3764-73.
115. Massart C, Hoste C, Virion A, Ruf J, Dumont JE, Van Sande J. Cell biology of H2O2 generation in the thyroid: investigation of the control of dual oxidases (DUOX) activity in intact ex vivo thyroid tissue and cell lines. Molecular and cellular endocrinology. 2011;343(1-2):32-44. 116. Bjorkman U, Ekholm R. Hydrogen peroxide degradation and glutathione peroxidase activity in cultures of thyroid cells. Molecular and cellular endocrinology. 1995;111(1):99-107. 117. Gerard AC, Many MC, Daumerie C, Knoops B, Colin IM. Peroxiredoxin 5 expression in the
human thyroid gland. Thyroid : official journal of the American Thyroid Association. 2005;15(3):205-9. 118. Driessens N, Versteyhe S, Ghaddhab C, Burniat A, De Deken X, Van Sande J, et al. Hydrogen peroxide induces DNA single- and double-strand breaks in thyroid cells and is therefore a potential mutagen for this organ. Endocrine-related cancer. 2009;16(3):845-56. 119. Mariotti LG, Pirovano G, Savage KI, Ghita M, Ottolenghi A, Prise KM, et al. Use of the
gamma-H2AX assay to investigate DNA repair dynamics following multiple radiation exposures. PloS one. 2013;8(11):e79541.
120. Anderson L, Henderson C, Adachi Y. Phosphorylation and rapid relocalization of 53BP1 to nuclear foci upon DNA damage. Molecular and cellular biology. 2001;21(5):1719-29. 121. Zhang X, Ye C, Sun F, Wei W, Hu B, Wang J. Both Complexity and Location of DNA Damage Contribute to Cellular Senescence Induced by Ionizing Radiation. PloS one. 2016;11(5):e0155725. 122. Grudzenski S, Raths A, Conrad S, Rube CE, Lobrich M. Inducible response required for
repair of low-dose radiation damage in human fibroblasts. Proceedings of the National Academy of Sciences of the United States of America. 2010;107(32):14205-10.

48
123. Runge R, Wendisch M, Wunderlich G, Roggenbuck D, Hiemann R, Kasten-Pisula A, et al.
Visual and automatic interpretation of yH2AX immunofluorescence microscopy images after irradiation with open radionuclides. Germany: Technical University Dresden, 2010. 124. Chaudhry MA. Base excision repair of ionizing radiation-induced DNA damage in G1 and G2 cell cycle phases. Cancer cell international. 2007;7:15. 125. Kostic I, Toffoletto B, Toller M, Beltrami CA, Ambesi-Impiombato FS, Curcio F. UVC radiation-induced effect on human primary thyroid cell proliferation and HLA-DR expression. Hormone and metabolic research = Hormon- und Stoffwechselforschung = Hormones et
metabolisme. 2010;42(12):846-53. 126. Bartek J, Lukas J. Pathways governing G1/S transition and their response to DNA damage. FEBS letters. 2001;490(3):117-22. 127. Nelson WG, Kastan MB. DNA strand breaks: the DNA template alterations that trigger p53-dependent DNA damage response pathways. Molecular and cellular biology. 1994;14(3):1815-23. 128. Persu A, Stoenoiu MS, Messiaen T, Davila S, Robino C, El-Khattabi O, et al. Modifier effect
of ENOS in autosomal dominant polycystic kidney disease. Human molecular genetics. 2002;11(3):229-41. 129. de Nadal E, Ammerer G, Posas F. Controlling gene expression in response to stress. Nature reviews Genetics. 2011;12(12):833-45. 130. Selmansberger M, Feuchtinger A, Zurnadzhy L, Michna A, Kaiser JC, Abend M, et al. CLIP2 as radiation biomarker in papillary thyroid carcinoma. Oncogene. 2015;34(30):3917-25.

49
SUPPLEMENTAL FIGURES AND TABLES
Supplemental Table 1: thyroid cancer types and their mutational profiles (2).
Characteristics Papillary
carcinoma
Follicular carcinoma Anaplastic
carcinoma
Medullary
carcinoma
Cell type Follicular cells Follicular cells Follicular cells C-cells
Prevalence 80-85% 10-15% 1-2% 3-5%
Typical route of
spread
Local lymph node
metastasis.
Hematogenous
metastasis, typically to
bones and lungs.
Invasive local
growth, lymph node
and
hematogeneous
metastases.
Lymph node and
hematogeneous
metastases.
10-years survival 95-98% 90-95% <10% 60-80%
Common
mutations and
their prevalence
BRAF 40–45%
RAS 10–20%
RET/PTC 10–20%
TRK <5%
RAS 40–50%
PAX8/PPARγ 30–35%
PIK3CA <10%
PTEN <10%
TP53 50–80%
CTNNB1 5–60%
RAS 20–40%
BRAF 20–40%
PIK3CA 10–20%
PTEN 5–15%
AKT1 5-10%
Familial forms:
RET >95%
Sporadic:
RET 40–50%
RAS 25%
Supplemental Figure 1: The main signaling pathways involved in thyroid carcinogenesis are the
MAPK and PI3K–AKT pathways. These pathways regulate multiple cellular processes including proliferation,
differentiation and survival. Constitutive activation of the MAPK pathway by mutated BRAF and RAS genes or by
the chimeric fusion proteins RET/PTC and tyrosine receptor kinase (TRK) are a common tumor-initiating event
in well-differentiated papillary carcinoma and in some follicular carcinomas. Mutations involving the effectors of
the PI3K–AKT pathway such as the PI3K subunit PIK3CA, AKT1 and PTEN are found more frequently in follicular
carcinomas and in undifferentiated types of thyroid cancer (2).

50
Supplemental Figure 2: Possible relationships between low-dose radiation of cancer risk.
Epidemiological data provide direct measurements down to 100 mSv (solid black line). However, there are
still uncertainties about the health effects of radiation doses below 100 mSv. Below this level a linear non-
threshold extrapolation is used to estimate the risks to develop cancer at low radiation doses (dashed black
line) (14).
Supplemental Figure 3: Proposed mechanism of iodide deprivation-induced angiogenesis in thyroid
angiofollicular units. As soon as intracellular iodide levels drop due to an acute decrease in iodine supply, an
increase in intracellular ROS levels is observed. Furthermore, ID induces RYR-dependent Ca2+ release from the
endoplasmic reticulum, leading to phosphorylation and subsequent activation of NOS3 and NO production. The
produced ROS and NO stabilize HIF-1α which associates with HIF-1ß to form the transcription factor HIF- 1.
HIF-1 binds to the hypoxia-response element (HRE) site localized in the promoter region of the VEGF-A gene,
thereby initiating VEGF-A transcription and VEGF-A protein synthesis. VEGF-A then acts as a paracrine factor to
stimulate the proliferation of adjacent endothelial cells and promote microvascular thyroid reshaping. Adapted
from (69) and (70).

51
Supplemental figure 4: DNA damage response pathway
Supplemental figure 5: PI3K/AKT pathway

52
Supplemental figure 6: NFκB pathway
Supplemental figure 7: JAK/STAT pathway

53
Supplemental figure 8: Experimental set-up with the different condition (iodine, iodine deficiency,
and the different radiation doses).
Supplemental figure 9: Cultured rat PCCL3 thyroid cells.

54
A
B
C

55
D
E
F
Supplemental figure 10: Western blot results of HIF-1α and β-Actin (A); NOS, pNOS3 and
β-Actin (B); Catalase and β-Actin (C); AKT-1, pAKT-1 and viniculin (D); NFκB p52 and
viniculin (E); STAT-3, pSTAT-3 and viniculin (F). Viniculin and β-Actin are housekeeping
proteins to normalize for equal loading.
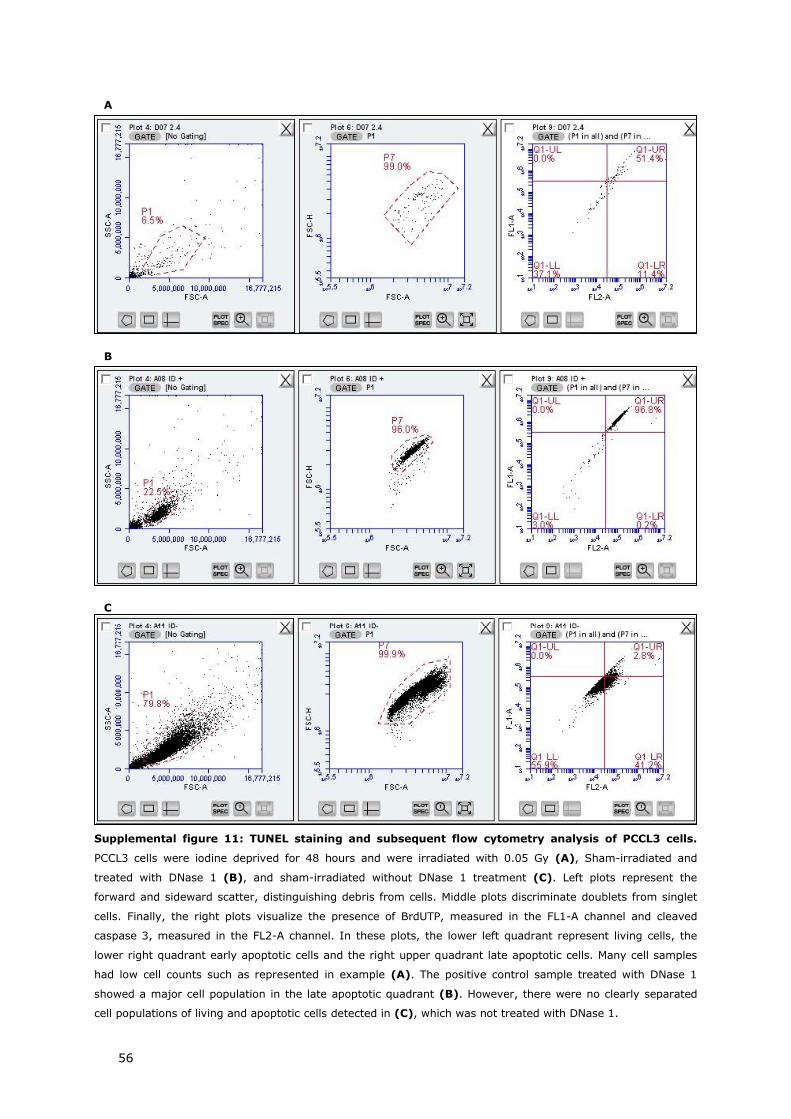
56
Supplemental figure 11: TUNEL staining and subsequent flow cytometry analysis of PCCL3 cells.
PCCL3 cells were iodine deprived for 48 hours and were irradiated with 0.05 Gy (A), Sham-irradiated and
treated with DNase 1 (B), and sham-irradiated without DNase 1 treatment (C). Left plots represent the
forward and sideward scatter, distinguishing debris from cells. Middle plots discriminate doublets from singlet
cells. Finally, the right plots visualize the presence of BrdUTP, measured in the FL1-A channel and cleaved
caspase 3, measured in the FL2-A channel. In these plots, the lower left quadrant represent living cells, the
lower right quadrant early apoptotic cells and the right upper quadrant late apoptotic cells. Many cell samples
had low cell counts such as represented in example (A). The positive control sample treated with DNase 1
showed a major cell population in the late apoptotic quadrant (B). However, there were no clearly separated
cell populations of living and apoptotic cells detected in (C), which was not treated with DNase 1.
B
C
A

57
Supplemental figure 12: γH2AX and 53BP1 foci in 3 Gy-irradiated iodine-deficient PCCL3 cells at 1
hour post-treatment. (Magnification: 40X).
Supplemental figure 13: Cell cycle analysis by 7-AAD/BrdU staining measured by flow cytometry.
PCCL3 cells were iodine deprived for 6 hours (A), 24 hours (B) and 48 hours (C) and were irradiated with
0.05 Gy in (A) and (B) and were sham-irradiated in (C). Upper left plots represent the forward and sideward
scatter, distinguishing debris from cells. Upper right plots discriminate doublets from singlet cells. Lower left
plots visualize the presence of BrdU in the FL1-A channel and 7-AAD in the FL3-A channel. Lower right plots
represent a DNA histogram with the fluorescence intensity on the X-axis and the number of cells in the G0/G1
phase, S phase and G2/M phase in the Y-axis.
A B C
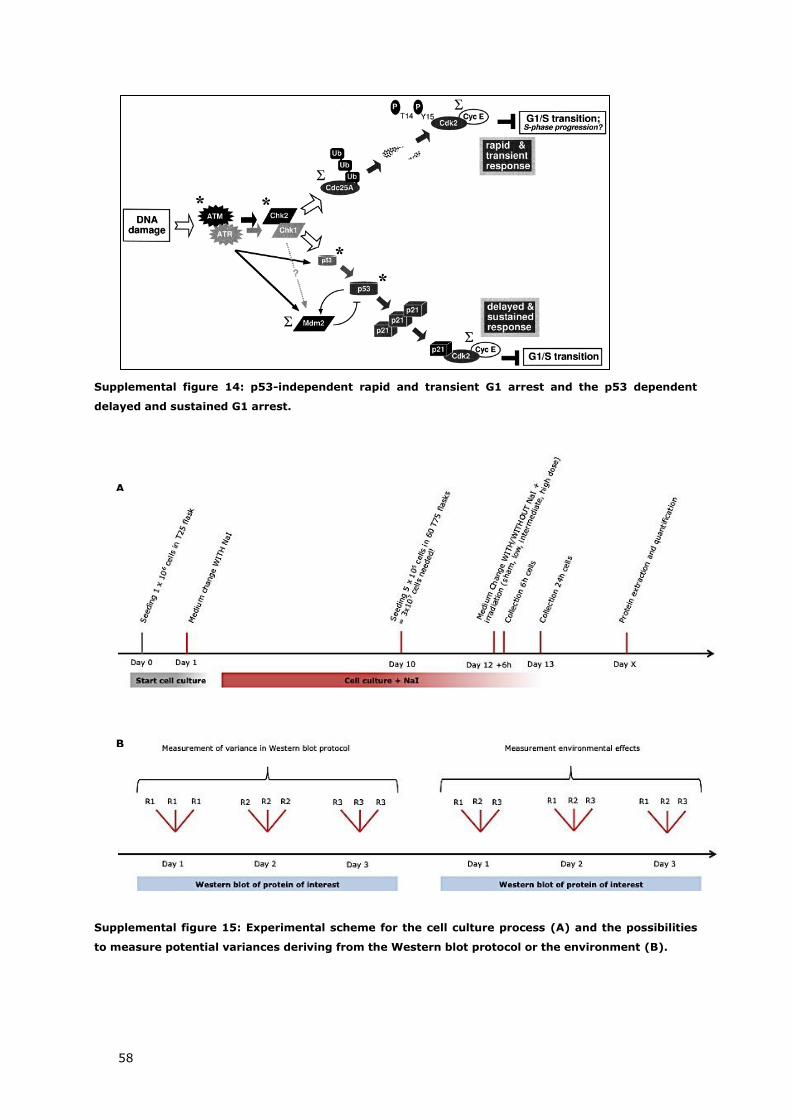
58
Supplemental figure 14: p53-independent rapid and transient G1 arrest and the p53 dependent
delayed and sustained G1 arrest.
Supplemental figure 15: Experimental scheme for the cell culture process (A) and the possibilities
to measure potential variances deriving from the Western blot protocol or the environment (B).
A
B

Auteursrechtelijke overeenkomst
Ik/wij verlenen het wereldwijde auteursrecht voor de ingediende eindverhandeling:
Cellular and molecular effects of iodine deficiency and ionizing radiation on
non-cancerous thyroid cells
Richting: master in de biomedische wetenschappen-klinische moleculaire
wetenschappen
Jaar: 2016
in alle mogelijke mediaformaten, - bestaande en in de toekomst te ontwikkelen - , aan de
Universiteit Hasselt.
Niet tegenstaand deze toekenning van het auteursrecht aan de Universiteit Hasselt
behoud ik als auteur het recht om de eindverhandeling, - in zijn geheel of gedeeltelijk -,
vrij te reproduceren, (her)publiceren of distribueren zonder de toelating te moeten
verkrijgen van de Universiteit Hasselt.
Ik bevestig dat de eindverhandeling mijn origineel werk is, en dat ik het recht heb om de
rechten te verlenen die in deze overeenkomst worden beschreven. Ik verklaar tevens dat
de eindverhandeling, naar mijn weten, het auteursrecht van anderen niet overtreedt.
Ik verklaar tevens dat ik voor het materiaal in de eindverhandeling dat beschermd wordt
door het auteursrecht, de nodige toelatingen heb verkregen zodat ik deze ook aan de
Universiteit Hasselt kan overdragen en dat dit duidelijk in de tekst en inhoud van de
eindverhandeling werd genotificeerd.
Universiteit Hasselt zal mij als auteur(s) van de eindverhandeling identificeren en zal geen
wijzigingen aanbrengen aan de eindverhandeling, uitgezonderd deze toegelaten door deze
overeenkomst.
Voor akkoord,
Daems, Noami
Datum: 8/06/2016