2016 annual report - amazon s3
TRANSCRIPT

2016 Annual Report
The Northwest Seaport Alliance is a marine cargo
operating partnership of the Port of Seattle and Port of
Tacoma. We are the fourth-largest container gateway in
North America. Under a port development authority,
the alliance manages container, breakbulk, auto and
some bulk terminals in Seattle and Tacoma.

NWSA FEATURESCEO LETTER ........................................................................................ 2
LEADERSHIP ......................................................................................... 4
STATE OF THE INDUSTRY ............................................................... 6
STRATEGIC INVESTMENTS ............................................................ 8
ENVIRONMENTAL ............................................................................. 10
CUSTOMER CARE ............................................................................. 12
PARTNERSHIPS .................................................................................... 14
TRADE STATISTICS ............................................................................ 18
NWSA FINANCIALS ............................................................................ 20
TABLE OF CONTENTS
2016 Annual Report
THE NORTHWEST SEAPORT ALLIANCE P.O. Box 2985 Tacoma, WA 98401-2985800-657-9808
North Harbor (Seattle)Pier 69, 2711 Alaskan Way Seattle, WA 98121
South Harbor (Tacoma)One Sitcum Plaza Tacoma, WA 98421
www.nwseaportalliance.com1

THE NORTHWEST SEAPORT ALLIANCE
2
John Wolfe, chief executive officerThe Northwest Seaport Alliance
A full calendar year is in the books since we embarked
on the journey as The Northwest Seaport Alliance. This
important partnership between the ports of Seattle and
Tacoma to direct and oversee marine cargo facilities
and maritime cargo business saw many benefits and
opportunities to grow.
Once rivals, the two ports have embraced collabora-
tion for the betterment of our gateway. In November,
we were honored to be named Port of the Year by the
Washington Public Ports Association. Our work on mod-
ernizing the General Central Peninsula and Terminal 5,
the Operations Service Center and diversifying cargo
were a few of the major accomplishments that WPPA’s
selection committee noted.
We held a dozen workshops throughout the year with
importers and exporters across the state to hear their
needs and concerns. We took their recommendations
and implemented changes, including providing online
tools to improve truck turn times and rolling out a pilot
program for extended gate hours at our terminals. We
also continue to combine our efforts between the two
ports to reduce our environmental footprint and protect
air and water quality through initiatives like the North-
west Ports Clean Air Strategy and stormwater manage-
ment programs.
We welcomed several ocean vessels making their first
voyage to the Puget Sound area. In the spring, all
eyes were on the CMA CGM Benjamin Franklin as the
mega-ship made a grand entrance at Terminal 18 in our
North Harbor. In the fall, Pacific Basin Shipping’s Olive
Bay, reputed to be the world’s largest single-deck bulk/
log carrier, called at the West Hylebos log terminal in
our South Harbor.
It’s important to note that these new-generation ships
underscore the need to modernize our infrastructure
and capabilities. I’m grateful to our Managing Members
for supporting investment in infrastructure improve-
ments at both harbors. While the upgrades are vital to
our gateway’s success in the years to come, I know it
took bold leadership for the five commissioners from
each port to approve these major projects in our first
year.
Considering the continuing trend of larger vessels
sailing from even fewer ocean carriers, the competition
within the maritime industry is tighter than ever. While
we have our work cut out for us, I believe in the power
of two. Our diverse cargo portfolio and commitment to
an environmentally responsible supply chain have po-
sitioned us to offer best-in-class service to better meet
our customers’ needs and also make our region more
competitive in the global economy, while creating new,
family-wage jobs in Washington.
I’m confident that we are moving in the right direc-
tion to take on the challenges awaiting us beyond the
horizon, and I look forward to having you along on the
journey.
John Wolfe, chief executive officer
The Northwest Seaport Alliance
CEO LETTER THE POWER OF TWO Seattle and Tacoma stronger as one
NWSA: FEATURESAnnual Report / 2016
3
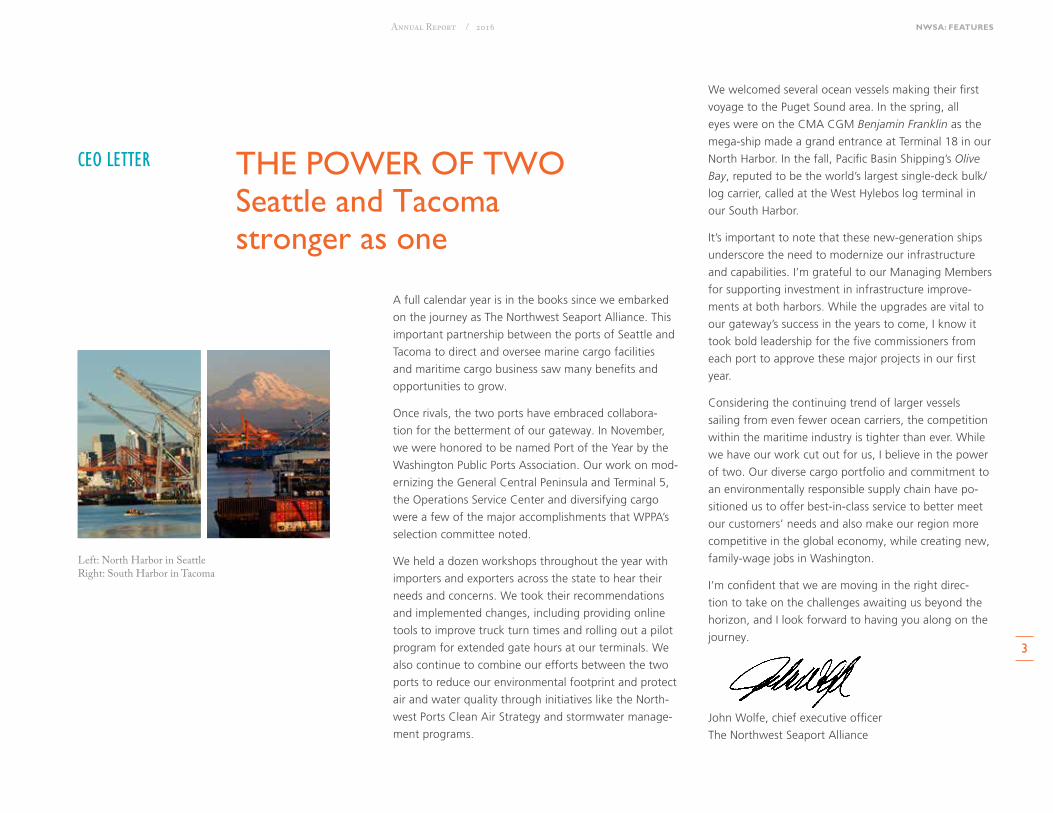
Left: North Harbor in SeattleRight: South Harbor in Tacoma

LEADERSHIP
In August 2015, the ports of Seattle and Tacoma joined
forces and formed The Northwest Seaport Alliance.
The first of its kind in North America, the partnership
unifies the two ports’ marine cargo terminal investments,
operations, planning and marketing activities to strengthen
the Puget Sound gateway and attract more business
opportunities to the region. The alliance is governed by the
elected commissions of the two ports as equal members.
THE NORTHWEST SEAPORT ALLIANCE
4

PORT OF TACOMA COMMISSION
1. Connie Bacon (2016 President)2. Don Johnson3. Dick Marzano4. Don Meyer5. Clare Petrich
1
54
98
2
6
10
3
7
NWSA: FEATURESAnnual Report / 2016
5PORT OF SEATTLECOMMISSION
6. Tom Albro7. Stephanie Bowman8. John Creighton (2016 President)9. Fred Felleman 10. Courtney Gregoire

THE NORTHWEST SEAPORT ALLIANCE
6
A Foss Maritime tugboat assists Evergreen Marine Corporation’s Ever Uberty through the Blair Waterway in the South Harbor.

The maritime industry is navigating through a period
of unprecedented change that is taking place at an
increasingly fast pace.
During 2016, we saw the first 18,000-TEU (twenty-foot
equivalent units) ship call in Puget Sound, shipping
industry consolidation through a series of mergers and
acquisitions among the major shipping lines, a re-shuf-
fling of alliances between carriers and the bankruptcy
of Hanjin Shipping – the world’s seventh-largest
international container carrier.
These major waves are generating a perfect storm in
international trade.
Over the past few years, shipping lines have invested in
increasingly larger vessels to drive economies of scale
and thereby reduce operating costs. But slow growth in
international trade, along with excess container capacity
fueled by the introduction of these larger ships, have
created an environment where shipping lines struggle
for profitability. Carriers have responded by forming
alliances among themselves to fill their ships in the face
of lackluster demand.
Anticipating what was unfolding, the ports of Tacoma
and Seattle proactively formed The Northwest Seaport
Alliance in 2015. The partnership allows us to capitalize
on the strengths of the individual ports and leverage
our strategic investments to compete more effectively
alongside other major ports on a national and global
scale.
The drastic changes shaping our industry, however, are
surging faster and more dynamically than any of us had
envisioned.
As a port authority, we recognize the need to rethink
our strategy. But we cannot do it alone. We must work
with our customers and stakeholders, and make in-
formed decisions on investments inside and outside the
terminal gates to drive efficiency and productivity.
As we forge ahead, the ports are faced with the reality
that significant capital investments alone no longer
guarantee additional cargo volumes and new business
revenue. That’s why we are focused on developing
creative partnerships to drive the economic benefits and
job opportunities for our communities and our
customers.
NWSA: FEATURESAnnual Report / 2016
7
THE STATE OF THE INDUSTRY Adapting to the changing industry
As the maritime industry evolves through shipping
line consolidations and the growing presence of
mega-ships, it has created fierce competition among
ports to invest in infrastructure to expand efficiency and
cargo handling capabilities.
Decades ago, container ships calling Puget Sound aver-
aged 4,000 TEUs. The average vessel size has since dou-
bled, and 10,000-TEU vessels are no longer uncommon.
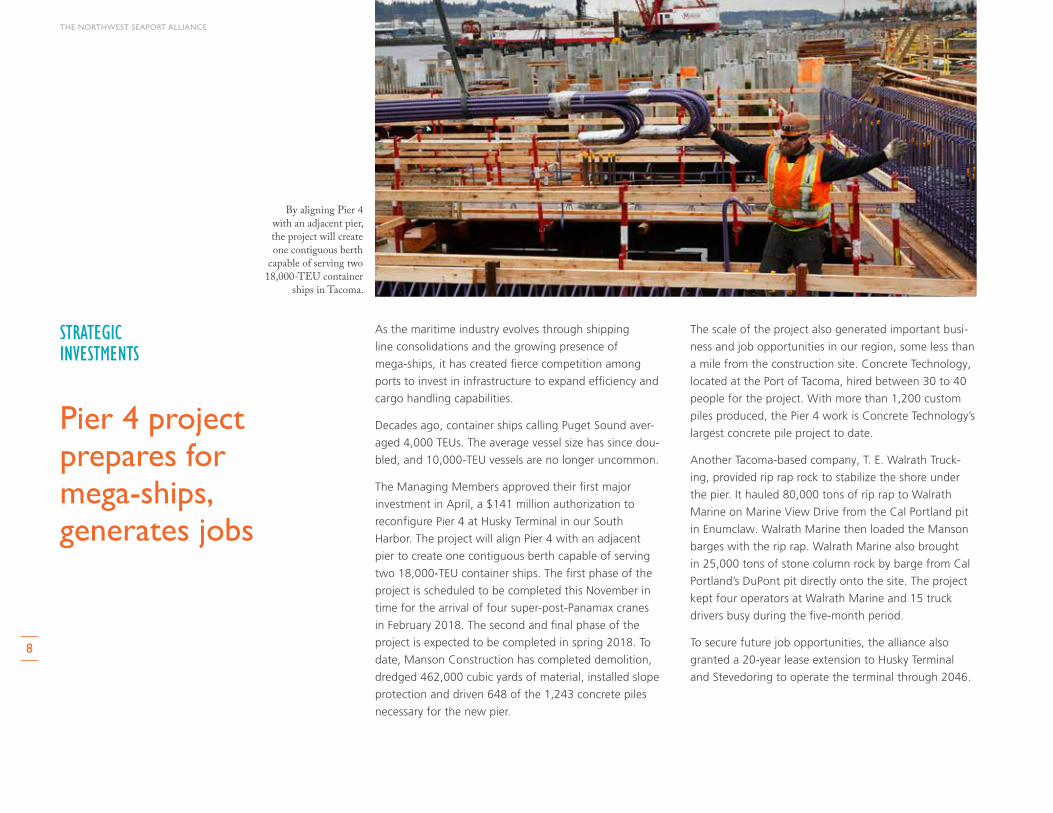
The Managing Members approved their first major
investment in April, a $141 million authorization to
reconfigure Pier 4 at Husky Terminal in our South
Harbor. The project will align Pier 4 with an adjacent
pier to create one contiguous berth capable of serving
two 18,000-TEU container ships. The first phase of the
project is scheduled to be completed this November in
time for the arrival of four super-post-Panamax cranes
in February 2018. The second and final phase of the
project is expected to be completed in spring 2018. To
date, Manson Construction has completed demolition,
dredged 462,000 cubic yards of material, installed slope
protection and driven 648 of the 1,243 concrete piles
necessary for the new pier.
The scale of the project also generated important busi-
ness and job opportunities in our region, some less than
a mile from the construction site. Concrete Technology,
located at the Port of Tacoma, hired between 30 to 40
people for the project. With more than 1,200 custom
piles produced, the Pier 4 work is Concrete Technology’s
largest concrete pile project to date.
Another Tacoma-based company, T. E. Walrath Truck-
ing, provided rip rap rock to stabilize the shore under
the pier. It hauled 80,000 tons of rip rap to Walrath
Marine on Marine View Drive from the Cal Portland pit
in Enumclaw. Walrath Marine then loaded the Manson
barges with the rip rap. Walrath Marine also brought
in 25,000 tons of stone column rock by barge from Cal
Portland’s DuPont pit directly onto the site. The project
kept four operators at Walrath Marine and 15 truck
drivers busy during the five-month period.
To secure future job opportunities, the alliance also
granted a 20-year lease extension to Husky Terminal
and Stevedoring to operate the terminal through 2046.
STRATEGIC INVESTMENTS
Pier 4 project prepares for mega-ships, generates jobs
THE NORTHWEST SEAPORT ALLIANCE
8
By aligning Pier 4 with an adjacent pier, the project will create one contiguous berth
capable of serving two 18,000-TEU container
ships in Tacoma.
Terminal 5 improvements under design
With mega-ships projected to make up some 80 percent of container ships within the next 25 years, Terminal 5 in our North Harbor is preparing to undergo improvements to handle two 18,000-TEU vessels. The proposed improvements include deepening the waterway, strengthening the pier to hold heavier cranes and modifying the rail and yard to handle as many as 1.7 million TEUs each year. Container operations at Terminal 5 ended in 2014 to allow for the improvements, although it has been available in the interim for breakbulk cargo.Following a public comment period, the Port of Seattle issued the final Environmental Impact Statement in late 2016 for the container terminal improvements. Mitigation measures for the project include plug-in capability for shore power at two berths, air quality performance tracking, a gate queue management plan and a truck driver information system.
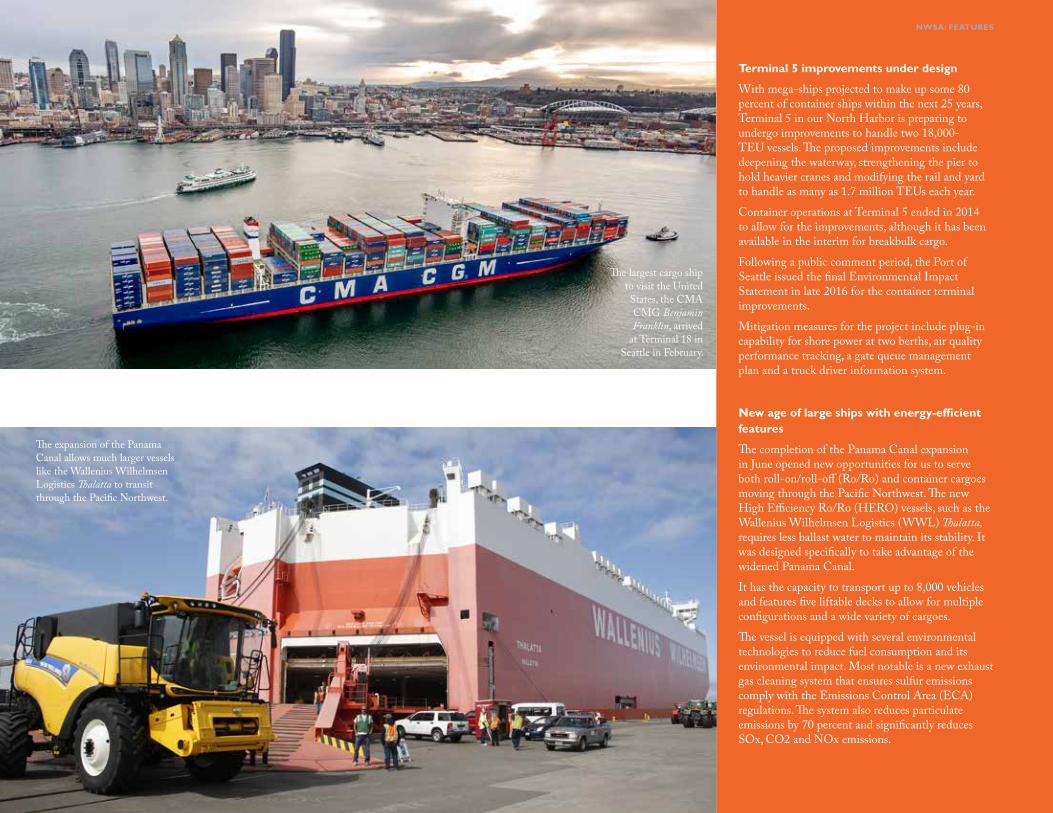
New age of large ships with energy-efficient features
The completion of the Panama Canal expansion in June opened new opportunities for us to serve both roll-on/roll-off (Ro/Ro) and container cargoes moving through the Pacific Northwest. The new High Efficiency Ro/Ro (HERO) vessels, such as the Wallenius Wilhelmsen Logistics (WWL) Thalatta, requires less ballast water to maintain its stability. It was designed specifically to take advantage of the widened Panama Canal.It has the capacity to transport up to 8,000 vehicles and features five liftable decks to allow for multiple configurations and a wide variety of cargoes. The vessel is equipped with several environmental technologies to reduce fuel consumption and its environmental impact. Most notable is a new exhaust gas cleaning system that ensures sulfur emissions comply with the Emissions Control Area (ECA) regulations. The system also reduces particulate emissions by 70 percent and significantly reduces SOx, CO2 and NOx emissions.
NWSA: FEATURESAnnual Report / 2016
11
The expansion of the Panama Canal allows much larger vessels like the Wallenius Wilhelmsen Logistics Thalatta to transit through the Pacific Northwest.
The largest cargo ship to visit the United States, the CMA CMG Benjamin Franklin, arrived
at Terminal 18 in Seattle in February.
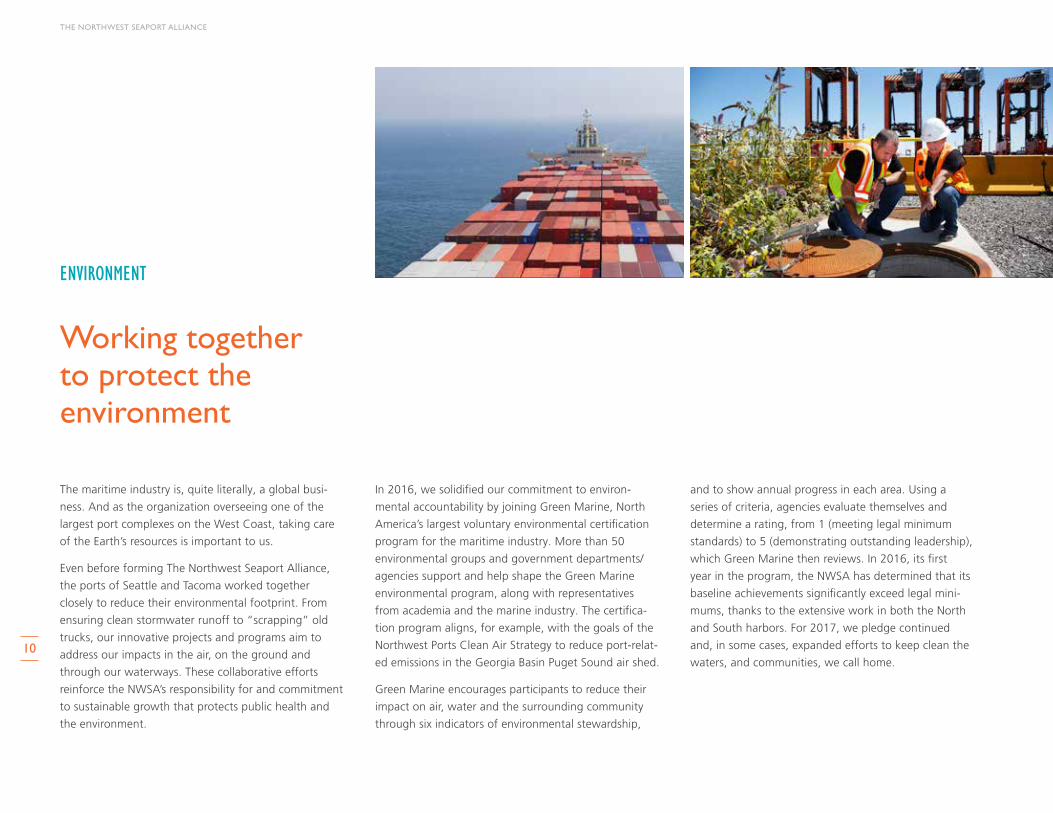
ENVIRONMENT
The maritime industry is, quite literally, a global busi-
ness. And as the organization overseeing one of the
largest port complexes on the West Coast, taking care
of the Earth’s resources is important to us.
Even before forming The Northwest Seaport Alliance,
the ports of Seattle and Tacoma worked together
closely to reduce their environmental footprint. From
ensuring clean stormwater runoff to “scrapping” old
trucks, our innovative projects and programs aim to
address our impacts in the air, on the ground and
through our waterways. These collaborative efforts
reinforce the NWSA’s responsibility for and commitment
to sustainable growth that protects public health and
the environment.
In 2016, we solidified our commitment to environ-
mental accountability by joining Green Marine, North
America’s largest voluntary environmental certification
program for the maritime industry. More than 50
environmental groups and government departments/
agencies support and help shape the Green Marine
environmental program, along with representatives
from academia and the marine industry. The certifica-
tion program aligns, for example, with the goals of the
Northwest Ports Clean Air Strategy to reduce port-relat-
ed emissions in the Georgia Basin Puget Sound air shed.
Green Marine encourages participants to reduce their
impact on air, water and the surrounding community
through six indicators of environmental stewardship,
and to show annual progress in each area. Using a
series of criteria, agencies evaluate themselves and
determine a rating, from 1 (meeting legal minimum
standards) to 5 (demonstrating outstanding leadership),
which Green Marine then reviews. In 2016, its first
year in the program, the NWSA has determined that its
baseline achievements significantly exceed legal mini-
mums, thanks to the extensive work in both the North
and South harbors. For 2017, we pledge continued
and, in some cases, expanded efforts to keep clean the
waters, and communities, we call home.
THE NORTHWEST SEAPORT ALLIANCE
10
Working together to protect the environment
Exceeding a key performance indicator
Every year, we aim to expand the amount of alliance-
owned property that has stormwater pollution-pro-
tection measures in place. “Source control” addresses
stormwater at the point of generation; one alliance
Key Performance Indicator is to increase the amount of
acreage with source-control measures in place by 15
percent annually. We beat that indicator by 45 percent;
placing an additional 70 acres under source control
instead of just 50. This work was done in both North
and South harbors.
“We’re on a continuous improvement process with
our treatment systems and permit compliance,” said
Deanna Seaman, the alliance’s senior manager of envi-
ronmental water quality. “We’re working with tenants
to share what we’ve learned, with a goal of consistent
attainment across the port industrial areas and among
businesses that operate on alliance properties.”
Working together on source control
In 2016, representatives of the NWSA, terminal oper-
ators, environmental agencies and other stakeholders
began meeting quarterly to share lessons learned. Part
educational session, part networking opportunity, the
meetings of the Stormwater Working Group are an
outgrowth of longtime, informal efforts at the South
Harbor and incorporate both ports on a more official
level. An increasing number of tenants have been par-
ticipating in the meetings and providing input on best
practices, generating more from-the-ground-up—rather
than top-down—discussions. This is also a key initiative
in the alliance strategic plan.
Building a model project
We retrofitted an oil/water separator at the South
Harbor’s East Blair 1 Terminal to filter out metals from
the water. The innovative project was installed at the
end of the year, and since then, we’ve taken water
samples regularly to gauge the system’s effectiveness in
removing metals. Early tests have shown the separator
has removed 50 to 80 percent of metals in the water. If
consistent, such results demonstrate that the separator
is doing its job and can be replicated not only at other
alliance properties, but also, potentially, at other ports.
Innovating cleaner water at both harbors
A bioretention system at the West Hylebos Log Yard
in the South Harbor met benchmarks for water quality
two years in a row. These clean test results indicate the
system is performing as designed at the site, filtering
stormwater through four stages—two piped, two
gravity fed—that include passing through filtration
media and plants. In addition, modular wetland and
membrane filtration “jellyfish” systems at the North
and South Intermodal yards have reached consistent
attainment for most permit pollutants parameters. The
work in the North Harbor, installing chemical treatment
systems and enhanced media systems, represents only
the first phase of a multi-year, multi-million-dollar effort
to improve stormwater treatment at customer terminals.
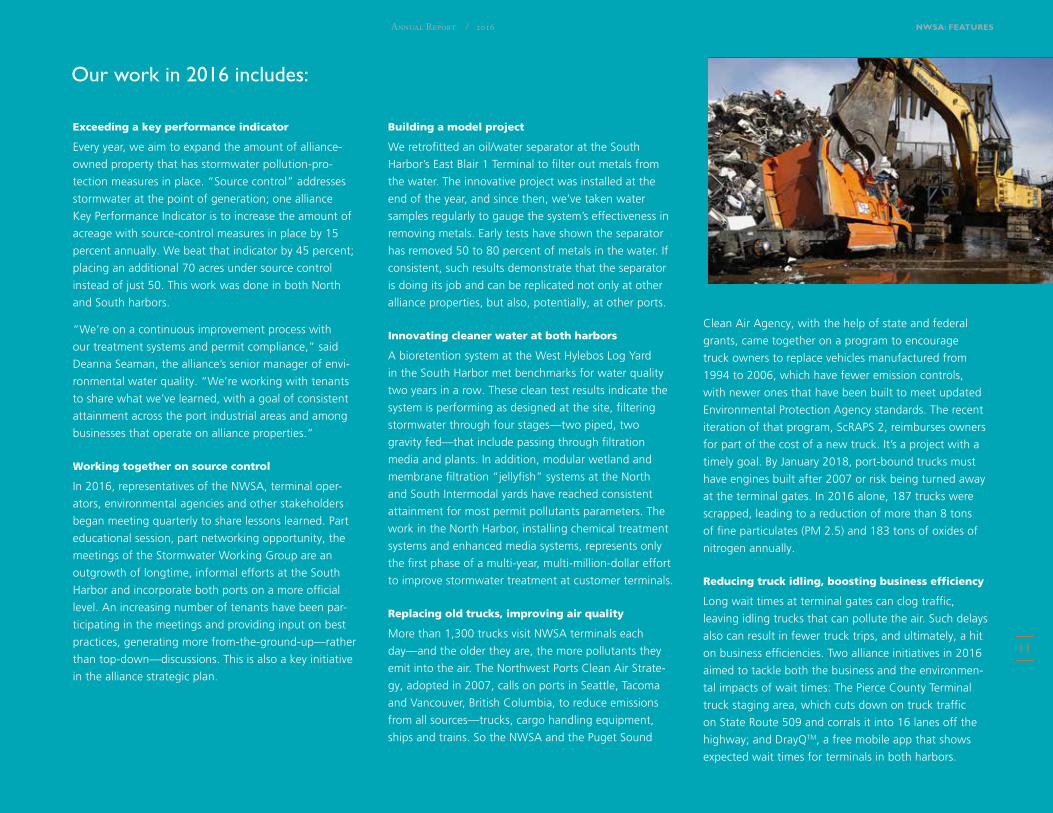
Replacing old trucks, improving air quality
More than 1,300 trucks visit NWSA terminals each
day—and the older they are, the more pollutants they
emit into the air. The Northwest Ports Clean Air Strate-
gy, adopted in 2007, calls on ports in Seattle, Tacoma
and Vancouver, British Columbia, to reduce emissions
from all sources—trucks, cargo handling equipment,
ships and trains. So the NWSA and the Puget Sound
Clean Air Agency, with the help of state and federal
grants, came together on a program to encourage
truck owners to replace vehicles manufactured from
1994 to 2006, which have fewer emission controls,
with newer ones that have been built to meet updated
Environmental Protection Agency standards. The recent
iteration of that program, ScRAPS 2, reimburses owners
for part of the cost of a new truck. It’s a project with a
timely goal. By January 2018, port-bound trucks must
have engines built after 2007 or risk being turned away
at the terminal gates. In 2016 alone, 187 trucks were
scrapped, leading to a reduction of more than 8 tons
of fine particulates (PM 2.5) and 183 tons of oxides of
nitrogen annually.
Reducing truck idling, boosting business efficiency
Long wait times at terminal gates can clog traffic,
leaving idling trucks that can pollute the air. Such delays
also can result in fewer truck trips, and ultimately, a hit
on business efficiencies. Two alliance initiatives in 2016
aimed to tackle both the business and the environmen-
tal impacts of wait times: The Pierce County Terminal
truck staging area, which cuts down on truck traffic
on State Route 509 and corrals it into 16 lanes off the
highway; and DrayQTM, a free mobile app that shows
expected wait times for terminals in both harbors.
NWSA: FEATURESAnnual Report / 2016
11
Our work in 2016 includes:
We pride ourselves on doing what’s right for our cus-
tomers. We value partnering with our stakeholders and
collaborating on ways to improve gateway performance
and service delivery. We formed the Executive Advisory
Council and invited industry leaders to offer input on
improving rail, ship, trucking and crane performance
across our gateway. Based on what we heard, we
launched the Operations Service Center to provide
greater visibility to cargo movement within the gateway
to our customers and industry partners.
The Operations Service Center includes both day-to-day
operational engagement and strategic improvement
initiatives to drive best-in-class service. Its main focus
areas include waterway management, road and rail
network efficiency, terminal operations, operational
planning and analysis and supporting business continu-
ity. To maximize efficiency of the supply chain, the Op-
erations Service Center implemented an extended gate
hours program during peak season, facilitated a crane
mentorship program and added terminal visibility tools.
Using Key Performance Indicators as metrics set by the
Executive Advisory Council, we’ll continue to identify
and implement ways to remain one of the easiest places
in which to do business.
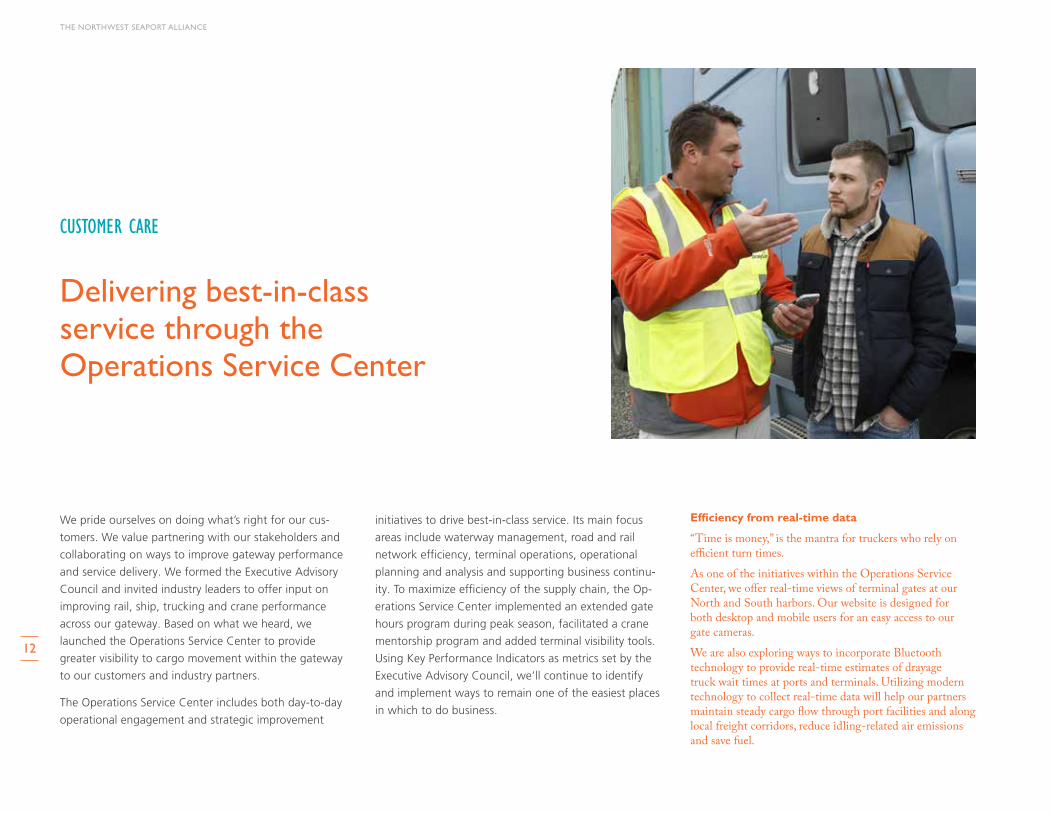
CUSTOMER CARE
Delivering best-in-class service through the Operations Service Center
THE NORTHWEST SEAPORT ALLIANCE
12
Efficiency from real-time data
“Time is money,” is the mantra for truckers who rely on efficient turn times.As one of the initiatives within the Operations Service Center, we offer real-time views of terminal gates at our North and South harbors. Our website is designed for both desktop and mobile users for an easy access to our gate cameras.We are also exploring ways to incorporate Bluetooth technology to provide real-time estimates of drayage truck wait times at ports and terminals. Utilizing modern technology to collect real-time data will help our partners maintain steady cargo flow through port facilities and along local freight corridors, reduce idling-related air emissions and save fuel.

Quest for quality
The Northwest Seaport Alliance ports of Seattle and Taco-ma were honored in Logistics Management’s 2016 Quest for Quality awards, ranking highest on the U.S. West Coast and second overall in the West Coast category. The winners were selected by the magazine readers – the buyers of logistics and transportation services who worked with the carriers and providers they evaluated. The recogni-tion reaffirms our commitment to making The Northwest Seaport Alliance the best gateway in North America. The ports were evaluated based on five criteria: ease of doing business, value, ocean carrier network, intermodal network, and equipment and operations. A port had to receive at least 5 percent of the category vote to win.
Extended gate hours prove great success
During peak season, we offered shippers 15 weeks of extended service hours at international container terminals in both harbors. To help cover the costs, we reimbursed marine terminal operators up to $2 million to keep their facilities open longer hours. The pilot program was designed to reduce truck congestion on surface streets in the port industrial area, improve safety and keep cargo flowing efficiently. Terminals offered various extended hour options, including flex gates from 7 a.m. to 8 a.m., lunch gate hours Monday through Friday, an off-shift gate after 5 p.m. Monday through Friday, or Saturday or Sunday gates. In the end, the availability of Saturday gates proved particularly successful as it allowed for additional drayage of import cargo during peak season, improving terminal fluidity during business hours. During the program, two terminals offered Saturday gates on a regular basis; 3.2 percent of total transactions were moved on Saturdays.Originally intended for 12 weeks, we extended the program three additional weeks based on positive feedback from our customers and to support the season’s strong agricultural exports. On average, about 8 to 10 percent of the total NWSA gate volumes moved during extended gate hours. About 70 to 90 additional terminal gate hours in the North and South harbors were offered each week during the program.
NWSA: FEATURESAnnual Report / 2016
15
Knowing the wait times at the terminals helps truck drivers better plan their dray moves.

THE NORTHWEST SEAPORT ALLIANCE
14
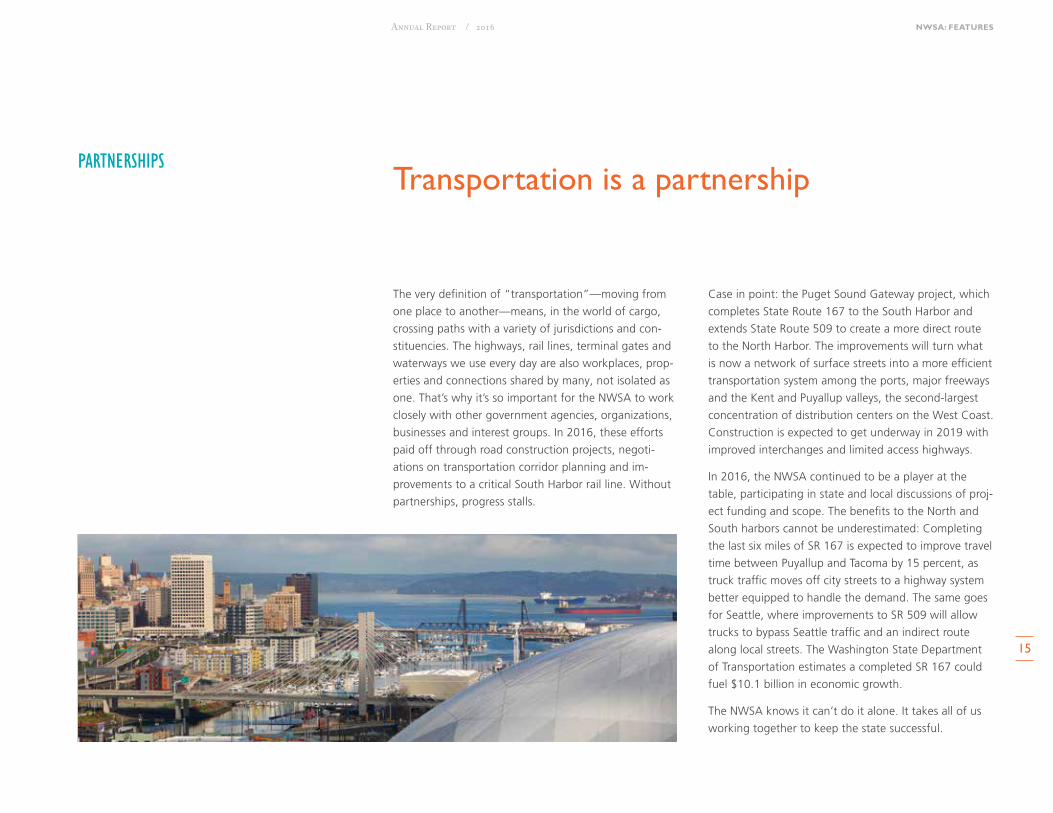
The very definition of “transportation”—moving from
one place to another—means, in the world of cargo,
crossing paths with a variety of jurisdictions and con-
stituencies. The highways, rail lines, terminal gates and
waterways we use every day are also workplaces, prop-
erties and connections shared by many, not isolated as
one. That’s why it’s so important for the NWSA to work
closely with other government agencies, organizations,
businesses and interest groups. In 2016, these efforts
paid off through road construction projects, negoti-
ations on transportation corridor planning and im-
provements to a critical South Harbor rail line. Without
partnerships, progress stalls.
Case in point: the Puget Sound Gateway project, which
completes State Route 167 to the South Harbor and
extends State Route 509 to create a more direct route
to the North Harbor. The improvements will turn what
is now a network of surface streets into a more efficient
transportation system among the ports, major freeways
and the Kent and Puyallup valleys, the second-largest
concentration of distribution centers on the West Coast.
Construction is expected to get underway in 2019 with
improved interchanges and limited access highways.
In 2016, the NWSA continued to be a player at the
table, participating in state and local discussions of proj-
ect funding and scope. The benefits to the North and
South harbors cannot be underestimated: Completing
the last six miles of SR 167 is expected to improve travel
time between Puyallup and Tacoma by 15 percent, as
truck traffic moves off city streets to a highway system
better equipped to handle the demand. The same goes
for Seattle, where improvements to SR 509 will allow
trucks to bypass Seattle traffic and an indirect route
along local streets. The Washington State Department
of Transportation estimates a completed SR 167 could
fuel $10.1 billion in economic growth.
The NWSA knows it can’t do it alone. It takes all of us
working together to keep the state successful.
PARTNERSHIPSTransportation is a partnership
NWSA: FEATURESAnnual Report / 2016
15
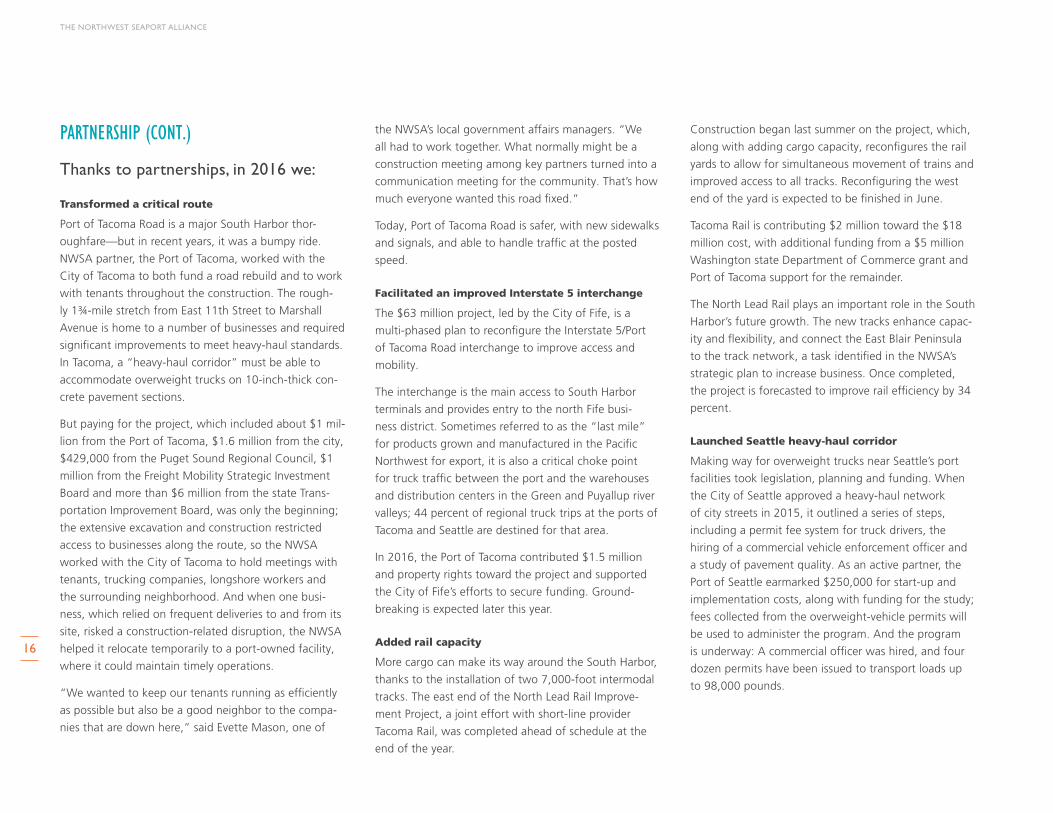
Thanks to partnerships, in 2016 we:
Transformed a critical route
Port of Tacoma Road is a major South Harbor thor-
oughfare—but in recent years, it was a bumpy ride.
NWSA partner, the Port of Tacoma, worked with the
City of Tacoma to both fund a road rebuild and to work
with tenants throughout the construction. The rough-
ly 1¾-mile stretch from East 11th Street to Marshall
Avenue is home to a number of businesses and required
significant improvements to meet heavy-haul standards.
In Tacoma, a “heavy-haul corridor” must be able to
accommodate overweight trucks on 10-inch-thick con-
crete pavement sections.
But paying for the project, which included about $1 mil-
lion from the Port of Tacoma, $1.6 million from the city,
$429,000 from the Puget Sound Regional Council, $1
million from the Freight Mobility Strategic Investment
Board and more than $6 million from the state Trans-
portation Improvement Board, was only the beginning;
the extensive excavation and construction restricted
access to businesses along the route, so the NWSA
worked with the City of Tacoma to hold meetings with
tenants, trucking companies, longshore workers and
the surrounding neighborhood. And when one busi-
ness, which relied on frequent deliveries to and from its
site, risked a construction-related disruption, the NWSA
helped it relocate temporarily to a port-owned facility,
where it could maintain timely operations.
“We wanted to keep our tenants running as efficiently
as possible but also be a good neighbor to the compa-
nies that are down here,” said Evette Mason, one of
the NWSA’s local government affairs managers. “We
all had to work together. What normally might be a
construction meeting among key partners turned into a
communication meeting for the community. That’s how
much everyone wanted this road fixed.”
Today, Port of Tacoma Road is safer, with new sidewalks
and signals, and able to handle traffic at the posted
speed.
Facilitated an improved Interstate 5 interchange
The $63 million project, led by the City of Fife, is a
multi-phased plan to reconfigure the Interstate 5/Port
of Tacoma Road interchange to improve access and
mobility.
The interchange is the main access to South Harbor
terminals and provides entry to the north Fife busi-
ness district. Sometimes referred to as the “last mile”
for products grown and manufactured in the Pacific
Northwest for export, it is also a critical choke point
for truck traffic between the port and the warehouses
and distribution centers in the Green and Puyallup river
valleys; 44 percent of regional truck trips at the ports of
Tacoma and Seattle are destined for that area.
In 2016, the Port of Tacoma contributed $1.5 million
and property rights toward the project and supported
the City of Fife’s efforts to secure funding. Ground-
breaking is expected later this year.
Added rail capacity
More cargo can make its way around the South Harbor,
thanks to the installation of two 7,000-foot intermodal
tracks. The east end of the North Lead Rail Improve-
ment Project, a joint effort with short-line provider
Tacoma Rail, was completed ahead of schedule at the
end of the year.
Construction began last summer on the project, which,
along with adding cargo capacity, reconfigures the rail
yards to allow for simultaneous movement of trains and
improved access to all tracks. Reconfiguring the west
end of the yard is expected to be finished in June.
Tacoma Rail is contributing $2 million toward the $18
million cost, with additional funding from a $5 million
Washington state Department of Commerce grant and
Port of Tacoma support for the remainder.
The North Lead Rail plays an important role in the South
Harbor’s future growth. The new tracks enhance capac-
ity and flexibility, and connect the East Blair Peninsula
to the track network, a task identified in the NWSA’s
strategic plan to increase business. Once completed,
the project is forecasted to improve rail efficiency by 34
percent.
Launched Seattle heavy-haul corridor
Making way for overweight trucks near Seattle’s port
facilities took legislation, planning and funding. When
the City of Seattle approved a heavy-haul network
of city streets in 2015, it outlined a series of steps,
including a permit fee system for truck drivers, the
hiring of a commercial vehicle enforcement officer and
a study of pavement quality. As an active partner, the
Port of Seattle earmarked $250,000 for start-up and
implementation costs, along with funding for the study;
fees collected from the overweight-vehicle permits will
be used to administer the program. And the program
is underway: A commercial officer was hired, and four
dozen permits have been issued to transport loads up
to 98,000 pounds.
THE NORTHWEST SEAPORT ALLIANCE
16
PARTNERSHIP (CONT.)

NWSA: FEATURESAnnual Report / 2016
19
The Northwest Seaport Alliance’s full portfolio of terminals gives more flexibility to meet the changing customer needs.

CHINA (INC. HK) $32.5 BILLION
JAPAN $17.4 BILLION
S. KOREA $6.0 BILLION
TAIWAN $3.9 BILLION
VIETNAM $2.3 BILLION
THAILAND $1.3 BILLION
AUSTRALIA $1.0 BILLION
MALAYSIA $1.0 BILLION
SINGAPORE $784.5 MILLION
INDIA $781.9 MILLION
PHILIPPINES $632.4 MILLION
GERMANY $574.4 MILLION
CANADA $567.5 MILLION
ITALY $394.7 MILLION
NETHERLANDS $382.9 MILLION
CHILE $325.2 MILLION
UK $321.4 MILLION
NEW ZEALAND $310.0 MILLION
BRAZIL $292.2 MILLION
RUSSIA $256.7 MILLION
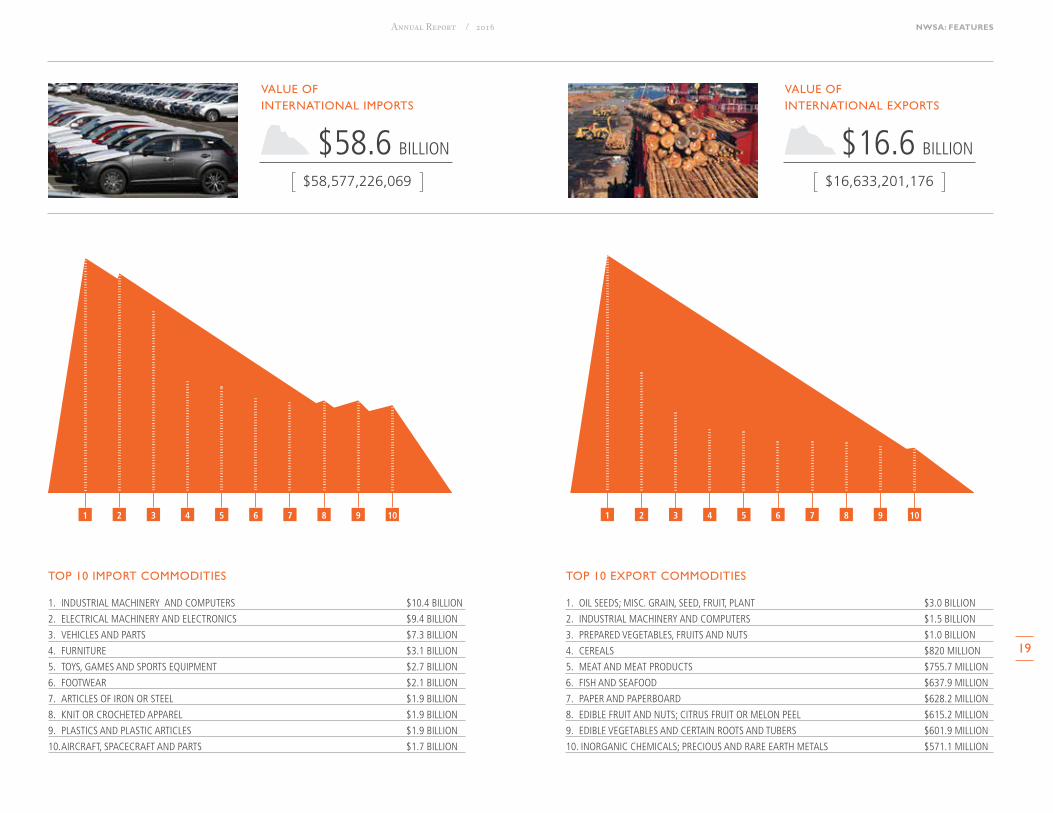
1. OIL SEEDS; MISC. GRAIN, SEED, FRUIT, PLANT $3.0 BILLION
2. INDUSTRIAL MACHINERY AND COMPUTERS $1.5 BILLION
3. PREPARED VEGETABLES, FRUITS AND NUTS $1.0 BILLION
4. CEREALS $820 MILLION
5. MEAT AND MEAT PRODUCTS $755.7 MILLION
6. FISH AND SEAFOOD $637.9 MILLION
7. PAPER AND PAPERBOARD $628.2 MILLION
8. EDIBLE FRUIT AND NUTS; CITRUS FRUIT OR MELON PEEL $615.2 MILLION
9. EDIBLE VEGETABLES AND CERTAIN ROOTS AND TUBERS $601.9 MILLION
10. INORGANIC CHEMICALS; PRECIOUS AND RARE EARTH METALS $571.1 MILLION
TOP 10 IMPORT COMMODITIES TOP 10 EXPORT COMMODITIES
1. INDUSTRIAL MACHINERY AND COMPUTERS $10.4 BILLION
2. ELECTRICAL MACHINERY AND ELECTRONICS $9.4 BILLION
3. VEHICLES AND PARTS $7.3 BILLION
4. FURNITURE $3.1 BILLION
5. TOYS, GAMES AND SPORTS EQUIPMENT $2.7 BILLION
6. FOOTWEAR $2.1 BILLION
7. ARTICLES OF IRON OR STEEL $1.9 BILLION
8. KNIT OR CROCHETED APPAREL $1.9 BILLION
9. PLASTICS AND PLASTIC ARTICLES $1.9 BILLION
10. AIRCRAFT, SPACECRAFT AND PARTS $1.7 BILLION
TOP 10 INTERNATIONAL TRADING PARTNERSVALUE OF INTERNATIONAL IMPORTS
TRADING PARTNERS 11–20
NWSA CARGO HIGHLIGHTS
$58.6 BILLION
$58,577,226,069
$75,210,427,245
VALUE OF INTERNATIONAL EXPORTS
$16.6 BILLION
$16,633,201,176VALUE OF TWO-WAY INTERNATIONAL TRADE
TOTAL TEUs
3,615,752 TEUs
TOTAL TONNAGE
28,026,869 metric tons
AUTO UNITS
165,687units
BREAKBULK CARGO
181,372 metric tons
LOGS
176,928metric tons
VESSEL CALLS
1,995calls
VALUE OF INTL. TRADE
$75.2billion
VALUE OF DOMESTIC TRADE
$5.4 billion
The Puget Sound's annual trade with Alaska is estimated at $5.4 billion. If ranked with our international partners, Alaska would be fourth.(Source: 2015 update to Ties That Bind study)
$75.2BILLION
1 2 3 4 5 6 7 8 9 10 1 2 3 4 5 6 7 8 9 10
THE NORTHWEST SEAPORT ALLIANCE
18
NWSA 2016 TRADE STATISTICS
The Northwest Seaport Alliance is off to a busy start in its first year.
CHINA (INC. HK) $32.5 BILLION
JAPAN $17.4 BILLION
S. KOREA $6.0 BILLION
TAIWAN $3.9 BILLION
VIETNAM $2.3 BILLION
THAILAND $1.3 BILLION
AUSTRALIA $1.0 BILLION
MALAYSIA $1.0 BILLION
SINGAPORE $784.5 MILLION
INDIA $781.9 MILLION
PHILIPPINES $632.4 MILLION
GERMANY $574.4 MILLION
CANADA $567.5 MILLION
ITALY $394.7 MILLION
NETHERLANDS $382.9 MILLION
CHILE $325.2 MILLION
UK $321.4 MILLION
NEW ZEALAND $310.0 MILLION
BRAZIL $292.2 MILLION
RUSSIA $256.7 MILLION
1. OIL SEEDS; MISC. GRAIN, SEED, FRUIT, PLANT $3.0 BILLION
2. INDUSTRIAL MACHINERY AND COMPUTERS $1.5 BILLION
3. PREPARED VEGETABLES, FRUITS AND NUTS $1.0 BILLION
4. CEREALS $820 MILLION
5. MEAT AND MEAT PRODUCTS $755.7 MILLION
6. FISH AND SEAFOOD $637.9 MILLION
7. PAPER AND PAPERBOARD $628.2 MILLION
8. EDIBLE FRUIT AND NUTS; CITRUS FRUIT OR MELON PEEL $615.2 MILLION
9. EDIBLE VEGETABLES AND CERTAIN ROOTS AND TUBERS $601.9 MILLION
10. INORGANIC CHEMICALS; PRECIOUS AND RARE EARTH METALS $571.1 MILLION
TOP 10 IMPORT COMMODITIES TOP 10 EXPORT COMMODITIES
1. INDUSTRIAL MACHINERY AND COMPUTERS $10.4 BILLION
2. ELECTRICAL MACHINERY AND ELECTRONICS $9.4 BILLION
3. VEHICLES AND PARTS $7.3 BILLION
4. FURNITURE $3.1 BILLION
5. TOYS, GAMES AND SPORTS EQUIPMENT $2.7 BILLION
6. FOOTWEAR $2.1 BILLION
7. ARTICLES OF IRON OR STEEL $1.9 BILLION
8. KNIT OR CROCHETED APPAREL $1.9 BILLION
9. PLASTICS AND PLASTIC ARTICLES $1.9 BILLION
10. AIRCRAFT, SPACECRAFT AND PARTS $1.7 BILLION
TOP 10 INTERNATIONAL TRADING PARTNERSVALUE OF INTERNATIONAL IMPORTS
TRADING PARTNERS 11–20
NWSA CARGO HIGHLIGHTS
$58.6 BILLION
$58,577,226,069
$75,210,427,245
VALUE OF INTERNATIONAL EXPORTS
$16.6 BILLION
$16,633,201,176VALUE OF TWO-WAY INTERNATIONAL TRADE
TOTAL TEUs
3,615,752 TEUs
TOTAL TONNAGE
28,026,869 metric tons
AUTO UNITS
165,687units
BREAKBULK CARGO
181,372 metric tons
LOGS
176,928metric tons
VESSEL CALLS
1,995calls
VALUE OF INTL. TRADE
$75.2billion
VALUE OF DOMESTIC TRADE
$5.4 billion
The Puget Sound's annual trade with Alaska is estimated at $5.4 billion. If ranked with our international partners, Alaska would be fourth.(Source: 2015 update to Ties That Bind study)
$75.2BILLION
1 2 3 4 5 6 7 8 9 10 1 2 3 4 5 6 7 8 9 10
NWSA: FEATURESAnnual Report / 2016
19
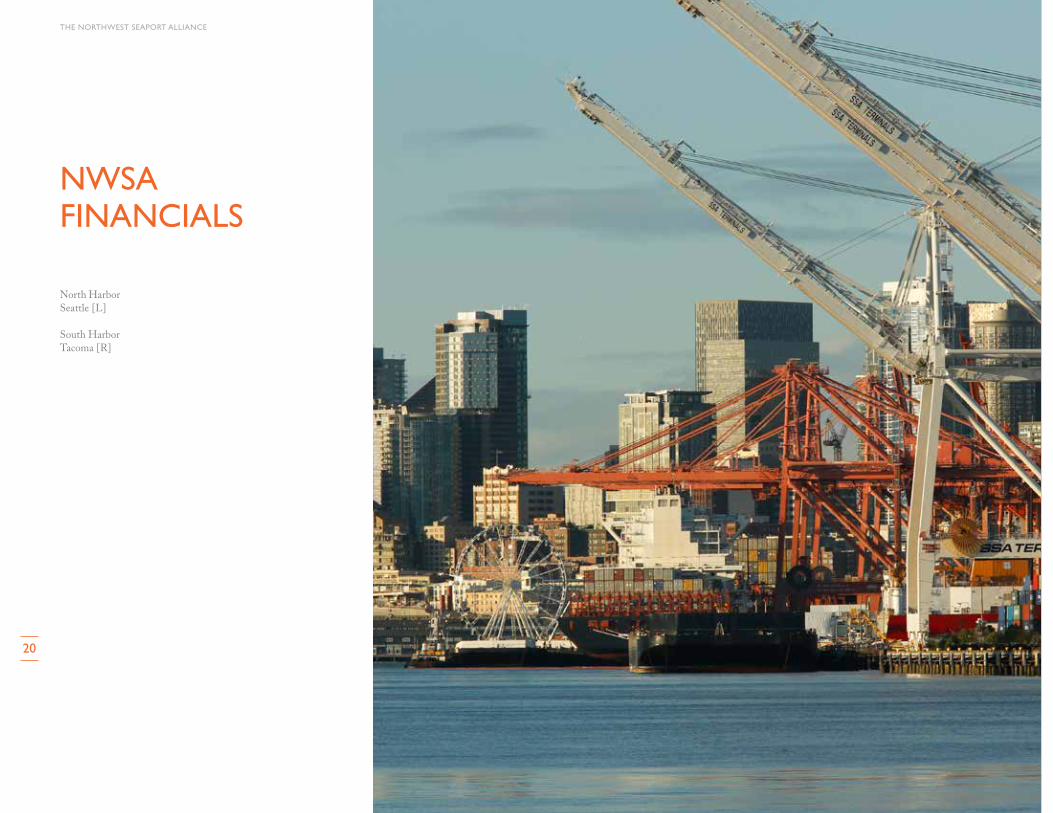
NWSAFINANCIALS
THE NORTHWEST SEAPORT ALLIANCE
20
North Harbor Seattle [L]
South Harbor Tacoma [R]

INTRODUCTIONThe Northwest Seaport Alliance (NWSA) Management Discussion and Analysis (MD&A) of financial activities and performance introduces the NWSA’s 2016 financial statements, a Port Development Authority. NWSA management prepared this MD&A and readers should consider it in conjunction with the financial statements and the notes thereto. Since 2016 is the first year of operations for the NWSA, prior year comparative data is limited.
The notes are essential to a full understanding of the data contained in the financial statements. This report also presents information about the formation of the NWSA and certain required supplementary financial information.
OVERVIEW OF THE FINANCIAL STATEMENTSThe financial section of this annual report consists of three parts: MD&A, the basic financial statements and the notes to the financial statements. The financial statements include: the statement of net position, the statement of revenues, expenses and changes in net position, and the statement of cash flows.
The statement of net position presents information on all of the NWSA’s assets and liabilities, with the difference between the assets and liabilities, reported as net position. Over time, increases or decreases in net position may serve as an indicator of whether the financial position of the NWSA is improving or deteriorating. The statement of revenues, expenses and changes in net position shows how the NWSA’s net position changed during the year. These changes are reported in the period in which the underlying event occurs, regardless of the timing of related cash flows.
The NWSA’s operations began January 1, 2016. Since 2016 is the first year of financial operations, comparative financial statements are not presented. However, in future years, when prior year information is available, a comparative analysis of revenues and expenses and changes in net position will be presented.
Formation of The Northwest Seaport AllianceThe ports of Seattle and Tacoma (the home ports) joined forces in August 2015, forming the NWSA to unify management of marine cargo facilities and business to strengthen the Puget Sound gateway and attract more marine cargo and jobs to the region.
The NWSA is a special purpose governmental entity established as a Port Development Authority (PDA), similar to Public Development Authorities formed by cities and counties. The PDA is governed by the home ports as equal members (each a “Managing Member” and collectively, “Managing Members”) with each home port acting through its elected commissioners. As approved, the charter for the NWSA (Charter) may be amended only by mutual agreement of the Managing Members. Each port will remain a separate legal entity, independently governed by its own elected commissioners. Each home port has granted to the NWSA a license for the NWSA’s exclusive use, operation and management of certain facilities, but
ownership of the licensed facilities remains with the home ports, not with the NWSA.
Membership interestsThe home ports made an initial contribution of certain cargo terminals and related marine cargo business activities to the NWSA through license agreements (Licensed Properties). Under these agreements, the NWSA was charged with managing the properties as an agent on behalf of the home ports. The initial contribution of each Managing Member to the NWSA was 50 percent as established with its Membership Interest (based on the value of the contributed facilities using cash flow forecasts for each parcel that went to the NWSA) with a revaluation review at the end of 2017. The revaluation review is to determine if material changes in cash flows from the Licensed Properties have occurred since the initial valuation. A change in the valuation of the cash flow forecasts of these facilities could result in a change in Membership Interests. The Managing Members shall approve any change in Membership Interest by vote, to include provision for addressing any change to distributions and allocations as a result of the change in Membership Interest. Changes in Membership Interest do not affect a Managing Member’s voting rights under the Charter, as votes are not weighted by or otherwise determined by Membership Interest.
Financial frameworkThe NWSA intends to support the credit profiles of both home ports, and its financial framework will preserve both ports’ commitment to financial strength and fiscal stewardship. The NWSA distributes cash to each home port based on cash flow from operations, calculated pursuant to generally accepted accounting principles (GAAP). Cash distributions are to be made no less than quarterly based on each Managing Member’s Membership Interest. Cash flow from operations will be distributed to home ports and not retained by the NWSA for funding capital investment.
The NWSA is responsible for capital investments, including renewal and replacement projects and new development. Such capital investments or post-formation assets will be treated as tenant improvements owned by the NWSA. Both home ports work cooperatively with the NWSA to develop an annual capital budget for approval by each Managing Member. Capital funding will be provided by joint contributions from the home ports. Each Managing Member must approve its capital contributions.
The Charter recognizes that each home port’s respective share of revenues received by the NWSA with respect to the Licensed Properties has been or may be pledged in connection with the home port’s bond obligations. Under the Charter, the Managing Members instruct the Chief Executive Officer (CEO) to manage the PDA in a prudent and reasonable manner in support of the home port’s respective bond covenants. The home ports shall keep the CEO and the NWSA management informed of their respective bond obligations, and shall notify the other home port of any proposed change to such home port’s governing bond resolutions as soon as practical before adoption. The Charter does not modify or alter the obligations of each home port with respect to its own bond obligations. The NWSA does not assume any obligations to the home ports’ bondholders.
With respect to bonds of each home port that were outstanding at the time of the formation of the NWSA, the Managing Members shall establish and maintain a requirement for the NWSA to calculate and establish a minimum level of change in net position from the NWSA equal to the amount required for the home ports to meet their bond rate covenants in effect at the time of formation of the NWSA (Bond Income Calculation, initially calculated to be $90 million). The Managing Members shall require the Bond Income Calculation to be reviewed annually as part of the NWSA budget process and the Managing Members may adjust the Bond Income Calculation so long as it does not cause any home port to fail to comply with its rate covenant in effect at the time of formation of the NWSA. The NWSA may not take any action that reasonably would reduce NWSA income below the minimum level established by the Bond Income Calculation unless each Managing Member separately votes to approve that action. Such a vote by each Managing Member must occur even if the action is within the CEO’s delegated authority. The Bond Income Calculation is subject to adjustment, including reductions from payment or refunding of bonds outstanding at the time of the formation of the NWSA.
Initial fundingEach home port provided an initial contribution for working capital of $25.5 million, for a total initial working capital funding of $51 million. Working capital cannot be redirected to fund Capital Construction as defined in the Charter.
Future needs will be evaluated during the annual budget process or if the working capital reserve should decline below a target minimum established by the Managing Members. Managing Members each must vote affirmatively to approve additional working capital contributions.
Each home port provided an initial Capital Construction contribution of $13.5 million (totaling $27 million), equal to the budgeted five-year capital improvement plan cash forecast needs for 2016. The home ports also provided $16.8 million noncash construction in process for capital projects that started in the home ports and will be completed by the NWSA.
Financial position summaryThe statement of net position presents the financial position of the NWSA. The statement includes all of the NWSA’s assets and liabilities. Net position serves as an indicator of the NWSA’s financial position. The NWSA’s current assets consist primarily of cash and cash equivalents, investments and accounts receivable.
The NWSA’s operations began January 1, 2016. Since 2016 is the first year of financial operations, comparative financial statements are not presented. However in future years, when prior year information is available, a comparative analysis of revenues and expenses and changes in net position will be presented.
MANAGEMENT’S DISCUSSION AND ANALYSISYear Ended December 31, 2016
22
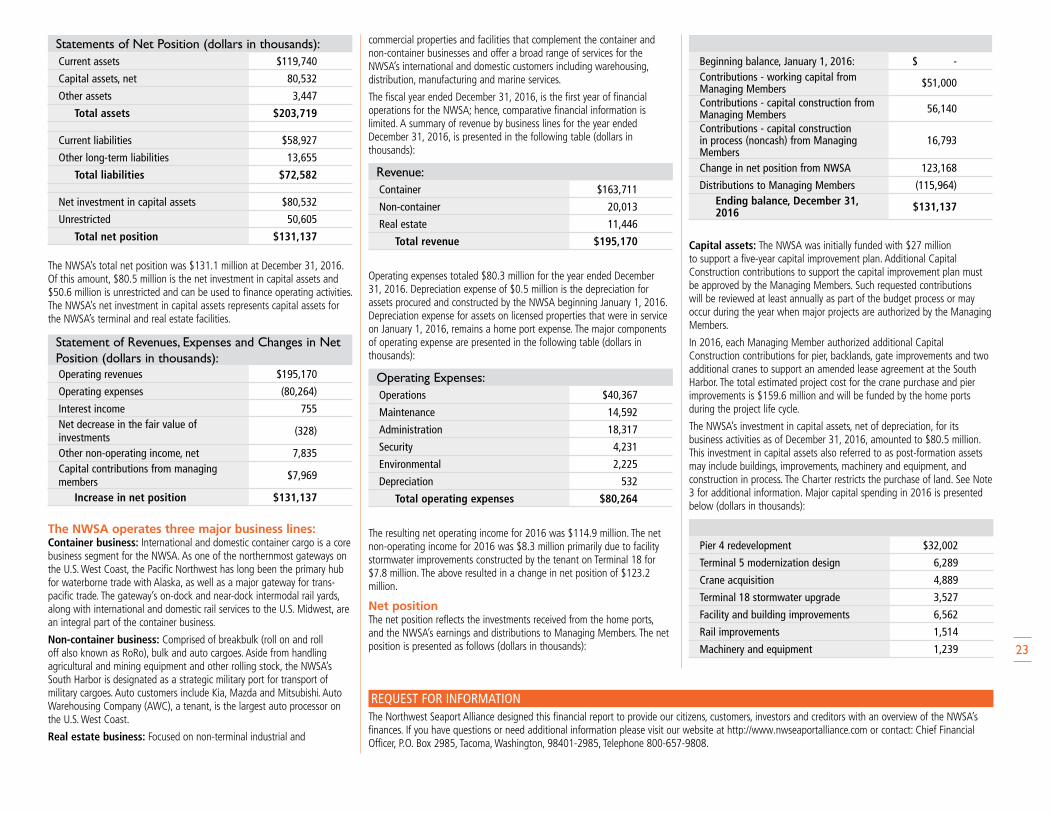
Statements of Net Position (dollars in thousands):Current assets $119,740
Capital assets, net 80,532
Other assets 3,447
Total assets $203,719
Current liabilities $58,927
Other long-term liabilities 13,655
Total liabilities $72,582
Net investment in capital assets $80,532
Unrestricted 50,605
Total net position $131,137
The NWSA’s total net position was $131.1 million at December 31, 2016. Of this amount, $80.5 million is the net investment in capital assets and $50.6 million is unrestricted and can be used to finance operating activities. The NWSA’s net investment in capital assets represents capital assets for the NWSA’s terminal and real estate facilities.
Statement of Revenues, Expenses and Changes in Net Position (dollars in thousands):Operating revenues $195,170
Operating expenses (80,264)
Interest income 755Net decrease in the fair value of investments (328)
Other non-operating income, net 7,835Capital contributions from managing members $7,969
Increase in net position $131,137
The NWSA operates three major business lines:Container business: International and domestic container cargo is a core business segment for the NWSA. As one of the northernmost gateways on the U.S. West Coast, the Pacific Northwest has long been the primary hub for waterborne trade with Alaska, as well as a major gateway for trans-pacific trade. The gateway’s on-dock and near-dock intermodal rail yards, along with international and domestic rail services to the U.S. Midwest, are an integral part of the container business.
Non-container business: Comprised of breakbulk (roll on and roll off also known as RoRo), bulk and auto cargoes. Aside from handling agricultural and mining equipment and other rolling stock, the NWSA’s South Harbor is designated as a strategic military port for transport of military cargoes. Auto customers include Kia, Mazda and Mitsubishi. Auto Warehousing Company (AWC), a tenant, is the largest auto processor on the U.S. West Coast.
Real estate business: Focused on non-terminal industrial and
Beginning balance, January 1, 2016: $ -Contributions - working capital from Managing Members $51,000
Contributions - capital construction from Managing Members 56,140
Contributions - capital construction in process (noncash) from Managing Members
16,793
Change in net position from NWSA 123,168
Distributions to Managing Members (115,964) Ending balance, December 31, 2016 $131,137
Capital assets: The NWSA was initially funded with $27 million to support a five-year capital improvement plan. Additional Capital Construction contributions to support the capital improvement plan must be approved by the Managing Members. Such requested contributions will be reviewed at least annually as part of the budget process or may occur during the year when major projects are authorized by the Managing Members.
In 2016, each Managing Member authorized additional Capital Construction contributions for pier, backlands, gate improvements and two additional cranes to support an amended lease agreement at the South Harbor. The total estimated project cost for the crane purchase and pier improvements is $159.6 million and will be funded by the home ports during the project life cycle.
The NWSA’s investment in capital assets, net of depreciation, for its business activities as of December 31, 2016, amounted to $80.5 million. This investment in capital assets also referred to as post-formation assets may include buildings, improvements, machinery and equipment, and construction in process. The Charter restricts the purchase of land. See Note 3 for additional information. Major capital spending in 2016 is presented below (dollars in thousands):
Pier 4 redevelopment $32,002
Terminal 5 modernization design 6,289
Crane acquisition 4,889
Terminal 18 stormwater upgrade 3,527
Facility and building improvements 6,562
Rail improvements 1,514
Machinery and equipment 1,239
commercial properties and facilities that complement the container and non-container businesses and offer a broad range of services for the NWSA’s international and domestic customers including warehousing, distribution, manufacturing and marine services.
The fiscal year ended December 31, 2016, is the first year of financial operations for the NWSA; hence, comparative financial information is limited. A summary of revenue by business lines for the year ended December 31, 2016, is presented in the following table (dollars in thousands):
Revenue:Container $163,711
Non-container 20,013
Real estate 11,446
Total revenue $195,170
Operating expenses totaled $80.3 million for the year ended December 31, 2016. Depreciation expense of $0.5 million is the depreciation for assets procured and constructed by the NWSA beginning January 1, 2016. Depreciation expense for assets on licensed properties that were in service on January 1, 2016, remains a home port expense. The major components of operating expense are presented in the following table (dollars in thousands):
Operating Expenses:Operations $40,367
Maintenance 14,592
Administration 18,317
Security 4,231
Environmental 2,225
Depreciation 532
Total operating expenses $80,264
The resulting net operating income for 2016 was $114.9 million. The net non-operating income for 2016 was $8.3 million primarily due to facility stormwater improvements constructed by the tenant on Terminal 18 for $7.8 million. The above resulted in a change in net position of $123.2 million.
Net positionThe net position reflects the investments received from the home ports, and the NWSA’s earnings and distributions to Managing Members. The net position is presented as follows (dollars in thousands):
REQUEST FOR INFORMATIONThe Northwest Seaport Alliance designed this financial report to provide our citizens, customers, investors and creditors with an overview of the NWSA’s finances. If you have questions or need additional information please visit our website at http://www.nwseaportalliance.com or contact: Chief Financial Officer, P.O. Box 2985, Tacoma, Washington, 98401-2985, Telephone 800-657-9808.
23
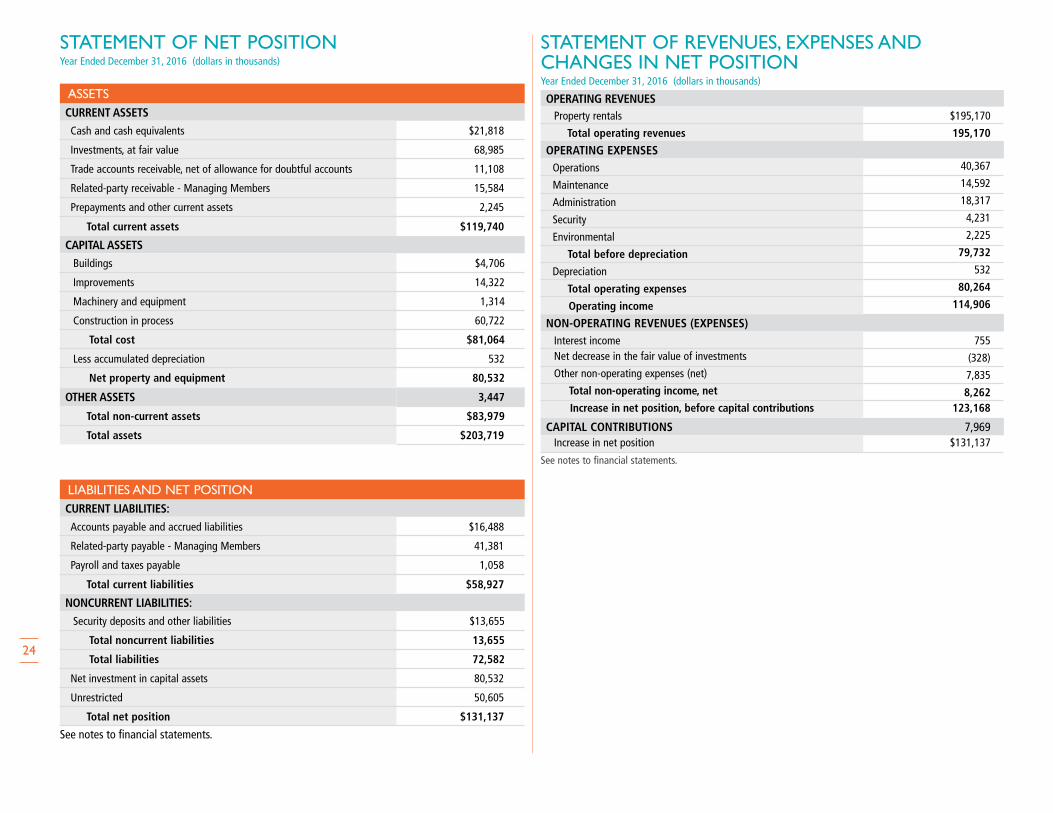
STATEMENT OF NET POSITIONYear Ended December 31, 2016 (dollars in thousands)
ASSETSCURRENT ASSETS
Cash and cash equivalents $21,818
Investments, at fair value 68,985
Trade accounts receivable, net of allowance for doubtful accounts 11,108
Related-party receivable - Managing Members 15,584
Prepayments and other current assets 2,245
Total current assets $119,740
CAPITAL ASSETS
Buildings $4,706
Improvements 14,322
Machinery and equipment 1,314
Construction in process 60,722
Total cost $81,064
Less accumulated depreciation 532
Net property and equipment 80,532
OTHER ASSETS 3,447
Total non-current assets $83,979
Total assets $203,719
LIABILITIES AND NET POSITIONCURRENT LIABILITIES:
Accounts payable and accrued liabilities $16,488
Related-party payable - Managing Members 41,381
Payroll and taxes payable 1,058
Total current liabilities $58,927
NONCURRENT LIABILITIES:
Security deposits and other liabilities $13,655
Total noncurrent liabilities 13,655
Total liabilities 72,582
Net investment in capital assets 80,532
Unrestricted 50,605
Total net position $131,137
See notes to financial statements.
STATEMENT OF REVENUES, EXPENSES AND CHANGES IN NET POSITIONYear Ended December 31, 2016 (dollars in thousands)
OPERATING REVENUESProperty rentals $195,170
Total operating revenues 195,170
OPERATING EXPENSESOperations 40,367
Maintenance 14,592
Administration 18,317
Security 4,231
Environmental 2,225
Total before depreciation 79,732
Depreciation 532
Total operating expenses 80,264
Operating income 114,906
NON-OPERATING REVENUES (EXPENSES)Interest income 755 Net decrease in the fair value of investments (328) Other non-operating expenses (net) 7,835 Total non-operating income, net 8,262
Increase in net position, before capital contributions 123,168
CAPITAL CONTRIBUTIONS 7,969Increase in net position $131,137
See notes to financial statements.
24

STATEMENT OF CASH FLOWSYear Ended December 31, 2016 (dollars in thousands)
CASH FLOWS FROM OPERATING ACTIVITIESCash received from customers $186,291 Cash paid to suppliers, longshore labor and employees (36,069)
Cash paid to homeports for support services (34,257)
Cash held for customer deposits 1,042
Net cash provided by operating activities 117,007
CASH FLOWS FROM NON-CAPITAL FINANCING ACTIVITIESCash received from Managing Members for working capital 51,000
Cash received from Managing Members - customer deposits, lease liabilities
15,762
Cash distributions to Managing Members (95,084)
Net cash used by non-capital financing activities (28,322)
CASH FLOWS FROM CAPITAL AND RELATED FINANCING ACTIVITIESCash received from Managing Members for capital construction 40,556 Acquisition and construction of capital assets (38,856)
Net cash provided by capital and related financing activities 1,700
CASH FLOWS FROM INVESTING ACTIVITIESPurchases of investments (99,162)
Proceeds from sales and maturities of investment securities 30,000 Interest received on investments 595
Net cash provided by (used in) investing activities (68,567) Net increase in cash and cash equivalents 21,818
CASH AND CASH EQUIVALENTS:Beginning of year –
End of year $21,818
NOTES TO FINANCIAL STATEMENTSYear Ended December 31, 2016 (dollars in thousands)
NOTE 1. SUMMARY OF SIGNIFICANT ACCOUNTING POLICIES
Reporting entity: The ports of Seattle and Tacoma formed The Northwest Seaport Alliance (NWSA), a special purpose governmental entity established as a Port Development Authority (PDA), with an effective date of August 4, 2015 (the “Effective Date”). The PDA was formed pursuant to a provision in Title 53 Revised Code of Washington (RCW) that grants ports that meet certain criteria the authority to create a separate PDA, similar to public development authorities created by Washington cities and counties. Each Port Commission is a Managing Member of the NWSA. Each port will remain a separate legal entity, independently governed by its own elected commissioners. As formed, the NWSA is to continue for an indefinite term until dissolution. As approved, the Charter for the NWSA may be amended only by mutual agreement of both ports as the NWSA’s Managing Members. On January, 1, 2016, the NWSA became a separate legal entity.
The State Legislature granted qualifying ports the authority to create a PDA for the management of maritime activities and to allow ports to act cooperatively and use financial resources strategically, while remaining separate entities and complying with federal regulations. Pursuant to the PDA statute, if a PDA is created jointly by more than one port district, the PDA must be managed by each port district as a member, in accordance with the terms of the statute and the Charter. Any port district that creates a PDA must oversee the affairs, operations, and funds of the PDA to correct any deficiency, and ensure the purposes of each program undertaken are reasonably accomplished. The statute permits a PDA, in managing maritime activities of a port district or districts, to own and
RECONCILIATION OF OPERATING INCOME TO NET CASH PROVIDED BY OPERATING ACTIVITIESOperating income $114,906 Adjustments to reconcile operating income to net cash provided by operating activities:
Depreciation 532Changes in assets and liabilities:
Increase in accounts receivable (10,685)
Increase in prepayments and other current assets (1,816)
Increase in accounts payable and accrued liabilities 6,830
Increase in related-party payable 4,271
Increase in lease securities and customer deposits 1,957
Increase in payroll and taxes payable 1,012
Total adjustments and changes 2,101
Net cash provided by operating activities $117,007
NON-CASH INVESTING AND FINANCING ACTIVITIES Capital asset additions and other purchases financed with accounts payable $17,574
Capital construction in process contributed by the Managing Members $16,792
Contributions receivable from Managing Members for capital construction $15,584
Contributions received for capital assets - tenant improvements $7,842 Distributions payable to Managing Members $(20,880)
Decrease in fair value of investments $(328)
See notes to financial statements.
25

sell real and personal property; to enter into contracts, to sue and be sued; to loan and borrow funds; to issue bonds, notes, and other evidences of indebtedness; to transfer funds, real or personal property, property interests, or services; and to perform community services related to maritime activities managed by the PDA. As discussed below, the statute allows, but the Charter prohibits, the NWSA to issue bonds, borrow funds, or enter into other debt instruments. By statute, PDAs do not have the power of eminent domain or the power to levy taxes or special assessments. In transferring real property to a PDA, the port district or districts creating the PDA must impose appropriate deed restrictions necessary to ensure the continued use of the property for the public purpose for which the property is transferred.
The NWSA is governed by its Managing Members, with each Managing Member acting pursuant to the Charter through its elected commissioners. The Managing Members appointed a Chief Executive Officer who is responsible for hiring staff and entering into service agreements with the Managing Members as needed. Staff is comprised of certain Port of Tacoma and former Port of Seattle employees assigned either in full or in part to work in roles in the NWSA. In addition, both Managing Members may provide services through support service agreements with a portion of staff time allocated to and reimbursed by the NWSA.
Effective January 1, 2016, the revenues and expenses associated with Licensed Properties were accounted for and reported by the NWSA. The initial funding of working capital and capital construction and subsequent earnings and cash distributions are presented on the statement of net position. Additional information about the formation of the NWSA is presented in the MD&A.
The home ports agreed to share investments, earnings and cash distributions on a 50/50 basis. The home ports initial contribution of Licensed Properties to the NWSA was 50 percent (based on the value of the contributed facilities using cash flow forecasts for each parcel that went to the NWSA). The initial cash investment totaling $78 million, of which $51 million funded Working Capital and $27 million funded Capital Construction projects, were shared equally. The home ports contributed an additional $16.8 million of non-cash work in process capital projects that started in the home ports and will be completed by The NWSA for an opening investment of $94.8 million.
The NWSA distributes cash to each home port based on cash flow from operations, calculated pursuant to GAAP. Cash distributions are to be made no less than quarterly based on each Managing Member’s percentage of total shares; however, during 2016 cash distributions have been generally made in the following month after the amount due was determined. The investment in joint venture activity is presented on the statement of net position.
Nature of business The PDA is used to account for the general operations of the NWSA as more fully described below.
The NWSA is authorized by Washington law to provide and charge rentals, tariffs and other fees for docks, wharves and similar harbor facilities, including associated storage and traffic handling facilities, for waterborne
commerce. The NWSA may also provide freight and passenger terminals and transfer and storage facilities for other modes of transportation, including air, rail and motor vehicles.
Measurement focus, basis of accounting and presentationThe financial statements of the NWSA have been prepared in conformity with accounting principles generally accepted in the United States of America, as applied to government units. The Governmental Accounting Standards Board (GASB) is the accepted standard-setting body for establishing governmental accounting and financial reporting principles. The NWSA is accounted for on a flow of economic resources measurement focus and the full-accrual basis of accounting where revenues are recognized when earned and expenses are recognized when incurred, regardless of the timing of the related cash flows.
The accounting records of the NWSA are maintained in accordance with methods prescribed by the State Auditor under the authority of Chapter 43.09, Revised Code of Washington. The NWSA also follows the Uniform System of Accounts for Port Districts in the state of Washington.
Use of estimatesThe preparation of financial statements in conformity with accounting principles generally accepted in the United States of America requires management to make estimates and assumptions that affect the reported amounts of assets and liabilities, and disclosure of contingent assets and liabilities, at the date of the financial statements. Significant estimates also affect the reported amounts of revenues and expenses during the reporting period. Significant estimates made by the NWSA include depreciation and environmental liabilities. Actual results could differ from those estimates.
Significant risks and uncertaintiesThe NWSA is subject to certain business risks that could have a material impact on future operations and financial performance. These risks include economic conditions, collective bargaining disputes, federal, state and local government regulations, and changes in law.
The formation of the NWSA is intended to reduce pricing competition between the home ports by creating a unified gateway, to allow for coordination regarding customer relationships, to improve capacity utilization between the home ports, and to rationalize strategic capital investments. The formation of the NWSA may or may not successfully address these risks, and may create new risks, including the risks associated with a new joint venture funded by the Managing Members with equal Membership Interests, and reliance on the financial strength of the home ports to fund future capital expenditures and shortfall in working capital.
The Charter requires that the NWSA maintain the Bond Income Calculation and not to take any action that would reasonably reduce its income below this minimum net operating income level unless each Managing Member votes separately to approve that action. This minimum net operating level was established based on the amount required at formation of the NWSA for the Managing Members to meet their then current bond rate covenants, and may not always reflect the amount required to meet bond rate covenants on a going-forward basis.
If net operating income before depreciation of the NWSA is not sufficient for either home port to be in compliance with a rate covenant (as described in each Managing Member’s governing bond resolutions in effect as of the Effective Date), then: (i) upon that Managing Member’s request, the NWSA shall hire an independent third-party consultant to perform analysis and make recommendations for actions needed to achieve bond covenant compliance; (ii) if the consultant recommends an action that the NWSA is unwilling, unable or refuses to undertake, either Managing Member can require dissolution of the NWSA following the dispute resolution process even if within the “Initial Period” (as defined in the Charter, “the expiration of 20 years following the NWSA’s formation”); and (iii) the NWSA shall have at least four months to respond, act and or dissolve following its receipt of the consultant’s recommended action, unless a shorter time is required by the applicable bond covenants.
The NWSA selected as its Chief Executive Officer, the Chief Executive Officer of the Port of Tacoma, who may serve in those dual roles for up to five years. It is possible that the dual role may pose a real or perceived conflict of interest.
Cash and cash equivalents Cash represents cash and demand deposits. The NWSA maintains its cash in bank deposit accounts, which are covered by the Public Deposit Protection Commission of the state of Washington. All short-term investments with a maturity of three months or less at the date of purchase are considered cash equivalents.
Trade accounts receivable Trade accounts receivable are carried at original invoice amount less an estimate made for doubtful accounts based on a review of all outstanding amounts. Management determines the allowance for doubtful accounts by identifying delinquent accounts and by using historical experience applied to an aging of accounts. Trade accounts receivable are written off when deemed uncollectible. Recoveries of receivables previously written off are recorded when received. The allowance for doubtful accounts at December 31, 2016, was $3.1 million.
InvestmentsInvestments are stated at fair value which is the price that would be received in an orderly transaction between market participants at the measurement date. The NWSA also has investments in the state Local Government Investment Pool (LGIP). The LGIP is similar to a money market fund recognized by the Securities and Exchange Commission. The LGIP invests in U.S. Agency Securities, Repurchase Agreements, U.S. Treasury Securities, Interest Bearing Bank Deposits, and Certificates of Deposit. The investments are limited to high-quality obligations with limited maximum and average maturities. These investments are valued at amortized cost. Interest income on investments is recognized as earned. Interest income and changes in the fair value of investments are recognized on the statement of revenues, expenses and changes in net position. The NWSA’s general policy is to not hold more than 20 percent of its holdings in any one investment. See Note 2 for further information.
Capital assets and depreciation
NOTE 1. SUMMARY OF SIGNIFICANT ACCOUNTING POLICIES (CONTINUED)
26
The NWSA has an annual operating budget and a five-year capital improvement plan. Capital assets are recorded at cost. Donated assets are recorded at acquisition value on the date donated.
The NWSA’s policy is to capitalize all asset additions greater than $20,000 and with an estimated life of more than three years. Depreciation is computed on the straight-line method. The following lives are used:
Years
Buildings and improvements 10-75
Machinery and equipment 3-20
Preliminary costs incurred for proposed projects are deferred pending construction of the facility. Regular monthly reviews are completed and costs relating to projects ultimately constructed are transferred to the appropriate capital asset account; charges that relate to abandoned projects are expensed when the project is abandoned.
Net positionNet position consists of net investment in capital assets, restricted and unrestricted net position. Net investment in capital assets consists of capital assets, net of accumulated depreciation which was $80.5 million at December 31, 2016. Net position is reported as restricted when there are limitations imposed on their use either through the enabling legislation adopted by the NWSA or through external restrictions imposed by creditors, grantors, laws or regulations of other governments. There were no restrictions on net position at December 31, 2016. The unrestricted component of net position is the net amount of the assets less liabilities that are not included in the determination of net investment in capital assets or the restricted components of net position and was $50.6 million at December 31, 2016.
Retentions payable The NWSA enters into construction contracts that may include retention provisions such that a certain percentage of the contract amount is held for payment until completion of the contract and acceptance by the NWSA. The NWSA’s policy is to pay the retention due only after completion and acceptance have occurred. Retentions payable totaled $44,000 at December 31, 2016. Retentions payable are included in accounts payable and accrued liabilities on the accompanying statement of net position.
Federal and state grants The NWSA may receive federal and state grants as reimbursement for construction of facilities and other capital projects. These grants are included in capital contributions on the accompanying statement of revenues, expenses and changes in net position.
Employee benefits The NWSA accrues unpaid vacation and sick leave benefit amounts as earned and payable upon termination. These benefits are accrued at current rates of compensation. Accrued vacation and sick leave are included in payroll and taxes payable and amounted to $399,000 and $171,000, respectively, at December 31, 2016. Vacation and sick leave paid in 2016 was $311,000 and $153,000, respectively. The estimated total amount of vacation and sick leave expected to be paid in 2017 is $320,000 and $157,000, respectively.
The NWSA provides health care benefits for eligible employees through the voluntary employees’ beneficiary association (VEBA) which is a tax-exempt health and welfare trust and through the health reimbursement arrangement (HRA) plan. The plan is closed to employees not covered by collective bargaining agreements hired on or after April 1, 2013. The plans require the NWSA to contribute $217 per month to the VEBA accounts of eligible employees. The NWSA contributed $87,000 to eligible employee VEBA accounts in 2016.
Pensions The NWSA’s full-time and qualifying part-time employees participate in the cost-sharing, multiple-employer public employee defined benefit retirement plans administered by the Washington State Department of Retirement Systems (DRS). The employer of record for the DRS is the Port of Tacoma for the year ended December 31, 2016. In 2016 the NWSA made all required contributions directly to DRS for its employees. On January 1, 2017, the NWSA established a separate account with DRS and will be an employee of record and will record its share of pension liability.
Environmental remediation costs The NWSA environmental remediation policy requires accrual of pollution remediation obligation amounts when: (a) one of the following specific obligating events is met and (b) the amount can be reasonably estimated. Obligating events include: imminent endangerment to the public; permit violation; NWSA named as party responsible for sharing costs; NWSA named in a lawsuit to compel participation in pollution remediation; or commenced or legally obligated to commence pollution remediation. Potential cost recoveries such as insurance proceeds, if any, are evaluated separately from the NWSA’s pollution remediation obligation. Costs incurred for pollution remediation obligations are typically recorded as non-operating environmental expenses unless the expenditures relate to the NWSA’s principal ongoing operations, in which case they are recorded as operating expenses. Costs incurred for pollution remediation obligations can be capitalized if they meet specific criteria. Capitalization criteria include: preparation of property in anticipation of a sale; preparation of property for use if the property was acquired with known or suspected pollution that was expected to be remediated; performance of pollution remediation that restores a pollution-caused decline in service utility that was recognized as an asset impairment; or acquisition of property, plant and equipment that have a future alternative use not associated with pollution remediation efforts.
The NWSA licenses property from the home ports for its operations. Remediation costs associated with contamination on Licensed Properties that occurred before the formation of the NWSA shall remain the responsibility of the home port in which the Licensed Property is located. Remediation costs associated with redevelopment on Licensed Properties shall be the responsibility of the NWSA. At December 31, 2016, the NWSA has determined that there is no environmental remediation liability to be recognized.
Lease securities Under the terms of certain Licensed Property lease agreements, the NWSA’s customers or tenants are required to provide security in the event of delinquencies in rent payment, default, or other events defined in these agreements. The security amounts are determined by lease terms. The NWSA held $12.9 million in lease securities at December 31, 2016, and this amount is presented in security deposits and other liabilities on the statement of net position.
Operating and non-operating revenues and expenses Property rental revenues are charges for use of the NWSA’s facilities and are reported as operating revenue. Other revenues generated from non-operating sources are classified as non-operating.
Operating expenses are costs primarily related to the property rental activities. Interest expense and other expenses incurred not related to the operations of the NWSA’s terminal and property rental activities are classified as non-operating.
Recent accounting pronouncements In February 2015, the GASB issued Statement No. 72, Fair Value Measurement and Application. The primary objective of this statement is to establish general principles for measuring fair value and standards of accounting and financial reporting for assets and liabilities measured at fair value. The NWSA adopted this standard and included the prescribed disclosures in Note 11, Fair Value Measurements.
In December 2015, the GASB issued Statement No. 79, Certain External Investment Pools and Pool Participants. This statement addresses accounting and financial reporting for certain external investment pools and pool participants. Specifically, it establishes criteria for an external investment pool to qualify for making the election to measure all of its investments at amortized cost for financial reporting purposes. The requirements of this statement are effective for reporting periods beginning after June 15, 2015, except for certain provisions on portfolio quality, custodial credit risk, and shadow pricing. Those provisions are effective for reporting periods beginning after December 15, 2015. The NWSA adopted this standard and included the prescribed disclosures in Note 2, Deposits and Investments.
In November 2016, the GASB issued Statement No. 83, Certain Asset Retirement Obligations. This statement addresses accounting and financial reporting for certain asset retirement obligations and establishes criteria for determining the timing and pattern of recognition of a liability and a corresponding deferred outflow of resources for asset retirement obligations. The requirements of this statement are effective for reporting periods beginning after June 15, 2018. NWSA is currently evaluating the effect of the adoption of this standard on its financial statements and related disclosures.
In January 2017, the GASB issued Statement No. 84, Fiduciary Activities. The objective of this statement is to improve guidance regarding the identification of fiduciary activities for accounting and financial reporting purposes and how those activities should be reported and this statement establishes criteria for identifying fiduciary activities of all state and local governments. The requirements of this statement are effective for reporting periods beginning after December 15, 2018. NWSA is currently evaluating the effect of the adoption of this standard on its financial statements and related disclosures.
27

NOTE 2. DEPOSITS AND INVESTMENTS
Discretionary deposits The NWSA’s cash and cash equivalents of $21.8 million at December 31, 2016, were deposited in qualified depositories as required by state statute. Deposits in excess of federal depository insurance coverage are covered by the Public Deposit Protection Commission of the State of Washington (PDPC). The PDPC is a statutory authority under chapter 39.58 RCW. Currently, all public depositories with the state fully collateralize uninsured public deposits at 100 percent.
Investments State of Washington statutes authorize the NWSA to invest in direct obligations of the U.S. Government, certificates of deposit, bankers’ acceptances, repurchase agreements, commercial paper and certain municipal bonds. These investments must be placed with or through qualified public depositories of the state of Washington.
RISKSInterest rate risk Interest rate risk is the risk that changes in interest rates will adversely affect the fair value of an investment. The NWSA’s investment guideline is to maximize investment return while preserving liquidity. To the extent possible, the NWSA will attempt to match its investments with anticipated cash flow requirements using the specific-identification method.
Credit riskCredit risk is the risk that an issuer of an investment will not fulfill its obligation to the holder of the investment. This is measured by the assignment of a rating by a nationally recognized statistical rating organization. The LGIP is an external investment pool, as defined by the GASB.
Custodial credit riskCustodial credit risk is the risk that, in the event of the failure of the counterparty, the NWSA will not be able to recover the value of its investments or collateral securities that are in the possession of the outside party. To minimize this risk, the NWSA’s policy requires that all security transactions are settled “delivery versus payment.” This means that payment is made simultaneously with the receipt of the security. These securities are delivered to the NWSA’s safekeeping bank. With the exception of the Washington State LGIP, the NWSA’s investment securities are registered, or held by the NWSA or its agent in the NWSA’s name. The certificates of deposit are covered by the PDPC. The PDPC approves which banks and thrifts can hold state and local government deposits and monitors collateral pledged to secure uninsured public deposits. This secures public treasurers’ deposits when they exceed the amount insured by the FDIC by requiring banks and thrifts to pledge securities as collateral.
In 2016, the NWSA adopted GASB 79, Certain External Investment Pools and Pool Participants, due to the NWSA’s participation in the LGIP. The LGIP manages a portfolio of securities that meet the maturity, quality, diversification and liquidity requirements set forth by the GASB for external investment pools that elect to measure, for financial reporting purposes, investments at amortized cost. The funds are limited to high quality obligations with regulated maximum and average maturities to minimize both market and credit risk. LGIP participants may contribute and withdraw funds on a daily basis. Participants must inform the Office of the State Treasurer of any contribution or withdrawal over $1 million no later than 9 a.m. on the same day the transaction is made. Contributions or withdrawals for $1 million or less can be requested at any time prior to 10 a.m. on the day of the transaction. However, participants may complete transactions greater than $1 million when notification is made between 9 a.m. and 10 a.m., at the sole discretion of the Office of the State Treasurer. All participants are required to file with the State Treasurer documentation containing the names and titles of the officials authorized to contribute or withdraw funds.
The following table identifies the types of investments, concentration of investments in any one issuer, and maturities of the NWSA investment portfolio as of December 31, 2016 (dollars in thousands):
Maturities (in Years)
Investment Type Fair Value Less than 1 1-3 More than 3Percentage
of Total Portfolio
Federal Home Loan Bank $8,952 $ - $ - $8,952 13.0%Federal Home Loan Mortgage Corporation 3,006 - 3,006 - 4.4%
Federal National Mortgage Association 6,988 - 6,988 - 10.1%
Municipal Bonds 9,274 3,345 - 5,929 13.4%State Local Investment Pool* 40,765 40,765 - - 59.1%
Total investments $68,985 $44,110 $9,994 $14,881 100.0%
Percentage of total portfolio
63.9% 14.5% 21.6% 100.00%
The following table identifies the credit risk of the NWSA’s Investment portfolio as of December 31, 2016 (dollars in thousands):
Moody’s Equivalent Credit Ratings
Investment Type Fair Value A1 Aa3 Aa2 Aa1 Aaa No Rating
Federal Home Loan Bank $8,952 $ - $ - $ - $ - $8,952 $ - Federal Home Loan Mortgage Corporation 3,006 - - - - 3,006 - Federal National Mortgage Association 6,988 - - - - 6,988 - Municipal Bonds 9,274 1,331 4,399 2,000 1,544 - - State Local Investment Pool* 40,765 - - - - - 40,765
Total $68,985 $1,331 $4,399 $2,000 $1,544 $18,946 $40,765
* Investments in Washington State Local Investment Pool. The fair value of the investments is the same as the amortized cost of the pool shares.
28

NOTE 3. CAPITAL ASSETSThe following capital asset activity took place during 2016 (dollars in thousands):
Beginning of Year Additions Transfers
Retirements and Other
End of Year
Capital assets not being depreciated: Construction in process $ - $73,222 $(12,500) $ - $60,722 Total capital assets not being depreciated - $73,222 $(12,500) - $60,722
Capital assets being depreciated: Buildings - - 4,706 - 4,706 Improvements - 7,842 6,480 - 14,322 Machinery and equipment - - 1,314 - 1,314 Total capital assets being depreciated - 7,842 12,500 - 20,342
Less accumulated depreciation: Buildings - (156) - - (156) Improvements - (173) - - (173) Machinery and equipment - (203) - - (203) Total accumulated depreciation - (532) - - (532)
Net, capital assets being depreciated - (7,310) 12,500 - 19,810
Net, capital assets $ - $80,532 $ - $ - $80,532
NOTE 4. RISK MANAGEMENTThe NWSA is exposed to various risks of loss principally related to torts. To limit its exposure, the NWSA purchases a Special Liability Insurance Program (SLIP). The SLIP provides commercial general liability, public officials’ errors and omissions, employment practices liability and non-owned and hired automobile liability subject to limits of $10 million per occurrence. No deductible under the SLIP exceeds $10,000. A separate crime policy is also purchased. As further protection, the NWSA is named as Additional Insured under the Port of Tacoma and the Port of Seattle liability policies, both of which purchase coverage to limits of $150 million.
The NWSA is self-insured for its regular medical coverage. The liability for unpaid medical claims totaling $105,000 at December 31, 2016, is included in payroll and taxes payable on the accompanying statement of net position and is expected to be paid in 2017. Excess loss coverage has been purchased through an outside provider to limit individual loss to $110,000. Self-insured claim activity for December 31, 2016, is as follows (dollars in thousands):
Claims liability, beginning of year $ - Claims reserve 735 Payments on claims (630)
Claims liability, end of year $105
The NWSA self-insures for workers’ compensation losses subject to a $1.25 million self-insured retention as a Named Insured under the Port of Tacoma’s excess workers’ compensation policy. There was no accrual for claims incurred as of December 31, 2016.
NOTE 5. LEASE COMMITMENTSThe NWSA leases land, office space and other equipment under operating leases that expire through 2020. Future minimum lease payments under non-cancellable operating leases are as follows (dollars in thousands):
Years ending December 31:2017 $7802018 7802019 7802020 520
Total minimum payments required $2,860
Total rent expense under non-cancellable operating leases for the year ended December 31, 2016, was $720,000.
The NWSA, as a lessor (via licensing agreements with the home ports), leases land and facilities under terms of 1 to 50 years. In addition, some properties are rented on a month-to-month basis. Future minimum rents receivable under non-cancellable operating leases and subleases are as follows (dollars in thousands):
Years ending December 31:2017 $104,377 2018 90,803 2019 88,586 2020 87,375 2021 83,844 Thereafter 886,429
Total minimum payments required $1,341,414
Licensed assets of the home ports and NWSA assets held for rental and leasing purposes for the year ended December 31, 2016, are as follows (dollars in thousands):
Land $659,650 Buildings, improvements and equipment, net 617,661
Total minimum payments required $1,277,311
29

NOTE 6. PENSION PLANSThe NWSA’s full-time and qualifying part-time employees participate in the cost-sharing, multiple-employer public employee defined benefit retirement plans administered by the Washington State Department of Retirement Systems, under cost-sharing, multiple-employer public employee defined benefit retirement plans (PERS). The NWSA employees remained on the Port of Tacoma payroll through December 31, 2016, and participated in PERS under the Port of Tacoma. The NWSA made all required contributions directly to DRS during 2016. On January 1, 2017, the NWSA established a separate account with DRS.
Historical trend and other information regarding each plan are presented in the Washington State Department of Retirement Systems comprehensive annual financial report. A copy of this report may be obtained at:
Department of Retirement Systems Communications Unit P. O. Box 48380 Olympia, WA 98504-8380 Internet Address: www.drs.wa.gov
Contributions The required contribution rates, expressed as a percentage of covered payrolls, as of December 31, 2016, were:
PERS Plan 1 PERS Plan 2 PERS Plan 3Employer* 11.18% 11.18% 11.18%**Employee 6.00% 6.12% ***
* The employer rates include the employer administrative expense fee of 0.18% for 2016
**Plan 3 defined benefit portion only
*** Rate selected by PERS 3 members, 5% minimum to 15% maximum
Both the NWSA and the employees made the required contributions. The NWSA’s required contribution for December 31, 2016, was $564,000.
NOTE 7. DEFERRED COMPENSATION PLANSThe NWSA offers its employees a deferred compensation plan created in accordance with Internal Revenue Code Section 457. The plan, available to all NWSA employees, permits them to defer a portion of their salary until future years. In accordance with GASB authoritative guidance, accounting and reporting for Internal Revenue Code Section 457 deferred compensation plans, employee assets are not reflected in the NWSA’s financial statements.
The NWSA established a profit sharing plan for non-represented employees in accordance with Internal Revenue Code Section 401. The plan provides for an annual contribution to each eligible employee’s 401 account based on the NWSA meeting financial targets. The minimum contribution of $100 or a maximum contribution of 4 percent of total salaries of eligible employees will be made annually to the 401 accounts. In addition to the employer contribution, eligible employees may defer a portion of their
salary until future years. The NWSA did not contribute to the plan in 2016.
Both plans are fully funded and held in outside trusts. The fund is not available to employees until termination, retirement, death or unforeseeable emergency.
NOTE 8. COMMITMENTS AND CONTINGENCIES
CommitmentsThe NWSA has entered into separate contractual agreements for terminal maintenance, infrastructure improvements, environmental projects, and professional services. At December 31, 2016, the remaining commitments amounted to $479,000. During NWSA’s start-up period, the Port of Tacoma acting as an agent for the NWSA per support services agreements issued contracts on behalf of the NWSA. The remaining commitments on these contracts was $591,000 at December 31, 2016, and will be reimbursed by the NWSA.
The NWSA agreed to purchase support services from both home ports during NWSA’s startup and transition period. See Note 10, Related-Party Transactions, for additional information.
ContingenciesThe NWSA is named as a defendant in various other lawsuits incidental to carrying out its function. The NWSA believes its ultimate liability, if any, will not be material to the financial statements.
NOTE 9. MAJOR CUSTOMERSOperating revenues for the year ended December 31, 2016, of $195.2 million included $151.5 million, or 78 percent of operating revenue from 10 customers, three of these customers individually accounted for 10 percent or more of operating revenues, and in aggregate, 40 percent of operating revenues. Receivables from the 10 significant customers totaled $8.2 million, or 75 percent of total trade receivables.
NOTE 10. RELATED-PARTY TRANSACTIONSAs more fully described in the MD&A and Note 1, Summary of Significant Accounting Policies, the NWSA entered into licensing agreements with each home port for the exclusive use, operation and management of certain facilities or Licensed Properties. These licensing agreements generated 100 percent of NWSA revenues in 2016.
Support services agreements The NWSA entered into support services agreements with the home ports to receive support services during NWSA’s start-up and transition period as the NWSA works to setup its back office infrastructure and staff positions. The support services received by the NWSA include finance, human resources, information technology, public affairs, risk management, capital construction and environmental project management and contracting, equipment and facilities maintenance, security, and office infrastructure. During 2016, support services paid by NWSA to the home ports totaled $38.1 million. The expenses are included in operating expenses on the accompanying statement of revenues, expenses and changes in net position.
The NWSA entered into support services agreements with the Port of Tacoma to provide the Port of Tacoma executive management, commercial, environmental and planning support services. In 2016, support services provided to the Port of Tacoma by NWSA amounted to $1.1 million. The amount of operating expenses on the accompanying statement of revenues, expenses and changes in net position are net of the charges to the Port of Tacoma. The NWSA did not enter into agreements to provide support services to the Port of Seattle.
Related-party receivable and payable During 2016, the NWSA generally repaid the home ports for support services in the following month, after the amount due was determined. At December 31, 2016, $20.6 million was payable to the home ports and is presented on the statement of net position as related-party payable - Managing Members.
The NWSA distributes cash flow from operations, calculated pursuant to GAAP to the home ports. During 2016, cash distributions have been generally made in the following month, after the amount due was determined. At December 31, 2016, $20.8 million was payable to the home ports and is presented on the statement of net position as related-party payable - Managing Members.
The NWSA was initially funded with $27 million to support a five-year capital improvement plan. During 2016, each Managing Member authorized additional Capital Construction contributions primarily for pier, backlands, gate improvements and two additional cranes to support an amended lease agreement at the South Harbor totaling $54.8 million. The $54.8 million approved Capital Construction contributions will be funded by the home ports as the NWSA incurs spending on the approved projects. The home ports generally funded the capital construction spending made in the following month, after the amount receivable was determined. At December 31, 2016, $15.6 million was receivable from the home ports and is presented on the statement of net position as related-party receivable - Managing Members.
Additionally, the NWSA CEO also serves as the CEO of the Port of Tacoma. The CEO will serve in dual roles through the transition period or until a new Port of Tacoma CEO is hired in late 2017.
30

NOTE 11. FAIR VALUE MEASUREMENTSIn 2016, the NWSA adopted GASB issued Statement No. 72, Fair Value Measurement and Application. The guidance requires that assets and liabilities carried at fair value will be classified and disclosed in one of the following three categories:
Level 1: Quoted market prices in active markets for identical assets or liabilities.
Level 2: Observable market based inputs or unobservable inputs that are corroborated by market data.
Level 3: Unobservable inputs that are not corroborated by market data.
In determining the appropriate levels, the NWSA performs a detailed analysis of the assets and liabilities that are subject to the guidance. The NWSA’s fair value measurements are evaluated by an independent third-party vendor. The third-party vendor uses a variety of methods when pricing these securities that incorporate relevant observable market data to arrive at an estimate of what a buyer in the marketplace would pay for a security under current market conditions. Level 1 inputs are quoted prices in active markets for identical assets assessed at the measurement date. An active market for the asset is a principal market in which transactions for the asset are open to many and occur with sufficient frequency and volume. Level 2 inputs include quoted prices for similar assets in active markets, quoted prices for identical or similar assets in markets where there isn’t sufficient activity, and/or where price quotations vary substantially either over time or among market makers (some brokered markets, for example), or in which little information is released publicly. The NWSA does not have any Level 3 assets or liabilities at December 31, 2016.
The table below presents the balances of assets and liabilities measured at fair value by level within the hierarchy at December 31, 2016 (dollars in thousands):
Level 1 Level 2 Level 3Investments: Federal Home Loan Bank $ - $8,952 $8,952 Federal Home Loan Mortgage Corporation - 3,006 3,006
Federal National Mortgage Association 6,988 - 6,988
Municipal Bonds 2,384 6,890 9,274
Total investments $9,372
$18,848 $28,220
31

Report on the Financial Statements
We have audited the accompanying financial statements of The Northwest Seaport Alliance (the NWSA) as of and for the year ended December 31, 2016, and the related notes to the financial statements, which, collectively, comprise the NWSA’s basic financial statements as listed in the table of contents.
Management’s Responsibility for the Financial Statements
Management is responsible for the preparation and fair presentation of these financial statements in accordance with accounting principles generally accepted in the United States of America; this includes the design, implementation and maintenance of internal control relevant to the preparation and fair presentation of the financial statements that are free from material misstatement, whether due to fraud or error.
Auditor’s Responsibility
Our responsibility is to express opinions on these financial statements based on our audits. We conducted our audits in accordance with auditing standards generally accepted in the United States of America. Those standards require that we plan and perform the audits to obtain reasonable assurance about whether the financial statements are free of material misstatement.
An audit involves performing procedures to obtain audit evidence about the amounts and disclosures in the financial statements. The procedures selected depend on the auditor’s judgment, including the assessment of the risks of material misstatement of the financial statements, whether due to
fraud or error. In making those risk assessments, the auditor considers internal control relevant to NWSA’s preparation and fair presentation of the financial statements in order to design audit procedures that are appropriate in the circumstances but not for the purpose of expressing an opinion on the effectiveness of NWSA’s internal control. Accordingly, we express no such opinion. An audit also includes evaluating the appropriateness of accounting policies used and the reasonableness of significant accounting estimates made by management, as well as evaluating the overall presentation of the financial statements.
We believe the audit evidence we have obtained is sufficient and appropriate to provide a basis for our audit opinion.
Opinion
In our opinion, the financial statements referred to above present fairly, in all material respects, the respective financial position of the NWSA as of December 31, 2016, and the respective changes in financial position and where applicable, cash flows thereof for the year then ended, in accordance with accounting principles generally accepted in the United States of America.
Other Matters
Required Supplementary Information: Accounting principles generally accepted in the United States of America require that the management’s discussion and analysis on pages 22-23 be presented to supplement the basic financial statements. Such information, although not a part of the basic financial statements, is required by the Governmental Accounting Standards Board, who considers it to be an
essential part of financial reporting for placing the basic financial statements in an appropriate operational, economic or historical context. We have applied certain limited procedures to the required supplementary information in accordance with auditing standards generally accepted in the United States of America, which consisted of inquiries of management about the methods of preparing the information and comparing the information for consistency with management’s responses to our inquiries, the basic financial statements, and other knowledge we obtained during our audits of the basic financial statements. We do not express an opinion or provide any assurance on the information because the limited procedures do not provide us with sufficient evidence to express an opinion or provide any assurance.
Tacoma, Washington
March 24, 2017
The Managing Members
The Northwest Seaport Alliance
Tacoma, Washington
INDEPENDENT AUDITOR’S REPORT
32

nwseaportalliance.com
11
THE NORTHWEST SEAPORT ALLIANCE
36
COMMERCIAL CONTACTSWe’re here to help. If you have questions or need help moving your cargo, contact us.
Bari BookoutChief commercial officer - Non-container & commercial strategy
Tong ZhuChief commercial officer - Container & real estate
BCO/NVO Accounts Steve BalaskiEmail: [email protected]: 253.888.4403
Sue CoffeyEmail: [email protected]: 253.203.3282
ContainerTom BellerudEmail: [email protected]: 253.383.9405
Non-Container John ChristensenEmail: [email protected]: 253.592.6727
Intermodal Mike ReillyEmail: [email protected]: 253.383.9418
/Breakbulk Non-Container/AutoAndre ElmalehEmail: [email protected]: 253.592.6792