2016 annual report executive summary - nebraska annual report executive summary ... jennifer...
TRANSCRIPT
2016 Annual Report
Executive Summary
1526 K Street, Suite 420 • Lincoln, NE 68508
Phone: 402-471-2043 • Fax: 402-471-2498 • https://nic.nebraska.gov/
email: [email protected]

1

2
3
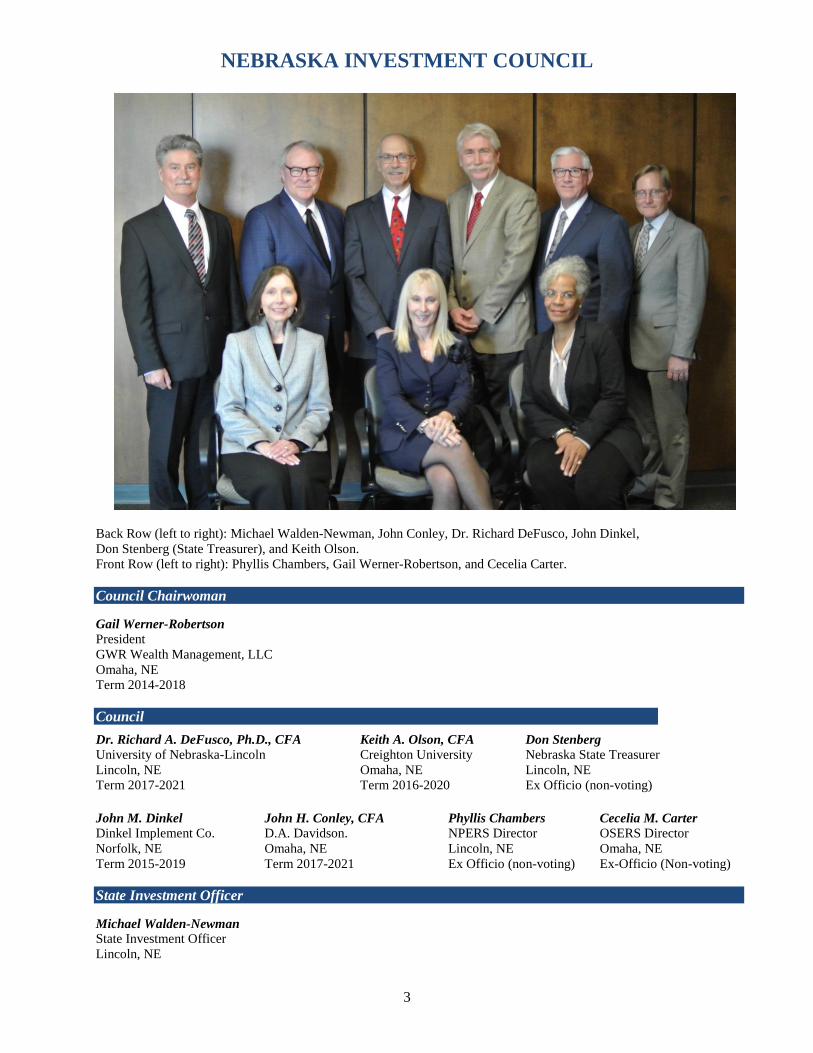
NEBRASKA INVESTMENT COUNCIL
Back Row (left to right): Michael Walden-Newman, John Conley, Dr. Richard DeFusco, John Dinkel,
Don Stenberg (State Treasurer), and Keith Olson.
Front Row (left to right): Phyllis Chambers, Gail Werner-Robertson, and Cecelia Carter.
Council Chairwoman
Gail Werner-Robertson
President
GWR Wealth Management, LLC
Omaha, NE
Term 2014-2018
Council
State Investment Officer
Michael Walden-Newman State Investment Officer
Lincoln, NE
Dr. Richard A. DeFusco, Ph.D., CFA
University of Nebraska-Lincoln
Lincoln, NE
Term 2017-2021
Keith A. Olson, CFA
Creighton University
Omaha, NE
Term 2016-2020
Don Stenberg
Nebraska State Treasurer
Lincoln, NE
Ex Officio (non-voting)
John M. Dinkel
Dinkel Implement Co.
Norfolk, NE
Term 2015-2019
John H. Conley, CFA
D.A. Davidson.
Omaha, NE
Term 2017-2021
Phyllis Chambers
NPERS Director
Lincoln, NE
Ex Officio (non-voting)
Cecelia M. Carter OSERS Director
Omaha, NE
Ex-Officio (Non-voting)
4
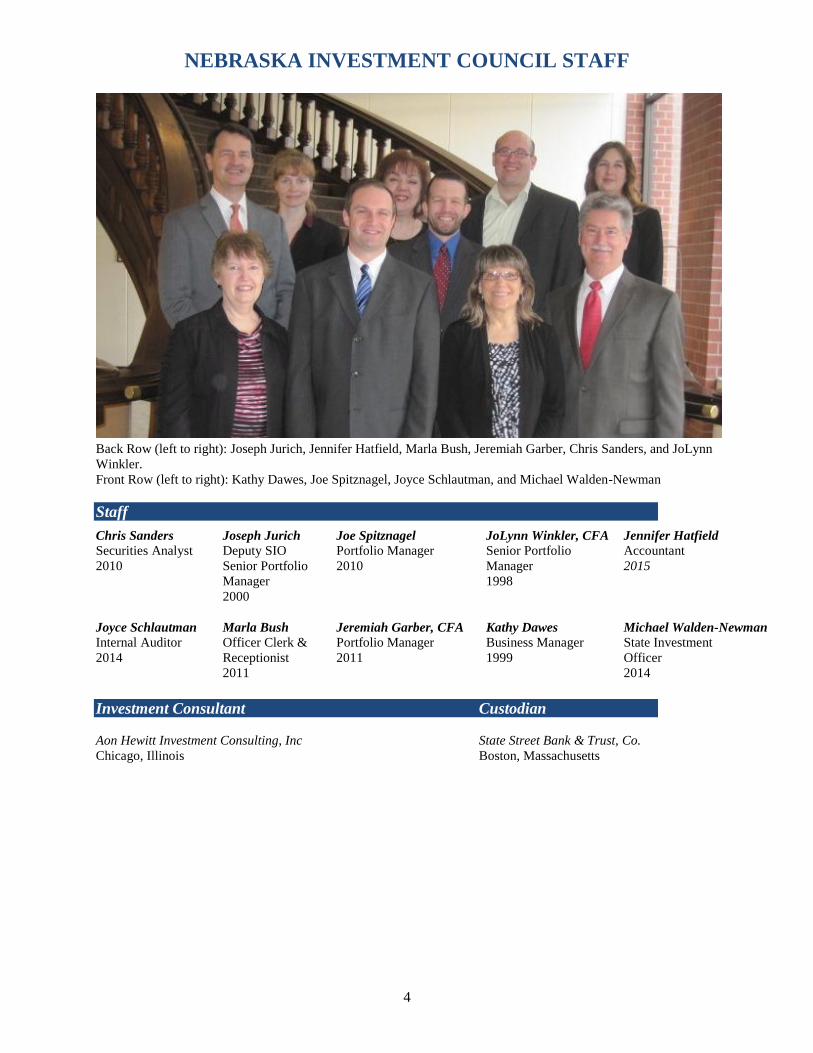
NEBRASKA INVESTMENT COUNCIL STAFF
Back Row (left to right): Joseph Jurich, Jennifer Hatfield, Marla Bush, Jeremiah Garber, Chris Sanders, and JoLynn
Winkler.
Front Row (left to right): Kathy Dawes, Joe Spitznagel, Joyce Schlautman, and Michael Walden-Newman
Staff
Investment Consultant Custodian
Aon Hewitt Investment Consulting, Inc State Street Bank & Trust, Co.
Chicago, Illinois Boston, Massachusetts
Chris Sanders
Securities Analyst
2010
Joseph Jurich
Deputy SIO
Senior Portfolio
Manager
2000
Joe Spitznagel
Portfolio Manager
2010
JoLynn Winkler, CFA
Senior Portfolio
Manager
1998
Jennifer Hatfield Accountant
2015
Joyce Schlautman
Internal Auditor
2014
Marla Bush
Officer Clerk &
Receptionist
2011
Jeremiah Garber, CFA
Portfolio Manager
2011
Kathy Dawes
Business Manager
1999
Michael Walden-Newman
State Investment
Officer
2014

5
6
EXECUTIVE SUMMARY
I am pleased to present the Annual Report for the Nebraska Investment Council for the year ending
December 31, 2016. The Council oversees $23 billion across 32 investment programs:
• $10.6 billion in 4 defined benefit pension plans.
• $2.9 billion in 7 other retirement plans.
• $1.2 billion in 11 public endowments.
• $3.8 billion in the Operating Investment Pool, the State's checkbook, which is managed internally.
• $294.4 million in State funds managed by the University of Nebraska Foundation.
• $76 million in 3 State trusts.
• $4.2 billion in 4 college savings plans.
• $1.0 million in Nebraska Enable, a new program for disability expenses.
The funds are spread among 58 investment firms and over 150 investments.
The term Council is used in several ways:
• The Council is the seven-member governing body including five private citizens appointed by the
Governor and confirmed by the State Legislature, and three ex-officio members: the State Treasurer, the
Director of the Public Employees' Retirement Systems.
• The Council is an independent state agency with a ten-member Investment Team.
• Most importantly, the Investment Council is the eighteen of us working together for the citizens of
Nebraska.
• Beginning January 1, 2017 the Director of the Omaha School Employees Retirement System becomes
an ex-officio member, bringing the Council to a total of eight members.
The Council is grateful for the support we receive from the Governor and other statewide elected
officials. We appreciate the interest and encouragement of state legislators, particularly the Nebraska
Retirement Systems Committee, Appropriations Committee and their staff. We value our close working
relationship with other state agencies, and the Nebraska Public Employees Retirement Systems staff and
board. Our mission statement reflects our shared goals:
“It is the mission of the Nebraska Investment Council to prudently manage the funds entrusted to us by
the people of the State of Nebraska. We deliver investment management services to provide direct
financial benefit exclusively to the owners of these funds. We are committed to thorough, sound, and
informed analysis in order to achieve superior returns while maintaining prudent levels of risk.”
The following Executive Summary provides an overview of our 2016 Annual Report. This summary
includes Council activity, 2016 capital markets, and general portfolio overview including performance on
the ten main Investment Programs. The full Annual Report follows with detailed sector and manager
performance. This report and a wealth of other information about the Nebraska investment program can
be found on the Council website at https://nic.nebraska.gov/. Please contact me with any questions you
have. I can be reached directly at 402-471-2001 or [email protected].
Michael W. Walden-Newman
State Investment Officer
7
Council Initiatives
The Council investment program remains solid and 2016 work produced results. In May the Council
approved a new, improved $2 billion global equity portfolio. This was the result of an initiative launched
in 2015 to examine the entire Council portfolio, asset class by asset class, using a "blank sheet" approach.
The process does not simply target underperforming managers. We ask instead: “Does the asset class
have a place in the portfolio? If so, what style? What weight? What Structure? And finally, which
managers?”
It was Council directed. We used over 20 existing and potential investment firms as an extension of staff.
Together we explored the strengths and weaknesses in the current structure, and potential for
improvement. We sent the best of the ideas to our consultant Aon Hewitt for analysis. Together, we
devised a final structure and selected best-in-class managers to implement.
In August of last year we turned our attention to the rest of the public equity portfolio—the $6 billion
invested in domestic and international equities. We have used the same blank sheet approach and by year-
end had again worked with over 20 different firms exploring options for improvement. We will bring an
improved, integrated equity structure to the Council for approval by mid-year 2017. This methodical
investment management process keeps the portfolio fresh and fine-tuned. Without it, portfolios run the
risk of being based on yesterday's best practices and ideas, not tomorrow's.
2016 saw the transfer of the Omaha School Employees' Retirement System (OSERS) assets to the
Council effective January 1, 2017. The State legislature first considered such a merger in 2015, and
approved it in March 2016. The Council and OSERS developed a transition plan effective July 1, 2016.
Cooperation and collaboration on all sides resulted in a very smooth transfer. The OSERS director
becomes a welcomed ex-officio member of the Council.
The Council's 2016 summer retreat—an annual policy-focused Council meeting—covered three critical
areas:
• Fixed Income Investing in Today’s Economy with a panel of our managers which covered the changing
bond market landscape.
• “An Asset Liability Study provides the tools to align a retirement plan’s risk taking with its liabilities,
says Council consultant Aon Hewitt.” The Council conducts a study every three to five years. Our
consultant presented the results of the 2016 study.
• Council members and the State Investment Officer are bound by State law to act as fiduciaries for the
State and the beneficiaries of the assets we manage. Fiduciary Responsibility was the focus of the last
session.
Audits improve accountability. The Council has a full-time internal auditor to ensure on-going
compliance. The State Auditor also calls on Council staff to help prepare the comprehensive annual
financial reports for the State of Nebraska, and the pension and retirement plans. It seems the reporting
becomes more in-depth each year. A significant amount of Council time is spent discussing the
investment program and preparing specific financial information.
Finally, the Council launches a new website in early 2017. This six-month effort will result in improved
transparency and public access.
8
Capital Markets Overview
Global equities provided positive returns over 2016, but there was a notable degree of regional
disparity. After a volatile year, the equity markets finished 2016 on an upbeat note. The Dow Jones U.S.
Total Stock Market Index, a broad measure for U.S. equities, returned 12.6% for the year. Developed
non-U.S. equities, as represented by the MSCI EAFE Index, returned 1.0% in 2016. The MSCI Emerging
Markets Index, a measure of emerging market equities, gained 11.2% during the year. Following Donald
Trump’s election win in November, the U.S. Dollar strengthened meaningfully. The strengthening of the
U.S. Dollar eroded much of the gains made in other regional equity markets in USD-terms. (In local
currency terms, the performance of developed non-U.S. equity markets was nearly eight percentage points
better than it was in USD-terms during 4Q.) Emerging market economies improved in 2016, mainly due
to rising commodity prices and economic stabilization in China.
Federal Reserve hikes benchmark rate and targets three further hikes in 2017. Signs of a stronger
economy alongside returning inflationary pressures prompted the Federal Reserve ("Fed") to increase the
target for the Federal Funds rate to 0.5-0.75% in December. Moreover, with the potential of the economy
to surprise on the upside, members of the Federal Open Markets Committee (FOMC) indicated that they
envisioned an additional three rate increases in 2017, in line with market expectations. Domestic fixed
income markets, as measured by the Bloomberg Barclays U.S. Universal Index, returned 3.9% during
2016.
Europe is showing improving economic conditions, however political risk remains ahead of a busy
2017. Immediately after the U.K.’s referendum decision to leave the European Union, the Europe ex-U.K.
region and the U.K. experienced a significant sell-off. European equity markets recovered rapidly,
however, erasing mark-to-market losses before the end of Q3. While Eurozone annualized GDP remained
unchanged at 2% at the end of the year, growth picked up in the manufacturing sector as the
manufacturing purchasing managers’ index moved firmly into expansionary territory. The unemployment
rate also broke through the 10% threshold for the first time in five years. That said, a high level of
uncertainty remains owing to the large number of geopolitical risk factors on the horizon, including
ongoing Brexit negotiations and German and French elections. Although the European economic
recovery remains intact, the European Central Bank extended their quantitative easing program until the
end of 2017.
Japan’s economy continues to stutter, but a weaker yen provides some help. The Japanese economy
posted anemic GDP growth throughout 2016. However, after six consecutive months of deflation,
inflation rose modestly in the fourth quarter of 2016. The weakening of the yen in the fourth quarter
provided a boost to the economy, partially restoring exporters’ competitiveness to near-early-2016 levels.
The Bank of Japan made no changes to its monetary policy during 2016; as of year-end, Japanese short-
term interest rates remained in negative territory.
Emerging markets outperformed non-U.S. developed markets in 2016. Emerging markets benefitted
from the stabilization of oil prices, China’s introduction of fresh stimulus measures, and gradual U.S.
monetary policy tightening. However, the recovery of emerging markets was threatened in the fourth
quarter by the strengthening in the U.S. dollar and expectations of increased protectionism under a Trump
administration.

9
NEBRASKA INVESTMENT COUNCIL PORTFOLIO HIGHLIGHTS
Transaction Summary
Beginning
Balance
Net
Contributions
Investment
Results
Closing
Balance
(millions of dollars)
Defined Benefit Plans $ 9,933 - $ 159 $ 847 $ 10,621
State & County Retirement Plans/
Deferred Compensation Plan
2,714 - 27 231 2,918
Operating Investment Pool 3,922 - 207 57 3,772
NE Educational Savings Plan Trust 3,848 64 282 4,194
Nebraska ENABLE Savings Plan 0 1 0 1
General Endowment Funds 766 - 8 68 826
Health Care Endowment Fund 377 - 21 30 386
University Funds 287 - 13 20 294
Miscellaneous Trusts 75 - 2 3 76
2016 Totals $21,922 - $ 372 $ 1,538 $ 23,088
2015 Totals $ 21,962 - $ 227 $ 187 $ 21,922
2014 Totals 20,595 159 1,208 21,962
2013 Totals 17,769 372 2,454 20,595
2012 Totals 15,831 241 1,697 17,769
2011 Totals 15,578 112 141 15,831
The Nebraska Investment Council manages the investments of over 30 different entities. Numerous
organizations may be included in an entity, such as the many separate departments of State Government
in the Operating Investment Pool. These entities fall into the ten major investment programs displayed
above. For example, the pension plans for the employees of the Schools, the State Patrol, and Judges have
similar characteristics and are grouped under “Defined Benefit Plans.” The pension plans for State and
County employees have different characteristics and are listed separately. For all these entities, the
Council’s responsibilities are primarily investment management. It does not determine the amount of
funds contributed to nor disbursed from the funds it manages.
46.0%
12.6%
16.3%
18.2%
0.0%
3.6%
1.7%
1.3%
0.3%
Defined Benefit Plans
State & County Retirement
Plans/Deferred Compensation PlanOperating Investment Pool
Nebraska Educational Savings Plan
TrustENABLE Savings Plan
General Endowment Funds
Health Care Endowment Fund
University Funds
Miscellaneous Trusts
10
This report is intended to provide an overview of the investment management activities of the Council.
All figures are believed to be materially accurate within the context of this report. Returns on all funds
managed by the Council are reported net of fees unless noted otherwise.
DEFINED BENEFIT PLANS
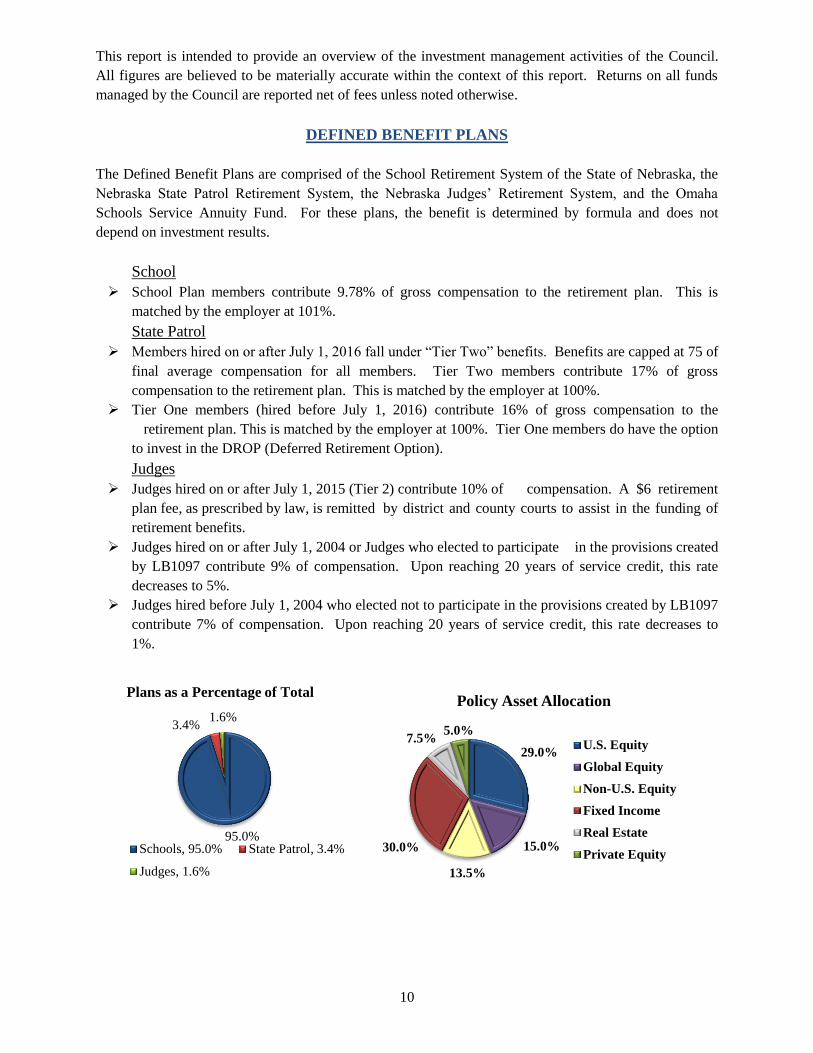
The Defined Benefit Plans are comprised of the School Retirement System of the State of Nebraska, the
Nebraska State Patrol Retirement System, the Nebraska Judges’ Retirement System, and the Omaha
Schools Service Annuity Fund. For these plans, the benefit is determined by formula and does not
depend on investment results.
School
School Plan members contribute 9.78% of gross compensation to the retirement plan. This is
matched by the employer at 101%.
State Patrol
Members hired on or after July 1, 2016 fall under “Tier Two” benefits. Benefits are capped at 75 of
final average compensation for all members. Tier Two members contribute 17% of gross
compensation to the retirement plan. This is matched by the employer at 100%.
Tier One members (hired before July 1, 2016) contribute 16% of gross compensation to the
retirement plan. This is matched by the employer at 100%. Tier One members do have the option
to invest in the DROP (Deferred Retirement Option).
Judges
Judges hired on or after July 1, 2015 (Tier 2) contribute 10% of compensation. A $6 retirement
plan fee, as prescribed by law, is remitted by district and county courts to assist in the funding of
retirement benefits.
Judges hired on or after July 1, 2004 or Judges who elected to participate in the provisions created
by LB1097 contribute 9% of compensation. Upon reaching 20 years of service credit, this rate
decreases to 5%.
Judges hired before July 1, 2004 who elected not to participate in the provisions created by LB1097
contribute 7% of compensation. Upon reaching 20 years of service credit, this rate decreases to
1%.
95.0%
3.4% 1.6%
Plans as a Percentage of Total
Schools, 95.0% State Patrol, 3.4%
Judges, 1.6%
29.0%
15.0%
13.5%
30.0%
7.5% 5.0%
Policy Asset Allocation
U.S. Equity
Global Equity
Non-U.S. Equity
Fixed Income
Real Estate
Private Equity
11
The School Plan is the largest of the three plans totaling $10.0 billion of the $10.6 billion (95%) in the
Defined Benefit Plan. The Policy Asset Allocation of the plan currently is listed above and it maintains a
57.5% to public equity, 30% fixed income, 5.0% to private equity, and 7.5% to private real estate.
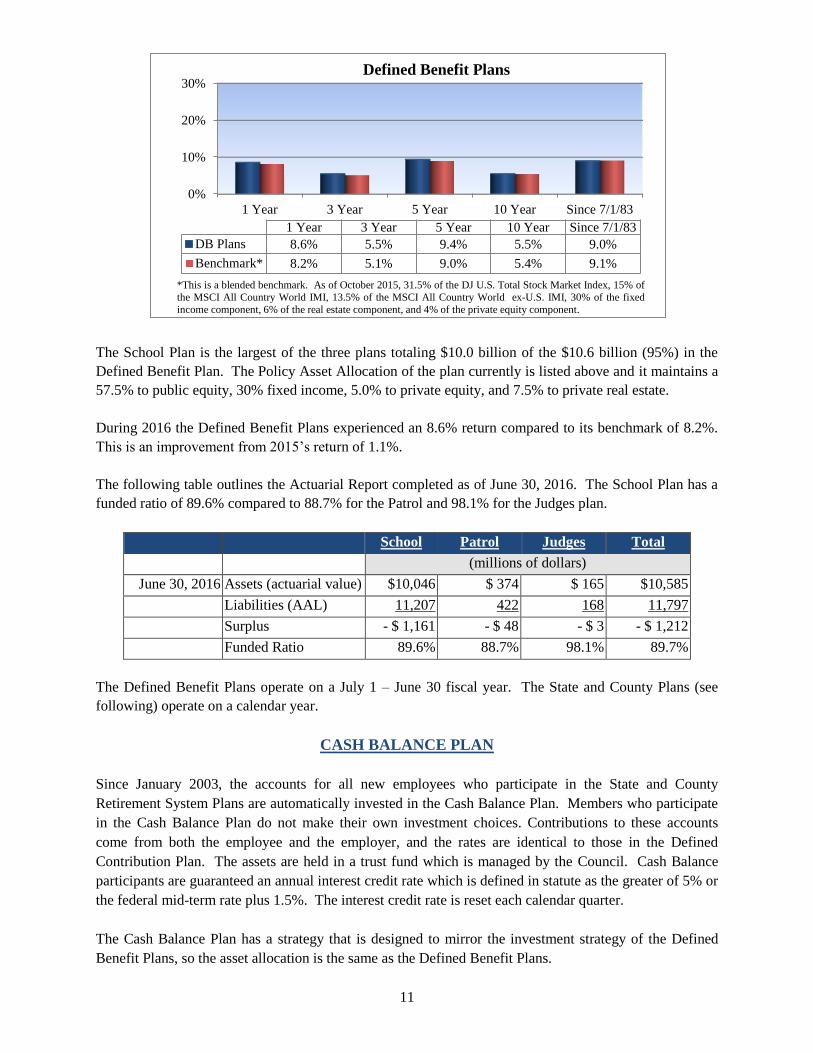
During 2016 the Defined Benefit Plans experienced an 8.6% return compared to its benchmark of 8.2%.
This is an improvement from 2015’s return of 1.1%.
The following table outlines the Actuarial Report completed as of June 30, 2016. The School Plan has a
funded ratio of 89.6% compared to 88.7% for the Patrol and 98.1% for the Judges plan.
School Patrol Judges Total
(millions of dollars)
June 30, 2016 Assets (actuarial value) $10,046 $ 374 $ 165 $10,585
Liabilities (AAL) 11,207 422 168 11,797
Surplus - $ 1,161 - $ 48 - $ 3 - $ 1,212
Funded Ratio 89.6% 88.7% 98.1% 89.7%
The Defined Benefit Plans operate on a July 1 – June 30 fiscal year. The State and County Plans (see
following) operate on a calendar year.
CASH BALANCE PLAN
Since January 2003, the accounts for all new employees who participate in the State and County
Retirement System Plans are automatically invested in the Cash Balance Plan. Members who participate
in the Cash Balance Plan do not make their own investment choices. Contributions to these accounts
come from both the employee and the employer, and the rates are identical to those in the Defined
Contribution Plan. The assets are held in a trust fund which is managed by the Council. Cash Balance
participants are guaranteed an annual interest credit rate which is defined in statute as the greater of 5% or
the federal mid-term rate plus 1.5%. The interest credit rate is reset each calendar quarter.
The Cash Balance Plan has a strategy that is designed to mirror the investment strategy of the Defined
Benefit Plans, so the asset allocation is the same as the Defined Benefit Plans.
0%
10%
20%
30%
1 Year 3 Year 5 Year 10 Year Since 7/1/83
1 Year 3 Year 5 Year 10 Year Since 7/1/83
DB Plans 8.6% 5.5% 9.4% 5.5% 9.0%
Benchmark* 8.2% 5.1% 9.0% 5.4% 9.1%
Defined Benefit Plans
*This is a blended benchmark. As of October 2015, 31.5% of the DJ U.S. Total Stock Market Index, 15% of
the MSCI All Country World IMI, 13.5% of the MSCI All Country World ex-U.S. IMI, 30% of the fixed
income component, 6% of the real estate component, and 4% of the private equity component.
12
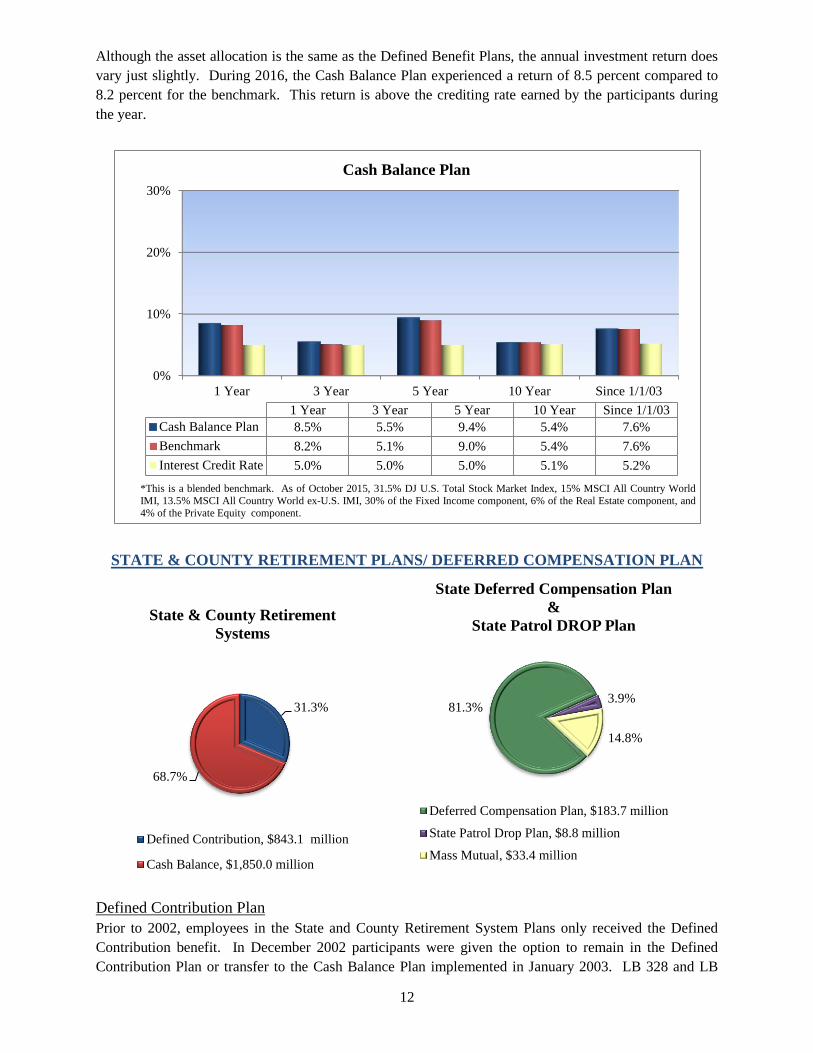
Although the asset allocation is the same as the Defined Benefit Plans, the annual investment return does
vary just slightly. During 2016, the Cash Balance Plan experienced a return of 8.5 percent compared to
8.2 percent for the benchmark. This return is above the crediting rate earned by the participants during
the year.
STATE & COUNTY RETIREMENT PLANS/ DEFERRED COMPENSATION PLAN
Defined Contribution Plan
Prior to 2002, employees in the State and County Retirement System Plans only received the Defined
Contribution benefit. In December 2002 participants were given the option to remain in the Defined
Contribution Plan or transfer to the Cash Balance Plan implemented in January 2003. LB 328 and LB
0%
10%
20%
30%
1 Year 3 Year 5 Year 10 Year Since 1/1/03
1 Year 3 Year 5 Year 10 Year Since 1/1/03
Cash Balance Plan 8.5% 5.5% 9.4% 5.4% 7.6%
Benchmark 8.2% 5.1% 9.0% 5.4% 7.6%
Interest Credit Rate 5.0% 5.0% 5.0% 5.1% 5.2%
Cash Balance Plan
*This is a blended benchmark. As of October 2015, 31.5% DJ U.S. Total Stock Market Index, 15% MSCI All Country World
IMI, 13.5% MSCI All Country World ex-U.S. IMI, 30% of the Fixed Income component, 6% of the Real Estate component, and
4% of the Private Equity component.
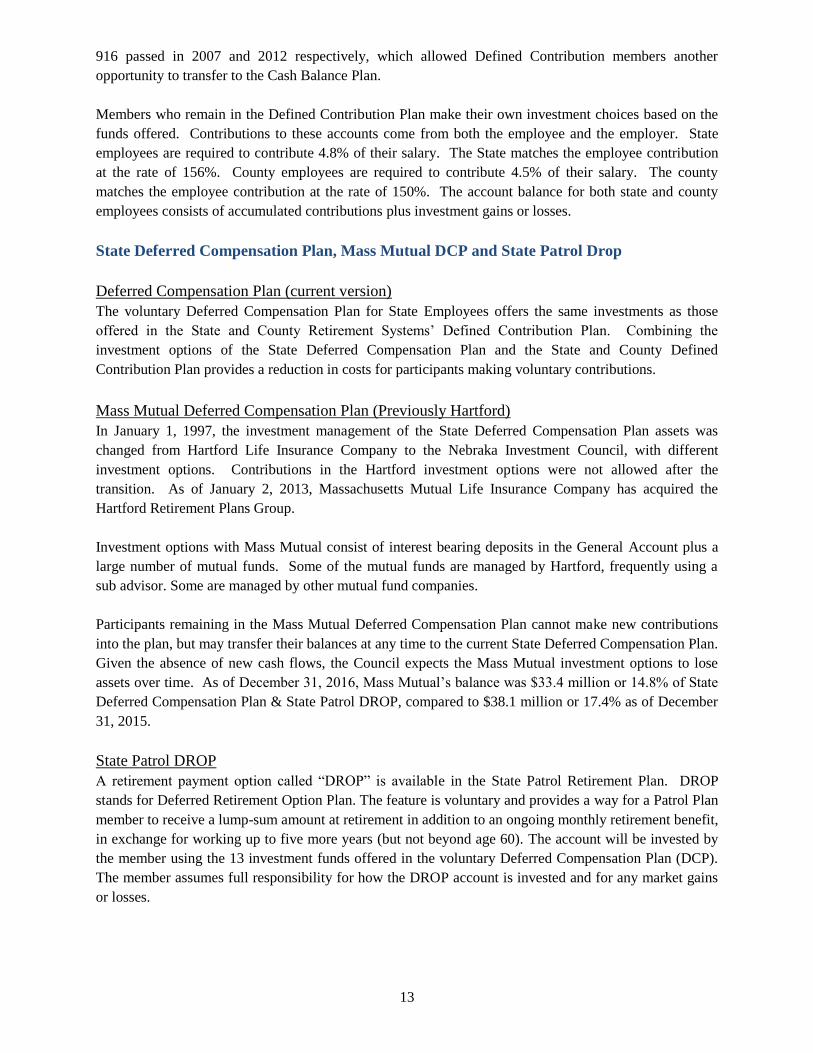
31.3%
68.7%
State & County Retirement
Systems
Defined Contribution, $843.1 million
Cash Balance, $1,850.0 million
81.3% 3.9%
14.8%
State Deferred Compensation Plan
&
State Patrol DROP Plan
Deferred Compensation Plan, $183.7 million
State Patrol Drop Plan, $8.8 million
Mass Mutual, $33.4 million
13
916 passed in 2007 and 2012 respectively, which allowed Defined Contribution members another
opportunity to transfer to the Cash Balance Plan.
Members who remain in the Defined Contribution Plan make their own investment choices based on the
funds offered. Contributions to these accounts come from both the employee and the employer. State
employees are required to contribute 4.8% of their salary. The State matches the employee contribution
at the rate of 156%. County employees are required to contribute 4.5% of their salary. The county
matches the employee contribution at the rate of 150%. The account balance for both state and county
employees consists of accumulated contributions plus investment gains or losses.
State Deferred Compensation Plan, Mass Mutual DCP and State Patrol Drop
Deferred Compensation Plan (current version)
The voluntary Deferred Compensation Plan for State Employees offers the same investments as those
offered in the State and County Retirement Systems’ Defined Contribution Plan. Combining the
investment options of the State Deferred Compensation Plan and the State and County Defined
Contribution Plan provides a reduction in costs for participants making voluntary contributions.
Mass Mutual Deferred Compensation Plan (Previously Hartford)
In January 1, 1997, the investment management of the State Deferred Compensation Plan assets was
changed from Hartford Life Insurance Company to the Nebraka Investment Council, with different
investment options. Contributions in the Hartford investment options were not allowed after the
transition. As of January 2, 2013, Massachusetts Mutual Life Insurance Company has acquired the
Hartford Retirement Plans Group.
Investment options with Mass Mutual consist of interest bearing deposits in the General Account plus a
large number of mutual funds. Some of the mutual funds are managed by Hartford, frequently using a
sub advisor. Some are managed by other mutual fund companies.
Participants remaining in the Mass Mutual Deferred Compensation Plan cannot make new contributions
into the plan, but may transfer their balances at any time to the current State Deferred Compensation Plan.
Given the absence of new cash flows, the Council expects the Mass Mutual investment options to lose
assets over time. As of December 31, 2016, Mass Mutual’s balance was $33.4 million or 14.8% of State
Deferred Compensation Plan & State Patrol DROP, compared to $38.1 million or 17.4% as of December
31, 2015.
State Patrol DROP
A retirement payment option called “DROP” is available in the State Patrol Retirement Plan. DROP
stands for Deferred Retirement Option Plan. The feature is voluntary and provides a way for a Patrol Plan
member to receive a lump-sum amount at retirement in addition to an ongoing monthly retirement benefit,
in exchange for working up to five more years (but not beyond age 60). The account will be invested by
the member using the 13 investment funds offered in the voluntary Deferred Compensation Plan (DCP).
The member assumes full responsibility for how the DROP account is invested and for any market gains
or losses.
14
Asset Allocation
For both employee and employer contributions, a participant selects among thirteen investment funds
offered by the Plans. The Council selects, monitors, and terminates, when necessary, these funds. Because
participants direct the investment of these contributions, the participant determines the allocation to each
of these funds.
The State Deferred Compensation Plan is voluntary and participants may choose to invest their assets in
any of the available Defined Contribution investment funds. By offering the same investment funds for
both the Defined Contribution Plan (mandatory contributions) and the State Deferred Compensation Plan
(voluntary contributions), plan participants may find it easier to implement an integrated investment
strategy. Combining the investment options also provides a reduction in costs for participants.
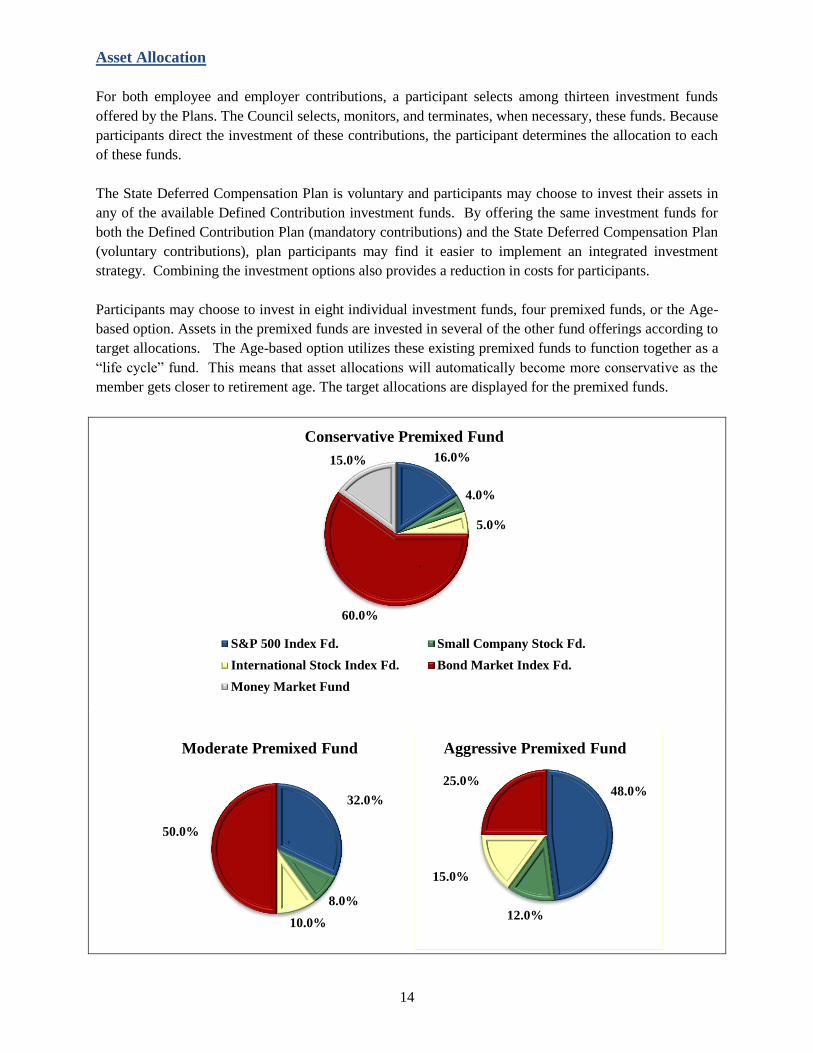
Participants may choose to invest in eight individual investment funds, four premixed funds, or the Age-
based option. Assets in the premixed funds are invested in several of the other fund offerings according to
target allocations. The Age-based option utilizes these existing premixed funds to function together as a
“life cycle” fund. This means that asset allocations will automatically become more conservative as the
member gets closer to retirement age. The target allocations are displayed for the premixed funds.
16.0%
4.0%
5.0%
60.0%
15.0%
Conservative Premixed Fund
S&P 500 Index Fd. Small Company Stock Fd.
International Stock Index Fd. Bond Market Index Fd.
Money Market Fund
7
32.0%
8.0%
10.0%
50.0%
Moderate Premixed Fund
7
48.0%
12.0%
15.0%
25.0%
Aggressive Premixed Fund
15
OPERATING INVESTMENT POOL (OIP)
The Council invests the available money from the State’s general fund and State boards, commissions,
departments or agencies, and any other state funds not currently needed, into the Operating Investment
Pool (OIP). The Department of Administrative Services calculates the average daily balance for each
participant and distributes the earned income monthly on a pro-rata share basis.
From the funds available for investment in the OIP, the Council is required, pursuant to the Nebraska
Capital Expansion Act, to offer each qualifying bank and capital stock financial institution in the State a
time deposit open account (TDOA) of one million dollars. To the extent that the total amount of funds
initially offered to each bank or capital stock financial institution is not accepted by such institutions, the
balance of the funds shall be reoffered to such banks and capital stock financial institutions that are
willing to meet the rate and other requirements set forth for participation in the program. No one bank or
capital stock financial institution may receive for deposit a sum of more than six million dollars.
The first $250,000 of the deposit is insured by the FDIC. The statute requires the pledging of collateral
for deposits greater than $250,000 with a minimum pledge of 102% of the amount deposited. However,
when publicly traded securities are used for collateral, the Council requires 110% for adequate coverage
due to fluctuating market values throughout the month. The Nebraska statute also allows institutions to
pledge letters of credit. This type of collateral does not have a fluctuating value so when letters of credit
are used, 102% is the coverage required by the Council.
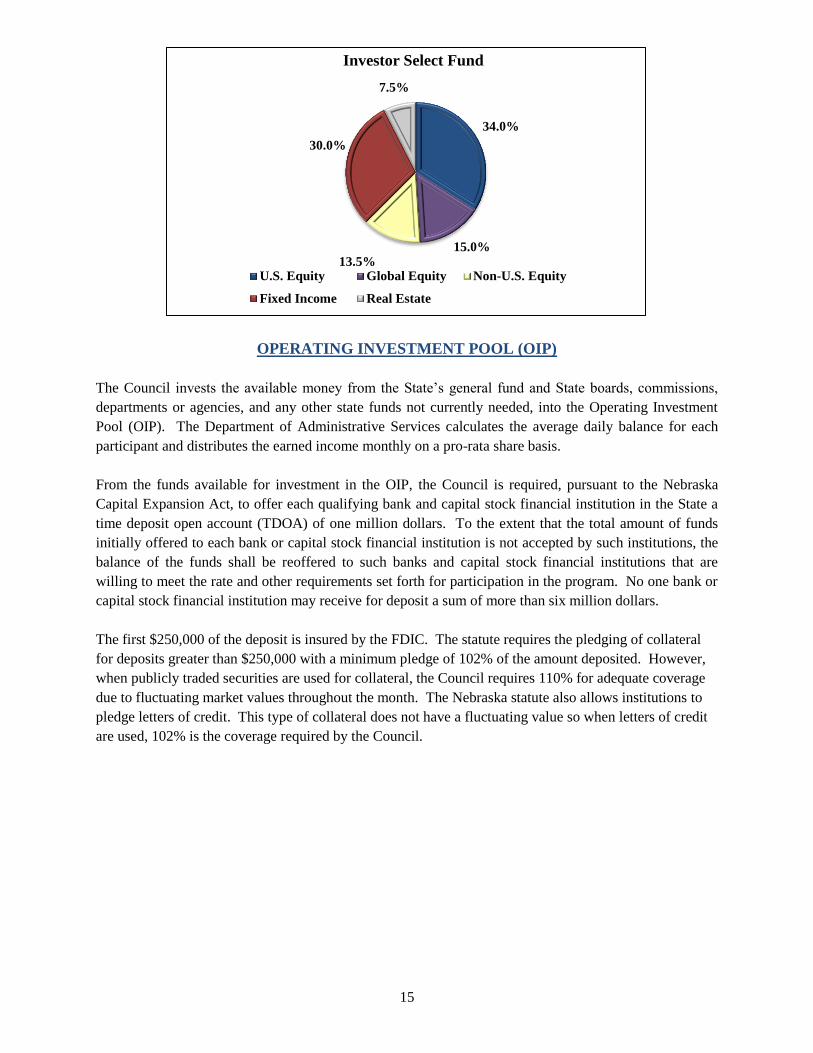
34.0%
15.0% 13.5%
30.0%
7.5%
Investor Select Fund
U.S. Equity Global Equity Non-U.S. Equity
Fixed Income Real Estate
16
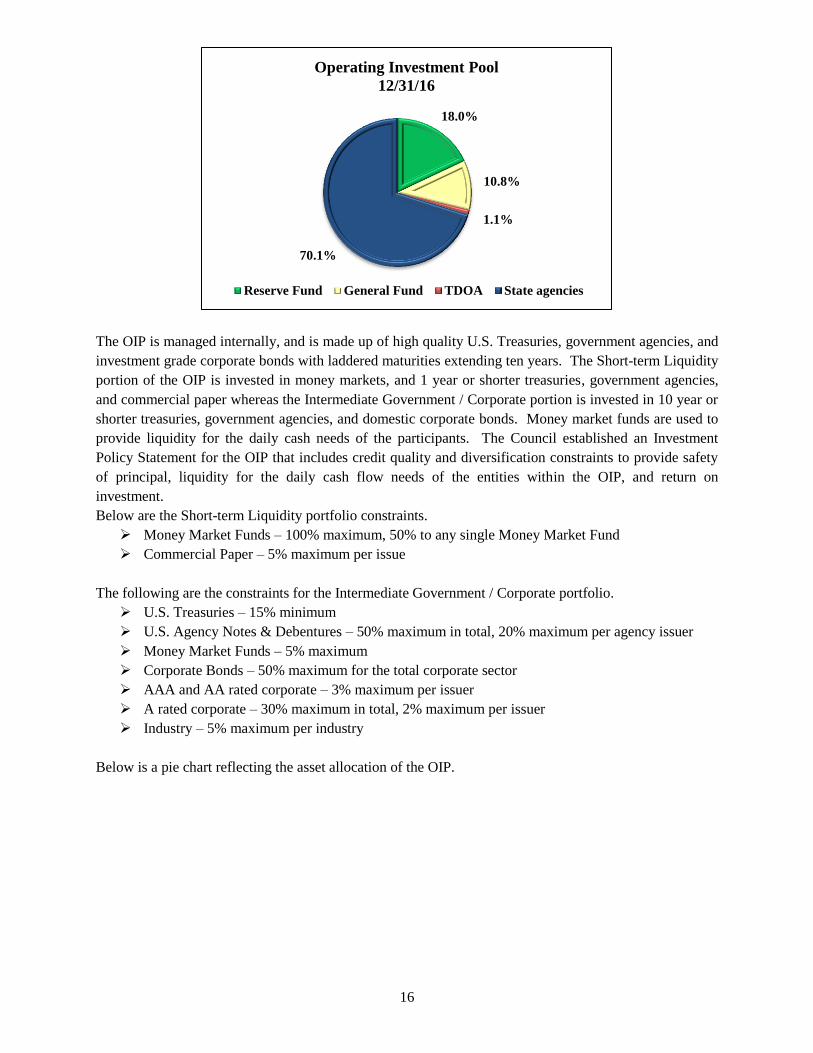
The OIP is managed internally, and is made up of high quality U.S. Treasuries, government agencies, and
investment grade corporate bonds with laddered maturities extending ten years. The Short-term Liquidity
portion of the OIP is invested in money markets, and 1 year or shorter treasuries, government agencies,
and commercial paper whereas the Intermediate Government / Corporate portion is invested in 10 year or
shorter treasuries, government agencies, and domestic corporate bonds. Money market funds are used to
provide liquidity for the daily cash needs of the participants. The Council established an Investment
Policy Statement for the OIP that includes credit quality and diversification constraints to provide safety
of principal, liquidity for the daily cash flow needs of the entities within the OIP, and return on
investment.
Below are the Short-term Liquidity portfolio constraints.
Money Market Funds – 100% maximum, 50% to any single Money Market Fund
Commercial Paper – 5% maximum per issue
The following are the constraints for the Intermediate Government / Corporate portfolio.
U.S. Treasuries – 15% minimum
U.S. Agency Notes & Debentures – 50% maximum in total, 20% maximum per agency issuer
Money Market Funds – 5% maximum
Corporate Bonds – 50% maximum for the total corporate sector
AAA and AA rated corporate – 3% maximum per issuer
A rated corporate – 30% maximum in total, 2% maximum per issuer
Industry – 5% maximum per industry
Below is a pie chart reflecting the asset allocation of the OIP.
18.0%
10.8%
1.1%
70.1%
Operating Investment Pool
12/31/16
Reserve Fund General Fund TDOA State agencies
17
Operating Investment Pool
NEBRASKA EDUCATIONAL SAVINGS PLAN (NEST)
The Nebraska Educational Savings Plan Trust was established by the Nebraska State Legislature with a
January 1, 2001, effective date. The Plan is an Internal Revenue Code Section 529 Plan providing tax-
deferred growth of funds for higher education costs. There are four plans within the Nebraska
Educational Savings Plan Trust – NEST Direct College Savings Plan, NEST Advisor College Savings
Plan, the TD Ameritrade 529 College Savings Plan, and the State Farm College Savings Plan. The
Nebraska State Treasurer serves as the Program Trustee, First National Bank of Omaha serves as the
Program Manager, and all investments are approved by the Nebraska Investment Council.
NEST Direct College Savings Plan
The NEST Direct Plan puts the account owner in charge of managing the account without guidance from
a financial advisor. The account can be invested in the following investment options.
Age Based Portfolios
Static Portfolios
Individual Fund Portfolios
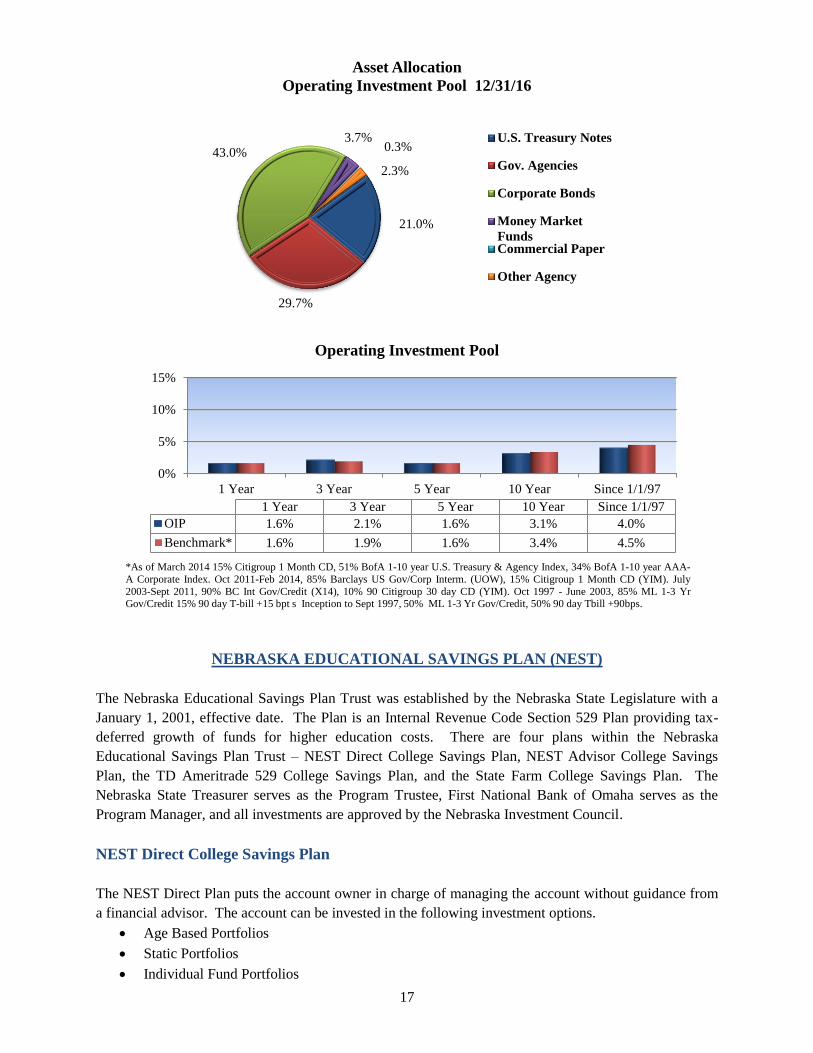
21.0%
29.7%
43.0%
3.7% 0.3%
2.3%
Asset Allocation
Operating Investment Pool 12/31/16
U.S. Treasury Notes
Gov. Agencies
Corporate Bonds
Money Market
FundsCommercial Paper
Other Agency
0%
5%
10%
15%
1 Year 3 Year 5 Year 10 Year Since 1/1/97
1 Year 3 Year 5 Year 10 Year Since 1/1/97
OIP 1.6% 2.1% 1.6% 3.1% 4.0%
Benchmark* 1.6% 1.9% 1.6% 3.4% 4.5%
*As of March 2014 15% Citigroup 1 Month CD, 51% BofA 1-10 year U.S. Treasury & Agency Index, 34% BofA 1-10 year AAA-
A Corporate Index. Oct 2011-Feb 2014, 85% Barclays US Gov/Corp Interm. (UOW), 15% Citigroup 1 Month CD (YIM). July
2003-Sept 2011, 90% BC Int Gov/Credit (X14), 10% 90 Citigroup 30 day CD (YIM). Oct 1997 - June 2003, 85% ML 1-3 Yr Gov/Credit 15% 90 day T-bill +15 bpt s Inception to Sept 1997, 50% ML 1-3 Yr Gov/Credit, 50% 90 day Tbill +90bps.
18
NEST Advisor College Savings Plan
The NEST Advisor Plan is offered to individuals who are using the expertise and guidance of a financial
advisor. The financial advisor will work with the Program Manager to open and transfer money to the
participant account. The account can be invested in the following investment options.
Age Based Portfolios
Static Portfolios
Individual Fund Portfolios
TD Ameritrade 529 College Savings Plan
Participant accounts can be set up directly with TD Ameritrade and participants are offered similar
investment options as those offered to participants with the NEST direct and advisor accounts. The
account can be invested in the following investment options.
Age Based Portfolios
Static Portfolios
Individual Fund Portfolios
State Farm College Savings Plan
State Farm agents market a series of the Nebraska Educational Savings Plan Trust under the State Farm
name. Participants may choose from the following investment options, of which the majority are
Oppenheimer mutual funds managed by OFI Private Investments Inc.
Static Portfolios
Enrollment-based Portfolios
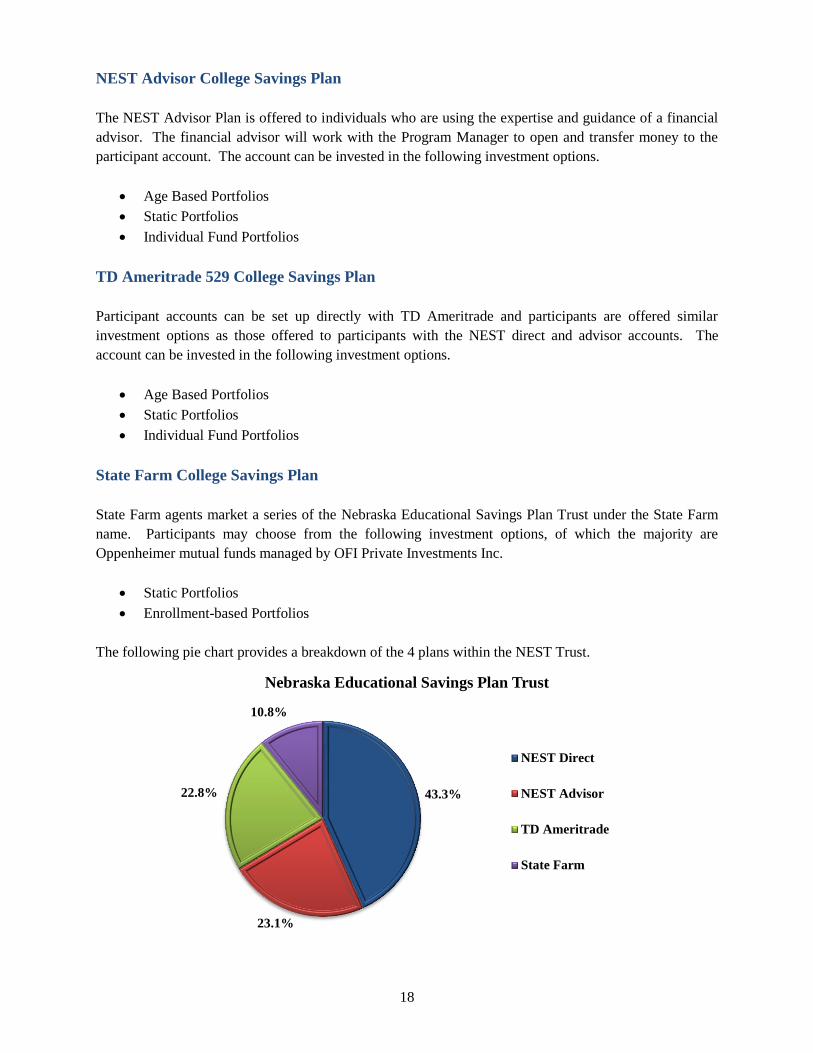
The following pie chart provides a breakdown of the 4 plans within the NEST Trust.
43.3%
23.1%
22.8%
10.8%
Nebraska Educational Savings Plan Trust
NEST Direct
NEST Advisor
TD Ameritrade
State Farm

19
NEBRASKA ENABLE SAVINGS PLAN
The Nebraska Enable Savings Plan (Enable) is issued by The Nebraska Achieving a Better Life
Experience Program Trust. The Plan is intended to operate as a qualified ABLE program to be used only
to save for Qualified Disability Expenses, pursuant to the Achieving a Better Life Experience Act of 2014
and Section 529A of the U.S. Internal Revenue Code. The Nebraska State Treasurer serves as the
Program Trustee, First National Bank of Omaha serves as the Program Manager, and all investments are
approved by the Nebraska Investment Council.
The Enable Plan offers participants five investment options.
Target-Risk Options: The Growth Option, Moderate Option, and Conservative Option. Each option is
invested in Vanguard index funds across various asset classes – equity, fixed income or cash equivalents.
Bank Savings Option: Investment in the Bank Savings Option will earn varying rates of interest and
provides FDIC insurance on a per participant, pass-through basis to each account owner up to the
maximum amount set by federal law, currently $250,000.
Checking Option: The Checking Investment Option provides FDIC insurance for the investment and
allows the account owner to write a check or use a debit card to withdraw funds. This option is available
to participants as of January 26, 2017.
GENERAL ENDOWMENTS
Endowment funds are used to provide a perpetual source of funding for the activities of the entities they
support. Generally there are two investment objectives – providing some funds for the current year’s
operations and increasing the portfolio to support future needs. The financial management of an
endowment fund consists of a contribution strategy, a distribution strategy, and an investment strategy.
Although these strategies are interrelated, the Nebraska Investment Council determines only the
investment strategy for these endowments. The assets of the endowments described in this section are
commingled to achieve administrative efficiencies and cost savings from economies of scale.
20
The basic purpose of each endowment is described below.
The Permanent School Fund
The endowment receives proceeds from the sales of school land held in trust for public education,
payments for easements and right-of-way over the lands, and royalties and severance taxes paid on oil,
gas, and minerals produced from these lands. The net income earned on this fund is distributed annually
to the K-12 public schools.
The Nebraska Early Childhood Education Endowment Fund
The endowment provides funding for grants to schools and community partners to provide programs
serving at-risk children birth to age three.
The Nebraska Veterans’ Aid Fund
The endowment provides emergency financial assistance to eligible veterans and dependents.
The Cultural Preservation Endowment Fund
The endowment supports the activities of the Nebraska Arts Council and the Nebraska Humanities
Council. Distributions from this fund are conditioned on matching contributions from other sources.
The Agricultural Endowment Fund
The endowment receives proceeds from sales of land granted by the federal government. Investment
income is distributed to the Institute of Agriculture and Natural Resources.
The Permanent Endowment Fund
The endowment receives proceeds from the sales of land granted by the federal government. Investment
income is distributed to the University of Nebraska. This fund is also called the Permanent University
Endowment Fund.
The Normal School Endowment
The endowment receives proceeds from sales of land granted by the federal government. Investment
income is distributed for the benefit of the state colleges. This fund is also called the State College
Endowment Fund.
The Nebraska Environmental Endowment Fund
The endowment is funded by the state lottery program and is part of the Nebraska Environmental Trust.
The Trust provides grants for the purposes of environmental conservation in Nebraska.
The Bessey Memorial Fund
The endowment provides aid to widows of University of Nebraska professors

21
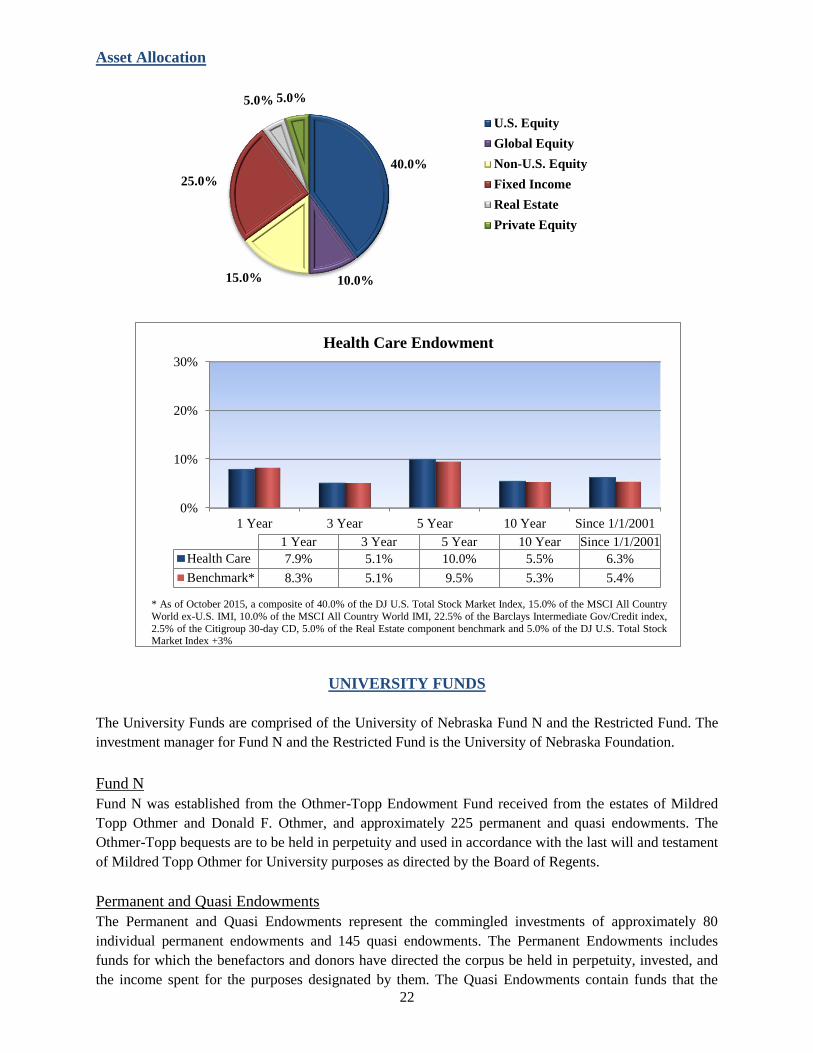
Asset Allocation
General Endowments
HEALTH CARE ENDOWMENT
The Health Care Endowment Fund is comprised of two distinct state trust funds. These two are the
Nebraska Tobacco Settlement Trust Fund and the Nebraska Medicaid Intergovernmental Trust Fund.
Although their external contributions are different, the investments are the same and the spending policy
is similar. The Nebraska Investment Council’s responsibility is managing the investments only.
25.0%
5.0%
10.0% 50.0%
5.0% 5.0%
U.S. Equity
Global Equity
Non-U.S. Equity
Fixed Income
Real Estate
Private Equity
0%
10%
20%
30%
1 Year 3 Years 5 Years 10 Years Since 1/1/96
1 Year 3 Years 5 Years 10 Years Since 1/1/96
General Endowments 8.9% 5.1% 7.9% 5.8% 7.4%
Benchmark* 7.3% 4.9% 7.5% 5.4% 6.8%
* As of April 2016, a composite of 25.0% of the DJ U.S. Total Stock Market, 10.0% of the MSCI All Country
World ex-U.S. IMI, 5.0% of the MSCI All Country World IMI, 50.0% of the fixed income component benchmark,
5.0% of the real estate component benchmark, and 5.0% of the DJ U.S. Total Stock Market Index + 3%.
22
Asset Allocation
UNIVERSITY FUNDS
The University Funds are comprised of the University of Nebraska Fund N and the Restricted Fund. The
investment manager for Fund N and the Restricted Fund is the University of Nebraska Foundation.
Fund N
Fund N was established from the Othmer-Topp Endowment Fund received from the estates of Mildred
Topp Othmer and Donald F. Othmer, and approximately 225 permanent and quasi endowments. The
Othmer-Topp bequests are to be held in perpetuity and used in accordance with the last will and testament
of Mildred Topp Othmer for University purposes as directed by the Board of Regents.
Permanent and Quasi Endowments
The Permanent and Quasi Endowments represent the commingled investments of approximately 80
individual permanent endowments and 145 quasi endowments. The Permanent Endowments includes
funds for which the benefactors and donors have directed the corpus be held in perpetuity, invested, and
the income spent for the purposes designated by them. The Quasi Endowments contain funds that the
40.0%
10.0% 15.0%
25.0%
5.0% 5.0%
U.S. Equity
Global Equity
Non-U.S. Equity
Fixed Income
Real Estate
Private Equity
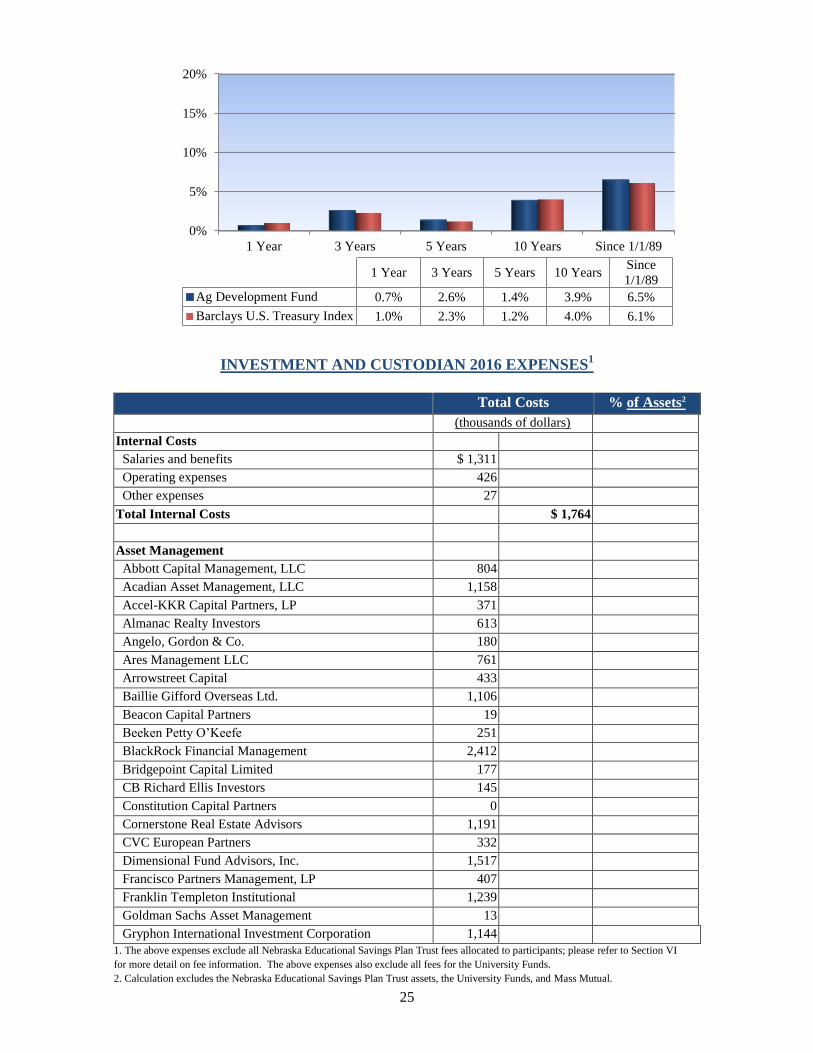
0%
10%
20%
30%
1 Year 3 Year 5 Year 10 Year Since 1/1/2001
1 Year 3 Year 5 Year 10 Year Since 1/1/2001
Health Care 7.9% 5.1% 10.0% 5.5% 6.3%
Benchmark* 8.3% 5.1% 9.5% 5.3% 5.4%
* As of October 2015, a composite of 40.0% of the DJ U.S. Total Stock Market Index, 15.0% of the MSCI All Country
World ex-U.S. IMI, 10.0% of the MSCI All Country World IMI, 22.5% of the Barclays Intermediate Gov/Credit index,
2.5% of the Citigroup 30-day CD, 5.0% of the Real Estate component benchmark and 5.0% of the DJ U.S. Total Stock Market Index +3%
Health Care Endowment

23
Board of Regents has designated to function as endowments, with the income to be spent for the purposes
designated by the Board.
Restricted Fund
The Restricted Fund is comprised of several funds that are restricted by the benefactors to be invested in
U.S. Government and U.S Agency fixed income securities only. This is a permanent endowment fund.
MISCELLANEOUS TRUSTS EXCESS LIABILITY
This Fund was created by the Nebraska Hospital-Medical Liability Act. Contributions consist of
insurance premiums from certain health care providers and a surcharge levied on all healthcare providers
in the State. The funds are used to pay judgments against the insured health care providers. The Nebraska
Investment Council does not determine the distribution policy.
55.0%
23.0%
3.6% 3.0% 3.3%
12.1%
Fund N
Policy Asset Allocation
12/31/16
U.S. Equity Non-U.S. Equity
Real Estate Inflation Hedging
Non- U.S. Bonds U.S. Bonds
100.0%
Restricted Fund
Policy Asset Allocation
12/31/16
Fixed Income
0%
10%
20%
30%
1 Year 3 Year 5 Year
1 Year 3 Year 5 Year
Fund N 6.8% 2.8% 7.9%
Benchmark* 9.5% 7.4% 11.3%
University Funds
Fund N
*The benchmark is a weighted average comprised of 73% S&P 500 and 27% Barclays Capital Aggregate Bond Index.

24
MISCELLANEOUS TRUSTS AERONAUTICS TRUST FUND
This Fund receives the proceeds from the sale of state-owned airfields. Investment income is used to pay
expenses of the Department of Aeronautics. Uses of the funds include, in order of priority, operations of
the State-owned Airfields, the Navigational Aids Division, and grants to eligible Nebraska airports.
MISCELLANEOUS TRUSTS AGRICULTURE TRUST FUND
This Fund consists of money received from the U.S. Department of Agriculture. Income from the Fund is
used to pay expenses of the Nebraska Department of Agriculture. The Nebraska Investment Council does
not determine the distribution policy.
0%
10%
20%
30%
1 Year 3 Years 5 Years 10 Years Since 7/1/97
1 Year 3 Years 5 Years 10 YearsSince
7/1/97
Excess Liability Fund 4.2% 3.3% 3.1% 5.2% 5.7%
Barclays Universal Bond Index* 3.9% 3.3% 2.8% 4.6% 5.4%
* Blended benchmark: 6/30/97 to 3/31/05 Barclays Capital Aggregate Bond Index; 4/1/05 to present Barclays Capital
Universal Bond Index.
0%
10%
20%
30%
1 Year 3 Years 5 Years 10 Years Since 1/1/90
1 Year 3 Years 5 Years 10 YearsSince
1/1/90
Aeronautics Fund 0.7% 2.6% 1.4% 4.3% 6.3%
Barclays U.S. Treasury Index 1.0% 2.3% 1.2% 4.0% 5.8%
25
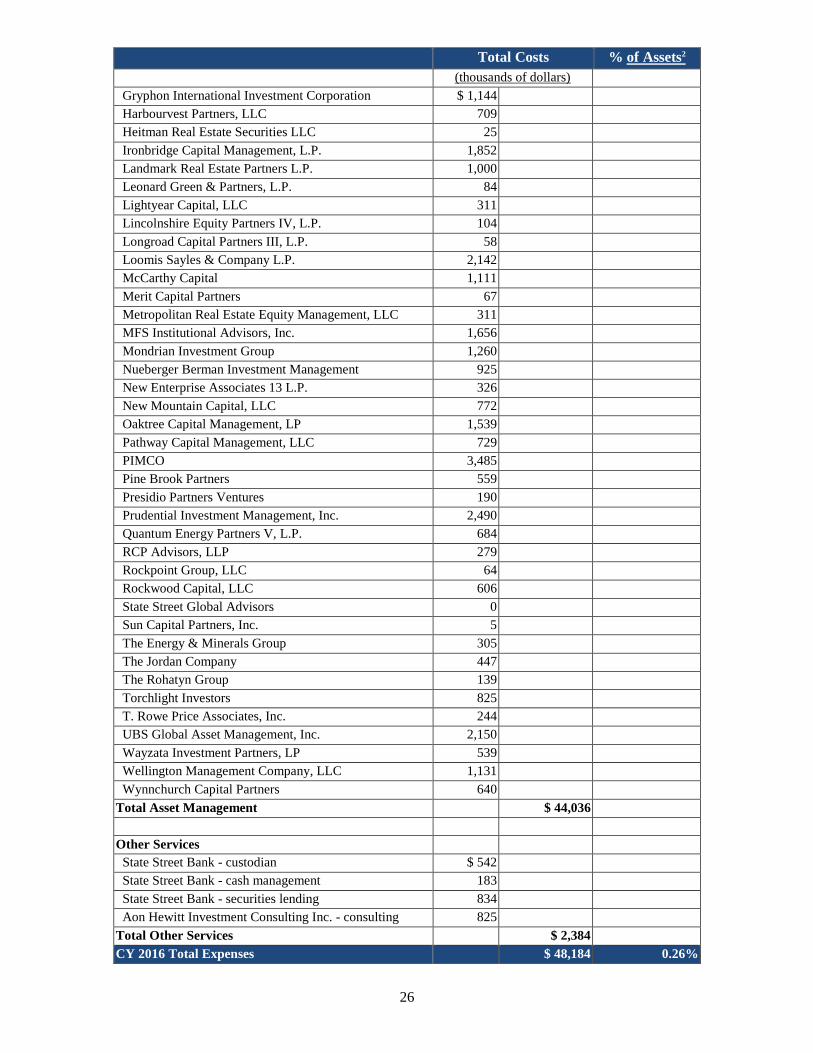
INVESTMENT AND CUSTODIAN 2016 EXPENSES1
Total Costs % of Assets2
(thousands of dollars)
Internal Costs
Salaries and benefits $ 1,311
Operating expenses 426
Other expenses 27
Total Internal Costs $ 1,764
Asset Management
Abbott Capital Management, LLC 804
Acadian Asset Management, LLC 1,158
Accel-KKR Capital Partners, LP 371
Almanac Realty Investors 613
Angelo, Gordon & Co. 180
Ares Management LLC 761
Arrowstreet Capital 433
Baillie Gifford Overseas Ltd. 1,106
Beacon Capital Partners 19
Beeken Petty O’Keefe 251
BlackRock Financial Management 2,412
Bridgepoint Capital Limited 177
CB Richard Ellis Investors 145
Constitution Capital Partners 0
Cornerstone Real Estate Advisors 1,191
CVC European Partners 332
Dimensional Fund Advisors, Inc. 1,517
Francisco Partners Management, LP 407
Franklin Templeton Institutional 1,239
Goldman Sachs Asset Management
13
Gryphon International Investment Corporation 1,144
1. The above expenses exclude all Nebraska Educational Savings Plan Trust fees allocated to participants; please refer to Section VI
for more detail on fee information. The above expenses also exclude all fees for the University Funds.
2. Calculation excludes the Nebraska Educational Savings Plan Trust assets, the University Funds, and Mass Mutual.
0%
5%
10%
15%
20%
1 Year 3 Years 5 Years 10 Years Since 1/1/89
1 Year 3 Years 5 Years 10 YearsSince
1/1/89
Ag Development Fund 0.7% 2.6% 1.4% 3.9% 6.5%
Barclays U.S. Treasury Index 1.0% 2.3% 1.2% 4.0% 6.1%
26
Total Costs % of Assets2
(thousands of dollars)
Gryphon International Investment Corporation $ 1,144
Harbourvest Partners, LLC 709
Heitman Real Estate Securities LLC
25
Ironbridge Capital Management, L.P. 1,852
Landmark Real Estate Partners L.P. 1,000
Leonard Green & Partners, L.P. 84
Lightyear Capital, LLC 311
Lincolnshire Equity Partners IV, L.P. 104
Longroad Capital Partners III, L.P. 58
Loomis Sayles & Company L.P. 2,142
McCarthy Capital 1,111
Merit Capital Partners 67
Metropolitan Real Estate Equity Management, LLC 311
MFS Institutional Advisors, Inc. 1,656
Mondrian Investment Group 1,260
Nueberger Berman Investment Management 925
New Enterprise Associates 13 L.P. 326
New Mountain Capital, LLC 772
Oaktree Capital Management, LP 1,539
Pathway Capital Management, LLC 729
PIMCO 3,485
Pine Brook Partners 559
Presidio Partners Ventures 190
Prudential Investment Management, Inc. 2,490
Quantum Energy Partners V, L.P. 684
RCP Advisors, LLP 279
Rockpoint Group, LLC 64
Rockwood Capital, LLC 606
State Street Global Advisors 0
Sun Capital Partners, Inc. 5
The Energy & Minerals Group 305
The Jordan Company 447
The Rohatyn Group 139
Torchlight Investors 825
T. Rowe Price Associates, Inc. 244
UBS Global Asset Management, Inc. 2,150
Wayzata Investment Partners, LP 539
Wellington Management Company, LLC 1,131
Wynnchurch Capital Partners 640
Total Asset Management $ 44,036
Other Services
State Street Bank - custodian $ 542
State Street Bank - cash management 183
State Street Bank - securities lending
834
Aon Hewitt Investment Consulting Inc. - consulting 825
Total Other Services $ 2,384
CY 2016 Total Expenses $ 48,184 0.26%