2016 annual report -...
TRANSCRIPT

2016ANNUALREPORT
G A P I N C . C O M
170252_L01_CVRS.indd 1 3/17/17 7:45 PM

B O A R D O FD I R E C T O R S
Domenico De Sole, 73 (*)Director since 2004. Chairman of Tom FordInternational, a luxury retailer. Former Presidentand Chief Executive Officer of Gucci Group NV.Chairman of Sotheby’s. Director of NewellRubbermaid, Inc. (Not standing for reelection atthe May 2017 Annual Meeting of Shareholders.)
Robert J. Fisher, 62 (+)Non-Executive Chairman. Director since 1990.Managing Director of Pisces, Inc., an investmentgroup. Former Interim Chief Executive Officerand executive of the company.
William S. Fisher, 59Director since 2009. Founder and Chief ExecutiveOfficer of Manzanita Capital Limited, a privateequity fund. Former executive of the company.
Tracy Gardner, 53Director since 2015. Principal of Tracy GardnerConsultancy. Former Chief Executive Officer ofdELiA*s Inc., an omni-channel retail companyprimarily marketing to teenage girls. Formerexecutive of the company.
Brian Goldner, 53 (*)Director since 2016. Chairman, President, andChief Executive Officer of Hasbro, Inc. FormerExecutive Vice President and Chief OperatingOfficer of Bandai America.
Isabella D. Goren, 56 (^)Director since 2011. Former Chief FinancialOfficer of AMR Corporation and AmericanAirlines, Inc. Director of Lyondell Basell IndustriesN.V. and MassMutual Financial Group.
Bob L. Martin, 68 (* +)Director since 2002. Operating Partner of StephensGroup, Inc., a private equity group. Chief ExecutiveOfficer (part-time) of Mcon Management Services,Ltd., a consulting company. Former President andChief Executive Officer of Wal-Mart International.Director of Conn’s, Inc.
Jorge P. Montoya, 70 (^)Director since 2004. Former executive of The Procter& Gamble Company. Director of The Kroger Co.
Art Peck, 61Director since 2015. President and ChiefExecutive Officer, Gap Inc.
Mayo A. Shattuck III, 62 (+ ^)Director since 2002. Non-Executive Chairmanof Exelon Corporation, an energy company.Former Chairman, Chief Executive Officerand President of Constellation Energy Group.Director of Capital One Financial Corporationand Alarm.com Holdings, Inc.
Katherine Tsang, 59 (*)Director since 2010. Principal of Max Giant Limited,an investment company. Former Chairperson ofGreater China, Standard Chartered Bank, StandardChartered Bank (Taiwan) Limited, StandardChartered Bank (Hong Kong) Limited. FormerChief Executive Officer of Standard CharteredBank (China) Limited.
Doris F. FisherHonorary Lifetime Director since 2009. FormerDirector and merchandiser of the company. Co-founder of the company with her husband Donald G.Fisher, who passed away in September 2009.
L E A D E R S H I PT E A M
Art PeckDirector, and President and CEO,Gap Inc.
Teri List-StollEVP and Chief Financial Officer
Sonia SyngalPresident and CEO, Old Navy
Jeff KirwanPresident and CEO, Gap
Nancy GreenPresident and CEO, Athleta
Jyothi RaoPresident and General Manager, Intermix
Paul ChapmanEVP and Chief Information Officer
Sebastian DiGrandeEVP, Strategy andChief Customer Officer
Julie GruberEVP, Global General Counsel, CorporateSecretary and Chief Compliance Officer
Abinta MalikEVP and General Manager,Greater China
Bobbi SiltenEVP, Global Talent and Sustainability
Michael YeeEVP, Global Supply Chain: Sourcingand Production
Shawn CurranEVP, Global Supply Chain: Logisticsand Product Operations
C O R P O R AT EA N D S H A R E H O L D E RI N F O R M AT I O N
Gap Inc. Investor RelationsPlease see the Investors tab onwww.gapinc.com2 Folsom StreetSan Francisco, CA [email protected]
Stock Exchange ListingTrading Symbol “GPS” / New YorkStock Exchange
Annual Shareholders’ MeetingMay 17, 2017, 10:00 a.m. Pacific TimeGap Inc. Headquarters2 Folsom StreetSan Francisco, CA 94105
Independent RegisteredPublic Accounting FirmDeloitte & Touche LLPSan Francisco, CA
Registrar and Transfer Agent(For registered shareholders)Wells Fargo Bank, N.A.Shareowner Services1110 Centre Pointe Curve, Suite 101Mendota Heights, MN 55120
Beneficial Shareholders(Shares held by your broker in the nameof the brokerage house)Direct questions to your broker.
Fiscal 2017 Earnings Release DatesPlease visit www.gapinc.com for up-to-dateinformation about earnings release dates.
Live audio of each quarterly earningsconference call can be accessed throughthe Investors page of our website atwww.gapinc.com the day of the earningsrelease. Replays are available forapproximately 90 days following the event.
P R I N T I N G C O N S I D E R AT I O N S
The Gap Inc. 2016 Annual Report wasprinted by an environmentally sustainableprinter, which utilizes 100 percent renewablewind power and sustainable manufacturingprinciples including: socially responsibleprocurement; green chemistry principles;reduced VOC inks and coatings; recyclingof residual materials; and carbon reductionstrategies supporting forest carbon offsetinitiatives. Printed on FSC®-certified Finchpaper supporting responsible forestry.
(*) Compensation and Management Development Committee (+) Governance and Sustainability Committee (^) Audit and Finance Committee
170252_L01_CVRS.indd 2 3/20/17 4:51 PM
UNITED STATESSECURITIES AND EXCHANGE COMMISSION
Washington, D.C. 20549FORM 10-K
(Mark One)
Annual report pursuant to Section 13 or 15(d) of the Securities Exchange Act of 1934 For the fiscal year ended January 28, 2017
Transition report pursuant to Section 13 or 15(d) of the Securities Exchange Act of 1934 For the transition period from to
Commission File Number 1-7562
THE GAP, INC.(Exact name of registrant as specified in its charter)
Delaware 94-1697231(State of Incorporation) (I.R.S. Employer Identification No.)
Two Folsom Street, San Francisco, California 94105(Address of principal executive offices) (Zip code)
Registrant’s telephone number, including area code: (415) 427-0100 Securities registered pursuant to Section 12(b) of the Act:
Common Stock, $0.05 par value The New York Stock Exchange(Title of class) (Name of exchange where registered)
Securities registered pursuant to Section 12(g) of the Act: None
Indicate by check mark if the registrant is a well-known seasoned issuer, as defined in Rule 405 of the Securities Act. Yes No Indicate by check mark if the registrant is not required to file reports pursuant to Section 13 or Section 15(d) of the Act. Yes No Indicate by check mark whether the registrant (1) has filed all reports required to be filed by Section 13 or 15(d) of the Securities Exchange Act of 1934 during the preceding 12 months (or for such shorter period that the registrant was required to file such reports), and (2) has been subject to such filing requirements for the past 90 days. Yes No Indicate by check mark whether the registrant has submitted electronically and posted on its corporate Web site, if any, every Interactive Data File required to be submitted and posted pursuant to Rule 405 of Regulation S-T during the preceding 12 months (or for such shorter period that the registrant was required to submit and post such files). Yes No Indicate by check mark if disclosure of delinquent filers pursuant to Item 405 of Regulation S-K is not contained herein, and will not be contained, to the best of registrant’s knowledge, in definitive proxy or information statements incorporated by reference in Part III of this Form 10-K or any amendment to this Form 10-K. Indicate by check mark whether the registrant is a large accelerated filer, an accelerated filer, a non-accelerated filer, or a smaller reporting company. See the definitions of “large accelerated filer,” “accelerated filer” and “smaller reporting company” in Rule 12b-2 of the Exchange Act:
Large accelerated filer Accelerated filer Non-accelerated filer Smaller reporting company
Indicate by check mark whether the registrant is a shell company (as defined in Rule 12b-2 of the Act). Yes No The aggregate market value of the voting and non-voting common equity held by non-affiliates of the registrant as of July 29, 2016 was approximately $6 billion based upon the last price reported for such date in the NYSE-Composite transactions.
The number of shares of the registrant’s common stock outstanding as of March 14, 2017 was 399,843,485.Documents Incorporated by Reference
Portions of the registrant’s Proxy Statement for the Annual Meeting of Shareholders to be held on May 17, 2017 (hereinafter referred to as the “2017 Proxy Statement”) are incorporated into Part III.
Special Note on Forward-Looking StatementsThis Annual Report on Form 10-K contains forward-looking statements within the “safe harbor” provisions of the Private Securities Litigation Reform Act of 1995. All statements other than those that are purely historical are forward-looking statements. Words such as “expect,” “anticipate,” “believe,” “estimate,” “intend,” “plan,” “project,” and similar expressions also identify forward-looking statements. Forward-looking statements include, but are not limited to, statements regarding the following:
• target cash balance and ability to provide for our working capital needs and for unexpected business downturns;
• the impact of foreign exchange rate fluctuations in fiscal 2017;
• the impact of store closures and streamlining measures, including annualized savings;
• the recovery of remaining costs related to the Fishkill distribution center fire;
• attracting, retaining, and training great talent in our businesses and functions;
• continuing our investment in customer experience both in stores and online;
• net store openings in fiscal 2017;
• the impact of continuing depreciation of certain foreign currencies on gross margin in fiscal 2017;
• current cash balances and cash flows being sufficient to support our business operations, including growth
initiatives, planned capital expenditures, dividend payments, and repayment of debt;
• ability to supplement near-term liquidity, if necessary, with our $500 million revolving credit facility or other
available market instruments;
• the impact of the seasonality of our operations;
• cash spending for purchases of property and equipment in fiscal 2017, including costs related to rebuilding the
Fishkill, New York distribution center campus;
• dividend payments in fiscal 2017;
• share repurchases in fiscal 2017;
• the estimates and assumptions we use in our accounting policies;
• the impact of accounting pronouncements;
• unrealized gains and losses from designated cash flow hedges;
• total gross unrecognized tax benefits;
• the impact of losses due to indemnification obligations;
• the outcome of proceedings, lawsuits, disputes, and claims; and
• the impact of changes in internal control over financial reporting.
Because these forward-looking statements involve risks and uncertainties, there are important factors that could cause our actual results to differ materially from those in the forward-looking statements. These factors include, without limitation, the following:
• the risk that we or our franchisees will be unsuccessful in gauging apparel trends and changing consumer
preferences;
• the highly competitive nature of our business in the United States and internationally;
• the risk that failure to maintain, enhance and protect our brand image could have an adverse effect on our
results of operations;
• the risk that the failure to attract and retain key personnel, or effectively manage succession, could have an
adverse impact on our results of operations;
• the risk that trade matters could increase the cost or reduce the supply of apparel available to us and adversely
affect our business, financial condition, and results of operations;
• the risk that changes in the regulatory or administrative landscape could adversely affect our financial condition,
strategies, and results of operations;
• the risk that our investments in omni-channel shopping initiatives may not deliver the results we anticipate;
• the risk that if we are unable to manage our inventory effectively, our gross margins will be adversely affected;
• the risk that we are subject to data or other security breaches that may result in increased costs, violations of
law, significant legal and financial exposure, and a loss of confidence in our security measures, which could
have an adverse effect on our results of operations and our reputation;
• the risk that foreign currency exchange rate fluctuations could adversely impact our financial results;
• the risks to our business, including our costs and supply chain, associated with global sourcing and
manufacturing;
• the risk that changes in global economic conditions or consumer spending patterns could adversely impact our
results of operations;
• the risks to our efforts to expand internationally, including our ability to operate under a global brand structure
and operating in regions where we have less experience;
• the risks to our reputation or operations associated with importing merchandise from foreign countries, including
failure of our vendors to adhere to our Code of Vendor Conduct;
• the risk that our franchisees’ operation of franchise stores is not directly within our control and could impair the
value of our brands;
• the risk that we or our franchisees will be unsuccessful in identifying, negotiating, and securing new store
locations and renewing, modifying, or terminating leases for existing store locations effectively;
• the risk that comparable sales and margins will experience fluctuations;
• the risk that changes in our credit profile or deterioration in market conditions may limit our access to the capital
markets and adversely impact our financial position or our business initiatives;
• the risk that updates or changes to our information technology (“IT”) systems may disrupt our operations;
• the risk that natural disasters, public health crises, political crises, or other catastrophic events could adversely
affect our operations and financial results, or those of our franchisees or vendors;
• the risk that reductions in income and cash flow from our marketing and servicing arrangement related to our
private label and co-branded credit cards could adversely affect our operating results and cash flows;
• the risk that the adoption of new accounting pronouncements will impact future results;
• the risk that we do not repurchase some or all of the shares we anticipate purchasing pursuant to our
repurchase program; and
• the risk that we will not be successful in defending various proceedings, lawsuits, disputes, claims, and audits.

Additional information regarding factors that could cause results to differ can be found in this Annual Report on Form 10-K and our other filings with the U.S. Securities and Exchange Commission (“SEC”).
Future economic and industry trends that could potentially impact net sales and profitability are difficult to predict. These forward-looking statements are based on information as of March 20, 2017, and we assume no obligation to publicly update or revise our forward-looking statements even if experience or future changes make it clear that any projected results expressed or implied therein will not be realized.
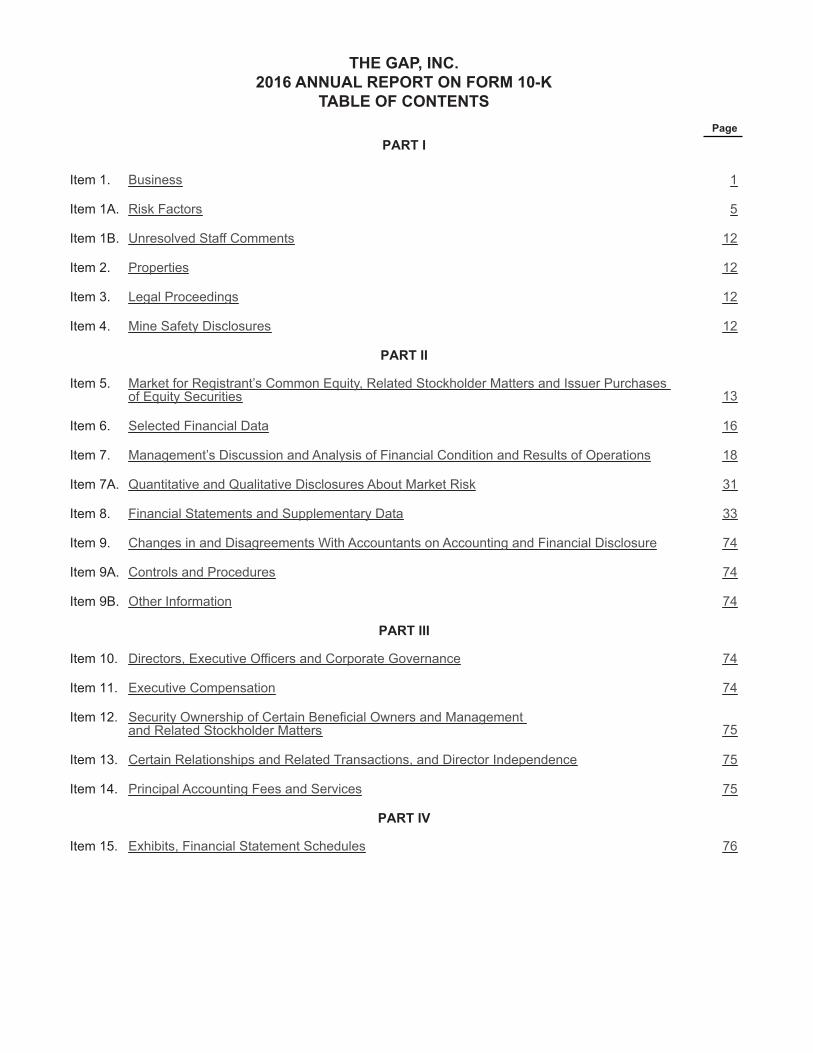
THE GAP, INC.2016 ANNUAL REPORT ON FORM 10-K
TABLE OF CONTENTS Page
PART I
Item 1. Business
Item 1A. Risk Factors
Item 1B. Unresolved Staff Comments
Item 2. Properties
Item 3. Legal Proceedings
Item 4. Mine Safety Disclosures
PART II
Item 5. Market for Registrant’s Common Equity, Related Stockholder Matters and Issuer Purchases of Equity Securities
Item 6. Selected Financial Data
Item 7. Management’s Discussion and Analysis of Financial Condition and Results of Operations
Item 7A. Quantitative and Qualitative Disclosures About Market Risk
Item 8. Financial Statements and Supplementary Data
Item 9. Changes in and Disagreements With Accountants on Accounting and Financial Disclosure
Item 9A. Controls and Procedures
Item 9B. Other Information
PART III
Item 10. Directors, Executive Officers and Corporate Governance
Item 11. Executive Compensation
Item 12. Security Ownership of Certain Beneficial Owners and Management and Related Stockholder Matters
Item 13. Certain Relationships and Related Transactions, and Director Independence
Item 14. Principal Accounting Fees and Services
PART IV
Item 15. Exhibits, Financial Statement Schedules
1
5
12
12
12
12
13
16
18
31
33
74
74
74
74
74
75
75
75
76

[THIS PAGE INTENTIONALLY LEFT BLANK]

1
Part IItem 1. Business.GeneralThe Gap, Inc. (Gap Inc., the “Company,” “we,” and “our”) was incorporated in the State of California in July 1969 and was reincorporated under the laws of the State of Delaware in May 1988.
Gap Inc. is a leading global apparel retail company. We offer apparel, accessories, and personal care products for men, women, and children under the Gap, Banana Republic, Old Navy, Athleta, and Intermix brands. Our portfolio of distinct brands across multiple channels and geographies, combined with our size and scale which allows for strategic and advantageous partnerships with our third-party vendors and suppliers throughout the organization, gives us a competitive advantage in the global retail marketplace. In December 2016, the Company acquired Weddington Way, which does not have a material impact on our Consolidated Financial Statements.
Gap Inc. is an omni-channel retailer, with sales to customers both in stores and online, through Company-operated and franchise stores, websites, and third-party arrangements. Gap Inc. has Company-operated stores in the United States, Canada, the United Kingdom, France, Ireland, Japan, Italy, China, Hong Kong, Taiwan, and Mexico. We also have franchise agreements with unaffiliated franchisees to operate Gap, Banana Republic, and Old Navy stores throughout Asia, Australia, Europe, Latin America, the Middle East, and Africa. Under these agreements, third parties operate, or will operate, stores that sell apparel and related products under our brand names. Most of the products sold under our brand names are designed by us and manufactured by independent sources. We also sell products that are designed and manufactured by branded third parties, especially at our Intermix brand.
Gap Inc. is a leader among apparel retailers in using omni-channel capabilities to bridge the digital world and physical stores, creating world-class shopping experiences regardless of where or how our customers shop. The Company's suite of omni-channel services, including order-in-store, reserve-in-store, find-in-store, and ship-from-store, as well as enhanced mobile experiences, are uniquely tailored across its portfolio of brands.
Gap. Gap is one of the world's most iconic apparel and accessories brands anchored in optimistic, casual, American style. Founded in San Francisco in 1969, the brand's collections continue to build the foundation of modern wardrobes - all things denim, tees, button-downs, and khakis, along with must-have trends.
Gap is designed to build the foundation of modern wardrobes through every stage of life with apparel and accessories for adult men and women under the Gap name, in addition to GapKids, babyGap, GapMaternity, GapBody, and GapFit collections. Beginning in 1987 with the opening of the first store outside North America in London, Gap continues to connect with customers around the world through specialty stores, online, and franchise stores. In addition, we bring the brand to value-conscious customers, with exclusively designed collections for Gap Outlet and Gap Factory stores and websites.
Banana Republic. Acquired with two stores in 1983 as a travel and adventure outfitter, Banana Republic is now a global apparel and accessories brand focused on delivering versatile, contemporary classics, designed for today with style that endures. Banana Republic offers clothing and accessories with detailed craftsmanship and luxurious materials. Customers can purchase Banana Republic products globally in our specialty and Banana Republic Factory stores, online, and in franchise stores.
Old Navy. Old Navy is a global apparel and accessories brand that believes in the democracy of style, making high quality, must-have fashion essentials for the whole family, while delivering incredible value, and fun, unique store experiences. Old Navy opened its first store in 1994 in the United States and since has expanded its international presence with Company-operated stores in Canada, China, and Mexico, as well as franchise stores in seven countries. Customers can purchase Old Navy products globally in Company-operated and franchise stores and online.
2
Athleta. Athleta is a premium fitness and lifestyle brand creating versatile performance apparel to inspire a community of active, confident women and girls. Established in 1998 and acquired by Gap Inc. in 2008, Athleta integrates technical features and innovative design across its women's collection to carry her through a life in motion, from yoga, training and sports, to everyday activities and travel. In 2016, the company launched Athleta Girl, mirroring its signature performance in styles for the next generation. Customers can purchase Athleta products in the United States through its stores and catalogs, or globally through its website.
Intermix. Acquired in December 2012, Intermix curates must-have styles from the most coveted emerging and established designers. Known for styling on-trend pieces in unexpected ways, Intermix delivers a unique point of view and an individualized approach to shopping and personal style. Customers can shop in stores in the United States and Canada, and online.
Weddington Way. Acquired in December 2016, Weddington Way is a social shopping platform for wedding parties, featuring an online boutique with exclusive bridesmaid dresses and a curated selection of wedding party gifts. Customers can shop Weddington Way online, and the brand ships globally.
Piperlime. Launched in 2006, Piperlime offered a mix of private label and branded apparel and accessories. The Company closed the Piperlime brand during the first half of fiscal 2015.
Sales to customers are tendered for cash, debit cards, credit cards, or personal checks. We also issue and redeem gift cards through our brands. Gap, Banana Republic, Old Navy, and Athleta each have a private label credit card program and a co-branded credit card program through which frequent customers receive benefits. Private label and co-branded credit cards are provided by a third-party financing company, with associated revenue sharing arrangements reflected in Gap Inc. operations.
The range of merchandise displayed in each store varies depending on the selling season and the size and location of the store. Stores are generally open seven days per week (where permitted by law) and most holidays.
We ended fiscal 2016 with 3,200 Company-operated stores and 459 franchise store locations. For more information on the number of stores by brand and region, see the table in “Management’s Discussion and Analysis of Financial Condition and Results of Operations” included in Item 7 of this Form 10-K.
Certain financial information about international operations is set forth under the heading "Segment Information" in Note 17 of Notes to Consolidated Financial Statements included in Item 8 of this Form 10-K.
Merchandise VendorsWe purchase private label and non-private label merchandise from about 800 vendors. Our vendors have factories in about 40 countries. Our two largest vendors each accounted for about 5 percent of the dollar amount of our total fiscal 2016 purchases. Of our merchandise purchased during fiscal 2016, substantially all purchases, by dollar value, were from factories outside the United States. Approximately 25 percent and 23 percent of our fiscal 2016 purchases, by dollar value, were from factories in Vietnam and China, respectively. Product cost increases or events causing disruption of imports from Vietnam, China, or other foreign countries, including the imposition of additional import restrictions or taxes, or vendors potentially failing due to political, financial, or regulatory issues, could have an adverse effect on our operations. Substantially all of our foreign purchases of merchandise are negotiated and paid for in U.S. dollars. Also see the sections entitled “Risk Factors—Our business is subject to risks associated with global sourcing and manufacturing," "Risk Factors—Risks associated with importing merchandise from foreign countries, including failure of our vendors to adhere to our Code of Vendor Conduct, could harm our business,” and “Risk Factors—Trade matters may disrupt our supply chain” in Item 1A of this Form 10-K.
Seasonal BusinessOur business follows a seasonal pattern, with sales peaking during the end-of-year holiday period.
3
Brand BuildingOur ability to develop and evolve our existing brands is a key to our success. We believe our distinct brands are among our most important assets. With the exception of Intermix, virtually all aspects of brand development, from product design and distribution to marketing, merchandising and shopping environments, are controlled by Gap Inc. employees. With respect to Intermix, we control all aspects of brand development except for product design related to third-party products. We continue to invest in our business and enhance the customer experience through significant investments in our supply chain and omni-channel capabilities, investments in marketing, enhancement of our online shopping sites, remodeling of existing stores, and international expansion.
Trademarks and Service MarksGap, GapKids, babyGap, GapMaternity, GapBody, GapFit, Banana Republic, Old Navy, Athleta, and Intermix trademarks and service marks, and certain other trademarks, have been registered, or are the subject of pending trademark applications, with the United States Patent and Trademark Office and with the registries of many foreign countries and/or are protected by common law.
FranchisingWe have franchise agreements with unaffiliated franchisees to operate Gap, Banana Republic, and Old Navy stores in a number of countries throughout Asia, Australia, Europe, Latin America, the Middle East, and Africa. Under these agreements, third parties operate, or will operate, stores that sell apparel and related products under our brand names. For additional information on risks related to our franchise business, see the sections entitled “Risk Factors—Our efforts to expand internationally may not be successful” and “Risk Factors—Our franchise business is subject to certain risks not directly within our control that could impair the value of our brands” in Item 1A of this Form 10-K.
InventoryThe nature of the retail business requires us to carry a significant amount of inventory, especially prior to the peak holiday selling season when we, along with other retailers, generally build up inventory levels. We maintain a large part of our inventory in distribution centers. We review our inventory levels in order to identify slow-moving merchandise and broken assortments (items no longer in stock in a sufficient range of sizes or colors) and we primarily use promotions and markdowns to clear merchandise. Also see the sections entitled “Risk Factors—We must successfully gauge apparel trends and changing consumer preferences to succeed”, "Risk Factors—If we are unable to manage our inventory effectively, our gross margins could be adversely affected", and "Risk Factors—Our results could be adversely affected by natural disasters, public health crises, political crises, or other catastrophic events" in Item 1A of this Form 10-K.
CompetitorsThe global apparel retail industry is highly competitive. We compete with local, national, and global apparel retailers. Also see the section entitled “Risk Factors—Our business is highly competitive” in Item 1A of this Form 10-K.
EmployeesAs of January 28, 2017, we had a workforce of approximately 135,000 employees, which includes a combination of part-time and full-time employees. We also hire seasonal employees, primarily during the peak holiday selling season.
To remain competitive in the retail apparel industry, we must attract, develop, and retain skilled employees in our design, merchandising, supply chain, marketing, and other functions. Competition for such personnel is intense. Our success is dependent to a significant degree on the continued contributions of key employees. Also see the section entitled “Risk Factors—The failure to attract and retain key personnel, or effectively manage succession, could have an adverse impact on our results of operations” in Item 1A of this Form 10-K.
Available InformationWe make available on our website, www.gapinc.com, under “Investors, Financial Information, SEC Filings,” free of charge, our annual reports on Form 10-K, quarterly reports on Form 10-Q, current reports on Form 8-K, and amendments to those reports as soon as reasonably practicable after we electronically file or furnish them to the SEC.
4
Our Board of Directors Committee Charters (Audit and Finance, Compensation and Management Development, and Governance and Sustainability Committees) and Corporate Governance Guidelines are also available on our website under “Investors, Governance.” Our Code of Business Conduct can be found on our website under “Investors, Corporate Compliance, Code of Business Conduct.” Any amendments and waivers to the Code will also be available on the website.
Executive Officers of the RegistrantThe following are our executive officers:Name, Age, Position, and Principal Occupation:
Arthur Peck, 61, Director, and President and Chief Executive Officer, Gap Inc. since February 2015; President, Growth, Innovation, and Digital division from November 2012 to January 2015; President, Gap North America from February 2011 to November 2012; Executive Vice President of Strategy and Operations from May 2005 to February 2011; President, Gap Inc. Outlet from October 2008 to February 2011; Acting President, Gap Inc. Outlet from February 2008 to October 2008.
Mark Breitbard, 49, President and Chief Executive Officer, Banana Republic beginning in May 2017; Chief Executive Officer, The Gymboree Corporation from January 2013 to February 2017; President, Gap North America from November 2012 to January 2013; Executive Vice President, Gap North America Merchandising from February 2011 to November 2012; Executive Vice President, GapKids and babyGap from February 2010 to February 2011.
Paul Chapman, 59, Executive Vice President, Chief Information Officer since December 2015; Senior Vice President and Chief Information Officer from January 2014 to December 2015; Senior Vice President, Information Technology, from 2010 to 2015; Vice President, Information Technology from 2004 to 2010.
Sebastian DiGrande, 50, Executive Vice President, Strategy and Chief Customer Officer since May 2016; Senior Partner and Managing Director, the Boston Consulting Group from September 1996 to May 2016.
Julie Gruber, 51, Executive Vice President, Global General Counsel, Corporate Secretary, and Chief Compliance Officer since February 2016; Senior Vice President and General Counsel from March 2015 to February 2016; Vice President and Deputy General Counsel from 2007 to 2015; Associate General Counsel from 2003 to 2007.
Jeff Kirwan, 50, President and Chief Executive Officer, Gap since December 2014; Executive Vice President and President, Gap China from February 2013 to December 2014; Senior Vice President, Managing Director and Chief Operating Officer, Gap China from May 2011 to February 2013; Senior Vice President, Stores and Operations, Old Navy from August 2008 to May 2011; Senior Vice President and General Manager, Old Navy Canada from March 2008 to August 2008; Vice President and General Manager, Old Navy Canada from April 2007 to March 2008.
Teri List-Stoll, 54, Executive Vice President and Chief Financial Officer since January 2017; Executive Vice President and Chief Financial Officer, Dick’s Sporting Goods, Inc. from August 2015 to September 2016; Executive Vice President and Chief Financial Officer, Kraft Foods Group, Inc. from September 2013 to May 2015; Senior Vice President and Treasurer, Procter & Gamble Co. from January 2009 to August 2013.
Bobbi Silten, 56, Executive Vice President, Global Talent and Sustainability since May 2015; Senior Vice President, Global Responsibility & President, Gap Foundation, 2010 to 2015; Chief Foundation Officer, Gap Foundation, 2005 to 2010.
Sonia Syngal, 47, President and Chief Executive Officer, Old Navy since April 2016; Executive Vice President, Global Supply Chain and Product Operations from February 2015 to April 2016; Executive Vice President, Global Supply Chain from November 2013 to January 2015; Senior Vice President, Old Navy International from February 2013 to November 2013; Senior Vice President and Managing Director, Europe from May 2011 to February 2013; Senior Vice President and General Manager, International Outlets from January 2010 to May 2011; Vice President of Global Production, Supply Chain - Outlet from July 2006 to January 2010; Vice President, Corporate Sourcing from July 2004 to July 2006.
5
Item 1A. Risk Factors. Our past performance may not be a reliable indicator of future performance because actual future results and trends may differ materially depending on a variety of factors, including but not limited to the risks and uncertainties discussed below. In addition, historical trends should not be used to anticipate results or trends in future periods.
We must successfully gauge apparel trends and changing consumer preferences to succeed.Our success is largely dependent upon our ability to gauge the tastes of our customers and to provide merchandise that satisfies customer demand in a timely manner. However, lead times for many of our design and purchasing decisions may make it more difficult for us to respond rapidly to new or changing apparel trends or consumer acceptance of our products. The global apparel retail business fluctuates according to changes in consumer preferences, dictated in part by apparel trends and season. To the extent we misjudge the market for our merchandise or the products suitable for local markets or fail to execute trends and deliver product to market as timely as our competitors, our sales will be adversely affected, and the markdowns required to move the resulting excess inventory will adversely affect our operating results.
Our business is highly competitive.The global apparel retail industry is highly competitive. We and our franchisees compete with local, national, and global department stores, specialty and discount store chains, independent retail stores, and online businesses that market similar lines of merchandise. We face a variety of competitive challenges including:• anticipating and quickly responding to changing apparel trends and customer demands;• attracting customer traffic both in stores and online;• competitively pricing our products and achieving customer perception of value;• maintaining favorable brand recognition and effectively marketing our products to customers in several diverse
market segments and geographic locations;• anticipating and responding to changing customer shopping preferences and practices, including the increasing
shift to digital brand engagement, social media communication, and online shopping;• developing innovative, high-quality products in sizes, colors, and styles that appeal to customers of varying age
groups and tastes; • purchasing and stocking merchandise to match seasonal weather patterns, and our ability to react to shifts in
weather that impact consumer demand; and• sourcing and allocating merchandise efficiently.
If we or our franchisees are not able to compete successfully in the United States or internationally, our results of operations would be adversely affected.
We must maintain our reputation and brand image.Our brands have wide recognition, and our success has been due in large part to our ability to maintain, enhance and protect our brand image and reputation and our customers’ connection to our brands. Our continued success depends in part on our ability to adapt to a rapidly changing media environment, including our increasing reliance on social media and online dissemination of advertising campaigns. Even if we react appropriately to negative posts or comments about us and/or our brands on social media and online, our customers’ perception of our brand image and our reputation could be negatively impacted. Failure to maintain, enhance and protect our brand image could have a material adverse effect on our results of operations.
6
The failure to attract and retain key personnel, or effectively manage succession, could have an adverse impact on our results of operations.Our ability to anticipate and effectively respond to changing apparel trends depends in part on our ability to attract and retain key personnel in our design, merchandising, sourcing, marketing, and other functions. In addition, several of our strategic initiatives, including our technology initiatives and supply chain initiatives, require that we hire and/or develop employees with appropriate experience. Competition for talent is intense, and we cannot be sure that we will be able to attract and retain a sufficient number of qualified personnel in future periods. If we are unable to retain, attract, and motivate talented employees with the appropriate skill sets, or if changes to our organizational structure, operating results, or business model adversely affect morale or retention, we may not achieve our objectives and our results of operations could be adversely impacted. In addition, the loss of one or more of our key personnel or the inability to effectively identify a suitable successor to a key role could have a material adverse effect on our business. In fiscal 2016, there were changes to our senior leadership team, including our new Chief Customer Officer and our new Chief Financial Officer. In addition, in March 2017, we announced the appointment of the new President and Chief Executive Officer of Banana Republic who will be joining the Company in May 2017. The effectiveness of the new leaders in these roles, and any further transition as a result of these changes, could have a significant impact on our results of operations.
Trade matters may disrupt our supply chain.Trade restrictions, including increased tariffs or quotas, embargoes, safeguards, and customs restrictions against apparel items, as well as U.S. or foreign labor strikes, work stoppages, or boycotts, could increase the cost or reduce the supply of apparel available to us and adversely affect our business, financial condition, and results of operations. We cannot predict whether any of the countries in which our merchandise currently is manufactured or may be manufactured in the future will be subject to additional trade restrictions imposed by the United States or other foreign governments, including the likelihood, type, or effect of any such restrictions. For example, the current political landscape has introduced greater uncertainty with respect to future tax and trade regulations. In addition, we face the possibility of anti-dumping or countervailing duties lawsuits from U.S. domestic producers. We are unable to determine the impact of the changes to the quota system or the impact that potential tariff lawsuits could have on our global sourcing operations. Our sourcing operations may be adversely affected by trade limits or political and financial instability, resulting in the disruption of trade from exporting countries, significant fluctuation in the value of the U.S. dollar against foreign currencies, restrictions on the transfer of funds, and/or other trade disruptions. Changes in tax policy or trade regulations, such as the disallowance of tax deductions on imported merchandise or the imposition of new tariffs on imported products, could have a material adverse effect on our business and results of operations.
Changes in the regulatory or administrative landscape could adversely affect our financial condition and results of operations.Laws and regulations at the local, state, federal, and international levels frequently change, and the ultimate cost of compliance cannot be precisely estimated. In addition, we cannot predict the impact that may result from changes in the regulatory or administrative landscape. For example, U.S. lawmakers are evaluating proposals for comprehensive reform of the U.S. federal corporate tax system, which could include a border-adjustment tax or other increased taxes on imports, a limit on the ability to defer U.S. taxation on earnings outside the United States until those earnings are repatriated to the United States, and a lower U.S. federal tax rate. These proposed changes to the federal tax law, if enacted as currently proposed, could have a material adverse effect to our financial position, results of operations, or cash flows.Any changes in laws or regulations, the imposition of additional laws or regulations, or the enactment of any new or more stringent legislation that impacts employment and labor, trade, product safety, transportation and logistics, health care, tax, privacy, operations, or environmental issues, among others, could have an adverse impact on our financial condition and results of operations.

7
Our investments in omni-channel shopping initiatives may not deliver the results we anticipate.One of our strategic priorities is to further develop an omni-channel shopping experience for our customers through the integration of our store and digital shopping channels. An example of our recent omni-channel initiatives includes cross-channel logistics optimization. We continue to explore additional ways to develop an omni-channel shopping experience, including further digital integration and customer personalization. These initiatives involve significant investments in IT systems and significant operational changes. In addition, our competitors are also investing in omni-channel initiatives, some of which may be more successful than our initiatives. If the implementation of our omni-channel initiatives is not successful, or we do not realize the return on our omni-channel investments that we anticipate, our operating results would be adversely affected.
If we are unable to manage our inventory effectively, our gross margins could be adversely affected.Fluctuations in the global apparel retail markets impact the levels of inventory owned by apparel retailers. The nature of the global apparel retail business requires us to carry a significant amount of inventory, especially prior to the peak holiday selling season when we build up our inventory levels. Merchandise usually must be ordered well in advance of the season and frequently before apparel trends are confirmed by customer purchases. We must enter into contracts for the purchase and manufacture of merchandise well in advance of the applicable selling season. As a result, we are vulnerable to demand and pricing shifts and to suboptimal selection and timing of merchandise purchases. In the past, we have not always predicted our customers’ preferences and acceptance levels of our trend items with accuracy. If sales do not meet expectations, too much inventory may cause excessive markdowns and, therefore, lower-than-planned margins.
We have key strategic initiatives designed to optimize our inventory levels and increase the efficiency and responsiveness of our supply chain, including vendor fabric platforming, product demand testing, and in-season rapid response to demand. These initiatives involve significant systems and operational changes, and we have limited experience operating in this manner. If we are unable to implement these initiatives successfully, we may not realize the return on our investments that we anticipate, and our operating results could be adversely affected.
We are subject to data security risks, which could have an adverse effect on our results of operations and consumer confidence in our security measures.As part of our normal operations, we receive and maintain confidential, proprietary, and personally identifiable information, including credit card information, and information about our customers, our employees, job applicants, and other third parties. Our business employs systems and websites that allow for the secure storage and transmission of this information. However, despite our safeguards and security processes and protections, security breaches could expose us to a risk of loss or misuse of this information, litigation, and potential liability. The retail industry, in particular, has been the target of many recent cyber-attacks. We may not have the resources to anticipate or prevent rapidly evolving types of cyber-attacks. Attacks may be targeted at us, our vendors or customers, or others who have entrusted us with information. In addition, even if we take appropriate measures to safeguard our information security and privacy environment from security breaches, we could still expose our customers and our business to risk. Actual or anticipated attacks may disrupt or impair our technology capabilities, and may cause us to incur increasing costs, including costs to deploy additional personnel and protection technologies, train employees, and engage third-party experts and consultants. Advances in computer capabilities, new technological discoveries, or other developments may result in the technology used by us to protect transaction or other data being breached or compromised. Measures we implement to protect against cyber attacks may also have the potential to impact our customers’ shopping experience or decrease activity on our websites by making them more difficult to use. Data and security breaches can also occur as a result of non-technical issues, including intentional or inadvertent breach by our employees or by persons with whom we have commercial relationships that result in the unauthorized release of personal or confidential information. In addition, the regulatory environment surrounding information security, cybersecurity, and privacy is increasingly demanding, with new and changing requirements, and customers have a high expectation that the Company will adequately protect their personal information from cyber-attack or other security breaches. Security breaches and cyber incidents could result in a violation of applicable privacy and other laws, significant legal and financial
8
exposure, and a loss of consumer confidence in our security measures, which could have an adverse effect on our results of operations and our reputation.
Our business is exposed to the risks of foreign currency exchange rate fluctuations and our hedging strategies may not be effective in mitigating those risks.
We are exposed to foreign currency exchange rate risk with respect to our sales, operating expenses, profits, assets, and liabilities generated or incurred in foreign currencies as well as inventory purchases in U.S. dollars for our foreign subsidiaries. Although we use financial instruments to hedge certain foreign currency risks, these measures may not succeed in fully offsetting the negative impact of foreign currency rate movements and generally only delay the impact of adverse foreign currency rate movements on our business and financial results. We expect a negative impact to continue in fiscal year 2017.
Our business is subject to risks associated with global sourcing and manufacturing.Independent third parties manufacture all of our products for us. As a result, we are directly impacted by increases in the cost of those products.
If we experience significant increases in demand or need to replace an existing vendor, there can be no assurance that additional manufacturing capacity will be available when required on terms that are acceptable to us or that any vendor would allocate sufficient capacity to us in order to meet our requirements. In addition, for any new manufacturing source, we may encounter delays in production and added costs as a result of the time it takes to train our vendors in our methods, products, quality control standards, and environmental, labor, health, and safety standards. Moreover, in the event of a significant disruption in the supply of the fabrics or raw materials used by our vendors in the manufacture of our products, our vendors might not be able to locate alternative suppliers of materials of comparable quality at an acceptable price. Any delays, interruption, or increased costs in the manufacture of our products could result in lower sales and net income. In addition, certain countries represent a larger portion of our global sourcing. For example, approximately 25 percent and 23 percent of our merchandise, by dollar value, is purchased from factories in Vietnam and China, respectively. Accordingly, any delays in production and added costs in Vietnam or China could have a more significant impact on our results of operations.
Because independent vendors manufacture virtually all of our products outside of our principal sales markets, third parties must transport our products over large geographic distances. Delays in the shipment or delivery of our products due to the availability of transportation, work stoppages, port strikes, infrastructure congestion, or other factors, and costs and delays associated with transitioning between vendors, could adversely impact our financial performance. Manufacturing delays, transportation delays, or unexpected demand for our products may require us to use faster, but more expensive, transportation methods such as aircraft, which could adversely affect our gross margins. In addition, the cost of fuel is a significant component of transportation costs, so increases in the price of petroleum products can adversely affect our gross margins.
Global economic conditions and any related impact on consumer spending patterns could adversely impact our results of operations.The Company’s performance is subject to global economic conditions, as well as their impact on levels of consumer spending worldwide. Some of the factors that may influence consumer spending include high levels of unemployment, higher consumer debt levels, reductions in net worth based on market declines and uncertainty, home foreclosures and reductions in home values, fluctuating interest and foreign currency rates and credit availability, government austerity measures, fluctuating fuel and other energy costs, fluctuating commodity prices, and general uncertainty regarding the overall future economic environment. Consumer purchases of discretionary items, including our merchandise, generally decline during periods when disposable income is adversely affected or there is economic uncertainty.
9
Adverse economic changes in any of the regions in which we and our franchisees sell our products could reduce consumer confidence, and thereby could negatively affect earnings and have a material adverse effect on our results of operations. In challenging and uncertain economic environments, we cannot predict whether or when such circumstances may improve or worsen, or what impact, if any, such circumstances could have on our business, results of operations, cash flows, and financial position.
Our efforts to expand internationally may not be successful.Our current strategies include pursuing selective international expansion in a number of countries around the world through a number of channels. We currently plan to open additional Old Navy stores outside of the United States, including in Mexico and China, open additional Gap stores in China, including outlet stores, and continue to grow online sales internationally. Our franchisees plan to open additional stores internationally. We have limited experience operating or franchising in some of these locations. In many of these locations, we face major, established competitors. In addition, in many of these locations, the real estate, employment and labor, transportation and logistics, regulatory, and other operating requirements differ dramatically from those in the places where we have more experience. Consumer tastes and trends may differ in many of these locations and, as a result, the sales of our products may not be successful or result in the margins we anticipate. If our international expansion plans are unsuccessful or do not deliver an appropriate return on our investments, our operations and financial results could be materially, adversely affected.
Risks associated with importing merchandise from foreign countries, including failure of our vendors to adhere to our Code of Vendor Conduct, could harm our business.We purchase nearly all merchandise from third-party vendors in many different countries, and we require those vendors to adhere to a Code of Vendor Conduct, which includes environmental, labor, health, and safety standards. From time to time, contractors or their subcontractors may not be in compliance with these standards or applicable local laws. Although we have implemented policies and procedures to facilitate our compliance with laws and regulations relating to doing business in foreign markets and importing merchandise into various countries, there can be no assurance that suppliers and other third parties with whom we do business will not violate such laws and regulations or our policies. Significant or continuing noncompliance with such standards and laws by one or more vendors could have a negative impact on our reputation, could subject us to liability, and could have an adverse effect on our results of operations.
Our franchise business is subject to certain risks not directly within our control that could impair the value of our brands.We enter into franchise agreements with unaffiliated franchisees to operate stores and, in limited circumstances, websites, in many countries around the world. Under these agreements, third parties operate, or will operate, stores and websites that sell apparel and related products under our brand names. The effect of these arrangements on our business and results of operations is uncertain and will depend upon various factors, including the demand for our products in new markets internationally and our ability to successfully identify appropriate third parties to act as franchisees, distributors, or in a similar capacity. In addition, certain aspects of these arrangements are not directly within our control, such as franchisee financial stability and the ability of these third parties to meet their projections regarding store locations, store openings, and sales. Other risks that may affect these third parties include general economic conditions in specific countries or markets, foreign exchange rates, changes in diplomatic and trade relationships, restrictions on the transfer of funds, and political instability. Moreover, while the agreements we have entered into and plan to enter into in the future provide us with certain termination rights, the value of our brands could be impaired to the extent that these third parties do not operate their stores in a manner consistent with our requirements regarding our brand identities and customer experience standards. Failure to protect the value of our brands, or any other harmful acts or omissions by a franchisee, could have an adverse effect on our results of operations and our reputation.
10
The market for prime real estate is competitive.
Our ability to effectively obtain real estate - to open new stores, distribution centers, and corporate offices nationally and internationally - depends on the availability of real estate that meets our criteria for traffic, square footage, co-tenancies, lease economics, demographics, and other factors. We also must be able to effectively renew our existing store leases. In addition, we may seek to downsize, consolidate, reposition, relocate, or close some of our real estate locations, which in most cases requires a modification of an existing store lease. Failure to secure adequate new locations or successfully modify existing locations, or failure to effectively manage the profitability of our existing fleet of stores, could have a material adverse effect on our results of operations.
Additionally, the economic environment may at times make it difficult to determine the fair market rent of real estate properties within the United States and internationally. This could impact the quality of our decisions to exercise lease options at previously negotiated rents and the quality of our decisions to renew expiring leases at negotiated rents. Any adverse effect on the quality of these decisions could impact our ability to retain real estate locations adequate to meet our targets or efficiently manage the profitability of our existing fleet of stores and could have a material adverse effect on our results of operations.
We experience fluctuations in our comparable sales and margins.Our success depends in part on our ability to improve sales, in particular at our largest brands. A variety of factors affect comparable sales or margins, including apparel trends, competition, current economic conditions, the timing of new merchandise releases and promotional events, changes in our merchandise mix, the success of marketing programs, foreign currency fluctuations, industry traffic trends, and weather conditions. These factors may cause our comparable sales results and margins to differ materially from prior periods and from expectations. Our comparable sales, including the associated comparable online sales, have fluctuated significantly in the past on an annual, quarterly, and monthly basis. Over the past fiscal year, our reported quarterly comparable sales have ranged from a high of positive 2 percent in the fourth quarter of fiscal 2016 to a low of negative 5 percent in the first quarter of fiscal 2016. Over the past five years, our reported gross margins have ranged from a high of 39.4 percent in fiscal 2012 to a low of 36.2 percent in fiscal 2015. In addition, over the past five years, our reported operating margins have ranged from a high of 13.3 percent in fiscal 2013 to a low of 7.7 percent in fiscal 2016.
Our ability to deliver strong comparable sales results and margins depends in large part on accurately forecasting demand and apparel trends, selecting effective marketing techniques, providing an appropriate mix of merchandise for our broad and diverse customer base, managing inventory effectively, using effective pricing strategies, and optimizing store performance. Failure to meet the expectations of investors, securities analysts, or credit rating agencies in one or more future periods could reduce the market price of our common stock, cause our credit ratings to decline, and impact liquidity.
Changes in our credit profile or deterioration in market conditions may limit our access to the capital markets and adversely impact our financial position or our business initiatives.In April 2011, we issued $1.25 billion aggregate principal amount of 5.95 percent notes due April 2021. As a result, we have additional costs that include interest payable semi-annually on the notes. In January 2014, we also entered into a 15 billion Japanese yen, four-year, unsecured term loan due January 2018.
Our cash flows from operations are the primary source of funds for these debt service payments. In this regard, we have generated annual cash flow from operating activities in excess of $1 billion per year for well over a decade and ended fiscal 2016 with $1.8 billion of cash and cash equivalents on our balance sheet. We are also able to supplement near-term liquidity, if necessary, with our $500 million revolving credit facility. We continue to target a cash balance between $1.0 billion to $1.2 billion, which provides not only for our working capital needs, but also a reserve for unexpected business downturns. However, if our cash flows from operating activities decline significantly, we may be required to reprioritize our business initiatives to ensure that we can continue to service or refinance our debt with favorable rates and terms. In addition, any future reduction in our long-term senior unsecured credit ratings could result in reduced access to the credit and capital markets and higher interest costs and potentially increased lease or hedging costs.
11
In May 2016, Fitch Ratings and Standard & Poor's Rating Services downgraded their respective credit ratings of us from BBB- negative outlook to BB+ stable outlook. These downgrades, and any future reduction in our long-term senior unsecured credit ratings, could result in reduced access to the credit and capital markets, more restrictive covenants in future financial documents and higher interest costs, and potentially increased lease or hedging costs.
For further information on our debt and credit facilities, see Item 8, Financial Statements and Supplementary Data, Notes 5 and 6 of Notes to Consolidated Financial Statements of this Form 10-K.
Updates or changes to our IT systems may disrupt operations.We continue to evaluate and implement upgrades and changes to our IT systems, some of which are significant. Upgrades involve replacing existing systems with successor systems, making changes to existing systems, or cost-effectively acquiring new systems with new functionality. We are aware of inherent risks associated with replacing these systems, including accurately capturing data and system disruptions and believe we are taking appropriate action to mitigate the risks through testing, training, and staging implementation, as well as ensuring appropriate commercial contracts are in place with third-party vendors supplying or supporting our IT initiatives. However, there can be no assurances that we will successfully launch these systems as planned or that they will be implemented without disruptions to our operations. IT system disruptions, if not anticipated and appropriately mitigated, or failure to successfully implement new or upgraded systems, could have a material adverse effect on our results of operations.
Our results could be adversely affected by natural disasters, public health crises, political crises, or other catastrophic events.Natural disasters, such as hurricanes, tornadoes, floods, earthquakes, and other adverse weather and climate conditions; unforeseen public health crises, such as pandemics and epidemics; political crises, such as terrorist attacks, war, labor unrest, and other political instability; or other catastrophic events, such as fires or other disasters occurring at our distribution centers or our vendors' manufacturing facilities, whether occurring in the United States or internationally, could disrupt our operations, including the operations of our franchisees, or the operations of one or more of our vendors. In particular, these types of events could impact our supply chain from or to the impacted region and could impact our ability or the ability of our franchisees or other third parties to operate our stores or websites. In addition, these types of events could negatively impact consumer spending in the impacted regions or, depending upon the severity, globally. Disasters occurring at our vendors’ manufacturing facilities could impact our reputation and our customers’ perception of our brands. To the extent any of these events occur, our operations and financial results could be adversely affected.
Reductions in income and cash flow from our marketing and servicing arrangement related to our private label and co-branded credit cards could adversely affect our operating results and cash flows. A third-party, Synchrony Financial (“Synchrony”), owns and services our private label credit card and co-branded programs. Our agreement with Synchrony provides for certain payments to be made by Synchrony to us, including a share of revenues from the performance of the credit card portfolios. The income and cash flow that we receive from Synchrony is dependent upon a number of factors, including the level of sales on private label and co-branded accounts, the level of balances carried on the accounts, payment rates on the accounts, finance charge rates and other fees on the accounts, the level of credit losses for the accounts, Synchrony’s ability to extend credit to our customers as well as the cost of customer rewards programs. All of these factors can vary based on changes in federal and state credit card, banking, and commercial protection laws. The factors affecting the income and cash flow that the Company receives from Synchrony can also vary based on a variety of economic, legal, social, and other factors that we cannot control. If the income and cash flow that we receive from our consumer credit card program agreement with Synchrony decreases significantly, our operating results and cash flows could be adversely affected.
12
We are subject to various proceedings, lawsuits, disputes, and claims from time to time, which could adversely affect our business, financial condition, and results of operations.As a multinational company, we are subject to various proceedings, lawsuits, disputes, and claims (“Actions”) arising in the ordinary course of our business. Many of these Actions raise complex factual and legal issues and are subject to uncertainties. Actions filed against us from time to time include commercial, intellectual property, customer, employment, and data privacy claims, including class action lawsuits. The plaintiffs in some Actions seek unspecified damages or injunctive relief, or both. Actions are in various procedural stages and some are covered in part by insurance. We cannot predict with assurance the outcome of Actions brought against us. Accordingly, developments, settlements, or resolutions may occur and impact income in the quarter of such development, settlement, or resolution. An unfavorable outcome could have an adverse impact on our business, financial condition and results of operations.
Item 1B. Unresolved Staff Comments.None.
Item 2. Properties.We have Company-operated stores in the United States, Canada, the United Kingdom, France, Ireland, Japan, Italy, China, Hong Kong, Taiwan, and Mexico. As of January 28, 2017, we had 3,200 Company-operated stores, which aggregated to approximately 36.7 million square feet. Almost all of these stores are leased, typically with one or more renewal options after our initial term. Terms vary by type and location of store.
We own approximately 1.1 million square feet of corporate office space located in San Francisco, San Bruno, Pleasanton, and Rocklin, California, of which approximately 184,000 square feet is leased to and occupied by others. We lease approximately 934,000 square feet of corporate office space located in San Francisco, Rocklin, Petaluma, and Pleasanton, California; New York and Brooklyn, New York; Albuquerque, New Mexico; and Toronto, Ontario, Canada. We also lease regional offices in North America and in various international locations. We own approximately 8.6 million square feet of distribution space located in Fresno, California; Fishkill, New York; Groveport, Ohio; Gallatin, Tennessee; Brampton, Ontario, Canada; and Rugby, England. Of the 8.6 million square feet of owned distribution space, approximately 117,000 square feet is leased to and occupied by others. We lease approximately 1.2 million square feet of distribution space located in Phoenix, Arizona; Grove City, Ohio; Erlanger and Hebron, Kentucky; and Bolton and Mississauga, Ontario, Canada. Third-party logistics companies provide logistics services to us through distribution warehouses in Chiba, Japan; and Shanghai and Hong Kong, China.
Item 3. Legal Proceedings.We do not believe that the outcome of any current Action would have a material effect on our Consolidated Financial Statements.
Item 4. Mine Safety Disclosures.Not applicable.
13
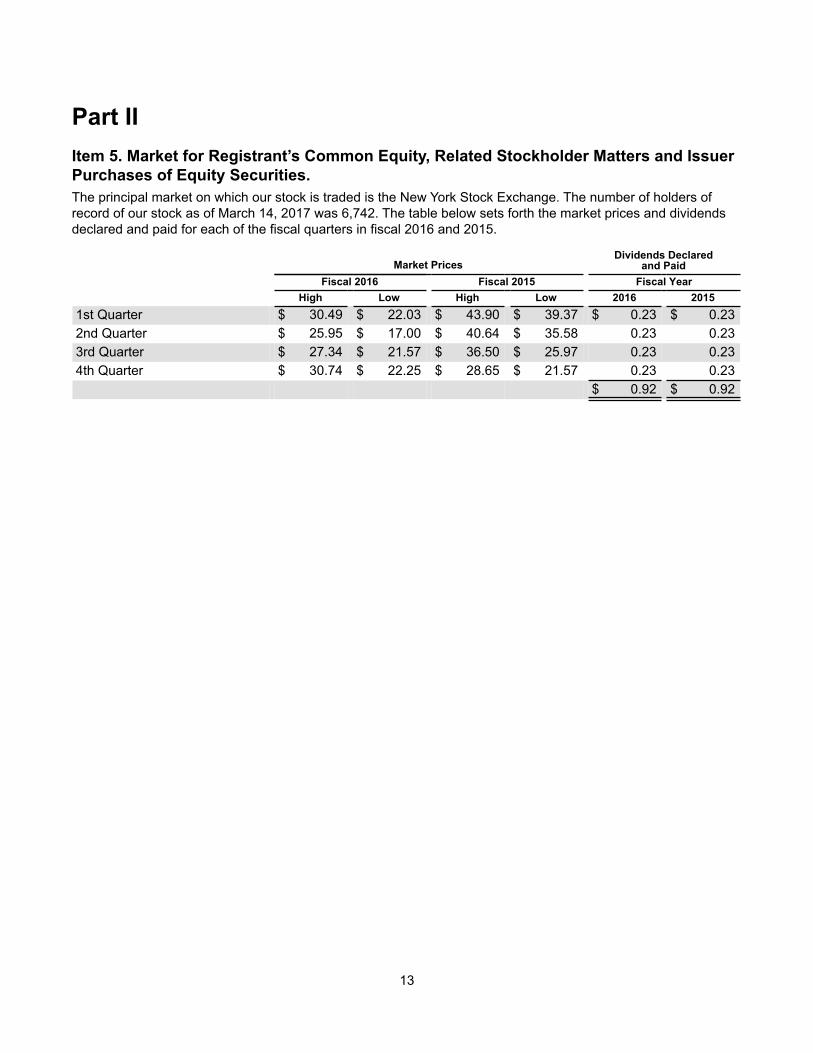
Part IIItem 5. Market for Registrant’s Common Equity, Related Stockholder Matters and Issuer Purchases of Equity Securities.The principal market on which our stock is traded is the New York Stock Exchange. The number of holders of record of our stock as of March 14, 2017 was 6,742. The table below sets forth the market prices and dividends declared and paid for each of the fiscal quarters in fiscal 2016 and 2015.
Market PricesDividends Declared
and Paid Fiscal 2016 Fiscal 2015 Fiscal Year High Low High Low 2016 20151st Quarter $ 30.49 $ 22.03 $ 43.90 $ 39.37 $ 0.23 $ 0.232nd Quarter $ 25.95 $ 17.00 $ 40.64 $ 35.58 0.23 0.233rd Quarter $ 27.34 $ 21.57 $ 36.50 $ 25.97 0.23 0.234th Quarter $ 30.74 $ 22.25 $ 28.65 $ 21.57 0.23 0.23
$ 0.92 $ 0.92
14
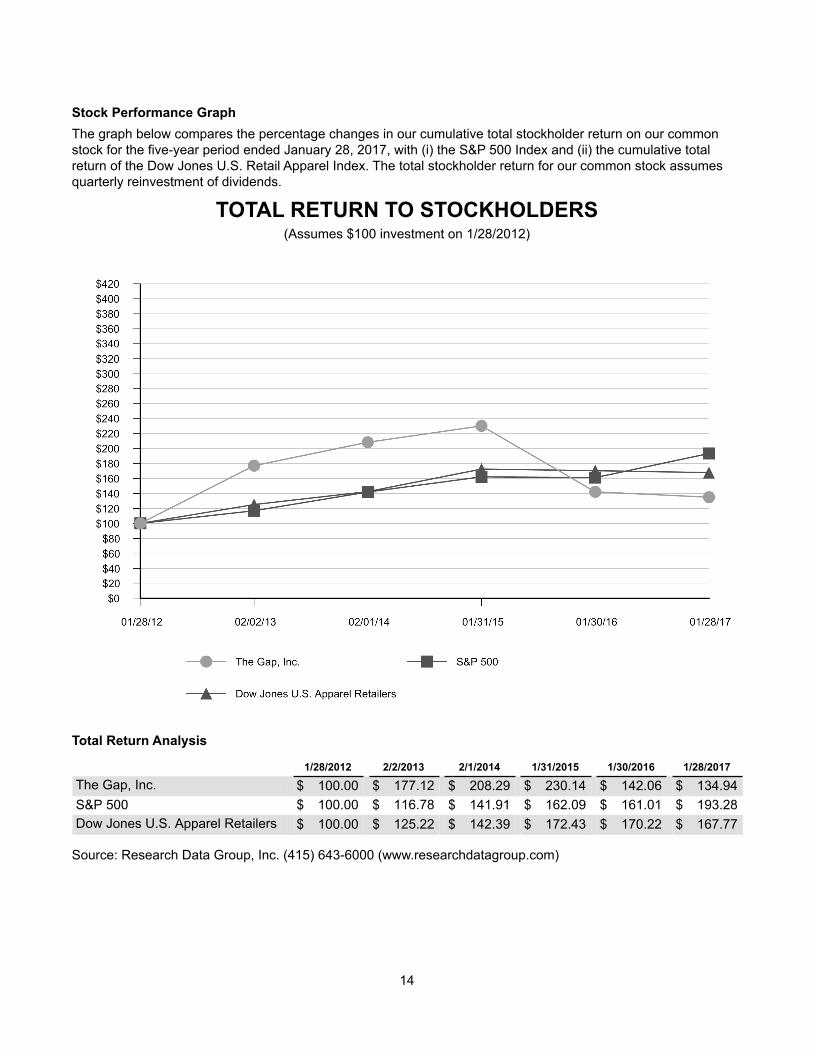
Stock Performance GraphThe graph below compares the percentage changes in our cumulative total stockholder return on our common stock for the five-year period ended January 28, 2017, with (i) the S&P 500 Index and (ii) the cumulative total return of the Dow Jones U.S. Retail Apparel Index. The total stockholder return for our common stock assumes quarterly reinvestment of dividends.
TOTAL RETURN TO STOCKHOLDERS(Assumes $100 investment on 1/28/2012)
Total Return Analysis
1/28/2012 2/2/2013 2/1/2014 1/31/2015 1/30/2016 1/28/2017
The Gap, Inc. $ 100.00 $ 177.12 $ 208.29 $ 230.14 $ 142.06 $ 134.94S&P 500 $ 100.00 $ 116.78 $ 141.91 $ 162.09 $ 161.01 $ 193.28Dow Jones U.S. Apparel Retailers $ 100.00 $ 125.22 $ 142.39 $ 172.43 $ 170.22 $ 167.77
Source: Research Data Group, Inc. (415) 643-6000 (www.researchdatagroup.com)

15
Purchases of Equity Securities by the Issuer and Affiliated PurchasersThe following table presents information with respect to purchases of common stock of the Company made during the thirteen weeks ended January 28, 2017 by The Gap, Inc. or any affiliated purchaser, as defined in Exchange Act Rule 10b-18(a)(3):
Total Numberof Shares
Purchased
AveragePrice PaidPer ShareIncluding
Commissions
Total Numberof Shares
Purchased asPart of Publicly
AnnouncedPlans or
Programs
Maximum Number(or approximate
dollar amount) ofShares that May
Yet be PurchasedUnder the Plans or
Programs (1)Month #1 (October 30 - November 26) — $ — — $1,000 millionMonth #2 (November 27 - December 31) — $ — — $1,000 millionMonth #3 (January 1 - January 28) — $ — — $1,000 millionTotal — $ — —
__________(1) On February 25, 2016, we announced that the Board of Directors approved a $1 billion share repurchase authorization (the "February
2016 repurchase program"), which has no expiration date. The February 2016 repurchase program replaced and superseded the previous $1 billion share repurchase authorization announced in February 2015, which had $302 million remaining.

16
Item 6. Selected Financial Data.The following selected financial data are derived from the Consolidated Financial Statements of the Company. We have also included certain non-financial data to enhance your understanding of our business. The data set forth below should be read in conjunction with “Management’s Discussion and Analysis of Financial Condition and Results of Operations” in Item 7 and the Company’s Consolidated Financial Statements and related notes in Item 8 of this Form 10-K.
Fiscal Year (number of weeks) 2016 (52) 2015 (52) 2014 (52) 2013 (52) 2012 (53)Operating Results ($ in millions)Net sales $ 15,516 $ 15,797 $ 16,435 $ 16,148 $ 15,651Gross margin 36.3 % 36.2 % 38.3% 39.0% 39.4 %Operating margin 7.7 % 9.6 % 12.7% 13.3% 12.4 %Net income $ 676 $ 920 $ 1,262 $ 1,280 $ 1,135Cash dividends paid $ 367 $ 377 $ 383 $ 321 $ 240
Per Share Data (number of shares in millions)Basic earnings per share $ 1.69 $ 2.24 $ 2.90 $ 2.78 $ 2.35Diluted earnings per share $ 1.69 $ 2.23 $ 2.87 $ 2.74 $ 2.33Weighted-average number of shares—basic 399 411 435 461 482Weighted-average number of shares—diluted 400 413 440 467 488Cash dividends declared and paid per share $ 0.92 $ 0.92 $ 0.88 $ 0.70 $ 0.50
Balance Sheet Information ($ in millions)Merchandise inventory $ 1,830 $ 1,873 $ 1,889 $ 1,928 $ 1,758Total assets $ 7,610 $ 7,473 $ 7,690 $ 7,849 $ 7,470Working capital (1) $ 1,862 $ 1,450 $ 2,083 $ 1,985 $ 1,788Total long-term debt, less current maturities $ 1,248 $ 1,310 $ 1,332 $ 1,369 $ 1,246Stockholders’ equity $ 2,904 $ 2,545 $ 2,983 $ 3,062 $ 2,894
Other Data ($ and square footage in millions)Cash used for purchases of property and
equipment $ 524 $ 726 $ 714 $ 670 $ 659Acquisition of business, net of cash acquired
(2) $ 4 $ — $ — $ — $ 129Percentage increase (decrease) in comparable
sales (2)% (4)% —% 2% 5 %Number of Company-operated store locations
open at year-end 3,200 3,275 3,280 3,164 3,095Number of franchise store locations open at
year-end 459 446 429 375 312Number of total store locations open at year-
end 3,659 3,721 3,709 3,539 3,407Square footage of Company-operated store
space at year-end 36.7 37.9 38.1 37.2 36.9Percentage increase (decrease) in square
footage of Company-operated store space atyear-end (3.2)% (0.5)% 2.4% 0.8% (0.8)%
Number of employees at year-end 135,000 141,000 141,000 137,000 136,000__________

17
(1) In fiscal year 2015, we adopted the Financial Accounting Standards Board, Accounting Standard Update No. 2015-17, Income Taxes. The adoption reduced the current portion of deferred tax assets as a result of classifying all net deferred tax assets as noncurrent as of January 30, 2016 on a prospective basis.
(2) On December 31, 2012, we acquired all of the outstanding capital stock of Intermix, a multi-brand specialty retailer of luxury and contemporary apparel and accessories, for an aggregate purchase price of $129 million. On December 2, 2016, we acquired the net assets of Weddington Way for an aggregate purchase price of $4 million.
18
Item 7. Management’s Discussion and Analysis of Financial Condition and Results of Operations.Overview We are a global retailer offering apparel, accessories, and personal care products for men, women, and children under the Gap, Banana Republic, Old Navy, Athleta, and Intermix brands. We have Company-operated stores in the United States, Canada, the United Kingdom, France, Ireland, Japan, Italy, China, Hong Kong, Taiwan, and beginning in October 2015, Mexico. We have franchise agreements with unaffiliated franchisees to operate Gap, Banana Republic, and Old Navy stores throughout Asia, Australia, Europe, Latin America, the Middle East, and Africa. Under these agreements, third parties operate, or will operate, stores that sell apparel and related products under our brand names. Our products are also available to customers online through Company-owned websites and through the use of third parties that provide logistics and fulfillment services. In addition to operating in the specialty, outlet, online, and franchise channels, we also use our omni-channel capabilities to bridge the digital world and physical stores to further enhance our shopping experience for our customers. Our omni-channel services, including order-in-store, reserve-in-store, find-in-store, and ship-from-store, as well as enhanced mobile experiences, are tailored uniquely across our portfolio of brands. Most of the products sold under our brand names are designed by us and manufactured by independent sources. We also sell products that are designed and manufactured by branded third parties, primarily at our Intermix brand.
We identify our operating segments according to how our business activities are managed and evaluated. As of January 28, 2017, our operating segments included Gap Global, Old Navy Global, Banana Republic Global, Athleta, and Intermix. We have determined that each of our operating segments share similar economic and other qualitative characteristics, and therefore the results of our operating segments are aggregated into one reportable segment.
In May 2016, we announced measures to better align talent and financial resources against our most important priorities to position the Company for improved business performance and long-term success. Our aim is to capture additional market share in our home market, North America, where we have our largest structural advantages, and to focus on international regions with the greatest potential. As part of this effort, we closed the entire fleet of 53 Old Navy stores in Japan during fiscal 2016. Japan remains an important market for the Company's portfolio, with a continued strong presence of more than 200 Gap and Banana Republic stores. Including the Old Navy closures in Japan, the Company closed 67 stores in total related to these measures in fiscal 2016.
We also created a more efficient operating model, enabling us to more fully leverage our scale. For example, we centralized or consolidated several brand and corporate functions, allowing us to simplify the organization and operate more efficiently.
The Company estimates that its actions will result in annualized pre-tax savings of about $275 million. In connection with the decision to close stores and streamline the Company's operations, the Company incurred $197 million in restructuring costs during fiscal 2016 on a pre-tax basis. The charges primarily include lease termination fees, employee-related costs, and store asset impairment. Certain of these costs incurred in foreign subsidiaries did not result in a tax benefit.
19
On August 29, 2016, a fire occurred in one of the buildings at a Company-owned distribution center campus in Fishkill, New York. Following the fire, the Company immediately activated contingency plans to help mitigate the overall impact to the business. In October 2016, the Company completed construction of a temporary fulfillment site at the Fishkill campus, which was in place to process orders by peak holiday season, and plans to rebuild a permanent building are currently underway. For fiscal 2016, the Company incurred fire-related costs which included $86 million in inventory at cost, $12 million in property, plant, and equipment at net book value, and $35 million in other fire-related costs. In January of fiscal 2016, the Company agreed upon a partial settlement of $159 million related to the inventory and recorded a gain of $73 million, representing the excess over the loss on inventory. Based on the provisions of the Company’s insurance policies, the Company has determined that recovery of certain remaining fire-related costs incurred during fiscal 2016 is probable, and an insurance receivable, net of advance insurance proceeds received, has been recorded as of January 28, 2017 to offset the fire-related costs. The company expects to continue to record additional costs and recoveries until the insurance claim is fully settled.
Fiscal 2015 results were impacted by a series of strategic actions to position Gap brand for improved business performance in the future, including rightsizing the Gap brand store fleet primarily in North America, streamlining the brand's headquarter workforce, and developing a clear, on-brand product aesthetic framework to strengthen the Gap brand to compete more successfully on the global stage. During fiscal 2015, the Company completed the closure of about 150 Gap global specialty stores related to the strategic actions. During fiscal 2015, the Company incurred $132 million of charges in connection with the strategic actions, primarily consisting of impairment of store assets related to underperforming stores, lease termination fees and lease losses, employee related expenses, and impairment of inventory that did not meet brand standards.
Financial results for fiscal 2016 are as follows:• Net sales for fiscal 2016 decreased 2 percent to $15.5 billion compared with $15.8 billion for fiscal 2015. • Comparable sales ("Comp Sales") for fiscal 2016 decreased 2 percent.• Gross profit for fiscal 2016 was $5.6 billion compared with $5.7 billion for fiscal 2015. Gross margin for fiscal
2016 was 36.3 percent compared with 36.2 percent for fiscal 2015.• Operating margin for fiscal 2016 was 7.7 percent compared with 9.6 percent for fiscal 2015. Operating margin is
defined as operating income as a percentage of net sales.• Net income for fiscal 2016 was $676 million compared with $920 million for fiscal 2015, and diluted earnings per
share was $1.69 for fiscal 2016 compared with $2.23 for fiscal 2015. Diluted earnings per share for fiscal 2016 included about a $0.41 impact of restructuring costs incurred during fiscal 2016, a non-cash goodwill impairment charge of $0.18 related to Intermix, an $0.11 benefit from the gain from insurance proceeds related to the fire which occurred at the Company's Fishkill distribution center campus, and a favorable income tax impact of a legal structure realignment of about $0.15. Diluted earnings per share for fiscal 2015 included a $0.20 impact of costs related to strategic actions incurred during fiscal 2015.
• During fiscal 2016, we distributed $367 million to shareholders through dividends.
Our business priorities in 2017 include: • offering product that is consistently brand-appropriate and on-trend with high customer acceptance, with a focus
on expanding our advantage in the most promising categories;• delivering meaningful product innovation;• creating a unique and differentiated customer experience that builds loyalty, with focus on both the physical and
digital expressions of our brands; and • attracting and retaining great talent in our businesses and functions.
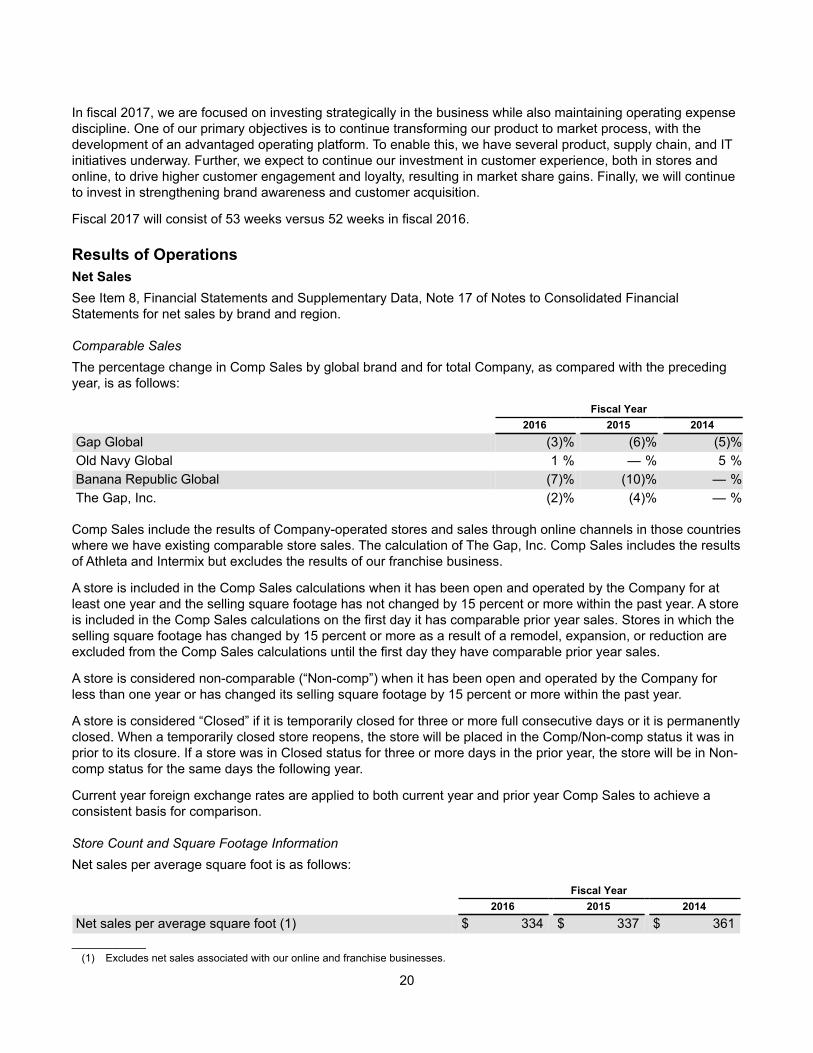
20
In fiscal 2017, we are focused on investing strategically in the business while also maintaining operating expense discipline. One of our primary objectives is to continue transforming our product to market process, with the development of an advantaged operating platform. To enable this, we have several product, supply chain, and IT initiatives underway. Further, we expect to continue our investment in customer experience, both in stores and online, to drive higher customer engagement and loyalty, resulting in market share gains. Finally, we will continue to invest in strengthening brand awareness and customer acquisition.
Fiscal 2017 will consist of 53 weeks versus 52 weeks in fiscal 2016.
Results of OperationsNet SalesSee Item 8, Financial Statements and Supplementary Data, Note 17 of Notes to Consolidated Financial Statements for net sales by brand and region.
Comparable Sales The percentage change in Comp Sales by global brand and for total Company, as compared with the preceding year, is as follows:
Fiscal Year 2016 2015 2014Gap Global (3)% (6)% (5)%Old Navy Global 1 % — % 5 %Banana Republic Global (7)% (10)% — %The Gap, Inc. (2)% (4)% — %
Comp Sales include the results of Company-operated stores and sales through online channels in those countries where we have existing comparable store sales. The calculation of The Gap, Inc. Comp Sales includes the results of Athleta and Intermix but excludes the results of our franchise business.
A store is included in the Comp Sales calculations when it has been open and operated by the Company for at least one year and the selling square footage has not changed by 15 percent or more within the past year. A store is included in the Comp Sales calculations on the first day it has comparable prior year sales. Stores in which the selling square footage has changed by 15 percent or more as a result of a remodel, expansion, or reduction are excluded from the Comp Sales calculations until the first day they have comparable prior year sales.
A store is considered non-comparable (“Non-comp”) when it has been open and operated by the Company for less than one year or has changed its selling square footage by 15 percent or more within the past year.
A store is considered “Closed” if it is temporarily closed for three or more full consecutive days or it is permanently closed. When a temporarily closed store reopens, the store will be placed in the Comp/Non-comp status it was in prior to its closure. If a store was in Closed status for three or more days in the prior year, the store will be in Non-comp status for the same days the following year.
Current year foreign exchange rates are applied to both current year and prior year Comp Sales to achieve a consistent basis for comparison.
Store Count and Square Footage InformationNet sales per average square foot is as follows:
Fiscal Year 2016 2015 2014Net sales per average square foot (1) $ 334 $ 337 $ 361
__________(1) Excludes net sales associated with our online and franchise businesses.
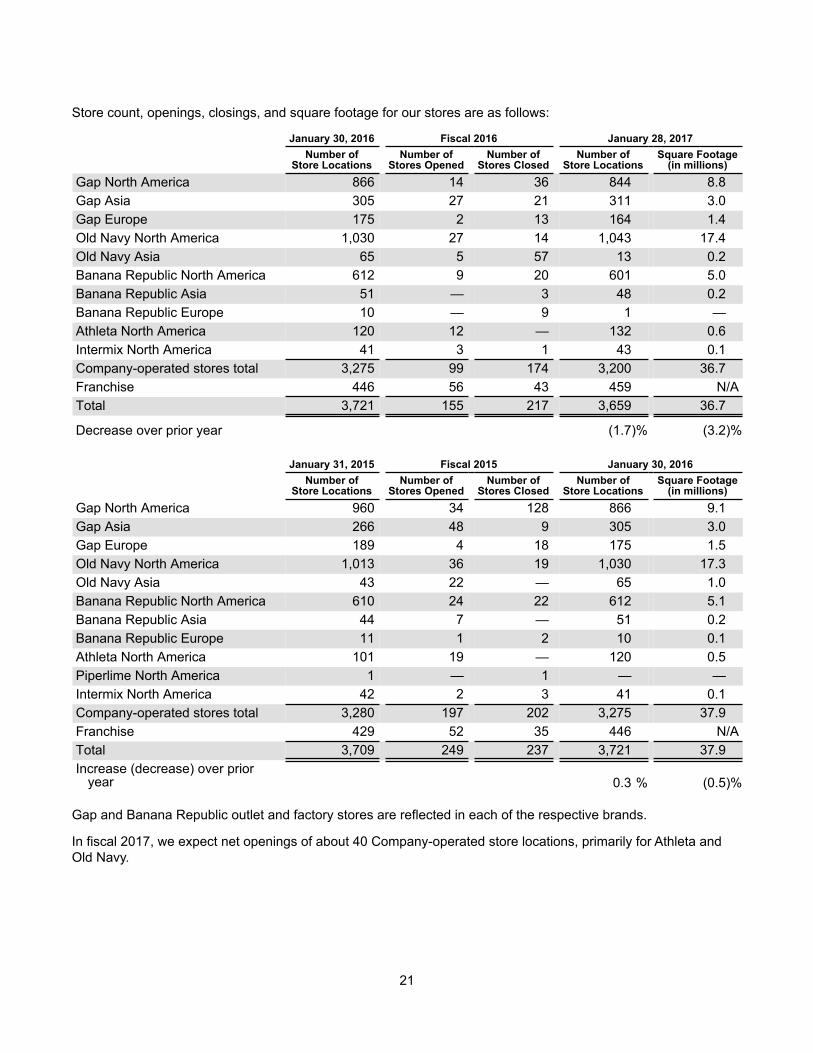
21
Store count, openings, closings, and square footage for our stores are as follows:
January 30, 2016 Fiscal 2016 January 28, 2017
Number of
Store LocationsNumber of
Stores OpenedNumber of
Stores ClosedNumber of
Store LocationsSquare Footage
(in millions)Gap North America 866 14 36 844 8.8Gap Asia 305 27 21 311 3.0Gap Europe 175 2 13 164 1.4Old Navy North America 1,030 27 14 1,043 17.4Old Navy Asia 65 5 57 13 0.2Banana Republic North America 612 9 20 601 5.0Banana Republic Asia 51 — 3 48 0.2Banana Republic Europe 10 — 9 1 —Athleta North America 120 12 — 132 0.6Intermix North America 41 3 1 43 0.1Company-operated stores total 3,275 99 174 3,200 36.7Franchise 446 56 43 459 N/ATotal 3,721 155 217 3,659 36.7
Decrease over prior year (1.7)% (3.2)%
January 31, 2015 Fiscal 2015 January 30, 2016
Number of
Store LocationsNumber of
Stores OpenedNumber of
Stores ClosedNumber of
Store LocationsSquare Footage
(in millions)Gap North America 960 34 128 866 9.1Gap Asia 266 48 9 305 3.0Gap Europe 189 4 18 175 1.5Old Navy North America 1,013 36 19 1,030 17.3Old Navy Asia 43 22 — 65 1.0Banana Republic North America 610 24 22 612 5.1Banana Republic Asia 44 7 — 51 0.2Banana Republic Europe 11 1 2 10 0.1Athleta North America 101 19 — 120 0.5Piperlime North America 1 — 1 — —Intermix North America 42 2 3 41 0.1Company-operated stores total 3,280 197 202 3,275 37.9Franchise 429 52 35 446 N/ATotal 3,709 249 237 3,721 37.9Increase (decrease) over prior
year 0.3 % (0.5)%
Gap and Banana Republic outlet and factory stores are reflected in each of the respective brands.
In fiscal 2017, we expect net openings of about 40 Company-operated store locations, primarily for Athleta and Old Navy.
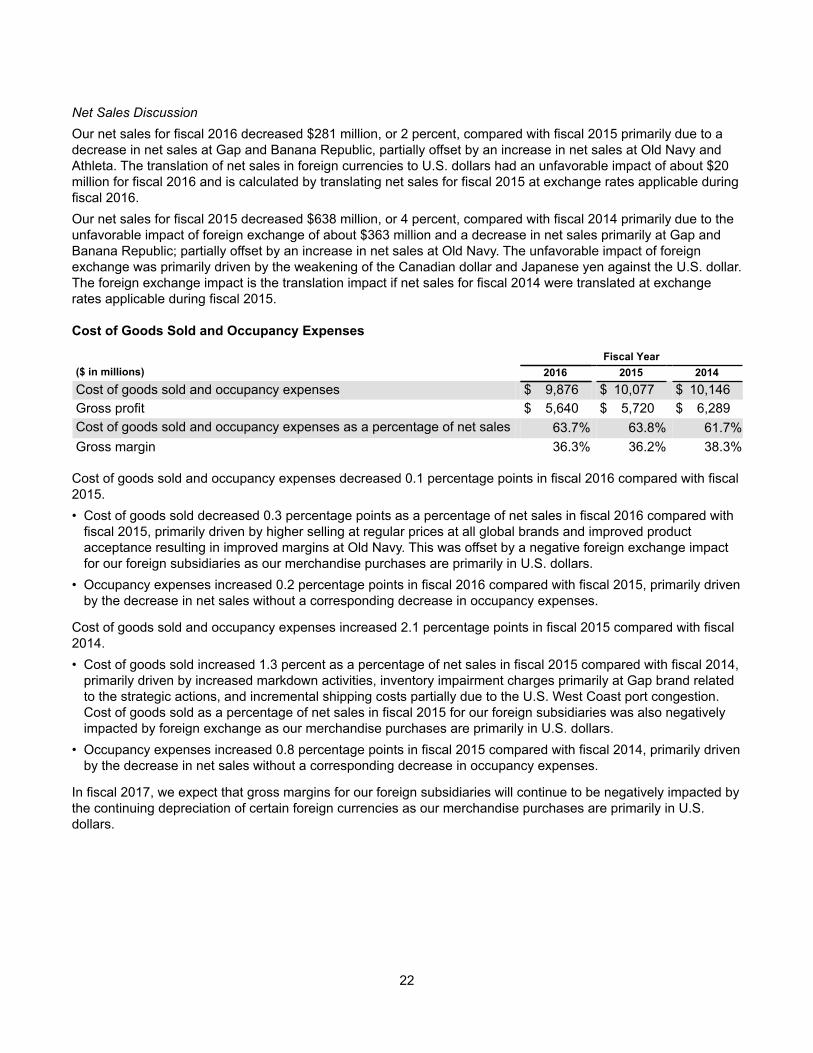
22
Net Sales DiscussionOur net sales for fiscal 2016 decreased $281 million, or 2 percent, compared with fiscal 2015 primarily due to a decrease in net sales at Gap and Banana Republic, partially offset by an increase in net sales at Old Navy and Athleta. The translation of net sales in foreign currencies to U.S. dollars had an unfavorable impact of about $20 million for fiscal 2016 and is calculated by translating net sales for fiscal 2015 at exchange rates applicable during fiscal 2016. Our net sales for fiscal 2015 decreased $638 million, or 4 percent, compared with fiscal 2014 primarily due to the unfavorable impact of foreign exchange of about $363 million and a decrease in net sales primarily at Gap and Banana Republic; partially offset by an increase in net sales at Old Navy. The unfavorable impact of foreign exchange was primarily driven by the weakening of the Canadian dollar and Japanese yen against the U.S. dollar. The foreign exchange impact is the translation impact if net sales for fiscal 2014 were translated at exchange rates applicable during fiscal 2015.
Cost of Goods Sold and Occupancy Expenses
($ in millions)Fiscal Year
2016 2015 2014Cost of goods sold and occupancy expenses $ 9,876 $ 10,077 $ 10,146Gross profit $ 5,640 $ 5,720 $ 6,289Cost of goods sold and occupancy expenses as a percentage of net sales 63.7% 63.8% 61.7%Gross margin 36.3% 36.2% 38.3%
Cost of goods sold and occupancy expenses decreased 0.1 percentage points in fiscal 2016 compared with fiscal 2015.• Cost of goods sold decreased 0.3 percentage points as a percentage of net sales in fiscal 2016 compared with
fiscal 2015, primarily driven by higher selling at regular prices at all global brands and improved product acceptance resulting in improved margins at Old Navy. This was offset by a negative foreign exchange impact for our foreign subsidiaries as our merchandise purchases are primarily in U.S. dollars.
• Occupancy expenses increased 0.2 percentage points in fiscal 2016 compared with fiscal 2015, primarily driven by the decrease in net sales without a corresponding decrease in occupancy expenses.
Cost of goods sold and occupancy expenses increased 2.1 percentage points in fiscal 2015 compared with fiscal 2014.• Cost of goods sold increased 1.3 percent as a percentage of net sales in fiscal 2015 compared with fiscal 2014,
primarily driven by increased markdown activities, inventory impairment charges primarily at Gap brand related to the strategic actions, and incremental shipping costs partially due to the U.S. West Coast port congestion. Cost of goods sold as a percentage of net sales in fiscal 2015 for our foreign subsidiaries was also negatively impacted by foreign exchange as our merchandise purchases are primarily in U.S. dollars.
• Occupancy expenses increased 0.8 percentage points in fiscal 2015 compared with fiscal 2014, primarily driven by the decrease in net sales without a corresponding decrease in occupancy expenses.
In fiscal 2017, we expect that gross margins for our foreign subsidiaries will continue to be negatively impacted by the continuing depreciation of certain foreign currencies as our merchandise purchases are primarily in U.S. dollars.
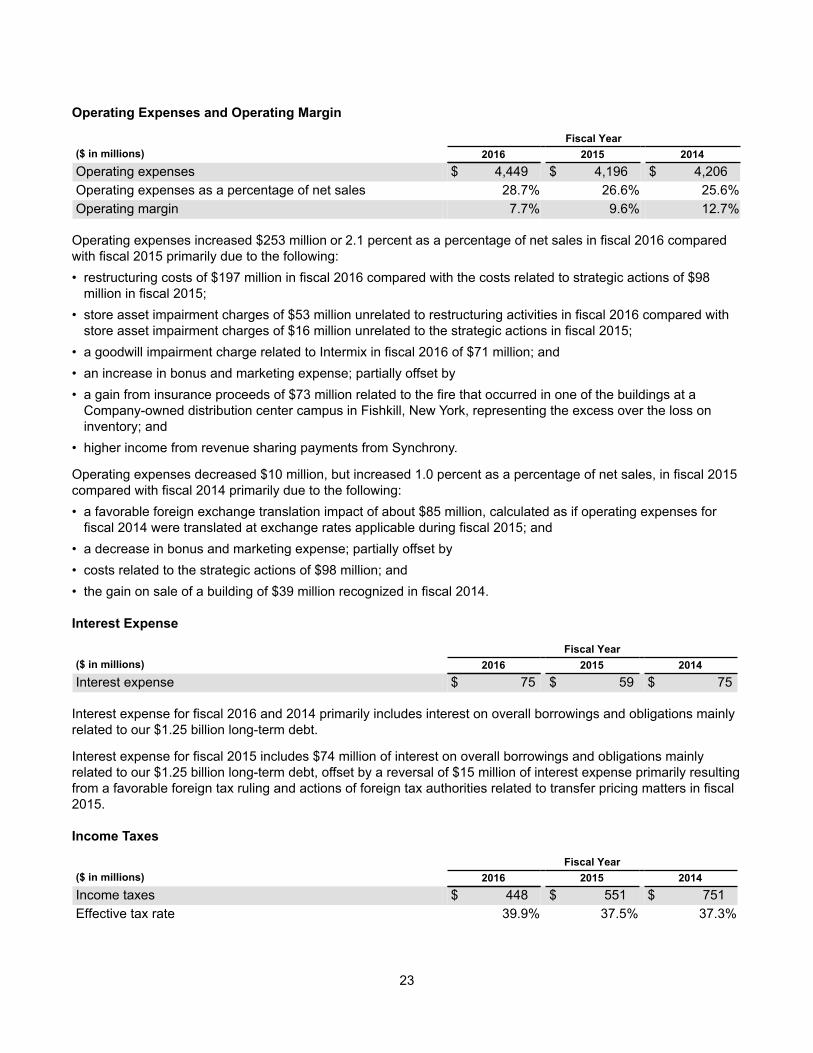
23
Operating Expenses and Operating Margin
($ in millions)Fiscal Year
2016 2015 2014Operating expenses $ 4,449 $ 4,196 $ 4,206Operating expenses as a percentage of net sales 28.7% 26.6% 25.6%Operating margin 7.7% 9.6% 12.7%
Operating expenses increased $253 million or 2.1 percent as a percentage of net sales in fiscal 2016 compared with fiscal 2015 primarily due to the following:• restructuring costs of $197 million in fiscal 2016 compared with the costs related to strategic actions of $98
million in fiscal 2015;• store asset impairment charges of $53 million unrelated to restructuring activities in fiscal 2016 compared with
store asset impairment charges of $16 million unrelated to the strategic actions in fiscal 2015;• a goodwill impairment charge related to Intermix in fiscal 2016 of $71 million; and• an increase in bonus and marketing expense; partially offset by• a gain from insurance proceeds of $73 million related to the fire that occurred in one of the buildings at a
Company-owned distribution center campus in Fishkill, New York, representing the excess over the loss on inventory; and
• higher income from revenue sharing payments from Synchrony.
Operating expenses decreased $10 million, but increased 1.0 percent as a percentage of net sales, in fiscal 2015 compared with fiscal 2014 primarily due to the following: • a favorable foreign exchange translation impact of about $85 million, calculated as if operating expenses for
fiscal 2014 were translated at exchange rates applicable during fiscal 2015; and• a decrease in bonus and marketing expense; partially offset by • costs related to the strategic actions of $98 million; and • the gain on sale of a building of $39 million recognized in fiscal 2014.
Interest Expense
($ in millions)Fiscal Year
2016 2015 2014Interest expense $ 75 $ 59 $ 75
Interest expense for fiscal 2016 and 2014 primarily includes interest on overall borrowings and obligations mainly related to our $1.25 billion long-term debt.
Interest expense for fiscal 2015 includes $74 million of interest on overall borrowings and obligations mainly related to our $1.25 billion long-term debt, offset by a reversal of $15 million of interest expense primarily resulting from a favorable foreign tax ruling and actions of foreign tax authorities related to transfer pricing matters in fiscal 2015.
Income Taxes
($ in millions)Fiscal Year
2016 2015 2014Income taxes $ 448 $ 551 $ 751Effective tax rate 39.9% 37.5% 37.3%
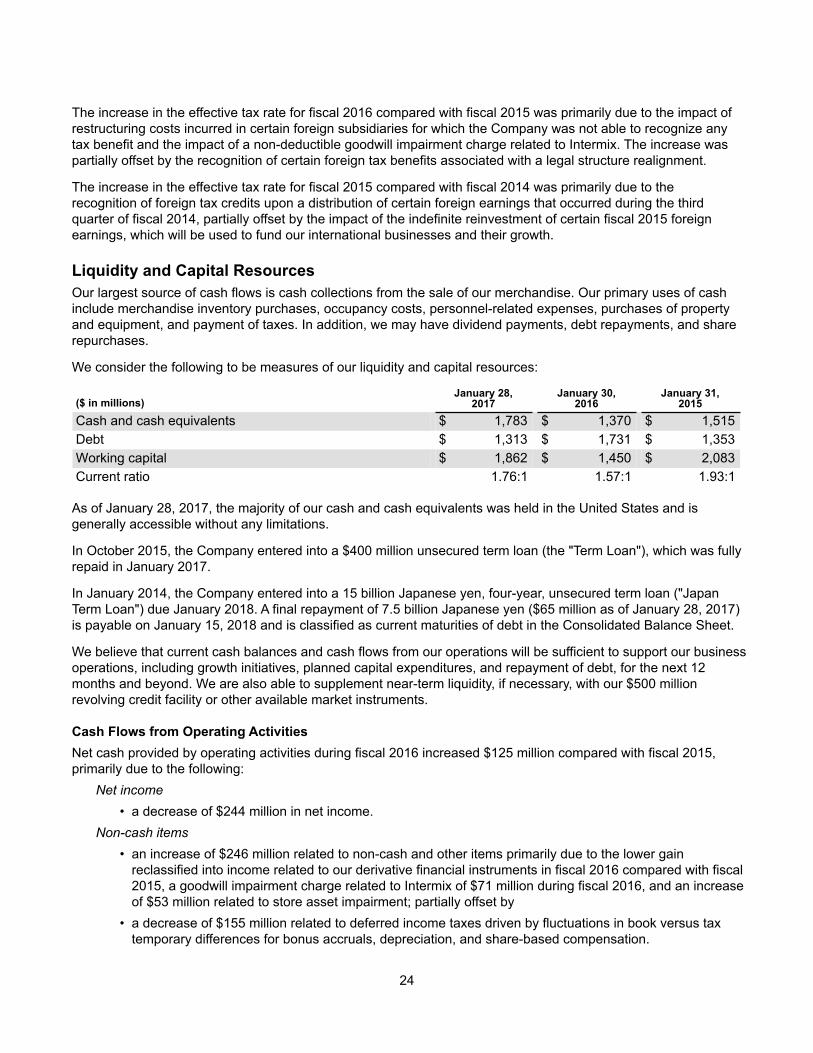
24
The increase in the effective tax rate for fiscal 2016 compared with fiscal 2015 was primarily due to the impact of restructuring costs incurred in certain foreign subsidiaries for which the Company was not able to recognize any tax benefit and the impact of a non-deductible goodwill impairment charge related to Intermix. The increase was partially offset by the recognition of certain foreign tax benefits associated with a legal structure realignment.
The increase in the effective tax rate for fiscal 2015 compared with fiscal 2014 was primarily due to the recognition of foreign tax credits upon a distribution of certain foreign earnings that occurred during the third quarter of fiscal 2014, partially offset by the impact of the indefinite reinvestment of certain fiscal 2015 foreign earnings, which will be used to fund our international businesses and their growth.
Liquidity and Capital ResourcesOur largest source of cash flows is cash collections from the sale of our merchandise. Our primary uses of cash include merchandise inventory purchases, occupancy costs, personnel-related expenses, purchases of property and equipment, and payment of taxes. In addition, we may have dividend payments, debt repayments, and share repurchases.
We consider the following to be measures of our liquidity and capital resources:
($ in millions)January 28,
2017January 30,
2016January 31,
2015Cash and cash equivalents $ 1,783 $ 1,370 $ 1,515Debt $ 1,313 $ 1,731 $ 1,353Working capital $ 1,862 $ 1,450 $ 2,083Current ratio 1.76:1 1.57:1 1.93:1
As of January 28, 2017, the majority of our cash and cash equivalents was held in the United States and is generally accessible without any limitations.
In October 2015, the Company entered into a $400 million unsecured term loan (the "Term Loan"), which was fully repaid in January 2017.
In January 2014, the Company entered into a 15 billion Japanese yen, four-year, unsecured term loan ("Japan Term Loan") due January 2018. A final repayment of 7.5 billion Japanese yen ($65 million as of January 28, 2017) is payable on January 15, 2018 and is classified as current maturities of debt in the Consolidated Balance Sheet.
We believe that current cash balances and cash flows from our operations will be sufficient to support our business operations, including growth initiatives, planned capital expenditures, and repayment of debt, for the next 12 months and beyond. We are also able to supplement near-term liquidity, if necessary, with our $500 million revolving credit facility or other available market instruments.
Cash Flows from Operating ActivitiesNet cash provided by operating activities during fiscal 2016 increased $125 million compared with fiscal 2015, primarily due to the following:
Net income• a decrease of $244 million in net income.
Non-cash items• an increase of $246 million related to non-cash and other items primarily due to the lower gain
reclassified into income related to our derivative financial instruments in fiscal 2016 compared with fiscal 2015, a goodwill impairment charge related to Intermix of $71 million during fiscal 2016, and an increase of $53 million related to store asset impairment; partially offset by
• a decrease of $155 million related to deferred income taxes driven by fluctuations in book versus tax temporary differences for bonus accruals, depreciation, and share-based compensation.
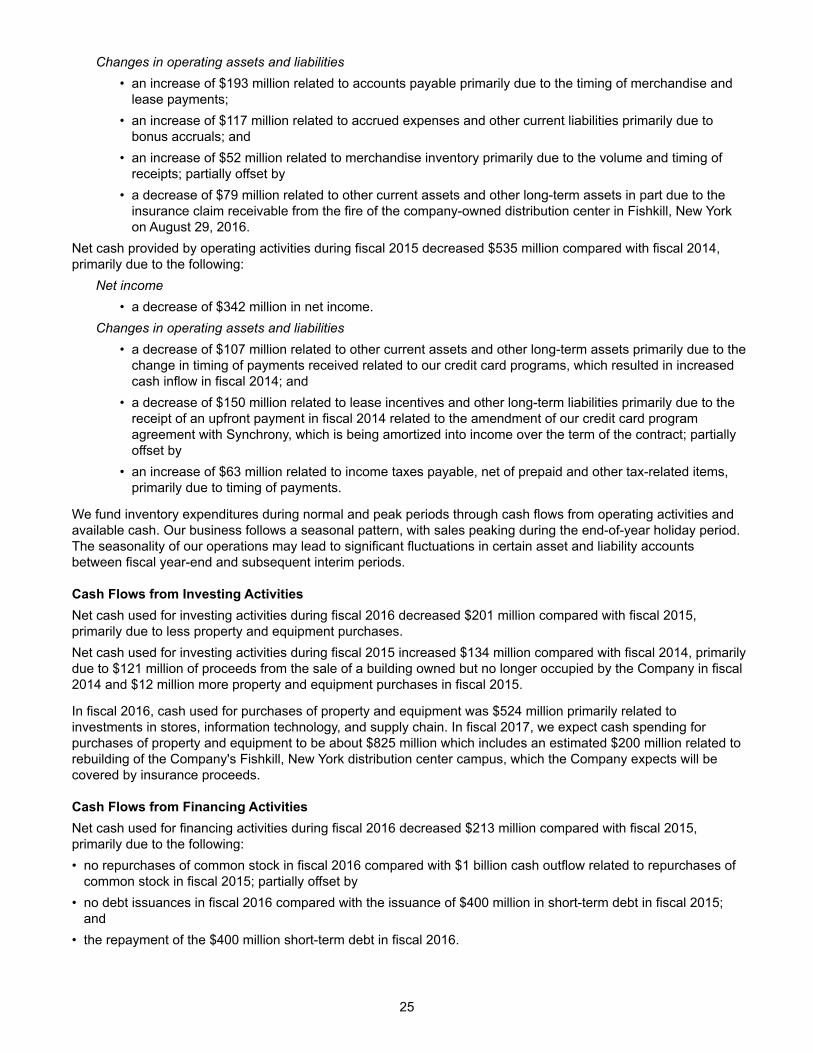
25
Changes in operating assets and liabilities• an increase of $193 million related to accounts payable primarily due to the timing of merchandise and
lease payments;• an increase of $117 million related to accrued expenses and other current liabilities primarily due to
bonus accruals; and• an increase of $52 million related to merchandise inventory primarily due to the volume and timing of
receipts; partially offset by• a decrease of $79 million related to other current assets and other long-term assets in part due to the
insurance claim receivable from the fire of the company-owned distribution center in Fishkill, New York on August 29, 2016.
Net cash provided by operating activities during fiscal 2015 decreased $535 million compared with fiscal 2014, primarily due to the following:
Net income• a decrease of $342 million in net income.
Changes in operating assets and liabilities• a decrease of $107 million related to other current assets and other long-term assets primarily due to the
change in timing of payments received related to our credit card programs, which resulted in increased cash inflow in fiscal 2014; and
• a decrease of $150 million related to lease incentives and other long-term liabilities primarily due to the receipt of an upfront payment in fiscal 2014 related to the amendment of our credit card program agreement with Synchrony, which is being amortized into income over the term of the contract; partially offset by
• an increase of $63 million related to income taxes payable, net of prepaid and other tax-related items, primarily due to timing of payments.
We fund inventory expenditures during normal and peak periods through cash flows from operating activities and available cash. Our business follows a seasonal pattern, with sales peaking during the end-of-year holiday period. The seasonality of our operations may lead to significant fluctuations in certain asset and liability accounts between fiscal year-end and subsequent interim periods.
Cash Flows from Investing ActivitiesNet cash used for investing activities during fiscal 2016 decreased $201 million compared with fiscal 2015, primarily due to less property and equipment purchases. Net cash used for investing activities during fiscal 2015 increased $134 million compared with fiscal 2014, primarily due to $121 million of proceeds from the sale of a building owned but no longer occupied by the Company in fiscal 2014 and $12 million more property and equipment purchases in fiscal 2015.
In fiscal 2016, cash used for purchases of property and equipment was $524 million primarily related to investments in stores, information technology, and supply chain. In fiscal 2017, we expect cash spending for purchases of property and equipment to be about $825 million which includes an estimated $200 million related to rebuilding of the Company's Fishkill, New York distribution center campus, which the Company expects will be covered by insurance proceeds.
Cash Flows from Financing ActivitiesNet cash used for financing activities during fiscal 2016 decreased $213 million compared with fiscal 2015, primarily due to the following:• no repurchases of common stock in fiscal 2016 compared with $1 billion cash outflow related to repurchases of
common stock in fiscal 2015; partially offset by• no debt issuances in fiscal 2016 compared with the issuance of $400 million in short-term debt in fiscal 2015;
and• the repayment of the $400 million short-term debt in fiscal 2016.
26
Net cash used for financing activities during fiscal 2015 decreased $517 million compared with fiscal 2014, primarily due to the following:• $400 million proceeds from the issuance of short-term debt in fiscal 2015; and• $164 million less repurchases of common stock; partially offset by• $4 million net cash out flows for fiscal 2015 compared with $38 million net cash inflows for fiscal 2014 related to
issuance under share-based compensation plans and withholding tax payments related to vesting of stock units.
Free Cash FlowFree cash flow is a non-GAAP financial measure. We believe free cash flow is an important metric because it represents a measure of how much cash a company has available for discretionary and non-discretionary items after the deduction of capital expenditures, as we require regular capital expenditures to build and maintain stores and purchase new equipment and invest in technology to improve our business. We use this metric internally, as we believe our sustained ability to generate free cash flow is an important driver of value creation. However, this non-GAAP financial measure is not intended to supersede or replace our GAAP result.
The following table reconciles free cash flow, a non-GAAP financial measure, from net cash provided by operating activities, a GAAP financial measure.
Fiscal Year($ in millions) 2016 2015 2014Net cash provided by operating activities $ 1,719 $ 1,594 $ 2,129Less: Purchases of property and equipment (524) (726) (714)Free cash flow $ 1,195 $ 868 $ 1,415
Debt and Credit FacilitiesCertain financial information about the Company's debt and credit facilities is set forth under the headings "Debt" and "Credit Facilities" in Notes 5 and 6, respectively, of Notes to Consolidated Financial Statements included in Item 8 of this Form 10-K.
Dividend PolicyIn determining whether and at what level to declare a dividend, we consider a number of factors including sustainability, operating performance, liquidity, and market conditions.
We paid an annual dividend of $0.92 per share in fiscal 2016 and fiscal 2015. We plan to pay an annual dividend of $0.92 per share in fiscal 2017.
Share RepurchasesCertain financial information about the Company's share repurchases is set forth under the heading "Share Repurchases" in Note 9 of Notes to Consolidated Financial Statements included in Item 8 of this Form 10-K.
In fiscal 2017, the Company intends to re-initiate share repurchases under its existing $1 billion share repurchase authorization.
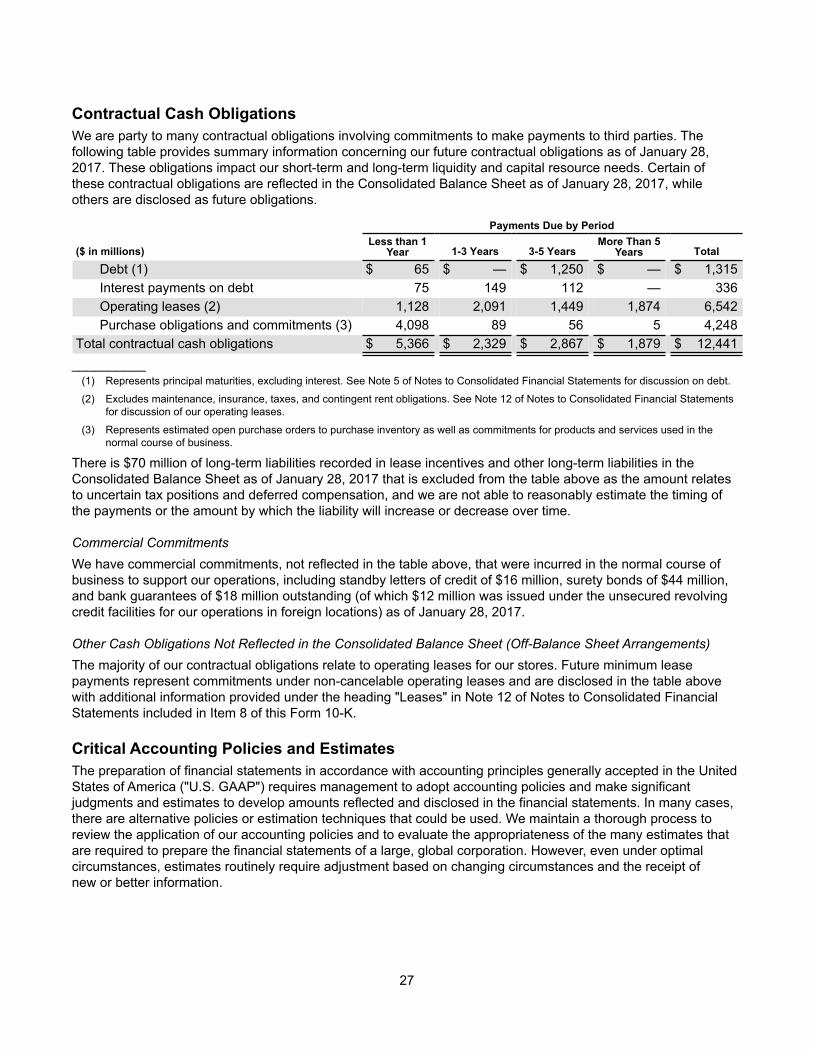
27
Contractual Cash ObligationsWe are party to many contractual obligations involving commitments to make payments to third parties. The following table provides summary information concerning our future contractual obligations as of January 28, 2017. These obligations impact our short-term and long-term liquidity and capital resource needs. Certain of these contractual obligations are reflected in the Consolidated Balance Sheet as of January 28, 2017, while others are disclosed as future obligations.
Payments Due by Period
($ in millions)Less than 1
Year 1-3 Years 3-5 YearsMore Than 5
Years Total
Debt (1) $ 65 $ — $ 1,250 $ — $ 1,315Interest payments on debt 75 149 112 — 336Operating leases (2) 1,128 2,091 1,449 1,874 6,542Purchase obligations and commitments (3) 4,098 89 56 5 4,248
Total contractual cash obligations $ 5,366 $ 2,329 $ 2,867 $ 1,879 $ 12,441__________
(1) Represents principal maturities, excluding interest. See Note 5 of Notes to Consolidated Financial Statements for discussion on debt.
(2) Excludes maintenance, insurance, taxes, and contingent rent obligations. See Note 12 of Notes to Consolidated Financial Statements for discussion of our operating leases.
(3) Represents estimated open purchase orders to purchase inventory as well as commitments for products and services used in the normal course of business.
There is $70 million of long-term liabilities recorded in lease incentives and other long-term liabilities in the Consolidated Balance Sheet as of January 28, 2017 that is excluded from the table above as the amount relates to uncertain tax positions and deferred compensation, and we are not able to reasonably estimate the timing of the payments or the amount by which the liability will increase or decrease over time.
Commercial CommitmentsWe have commercial commitments, not reflected in the table above, that were incurred in the normal course of business to support our operations, including standby letters of credit of $16 million, surety bonds of $44 million, and bank guarantees of $18 million outstanding (of which $12 million was issued under the unsecured revolving credit facilities for our operations in foreign locations) as of January 28, 2017.
Other Cash Obligations Not Reflected in the Consolidated Balance Sheet (Off-Balance Sheet Arrangements)The majority of our contractual obligations relate to operating leases for our stores. Future minimum lease payments represent commitments under non-cancelable operating leases and are disclosed in the table above with additional information provided under the heading "Leases" in Note 12 of Notes to Consolidated Financial Statements included in Item 8 of this Form 10-K.
Critical Accounting Policies and EstimatesThe preparation of financial statements in accordance with accounting principles generally accepted in the United States of America ("U.S. GAAP") requires management to adopt accounting policies and make significant judgments and estimates to develop amounts reflected and disclosed in the financial statements. In many cases, there are alternative policies or estimation techniques that could be used. We maintain a thorough process to review the application of our accounting policies and to evaluate the appropriateness of the many estimates that are required to prepare the financial statements of a large, global corporation. However, even under optimal circumstances, estimates routinely require adjustment based on changing circumstances and the receipt of new or better information.
28
Our significant accounting policies can be found under the heading "Organization and Summary of Significant Accounting Policies" in Note 1 of Notes to Consolidated Financial Statements included in Item 8 of this Form 10-K. The policies and estimates discussed below include the financial statement elements that are either judgmental or involve the selection or application of alternative accounting policies and are material to our financial statements. Management has discussed the development and selection of these critical accounting policies and estimates with the Audit and Finance Committee of our Board of Directors, which has reviewed our disclosure relating to critical accounting policies and estimates in this annual report on Form 10-K.
Merchandise InventoryWe value inventory at the lower of cost or market (“LCM”), with cost determined using the weighted-average cost method and market value determined based on the estimated net realizable value. We review our inventory levels in order to identify slow-moving merchandise and broken assortments (items no longer in stock in a sufficient range of sizes or colors), and we primarily use promotions and markdowns to clear merchandise. We record an adjustment to inventory when future estimated selling price is less than cost. Our LCM adjustment calculation requires management to make assumptions to estimate the selling price and amount of slow-moving merchandise and broken assortments subject to markdowns, which is dependent upon factors such as historical trends with similar merchandise, inventory aging, forecasted consumer demand, and the promotional environment. In addition, we estimate and accrue shortage for the period between the last physical count and the balance sheet date. Our shortage estimate can be affected by changes in merchandise mix and changes in actual shortage trends. Historically, actual shortage has not differed materially from our estimates.
We do not believe there is a reasonable likelihood that there will be a material change in the future estimates or assumptions we use to calculate our LCM or inventory shortage adjustments. However, if estimates regarding consumer demand are inaccurate or actual physical inventory shortage differs significantly from our estimate, our operating results could be affected. We have not made any material changes in the accounting methodology used to calculate our LCM or inventory shortage adjustments in the past three fiscal years.
Impairment of Long-Lived Assets, Goodwill, and Intangible AssetsWe review the carrying amount of long-lived assets for impairment whenever events or changes in circumstances indicate that the carrying amount of an asset or asset group may not be recoverable. Events that result in an impairment review include a significant decrease in the operating performance of the long-lived asset, or the decision to close a store, corporate facility, or distribution center. Long-lived assets are considered impaired if the carrying amount exceeds the estimated undiscounted future cash flows of the asset or asset group. For impaired assets, we recognize a loss equal to the difference between the carrying amount of the asset or asset group and its estimated fair value. The estimated fair value of the asset or asset group is based on estimated discounted future cash flows of the asset or asset group using a discount rate commensurate with the related risk. The asset group is defined as the lowest level for which identifiable cash flows are available and largely independent of the cash flows of other groups of assets. The asset group for our retail stores is reviewed for impairment primarily at the store level. Our estimate of future cash flows requires management to make assumptions and to apply judgment, including forecasting future sales and expenses and estimating useful lives of the assets. These estimates can be affected by factors such as future store results, real estate demand, and economic conditions that can be difficult to predict. We have not made any material changes in the methodology to assess and calculate impairment of long-lived assets in the past three fiscal years. We recorded a charge for the impairment of long-lived assets of $107 million, $54 million, and $10 million for fiscal 2016, 2015, and 2014, respectively.
We also review the carrying amount of goodwill and other indefinite-lived intangible assets for impairment annually in the fourth quarter of the fiscal year and whenever events or changes in circumstances indicate that it is more likely than not that the carrying amount may not be recoverable. Events that result in an impairment review include significant changes in the business climate, declines in our operating results, or an expectation that the carrying amount may not be recoverable.
29
In connection with the acquisitions of Athleta in September 2008 and Intermix in December 2012, we allocated $99 million and $81 million of the respective purchase prices to goodwill. Goodwill is reviewed for impairment using the applicable reporting unit, which is an operating segment or a business unit one level below that operating segment for which discrete financial information is prepared and regularly reviewed by segment management. We have deemed Athleta and Intermix to be the reporting units at which goodwill is tested for Athleta and Intermix, respectively.
We review goodwill for impairment by first assessing qualitative factors to determine whether it is more likely than not that the fair value of the reporting unit is less than its carrying amount, including goodwill, as a basis for determining whether it is necessary to perform the two-step goodwill impairment test. If it is determined that it is more likely than not that the fair value of the reporting unit is less than its carrying amount, the two-step test is performed to identify potential goodwill impairment. If it is determined that it is not more likely than not that the fair value of the reporting unit is less than its carrying amount, it is unnecessary to perform the two-step goodwill impairment test. During the fourth quarter of fiscal 2016, we determined that the fair value of the reporting unit for Athleta significantly exceeded its carrying amount as of the date of our annual impairment review and therefore, we did not recognize any impairment charges for Athleta.
Based on certain circumstances, we may elect to bypass the qualitative assessment and proceed directly to performing the first step of the two-step goodwill impairment test. The first step of the two-step goodwill impairment test compares the fair value of the reporting unit to its carrying amount, including goodwill. The second step includes hypothetically valuing all of the assets and liabilities of the reporting unit as if the reporting unit had been acquired in a business combination. Then, the implied fair value of the reporting unit’s goodwill is compared to the carrying amount of that goodwill. If the carrying amount of the reporting unit’s goodwill exceeds the implied fair value of the goodwill, we recognize an impairment loss in an amount equal to the excess, not to exceed the carrying amount.
At the end of each of the first three quarters of fiscal 2016, given the information available at the time of those assessments, we determined that there were no events or circumstances that indicated any impairment for goodwill related to Intermix. During the fourth quarter of fiscal 2016, management updated the fiscal 2017 budget and financial projections beyond fiscal 2017 for Intermix. There were several factors that caused the financial projections and estimates to significantly decrease from the previous estimates, which included: poor fourth quarter of fiscal 2016 holiday performance at Intermix stores, the decision to reduce expected future store openings, the approval of additional store closures in fiscal 2017, and the budgeting of additional headcount required to support increased focus on the online business. These factors arising during the fourth quarter of fiscal 2016 had a significant and negative impact on the estimated fair value of the Intermix reporting unit, and we have determined that the Intermix reporting unit’s carrying value exceeded its fair value as of the date of our annual impairment review. As such, we performed the second step of the goodwill impairment test which resulted in an impairment charge of $71 million for goodwill related to Intermix in fiscal 2016. This impairment charge reduced the $81 million of purchase price allocated to goodwill in connection with the acquisition of Intermix in December 2012 to $10 million as of January 28, 2017.
We did not recognize any impairment charges for goodwill in fiscal 2015.
As of January 28, 2017, the aggregate carrying value of trade names was $95 million, which primarily consisted of $54 million and $38 million related to Athleta and Intermix, respectively. A trade name is considered impaired if the carrying amount exceeds its estimated fair value. If a trade name is considered impaired, we recognize a loss equal to the difference between the carrying amount and the estimated fair value of the trade name. The fair value of the trade names is determined using the relief from royalty method. During the fourth quarter of fiscal 2016, we completed our annual impairment review of the trade names and we did not recognize any impairment charges. We determined that the fair value of the Athleta trade name significantly exceeded its carrying amount as of the date of our annual impairment review. The fair value of the Intermix trade name exceeded its carrying amount by less than 10 percent as of the date of our annual impairment review.
These analyses require management to make assumptions and to apply judgment, including forecasting future sales and expenses, and selecting appropriate discount rates and royalty rates, which can be affected by economic conditions and other factors that can be difficult to predict.
30
If actual store and online results and brand performance, real estate market conditions, and economic conditions including interest rates are not consistent with our estimates and assumptions used in our calculations, we may be exposed to additional impairment losses that could be material.
Revenue RecognitionWhile revenue recognition for the Company does not involve significant judgment, it represents an important accounting policy. We recognize revenue and the related cost of goods sold at the time the products are received by the customers. For sales transacted at stores, revenue is recognized when the customer receives and pays for the merchandise at the register. For sales where we ship the merchandise to the customer from a distribution center or store, revenue is recognized at the time we estimate the customer receives the merchandise.
We sell merchandise to franchisees under multi-year franchise agreements. We recognize revenue from sales to franchisees at the time merchandise ownership is transferred to the franchisee, which generally occurs when the merchandise reaches the franchisee’s predesignated turnover point. We also receive royalties from franchisees primarily based on a percentage of the total merchandise purchased by the franchisee, net of any refunds or credits due them. Royalty revenue is recognized primarily when merchandise ownership is transferred to the franchisee.
We record an allowance for estimated returns based on our historical return patterns and various other assumptions that management believes to be reasonable. We do not believe there is a reasonable likelihood that there will be a material change in the future estimates or assumptions we use to calculate our sales return allowance. However, if the actual rate of sales returns increases significantly, our operating results could be adversely affected. We have not made any material changes in the accounting methodology used to estimate future sales returns in the past three fiscal years.
See Note 1 of Notes to Consolidated Financial Statements included in Item 8 of this Form 10-K for recent accounting pronouncements related to revenue recognition and expected impact from the adoption of new standards.
Unredeemed Gift Cards, Gift Certificates, and Credit VouchersUpon issuance of a gift card, gift certificate, or credit voucher, a liability is established for its cash value. The liability is relieved and net sales are recorded upon redemption by the customer. Over time, some portion of these instruments is not redeemed (“breakage”). Based on historical redemption patterns, we determine breakage income for gift cards, gift certificates, and credit vouchers when we can determine the portion of the liability where redemption is remote, which is three years after issuance. Breakage income, which has been historically immaterial, is recorded in other income which is a component of operating expenses in the Consolidated Statements of Income. When breakage income is recorded, a liability is recognized for any legal obligation to remit the unredeemed portion to relevant jurisdictions. Substantially all of our gift cards, gift certificates, and credit vouchers have no expiration dates.
We do not believe there is a reasonable likelihood that there will be a material change in the future estimates or assumptions we use to calculate our breakage income. However, if the actual pattern of redemption for gift cards, gift certificates, and credit vouchers changes significantly, our operating results could be adversely affected. We have not made any material changes in the accounting methodology used to estimate breakage in the past three fiscal years. See Note 1 of Notes to Consolidated Financial Statements included in Item 8 of this Form 10-K for recent accounting pronouncements related to revenue recognition and expected impact on recognition of breakage income from the adoption of new standards.
31
Income TaxesWe record a valuation allowance against our deferred tax assets when it is more likely than not that some portion or all of such deferred tax assets will not be realized. In determining the need for a valuation allowance, management is required to make assumptions and to apply judgment, including forecasting future income, taxable income, and the mix of income or losses in the jurisdictions in which we operate. Our effective tax rate in a given financial statement period may also be materially impacted by changes in the mix and level of income or losses, changes in the expected outcome of audits, or changes in the deferred tax valuation allowance.
At any point in time, many tax years are subject to or in the process of being audited by various taxing authorities. To the extent our estimates of settlements change or the final tax outcome of these matters is different from the amounts recorded, such differences will impact the income tax provision in the period in which such determinations are made. Our income tax expense includes changes in our estimated liability for exposures associated with our various tax filing positions. Determining the income tax expense for these potential assessments requires management to make assumptions that are subject to factors such as proposed assessments by tax authorities, changes in facts and circumstances, issuance of new regulations, and resolution of tax audits.
We believe the judgments and estimates discussed above are reasonable. However, if actual results are not consistent with our estimates or assumptions, we may be exposed to losses or gains that could be material.
Recent Accounting PronouncementsSee "Organization and Summary of Significant Accounting Policies" in Note 1 of Notes to Consolidated Financial Statements included in Item 8 of this Form 10-K for recent accounting pronouncements, including the expected dates of adoption and estimated effects on our Consolidated Financial Statements.
Item 7A. Quantitative and Qualitative Disclosures About Market Risk.Derivative Financial InstrumentsCertain financial information about the Company's derivative financial instruments is set forth under the heading "Derivative Financial Instruments" in Note 8 of Notes to Consolidated Financial Statements included in Item 8 of this Form 10-K.
We have performed a sensitivity analysis as of January 28, 2017 based on a model that measures the impact of a hypothetical 10 percent adverse change in foreign currency exchange rates to U.S. dollars (with all other variables held constant) on our underlying estimated major foreign currency exposures, net of derivative financial instruments. The foreign currency exchange rates used in the model were based on the spot rates in effect as of January 28, 2017. The sensitivity analysis indicated that a hypothetical 10 percent adverse movement in foreign currency exchange rates would have an unfavorable impact on the underlying cash flow, net of our foreign exchange derivative financial instruments, of $35 million as of January 28, 2017.
DebtCertain financial information about the Company's debt is set forth under the heading "Debt" in Note 5 of Notes to Consolidated Financial Statements included in Item 8 of this Form 10-K.
Our $1.25 billion aggregate principal amount of 5.95 percent notes due April 2021 are not subject to interest rate risk as they have a fixed interest rate.
A final repayment of 7.5 billion Japanese yen ($65 million as of January 28, 2017) for the 15 billion Japanese yen, four-year, unsecured Japan Term Loan is payable on January 15, 2018. The average interest rate associated with the Japan Term Loan for fiscal 2016 was 1 percent. Due to the maturity of the Japan Term Loan in fiscal 2017, we believe we have no material exposure to interest rate risk.

32
Cash EquivalentsWe have highly liquid fixed and variable income investments classified as cash equivalents, which are placed primarily in time deposits, money market funds, and commercial paper. We value these investments at their original purchase prices plus interest that has accrued at the stated rate. The value of our investments is not subject to material interest rate risk. However, changes in interest rates would impact the interest income derived from our investments. We earned interest income of $8 million in fiscal 2016.
33
Item 8. Financial Statements and Supplementary Data.
THE GAP, INC.INDEX TO CONSOLIDATED FINANCIAL STATEMENTS
Page
Report of Independent Registered Public Accounting Firm
Consolidated Balance Sheets as of January 28, 2017 and January 30, 2016
Consolidated Statements of Income for the fiscal years ended January 28, 2017, January 30, 2016, and January 31, 2015
Consolidated Statements of Comprehensive Income for the fiscal years ended January 28, 2017, January 30, 2016, and January 31, 2015
Consolidated Statements of Stockholders' Equity for the fiscal years ended January 28, 2017, January 30, 2016, and January 31, 2015
Consolidated Statements of Cash Flows for the fiscal years ended January 28, 2017, January 30, 2016, and January 31, 2015
Notes to Consolidated Financial Statements
34
35
36
37
38
39
40
34
Report of Independent Registered Public Accounting Firm To the Board of Directors and Stockholders of The Gap, Inc.:We have audited the accompanying consolidated balance sheets of The Gap, Inc. and its subsidiaries (the "Company") as of January 28, 2017 and January 30, 2016, and the related consolidated statements of income, comprehensive income, stockholders' equity, and cash flows, for each of the three fiscal years in the period ended January 28, 2017. We also have audited the Company's internal control over financial reporting as of January 28, 2017 based on criteria established in Internal Control - Integrated Framework (2013) issued by the Committee of Sponsoring Organizations of the Treadway Commission. The Company's management is responsible for these financial statements, for maintaining effective internal control over financial reporting, and for its assessment of the effectiveness of internal control over financial reporting, included in the accompanying Management's Report on Internal Control over Financial Reporting. Our responsibility is to express an opinion on these financial statements and an opinion on the Company's internal control over financial reporting based on our audits.We conducted our audits in accordance with the standards of the Public Company Accounting Oversight Board (United States). Those standards require that we plan and perform the audit to obtain reasonable assurance about whether the financial statements are free of material misstatement and whether effective internal control over financial reporting was maintained in all material respects. Our audits of the financial statements included examining, on a test basis, evidence supporting the amounts and disclosures in the financial statements, assessing the accounting principles used and significant estimates made by management, and evaluating the overall financial statement presentation. Our audit of internal control over financial reporting included obtaining an understanding of internal control over financial reporting, assessing the risk that a material weakness exists, and testing and evaluating the design and operating effectiveness of internal control based on the assessed risk. Our audits also included performing such other procedures as we considered necessary in the circumstances. We believe that our audits provide a reasonable basis for our opinions.A company's internal control over financial reporting is a process designed by, or under the supervision of, the company's principal executive and principal financial officers, or persons performing similar functions, and effected by the company's board of directors, management, and other personnel to provide reasonable assurance regarding the reliability of financial reporting and the preparation of financial statements for external purposes in accordance with generally accepted accounting principles. A company's internal control over financial reporting includes those policies and procedures that (1) pertain to the maintenance of records that, in reasonable detail, accurately and fairly reflect the transactions and dispositions of the assets of the company; (2) provide reasonable assurance that transactions are recorded as necessary to permit preparation of financial statements in accordance with generally accepted accounting principles, and that receipts and expenditures of the company are being made only in accordance with authorizations of management and directors of the company; and (3) provide reasonable assurance regarding prevention or timely detection of unauthorized acquisition, use, or disposition of the company's assets that could have a material effect on the financial statements.Because of the inherent limitations of internal control over financial reporting, including the possibility of collusion or improper management override of controls, material misstatements due to error or fraud may not be prevented or detected on a timely basis. Also, projections of any evaluation of the effectiveness of the internal control over financial reporting to future periods are subject to the risk that the controls may become inadequate because of changes in conditions, or that the degree of compliance with the policies or procedures may deteriorate.In our opinion, the consolidated financial statements referred to above present fairly, in all material respects, the financial position of The Gap, Inc. and its subsidiaries as of January 28, 2017 and January 30, 2016, and the results of their operations and their cash flows for each of the three fiscal years in the period ended January 28, 2017, in conformity with accounting principles generally accepted in the United States of America. Also, in our opinion, the Company maintained, in all material respects, effective internal control over financial reporting as of January 28, 2017, based on the criteria established in Internal Control - Integrated Framework (2013) issued by the Committee of Sponsoring Organizations of the Treadway Commission.
/s/ Deloitte & Touche LLP
San Francisco, California March 20, 2017
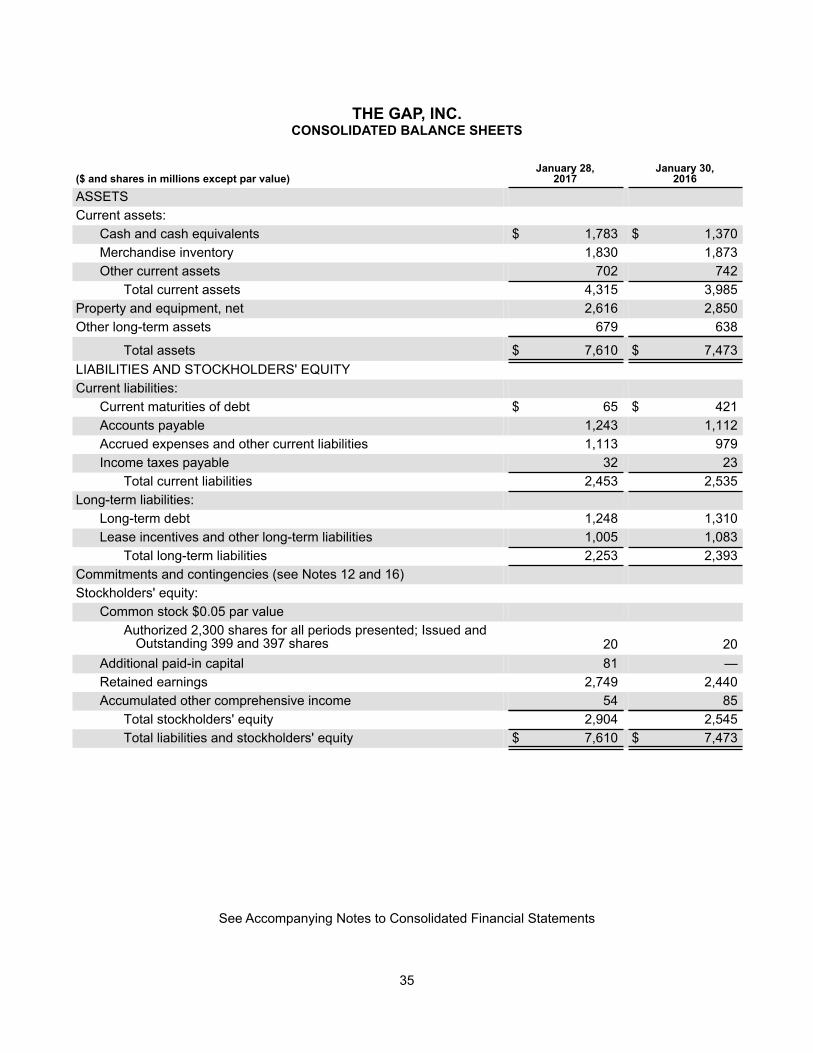
35
THE GAP, INC.CONSOLIDATED BALANCE SHEETS
($ and shares in millions except par value)January 28,
2017January 30,
2016
ASSETSCurrent assets:
Cash and cash equivalents $ 1,783 $ 1,370Merchandise inventory 1,830 1,873Other current assets 702 742
Total current assets 4,315 3,985Property and equipment, net 2,616 2,850Other long-term assets 679 638
Total assets $ 7,610 $ 7,473LIABILITIES AND STOCKHOLDERS' EQUITYCurrent liabilities:
Current maturities of debt $ 65 $ 421Accounts payable 1,243 1,112Accrued expenses and other current liabilities 1,113 979Income taxes payable 32 23
Total current liabilities 2,453 2,535Long-term liabilities:
Long-term debt 1,248 1,310Lease incentives and other long-term liabilities 1,005 1,083
Total long-term liabilities 2,253 2,393Commitments and contingencies (see Notes 12 and 16)Stockholders' equity:
Common stock $0.05 par valueAuthorized 2,300 shares for all periods presented; Issued and
Outstanding 399 and 397 shares 20 20Additional paid-in capital 81 —Retained earnings 2,749 2,440Accumulated other comprehensive income 54 85
Total stockholders' equity 2,904 2,545Total liabilities and stockholders' equity $ 7,610 $ 7,473
See Accompanying Notes to Consolidated Financial Statements
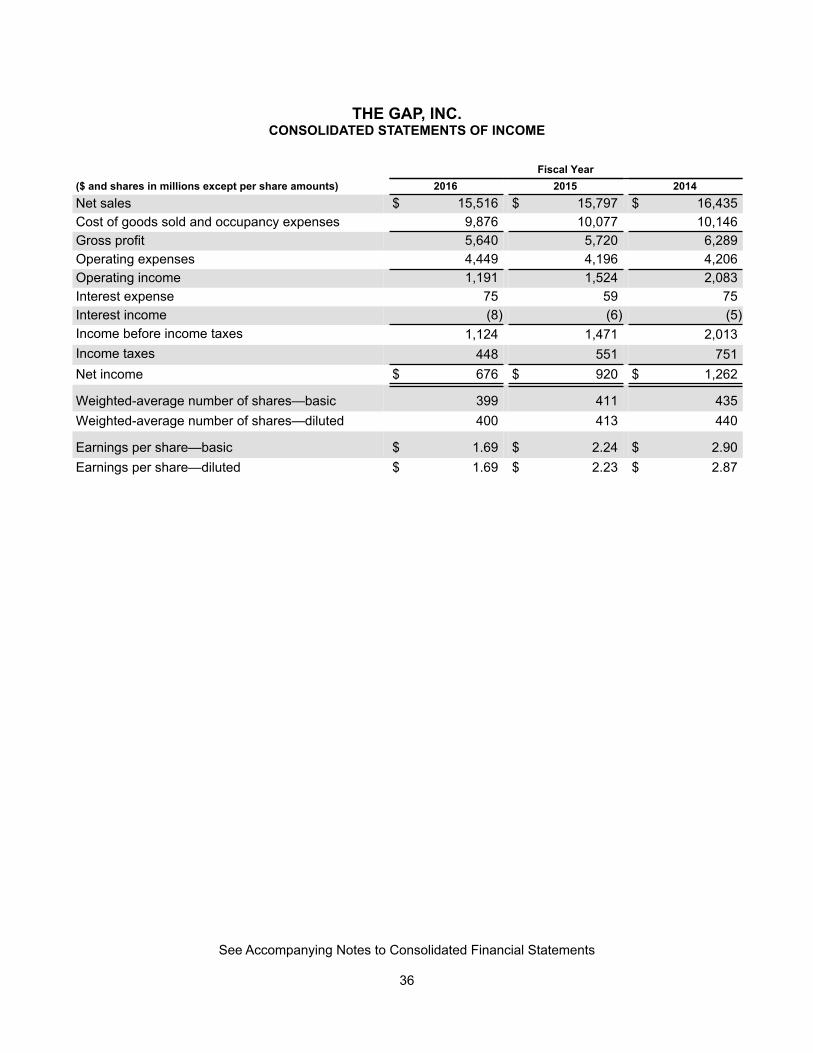
36
THE GAP, INC.CONSOLIDATED STATEMENTS OF INCOME
Fiscal Year($ and shares in millions except per share amounts) 2016 2015 2014Net sales $ 15,516 $ 15,797 $ 16,435Cost of goods sold and occupancy expenses 9,876 10,077 10,146Gross profit 5,640 5,720 6,289Operating expenses 4,449 4,196 4,206Operating income 1,191 1,524 2,083Interest expense 75 59 75Interest income (8) (6) (5)Income before income taxes 1,124 1,471 2,013Income taxes 448 551 751Net income $ 676 $ 920 $ 1,262
Weighted-average number of shares—basic 399 411 435Weighted-average number of shares—diluted 400 413 440
Earnings per share—basic $ 1.69 $ 2.24 $ 2.90Earnings per share—diluted $ 1.69 $ 2.23 $ 2.87
See Accompanying Notes to Consolidated Financial Statements
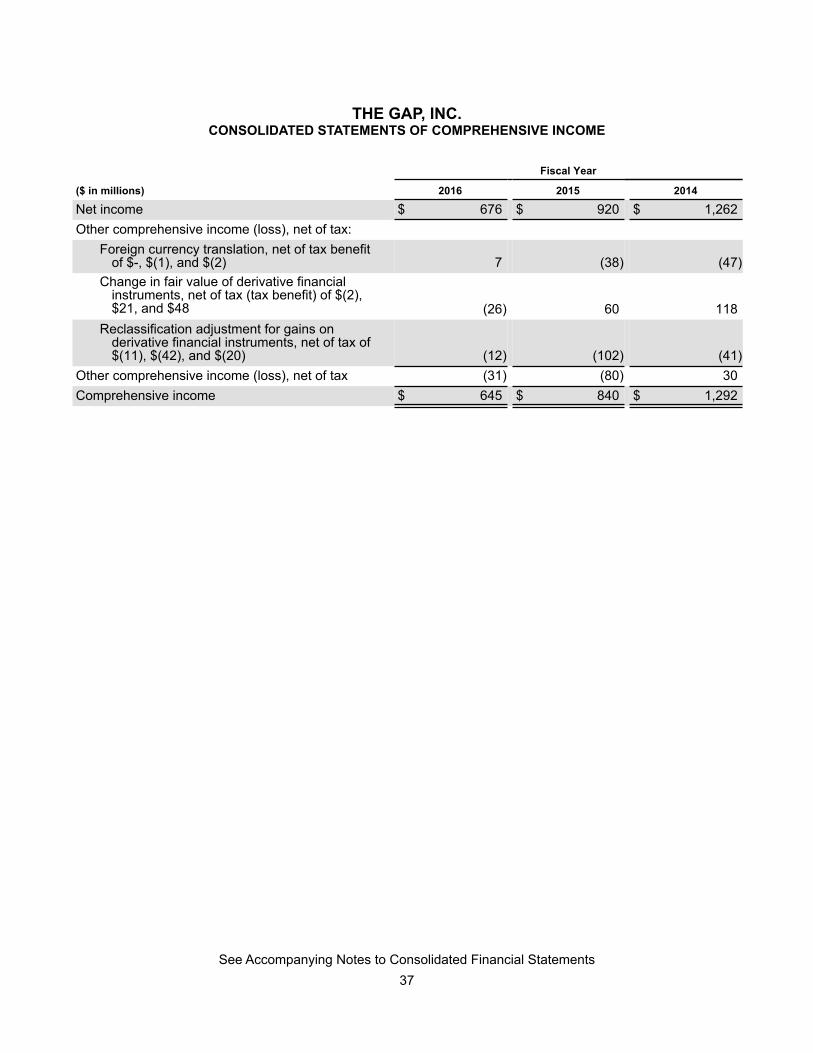
37
THE GAP, INC.CONSOLIDATED STATEMENTS OF COMPREHENSIVE INCOME
Fiscal Year
($ in millions) 2016 2015 2014
Net income $ 676 $ 920 $ 1,262Other comprehensive income (loss), net of tax:
Foreign currency translation, net of tax benefitof $-, $(1), and $(2) 7 (38) (47)
Change in fair value of derivative financialinstruments, net of tax (tax benefit) of $(2),$21, and $48 (26) 60 118
Reclassification adjustment for gains onderivative financial instruments, net of tax of$(11), $(42), and $(20) (12) (102) (41)
Other comprehensive income (loss), net of tax (31) (80) 30Comprehensive income $ 645 $ 840 $ 1,292
See Accompanying Notes to Consolidated Financial Statements
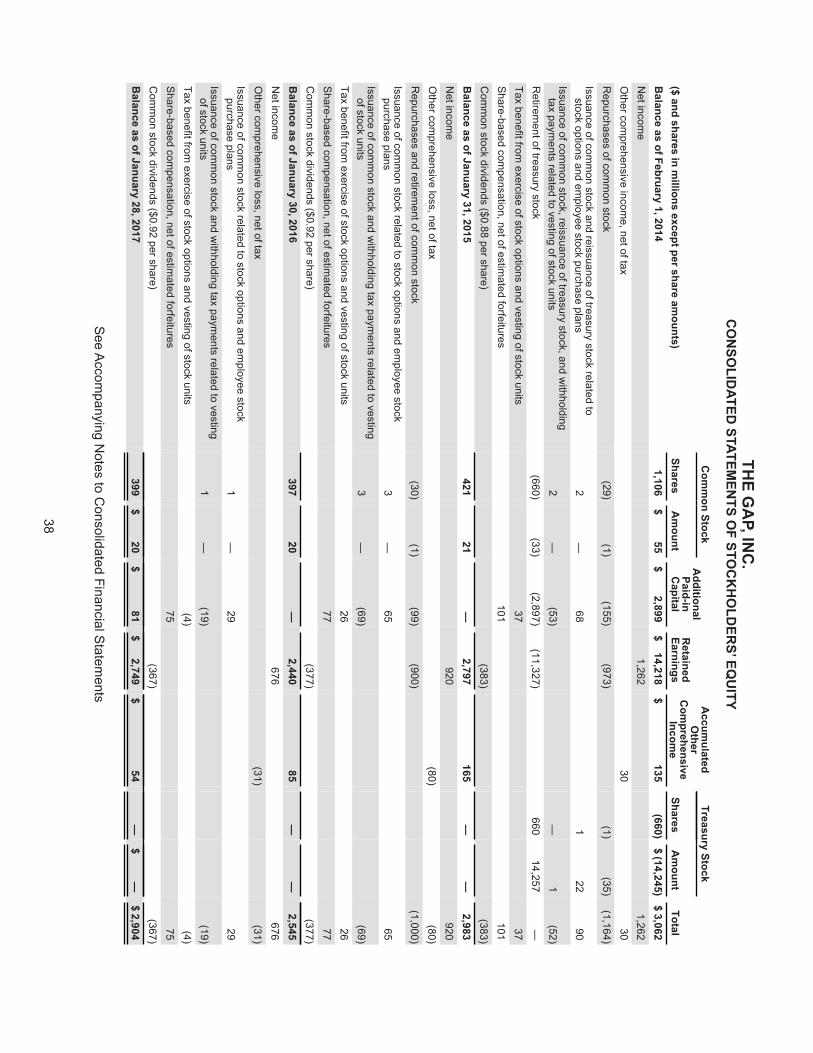
38
THE G
AP, IN
C.
CO
NSO
LIDATED
STATEMEN
TS OF STO
CK
HO
LDER
S’ EQU
ITY
C
omm
on StockA
dditionalPaid-in C
apitalR
etained Earnings
Accum
ulated O
ther C
omprehensive Incom
e
Treasury Stock
($ and shares in millions except per share am
ounts) Shares
Am
ount Shares
Am
ount Total
Balance as of February 1, 2014
1,106 $
55 $
2,899$
14,218$
135(660) $ (14,245) $ 3,062
Net incom
e1,262
1,262O
ther comprehensive incom
e, net of tax30
30R
epurchases of comm
on stock (29)
(1)(155) (973)
(1) (35)
(1,164)Issuance of com
mon stock and reissuance of treasury stock related to
stock options and employee stock purchase plans
2—
68
122
90Issuance of com
mon stock, reissuance of treasury stock, and w
ithholdingtax paym
ents related to vesting of stock units2
—(53)
— 1 (52)
Retirem
ent of treasury stock(660)
(33) (2,897)
(11,327) 660
14,257 —
Tax benefit from exercise of stock options and vesting of stock units
3737
Share-based com
pensation, net of estimated forfeitures
101101
Com
mon stock dividends ($0.88 per share)
(383)(383)
Balance as of January 31, 2015
421 21
—2,797
165—
—
2,983
Net incom
e920
920O
ther comprehensive loss, net of tax
(80)(80)
Repurchases and retirem
ent of comm
on stock(30) (1)
(99) (900)
(1,000)Issuance of com
mon stock related to stock options and em
ployee stockpurchase plans
3—
65
65Issuance of com
mon stock and w
ithholding tax payments related to vesting
of stock units3
—(69)
(69)Tax benefit from
exercise of stock options and vesting of stock units26
26S
hare-based compensation, net of estim
ated forfeitures77
77C
omm
on stock dividends ($0.92 per share)(377)
(377)B
alance as of January 30, 2016397
20 —
2,44085
—
—
2,545N
et income
676676
Other com
prehensive loss, net of tax(31)
(31)Issuance of com
mon stock related to stock options and em
ployee stockpurchase plans
1—
29
29Issuance of com
mon stock and w
ithholding tax payments related to vesting
of stock units1
—(19)
(19)Tax benefit from
exercise of stock options and vesting of stock units(4)
(4)S
hare-based compensation, net of estim
ated forfeitures75
75C
omm
on stock dividends ($0.92 per share)(367)
(367)B
alance as of January 28, 2017399
$
20$
81$
2,749$
54 —
$ —
$2,904
See A
ccompanying N
otes to Consolidated Financial S
tatements
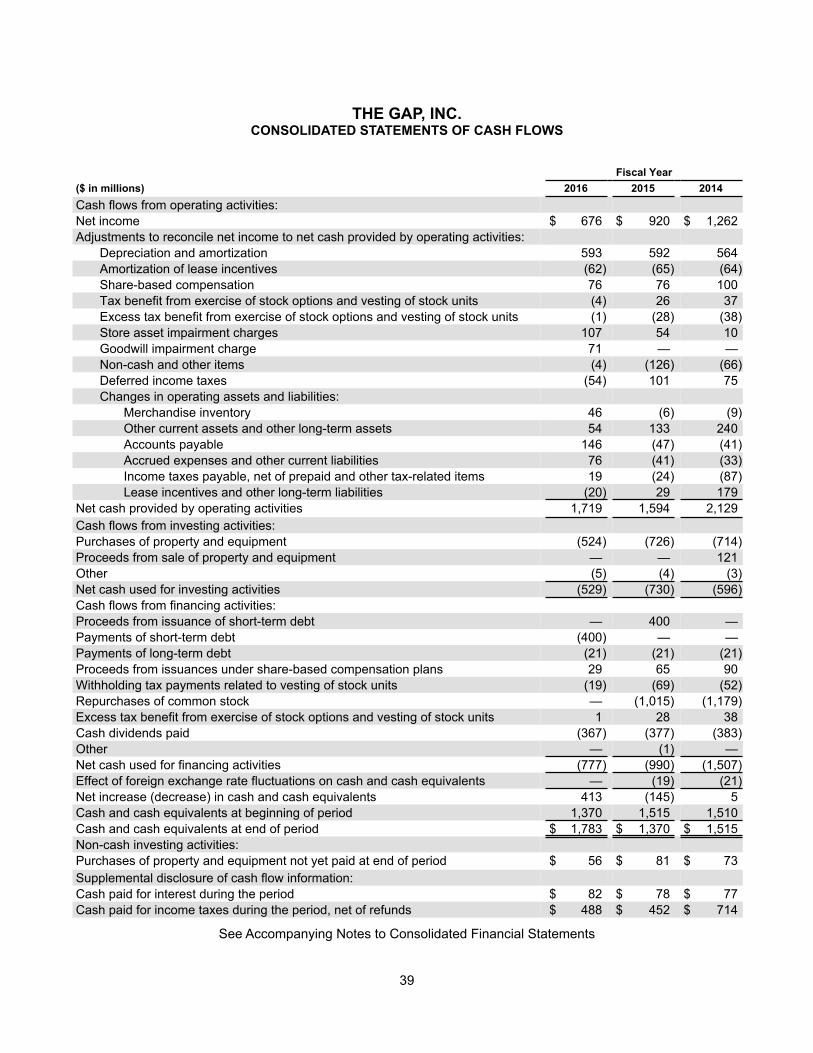
39
THE GAP, INC.CONSOLIDATED STATEMENTS OF CASH FLOWS
Fiscal Year($ in millions) 2016 2015 2014Cash flows from operating activities:Net income $ 676 $ 920 $ 1,262Adjustments to reconcile net income to net cash provided by operating activities:
Depreciation and amortization 593 592 564Amortization of lease incentives (62) (65) (64)Share-based compensation 76 76 100Tax benefit from exercise of stock options and vesting of stock units (4) 26 37Excess tax benefit from exercise of stock options and vesting of stock units (1) (28) (38)Store asset impairment charges 107 54 10Goodwill impairment charge 71 — —Non-cash and other items (4) (126) (66)Deferred income taxes (54) 101 75Changes in operating assets and liabilities:
Merchandise inventory 46 (6) (9)Other current assets and other long-term assets 54 133 240Accounts payable 146 (47) (41)Accrued expenses and other current liabilities 76 (41) (33)Income taxes payable, net of prepaid and other tax-related items 19 (24) (87)Lease incentives and other long-term liabilities (20) 29 179
Net cash provided by operating activities 1,719 1,594 2,129Cash flows from investing activities:Purchases of property and equipment (524) (726) (714)Proceeds from sale of property and equipment — — 121Other (5) (4) (3)Net cash used for investing activities (529) (730) (596)Cash flows from financing activities:Proceeds from issuance of short-term debt — 400 —Payments of short-term debt (400) — —Payments of long-term debt (21) (21) (21)Proceeds from issuances under share-based compensation plans 29 65 90Withholding tax payments related to vesting of stock units (19) (69) (52)Repurchases of common stock — (1,015) (1,179)Excess tax benefit from exercise of stock options and vesting of stock units 1 28 38Cash dividends paid (367) (377) (383)Other — (1) —Net cash used for financing activities (777) (990) (1,507)Effect of foreign exchange rate fluctuations on cash and cash equivalents — (19) (21)Net increase (decrease) in cash and cash equivalents 413 (145) 5Cash and cash equivalents at beginning of period 1,370 1,515 1,510Cash and cash equivalents at end of period $ 1,783 $ 1,370 $ 1,515Non-cash investing activities:Purchases of property and equipment not yet paid at end of period $ 56 $ 81 $ 73Supplemental disclosure of cash flow information:Cash paid for interest during the period $ 82 $ 78 $ 77Cash paid for income taxes during the period, net of refunds $ 488 $ 452 $ 714
See Accompanying Notes to Consolidated Financial Statements
40
Notes to Consolidated Financial StatementsFor the Fiscal Years Ended January 28, 2017, January 30, 2016, and January 31, 2015
Note 1. Organization and Summary of Significant Accounting PoliciesOrganizationThe Gap, Inc., a Delaware corporation, is a global omni-channel retailer offering apparel, accessories, and personal care products for men, women, and children under the Gap, Banana Republic, Old Navy, Athleta, and Intermix brands. We have Company-operated stores in the United States, Canada, the United Kingdom, France, Ireland, Japan, Italy, China, Hong Kong, Taiwan, and beginning in October 2015, Mexico. We also have franchise agreements with unaffiliated franchisees to operate Gap, Banana Republic, and Old Navy stores in approximately 40 other countries around the world. In addition, our products are available to customers online through Company-owned websites and through the use of third parties that provide logistics and fulfillment services. In December 2016, the Company acquired the net assets of Weddington Way, which does not have a material impact on our Consolidated Financial Statements.
Principles of ConsolidationThe Consolidated Financial Statements include the accounts of The Gap, Inc. and its subsidiaries. All intercompany transactions and balances have been eliminated.
Fiscal Year and PresentationOur fiscal year is a 52-week or 53-week period ending on the Saturday closest to January 31. The fiscal years ended January 28, 2017 (fiscal 2016), January 30, 2016 (fiscal 2015), and January 31, 2015 (fiscal 2014) consisted of 52 weeks. The fiscal year ending February 3, 2018 (fiscal 2017) will consist of 53 weeks.
Use of EstimatesThe preparation of financial statements in conformity with U.S. GAAP requires management to make estimates and assumptions that affect the reported amounts of assets and liabilities and disclosure of contingent assets and liabilities at the date of the financial statements and the reported amounts of revenue and expenses during the reporting period. Actual results could differ from those estimates.
Cash and Cash EquivalentsCash includes funds deposited in banks and amounts in transit from banks for customer credit card and debit card transactions that process in less than seven days.
All highly liquid investments with original maturities of 91 days or less are classified as cash equivalents. Our cash equivalents are placed primarily in time deposits and money market funds. We value these investments at their original purchase prices plus interest that has accrued at the stated rate. Income related to these securities is recorded in interest income in the Consolidated Statements of Income.
Merchandise InventoryWe value inventory at the lower of cost or market, with cost determined using the weighted-average cost method and market value determined based on the estimated net realizable value. We record an adjustment when future estimated selling price is less than cost. We review our inventory levels in order to identify slow-moving merchandise and broken assortments (items no longer in stock in a sufficient range of sizes or colors) and use promotions and markdowns to clear merchandise. In addition, we estimate and accrue shortage for the period between the last physical count and the balance sheet date.
Derivative Financial InstrumentsDerivative financial instruments are recorded at fair value in the Consolidated Balance Sheets as other current assets, other long-term assets, accrued expenses and other current liabilities, or lease incentives and other long-term liabilities.
41
For derivative financial instruments that are designated and qualify as cash flow hedges, the effective portion of the gain or loss on the derivative financial instruments is reported as a component of other comprehensive income (“OCI”) and is recognized in income in the period in which the underlying transaction impacts the income statement. For derivative financial instruments that are designated and qualify as net investment hedges, the effective portion of the gain or loss on the derivative financial instruments is reported as a component of OCI and is reclassified into income in the period or periods during which the hedged subsidiary is either sold or liquidated (or substantially liquidated). Gains and losses on the derivative financial instruments representing either hedge ineffectiveness or hedge components excluded from the assessment of effectiveness, if any, are recognized in current income. For derivative financial instruments not designated as hedging instruments, the gain or loss on the derivative financial instruments is recorded in operating expenses in the Consolidated Statements of Income. Cash flows from derivative financial instruments are classified as cash flows from operating activities in the Consolidated Statements of Cash Flows.
Property and EquipmentDepreciation is computed using the straight-line method over the estimated useful lives of the related assets. Estimated useful lives are as follows:
Category TermLeasehold improvements Shorter of remaining lease term or economic life, up to 15 yearsFurniture and equipment Up to 15 yearsSoftware 3 to 7 yearsBuildings and building improvements Up to 39 years
When assets are sold or retired, the cost and related accumulated depreciation are removed from the accounts, with any resulting gain or loss recorded in operating expenses in the Consolidated Statements of Income. Costs of maintenance and repairs are expensed as incurred.
Asset Retirement ObligationsAn asset retirement obligation represents a legal obligation associated with the retirement of a tangible long-lived asset that is incurred upon the acquisition, construction, development, or normal operation of that long-lived asset. The Company’s asset retirement obligations are primarily associated with leasehold improvements that we are contractually obligated to remove at the end of a lease to comply with the lease agreement. We recognize asset retirement obligations at the inception of a lease with such conditions if a reasonable estimate of fair value can be made. Asset retirement obligations are recorded in accrued expenses and other current liabilities and lease incentives and other long-term liabilities in the Consolidated Balance Sheets and are subsequently adjusted for changes in estimated asset retirement obligations. The associated estimated asset retirement costs are capitalized as part of the carrying amount of the long-lived asset and depreciated over its useful life.
Revenue RecognitionRevenue is recognized for sales transacted at stores when the customer receives and pays for the merchandise at the register. For sales where we ship the merchandise to the customer from a distribution center or store, revenue is recognized at the time we estimate the customer receives the product. Amounts related to shipping and handling that are billed to customers are recorded in net sales, and the related costs are recorded in cost of goods sold and occupancy expenses in the Consolidated Statements of Income. Revenues are presented net of estimated returns and any taxes collected from customers and remitted to governmental authorities. Allowances for estimated returns are recorded based on estimated margin using our historical return patterns.
42
We sell merchandise to franchisees under multi-year franchise agreements. We recognize revenue from sales to franchisees at the time merchandise ownership is transferred to the franchisee, which generally occurs when the merchandise reaches the franchisee’s predesignated turnover point. These sales are recorded in net sales, and the related cost of goods sold is recorded in cost of goods sold and occupancy expenses in the Consolidated Statements of Income. We also receive royalties from franchisees primarily based on a percentage of the total merchandise purchased by the franchisee, net of any refunds or credits due them. Royalty revenue is recognized primarily when merchandise ownership is transferred to the franchisee and is recorded in net sales in the Consolidated Statements of Income.
Classification of ExpensesCost of goods sold and occupancy expenses include the following:• the cost of merchandise;• inventory shortage and valuation adjustments;• freight charges;• online shipping and packaging costs;• costs associated with our sourcing operations, including payroll, benefits, and other administrative expenses; • gains and losses associated with foreign currency exchange contracts related to hedging of merchandise
purchases and intercompany revenue transactions; and• rent, occupancy, depreciation, and amortization related to our store operations, distribution centers, and certain
corporate functions.
Operating expenses include the following:• payroll, benefits, and other administrative expenses for our store operations and field management;• payroll, benefits, and other administrative expenses for our distribution centers;• payroll, benefits, and other administrative expenses for our corporate functions, including product design and
development;• marketing;• information technology maintenance costs and expenses;• rent, occupancy, depreciation, and amortization for our corporate facilities; • third party credit card processing fees; and• other expenses (income).
Payroll, benefits, and other administrative expenses for our distribution centers recorded in operating expenses were $254 million, $254 million, and $255 million in fiscal 2016, 2015, and 2014, respectively. We receive payments from third parties that provide our customers with private label credit cards and/or co-branded credit cards. The majority of such income earned is recorded in other income, which is a component of operating expenses, and the remaining portion of income is recognized as a reduction to cost of goods sold and occupancy expenses.
The classification of expenses varies across the apparel retail industry. Accordingly, our cost of goods sold and occupancy expenses and operating expenses may not be comparable to those of other companies.
43
Rent ExpenseMinimum rent expense is recognized over the term of the lease, starting when possession of the property is taken from the landlord, which normally includes a construction period prior to the store opening. When a lease contains a predetermined fixed escalation of the minimum rent, we recognize the related rent expense on a straight-line basis and record the difference between the recognized rent expense and the amounts payable under the lease as a short-term or long-term deferred rent liability. We also receive tenant allowances upon entering into certain leases, which are recorded as a short-term or long-term tenant allowance liability and amortized using the straight-line method as a reduction to rent expense over the term of the lease. Costs related to common area maintenance, insurance, real estate taxes, and other occupancy costs the Company is obligated to pay are excluded from minimum rent expense.
Certain leases provide for contingent rents that are not measurable at inception. These contingent rents are primarily based on a percentage of sales that are in excess of a predetermined level and/or rent increase based on a change in the consumer price index or fair market value. These amounts are excluded from minimum rent and are included in the determination of rent expense when it is probable that the expense has been incurred and the amount can be reasonably estimated.
Impairment of Long-Lived AssetsWe review the carrying amount of long-lived assets for impairment whenever events or changes in circumstances indicate that the carrying amount of an asset may not be recoverable. Events that result in an impairment review include a significant decrease in the operating performance of the long-lived asset, or the decision to close a store, corporate facility, or distribution center. Long-lived assets are considered impaired if the carrying amount exceeds the estimated undiscounted future cash flows of the asset or asset group. For impaired assets, we recognize a loss equal to the difference between the carrying amount of the asset or asset group and its estimated fair value, which is recorded in operating expenses in the Consolidated Statements of Income. The estimated fair value of the asset or asset group is based on discounted future cash flows of the asset or asset group using a discount rate commensurate with the related risk. The asset group is defined as the lowest level for which identifiable cash flows are available and largely independent of the cash flows of other groups of assets, which for our retail stores is primarily at the store level.
Goodwill and Intangible AssetsWe review the carrying amount of goodwill and other indefinite-lived intangible assets for impairment annually in the fourth quarter of the fiscal year and whenever events or changes in circumstances indicate that the carrying amount may not be recoverable. Events that result in an impairment review include significant changes in the business climate, declines in our operating results, or an expectation that the carrying amount may not be recoverable. We assess potential impairment by considering present economic conditions as well as future expectations.
We review goodwill for impairment by first assessing qualitative factors to determine whether it is more likely than not that the fair value of the reporting unit is less than its carrying amount, including goodwill, as a basis for determining whether it is necessary to perform the two-step goodwill impairment test. If it is determined that it is more likely than not that the fair value of the reporting unit is less than its carrying amount, the two-step test is performed to identify potential goodwill impairment. If it is determined that it is not more likely than not that the fair value of the reporting unit is less than its carrying amount, it is unnecessary to perform the two-step goodwill impairment test. Based on certain circumstances, we may elect to bypass the qualitative assessment and proceed directly to performing the first step of the two-step goodwill impairment test. The first step of the two-step goodwill impairment test compares the fair value of the reporting unit to its carrying amount, including goodwill. The second step includes hypothetically valuing all of the assets and liabilities of the reporting unit as if the reporting unit had been acquired in a business combination. Then, the implied fair value of the reporting unit’s goodwill is compared to the carrying amount of that goodwill. If the carrying amount of the reporting unit’s goodwill exceeds the implied fair value of the goodwill, we recognize an impairment loss in an amount equal to the excess, not to exceed the carrying amount.
44
A reporting unit is an operating segment or a business unit one level below that operating segment, for which discrete financial information is prepared and regularly reviewed by segment management. We have deemed Athleta and Intermix to be the reporting units at which goodwill is tested for Athleta and Intermix, respectively.
A trade name is considered impaired if the carrying amount exceeds its estimated fair value. If a trade name is considered impaired, we recognize a loss equal to the difference between the carrying amount and the estimated fair value of the trade name. The fair value of a trade name is determined using the relief from royalty method, which requires management to make assumptions and to apply judgment, including forecasting future sales and expenses, and selecting appropriate discount rates and royalty rates.
Goodwill and other indefinite-lived intangible assets, including the trade names, are recorded in other long-term assets in the Consolidated Balance Sheets.
Pre-Opening CostsPre-opening and start-up activity costs, which include rent and occupancy, supplies, advertising, and payroll expenses incurred prior to the opening of a new store or other facility, are expensed in the period in which they occur.
AdvertisingCosts associated with the production of advertising, such as writing, copy, printing, and other costs, are expensed as incurred. Costs associated with communicating advertising that has been produced, such as television and magazine costs, are expensed when the advertising event takes place. Advertising expense was $601 million, $578 million, and $639 million in fiscal 2016, 2015, and 2014, respectively, and is recorded in operating expenses in the Consolidated Statements of Income.
Share-Based CompensationShare-based compensation expense for stock options and other stock awards is determined based on the grant-date fair value. We use the Black-Scholes-Merton option-pricing model to determine the fair value of stock options, which requires the input of subjective assumptions regarding the expected term, expected volatility, dividend yield, and risk-free interest rate. For units granted whereby one share of common stock is issued for each unit as the unit vests (“Stock Units”), the fair value is determined based on the Company’s stock price on the date of grant less future expected dividends during the vesting period. For stock options and Stock Units, we recognize share-based compensation cost net of estimated forfeitures and revise the estimates in subsequent periods if actual forfeitures differ from the estimates. We estimate the forfeiture rate based on historical data as well as expected future behavior. Share-based compensation expense is recorded primarily in operating expenses in the Consolidated Statements of Income over the period during which the employee is required to provide service in exchange for stock options and Stock Units.
Unredeemed Gift Cards, Gift Certificates, and Credit VouchersUpon issuance of a gift card, gift certificate, or credit voucher, a liability is established for its cash value. The liability is relieved and net sales are recorded upon redemption by the customer. Over time, some portion of these instruments is not redeemed. We determine breakage income for gift cards, gift certificates, and credit vouchers based on historical redemption patterns. Breakage income is recorded in other income, which is a component of operating expenses in the Consolidated Statements of Income, when we can determine the portion of the liability where redemption is remote. Based on our historical information, three years after the gift card, gift certificate, or credit voucher is issued, we can determine the portion of the liability where redemption is remote. When breakage income is recorded, a liability is recognized for any legal obligation to remit the unredeemed portion to relevant jurisdictions. Substantially all of our gift cards, gift certificates, and credit vouchers have no expiration dates.
45
Credit CardsWe have credit card agreements with third parties to provide our customers with private label credit cards and/or co-branded credit cards (collectively, the “Credit Cards”). Each private label credit card bears the logo of Gap, Banana Republic, Old Navy, or Athleta and can be used at any of our U.S. or Canadian store locations and online. The co-branded credit card is a VISA credit card bearing the logo of Gap, Banana Republic, Old Navy, or Athleta and can be used everywhere VISA credit cards are accepted. The Credit Card programs offer incentives to cardholders in the form of reward certificates upon the cumulative purchase of an established amount. Synchrony Financial ("Synchrony"), a third-party financing company, is the sole owner of the accounts and underwrites the credit issued under the Credit Card programs. We receive income from Synchrony in accordance with a revenue sharing arrangement and based on usage of the Credit Cards, which we recognize when the amounts are fixed or determinable and collectibility is reasonably assured. The majority of income from the Credit Card programs is recorded in other income and is partially offset by the administrative costs related to the programs, including payroll, marketing expenses, and other direct costs, all of which are recorded in operating expenses in the Consolidated Statements of Income.
The cost associated with redemption of reward certificates is partially offset by income that we recognize as a reduction to cost of goods sold and occupancy expenses in our Consolidated Statements of Income. The cost associated with reward points and certificates is accrued as the rewards are earned by the cardholder and is recorded in accrued expenses and other current liabilities in the Consolidated Balance Sheets.
Earnings per ShareBasic earnings per share is computed as net income divided by the weighted-average number of common shares outstanding for the period. Diluted earnings per share is computed as net income divided by the weighted-average number of common shares outstanding for the period including common stock equivalents. Common stock equivalents consist of shares subject to share-based awards with exercise prices less than the average market price of our common stock for the period, to the extent their inclusion would be dilutive. Stock options and other stock awards that contain performance conditions are not included in the calculation of common stock equivalents until such performance conditions have been achieved.
Foreign CurrencyOur international subsidiaries primarily use local currencies as their functional currency and translate their assets and liabilities at the current rate of exchange in effect at the balance sheet date. Revenue and expenses from their operations are translated using rates that approximate those in effect during the period in which the transactions occur. The resulting gains and losses from translation are recorded in the Consolidated Statements of Comprehensive Income and in accumulated OCI in the Consolidated Statements of Stockholders’ Equity. Transaction gains and losses resulting from intercompany balances of a long-term investment nature are also classified as accumulated OCI. Transaction gains and losses that arise from exchange rate fluctuations on transactions denominated in a currency other than the local functional currency are included in the Consolidated Statements of Income. The aggregate transaction gains and losses recorded in operating expenses in the Consolidated Statements of Income are as follows:
Fiscal Year($ in millions) 2016 2015 2014Foreign currency transaction loss $ (18) $ (6) $ (34)Realized and unrealized gain from certain derivative financial instruments 10 25 28Net foreign exchange gain (loss) $ (8) $ 19 $ (6)
46
Income TaxesDeferred income taxes are recorded for temporary differences between the tax basis of assets and liabilities and their reported amounts in the Consolidated Financial Statements. A valuation allowance is established against deferred tax assets when it is more likely than not that some portion or all of the deferred tax assets will not be realized.
Our income tax expense includes changes in our estimated liability for exposures associated with our various tax filing positions. At any point in time, many tax years are subject to or in the process of being audited by various taxing authorities. To the extent our estimates of settlements change or the final tax outcome of these matters is different from the amounts recorded, such differences will impact the income tax provision in the period in which such determinations are made.
The Company recognizes interest related to unrecognized tax benefits in interest expense and penalties related to unrecognized tax benefits in operating expenses in the Consolidated Statements of Income.
Recent Accounting Pronouncements
Recent Accounting Pronouncements Related to Revenue RecognitionIn May 2014, the Financial Accounting Standards Board ("FASB") issued an accounting standards update ("ASU") No. 2014-09, Revenue from Contracts with Customers, to clarify the principles of recognizing revenue and create common revenue recognition guidance between U.S. GAAP and International Financial Reporting Standards. In August 2015, the FASB issued ASU No. 2015-14, Revenue from Contracts with Customers, Deferral of the Effective Date, which defers the effective date of the new revenue recognition standard by one year. As a result, the ASU No. 2014-09 is effective retrospectively for fiscal years and interim periods within those years beginning after December 15, 2017.
In March 2016, the FASB issued ASU No. 2016-08, Revenue from Contracts with Customers: Principal versus Agent Considerations, which is intended to improve the operability and understandability of the implementation guidance on principal versus agent considerations. In April 2016, the FASB issued ASU No. 2016-10, Revenue from Contracts with Customers: Identifying Performance Obligations and Licensing, which clarifies the identification of performance obligations and the licensing implementation guidance. In May 2016, the FASB issued ASU No. 2016-11, Revenue Recognition and Derivatives and Hedging: Rescission of SEC Guidance Because of Accounting Standards Updates 2014-09 and 2014-16 Pursuant to Staff Announcements at the March 3, 2016 EITF Meeting, which rescinds SEC paragraphs pursuant to SEC staff announcements. These rescissions include changes to topics pertaining to accounting for shipping and handling fees and costs and accounting for consideration given by a vendor to a customer. In May 2016, the FASB issued ASU No. 2016-12, Revenue from Contracts with Customers: Narrow-Scope Improvements and Practical Expedients, which provides clarifying guidance in certain narrow areas and adds some practical expedients. The effective dates for these ASUs are the same as the effective date for ASU No. 2014-09.

47
While we do not expect the adoption of these ASUs to have a material impact on our Consolidated Financial Statements, we expect the adoption to result in change in the timing of recognizing revenue for sales where we ship the merchandise to the customer from a distribution center or store, breakage income for gift cards, gift certificates, and credit vouchers, and credit card reward points and certificate liability. Under the new guidance, we expect to recognize revenue for sales where we ship the merchandise to the customer from a distribution center or store on the basis of control of the merchandise, rather than at the time the risk of loss is transferred. Additionally, the adoption is expected to result in change in the timing of recognition and classification of breakage income for gift cards, gift certificates, and credit vouchers. Our credit card incentive program is expected to be accounted for differently under the new guidance as the reward points and certificates are considered a separate performance obligation requiring the standalone value to be deferred until redemption or expiration. We currently do not defer any portion of revenue related to reward points and certificates and recognize cost associated with reward points and certificates as the rewards are earned and based on estimated redemption patterns. Additionally, under the new guidance, we expect to recognize allowances for estimated sales returns on a gross basis rather than net basis on the Consolidated Balance Sheets.
We are still evaluating our method of adoption (full retrospective or modified retrospective). We will adopt these ASUs beginning in the first quarter of fiscal 2018.
Other Recent Accounting Pronouncements
In November 2015, the FASB issued ASU No. 2015-17, Income Taxes, which changes how deferred taxes are classified on the balance sheet. The ASU eliminates the requirement for organizations to present deferred tax liabilities and assets as current and noncurrent in a classified balance sheet. Instead, organizations will be required to classify all deferred tax assets and liabilities as noncurrent. The ASU is effective for fiscal years and interim periods within those years beginning after December 15, 2016. We adopted ASU No. 2015-17 prospectively effective January 30, 2016.
In January 2016, the FASB issued ASU No. 2016-01, Financial Instruments - Overall: Recognition and Measurement of Financial Assets and Financial Liabilities. The new guidance is intended to improve the recognition and measurement of financial instruments. The ASU is effective for fiscal years and interim periods within those years beginning after December 15, 2017. We do not expect the adoption of this ASU to have a material impact on our Consolidated Financial Statements.
In February 2016, the FASB issued ASU No. 2016-02, Leases. Under the new guidance, lessees will be required to recognize a lease liability and a right-of-use asset for all leases (with the exception of short-term leases) at the commencement date. The ASU is effective for fiscal years and interim periods within those years beginning after December 15, 2018. We are still assessing the impact of this ASU on our Consolidated Financial Statements, but we expect that it will result in a substantial increase in our long-term assets and liabilities. We will adopt the ASU beginning in the first quarter of fiscal 2019.
In March 2016, the FASB issued ASU No. 2016-09, Compensation - Stock Compensation: Improvements to Employee Share-Based Payment Accounting. The amendments are intended to improve the accounting for employee share-based payments and affect all organizations that issue share-based payment awards to their employees. The ASU is effective for fiscal years and interim periods within those years beginning after December 15, 2016. We will adopt the provisions of this ASU in the first quarter of fiscal 2017. The ASU is expected to have an impact on our current accounting and reporting for share-based compensation, primarily related to income taxes. Additionally, we plan to make the policy election to account for forfeitures when they occur beginning in the first quarter of fiscal 2017. The significance of this ASU to the Company's financial statements is largely dependent on the Company's stock price and employee terminations and could vary in the future. However, we do not currently expect the adoption of this ASU to have a material impact on our Consolidated Financial Statements.
48
In June 2016, the FASB issued ASU No. 2016-13, Financial Instruments - Credit Losses: Measurement of Credit Losses on Financial Instruments. The amendments require the measurement of all expected credit losses for financial assets held at the reporting date based on historical experience, current conditions, and reasonable and supportable forecasts. The ASU is effective for fiscal years and interim periods within those years beginning after December 15, 2019. We do not expect the adoption of this ASU to have a material impact on our Consolidated Financial Statements.
In August 2016, the FASB issued ASU No. 2016-15, Statement of Cash Flows: Classification of Certain Cash Receipts and Cash Payments. The amendments provide guidance for eight specific cash flow issues and are intended to address diversity in how certain cash receipts and cash payments are presented and classified in the statement of cash flows. The ASU is effective retrospectively for fiscal years and interim periods within those years beginning after December 15, 2017. We will adopt the presentation and disclosure provisions of this ASU in the first quarter of fiscal 2018.
In October 2016, the FASB issued ASU No. 2016-16, Income Taxes: Intra-Entity Transfers of Assets Other than Inventory. The amendments remove the prohibition against the recognition of current and deferred income tax effects of intra-entity transfers of assets other than inventory until the asset has been sold to an outside party. The ASU is effective for fiscal years and interim periods within those years beginning after December 15, 2017. We do not expect the adoption of this ASU to have a material impact on our Consolidated Financial Statements.
In October 2016, the FASB issued ASU No. 2016-17, Consolidation: Interests Held through Related Parties That Are Under Common Control. The amendments change how a reporting entity that is the single decision maker of a variable interest entity should treat indirect interests in the entity held through related parties that are under common control with the reporting entity when determining whether it is the primary beneficiary of that variable interest entity. The ASU is effective for fiscal years and interim periods within those years beginning after December 15, 2016. We do not expect the adoption of this ASU to have a material impact on our Consolidated Financial Statements.
In November 2016, the FASB issued ASU No. 2016-18, Statement of Cash Flows: Restricted Cash. The amendments address diversity in practice that exists in the classification and presentation of changes in restricted cash and require that a statement of cash flows explain the change during the period in the total of cash, cash equivalents, and amounts generally described as restricted cash or restricted cash equivalents. The ASU is effective retrospectively for fiscal years and interim periods within those years beginning after December 15, 2017. We will adopt the presentation and disclosure provisions of this ASU in the first quarter of fiscal 2018.
In January 2017, the FASB issued ASU No. 2017-01, Business Combinations: Clarifying the Definition of a Business. The amendments provide a more robust framework to use in determining when a set of assets and activities is a business. The ASU is effective prospectively for fiscal years and interim periods within those years beginning after December 15, 2017. The Company would apply this guidance to applicable transactions after the adoption date.
In January 2017, the FASB issued ASU No. 2017-04, Intangibles - Goodwill and Other: Simplifying the Test for Goodwill Impairment. The amendments simplify the subsequent measurement of goodwill and eliminate the two-step goodwill impairment test. Under the new guidance, an annual or interim goodwill impairment test is performed by comparing the fair value of a reporting unit with its carrying amount, and an impairment charge is recognized for the amount by which the carrying amount exceeds the reporting unit’s fair value. The amendments also eliminate the requirements for any reporting unit with a zero or negative carrying amount to perform a qualitative assessment and two-step goodwill impairment test. The ASU is effective prospectively for fiscal years and interim periods within those years beginning after December 15, 2019. Early adoption is permitted for interim or annual goodwill impairment tests performed on testing dates after January 1, 2017. The Company recorded a goodwill impairment charge related to Intermix under the existing FASB Accounting Standards Codification No. 350 Intangibles - Goodwill and Other as the annual impairment test was performed prior to January 1, 2017. See Note 4 of Notes to Consolidated Financial Statements. We will early adopt this ASU for goodwill impairment tests beginning in the first quarter of fiscal 2017.
49
In February 2017, the FASB issued ASU No. 2017-05, Other Income - Gains and Losses from the Derecognition of Nonfinancial Assets: Clarifying the Scope of Asset Derecognition Guidance and Accounting for Partial Sales of Nonfinancial Assets. The ASU was issued to clarify the scope of the previous standard and to add guidance for partial sales of nonfinancial assets. The ASU is effective for fiscal years and interim periods within those years beginning after December 15, 2017. We are currently assessing the potential impact of this ASU on our Consolidated Financial Statements.
Note 2. Additional Financial Statement InformationCash and Cash EquivalentsCash and cash equivalents consist of the following:
($ in millions)January 28,
2017January 30,
2016Cash (1) $ 1,086 $ 853Bank certificates of deposit and time deposits 416 313Money market funds 256 204Domestic commercial paper 25 —Cash equivalents 697 517Cash and cash equivalents $ 1,783 $ 1,370
__________(1) Cash includes $58 million and $64 million of amounts in transit from banks for customer credit card and debit card transactions as of
January 28, 2017 and January 30, 2016, respectively.
Other Current AssetsOther current assets consist of the following:
($ in millions)January 28,
2017January 30,
2016
Accounts receivable $ 335 $ 282Prepaid minimum rent and occupancy expenses 154 155Prepaid income taxes 89 142Derivative financial instruments 41 85Other 83 78Other current assets $ 702 $ 742
Property and EquipmentProperty and equipment are stated at cost less accumulated depreciation and consist of the following:
($ in millions)January 28,
2017January 30,
2016
Leasehold improvements $ 3,099 $ 3,252Furniture and equipment 2,508 2,603Software 1,600 1,433Land, buildings, and building improvements 1,000 1,019Construction-in-progress 222 187Property and equipment, at cost 8,429 8,494Less: Accumulated depreciation (5,813) (5,644)Property and equipment, net of accumulated depreciation $ 2,616 $ 2,850
50
Depreciation expense for property and equipment was $590 million, $588 million, and $560 million for fiscal 2016, 2015, and 2014, respectively.
Interest of $9 million, $8 million, and $7 million related to assets under construction was capitalized in fiscal 2016, 2015, and 2014, respectively.
We recorded a charge for the impairment of long-lived assets of $107 million, $54 million, and $10 million for fiscal 2016, 2015, and 2014, respectively, related to store assets which is recorded in operating expenses in the Consolidated Statements of Income.
Other Long-Term AssetsOther long-term assets consist of the following:
($ in millions)January 28,
2017January 30,
2016
Long-term income tax-related assets $ 282 $ 189Goodwill 109 180Trade names 95 92Other 193 177Other long-term assets $ 679 $ 638
In fiscal 2016, we recorded a charge for the impairment of goodwill related to the Intermix reporting unit of $71 million, which is recorded in operating expenses in the Consolidated Statement of Income. No goodwill impairment charges were recorded in fiscal 2015 or 2014. See Note 4 of Notes to Consolidated Financial Statements for additional disclosures on goodwill and other intangible assets.
Accrued Expenses and Other Current LiabilitiesAccrued expenses and other current liabilities consist of the following:
($ in millions)January 28,
2017January 30,
2016Accrued compensation and benefits $ 312 $ 230Unredeemed gift cards, gift certificates, and credit vouchers, net of
breakage 256 254Short-term deferred rent and tenant allowances 99 100Accrued advertising 46 31Other 400 364Accrued expenses and other current liabilities $ 1,113 $ 979
No other individual items accounted for greater than five percent of total current liabilities as of January 28, 2017 or January 30, 2016.
51
Lease Incentives and Other Long-Term LiabilitiesLease incentives and other long-term liabilities consist of the following:
($ in millions)January 28,
2017January 30,
2016Long-term deferred rent and tenant allowances $ 748 $ 776Long-term asset retirement obligations 51 70Long-term income tax-related liabilities 32 49Other 174 188Lease incentives and other long-term liabilities $ 1,005 $ 1,083
The activity related to asset retirement obligations includes adjustments to the asset retirement obligation balance and fluctuations in foreign currency exchange rates.
Sales Return AllowanceA summary of activity in the sales return allowance account is as follows:
($ in millions)January 28,
2017January 30,
2016January 31,
2015Balance at beginning of fiscal year $ 27 $ 29 $ 26Additions 861 865 896Returns (858) (867) (893)Balance at end of fiscal year $ 30 $ 27 $ 29
Sales return allowances are recorded in accrued expenses and other current liabilities in the Consolidated Balance Sheets.
Note 3. Store Closing and Other Operating ChargesIn May 2016, the Company announced measures to better align talent and financial resources against its most important priorities; these measures include (i) focusing each brand on geographies with the greatest potential and (ii) streamlining the Company’s operating model. The measures resulted in the closure of its fleet of 53 Old Navy stores in Japan, the closure of select international stores, primarily for Banana Republic in Europe, and the creation of a more efficient global brand structure. Including the Old Navy closures in Japan, the Company closed 67 stores in total related to these measures in fiscal 2016.
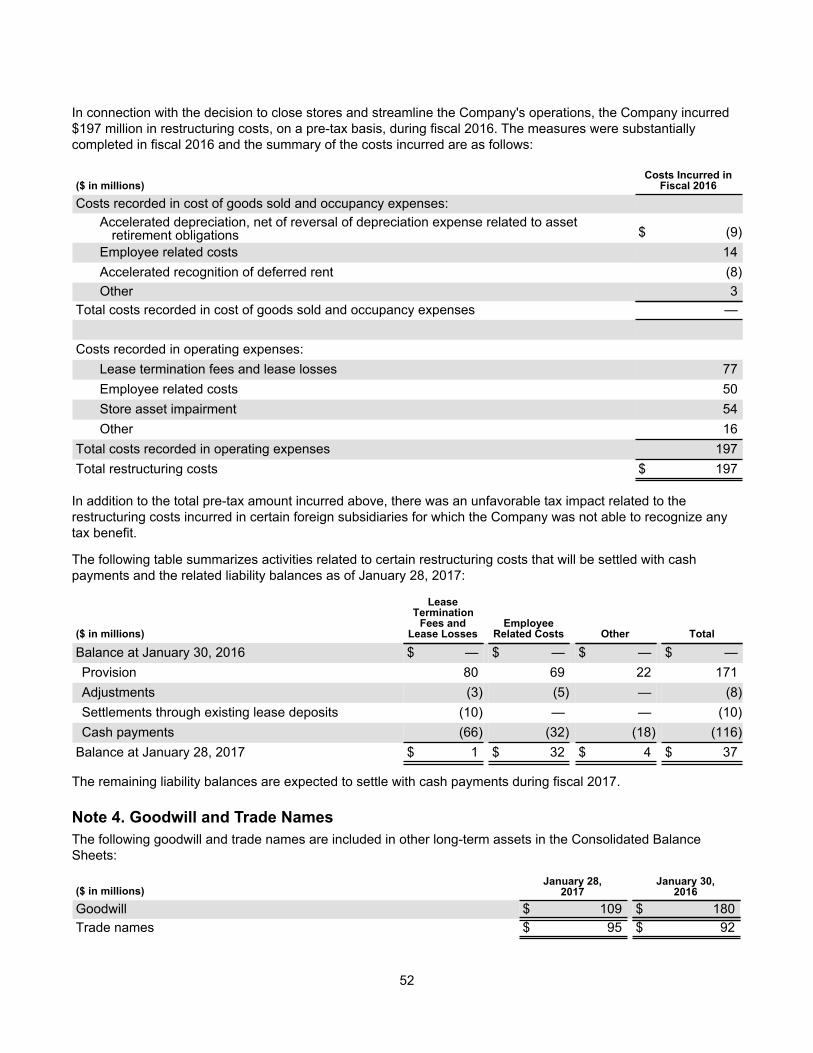
52
In connection with the decision to close stores and streamline the Company's operations, the Company incurred $197 million in restructuring costs, on a pre-tax basis, during fiscal 2016. The measures were substantially completed in fiscal 2016 and the summary of the costs incurred are as follows:
($ in millions)Costs Incurred in
Fiscal 2016
Costs recorded in cost of goods sold and occupancy expenses:Accelerated depreciation, net of reversal of depreciation expense related to asset
retirement obligations $ (9)Employee related costs 14Accelerated recognition of deferred rent (8)Other 3
Total costs recorded in cost of goods sold and occupancy expenses —
Costs recorded in operating expenses:Lease termination fees and lease losses 77Employee related costs 50Store asset impairment 54Other 16
Total costs recorded in operating expenses 197Total restructuring costs $ 197
In addition to the total pre-tax amount incurred above, there was an unfavorable tax impact related to the restructuring costs incurred in certain foreign subsidiaries for which the Company was not able to recognize any tax benefit.
The following table summarizes activities related to certain restructuring costs that will be settled with cash payments and the related liability balances as of January 28, 2017:
($ in millions)
LeaseTermination
Fees andLease Losses
EmployeeRelated Costs Other Total
Balance at January 30, 2016 $ — $ — $ — $ —Provision 80 69 22 171Adjustments (3) (5) — (8)Settlements through existing lease deposits (10) — — (10)Cash payments (66) (32) (18) (116)
Balance at January 28, 2017 $ 1 $ 32 $ 4 $ 37
The remaining liability balances are expected to settle with cash payments during fiscal 2017.
Note 4. Goodwill and Trade NamesThe following goodwill and trade names are included in other long-term assets in the Consolidated Balance Sheets:
($ in millions)January 28,
2017January 30,
2016Goodwill $ 109 $ 180Trade names $ 95 $ 92
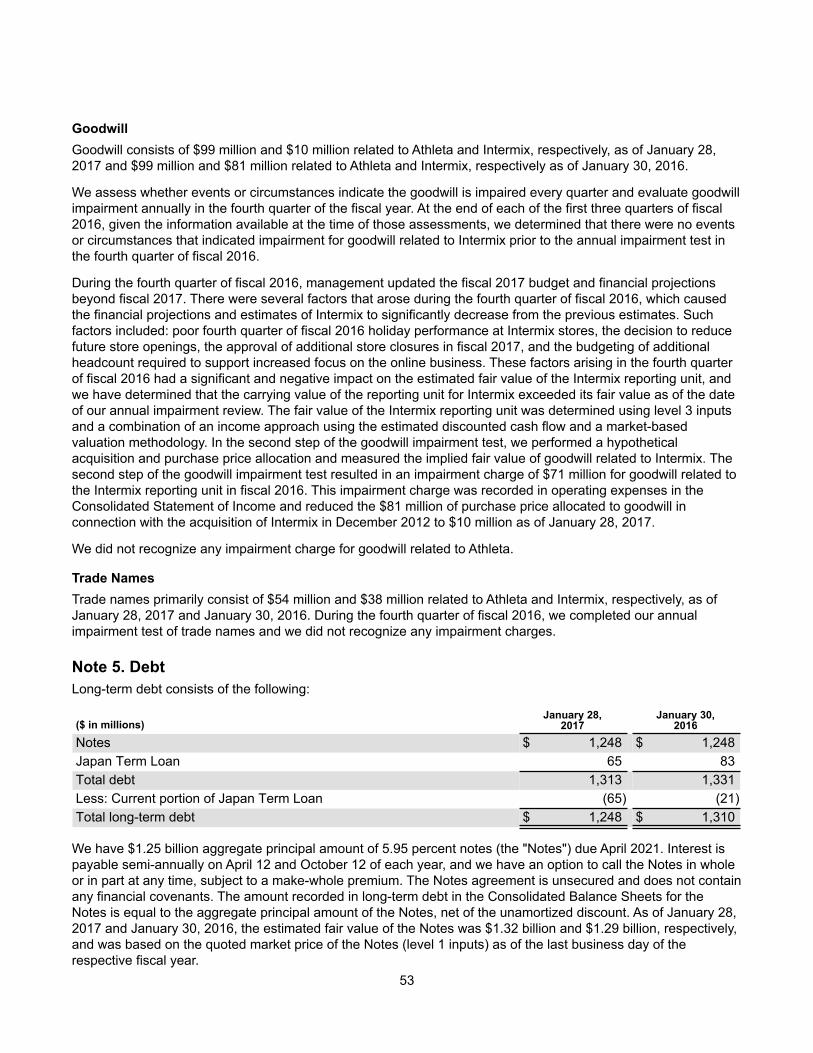
53
GoodwillGoodwill consists of $99 million and $10 million related to Athleta and Intermix, respectively, as of January 28, 2017 and $99 million and $81 million related to Athleta and Intermix, respectively as of January 30, 2016.
We assess whether events or circumstances indicate the goodwill is impaired every quarter and evaluate goodwill impairment annually in the fourth quarter of the fiscal year. At the end of each of the first three quarters of fiscal 2016, given the information available at the time of those assessments, we determined that there were no events or circumstances that indicated impairment for goodwill related to Intermix prior to the annual impairment test in the fourth quarter of fiscal 2016.
During the fourth quarter of fiscal 2016, management updated the fiscal 2017 budget and financial projections beyond fiscal 2017. There were several factors that arose during the fourth quarter of fiscal 2016, which caused the financial projections and estimates of Intermix to significantly decrease from the previous estimates. Such factors included: poor fourth quarter of fiscal 2016 holiday performance at Intermix stores, the decision to reduce future store openings, the approval of additional store closures in fiscal 2017, and the budgeting of additional headcount required to support increased focus on the online business. These factors arising in the fourth quarter of fiscal 2016 had a significant and negative impact on the estimated fair value of the Intermix reporting unit, and we have determined that the carrying value of the reporting unit for Intermix exceeded its fair value as of the date of our annual impairment review. The fair value of the Intermix reporting unit was determined using level 3 inputs and a combination of an income approach using the estimated discounted cash flow and a market-based valuation methodology. In the second step of the goodwill impairment test, we performed a hypothetical acquisition and purchase price allocation and measured the implied fair value of goodwill related to Intermix. The second step of the goodwill impairment test resulted in an impairment charge of $71 million for goodwill related to the Intermix reporting unit in fiscal 2016. This impairment charge was recorded in operating expenses in the Consolidated Statement of Income and reduced the $81 million of purchase price allocated to goodwill in connection with the acquisition of Intermix in December 2012 to $10 million as of January 28, 2017.
We did not recognize any impairment charge for goodwill related to Athleta.
Trade NamesTrade names primarily consist of $54 million and $38 million related to Athleta and Intermix, respectively, as of January 28, 2017 and January 30, 2016. During the fourth quarter of fiscal 2016, we completed our annual impairment test of trade names and we did not recognize any impairment charges.
Note 5. DebtLong-term debt consists of the following:
($ in millions)January 28,
2017January 30,
2016Notes $ 1,248 $ 1,248Japan Term Loan 65 83Total debt 1,313 1,331Less: Current portion of Japan Term Loan (65) (21)Total long-term debt $ 1,248 $ 1,310
We have $1.25 billion aggregate principal amount of 5.95 percent notes (the "Notes") due April 2021. Interest is payable semi-annually on April 12 and October 12 of each year, and we have an option to call the Notes in whole or in part at any time, subject to a make-whole premium. The Notes agreement is unsecured and does not contain any financial covenants. The amount recorded in long-term debt in the Consolidated Balance Sheets for the Notes is equal to the aggregate principal amount of the Notes, net of the unamortized discount. As of January 28, 2017 and January 30, 2016, the estimated fair value of the Notes was $1.32 billion and $1.29 billion, respectively, and was based on the quoted market price of the Notes (level 1 inputs) as of the last business day of the respective fiscal year.

54
In January 2014, we entered into a 15 billion Japanese yen, four-year, unsecured term loan due January 2018. Repayments of 2.5 billion Japanese yen were payable on January 15 of each year. A final repayment of 7.5 billion Japanese yen ($65 million as of January 28, 2017) is due on January 15, 2018. In addition, interest is payable at least quarterly based on an interest rate equal to the Tokyo Interbank Offered Rate plus a fixed margin. The average interest rate for fiscal 2016 was 1 percent. The carrying amount of the Japan Term Loan as of January 28, 2017 and January 30, 2016 approximated its fair value, as the interest rate varies depending on quoted market rates (level 1 inputs). The Japan Term Loan agreement contains certain requirements, including that the covenants in our $500 million, five-year, unsecured revolving credit facility are upheld. As of January 28, 2017, we were in compliance with all such covenants. Violation of these covenants would result in a default under the Japan Term Loan agreement, which, at the bank's discretion, could require the immediate repayment of outstanding amounts.
In October 2015, we entered into a $400 million unsecured Term Loan. The Term Loan was originally scheduled to mature on October 15, 2016, but had an option to be extended until October 15, 2017. In August 2016, the Company exercised the option to extend the Term Loan. In January 2017, the Term Loan was repaid in full. Interest was payable at least quarterly based on an interest rate equal to the London Interbank Offered Rate ("LIBOR") plus a fixed margin. The average interest rate for fiscal 2016 was 1 percent.
Note 6. Credit FacilitiesWe have a $500 million, five-year, unsecured revolving credit facility (the "Facility"), which was set to expire in May 2018. On May 20, 2015, the Facility was amended under substantially similar terms to extend the expiration date to May 2020. The Facility is available for general corporate purposes including working capital, trade letters of credit, and standby letters of credit. The Facility fees fluctuate based on our long-term senior unsecured credit ratings and our leverage ratio. If we were to draw on the Facility, interest would be a base rate (typically LIBOR) plus a margin based on our long-term senior unsecured credit ratings and our leverage ratio on the unpaid principal amount. To maintain availability of funds under the Facility, we pay a facility fee on the full facility amount, regardless of usage. As of January 28, 2017, there were no borrowings and no material outstanding standby letters of credit under the Facility.
We maintain multiple agreements with third parties that make unsecured revolving credit facilities available for our operations in foreign locations (the “Foreign Facilities”). These Foreign Facilities are uncommitted and are generally available for borrowings, overdraft borrowings, and the issuance of bank guarantees. The total capacity of the Foreign Facilities was $46 million as of January 28, 2017. As of January 28, 2017, there were no borrowings under the Foreign Facilities. There were $12 million in bank guarantees issued and outstanding primarily related to store leases under the Foreign Facilities as of January 28, 2017.
We have bilateral unsecured standby letter of credit agreements that are uncommitted and do not have expiration dates. As of January 28, 2017, we had $16 million in standby letters of credit issued under these agreements.
The Facility contains financial and other covenants including, but not limited to, limitations on liens and subsidiary debt, as well as the maintenance of two financial ratios—a minimum annual fixed charge coverage ratio of 2.00 and a maximum annual leverage ratio of 2.25. As of January 28, 2017, we were in compliance with all such covenants. Violation of these covenants could result in a default under the Facility and Japan Term Loan, which would permit the participating banks to terminate our ability to access the Facility for letters of credit and advances and require the immediate repayment of any outstanding advances under the Facility or Japan Term Loan.
Note 7. Fair Value MeasurementsThere were no purchases, sales, issuances, or settlements related to recurring level 3 measurements during fiscal 2016 or 2015. There were no transfers into or out of level 1 and level 2 during fiscal 2016 or 2015.

55
Financial Assets and LiabilitiesFinancial assets and liabilities measured at fair value on a recurring basis and cash equivalents held at amortized cost are as follows:
Fair Value Measurements at Reporting Date Using
($ in millions) January 28, 2017
Quoted Prices inActive Markets forIdentical Assets
(Level 1)
Significant OtherObservable Inputs
(Level 2)
SignificantUnobservable
Inputs(Level 3)
Assets:Cash equivalents $ 697 $ 256 $ 441 $ —Derivative financial instruments 58 — 58 —Deferred compensation plan assets 40 40 — —Total $ 795 $ 296 $ 499 $ —
Liabilities:Derivative financial instruments $ 21 $ — $ 21 $ —
Fair Value Measurements at Reporting Date Using
($ in millions) January 30, 2016
Quoted Prices inActive Markets forIdentical Assets
(Level 1)
Significant OtherObservable Inputs
(Level 2)
SignificantUnobservable
Inputs(Level 3)
Assets:Cash equivalents $ 517 $ 204 $ 313 $ —Derivative financial instruments 93 — 93 —Deferred compensation plan assets 37 37 — —Total $ 647 $ 241 $ 406 $ —
Liabilities:Derivative financial instruments $ 3 $ — $ 3 $ —
We have highly liquid investments classified as cash equivalents, which are placed primarily in time deposits, money market funds, and commercial paper. We value these investments at their original purchase prices plus interest that has accrued at the stated rate.
Derivative financial instruments primarily include foreign exchange forward contracts. The principal currencies hedged against changes in the U.S. dollar are Japanese yen, Canadian dollars, British pounds, Euro, Mexican pesos, Chinese yuan, and Taiwan dollars. The fair value of the Company’s derivative financial instruments is determined using pricing models based on current market rates. Derivative financial instruments in an asset position are recorded in other current assets or other long-term assets in the Consolidated Balance Sheets. Derivative financial instruments in a liability position are recorded in accrued expenses and other current liabilities or lease incentives and other long-term liabilities in the Consolidated Balance Sheets.
We maintain the Gap Inc. Deferred Compensation Plan (“DCP”), which allows eligible employees and non-employee directors to defer compensation up to a maximum amount. Plan investments are directed by participants and are recorded at market value and designated for the DCP. The fair value of the Company’s DCP assets is determined based on quoted market prices, and the assets are recorded in other long-term assets in the Consolidated Balance Sheets.
Nonfinancial Assets
In May 2016, the Company announced measures that resulted in the closure of its fleet of 53 Old Navy stores in Japan and select Banana Republic stores, primarily internationally. In fiscal 2016, we recorded a charge for the impairment of long-lived assets of $54 million related to the announced store closures, and an additional $53 million for long-lived assets that were unrelated to the announced measures.
56
In June 2015, the Company announced a series of strategic actions to position Gap brand for improved business performance in the future, including its plan to close about 175 Gap brand specialty stores in North America and a limited number of stores in Europe and Asia over the next few years. As a result of the strategic actions, in fiscal 2015, we recorded an impairment charge of $38 million related to long-lived assets. We also recorded an impairment charge of $16 million for long-lived assets that were unrelated to the Gap brand strategic actions.
As discussed above and in Note 2 of Notes to Consolidated Financial Statements, we recorded a total charge for the impairment of long-lived assets of $107 million, $54 million, and $10 million in fiscal 2016, 2015, and 2014, respectively. The impairment charge reduced the then carrying amount of the applicable long-lived assets of $125 million, $62 million, and $11 million to their fair value of $18 million, $8 million, and $1 million during fiscal 2016, 2015, and 2014, respectively. The fair value of the long-lived assets was determined using level 3 inputs and the valuation techniques discussed in Note 1 of Notes to Consolidated Financial Statements.
In fiscal 2015, we also recorded an impairment charge of $5 million related to an indefinite-lived intangible asset as a result of the strategic actions discussed above. The impairment charge was recorded in operating expenses in the Consolidated Statement of Income and reduced the then carrying amount of the applicable indefinite-lived intangible asset of $6 million to its fair value of $1 million during fiscal 2015. There were no impairment charges recorded for other indefinite-lived intangible assets for fiscal 2016 or 2014.
As discussed in Note 4 of Notes to Consolidated Financial Statements, we recorded an impairment charge of $71 million for Intermix goodwill in fiscal 2016. The fair value of the Intermix reporting unit was determined using level 3 inputs and valuation techniques discussed in Note 4 of Notes to Consolidated Financial Statements. There were no impairment charges recorded for goodwill for fiscal 2015 or 2014.
Note 8. Derivative Financial InstrumentsWe operate in foreign countries, which exposes us to market risk associated with foreign currency exchange rate fluctuations. We use derivative financial instruments to manage our exposure to foreign currency exchange rate risk and do not enter into derivative financial contracts for trading purposes. Consistent with our risk management guidelines, we hedge a portion of our transactions related to merchandise purchases for foreign operations and certain intercompany transactions using foreign exchange forward contracts. These contracts are entered into with large, reputable financial institutions that are monitored for counterparty risk. The principal currencies hedged against changes in the U.S. dollar are Japanese yen, Canadian dollars, British pounds, Euro, Mexican pesos, Chinese yuan, and Taiwan dollars.
Cash Flow HedgesWe designate the following foreign exchange forward contracts as cash flow hedges: (1) forward contracts used to hedge forecasted merchandise purchases and related costs denominated in U.S. dollars made by our international subsidiaries whose functional currencies are their local currencies; (2) forward contracts used to hedge forecasted intercompany royalty payments denominated in foreign currencies received by entities whose functional currencies are U.S. dollars; and (3) forward contracts used to hedge forecasted intercompany revenue transactions related to merchandise sold from our regional purchasing entities, whose functional currency is the U.S. dollar, to certain international subsidiaries in their local currencies. The foreign exchange forward contracts entered into to hedge forecasted merchandise purchases and related costs, intercompany royalty payments, and intercompany revenue transactions generally have terms of up to 24 months.
There were no material amounts recorded in the Consolidated Statements of Income for fiscal 2016, 2015, or 2014 as a result of our analysis of hedge ineffectiveness or hedge components excluded from the assessment of effectiveness. There were no material amounts reclassified into earnings for fiscal 2016, 2015, or 2014 as a result of the discontinuance of cash flow hedges because the forecasted transactions were no longer probable.
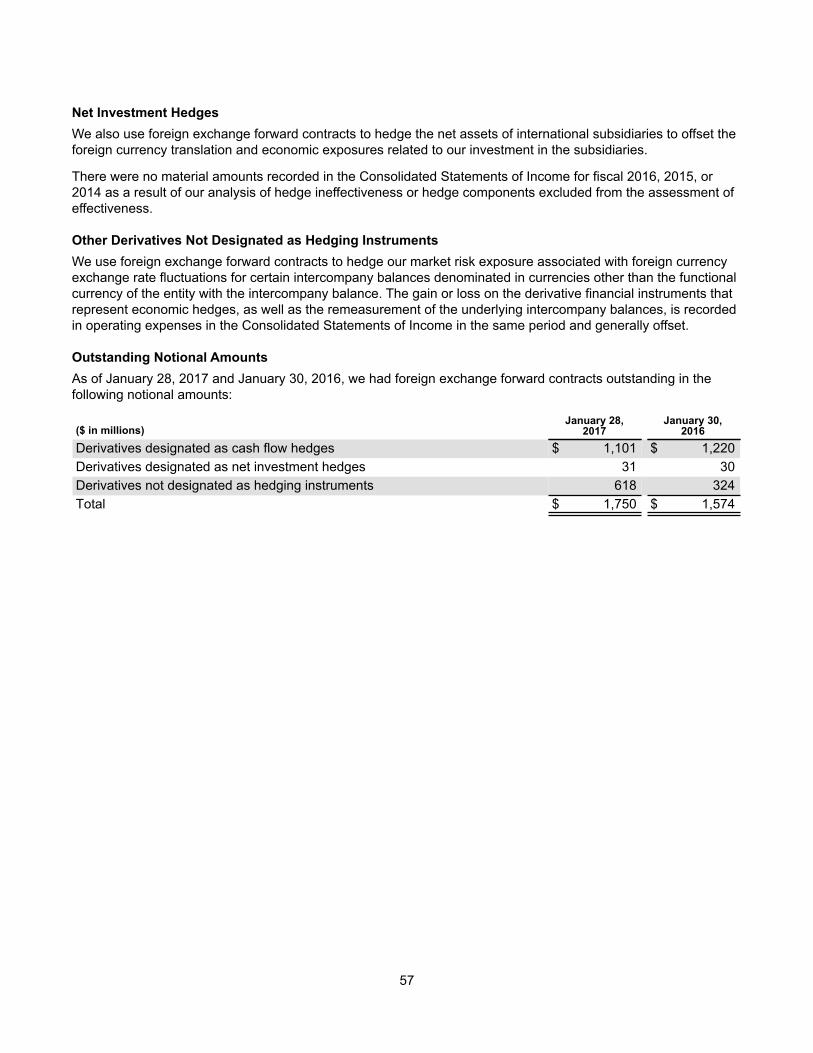
57
Net Investment HedgesWe also use foreign exchange forward contracts to hedge the net assets of international subsidiaries to offset the foreign currency translation and economic exposures related to our investment in the subsidiaries.
There were no material amounts recorded in the Consolidated Statements of Income for fiscal 2016, 2015, or 2014 as a result of our analysis of hedge ineffectiveness or hedge components excluded from the assessment of effectiveness.
Other Derivatives Not Designated as Hedging InstrumentsWe use foreign exchange forward contracts to hedge our market risk exposure associated with foreign currency exchange rate fluctuations for certain intercompany balances denominated in currencies other than the functional currency of the entity with the intercompany balance. The gain or loss on the derivative financial instruments that represent economic hedges, as well as the remeasurement of the underlying intercompany balances, is recorded in operating expenses in the Consolidated Statements of Income in the same period and generally offset.
Outstanding Notional AmountsAs of January 28, 2017 and January 30, 2016, we had foreign exchange forward contracts outstanding in the following notional amounts:
($ in millions)January 28,
2017January 30,
2016Derivatives designated as cash flow hedges $ 1,101 $ 1,220Derivatives designated as net investment hedges 31 30Derivatives not designated as hedging instruments 618 324Total $ 1,750 $ 1,574
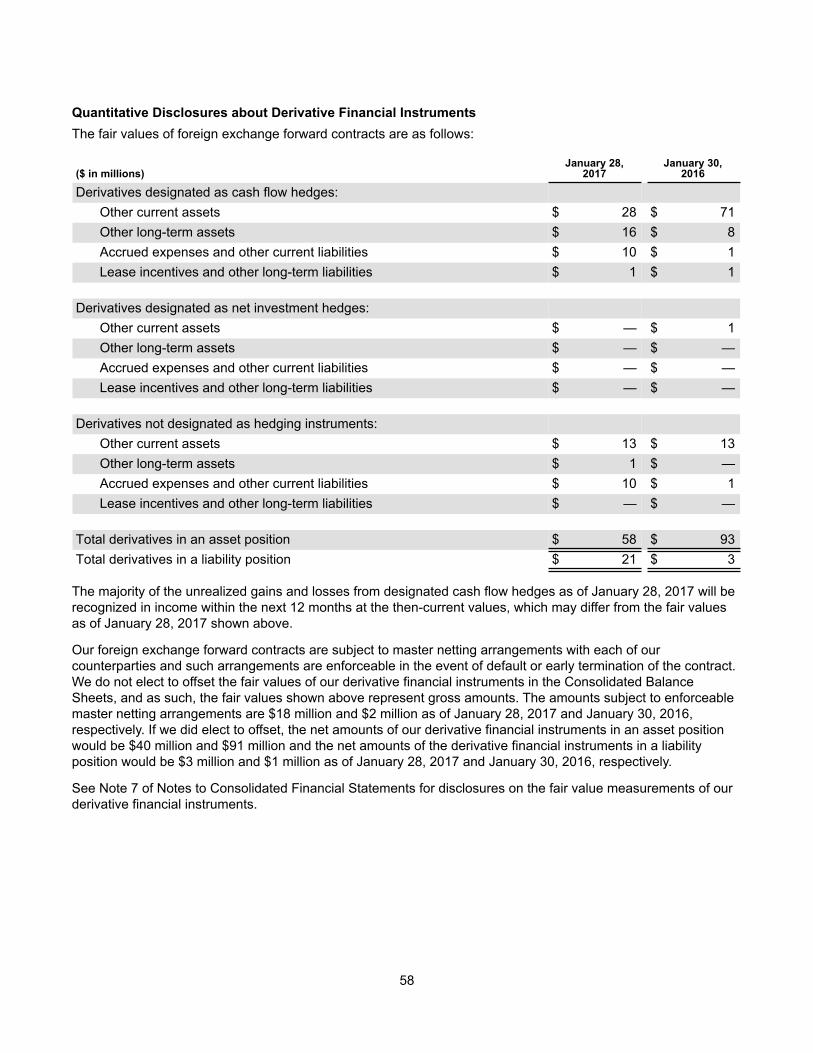
58
Quantitative Disclosures about Derivative Financial InstrumentsThe fair values of foreign exchange forward contracts are as follows:
($ in millions)January 28,
2017January 30,
2016
Derivatives designated as cash flow hedges:Other current assets $ 28 $ 71Other long-term assets $ 16 $ 8Accrued expenses and other current liabilities $ 10 $ 1Lease incentives and other long-term liabilities $ 1 $ 1
Derivatives designated as net investment hedges:Other current assets $ — $ 1Other long-term assets $ — $ —Accrued expenses and other current liabilities $ — $ —Lease incentives and other long-term liabilities $ — $ —
Derivatives not designated as hedging instruments:Other current assets $ 13 $ 13Other long-term assets $ 1 $ —Accrued expenses and other current liabilities $ 10 $ 1Lease incentives and other long-term liabilities $ — $ —
Total derivatives in an asset position $ 58 $ 93Total derivatives in a liability position $ 21 $ 3
The majority of the unrealized gains and losses from designated cash flow hedges as of January 28, 2017 will be recognized in income within the next 12 months at the then-current values, which may differ from the fair values as of January 28, 2017 shown above.
Our foreign exchange forward contracts are subject to master netting arrangements with each of our counterparties and such arrangements are enforceable in the event of default or early termination of the contract. We do not elect to offset the fair values of our derivative financial instruments in the Consolidated Balance Sheets, and as such, the fair values shown above represent gross amounts. The amounts subject to enforceable master netting arrangements are $18 million and $2 million as of January 28, 2017 and January 30, 2016, respectively. If we did elect to offset, the net amounts of our derivative financial instruments in an asset position would be $40 million and $91 million and the net amounts of the derivative financial instruments in a liability position would be $3 million and $1 million as of January 28, 2017 and January 30, 2016, respectively.
See Note 7 of Notes to Consolidated Financial Statements for disclosures on the fair value measurements of our derivative financial instruments.
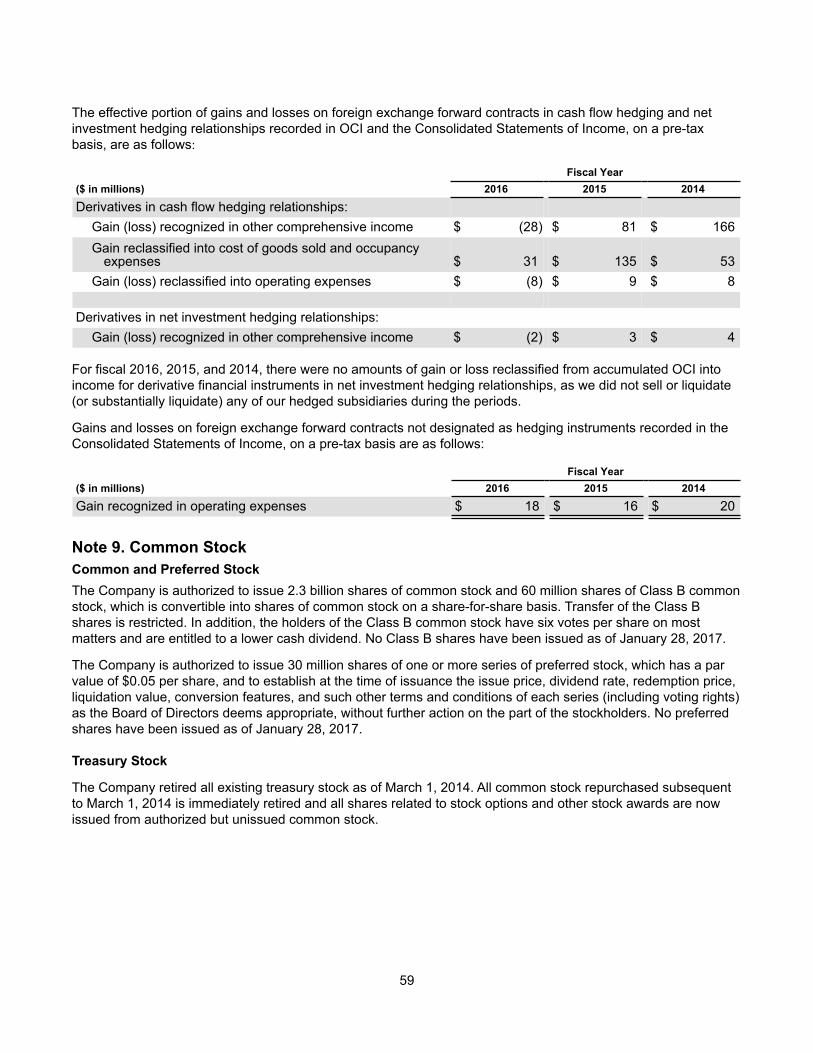
59
The effective portion of gains and losses on foreign exchange forward contracts in cash flow hedging and net investment hedging relationships recorded in OCI and the Consolidated Statements of Income, on a pre-tax basis, are as follows:
Fiscal Year($ in millions) 2016 2015 2014
Derivatives in cash flow hedging relationships:Gain (loss) recognized in other comprehensive income $ (28) $ 81 $ 166Gain reclassified into cost of goods sold and occupancy
expenses $ 31 $ 135 $ 53Gain (loss) reclassified into operating expenses $ (8) $ 9 $ 8
Derivatives in net investment hedging relationships:Gain (loss) recognized in other comprehensive income $ (2) $ 3 $ 4
For fiscal 2016, 2015, and 2014, there were no amounts of gain or loss reclassified from accumulated OCI into income for derivative financial instruments in net investment hedging relationships, as we did not sell or liquidate (or substantially liquidate) any of our hedged subsidiaries during the periods.
Gains and losses on foreign exchange forward contracts not designated as hedging instruments recorded in the Consolidated Statements of Income, on a pre-tax basis are as follows:
Fiscal Year($ in millions) 2016 2015 2014
Gain recognized in operating expenses $ 18 $ 16 $ 20
Note 9. Common StockCommon and Preferred StockThe Company is authorized to issue 2.3 billion shares of common stock and 60 million shares of Class B common stock, which is convertible into shares of common stock on a share-for-share basis. Transfer of the Class B shares is restricted. In addition, the holders of the Class B common stock have six votes per share on most matters and are entitled to a lower cash dividend. No Class B shares have been issued as of January 28, 2017.
The Company is authorized to issue 30 million shares of one or more series of preferred stock, which has a par value of $0.05 per share, and to establish at the time of issuance the issue price, dividend rate, redemption price, liquidation value, conversion features, and such other terms and conditions of each series (including voting rights) as the Board of Directors deems appropriate, without further action on the part of the stockholders. No preferred shares have been issued as of January 28, 2017.
Treasury Stock
The Company retired all existing treasury stock as of March 1, 2014. All common stock repurchased subsequent to March 1, 2014 is immediately retired and all shares related to stock options and other stock awards are now issued from authorized but unissued common stock.
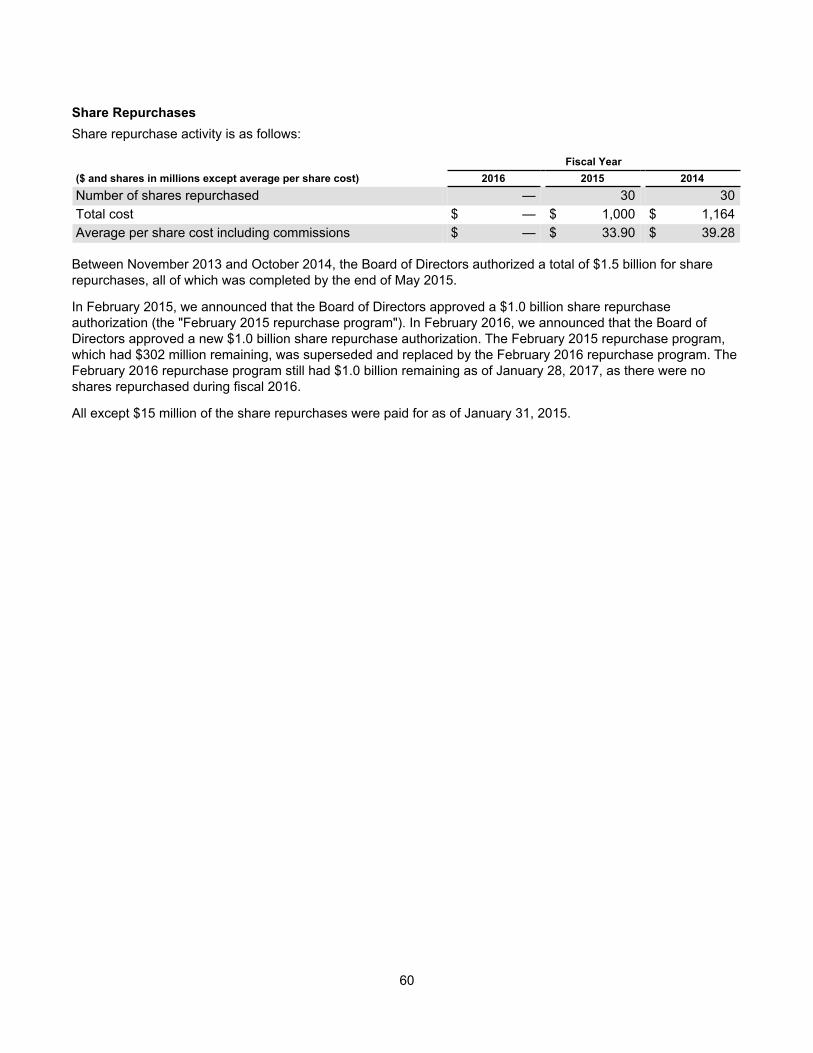
60
Share RepurchasesShare repurchase activity is as follows:
Fiscal Year($ and shares in millions except average per share cost) 2016 2015 2014Number of shares repurchased — 30 30Total cost $ — $ 1,000 $ 1,164Average per share cost including commissions $ — $ 33.90 $ 39.28
Between November 2013 and October 2014, the Board of Directors authorized a total of $1.5 billion for share repurchases, all of which was completed by the end of May 2015.
In February 2015, we announced that the Board of Directors approved a $1.0 billion share repurchase authorization (the "February 2015 repurchase program"). In February 2016, we announced that the Board of Directors approved a new $1.0 billion share repurchase authorization. The February 2015 repurchase program, which had $302 million remaining, was superseded and replaced by the February 2016 repurchase program. The February 2016 repurchase program still had $1.0 billion remaining as of January 28, 2017, as there were no shares repurchased during fiscal 2016.
All except $15 million of the share repurchases were paid for as of January 31, 2015.
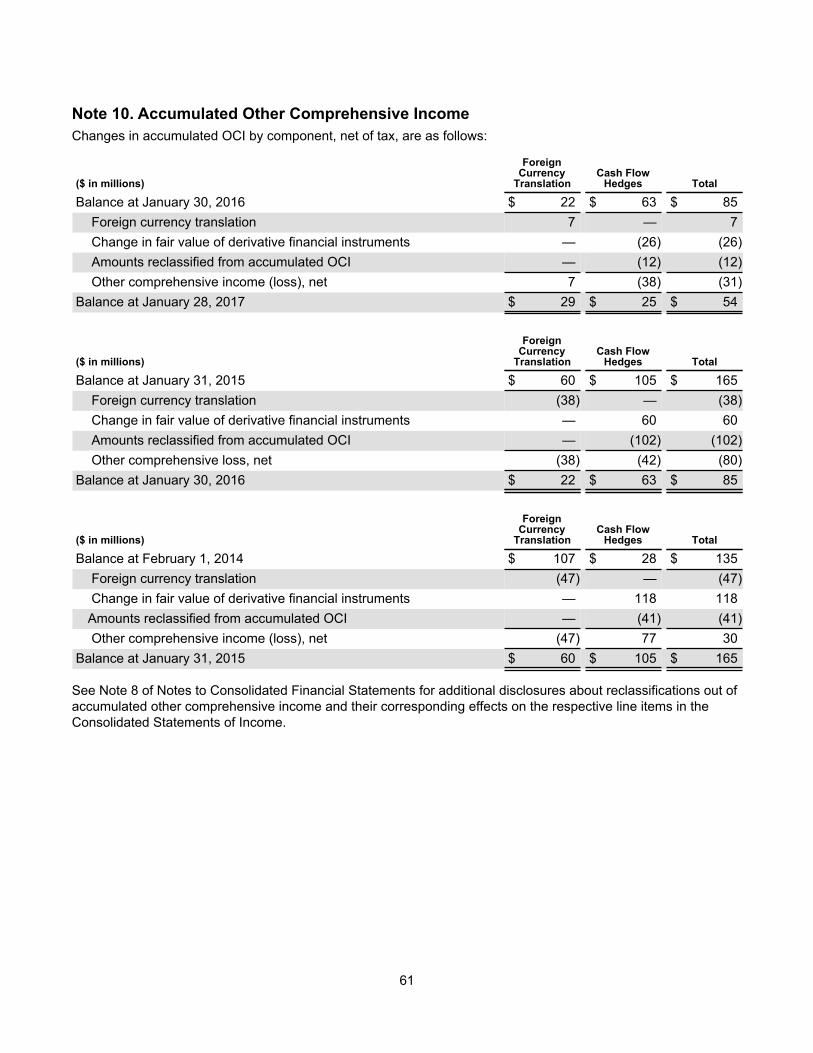
61
Note 10. Accumulated Other Comprehensive IncomeChanges in accumulated OCI by component, net of tax, are as follows:
($ in millions)
ForeignCurrency
TranslationCash Flow
Hedges Total
Balance at January 30, 2016 $ 22 $ 63 $ 85 Foreign currency translation 7 — 7 Change in fair value of derivative financial instruments — (26) (26) Amounts reclassified from accumulated OCI — (12) (12) Other comprehensive income (loss), net 7 (38) (31)
Balance at January 28, 2017 $ 29 $ 25 $ 54
($ in millions)
ForeignCurrency
TranslationCash Flow
Hedges Total
Balance at January 31, 2015 $ 60 $ 105 $ 165 Foreign currency translation (38) — (38) Change in fair value of derivative financial instruments — 60 60 Amounts reclassified from accumulated OCI — (102) (102) Other comprehensive loss, net (38) (42) (80)
Balance at January 30, 2016 $ 22 $ 63 $ 85
($ in millions)
ForeignCurrency
TranslationCash Flow
Hedges Total
Balance at February 1, 2014 $ 107 $ 28 $ 135 Foreign currency translation (47) — (47) Change in fair value of derivative financial instruments — 118 118Amounts reclassified from accumulated OCI — (41) (41) Other comprehensive income (loss), net (47) 77 30
Balance at January 31, 2015 $ 60 $ 105 $ 165
See Note 8 of Notes to Consolidated Financial Statements for additional disclosures about reclassifications out of accumulated other comprehensive income and their corresponding effects on the respective line items in the Consolidated Statements of Income.
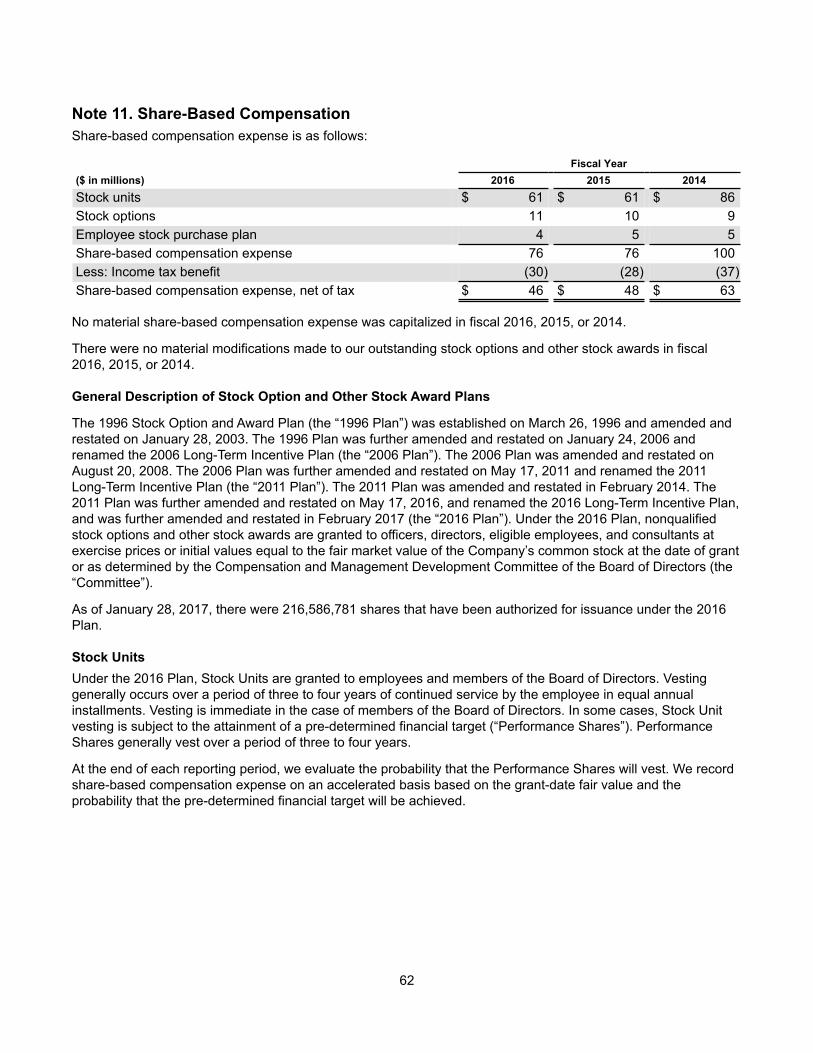
62
Note 11. Share-Based Compensation Share-based compensation expense is as follows:
Fiscal Year($ in millions) 2016 2015 2014Stock units $ 61 $ 61 $ 86Stock options 11 10 9Employee stock purchase plan 4 5 5Share-based compensation expense 76 76 100Less: Income tax benefit (30) (28) (37)Share-based compensation expense, net of tax $ 46 $ 48 $ 63
No material share-based compensation expense was capitalized in fiscal 2016, 2015, or 2014.
There were no material modifications made to our outstanding stock options and other stock awards in fiscal 2016, 2015, or 2014.
General Description of Stock Option and Other Stock Award Plans
The 1996 Stock Option and Award Plan (the “1996 Plan”) was established on March 26, 1996 and amended and restated on January 28, 2003. The 1996 Plan was further amended and restated on January 24, 2006 and renamed the 2006 Long-Term Incentive Plan (the “2006 Plan”). The 2006 Plan was amended and restated on August 20, 2008. The 2006 Plan was further amended and restated on May 17, 2011 and renamed the 2011 Long-Term Incentive Plan (the “2011 Plan”). The 2011 Plan was amended and restated in February 2014. The 2011 Plan was further amended and restated on May 17, 2016, and renamed the 2016 Long-Term Incentive Plan, and was further amended and restated in February 2017 (the “2016 Plan”). Under the 2016 Plan, nonqualified stock options and other stock awards are granted to officers, directors, eligible employees, and consultants at exercise prices or initial values equal to the fair market value of the Company’s common stock at the date of grant or as determined by the Compensation and Management Development Committee of the Board of Directors (the “Committee”).
As of January 28, 2017, there were 216,586,781 shares that have been authorized for issuance under the 2016 Plan.
Stock UnitsUnder the 2016 Plan, Stock Units are granted to employees and members of the Board of Directors. Vesting generally occurs over a period of three to four years of continued service by the employee in equal annual installments. Vesting is immediate in the case of members of the Board of Directors. In some cases, Stock Unit vesting is subject to the attainment of a pre-determined financial target (“Performance Shares”). Performance Shares generally vest over a period of three to four years.
At the end of each reporting period, we evaluate the probability that the Performance Shares will vest. We record share-based compensation expense on an accelerated basis based on the grant-date fair value and the probability that the pre-determined financial target will be achieved.
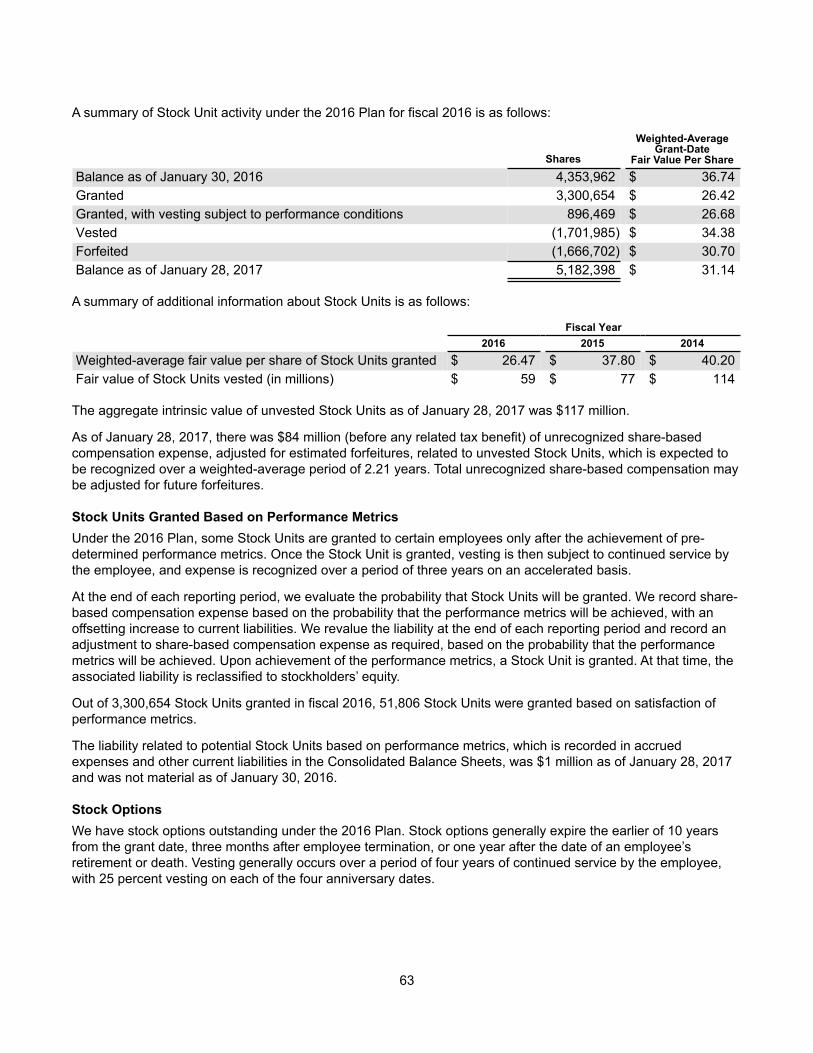
63
A summary of Stock Unit activity under the 2016 Plan for fiscal 2016 is as follows:
Shares
Weighted-AverageGrant-Date
Fair Value Per ShareBalance as of January 30, 2016 4,353,962 $ 36.74Granted 3,300,654 $ 26.42Granted, with vesting subject to performance conditions 896,469 $ 26.68Vested (1,701,985) $ 34.38Forfeited (1,666,702) $ 30.70Balance as of January 28, 2017 5,182,398 $ 31.14
A summary of additional information about Stock Units is as follows:
Fiscal Year 2016 2015 2014Weighted-average fair value per share of Stock Units granted $ 26.47 $ 37.80 $ 40.20Fair value of Stock Units vested (in millions) $ 59 $ 77 $ 114
The aggregate intrinsic value of unvested Stock Units as of January 28, 2017 was $117 million.
As of January 28, 2017, there was $84 million (before any related tax benefit) of unrecognized share-based compensation expense, adjusted for estimated forfeitures, related to unvested Stock Units, which is expected to be recognized over a weighted-average period of 2.21 years. Total unrecognized share-based compensation may be adjusted for future forfeitures.
Stock Units Granted Based on Performance MetricsUnder the 2016 Plan, some Stock Units are granted to certain employees only after the achievement of pre-determined performance metrics. Once the Stock Unit is granted, vesting is then subject to continued service by the employee, and expense is recognized over a period of three years on an accelerated basis.
At the end of each reporting period, we evaluate the probability that Stock Units will be granted. We record share-based compensation expense based on the probability that the performance metrics will be achieved, with an offsetting increase to current liabilities. We revalue the liability at the end of each reporting period and record an adjustment to share-based compensation expense as required, based on the probability that the performance metrics will be achieved. Upon achievement of the performance metrics, a Stock Unit is granted. At that time, the associated liability is reclassified to stockholders’ equity.
Out of 3,300,654 Stock Units granted in fiscal 2016, 51,806 Stock Units were granted based on satisfaction of performance metrics.
The liability related to potential Stock Units based on performance metrics, which is recorded in accrued expenses and other current liabilities in the Consolidated Balance Sheets, was $1 million as of January 28, 2017 and was not material as of January 30, 2016.
Stock OptionsWe have stock options outstanding under the 2016 Plan. Stock options generally expire the earlier of 10 years from the grant date, three months after employee termination, or one year after the date of an employee’s retirement or death. Vesting generally occurs over a period of four years of continued service by the employee, with 25 percent vesting on each of the four anniversary dates.
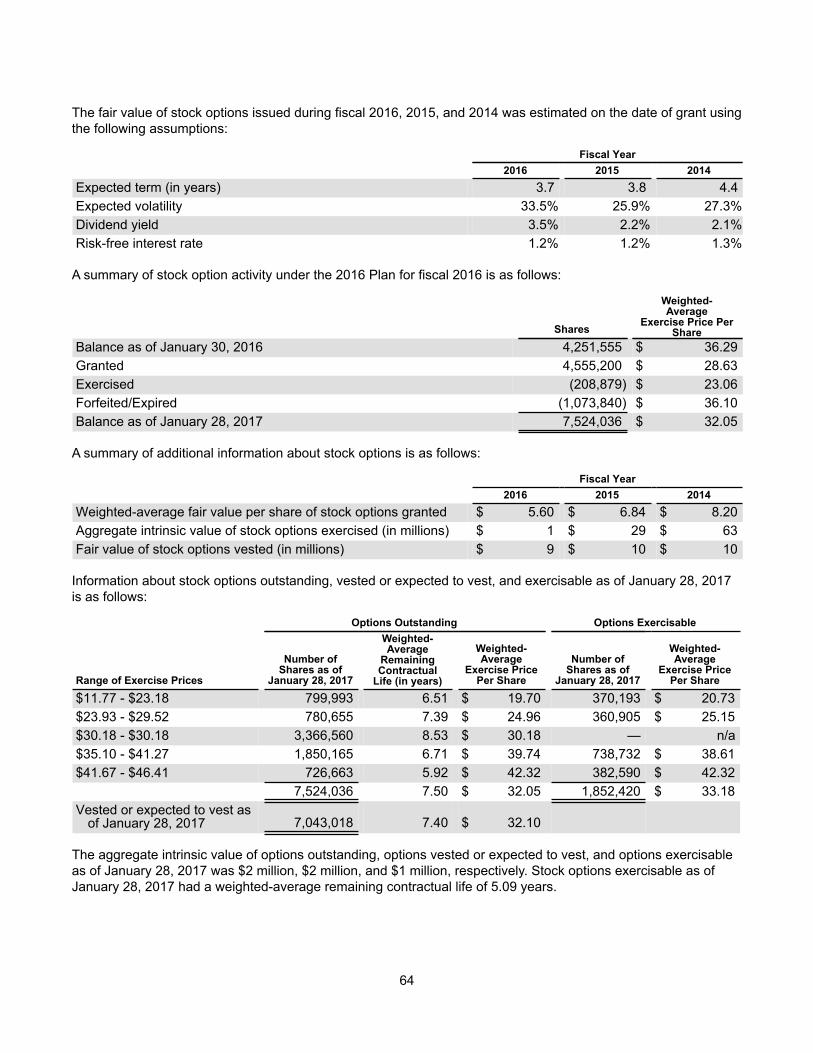
64
The fair value of stock options issued during fiscal 2016, 2015, and 2014 was estimated on the date of grant using the following assumptions:
Fiscal Year 2016 2015 2014Expected term (in years) 3.7 3.8 4.4Expected volatility 33.5% 25.9% 27.3%Dividend yield 3.5% 2.2% 2.1%Risk-free interest rate 1.2% 1.2% 1.3%
A summary of stock option activity under the 2016 Plan for fiscal 2016 is as follows:
Shares
Weighted-Average
Exercise Price Per Share
Balance as of January 30, 2016 4,251,555 $ 36.29Granted 4,555,200 $ 28.63Exercised (208,879) $ 23.06Forfeited/Expired (1,073,840) $ 36.10Balance as of January 28, 2017 7,524,036 $ 32.05
A summary of additional information about stock options is as follows:
Fiscal Year 2016 2015 2014Weighted-average fair value per share of stock options granted $ 5.60 $ 6.84 $ 8.20Aggregate intrinsic value of stock options exercised (in millions) $ 1 $ 29 $ 63Fair value of stock options vested (in millions) $ 9 $ 10 $ 10
Information about stock options outstanding, vested or expected to vest, and exercisable as of January 28, 2017 is as follows:
Options Outstanding Options Exercisable
Range of Exercise Prices
Number ofShares as of
January 28, 2017
Weighted-Average
RemainingContractual
Life (in years)
Weighted-Average
Exercise Price Per Share
Number ofShares as of
January 28, 2017
Weighted-Average
Exercise Price Per Share
$11.77 - $23.18 799,993 6.51 $ 19.70 370,193 $ 20.73$23.93 - $29.52 780,655 7.39 $ 24.96 360,905 $ 25.15$30.18 - $30.18 3,366,560 8.53 $ 30.18 — n/a$35.10 - $41.27 1,850,165 6.71 $ 39.74 738,732 $ 38.61$41.67 - $46.41 726,663 5.92 $ 42.32 382,590 $ 42.32
7,524,036 7.50 $ 32.05 1,852,420 $ 33.18Vested or expected to vest as
of January 28, 2017 7,043,018 7.40 $ 32.10
The aggregate intrinsic value of options outstanding, options vested or expected to vest, and options exercisable as of January 28, 2017 was $2 million, $2 million, and $1 million, respectively. Stock options exercisable as of January 28, 2017 had a weighted-average remaining contractual life of 5.09 years.

65
Employee Stock Purchase PlanUnder our Employee Stock Purchase Plan (“ESPP”), eligible U.S. employees are able to purchase our common stock at 85 percent of the closing price on the New York Stock Exchange on the last day of the three-month purchase periods. Accordingly, compensation expense is recognized for an amount equal to the 15 percent discount. Employees pay for their stock purchases through payroll deductions at a rate equal to any whole percentage from 1 percent to 15 percent. There were 1,260,361, 949,751, and 785,794 shares issued under the ESPP in fiscal 2016, 2015, and 2014, respectively. As of January 28, 2017, there were 1,257,830 shares reserved for future issuances under the ESPP. The ESPP was amended and restated in February 2017, subject to shareholder approval.
Note 12. LeasesWe lease most of our store premises and some of our corporate facilities and distribution centers. These operating leases expire at various dates through 2032. Most store leases have a five-year base period and include options that allow us to extend the lease term beyond the initial base period, subject to terms agreed upon at lease inception. Some leases also include early termination options, which can be exercised under specific conditions.
The aggregate minimum non-cancelable annual lease payments under leases in effect on January 28, 2017 are as follows:
($ in millions) Fiscal Year
2017 $ 1,1282018 1,1112019 9802020 8262021 623Thereafter 1,874Total minimum lease commitments $ 6,542
The total minimum lease commitment amount above does not include minimum sublease rent income of $20 million receivable in the future under non-cancelable sublease agreements.
Rent expense related to our store premises, corporate facilities, and distribution centers under operating leases is as follows:
Fiscal Year($ in millions) 2016 2015 2014Minimum rent expense $ 1,208 $ 1,211 $ 1,209Contingent rent expense 107 106 114Less: Sublease income (4) (4) (4)Total $ 1,311 $ 1,313 $ 1,319
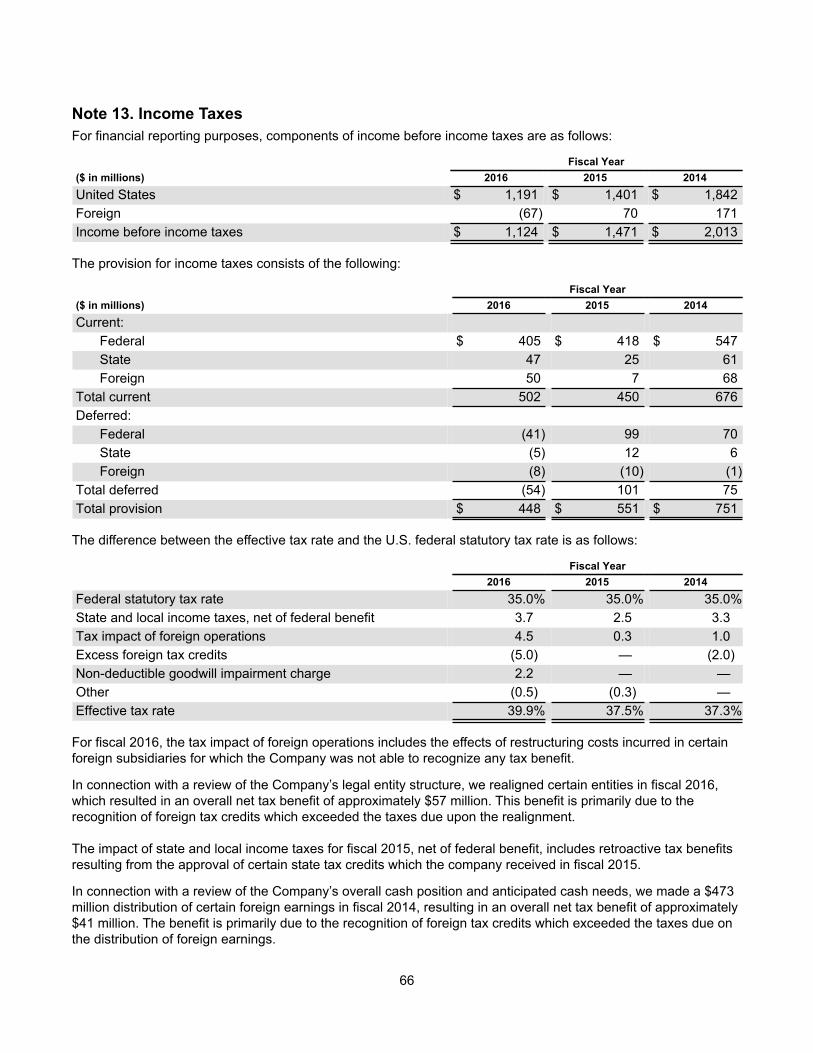
66
Note 13. Income Taxes For financial reporting purposes, components of income before income taxes are as follows:
Fiscal Year($ in millions) 2016 2015 2014United States $ 1,191 $ 1,401 $ 1,842Foreign (67) 70 171Income before income taxes $ 1,124 $ 1,471 $ 2,013
The provision for income taxes consists of the following:
Fiscal Year($ in millions) 2016 2015 2014Current:
Federal $ 405 $ 418 $ 547State 47 25 61Foreign 50 7 68
Total current 502 450 676Deferred:
Federal (41) 99 70State (5) 12 6Foreign (8) (10) (1)
Total deferred (54) 101 75Total provision $ 448 $ 551 $ 751
The difference between the effective tax rate and the U.S. federal statutory tax rate is as follows:
Fiscal Year 2016 2015 2014Federal statutory tax rate 35.0% 35.0% 35.0%State and local income taxes, net of federal benefit 3.7 2.5 3.3Tax impact of foreign operations 4.5 0.3 1.0Excess foreign tax credits (5.0) — (2.0)Non-deductible goodwill impairment charge 2.2 — —Other (0.5) (0.3) —Effective tax rate 39.9% 37.5% 37.3%
For fiscal 2016, the tax impact of foreign operations includes the effects of restructuring costs incurred in certain foreign subsidiaries for which the Company was not able to recognize any tax benefit.
In connection with a review of the Company’s legal entity structure, we realigned certain entities in fiscal 2016, which resulted in an overall net tax benefit of approximately $57 million. This benefit is primarily due to the recognition of foreign tax credits which exceeded the taxes due upon the realignment.
The impact of state and local income taxes for fiscal 2015, net of federal benefit, includes retroactive tax benefits resulting from the approval of certain state tax credits which the company received in fiscal 2015.
In connection with a review of the Company’s overall cash position and anticipated cash needs, we made a $473 million distribution of certain foreign earnings in fiscal 2014, resulting in an overall net tax benefit of approximately $41 million. The benefit is primarily due to the recognition of foreign tax credits which exceeded the taxes due on the distribution of foreign earnings.
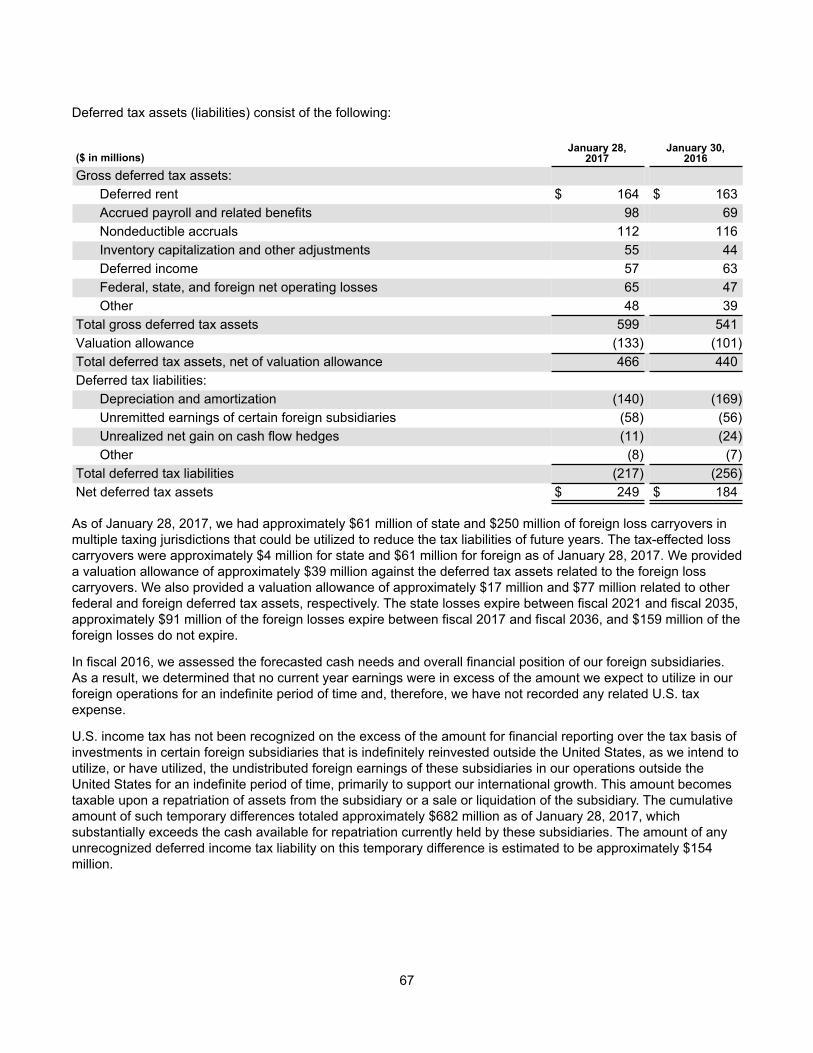
67
Deferred tax assets (liabilities) consist of the following:
($ in millions)January 28,
2017January 30,
2016Gross deferred tax assets:
Deferred rent $ 164 $ 163Accrued payroll and related benefits 98 69Nondeductible accruals 112 116Inventory capitalization and other adjustments 55 44Deferred income 57 63Federal, state, and foreign net operating losses 65 47Other 48 39
Total gross deferred tax assets 599 541Valuation allowance (133) (101)Total deferred tax assets, net of valuation allowance 466 440Deferred tax liabilities:
Depreciation and amortization (140) (169)Unremitted earnings of certain foreign subsidiaries (58) (56)Unrealized net gain on cash flow hedges (11) (24)Other (8) (7)
Total deferred tax liabilities (217) (256)Net deferred tax assets $ 249 $ 184
As of January 28, 2017, we had approximately $61 million of state and $250 million of foreign loss carryovers in multiple taxing jurisdictions that could be utilized to reduce the tax liabilities of future years. The tax-effected loss carryovers were approximately $4 million for state and $61 million for foreign as of January 28, 2017. We provided a valuation allowance of approximately $39 million against the deferred tax assets related to the foreign loss carryovers. We also provided a valuation allowance of approximately $17 million and $77 million related to other federal and foreign deferred tax assets, respectively. The state losses expire between fiscal 2021 and fiscal 2035, approximately $91 million of the foreign losses expire between fiscal 2017 and fiscal 2036, and $159 million of the foreign losses do not expire.
In fiscal 2016, we assessed the forecasted cash needs and overall financial position of our foreign subsidiaries. As a result, we determined that no current year earnings were in excess of the amount we expect to utilize in our foreign operations for an indefinite period of time and, therefore, we have not recorded any related U.S. tax expense.
U.S. income tax has not been recognized on the excess of the amount for financial reporting over the tax basis of investments in certain foreign subsidiaries that is indefinitely reinvested outside the United States, as we intend to utilize, or have utilized, the undistributed foreign earnings of these subsidiaries in our operations outside the United States for an indefinite period of time, primarily to support our international growth. This amount becomes taxable upon a repatriation of assets from the subsidiary or a sale or liquidation of the subsidiary. The cumulative amount of such temporary differences totaled approximately $682 million as of January 28, 2017, which substantially exceeds the cash available for repatriation currently held by these subsidiaries. The amount of any unrecognized deferred income tax liability on this temporary difference is estimated to be approximately $154 million.
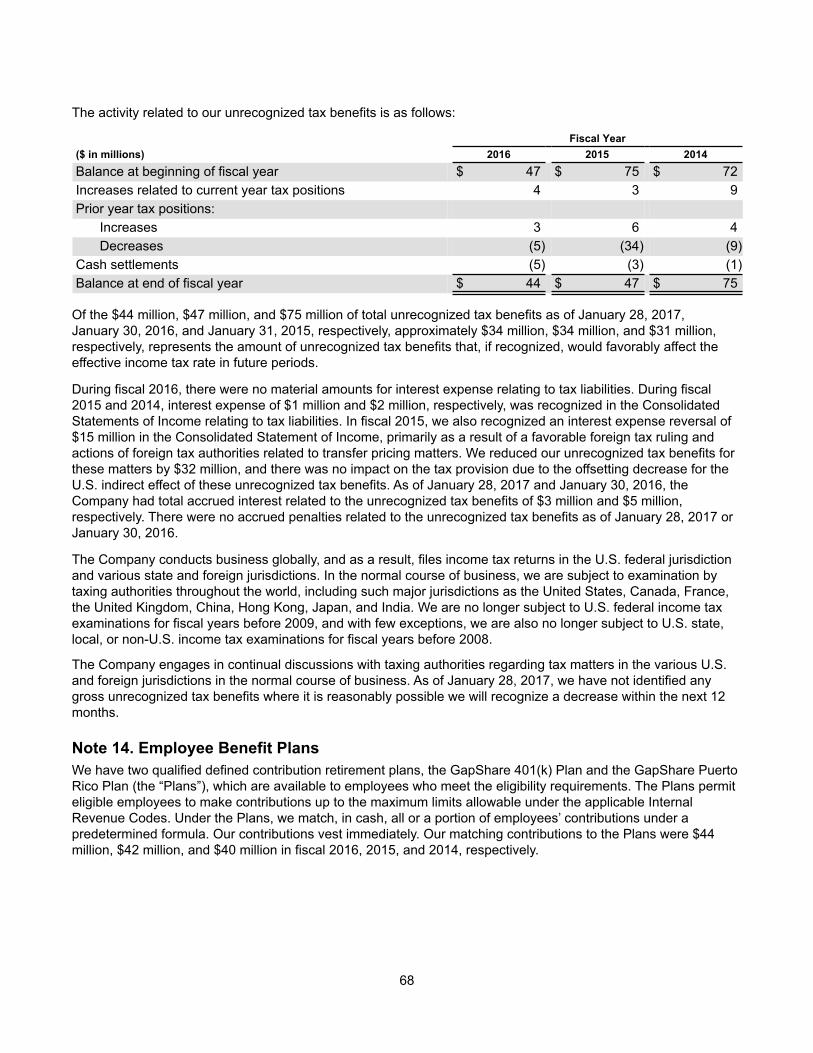
68
The activity related to our unrecognized tax benefits is as follows:
Fiscal Year($ in millions) 2016 2015 2014Balance at beginning of fiscal year $ 47 $ 75 $ 72Increases related to current year tax positions 4 3 9Prior year tax positions:
Increases 3 6 4Decreases (5) (34) (9)
Cash settlements (5) (3) (1)Balance at end of fiscal year $ 44 $ 47 $ 75
Of the $44 million, $47 million, and $75 million of total unrecognized tax benefits as of January 28, 2017, January 30, 2016, and January 31, 2015, respectively, approximately $34 million, $34 million, and $31 million, respectively, represents the amount of unrecognized tax benefits that, if recognized, would favorably affect the effective income tax rate in future periods.
During fiscal 2016, there were no material amounts for interest expense relating to tax liabilities. During fiscal 2015 and 2014, interest expense of $1 million and $2 million, respectively, was recognized in the Consolidated Statements of Income relating to tax liabilities. In fiscal 2015, we also recognized an interest expense reversal of $15 million in the Consolidated Statement of Income, primarily as a result of a favorable foreign tax ruling and actions of foreign tax authorities related to transfer pricing matters. We reduced our unrecognized tax benefits for these matters by $32 million, and there was no impact on the tax provision due to the offsetting decrease for the U.S. indirect effect of these unrecognized tax benefits. As of January 28, 2017 and January 30, 2016, the Company had total accrued interest related to the unrecognized tax benefits of $3 million and $5 million, respectively. There were no accrued penalties related to the unrecognized tax benefits as of January 28, 2017 or January 30, 2016.
The Company conducts business globally, and as a result, files income tax returns in the U.S. federal jurisdiction and various state and foreign jurisdictions. In the normal course of business, we are subject to examination by taxing authorities throughout the world, including such major jurisdictions as the United States, Canada, France, the United Kingdom, China, Hong Kong, Japan, and India. We are no longer subject to U.S. federal income tax examinations for fiscal years before 2009, and with few exceptions, we are also no longer subject to U.S. state, local, or non-U.S. income tax examinations for fiscal years before 2008.
The Company engages in continual discussions with taxing authorities regarding tax matters in the various U.S. and foreign jurisdictions in the normal course of business. As of January 28, 2017, we have not identified any gross unrecognized tax benefits where it is reasonably possible we will recognize a decrease within the next 12 months.
Note 14. Employee Benefit PlansWe have two qualified defined contribution retirement plans, the GapShare 401(k) Plan and the GapShare Puerto Rico Plan (the “Plans”), which are available to employees who meet the eligibility requirements. The Plans permit eligible employees to make contributions up to the maximum limits allowable under the applicable Internal Revenue Codes. Under the Plans, we match, in cash, all or a portion of employees’ contributions under a predetermined formula. Our contributions vest immediately. Our matching contributions to the Plans were $44 million, $42 million, and $40 million in fiscal 2016, 2015, and 2014, respectively.
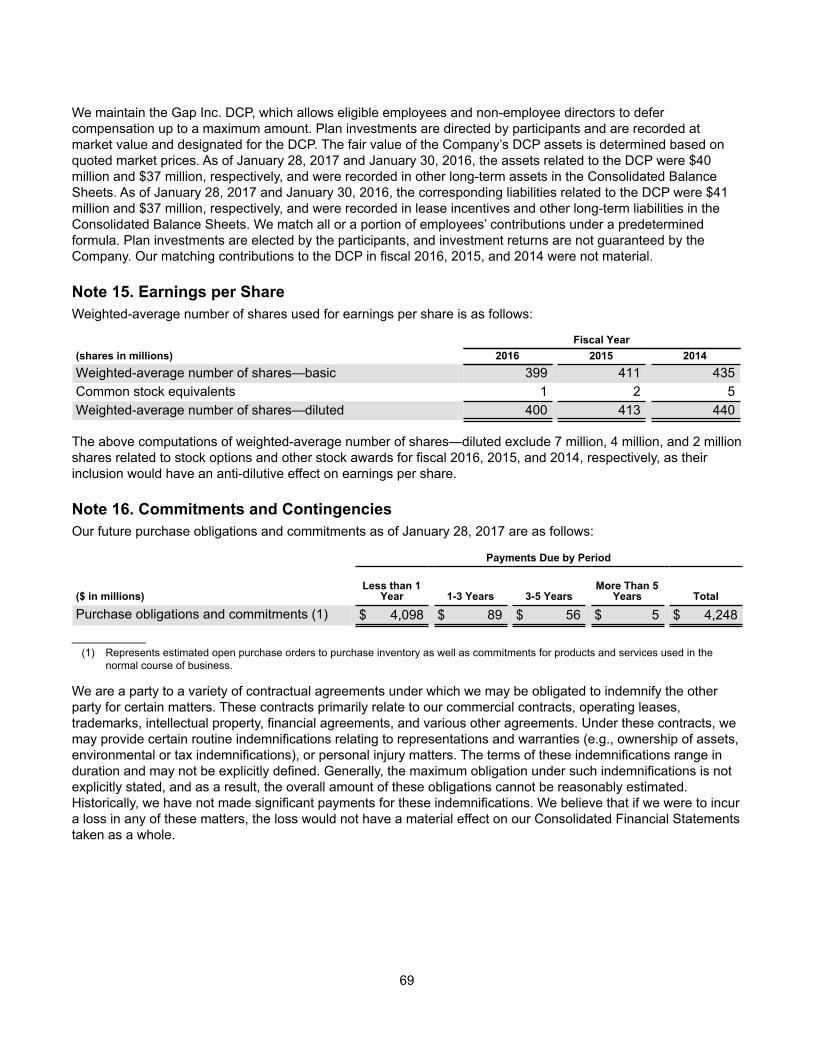
69
We maintain the Gap Inc. DCP, which allows eligible employees and non-employee directors to defer compensation up to a maximum amount. Plan investments are directed by participants and are recorded at market value and designated for the DCP. The fair value of the Company’s DCP assets is determined based on quoted market prices. As of January 28, 2017 and January 30, 2016, the assets related to the DCP were $40 million and $37 million, respectively, and were recorded in other long-term assets in the Consolidated Balance Sheets. As of January 28, 2017 and January 30, 2016, the corresponding liabilities related to the DCP were $41 million and $37 million, respectively, and were recorded in lease incentives and other long-term liabilities in the Consolidated Balance Sheets. We match all or a portion of employees’ contributions under a predetermined formula. Plan investments are elected by the participants, and investment returns are not guaranteed by the Company. Our matching contributions to the DCP in fiscal 2016, 2015, and 2014 were not material.
Note 15. Earnings per ShareWeighted-average number of shares used for earnings per share is as follows:
Fiscal Year(shares in millions) 2016 2015 2014Weighted-average number of shares—basic 399 411 435Common stock equivalents 1 2 5Weighted-average number of shares—diluted 400 413 440
The above computations of weighted-average number of shares—diluted exclude 7 million, 4 million, and 2 million shares related to stock options and other stock awards for fiscal 2016, 2015, and 2014, respectively, as their inclusion would have an anti-dilutive effect on earnings per share.
Note 16. Commitments and ContingenciesOur future purchase obligations and commitments as of January 28, 2017 are as follows:
Payments Due by Period
($ in millions)Less than 1
Year 1-3 Years 3-5 YearsMore Than 5
Years Total
Purchase obligations and commitments (1) $ 4,098 $ 89 $ 56 $ 5 $ 4,248__________
(1) Represents estimated open purchase orders to purchase inventory as well as commitments for products and services used in the normal course of business.
We are a party to a variety of contractual agreements under which we may be obligated to indemnify the other party for certain matters. These contracts primarily relate to our commercial contracts, operating leases, trademarks, intellectual property, financial agreements, and various other agreements. Under these contracts, we may provide certain routine indemnifications relating to representations and warranties (e.g., ownership of assets, environmental or tax indemnifications), or personal injury matters. The terms of these indemnifications range in duration and may not be explicitly defined. Generally, the maximum obligation under such indemnifications is not explicitly stated, and as a result, the overall amount of these obligations cannot be reasonably estimated. Historically, we have not made significant payments for these indemnifications. We believe that if we were to incur a loss in any of these matters, the loss would not have a material effect on our Consolidated Financial Statements taken as a whole.
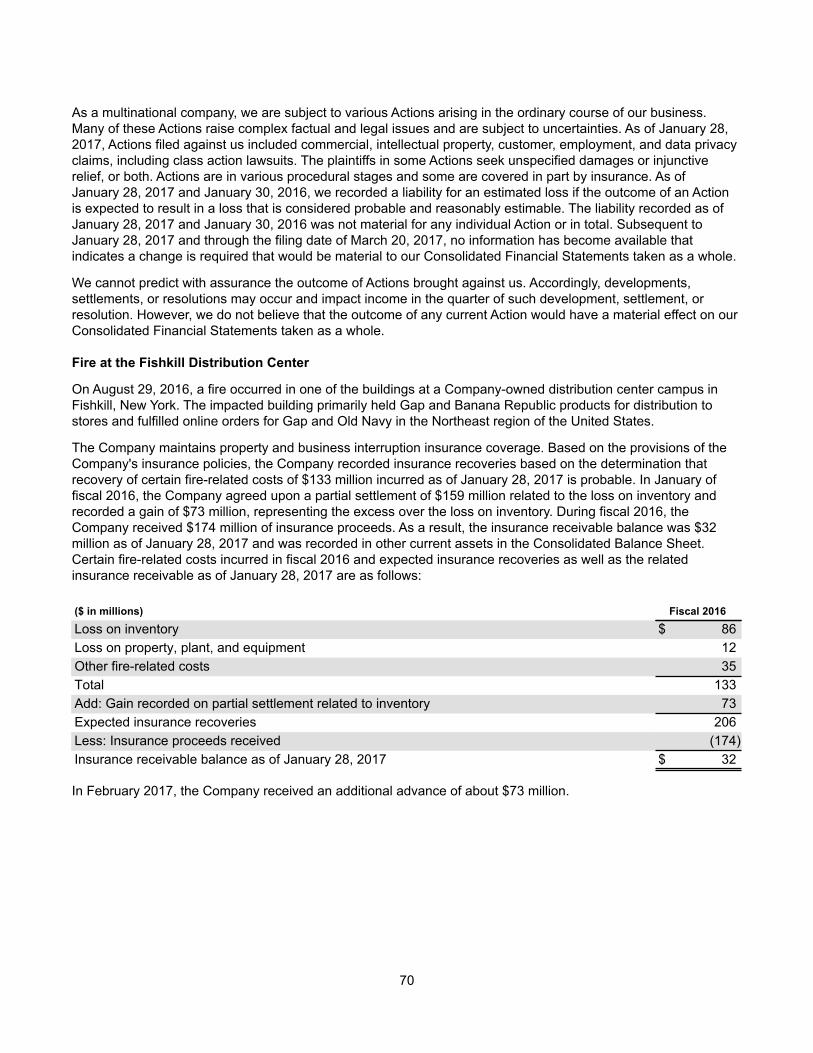
70
As a multinational company, we are subject to various Actions arising in the ordinary course of our business. Many of these Actions raise complex factual and legal issues and are subject to uncertainties. As of January 28, 2017, Actions filed against us included commercial, intellectual property, customer, employment, and data privacy claims, including class action lawsuits. The plaintiffs in some Actions seek unspecified damages or injunctive relief, or both. Actions are in various procedural stages and some are covered in part by insurance. As of January 28, 2017 and January 30, 2016, we recorded a liability for an estimated loss if the outcome of an Action is expected to result in a loss that is considered probable and reasonably estimable. The liability recorded as of January 28, 2017 and January 30, 2016 was not material for any individual Action or in total. Subsequent to January 28, 2017 and through the filing date of March 20, 2017, no information has become available that indicates a change is required that would be material to our Consolidated Financial Statements taken as a whole.
We cannot predict with assurance the outcome of Actions brought against us. Accordingly, developments, settlements, or resolutions may occur and impact income in the quarter of such development, settlement, or resolution. However, we do not believe that the outcome of any current Action would have a material effect on our Consolidated Financial Statements taken as a whole.
Fire at the Fishkill Distribution Center
On August 29, 2016, a fire occurred in one of the buildings at a Company-owned distribution center campus in Fishkill, New York. The impacted building primarily held Gap and Banana Republic products for distribution to stores and fulfilled online orders for Gap and Old Navy in the Northeast region of the United States.
The Company maintains property and business interruption insurance coverage. Based on the provisions of the Company's insurance policies, the Company recorded insurance recoveries based on the determination that recovery of certain fire-related costs of $133 million incurred as of January 28, 2017 is probable. In January of fiscal 2016, the Company agreed upon a partial settlement of $159 million related to the loss on inventory and recorded a gain of $73 million, representing the excess over the loss on inventory. During fiscal 2016, the Company received $174 million of insurance proceeds. As a result, the insurance receivable balance was $32 million as of January 28, 2017 and was recorded in other current assets in the Consolidated Balance Sheet. Certain fire-related costs incurred in fiscal 2016 and expected insurance recoveries as well as the related insurance receivable as of January 28, 2017 are as follows:
($ in millions) Fiscal 2016
Loss on inventory $ 86Loss on property, plant, and equipment 12Other fire-related costs 35Total 133Add: Gain recorded on partial settlement related to inventory 73Expected insurance recoveries 206Less: Insurance proceeds received (174)Insurance receivable balance as of January 28, 2017 $ 32
In February 2017, the Company received an additional advance of about $73 million.
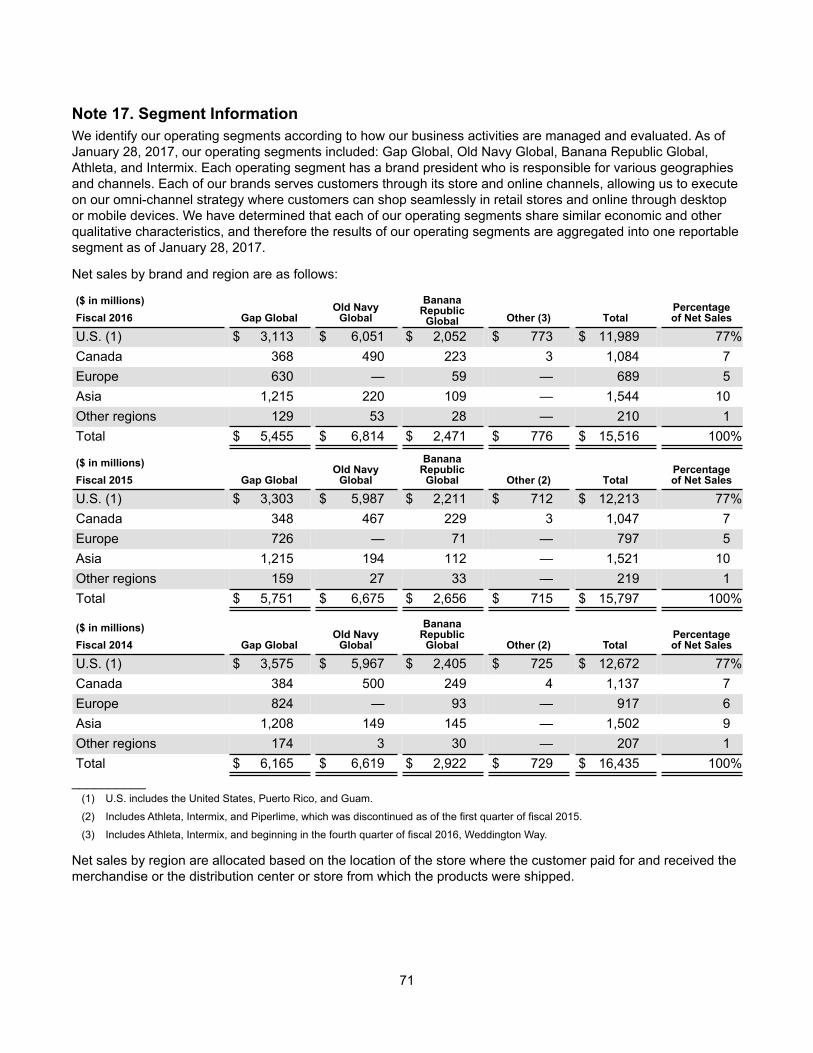
71
Note 17. Segment InformationWe identify our operating segments according to how our business activities are managed and evaluated. As of January 28, 2017, our operating segments included: Gap Global, Old Navy Global, Banana Republic Global, Athleta, and Intermix. Each operating segment has a brand president who is responsible for various geographies and channels. Each of our brands serves customers through its store and online channels, allowing us to execute on our omni-channel strategy where customers can shop seamlessly in retail stores and online through desktop or mobile devices. We have determined that each of our operating segments share similar economic and other qualitative characteristics, and therefore the results of our operating segments are aggregated into one reportable segment as of January 28, 2017.
Net sales by brand and region are as follows:
($ in millions)Gap Global
Old NavyGlobal
BananaRepublic
Global Other (3) TotalPercentageof Net SalesFiscal 2016
U.S. (1) $ 3,113 $ 6,051 $ 2,052 $ 773 $ 11,989 77%Canada 368 490 223 3 1,084 7Europe 630 — 59 — 689 5Asia 1,215 220 109 — 1,544 10Other regions 129 53 28 — 210 1Total $ 5,455 $ 6,814 $ 2,471 $ 776 $ 15,516 100%
($ in millions)Gap Global
Old NavyGlobal
BananaRepublic
Global Other (2) TotalPercentageof Net SalesFiscal 2015
U.S. (1) $ 3,303 $ 5,987 $ 2,211 $ 712 $ 12,213 77%Canada 348 467 229 3 1,047 7Europe 726 — 71 — 797 5Asia 1,215 194 112 — 1,521 10Other regions 159 27 33 — 219 1Total $ 5,751 $ 6,675 $ 2,656 $ 715 $ 15,797 100%
($ in millions)Gap Global
Old Navy Global
BananaRepublic
Global Other (2) TotalPercentageof Net SalesFiscal 2014
U.S. (1) $ 3,575 $ 5,967 $ 2,405 $ 725 $ 12,672 77%Canada 384 500 249 4 1,137 7Europe 824 — 93 — 917 6Asia 1,208 149 145 — 1,502 9Other regions 174 3 30 — 207 1Total $ 6,165 $ 6,619 $ 2,922 $ 729 $ 16,435 100%
__________(1) U.S. includes the United States, Puerto Rico, and Guam.
(2) Includes Athleta, Intermix, and Piperlime, which was discontinued as of the first quarter of fiscal 2015.
(3) Includes Athleta, Intermix, and beginning in the fourth quarter of fiscal 2016, Weddington Way.
Net sales by region are allocated based on the location of the store where the customer paid for and received the merchandise or the distribution center or store from which the products were shipped.
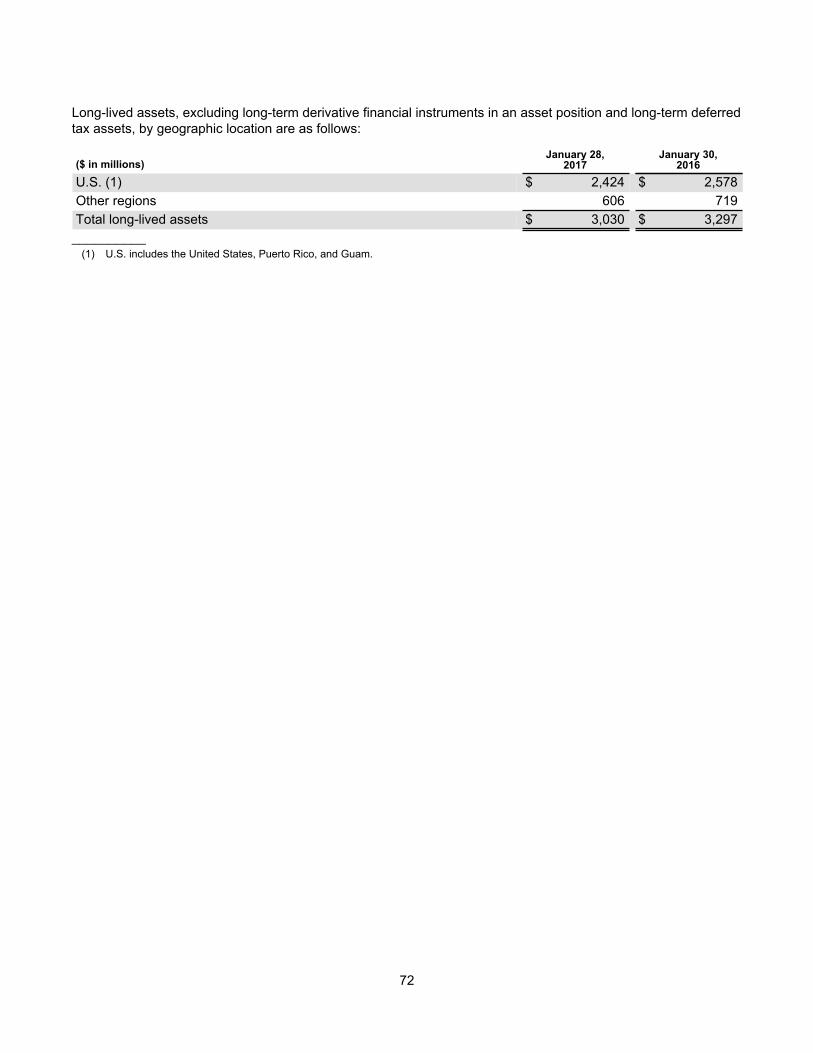
72
Long-lived assets, excluding long-term derivative financial instruments in an asset position and long-term deferred tax assets, by geographic location are as follows:
($ in millions)January 28,
2017January 30,
2016U.S. (1) $ 2,424 $ 2,578Other regions 606 719Total long-lived assets $ 3,030 $ 3,297
__________(1) U.S. includes the United States, Puerto Rico, and Guam.
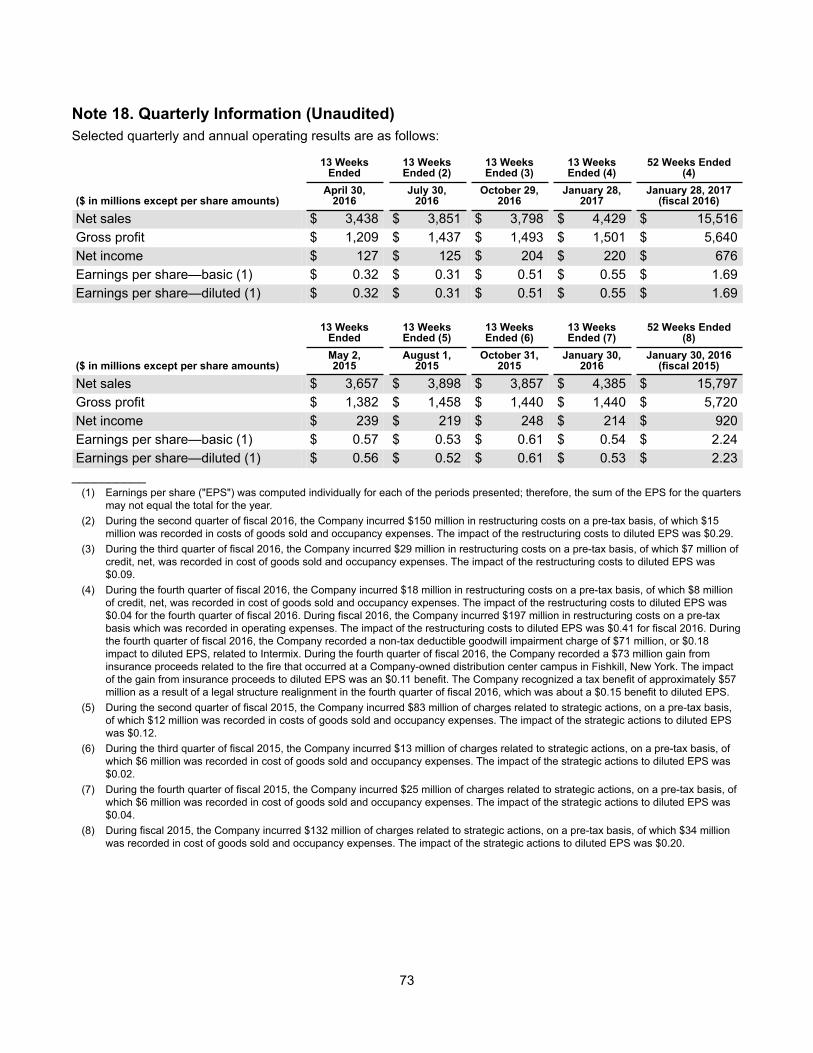
73
Note 18. Quarterly Information (Unaudited)Selected quarterly and annual operating results are as follows:
13 Weeks
Ended13 WeeksEnded (2)
13 WeeksEnded (3)
13 WeeksEnded (4)
52 Weeks Ended(4)
($ in millions except per share amounts)April 30,
2016July 30,
2016October 29,
2016January 28,
2017January 28, 2017
(fiscal 2016)
Net sales $ 3,438 $ 3,851 $ 3,798 $ 4,429 $ 15,516Gross profit $ 1,209 $ 1,437 $ 1,493 $ 1,501 $ 5,640Net income $ 127 $ 125 $ 204 $ 220 $ 676Earnings per share—basic (1) $ 0.32 $ 0.31 $ 0.51 $ 0.55 $ 1.69Earnings per share—diluted (1) $ 0.32 $ 0.31 $ 0.51 $ 0.55 $ 1.69
13 Weeks
Ended13 WeeksEnded (5)
13 WeeksEnded (6)
13 WeeksEnded (7)
52 Weeks Ended(8)
($ in millions except per share amounts)May 2,2015
August 1,2015
October 31,2015
January 30,2016
January 30, 2016(fiscal 2015)
Net sales $ 3,657 $ 3,898 $ 3,857 $ 4,385 $ 15,797Gross profit $ 1,382 $ 1,458 $ 1,440 $ 1,440 $ 5,720Net income $ 239 $ 219 $ 248 $ 214 $ 920Earnings per share—basic (1) $ 0.57 $ 0.53 $ 0.61 $ 0.54 $ 2.24Earnings per share—diluted (1) $ 0.56 $ 0.52 $ 0.61 $ 0.53 $ 2.23
__________(1) Earnings per share ("EPS") was computed individually for each of the periods presented; therefore, the sum of the EPS for the quarters
may not equal the total for the year.(2) During the second quarter of fiscal 2016, the Company incurred $150 million in restructuring costs on a pre-tax basis, of which $15
million was recorded in costs of goods sold and occupancy expenses. The impact of the restructuring costs to diluted EPS was $0.29.(3) During the third quarter of fiscal 2016, the Company incurred $29 million in restructuring costs on a pre-tax basis, of which $7 million of
credit, net, was recorded in cost of goods sold and occupancy expenses. The impact of the restructuring costs to diluted EPS was $0.09.
(4) During the fourth quarter of fiscal 2016, the Company incurred $18 million in restructuring costs on a pre-tax basis, of which $8 million of credit, net, was recorded in cost of goods sold and occupancy expenses. The impact of the restructuring costs to diluted EPS was $0.04 for the fourth quarter of fiscal 2016. During fiscal 2016, the Company incurred $197 million in restructuring costs on a pre-tax basis which was recorded in operating expenses. The impact of the restructuring costs to diluted EPS was $0.41 for fiscal 2016. During the fourth quarter of fiscal 2016, the Company recorded a non-tax deductible goodwill impairment charge of $71 million, or $0.18 impact to diluted EPS, related to Intermix. During the fourth quarter of fiscal 2016, the Company recorded a $73 million gain from insurance proceeds related to the fire that occurred at a Company-owned distribution center campus in Fishkill, New York. The impact of the gain from insurance proceeds to diluted EPS was an $0.11 benefit. The Company recognized a tax benefit of approximately $57 million as a result of a legal structure realignment in the fourth quarter of fiscal 2016, which was about a $0.15 benefit to diluted EPS.
(5) During the second quarter of fiscal 2015, the Company incurred $83 million of charges related to strategic actions, on a pre-tax basis, of which $12 million was recorded in costs of goods sold and occupancy expenses. The impact of the strategic actions to diluted EPS was $0.12.
(6) During the third quarter of fiscal 2015, the Company incurred $13 million of charges related to strategic actions, on a pre-tax basis, of which $6 million was recorded in cost of goods sold and occupancy expenses. The impact of the strategic actions to diluted EPS was $0.02.
(7) During the fourth quarter of fiscal 2015, the Company incurred $25 million of charges related to strategic actions, on a pre-tax basis, of which $6 million was recorded in cost of goods sold and occupancy expenses. The impact of the strategic actions to diluted EPS was $0.04.
(8) During fiscal 2015, the Company incurred $132 million of charges related to strategic actions, on a pre-tax basis, of which $34 million was recorded in cost of goods sold and occupancy expenses. The impact of the strategic actions to diluted EPS was $0.20.
74
Item 9. Changes in and Disagreements With Accountants on Accounting and Financial Disclosure.None.
Item 9A. Controls and Procedures.Evaluation of Disclosure Controls and ProceduresWe carried out an evaluation, under the supervision and with the participation of management, including the Chief Executive Officer and Chief Financial Officer, of the effectiveness of the design and operation of our disclosure controls and procedures (as defined in Exchange Act Rule 13a-15(e)) as of the end of the period covered by this Annual Report on Form 10-K. Based upon that evaluation, the Chief Executive Officer and Chief Financial Officer concluded that the Company’s disclosure controls and procedures are effective.
Management’s Report on Internal Control over Financial ReportingOur management is responsible for establishing and maintaining an adequate system of internal control over financial reporting, as defined in Exchange Act Rule 13a-15(f). Management conducted an assessment of our internal control over financial reporting based on the framework established by the Committee of Sponsoring Organizations of the Treadway Commission in Internal Control—Integrated Framework (released in 2013). Based on the assessment, management concluded that as of January 28, 2017, our internal control over financial reporting is effective. The Company’s internal control over financial reporting as of January 28, 2017 has been audited by Deloitte & Touche LLP, an independent registered public accounting firm, as stated in their report which is included herein.
Changes in Internal Control over Financial ReportingThere was no change in the Company’s internal control over financial reporting that occurred during the Company’s fourth quarter of fiscal 2016 that has materially affected, or is reasonably likely to materially affect, the Company’s internal control over financial reporting.
Item 9B. Other Information.Not applicable.
Part IIIItem 10. Directors, Executive Officers and Corporate Governance.The information required by this item is incorporated herein by reference to the sections entitled “Nominees for Election as Directors,” “Corporate Governance—Audit and Finance Committee,” and “Section 16(a) Beneficial Ownership Reporting Compliance” in the 2017 Proxy Statement. See also Part I, Item 1 in the section entitled “Executive Officers of the Registrant.”
The Company has adopted a code of ethics, our Code of Business Conduct, which applies to all employees including our principal executive officer, principal financial officer, controller, and persons performing similar functions. Our Code of Business Conduct is available on our website, gapinc.com, under “Investors, Corporate Compliance, Code of Business Conduct.” Any amendments and waivers to the Code will also be available on the website.
Item 11. Executive Compensation.The information required by this item is incorporated herein by reference to the sections entitled “Compensation of Directors,” “Corporate Governance—Compensation and Management Development Committee,” and “Executive Compensation and Related Information” in the 2017 Proxy Statement.

75
Item 12. Security Ownership of Certain Beneficial Owners and Management and Related Stockholder Matters.The information required by this item is incorporated herein by reference to the sections entitled “Executive Compensation and Related Information—Equity Compensation Plan Information” and “Beneficial Ownership of Shares” in the 2017 Proxy Statement.
Item 13. Certain Relationships and Related Transactions, and Director Independence.The information required by this item is incorporated herein by reference to the sections entitled “Policies and Procedures with Respect to Related Party Transactions” and “Nominees for Election as Directors—Director Independence” in the 2017 Proxy Statement.
Item 14. Principal Accounting Fees and Services.The information required by this item is incorporated herein by reference to the section entitled “Principal Accounting Firm Fees” in the 2017 Proxy Statement.
76
Part IVItem 15. Exhibits, Financial Statement Schedules.1. Financial Statements: See “Index to Consolidated Financial Statements” in Part II, Item 8 of this Form 10-
K.
2. Financial Statement Schedules: Schedules are included in the Consolidated Financial Statements ornotes of this Form 10-K or are not required.
3. Exhibits: The exhibits listed in the accompanying index to exhibits are filed or incorporated by referenceas part of this Form 10-K.
77
SIGNATURESPursuant to the requirements of Section 13 or 15(d) of the Securities Exchange Act of 1934, the registrant has duly caused this report to be signed on its behalf by the undersigned, thereunto duly authorized.
THE GAP, INC.
Date: March 20, 2017 By /s/ ARTHUR PECK
Arthur PeckChief Executive Officer
(Principal Executive Officer)
Date: March 20, 2017 By /s/ TERI LIST-STOLL
Teri List-StollExecutive Vice President and Chief Financial Officer
(Principal Financial and Accounting Officer)
Pursuant to the requirements of the Securities Exchange Act of 1934, this report has been signed below by the following persons on behalf of the registrant and in the capacities and on the dates indicated.
Date: March 20, 2017 By /s/ DOMENICO DE SOLEDomenico De Sole, Director
Date: March 20, 2017 By /s/ ROBERT J. FISHERRobert J. Fisher, Director
Date: March 20, 2017 By /s/ WILLIAM S. FISHERWilliam S. Fisher, Director
Date: March 20, 2017 By /s/ TRACY GARDNERTracy Gardner, Director
Date: March 20, 2017 By /s/ BRIAN GOLDNERBrian Goldner, Director
Date: March 20, 2017 By /s/ ISABELLA D. GORENIsabella D. Goren, Director
Date: March 20, 2017 By /s/ BOB L. MARTINBob L. Martin, Director
Date: March 20, 2017 By /s/ JORGE P. MONTOYAJorge P. Montoya, Director
Date: March 20, 2017 By /s/ ARTHUR PECKArthur Peck, Director
Date: March 20, 2017 By /s/ MAYO A. SHATTUCK IIIMayo A. Shattuck III, Director
Date: March 20, 2017 By /s/ KATHERINE TSANGKatherine Tsang, Director
78
Exhibit Index
3.1 Registrant’s Amended and Restated Certificate of Incorporation, filed as Exhibit 3.1 to Registrant’sAnnual Report on Form 10-K for the year ended January 30, 1993, Commission File No. 1-7562.
3.2
Certificate of Amendment of Amended and Restated Certificate of Incorporation, filed as Exhibit 3.2to Registrant’s Annual Report on Form 10-K for year ended January 29, 2000, CommissionFile No. 1-7562.
3.3 Amended and Restated Bylaws of the Company (effective February 1, 2015), filed as Exhibit 3(ii) toRegistrant’s Form 8-K on November 14, 2014, Commission File No. 1-7562.
4.1
Indenture, dated as of April 12, 2011, by and between Registrant and Wells Fargo Bank, NationalAssociation, as Trustee, filed as Exhibit 4.1 to Registrant’s Form 8-K on April 12, 2011, CommissionFile No. 1-7562.
4.2
First Supplemental Indenture, dated as of April 12, 2011, relating to the issuance of $1,250,000,000aggregate principal amount of Registrant’s 5.95% Notes due 2021, filed as Exhibit 4.2 to Registrant’sForm 8-K on April 12, 2011, Commission File No. 1-7562.
4.3 Form of Registrant’s 5.95% Notes due 2021, included as Exhibit A to First Supplemental Indenture,filed as Exhibit 4.2 to Registrant’s Form 8-K on April 12, 2011, Commission File No. 1-7562.
10.1
3-Year LC Agreement dated as of May 6, 2005 among The Gap, Inc., LC Subsidiaries, and HSBCBank USA, National Association (formerly HSBC Bank USA), as LC Issuer, filed as Exhibit 10.2 tothe Registrant’s Form 10-Q for the quarter ended May 1, 2010, Commission File No. 1-7562.
10.2
Letter Amendment No. 1 to the 3-Year Letter of Credit Agreement with HSBC Bank USA, NationalAssociation dated May 18, 2007, filed as Exhibit 10.3 to Registrant’s Form 8-K on May 24, 2007,Commission File No. 1-7562.
10.3
Letter Amendment No. 2 to the 3-Year Letter of Credit Agreement with HSBC Bank USA, NationalAssociation dated September 21, 2010, filed as Exhibit 10.1 to Registrant’s Form 10-Q for thequarter ended October 30, 2010, Commission File No. 1-7562.
10.4
Letter Amendment No. 3 to the 3-Year Letter of Credit Agreement with HSBC Bank USA, NationalAssociation dated August 24, 2012, filed as Exhibit 10.4 to Registrant’s Form 10-Q for the quarterended October 27, 2012, Commission File No. 1-7562.
10.5
Letter Amendment No. 4 to the 3-Year Letter of Credit Agreement with HSBC Bank USA, NationalAssociation dated April 15, 2014, filed as Exhibit 10.11 to Registrant’s Form 10-Q for the quarterended May 3, 2014, Commission File No. 1-7562.
10.6
Letter Agreement dated April 1, 2008 regarding the 3-Year Letter of Credit Agreement with HSBCBank USA, National Association, filed as Exhibit 10.8 to Registrant’s Form 10-Q for the quarterended May 3, 2008, Commission File No. 1-7562.
10.7 Term Loan and Revolving Credit Agreement dated April 7, 2011, filed as Exhibit 10.1 to Registrant’sForm 8-K on April 7, 2011, Commission File No. 1-7562.
79
10.8 Amendment No. 1 to Term Loan and Revolving Credit Agreement dated April 25, 2011, filed asExhibit 10.4 to Registrant’s Form 10-Q for the quarter ended April 30, 2011, Commission File No.1-7562.
10.9 Amendment No. 2 to the Credit Agreement dated as of May 1, 2013, filed as Exhibit 10.1 toRegistrant’s Form 8-K on May 1, 2013, Commission File No. 1-7562.
10.10 Amended and Restated Revolving Credit Agreement dated May 20, 2015, filed as Exhibit 10.2 toRegistrant's Form 10-Q for the quarter ended August 1, 2015, Commission File No. 1-7562.
10.11 Letter Amendment No. 1 to the Amended and Restated Revolving Credit Agreement dated August31, 2016, filed as Exhibit 10.2 to Registrant's Form 10-Q for the quarter ended July 30, 2016,Commission File No. 1-7562.
10.12 Credit Agreement dated October 15, 2015, filed as Exhibit 10.1 to Registrant's Form 10-Q for thequarter ended October 31, 2015, Commission File No. 1-7562.
10.13
Second Amended and Restated Master Services Agreement between Registrant and IBM, dated asof March 13, 2013, filed as Exhibit 10.1 to Registrant’s Form 10-Q for the quarter ended May 4,2013, Commission File No. 1-7562. (1)
10.14
Amended and Restated Consumer Credit Card Program Agreement by and among Registrant, Gap(Puerto Rico), Inc., GPS Consumer Direct, Inc., Gap (Apparel), LLC, Gap (ITM) Inc., GE CapitalRetail Bank and GE Capital Retail Finance Corporation, dated as of February 28, 2014, filed asExhibit 10.1 to Amendment No. 1 to Registrant’s Form 10-Q for the quarter ended May 3, 2014,Commission File No. 1-7562. (1)
10.15
First Amendment to Amended and Restated Consumer Credit Card Program Agreement by andamong Registrant, Gap (Puerto Rico), Inc., GPS Consumer Direct, Inc., Gap (Apparel), LLC, Gap(ITM) Inc., Synchrony Bank (f/k/a GE Capital Retail Bank) and Synchrony Financial, dated as ofJanuary 31, 2015, filed as Exhibit 10.12 to Registrant's Form 10-K for the year ended January 31,2015, Commission File No. 1-7562.
10.16 Second Amendment to Amended and Restated Consumer Credit Card Program Agreement by andamong Registrant, Gap (Puerto Rico), Inc., GPS Consumer Direct, Inc., Gap (Apparel), LLC, Gap(ITM) Inc., Synchrony Bank (f/k/a GE Capital Retail Bank) and Synchrony Financial, dated as of May8, 2015, filed as Exhibit 10.1 to Registrant's Form 10-Q for the quarter ended August 1, 2015,Commission File No. 1-7562. (1)
10.17 Third Amendment to Amended and Restated Consumer Credit Card Program Agreement by andamong Registrant, Gap (Puerto Rico), Inc., GPS Consumer Direct, Inc., Gap (Apparel), LLC, Gap(ITM) Inc., Synchrony Bank (f/k/a GE Capital Retail Bank) and Synchrony Financial, dated as ofDecember 15, 2015, filed as Exhibit 10.16 to Registrant's Form 10-K for the year ended January 30,2016, Commission File No. 1-7562. (1)
10.18 Fourth Amendment to Amended and Restated Consumer Credit Card Program Agreement by andamong theRegistrant, Gap (Puerto Rico), Inc., GPS Consumer Direct, Inc., Gap (Apparel), LLC, Gap(ITM) Inc., SynchronyBank (f/k/a GE Capital Retail Bank) and Synchrony Financial, dated as of April29, 2016, filed as Exhibit 10.1 to Registrant's Form 10-Q for the quarter ended April 30, 2016,Commission File No. 1-7562. (1)
EXECUTIVE COMPENSATION PLANS AND ARRANGEMENTS
80
10.19
Executive Management Incentive Compensation Award Plan, filed as Appendix A to Registrant’sdefinitive proxy statement for its annual meeting of stockholders held on May 19, 2015, CommissionFile No. 1-7562.
10.20 The Gap, Inc. Executive Deferred Compensation Plan, filed as Exhibit 10.3 to Registrant’s Form 10-Q for the quarter ended October 31, 1998, Commission File No.1-7562.
10.21
Amendment to Executive Deferred Compensation Plan - Freezing of Plan Effective December 31,2005, filed as Exhibit 10.1 to Registrant’s Form 8-K on November 8, 2005, Commission File No.1-7562.
10.22
Amendment to Executive Deferred Compensation Plan - Merging of Plan into the SupplementalDeferred Compensation Plan, filed as Exhibit 10.29 to Registrant’s Form 10-K for the year endedJanuary 31, 2009, Commission File No. 1-7562.
10.23
Amendment to Executive Deferred Compensation Plan - Suspension of Pending Merger intoSupplemental Deferred Compensation Plan, filed as Exhibit 10.30 to Registrant’s Form 10-K for theyear ended January 31, 2009, Commission File No. 1-7562.
10.24
Amendment to Executive Deferred Compensation Plan - Merging of Plan into the DeferredCompensation Plan, filed as Exhibit 10.1 to Registrant’s Form 10-Q for the quarter ended October31, 2009, Commission File No. 1-7562.
10.25
Deferred Compensation Plan, amended and restated effective September 1, 2011, filed as Exhibit10.1 to Registrant’s Form 10-Q for the quarter ended October 29, 2011, Commission File No.1-7562.
10.26 Deferred Compensation Plan, amended and restated effective November 17, 2015, filed as Exhibit10.24 to Registrant's Form 10-K for the year ended January 30, 2016, Commission File No. 1-7562.
10.27 Deferred Compensation Plan, amended and restated effective March 24, 2016, filed as Exhibit 10.2to Registrant's Form 10-Q for the quarter ended April 30, 2016, Commission File No. 1-7562.
10.28 Supplemental Deferred Compensation Plan, filed as Exhibit 4.1 to the Company’s RegistrationStatement on Form S-8, dated November 29, 2005, Commission File No. 333-129986.
10.29 First Amendment to Supplemental Deferred Compensation Plan, filed as Exhibit 10.32 toRegistrant’s Form 10-K for the year ended January 31, 2009, Commission File No. 1-7562.
10.30
Second Amendment to Supplemental Deferred Compensation Plan - Merging of Executive DeferredCompensation Plan into the Plan and Name Change to Deferred Compensation Plan, filed as Exhibit10.33 to Registrant’s Form 10-K for the year ended January 31, 2009, Commission File No. 1-7562.
10.31
Third Amendment to Supplemental Deferred Compensation Plan - Suspension of Pending Mergingof Executive Deferred Compensation Plan into the Plan and Name Change to DeferredCompensation Plan, filed as Exhibit 10.34 to Registrant’s Form 10-K for the year ended January 31,2009, Commission File No. 1-7562.
10.32
Fourth Amendment to Supplemental Deferred Compensation Plan - Merging of Executive DeferredCompensation Plan into the Plan and Name Change to Deferred Compensation Plan, filed as Exhibit10.2 to Registrant’s Form 10-Q for the quarter ended October 31, 2009, Commission File No.1-7562.
81
10.33 1981 Stock Option Plan, filed as Exhibit 4.1 to Registrant’s Registration Statement on Form S-8,Commission File No. 33-54690.
10.34 Management Incentive Restricted Stock Plan II, filed as Exhibit 4.1 to Registrant’s RegistrationStatement on Form S-8, Commission File No. 33-54686.
10.35 1996 Stock Option and Award Plan, filed as Exhibit A to Registrant’s definitive proxy statement for itsannual meeting of stockholders held on May 21, 1996, Commission File No. 1-7562.
10.36 Amendment Number 1 to Registrant’s 1996 Stock Option and Award Plan, filed as Exhibit 10.1 toRegistrant’s Form 10-Q for the quarter ended August 2, 1997, Commission File No. 1-7562.
10.37 Amendment Number 2 to Registrant’s 1996 Stock Option and Award Plan, filed as Exhibit 10.15 toRegistrant’s Form 10-K for the year ended January 31, 1998, Commission File No. 1-7562.
10.38 Amendment Number 3 to Registrant’s 1996 Stock Option and Award Plan, filed as Exhibit 10.1 toRegistrant’s Form 10-Q for the quarter ended October 31, 1998, Commission File No. 1-7562.
10.39 Amendment Number 4 to Registrant’s 1996 Stock Option and Award Plan, filed as Exhibit 10.3 toRegistrant’s Form 10-Q for the quarter ended July 29, 2000, Commission File No. 1-7562.
10.40 Amendment Number 5 to Registrant’s 1996 Stock Option and Award Plan, filed as Exhibit 10.13 toRegistrant’s Form 10-K for the year ended February 3, 2001, Commission File No. 1-7562.
10.41 Amendment Number 6 to Registrant’s 1996 Stock Option and Award Plan, filed as Exhibit 10.1 toRegistrant’s Form 10-Q for the quarter ended May 5, 2001, Commission File No. 1-7562.
10.42
1996 Stock Option and Award Plan (as Amended and Restated effective as of January 28, 2003),filed as Appendix C to Registrant’s definitive proxy statement for its annual meeting of stockholdersheld on May 14, 2003, Commission File No. 1-7562.
10.43
Form of Non-Qualified Stock Option Agreement for consultants under Registrant’s 1996 StockOption and Award Plan, filed as Exhibit 10.4 to Registrant’s Form 10-Q for the quarter endedOctober 31, 1998, Commission File No. 1-7562.
10.44
Form of Non-Qualified Stock Option Agreement for employees in France under Registrant’s 1996Stock Option and Award Plan, filed as Exhibit 10.5 to Registrant’s Form 10-Q for the quarter endedOctober 31, 1998, Commission File No. 1-7562.
10.45
Form of Non-Qualified Stock Option Agreement for international employees under Registrant’s 1996Stock Option and Award Plan, filed as Exhibit 10.6 to Registrant’s Form 10-Q for the quarter endedOctober 31, 1998, Commission File No. 1-7562.
10.46
Form of Non-Qualified Stock Option Agreement for employees in Japan under Registrant’s 1996Stock Option and Award Plan, filed as Exhibit 10.7 to Registrant’s Form 10-Q for the quarter endedOctober 31, 1998, Commission File No. 1-7562.
10.47
Form of Stock Option Agreement for employees under the UK Sub-plan to the U.S. Stock Option andAward Plan, filed as Exhibit 10.8 to Registrant’s Form 10-Q for the quarter ended October 31, 1998,Commission File No. 1-7562.
82
10.48
Form of Non-Qualified Stock Option Agreement for directors effective April 3, 2001 underRegistrant’s 1996 Stock Option and Award Plan, filed as Exhibit 10.4 to Registrant’s Form 10-Q forthe quarter ended May 5, 2001, Commission File No. 1-7562.
10.49
Form of Non-Qualified Stock Option Agreement under Registrant’s 1996 Stock Option and AwardPlan, filed as Exhibit 10.3 to Registrant’s Form 10-Q for the quarter ended November 3, 2001,Commission File No. 1-7562.
10.50 UK Employee Stock Purchase Plan, filed as Exhibit 4.1 to Registrant’s Registration Statement onForm S-8, Commission File No. 333-47508.
10.51
2002 Stock Option Plan, as amended (formerly the 1999 Stock Option Plan as amended and StockUp On Success, The Gap, Inc.’s Stock Option Bonus Program), filed as Exhibit 4.1 to Registrant’sRegistration Statement on Form S-8, Commission File No. 333-103128.
10.52 2006 Long-Term Incentive Plan, filed as Appendix B to Registrant’s definitive proxy statement for itsannual meeting of stockholders held on May 9, 2006, Commission File No. 1-7562.
10.53 2006 Long-Term Incentive Plan, as amended and restated effective August 20, 2008, filed as Exhibit10.1 to Registrant’s Form 10-Q for the quarter ended November 1, 2008, Commission File No.1-7562.
10.54 Amendment No. 1 to Registrant’s 2006 Long-Term Incentive Plan, filed as Exhibit 10.62 toRegistrant’s Form 10-K for the year ended February 3, 2007, Commission File No. 1-7562.
10.55 2011 Long-Term Incentive Plan, filed as Appendix A to Registrant’s definitive proxy statement for itsannual meeting of stockholders held on May 17, 2011, Commission File No. 1-7562.
10.56 Amended and Restated 2011 Long-Term Incentive Plan (effective February 26, 2014), filed asExhibit 10.1 to Registrant’s Form 8-K on March 6, 2014, Commission File No. 1-7562.
10.57 2016 Long-Term Incentive Plan, filed as Appendix A to Registrant's definitive proxy statement for itsannual meeting of stockholders held on May 17, 2016, Commission File No. 1-7562.
10.58 Form of Non-Qualified Stock Option Agreement for Executives under the 2006 Long-Term IncentivePlan, filed as Exhibit 10.1 to Registrant’s Form 8-K on March 23, 2006, Commission File No. 1-7562.
10.59 Form of Non-Qualified Stock Option Agreement under the 2011 Long-Term Incentive Plan, filed asExhibit 10.8 to Registrant’s Form 10-Q for the quarter ended April 30, 2011, Commission File No.1-7562.
10.60
Form of Non-Qualified Stock Option Agreement under the 2011 Long-Term Incentive Plan, filed asExhibit 10.9 to Registrant’s Form 10-Q for the quarter ended July 28, 2012, Commission File No.1-7562.
10.61
Form of Non-Qualified Stock Option Agreement under the 2011 Long-Term Incentive Plan, filed asExhibit 10.72 to Registrant's Form 10-K for the year ended February 2, 2013, Commission File No.1-7562.
10.62 Form of Non-Qualified Stock Option Agreement under the 2011 Long-Term Incentive Plan, filed asExhibit 10.2 to Registrant's Form 8-K on March 6, 2014, Commission File No. 1-7562.
83
10.63 Form of Non-Qualified Stock Option Agreement under the 2011 Long-Term Incentive Plan, filed asExhibit 10.1 to Registrant's Form 8-K on March 6, 2015, Commission File No. 1-7562.
10.64 Form of Non-Qualified Stock Option Agreement under the 2011 Long-Term Incentive Plan, filed asExhibit 10.60 to Registrant's Form 10-K for the year ended January 30, 2016, Commission File No.1-7562.
10.65 Form of Non-Qualified Stock Option Agreement under the 2016 Long-Term Incentive Plan, filed asExhibit 10.1 to Registrant's Form 8-K on March 9, 2017, Commission File No. 1-7562.
10.66 Form of Stock Award Agreement for Executives under the 2006 Long-Term Incentive Plan, filed asExhibit 10.2 to Registrant’s Form 8-K on March 23, 2006, Commission File No. 1-7562.
10.67 Form of Performance Share Agreement under the 2011 Long-Term Incentive Plan, filed as Exhibit10.9 to Registrant’s Form 10-Q for the quarter ended April 30, 2011, Commission File No. 1-7562.
10.68 Form of Performance Share Agreement under the 2011 Long-Term Incentive Plan, filed as Exhibit10.8 to Registrant’s Form 10-Q for the quarter ended July 28, 2012, Commission File No. 1-7562.
10.69 Form of Performance Share Agreement under the 2006 Long-Term Incentive Plan, filed as Exhibit10.5 to Registrant’s Form 10-Q for the quarter ended May 1, 2010, Commission File No. 1-7562.
10.70 Form of Performance Share Agreement under the 2006 Long-Term Incentive Plan, filed as Exhibit10.1 to Registrant’s Form 8-K on March 11, 2011, Commission File No. 1-7562.
10.71 Form of Performance Share Agreement under the 2011 Long-Term Incentive Plan., filed as Exhibit10.85 to Registrant's Form 10-K for the year ended February 2, 2013, Commission File No. 1-7562.
10.72 Form of Performance Share Agreement under the 2011 Long-Term Incentive Plan, filed as Exhibit10.4 to Registrant's form 8-K on March 6, 2014, Commission File No. 1.7562.
10.73 Form of Performance Share Agreement under the 2011 Long-Term Incentive Plan, filed as Exhibit10.3 to Registrant's form 8-K on March 6, 2015, Commission File No. 1.7562.
10.74 Form of Performance Share Agreement under the 2011 Long-Term Incentive Plan, filed as Exhibit10.69 to Registrant's Form 10-K for the year ended January 30, 2016, Commission File No. 1-7562.
10.75 Form of Performance Share Agreement under the 2016 Long-Term Incentive Plan, filed as Exhibit10.3 to Registrant's Form 8-K on March 9, 2017, Commission File No. 1-7562.
10.76 Form of Restricted Stock Unit Award Agreement under the 2011 Long-Term Incentive Plan, filed asExhibit 10.7 to Registrant’s Form 10-Q for the quarter ended April 30, 2011, Commission File No.1-7562.
10.77
Form of Restricted Stock Unit Award Agreement under the 2011 Long-Term Incentive Plan, filed asExhibit 10.10 to Registrant’s Form 10-Q for the quarter ended July 28, 2012, Commission File No.1-7562.
10.78
Form of Restricted Stock Unit Award Agreement under the 2011 Long-Term Incentive Plan, filed asExhibit 10.89 to Registrant's Form 10-K for the year ended February 2, 2013, Commission File No.1-7562.
84
10.79 Form of Restricted Stock Unit Award Agreement under the 2011 Long-Term Incentive Plan, filed asExhibit 10.3 to Registrant's Form 8-K on March 6, 2014, Commission File No. 1-7562.
10.80 Form of Restricted Stock Unit Award Agreement under the 2011 Long-Term Incentive Plan, filed asExhibit 10.2 to Registrant's Form 8-K on March 6, 2015, Commission File No. 1-7562.
10.81 Form of Restricted Stock Unit Award Agreement under the 2011 Long-Term Incentive Plan, filed asExhibit 10.75 to Registrant's Form 10-K for the year ended January 30, 2016, Commission File No.1-7562.
10.82 Form of Restricted Stock Unit Award Agreement under the 2016 Long-Term Incentive Plan, filed asExhibit 10.2 to Registrant's Form 8-K on March 9, 2017, Commission File No. 1-7562.
10.83
Form of Director Stock Unit Agreement and Stock Unit Deferral Election Form under the 2011 Long-Term Incentive Plan, filed as Exhibit 10.10 to Registrant’s Form 10-Q for the quarter ended April 30,2011, Commission File No. 1-7562.
10.84 Form of Director Stock Unit Agreement and Stock Unit Deferral Election Form under the 2011 Long-Term Incentive Plan, filed as Exhibit 10.5 to Registrant's Form 8-K on March 6, 2014, CommissionFile No. 1-7562.
10.85 Form of Director Stock Unit Agreement and Stock Unit Deferral Election Form under the 2011 Long-Term Incentive Plan, filed as Exhibit 10.4 to Registrant's Form 8-K on March 6, 2015, CommissionFile No. 1-7562.
10.86 Form of Director Stock Unit Agreement and Stock Unit Deferral Election Form under the 2011 Long-Term Incentive Plan, filed as Exhibit 10.79 to Registrant's Form 10-K for the year ended January 30,2016, Commission File No. 1-7562.
10.87 Form of Director Stock Unit Agreement and Stock Unit Deferral Election Form under the 2016 Long-Term Incentive Plan, filed as Exhibit 10.4 to Registrant's Form 8-K on March 9, 2017, CommissionFile No. 1-7562.
10.88 Summary of Revised Timing of Annual Board Member Stock Unit Grants, effective August 20, 2008,filed as Exhibit 10.3 to Registrant’s Form 10-Q for the quarter ended November 1, 2008,Commission File No. 1-7562.
10.89 Agreement with Paul Chapman dated November 16, 2015 and confirmed on November 16, 2015,filed as Exhibit 10.86 to Registrant's Form 10-K for the year ended January 30, 2016, CommissionFile No. 1-7562.
10.90 Agreement with Sebastian DiGrande dated April 22, 2016 and confirmed on April 22, 2016, filed asExhibit 10.1 to Registrant's Form 10-Q for the quarter ended July 30, 2016, Commission File No.1-7562.
10.91
Agreement with Solomon Goldfarb dated January 23, 2015 and confirmed on January 28, 2015, filedas Exhibit 10.103 to Registrant's Form 10-K for the year ended January 31, 2015, Commission FileNo. 1-7562.
10.92 Agreement with Julie Gruber dated February 1, 2016 and confirmed on February 4, 2016, filed asExhibit 10.3 to Registrant's Form 10-Q for the quarter ended Aprill 30, 2016, Commission File No.1-7562.
85
10.93 Agreement with Jeff Kirwan dated November 17, 2014 and confirmed on November 18, 2014, filedas Exhibit 10.108 to Registrant's Form 10-K for the year ended January 31, 2015, Commission FileNo. 1-7562.
10.94 Letter Agreement dated November 10, 2016 by and between Teri List-Stoll and the Registrant datedNovember 10, 2016 and confirmed on November 10, 2016, filed as Exhibit 10.1 to Registrant's Form8-K on November 15, 2016, Commission File No. 1-7562.
10.95 Agreement with Andi Owen dated November 17, 2014 and confirmed on November 18, 2014 filed asExhibit 10.117 to Registrant's Form 10-K for the year ended January 31, 2015, Commission File No.1-7562.
10.96 Letter Agreement with Art Peck dated October 3, 2014, filed as Exhibit 10.1 to Registrant’s Form 8-Kon October 8, 2014, Commission File No. 1-7562.
10.97 Agreement with Roberta Silten dated April 28, 2015 and confirmed on April 29, 2015, filed as Exhibit10.3 to Registrant's Form 10-Q for the quarter ended May 2, 2015, Commission File No. 1-7562.
10.98 Agreement with Sabrina L. Simmons dated February 4, 2008 and confirmed on February 6, 2008,filed as Exhibit 10.1 to Registrant’s Form 8-K on February 12, 2008, Commission File No. 1-7562.
10.99 Agreement for Post-Termination Benefits with Sabrina Simmons dated May 31, 2012, filed as Exhibit10.5 to Registrant's Form 10-Q for the quarter ended April 28, 2012, Commission File No. 1-7562.
10.100 Amendment to Agreement for Post-Termination Benefits with Sabrina Simmons dated June 4, 2014,filed as Exhibit 10.8 to Registrant’s Form 10-Q for the quarter ended May 3, 2014, Commission FileNo. 1-7562.
10.101 Agreement with Sonia Syngal dated April 11, 2016 and confirmed on April 11, 2016, filed as Exhibit10.1 to Registrant's Form 8-K on April 13, 2016, Commission File No. 1-7562.
12 Ratio of Earnings to Fixed Charges. (2)
14 Code of Business Conduct, filed as Exhibit 14 to Registrant’s Form 10-K for the year ended January30, 2010, Commission File No. 1-7562.
21 Subsidiaries of Registrant. (2)
23 Consent of Independent Registered Public Accounting Firm. (2)
31.1 Rule 13a-14(a)/15d-14(a) Certification of the Chief Executive Officer of The Gap, Inc. (Section 302 ofthe Sarbanes-Oxley Act of 2002). (2)
31.2 Rule 13a-14(a)/15d-14(a) Certification of the Chief Financial Officer of The Gap, Inc. (Section 302 ofthe Sarbanes-Oxley Act of 2002). (2)
32.1 Certification of the Chief Executive Officer of The Gap, Inc. pursuant to 18 U.S.C. Section 1350, asadopted pursuant to Section 906 of the Sarbanes-Oxley Act of 2002. (3)
32.2 Certification of the Chief Financial Officer of The Gap, Inc. pursuant to 18 U.S.C. Section 1350, asadopted pursuant to Section 906 of the Sarbanes-Oxley Act of 2002. (3)
86
101
The following materials from The Gap, Inc.’s Annual Report on Form 10-K for the year endedJanuary 28, 2017, formatted in XBRL (eXtensible Business Reporting Language): (i) theConsolidated Balance Sheets, (ii) the Consolidated Statements of Income, (iii) the ConsolidatedStatements of Comprehensive Income, (iv) the Consolidated Statements of Stockholders’ Equity, (v)the Consolidated Statements of Cash Flows, and (vi) Notes to Consolidated Financial Statements.(2)
__________(1) Pursuant to a request for confidential treatment, confidential portions of this Exhibit have been redacted and have been filed separately
with the Securities and Exchange Commission.(2) Filed herewith.(3) Furnished herewith.
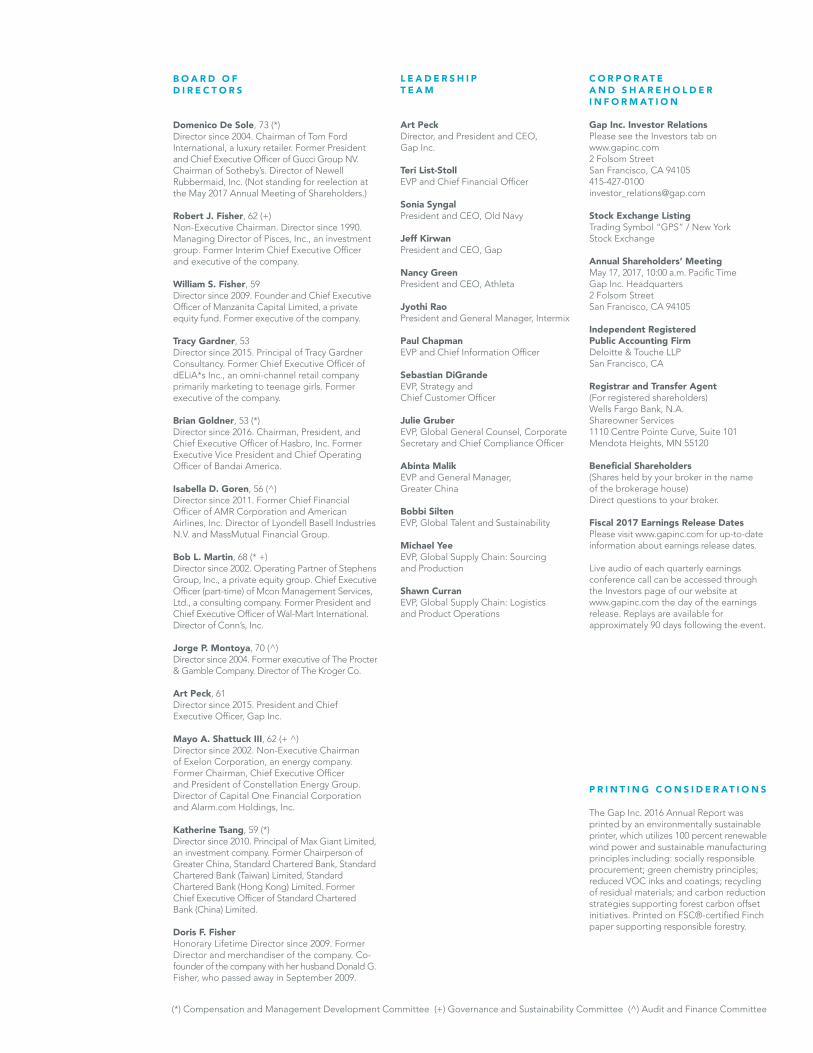
B O A R D O FD I R E C T O R S
Domenico De Sole, 73 (*)Director since 2004. Chairman of Tom FordInternational, a luxury retailer. Former Presidentand Chief Executive Officer of Gucci Group NV.Chairman of Sotheby’s. Director of NewellRubbermaid, Inc. (Not standing for reelection atthe May 2017 Annual Meeting of Shareholders.)
Robert J. Fisher, 62 (+)Non-Executive Chairman. Director since 1990.Managing Director of Pisces, Inc., an investmentgroup. Former Interim Chief Executive Officerand executive of the company.
William S. Fisher, 59Director since 2009. Founder and Chief ExecutiveOfficer of Manzanita Capital Limited, a privateequity fund. Former executive of the company.
Tracy Gardner, 53Director since 2015. Principal of Tracy GardnerConsultancy. Former Chief Executive Officer ofdELiA*s Inc., an omni-channel retail companyprimarily marketing to teenage girls. Formerexecutive of the company.
Brian Goldner, 53 (*)Director since 2016. Chairman, President, andChief Executive Officer of Hasbro, Inc. FormerExecutive Vice President and Chief OperatingOfficer of Bandai America.
Isabella D. Goren, 56 (^)Director since 2011. Former Chief FinancialOfficer of AMR Corporation and AmericanAirlines, Inc. Director of Lyondell Basell IndustriesN.V. and MassMutual Financial Group.
Bob L. Martin, 68 (* +)Director since 2002. Operating Partner of StephensGroup, Inc., a private equity group. Chief ExecutiveOfficer (part-time) of Mcon Management Services,Ltd., a consulting company. Former President andChief Executive Officer of Wal-Mart International.Director of Conn’s, Inc.
Jorge P. Montoya, 70 (^)Director since 2004. Former executive of The Procter& Gamble Company. Director of The Kroger Co.
Art Peck, 61Director since 2015. President and ChiefExecutive Officer, Gap Inc.
Mayo A. Shattuck III, 62 (+ ^)Director since 2002. Non-Executive Chairmanof Exelon Corporation, an energy company.Former Chairman, Chief Executive Officerand President of Constellation Energy Group.Director of Capital One Financial Corporationand Alarm.com Holdings, Inc.
Katherine Tsang, 59 (*)Director since 2010. Principal of Max Giant Limited,an investment company. Former Chairperson ofGreater China, Standard Chartered Bank, StandardChartered Bank (Taiwan) Limited, StandardChartered Bank (Hong Kong) Limited. FormerChief Executive Officer of Standard CharteredBank (China) Limited.
Doris F. FisherHonorary Lifetime Director since 2009. FormerDirector and merchandiser of the company. Co-founder of the company with her husband Donald G.Fisher, who passed away in September 2009.
L E A D E R S H I PT E A M
Art PeckDirector, and President and CEO,Gap Inc.
Teri List-StollEVP and Chief Financial Officer
Sonia SyngalPresident and CEO, Old Navy
Jeff KirwanPresident and CEO, Gap
Nancy GreenPresident and CEO, Athleta
Jyothi RaoPresident and General Manager, Intermix
Paul ChapmanEVP and Chief Information Officer
Sebastian DiGrandeEVP, Strategy andChief Customer Officer
Julie GruberEVP, Global General Counsel, CorporateSecretary and Chief Compliance Officer
Abinta MalikEVP and General Manager,Greater China
Bobbi SiltenEVP, Global Talent and Sustainability
Michael YeeEVP, Global Supply Chain: Sourcingand Production
Shawn CurranEVP, Global Supply Chain: Logisticsand Product Operations
C O R P O R AT EA N D S H A R E H O L D E RI N F O R M AT I O N
Gap Inc. Investor RelationsPlease see the Investors tab onwww.gapinc.com2 Folsom StreetSan Francisco, CA [email protected]
Stock Exchange ListingTrading Symbol “GPS” / New YorkStock Exchange
Annual Shareholders’ MeetingMay 17, 2017, 10:00 a.m. Pacific TimeGap Inc. Headquarters2 Folsom StreetSan Francisco, CA 94105
Independent RegisteredPublic Accounting FirmDeloitte & Touche LLPSan Francisco, CA
Registrar and Transfer Agent(For registered shareholders)Wells Fargo Bank, N.A.Shareowner Services1110 Centre Pointe Curve, Suite 101Mendota Heights, MN 55120
Beneficial Shareholders(Shares held by your broker in the nameof the brokerage house)Direct questions to your broker.
Fiscal 2017 Earnings Release DatesPlease visit www.gapinc.com for up-to-dateinformation about earnings release dates.
Live audio of each quarterly earningsconference call can be accessed throughthe Investors page of our website atwww.gapinc.com the day of the earningsrelease. Replays are available forapproximately 90 days following the event.
P R I N T I N G C O N S I D E R AT I O N S
The Gap Inc. 2016 Annual Report wasprinted by an environmentally sustainableprinter, which utilizes 100 percent renewablewind power and sustainable manufacturingprinciples including: socially responsibleprocurement; green chemistry principles;reduced VOC inks and coatings; recyclingof residual materials; and carbon reductionstrategies supporting forest carbon offsetinitiatives. Printed on FSC®-certified Finchpaper supporting responsible forestry.
(*) Compensation and Management Development Committee (+) Governance and Sustainability Committee (^) Audit and Finance Committee
170252_L01_CVRS.indd 2 3/20/17 4:51 PM

2016ANNUALREPORT
G A P I N C . C O M
170252_L01_CVRS.indd 1 3/17/17 7:45 PM