2016 annual report to the school community - elwood primary school · 2016 annual report to the...
TRANSCRIPT

1
2016 Annual Report to the School Community
School Name: Elwood Primary School
School Number: 3942
Robert Csoti
Name of School Principal:
Ralf Huempel
Name of School Council President:
30 March 2017
Date of Endorsement:
Elwood Primary School
2
School Context
We are an inner bayside school [located in the City of Port Phillip], established in 1917, with the majority of our students drawn from nearby areas with the school enforcing a neighbourhood boundary in 2010. The school is in a quiet, residential area close to other facilities such as public transport, beaches and shopping villages. The school forms part of an education precinct, (The HUB) including the Poets Grove Maternal Health, Childcare and Kindergarten Centre, Elwood Primary School and Elwood College. The school population reflects the characteristics of the Elwood community with its diversity of socio – economic and cultural backgrounds. A strength of the school is the value placed on ‘community’. Parents and teachers work in an educational partnership to support each child’s learning journey. Parental involvement in the many aspects of school life is highly valued, including the school markets which provide a strong sense of connectedness, and a major source of school fundraising. Many parents have flexible work arrangements that allow them to contribute during school hours, and in particular, the mix of creative and performing artists in the community supports and enhances the school’s learning and teaching programs. All buildings and learning spaces have been modernised to create positive classroom environments that seek to create flexible spaces that meet the needs of all learners in a variety of situations. The school has grown from 551 in 2009 to 807 in 2017. Our Prep enrolment has doubled since 2005 and is 135 in 2017. The school’s programs reflect our priority focus on the foundations of learning as well as the wellbeing of students, and are designed to assist in developing skills for life-long learning. The values which form the basis of the school’s actions are: empathy, resilience, respect, integrity and responsibility. They include the YCDI Foundations of organisation, persistence, getting along and confidence, all of which promote resilience in students. Programs are based on the belief that students have the ability and the right to learn and we ensure that the environment is friendly, calm and orderly, safe, and responsive to the community’s diversity. We celebrate success in all areas of student achievement. We specifically focus on high quality programs with a clear commitment to student achievement in English and Mathematics as well as all other AusVELS areas. Key literacy programs include VCOP, Reader’s Notebook and Writer’s Workshop. Professional learning is a key strategy for the school with a Teaching and Learning coaching model in place concentrating on best practice for all teachers in the area of Literacy and Numeracy. The school is focussed on personalising its curriculum, to further meet student needs and abilities. The Australian Developmental Curriculum is implemented in Grades P-6 with grades 3-6 having a major focus on Educational Research Projects. The Stephanie Alexander Kitchen Garden Program is conducted with all students in Grades 3 and 4. The aim of the Kitchen Garden Program is pleasurable food education. Students experience first-hand the links between growing, harvesting, preparing and sharing fresh, seasonal produce. This program is a key driver in the ethos of the school and helps facilitate our strong community links.
Framework for Improving Student Outcomes (FISO)
FISO initiatives being implemented in 2017 further build on the dedicated work already in progress by our staff, parents and School Council
Our teaching teams continue to use evaluative skills and continually improve their practice through research, mentoring and observation. They give each other feedback, documenting the impact of new approaches and planning further improvements.
Our school systematically incorporates evaluative practices and continuous improvement into position descriptions, performance appraisal and professional learning strategies.
Our school continually reviews their impact on students’ progress and development and incorporates findings into school improvement plans.
Our school has a whole school curriculum plan that ensures horizontal alignment across learning areas, a clear vertical progression of skills and knowledge in each learning area and an extra-curricular program integrated with the school’s classroom-based teaching and learning program. This includes the explicit teaching of metacognitive skills, where students are taught to be reflective and self-monitor their learning.
Our school uses sophisticated diagnostic assessment aligned to the curriculum. Teachers make in-the-moment adjustments, give targeted feedback and help students evaluate their own progress.
Teaching teams use assessment evidence to challenge each other about the impact of curriculum
plans and content content-specific teaching strategies in continuous cycles of research and review.

Elwood Primary School
3
Achievement
Literacy and Mathematics results in 2016 were very pleasing with growth in all areas according to teacher judgements and NAPLAN. Significant work by all teachers to embed our learning strategies and approaches across all key learning areas has led to a significant lift in scores with excellent growth from Grade 3 to 5 according to NAPLAN. Teacher judgements reported on our school student reports show similar outcomes to our Victorian similar schools and well above the state mean in Literacy and Numeracy. An analysis of data in the Annual Report shows the following: Reading scores are similar to our Victorian similar schools in grade 3 and higher than our similar schools in Grade 5 in 2016 and are similar to our similar schools over the last 4 years. Student achievement in reading is very high and reflects the curriculum programs and parent support at Elwood PS. Numeracy scores in 2016 were similar to our Victorian similar schools in 2016 and over the last 4 years. Significant growth occurred in Mathematics in 2016 which was a result of our focused approach across the school to further refine our approach to Mathematics teaching. Learning gain from Grades 3 -5 according to NAPLAN was extremely high in Writing, Mathematics, Spelling and Punctuation and Grammar with approximately 38% of our students showing high growth; which is exceptional. Writing scores across the school and in NAPLAN showed significant growth in 2016. We believe the continued implementation of VCOP and Big Write and Writers Notebook will contribute to further growth.
Curriculum Framework implemented in 2016
Victorian Early Years Learning and Development Framework
X
AusVELS
Victorian Curriculum
A Combination of these
Engagement
Student absence data shows our absence rate to be similar to our school comparison group. A summary of our Engagement strategies in 2017 are below:
The continued implementation of a literacy intervention program targeting students just under benchmark from grades 2-6.
Further implementation of a rigorous and challenging curriculum that has high levels of student choice and student led learning goals.
The continued refinement and enhancement of transition programs from K- prep, grades 2 -3 and years 6 -7.
A continued focus on “Point of Need” teaching through our school wide assessment schedule that informs teaching and reporting.
The further implementation, reflection and refinement of the Developmental Curriculum through Investigations and Educational Research Projects.
Wellbeing
Attitudes to School Survey data shows our Grade 5 & 6 students view school connectedness to school and safety at a higher level than our similar schools and are very connected to school, their peers and their learning. A summary of our Wellbeing strategies in 2017 are below:
The continued implementation of school wide programs such as “You Can Do It” and “Manners Matter”
A continued focus and reinforcement of our school values in authentic learning experiences. The continuation of a school wide focus in all classrooms maintaining a positive focus on behaviour
management. The continuation of a welfare team structure that tracks all at risk students. Access to specialised support for all students in need both academically, emotionally and socially.
Elwood Primary School
4
For more detailed information regarding our school please visit our website at: www.elwoodprimary.vic.edu.au

Elwood Primary School
5
Performance Summary
The Government School Performance Summary provides an overview of how this school is contributing to the objectives of the Education State and how it compares to other Victorian government schools.
All schools work in partnership with their school community to improve outcomes for children and young people. Sharing this information with parents and the wider school community will help to deliver community engagement in student learning in the school, which is a state-wide priority of the Framework for Improving Student Outcomes.
Accessible data tables are available for all schools separately – please refer to 'AR_Appendix_Data_Tables' which can be found on the School Performance Reporting website.
School Profile
Enrolment Profile A total of 773 students were enrolled at this school in 2016, 382 female and 391 male. There were 5% of EAL (English as an Additional Language) students and < 10% ATSI (Aboriginal and Torres Strait Islander) students.
Overall Socio-Economic Profile Based on the school's Student Family Occupation and Education index which takes into account parents' occupations and Education.
Parent Satisfaction Summary Average level of parent satisfaction with the school, as derived from the annual Parent Opinion survey. The score is reported
on a scale of 1 to 7, where 7 is the highest possible score.
School Staff Survey Measures the percent endorsement by staff on School Climate derived from the annual School Staff Survey. The percent endorsement indicates the percent of positive responses (agree or strongly agree) on School Climate from staff at the school. Data are suppressed for schools with fewer than three respondents to the survey for confidentiality reasons.

Elwood Primary School
6
Performance Summary
Achievement
Teacher judgment of student achievement Percentage of students in Years Prep to 6 working at or above age expected standards in:
English
Mathematics
For further details refer to How to read the Performance Summary.
Student Outcomes
School Comparison

Elwood Primary School
7
Performance Summary
Achievement
Student Outcomes
School Comparison
NAPLAN Year 3 The percentage of students in the top 3 bands of testing in NAPLAN at Year 3. Year 3 assessments are reported on a scale from Bands 1 - 6.
NAPLAN Year 5 The percentage of students in the top 3 bands of testing in NAPLAN at Year 5. Year 5 assessments are reported on a scale from Bands 3 - 8.

Elwood Primary School
8
Performance Summary
Achievement
Student Outcomes
School Comparison
NAPLAN Learning Gain Year 3 - Year 5 Learning gain of students from Year 3 to Year 5 in the following domains; Reading, Numeracy, Writing, Spelling and Grammar and Punctuation. NAPLAN learning gain is determined by comparing a student's current year result to the results of all ‘similar’ Victorian students (i.e. students in all sectors in the same year level who had the same score two years prior). If the current year result is in the top 25%, their gain level is categorised as ‘High’, middle 50%, is ‘Medium’ and bottom 25%, is ‘Low’.
NAPLAN Learning Gain does not require a School Comparison.
Elwood Primary School
9
Performance Summary
Engagement
Student Outcomes
School Comparison
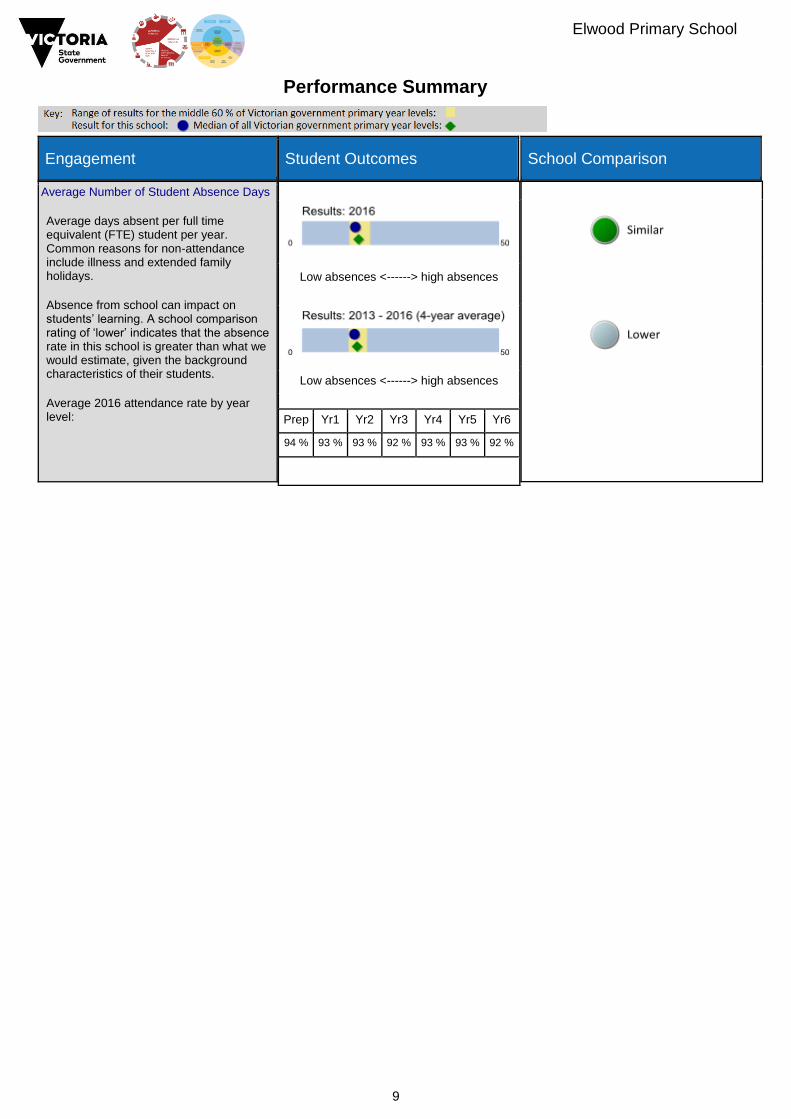
Average Number of Student Absence Days Average days absent per full time equivalent (FTE) student per year. Common reasons for non-attendance include illness and extended family holidays. Absence from school can impact on students’ learning. A school comparison rating of ‘lower’ indicates that the absence rate in this school is greater than what we would estimate, given the background characteristics of their students. Average 2016 attendance rate by year level:
Low absences <------> high absences
Low absences <------> high absences
Prep Yr1 Yr2 Yr3 Yr4 Yr5 Yr6
94 % 93 % 93 % 92 % 93 % 93 % 92 %

Elwood Primary School
10
Performance Summary
Wellbeing
Student Outcomes
School Comparison
Students Attitudes to School - Connectedness to School Measures the Connectedness to School factor derived from the Attitudes to School survey completed annually by Victorian government school students in Years 5 to 12. The school's average score is reported here on a scale of 1 to 5, where 5 is the highest possible score.
Students Attitudes to School - Student Perceptions of Safety Measures the Student Perceptions of Safety factor derived from the Attitudes to School survey completed annually by Victorian government school students in Years 5 to 12. The school's average score is reported here on a scale of 1 to 5, where 5 is the highest possible score.

Elwood Primary School
11
How to read the Performance Summary
What are student outcomes? Student outcomes show the achievements of students in this school in English and Mathematics. They also show results in national literacy and numeracy tests and, for secondary colleges, the Victorian Certificate of Education (VCE) examinations. They provide important information about student attendance and engagement at school. For secondary, P-12 and specialist schools, the Performance Summary also provides information about how many students at this school go on to further studies or full-time work after leaving school. You can see these results for the latest year, as well as the average of the last four years (where available).
What is a School Comparison?
The School comparison is a way of comparing school performance that takes into account the different student intake characteristics of each school. A School comparison takes into account the school’s academic intake, the socio-economic background of students, the number of Aboriginal students, the number of non-English speaking and refugee students, the number of students with a disability, and the size and location of the school. The School comparison measures show that most schools are doing well and are achieving results that are ‘similar’ to what we
would estimate given the background characteristics of their students. Some schools are doing exceptionally well with the students they have, and have ‘higher’ performance. Some schools have ‘lower’ performance after taking into account their
students’ characteristics – these schools will receive targeted support to ensure that there is improvement.
Looking at both the student outcomes and school comparisons provides important information about what a school is doing well and the areas that require further improvement. More information on school comparison performance measures can be found at: http://www.education.vic.gov.au/school/principals/manage ment/pages/performreports.aspx
What is the meaning of ‘Data not available’?
For some schools, there are too few students to provide data. For other schools, there are no students at some levels, so school comparisons are not possible. Newly opened schools have only the latest year of data and no averages from previous years. The Department also recognises the unique circumstances of Specialist, Select Entry, English Language and Community Schools where school comparisons are not appropriate.
What is this school doing to improve?
All schools have a plan to improve outcomes for their students. The ‘About Our School’ statement provides a summary of this school’s improvement plan.
The Performance Summary also allows you to compare student outcomes for students at this school with the outcomes of students in all other Victorian government schools.
Additionally, NAPLAN learning gain charts are provided for each of the NAPLAN domains. These compare a student's current year NAPLAN result to the results of all ‘similar’ Victorian students (i.e. students in all sectors in the same year level who had the same NAPLAN score two years prior). If the current year result is in the top 25% their gain level is categorised as ‘High’, the middle 50% is categorised as ‘Medium’ and the bottom 25% is categorised as ‘Low’.
What are the changes in student achievement? The Victorian Curriculum F–10 has been developed to ensure that curriculum content and achievement standards enable continuous learning for all students, including, students with disabilities. The objectives of the Victorian Curriculum are the same for all students. The curriculum offers flexibility for teachers to tailor their teaching in ways that provide rigorous, relevant and engaging learning and assessment opportunities for students with disabilities. The ‘Towards Foundation Level Victorian Curriculum’ is integrated directly into the curriculum and is referred to as ‘Levels A to D’.

Elwood Primary School
12
Financial Performance and Position
Financial performance and position commentary
Elwood Primary School is in a financially sound position with healthy balances. Funds collected both locally and from DET were
expanding during the year on the running of the school and program budgets. The other accounts line contains our Building and
Library funds, which are used for the continuous improvement of our schools facilities.
Financial Performance - Operating Statement Summary for the year ending 31 December, 2016
Financial Position as at 31 December, 2016
Revenue
Actual
Funds Available Actual
High Yield Investment Account $65,969
Official Account $24,506
Other Accounts $120,097
Total Funds Available $210,572
Student Resource Package
$4,868,255
Government Provided DET Grants $486,687
Government Grants Commonwealth $80,748
Revenue Other $35,527
Locally Raised Funds $862,650
Total Operating Revenue
$6,333,867
Expenditure
Financial Commitments
Operating Reserve $208,211
Maintenance -Buildings/Grounds incl SMS>12 months
$3,041
Total Financial Commitments $211,252
Student Resource Package
$4,881,839
Books & Publications $25,370
Communication Costs $8,714
Consumables $152,096
Miscellaneous Expense $309,526
Professional Development $33,023
Property and Equipment Services $303,378
Salaries & Allowances $349,974
Trading & Fundraising $112,491
Travel & Subsistence $3,166
Utilities $46,668
Total Operating Expenditure
$6,226,244
Net Operating Surplus/-Deficit
$107,623
Asset Acquisitions
$28,892
Student Resource Package Expenditure figures are as of 06 March 2017 and are subject to change during the reconciliation process. Misc Expenses may include bank charges, health and personal development, administration charges, camp/excursion costs and taxation charges. Salaries and Allowances refers to school-level payroll.
All funds received from the Department, or raised by the school, have been expended, or committed to subsequent years, to support the achievement of educational outcomes and other operational needs of the school, consistent with Department policies, School Council approvals and the intent/purposes for which funding was provided or raised.