2016 final report approved by dr. james...
TRANSCRIPT
Page | 1
2016 Final Report
Approved By DR. James Barnes
Jack Haiston, [email protected] , (970) 420-0943 Tyler Norris, [email protected], (513) 288-0258
Loren Christensen, [email protected], (719) 580-0750 Nathan Houser, [email protected], (970) 631-4734 Andrew Sullivan, [email protected], (970) 381-4533
Darrin Minnard, [email protected], (303) 921-6951 Grant Maskus, [email protected], (719) 760-9327
Jorden Ham, [email protected], (303) 819-8844
Page | 2
Page | 3
Contents Executive Summary ...................................................................................................................................................... 5
Acknowledgements ....................................................................................................................................................... 6
Introduction ................................................................................................................................................................... 7
Design Problem Analysis: ............................................................................................................................................. 8
Objectives ...................................................................................................................................................................... 8
Constraints ..................................................................................................................................................................... 9
Design Summary ......................................................................................................................................................... 10
Electrical ................................................................................................................................................................. 10
Accumulator Case ................................................................................................................................................... 10
Drivetrain ................................................................................................................................................................ 11
Suspension .............................................................................................................................................................. 11
Aerodynamics ......................................................................................................................................................... 12
Design Decisions ......................................................................................................................................................... 13
Electrical ................................................................................................................................................................. 13
Accumulator Case ................................................................................................................................................... 13
Drivetrain ................................................................................................................................................................ 14
Motor Type/Model .............................................................................................................................................. 14
Chain Adjustment ............................................................................................................................................... 14
Gear ratio ............................................................................................................................................................ 14
Suspension .............................................................................................................................................................. 15
Suspension Points and Kinematics ..................................................................................................................... 15
Control Arm Components ................................................................................................................................... 15
Rocker Design..................................................................................................................................................... 15
Anti-Roll ............................................................................................................................................................. 15
Aerodynamics ......................................................................................................................................................... 16
At-risk Items and Mitigation Plan ............................................................................................................................... 16
Funding ................................................................................................................................................................... 16
Motor and BMS .................................................................................................................................................. 16
Manufacturing Capabilities ..................................................................................................................................... 16
FMEA .......................................................................................................................................................................... 16
Detailed Design and Supporting Analysis ................................................................................................................... 17
Electrical ................................................................................................................................................................. 17
Accumulator Case ................................................................................................................................................... 18
Drivetrain ................................................................................................................................................................ 19
Suspension .............................................................................................................................................................. 20
Aerodynamics ......................................................................................................................................................... 20
Stress Analysis .................................................................................................................................................... 21
Airflow Analysis ................................................................................................................................................. 21
Page | 4
Validation .................................................................................................................................................................... 22
Electrical ................................................................................................................................................................. 22
Simulation ........................................................................................................... Error! Bookmark not defined. Bench-top Testing ............................................................................................................................................... 22
Accumulator Case and Sidepods ............................................................................................................................. 23
Drivetrain ................................................................................................................................................................ 23
Suspension .............................................................................................................................................................. 23
Budget ......................................................................................................................................................................... 24
Final Evaluation ........................................................................................................................................................... 24
Conclusions and Recommendations ............................................................................................................................ 26
Appendix ..................................................................................................................................................................... 28
FMEA...................................................................................................................................................................... 31
References: .................................................................................................................................................................. 34
Figure 1: Accumulator Case ........................................................................................................................................ 10 Figure 2: Drivetrain Components ................................................................................................................................ 11 Figure 3: Rear Suspension Assembly .......................................................................................................................... 12 Figure 4: Sidepods ....................................................................................................................................................... 12 Figure 5: Rotating Motor Mount with Tensioning Rods ............................................................................................. 14 Figure 6: Outer Control Arm Components (Upper Left, Lower Right), and Rear Rocker .......................................... 15 Figure 7: Accumulator Case Side Impact and Rear Impact Safety Factors ................................................................. 18 Figure 8: Static Heat Transfer of Accumulator case .................................................................................................... 18 Figure 9: Motor Mounting Plates ................................................................................................................................ 19 Figure 10: Loads and results on mounting plates ........................................................................................................ 19 Figure 11: Loads and Results on Rear Rocker............................................................................................................. 20 Figure 21: Total Deformation and Maximum Shear Strain ......................................................................................... 21 Figure 6: Airflow Through and Around Sidepod and Airflow along Sidepod Curvature............................................ 22 Figure 18: (a) Simulation Current vs. Time and (b) Current Draw in Failure Mode ... Error! Bookmark not defined. Figure 19: Safety Circuit Schematic ............................................................................................................................ 30 Figure 20: Emrax 207 Torque and Power Curves ....................................................................................................... 30
Table 1: Objectives for the 2016 RREV2 ...................................................................................................................... 8 Table 2: Constraints for the 2016 RREV2 ..................................................................................................................... 9 Table 3: Cashflow ........................................................................................................................................................ 24 Table 4 : Accumulator Case Material .......................................................................................................................... 28 Table 5 : Accumulator Case Design ............................................................................................................................ 28 Table 6: Motor Decision Matrix .................................................................................................................................. 28 Table 7: Gear ratio data ............................................................................................................................................... 28 Table 8: Anti-Roll Decision Matrix ............................................................................................................................. 29 Table 9: Sidepod design decision matrix ..................................................................................................................... 29 Table 10: Composite Material Decision ...................................................................................................................... 29 Table 11: FMEA .......................................................................................................................................................... 31
Page | 5
Executive Summary:
Formula SAE has evolved into the largest intercollegiate competition in the world with Colorado State University as a proud competitor for many years. CSU’s Formula SAE 2016 season has taken a very different design approach than years past with the creation of the Electric Vehicle 2 (EV2) car. For the 2015 season, the team has decided to move away from the internal combustion cars to compete in the fully electric category. The 2015 team attended competition with mixed success. They succeeded in proving that a fully electric car can be produced in time to attend competition, but team went overboard when creating safety circuits. This over planning caused the car to be unreliable and unable to pass safety inspection at competition and kept them from competing. The events of 2015 left our design team with no driving data on the car, including no knowledge on battery performance, motor characteristics, and drivability of their design. This, along with a short remaining budget for the 2016 competition registration time, swayed our decision to keep the 2015 chassis and create a test mule to acquire the necessary data to produce a competitive car for the 2017 competition.
The goals for the 2016 season were to create a bare bones, running vehicle with key subsystems that can be taken from the EV2 car and implemented on the EV3 car for the 2017 season. For the EV2 car to be called a success, the vehicle needs to drive, have the ability to acquire battery and motor data, and provide complete safety circuit and wiring that would be able to pass safety inspection if we were to attend competition. A focus on creating a reusable drivetrain design was also implemented for easy iteration from the EV2 to EV3 car.
With the decision to turn the EV2 car into a dedicated test vehicle, many design aspects could be simplified. Electrically, the safety circuits were designed using mechanical latching relays as opposed to the solid state design of 2015 allowing the car to be much more reliable and ultimately safer to drive and work on. For battery data, a half case (72 instead of estimated 144 cells) could be used due to the car no longer required to complete the full 22km endurance distance of competition. The half case will still provide the data necessary for battery sizing and characteristics, however, it allows for a simpler battery pack design, both physically and electrically, and allows for better packaging placement in the frame. In conjunction with making the case smaller, it was decided to make the case out of steel for easier welding and manufacturing as opposed to the aluminum design in 2015. Fiberglass sidepods were redesigned to direct air into the battery case for air cooling as opposed to the water cooling design of 2015. Rear suspension was altered due to poor design in 2015, causing a low ride height and no camber adjustment.
Manufacturing for the car was primarily done in house by team members with minor, more advanced processes being contracted out to professionals. These processes include circuit board manufacturing, waterjet cutting, precision welding, and complicated machining. Custom circuit boards were designed then sent out for manufacturing. They were then received and components were installed in house by members of the team. Tabs, motor mounts and battery case panels were designed then sent out for water jet cutting. It was then assembled in house, except for the battery case that was professionally welded due to the thin steel and lack of welding knowledge of team members. The battery pack was then assembled in house by team members once the finished case was received. It was decided that the outer control arm pieces
Page | 6
that would have the best quality if professionally machined and were sent to Woodward’s RPN department for manufacturing. All parts were assembled onto the painted chassis as they were completed.
The only scheduled milestone that remained constant throughout the entire process was a hard deadline of a completely assembled and running car by E-days. For this to happen many other scheduling problems had to be addressed. The biggest cause for schedule alteration this season was due to inadequate funding. The CSU Formula SAE team is a fully self-funded program with a majority of finances and parts being donated to the team. With the decision of not competing and reusing the EV2 chassis the two big purchases were a new, more suitable motor and a new Battery Management System (BMS). These big purchase items required a large lump sum to purchase. To acquire the funds necessary, there was a lot of design and manufacturing work that was pushed back in order to focus completely on fund raising. This ultimately caused all aspects of the car to fall behind the initial schedule by approximately three weeks. A new schedule was then established that reallocated member’s time and moved the car completion date back by removing testing time in order to maintain the deadline of a completed car by E-days. Some of the big milestones for the project was car assembly completion on April 10th, motor’s first spin up April 13th, and first test drive April 23rd (Confirm Dates).
The focus for initial testing was to tune the car to maximize the performance so future tests will be more accurate to a competition setting. Future tests will involve competition-like events, including acceleration, skid pad, autocross, and “mini” endurance. All of these tests will be focused on tracking battery characteristics such as temperatures, discharge rates, and longevity as well as motor outputs and temperatures. This data will be used to help the 2017 team make more educated design decision such as the use of regenerative braking, battery cell count, and battery cooling options. Times and performance for all driving tests will be used to compare with times and performance of competing teams at the 2016 Formula Electric competition in Lincoln, Nebraska to determine an estimated place in competition had we competed.
Acknowledgements
The team would like to recognize the advisor of the project, Dr. Mitch Stansloski for his generous contribution and continuous dedication to this team, project, and the FSAE organization.
Also, the team sends a special thank you to the sponsors who have donated or assisted in the completion of the 2016 FSAE EV2 car:
Melasta, THC Magnesium, Pioneer Engineering, Green Light Café, Interstate Batteries, G and E Construction, Enstroj, Woodward, PTC, Fusion Fabrication, The Pointe Real Estate, Colorado Water Jet, The Houser Family, and The Christensen Family.
Page | 7
Additional special thanks to CSU faculty and advisors:
Stephanie Rosso, Dr. Donald Radford, Jr. Garza, Dr. James Barnes, Dr. Andrew Meintz, and our Engineers in residence Sam Babb, Scot Heath, and Steve Pacheco.
Introduction
The Society of Automotive Engineers established Formula SAE in 1980. It began as a Baja competition with highly defined rules limiting innovation. Shortly after the competition was created, a new competition called Formula SAE was purposed to allow for a greater range of innovation and creativity among the students competing. Formula SAE is a fictional manufacturing company contracted to design small Formula-style racecar for the amateur racing market. Each team designs, builds, and tests a prototype based on a well-defined compilation of rules purposed both to ensure safety and to promote clever problem solving. The competitions provide teams the chance to demonstrate their abilities with respect to innovation, creativity and engineering knowledge when faced with real world problems and constraints.
Ram Racing was established in 1996 with the original Formula SAE competition, producing and competing with internal combustion cars. Currently, Ram Racing is headed by senior participating in senior design and supported by club members attending Colorado State University. Today’s Formula SAE club is made up of underclassmen from a variety of disciplines, with the majority being Mechanical and Electrical Engineering students. While the main goal of this club is producing a fully functioning vehicle for the 2016 Formula SAE competition in Lincoln, Nebraska, we are also very concerned with teaching the underclassmen good engineering practices and preparing them for a future iteration of our racecar.
During the competition, teams compete in three scored Static Events as well as four scored Dynamic Events. The Static Events include Design Judging, Cost Report, and Project Presentation, as well as a technical inspection that is not scored. The vehicle then competes in Acceleration, Skid pad, Autocross, and Endurance events during the Dynamic portion of competition.
Ram Racing 2016 has elected to continue with FSAE Electric and build the EV2 car. Our senior design team is utilizing similar EV1 design concepts and lessons learned from last year to increase the performance and reliability of CSU’s electric Formula SAE racecar. Again, the senior design team is a joint project between the Electrical and Mechanical Departments at Colorado State University, which allows for better integration of electrical components and mechanical components.
Problem Statement
The primary goal of this year’s senior design team is to learn from last year’s difficulties and build the team’s first running electric vehicle for the Formula SAE competition. Due to budget constraints, the team has made the decision to move to a two-year competition cycle. Going to competition is a very expensive endeavor and the team decided a better investment would be to

Page | 8
save our resources and compete once we have a tested, reliable, and proven car. Additionally, moving to a two year design cycle will provide the team with much more testing time and allow for better battery data acquisition. The additional preparation will give the next team reliable data to begin the next design phase as well as an advantage heading into competition.
Design Problem Analysis:
Customer and end-user
The customer for this project is well defined in the rules. For FSAE competition the idea is to build a race car for the average weekend racer. The goal is to build a reliable, easy to drive car that complies with all the competition rules.
Objectives For the 2016 Ram Racing Electric vehicle (RREV2), the team is focused primarily on
producing a tested and competitive car for E-Days, as well as acquiring as much data as possible for next year’s team. Although we are not planning on competing this year, the car is still being designed to comply with all the FSAE rules. By designing the car as if we were going to competition, the data acquired will be more useful when designing next year’s car. This will give next year’s team a solid platform on which to build a competitive car for competition.
Table 1: Objectives for the 2016 RREV2
Objectives
Priority Rating
5-Highest 1-Lowest
Method of Measurement (Theoretical)
Method of Measurement (Actual)
Objective Direction Target
Car Mass 1 Model 4 Point Scale Decrease <600 lb Electrical Safety 5 Bench Test Field Test Pass Pass Tech
Packaging 3 Weight Distribution 4 Point Scale Maintain
45-55 Front-rear 50-50 Left-right
Technical Inspection 4.5 FSAE Rules Competition Inspection Pass Pass Tech
Auto Cross Time 2 Lap Sim Field Test/Data Log Decrease 55s (~avg. lap time) on FSAE
course Battery Removal/
Replace Time 4 Creo Model Field Test Decrease 30 minutes
Endurance Length 4 Lap Sim Field Test/Data Log Increase 25 km
Page | 9
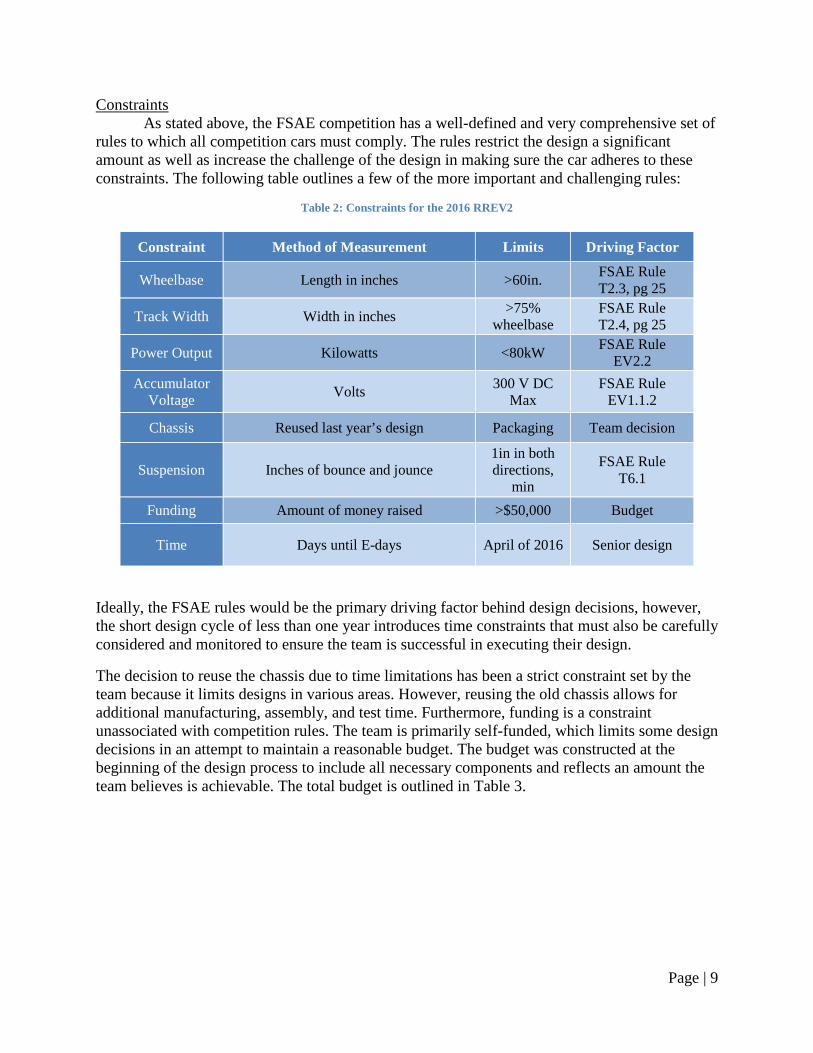
Constraints As stated above, the FSAE competition has a well-defined and very comprehensive set of
rules to which all competition cars must comply. The rules restrict the design a significant amount as well as increase the challenge of the design in making sure the car adheres to these constraints. The following table outlines a few of the more important and challenging rules:
Table 2: Constraints for the 2016 RREV2
Ideally, the FSAE rules would be the primary driving factor behind design decisions, however, the short design cycle of less than one year introduces time constraints that must also be carefully considered and monitored to ensure the team is successful in executing their design.
The decision to reuse the chassis due to time limitations has been a strict constraint set by the team because it limits designs in various areas. However, reusing the old chassis allows for additional manufacturing, assembly, and test time. Furthermore, funding is a constraint unassociated with competition rules. The team is primarily self-funded, which limits some design decisions in an attempt to maintain a reasonable budget. The budget was constructed at the beginning of the design process to include all necessary components and reflects an amount the team believes is achievable. The total budget is outlined in Table 3.
Constraint Method of Measurement Limits Driving Factor
Wheelbase Length in inches >60in. FSAE Rule T2.3, pg 25
Track Width Width in inches >75% wheelbase
FSAE Rule T2.4, pg 25
Power Output Kilowatts <80kW FSAE Rule EV2.2
Accumulator Voltage Volts 300 V DC
Max FSAE Rule
EV1.1.2
Chassis Reused last year’s design Packaging Team decision
Suspension Inches of bounce and jounce 1in in both directions,
min
FSAE Rule T6.1
Funding Amount of money raised >$50,000 Budget
Time Days until E-days April of 2016 Senior design
Page | 10
Design Summary Electrical Currently, the electrical team is in the track testing and tuning phase of the project. In this phase we run the car in various track conditions until we find an error in the system, once it has been found we will tune that if possible and if it is not we will change with any alternative parts we may have for that portion of the system and make note for the next iteration. Currently all systems are working as expected, however as we test it with other track conditions issues may arise.
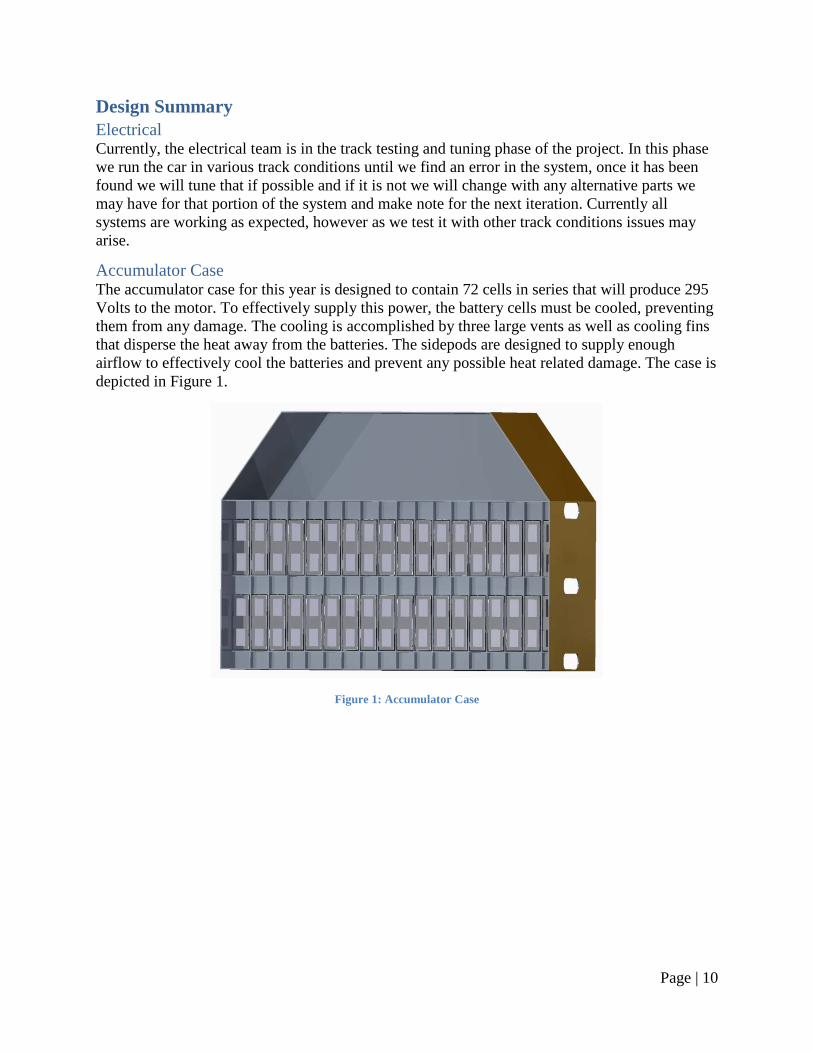
Accumulator Case The accumulator case for this year is designed to contain 72 cells in series that will produce 295 Volts to the motor. To effectively supply this power, the battery cells must be cooled, preventing them from any damage. The cooling is accomplished by three large vents as well as cooling fins that disperse the heat away from the batteries. The sidepods are designed to supply enough airflow to effectively cool the batteries and prevent any possible heat related damage. The case is depicted in Figure 1.
Figure 1: Accumulator Case
Page | 11
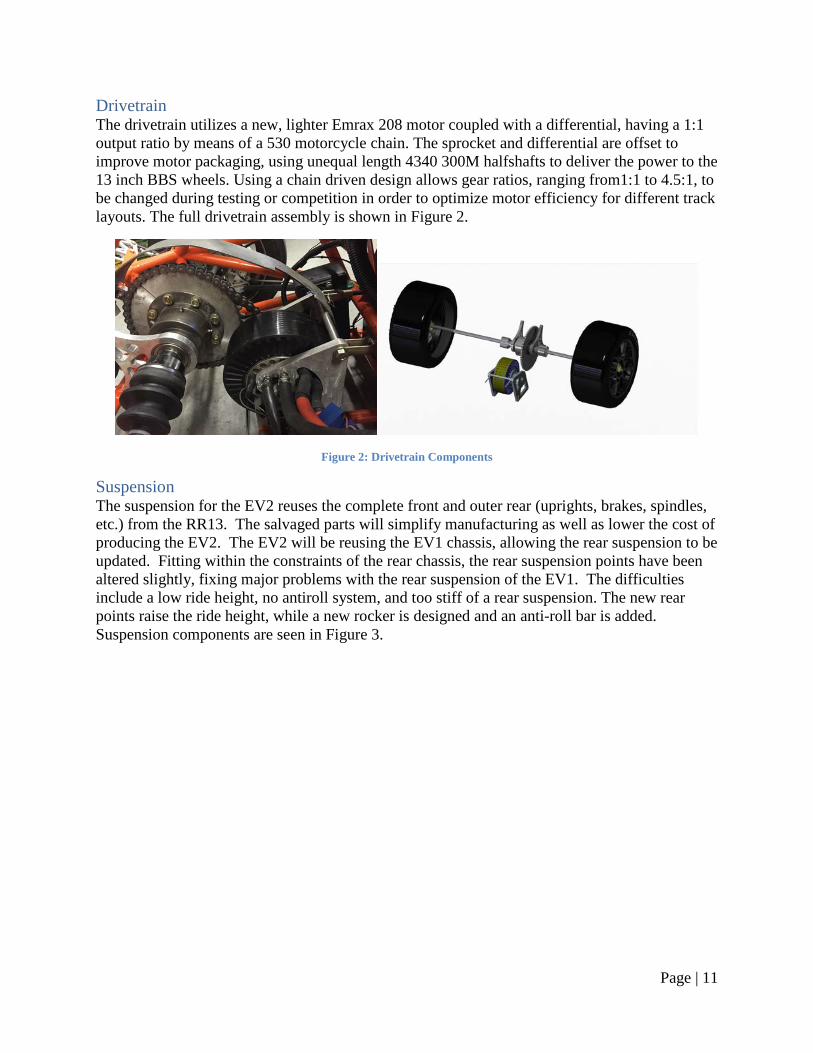
Drivetrain The drivetrain utilizes a new, lighter Emrax 208 motor coupled with a differential, having a 1:1 output ratio by means of a 530 motorcycle chain. The sprocket and differential are offset to improve motor packaging, using unequal length 4340 300M halfshafts to deliver the power to the 13 inch BBS wheels. Using a chain driven design allows gear ratios, ranging from1:1 to 4.5:1, to be changed during testing or competition in order to optimize motor efficiency for different track layouts. The full drivetrain assembly is shown in Figure 2.
Figure 2: Drivetrain Components
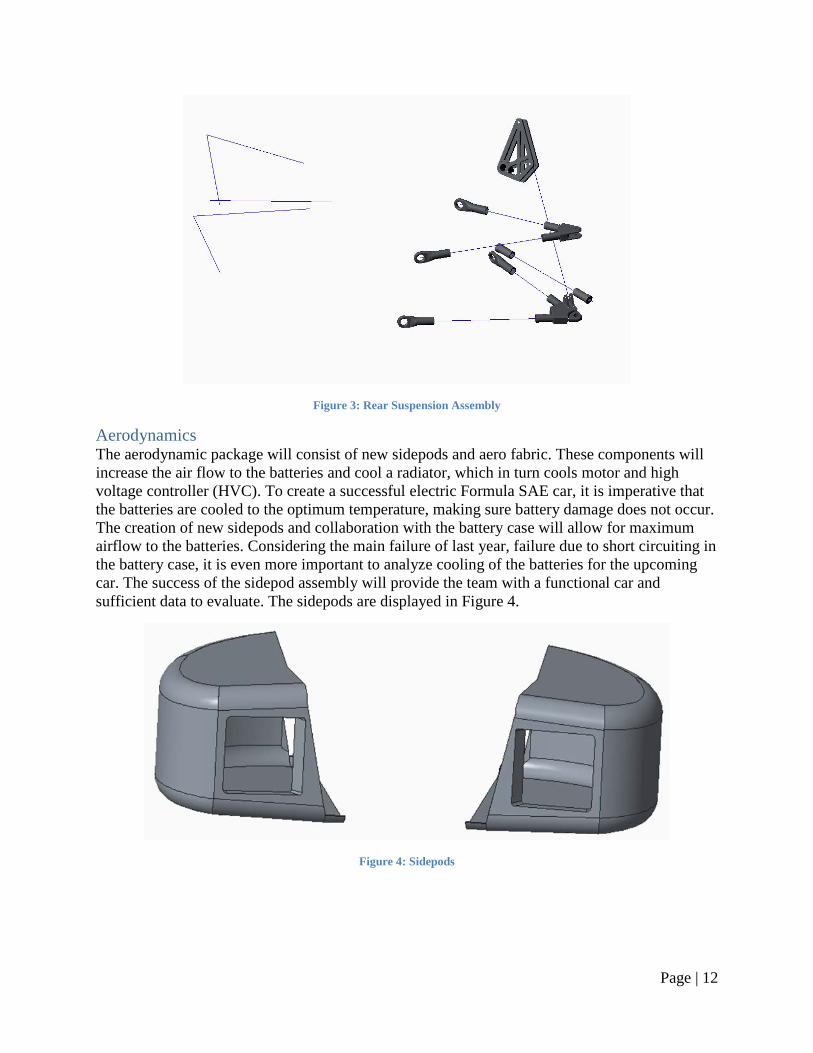
Suspension The suspension for the EV2 reuses the complete front and outer rear (uprights, brakes, spindles, etc.) from the RR13. The salvaged parts will simplify manufacturing as well as lower the cost of producing the EV2. The EV2 will be reusing the EV1 chassis, allowing the rear suspension to be updated. Fitting within the constraints of the rear chassis, the rear suspension points have been altered slightly, fixing major problems with the rear suspension of the EV1. The difficulties include a low ride height, no antiroll system, and too stiff of a rear suspension. The new rear points raise the ride height, while a new rocker is designed and an anti-roll bar is added. Suspension components are seen in Figure 3.
Page | 12
Figure 3: Rear Suspension Assembly
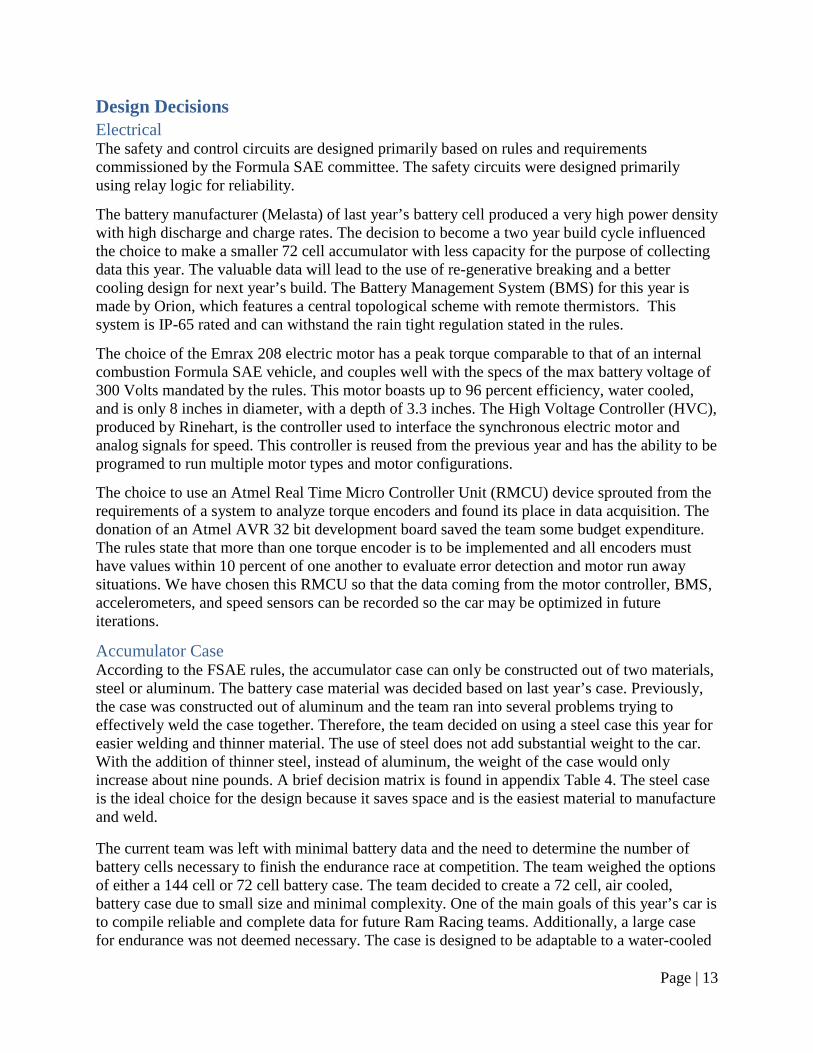
Aerodynamics The aerodynamic package will consist of new sidepods and aero fabric. These components will increase the air flow to the batteries and cool a radiator, which in turn cools motor and high voltage controller (HVC). To create a successful electric Formula SAE car, it is imperative that the batteries are cooled to the optimum temperature, making sure battery damage does not occur. The creation of new sidepods and collaboration with the battery case will allow for maximum airflow to the batteries. Considering the main failure of last year, failure due to short circuiting in the battery case, it is even more important to analyze cooling of the batteries for the upcoming car. The success of the sidepod assembly will provide the team with a functional car and sufficient data to evaluate. The sidepods are displayed in Figure 4.
Figure 4: Sidepods
Page | 13
Design Decisions Electrical The safety and control circuits are designed primarily based on rules and requirements commissioned by the Formula SAE committee. The safety circuits were designed primarily using relay logic for reliability.
The battery manufacturer (Melasta) of last year’s battery cell produced a very high power density with high discharge and charge rates. The decision to become a two year build cycle influenced the choice to make a smaller 72 cell accumulator with less capacity for the purpose of collecting data this year. The valuable data will lead to the use of re-generative breaking and a better cooling design for next year’s build. The Battery Management System (BMS) for this year is made by Orion, which features a central topological scheme with remote thermistors. This system is IP-65 rated and can withstand the rain tight regulation stated in the rules.
The choice of the Emrax 208 electric motor has a peak torque comparable to that of an internal combustion Formula SAE vehicle, and couples well with the specs of the max battery voltage of 300 Volts mandated by the rules. This motor boasts up to 96 percent efficiency, water cooled, and is only 8 inches in diameter, with a depth of 3.3 inches. The High Voltage Controller (HVC), produced by Rinehart, is the controller used to interface the synchronous electric motor and analog signals for speed. This controller is reused from the previous year and has the ability to be programed to run multiple motor types and motor configurations.
The choice to use an Atmel Real Time Micro Controller Unit (RMCU) device sprouted from the requirements of a system to analyze torque encoders and found its place in data acquisition. The donation of an Atmel AVR 32 bit development board saved the team some budget expenditure. The rules state that more than one torque encoder is to be implemented and all encoders must have values within 10 percent of one another to evaluate error detection and motor run away situations. We have chosen this RMCU so that the data coming from the motor controller, BMS, accelerometers, and speed sensors can be recorded so the car may be optimized in future iterations.
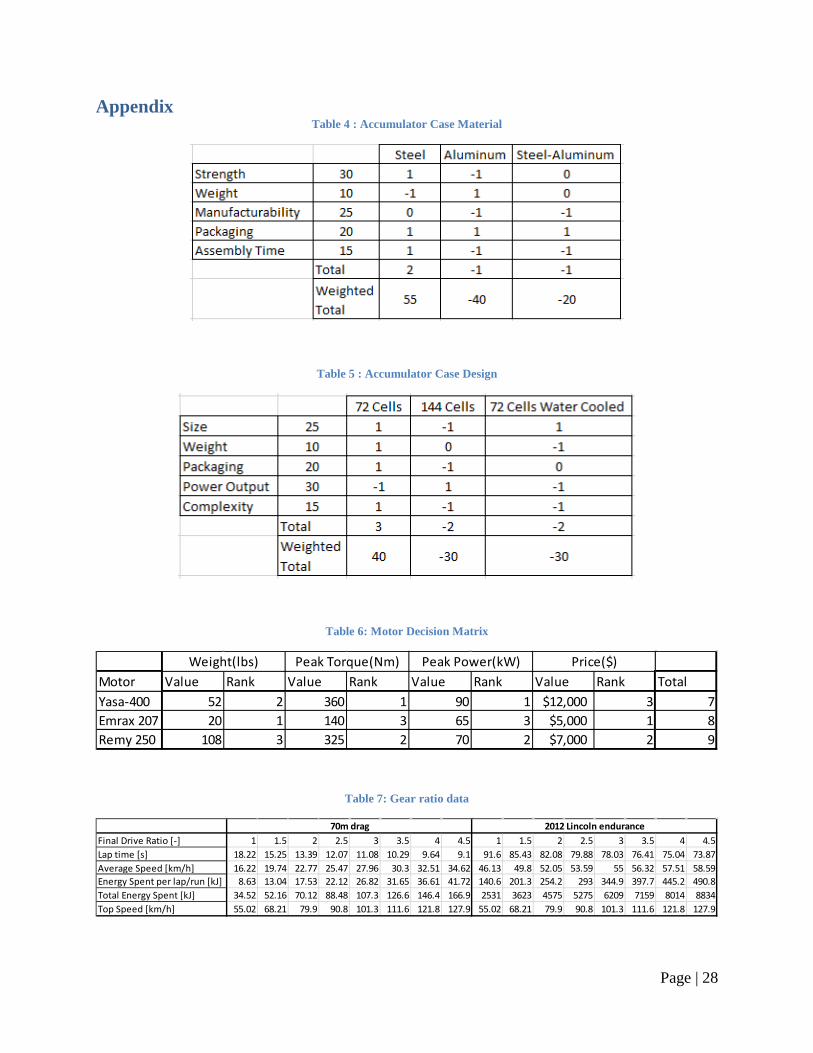
Accumulator Case According to the FSAE rules, the accumulator case can only be constructed out of two materials, steel or aluminum. The battery case material was decided based on last year’s case. Previously, the case was constructed out of aluminum and the team ran into several problems trying to effectively weld the case together. Therefore, the team decided on using a steel case this year for easier welding and thinner material. The use of steel does not add substantial weight to the car. With the addition of thinner steel, instead of aluminum, the weight of the case would only increase about nine pounds. A brief decision matrix is found in appendix Table 4. The steel case is the ideal choice for the design because it saves space and is the easiest material to manufacture and weld.
The current team was left with minimal battery data and the need to determine the number of battery cells necessary to finish the endurance race at competition. The team weighed the options of either a 144 cell or 72 cell battery case. The team decided to create a 72 cell, air cooled, battery case due to small size and minimal complexity. One of the main goals of this year’s car is to compile reliable and complete data for future Ram Racing teams. Additionally, a large case for endurance was not deemed necessary. The case is designed to be adaptable to a water-cooled
Page | 14
case if the future team considers it essential for regenerative breaking. Design decisions are further displayed in appendix Table 5.
Drivetrain Motor Type/Model The main improvement to the drivetrain this year is the motor. A new, lighter motor will be used, ultimately providing a better overall fit for the car. A decision matrix is shown in appendix Table 6. The Emrax 208 motor proved to be best for our needs. The Yasa 400 motor has a similar power to weight ratio. However, at more than double the price and lack of availability, the Emrax 208 was determined to be a better choice.
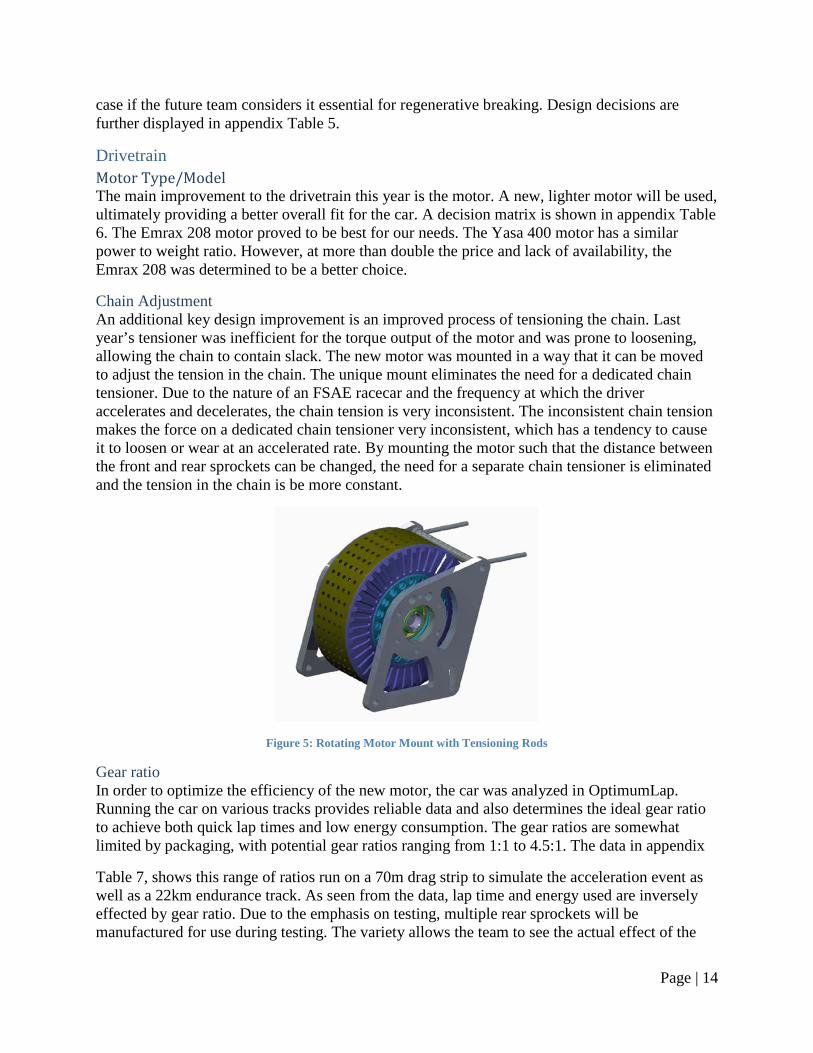
Chain Adjustment An additional key design improvement is an improved process of tensioning the chain. Last year’s tensioner was inefficient for the torque output of the motor and was prone to loosening, allowing the chain to contain slack. The new motor was mounted in a way that it can be moved to adjust the tension in the chain. The unique mount eliminates the need for a dedicated chain tensioner. Due to the nature of an FSAE racecar and the frequency at which the driver accelerates and decelerates, the chain tension is very inconsistent. The inconsistent chain tension makes the force on a dedicated chain tensioner very inconsistent, which has a tendency to cause it to loosen or wear at an accelerated rate. By mounting the motor such that the distance between the front and rear sprockets can be changed, the need for a separate chain tensioner is eliminated and the tension in the chain is be more constant.
Figure 5: Rotating Motor Mount with Tensioning Rods
Gear ratio In order to optimize the efficiency of the new motor, the car was analyzed in OptimumLap. Running the car on various tracks provides reliable data and also determines the ideal gear ratio to achieve both quick lap times and low energy consumption. The gear ratios are somewhat limited by packaging, with potential gear ratios ranging from 1:1 to 4.5:1. The data in appendix
Table 7, shows this range of ratios run on a 70m drag strip to simulate the acceleration event as well as a 22km endurance track. As seen from the data, lap time and energy used are inversely effected by gear ratio. Due to the emphasis on testing, multiple rear sprockets will be manufactured for use during testing. The variety allows the team to see the actual effect of the
Page | 15
gear ratio on energy consumption and lap time. In addition, other effects can be monitored, such as driver preference of location of torque curve in relation to car speed.
Suspension Suspension Points and Kinematics Inner suspension points were unable to be substantially moved, due to the restriction of reusing the EV1 chassis. The outer points in space, however, can be changed relatively easily, with only slight variations of the outer control arm components. The EV1 rear suspension caused a ride height that was too low and could not be easily raised without negative effects from the camber change. The new points on the EV2 raise the rear ride height 0.5 in from the EV1. The kinematic points on the rear rocker were also changed to more closely match the suspension travel as well as stiffness of the front suspension. All suspension had kinematic simulations ran using Optimum K.
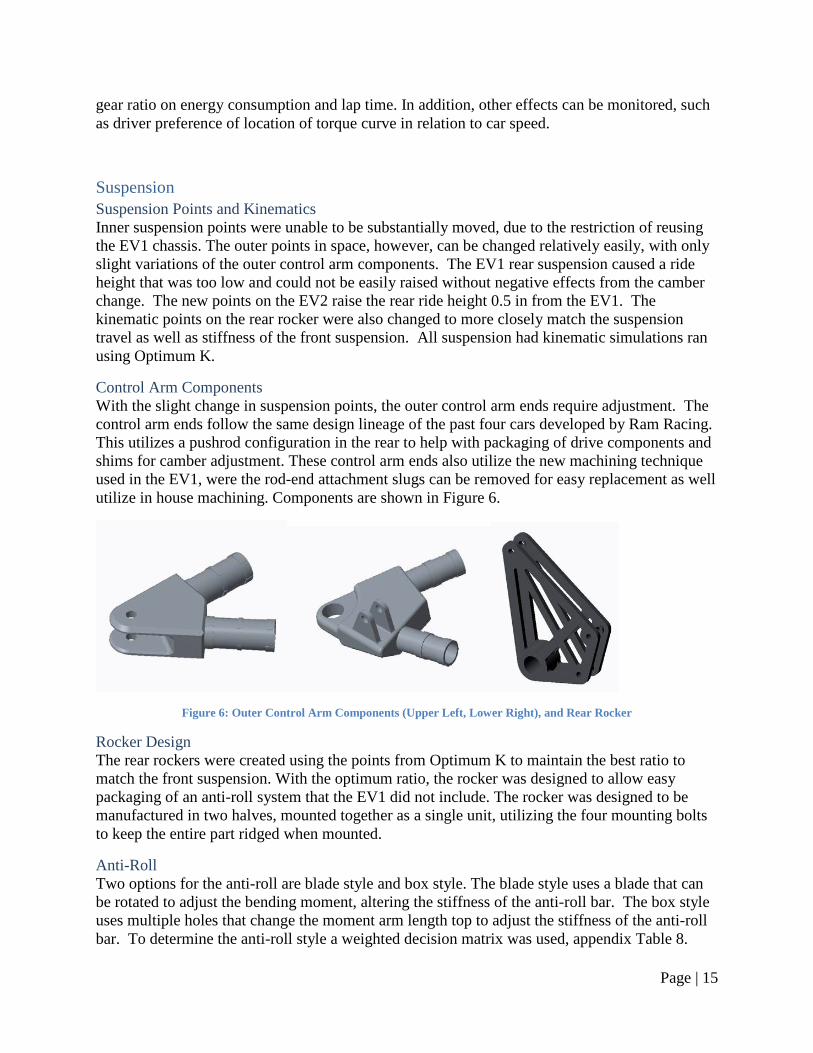
Control Arm Components With the slight change in suspension points, the outer control arm ends require adjustment. The control arm ends follow the same design lineage of the past four cars developed by Ram Racing. This utilizes a pushrod configuration in the rear to help with packaging of drive components and shims for camber adjustment. These control arm ends also utilize the new machining technique used in the EV1, were the rod-end attachment slugs can be removed for easy replacement as well utilize in house machining. Components are shown in Figure 6.
Figure 6: Outer Control Arm Components (Upper Left, Lower Right), and Rear Rocker
Rocker Design The rear rockers were created using the points from Optimum K to maintain the best ratio to match the front suspension. With the optimum ratio, the rocker was designed to allow easy packaging of an anti-roll system that the EV1 did not include. The rocker was designed to be manufactured in two halves, mounted together as a single unit, utilizing the four mounting bolts to keep the entire part ridged when mounted.
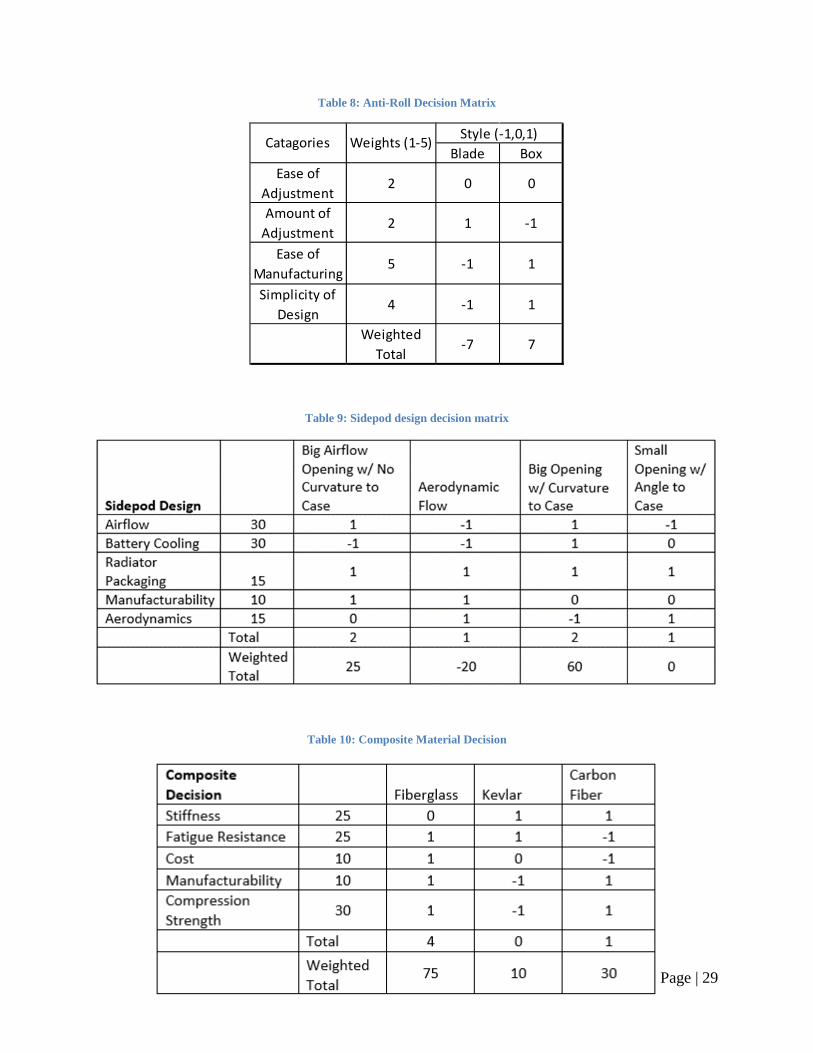
Anti-Roll Two options for the anti-roll are blade style and box style. The blade style uses a blade that can be rotated to adjust the bending moment, altering the stiffness of the anti-roll bar. The box style uses multiple holes that change the moment arm length top to adjust the stiffness of the anti-roll bar. To determine the anti-roll style a weighted decision matrix was used, appendix Table 8.
Page | 16
Aerodynamics Another main change to the aerodynamics of the car is the airflow system. The improved system provides cooling air to the battery case and radiator. With increased air intake abilities, the sidepods bring the maximum amount of air to the battery case. One sidepod also is used to hold a radiator, used to cool the water flowing to the motor and HVC. With increased curvature and a tight fit to the car, air swirls from the sidepod directly to the three air channels in the battery case, cooling the batteries. Aero fabric will be utilized on the chassis tubes to bounce air back into the sidepods where it will then be rerouted to the battery case. Pugh matricies Table 9 and Table 10 in the appendix display the design considerations of the piece.
At-risk Items and Mitigation Plan Funding Formula SAE is a self-funded club aside from the initial fund provided by the Mechanical Engineering Department for the senior design project portion. The initial funding can empty quickly with the cost of competition registration, expensive electrical items, chassis manufacturing, and machining. To make up for the extreme lack of finances, the team chose to forgo competition this year to save the money for a two year design cycle focus
Motor and BMS The motor and BMS cost a combined $7000. A majority of the cost is from the $5000 EMRAX motor. Cheaper alternatives for the motor were explored but the team decided this motor is a necessity. There is no alternative for the $2000 BMS. The BMS is needed to run the car as well as charge the complete battery pack. Last year’s BMS is unusable due to a catastrophic short that occurred during testing last summer.
Manufacturing Capabilities The most complicated manufacturing is associated with the suspension and battery. The complexity of the suspension comes from the unique geometry and packaging requirements. The battery complications are mainly rules and safety based. Manufacturing the sidepods was a four step process that included fabricating a male plug out of insulation foam, laying up mat fiberglass to create a female mold, two fiberglass layups to create the sidepods and post processing to create the final product that fit to the car.
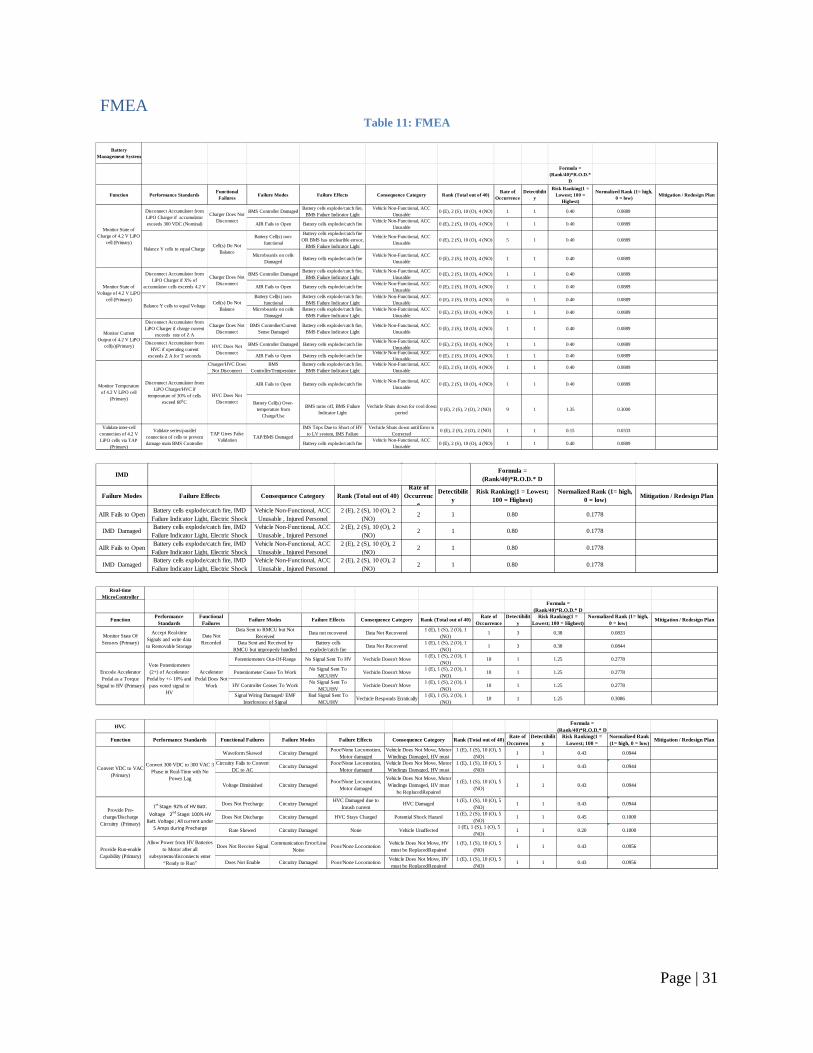
FMEA The FMEA analysis is used to evaluate each major component by the risks or failures it may have. After each component was identified and failure points were determined, the team elaborated on each failure, assigning the consequence a system of rank to govern the severity and likelihood of occurrence. In addition, the team prepared a mitigation plan for each area of the various components to determine how the problems will be solved.
The major mechanical FMEA components were the control arm, rocker, drivetrain, sidepod, as well as many electrical additions, BMS, IMD, RMCU, HVC, MSC, ACC, and motor. In general, failures focused on performance and safety precautions. The mitigation plans were largely aimed at remaking failed parts or replacing pieces as necessary. Details of FMEA can be found in appendix Table 11.
Page | 17
Detailed Design and Supporting Analysis Electrical The high voltage controller was reused from the previous year to save the team $5,200.00. It’s manufactured by Rinehart Motion Systems, model PM100-DX, which can take an input voltage of up to 400 VDC and produce an output of up to 350Vrms AC. The method used to convert the DC to AC is via MCU control and Insulated Gate Bipolar Transistor (IGBT) device. This MCU is powered by a low side battery in the range of 8V – 18V and is capable of other functions such as CAN communication.
The motor chosen is the EMRAX 208 produced by ENSROJ manufactured in Slovenia. The motor can produce 73 ft-lbs of torque when supplied with 150 Amperes. The motor will be attached to the drive axle using a chain and sprockets as described in the drivetrain section. The model chosen will be water cooled and has a resolver to tell the controller where the rotor is positioned.
Melasta is the manufacturer of the model SLPB9664155, Lithium Cobalt Ion batteries. The prismatic cells are capable of a 15C discharge rate at 150 Amperes continuous and 200 Amperes peak. The battery cells will be connected in series of 72 to produce a voltage of 300 V and 266 V nominal. Due to the lithium ion chemistry, the batteries must be monitored and kept within a voltage window of 4.2 V to 3.0 V to keep from battery destruction. The battery management system is produced by Orion with the ability to monitor 144 cells. Cell temperatures are monitored by and addition Thermistor Expansion Module which reports to the Orion master controller. This system is CAN capable from which the RMCU can collect data.
Atmel has donated one of their best RMCU chips already attached to a development board. This board is capable of analog to digital conversion, digital to analog conversions, CAN communications, audio in and out, local network interfacing, general purpose input/outputs (GPIO), and pulse width modulation outputs. The team has implemented this into the design to monitor and record many of the operations being performed on the car.
The RMCU is coded in the C/C++ programming languages. The algorithm implemented on the chip has the following functions. It monitors two simultaneous ADC channels given from two potentiometers located at the accelerator pedal. These two inputs are then put through a comparison to ensure that their signal is within 10% of each other as to detect potential failure of a potentiometer. It also monitors a GPIO pin for a signal from a micro-switch located on the brake pedal. If it detects the brake being pushed while the accelerator is more than 25% depressed, it will not send a signal to the high voltage controller. The output to the high voltage controller is handled by a pulse width modulated output paired with a low-pass filter to create a DC signal that the high voltage controller can interpret.
The Formula SAE rules specify a Bender, A-Isometer to be used for monitoring the potential insulation between the high voltage and low voltage systems. The system uses the IR 155-3203 model from last year’s design.
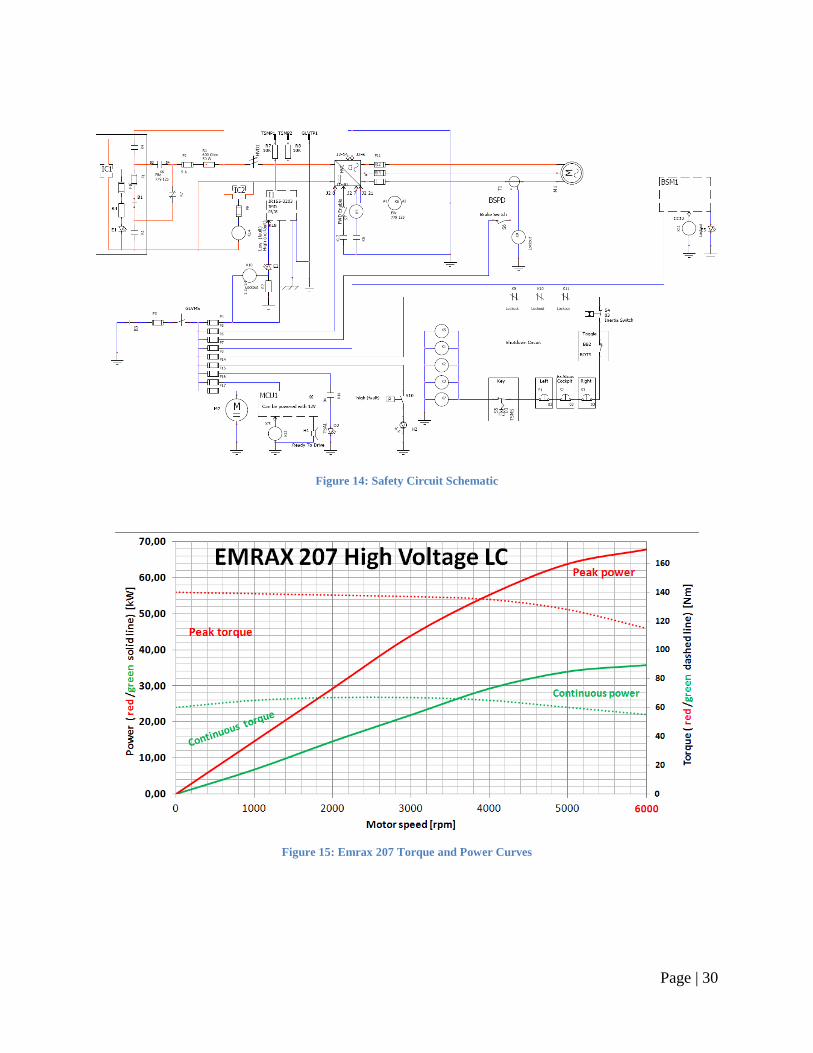
All these main components interact with the master safety circuit (MSC) to shut off the accumulator power to the tractive system in the event there is a fault in any system see appendix Figure 15. The MSC has three emergency-stop switches. Both the high voltage and low voltage systems have master switches and for added safety the high voltage has an easy disconnect.
Page | 18
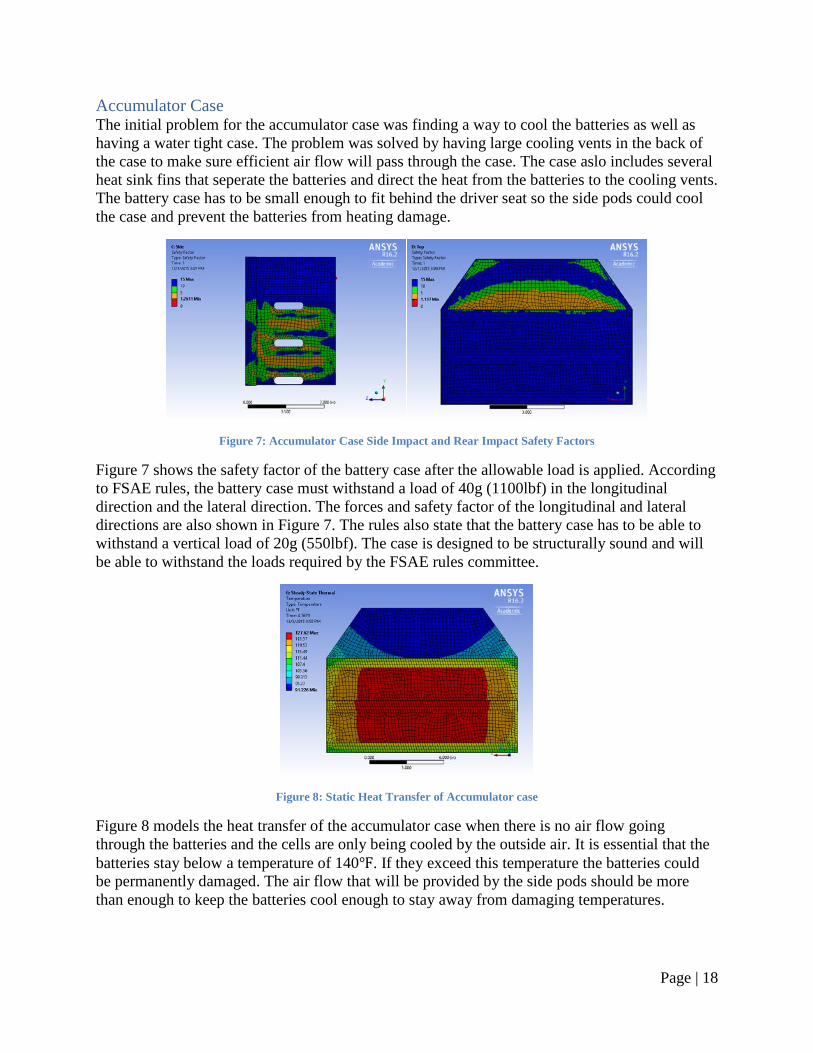
Accumulator Case The initial problem for the accumulator case was finding a way to cool the batteries as well as having a water tight case. The problem was solved by having large cooling vents in the back of the case to make sure efficient air flow will pass through the case. The case aslo includes several heat sink fins that seperate the batteries and direct the heat from the batteries to the cooling vents. The battery case has to be small enough to fit behind the driver seat so the side pods could cool the case and prevent the batteries from heating damage.
Figure 7: Accumulator Case Side Impact and Rear Impact Safety Factors
Figure 7 shows the safety factor of the battery case after the allowable load is applied. According to FSAE rules, the battery case must withstand a load of 40g (1100lbf) in the longitudinal direction and the lateral direction. The forces and safety factor of the longitudinal and lateral directions are also shown in Figure 7. The rules also state that the battery case has to be able to withstand a vertical load of 20g (550lbf). The case is designed to be structurally sound and will be able to withstand the loads required by the FSAE rules committee.
Figure 8: Static Heat Transfer of Accumulator case
Figure 8 models the heat transfer of the accumulator case when there is no air flow going through the batteries and the cells are only being cooled by the outside air. It is essential that the batteries stay below a temperature of 140℉. If they exceed this temperature the batteries could be permanently damaged. The air flow that will be provided by the side pods should be more than enough to keep the batteries cool enough to stay away from damaging temperatures.

Page | 19
Drivetrain The main design problem with the RREV2 drivetrain was mounting the unique Emrax 208 motor. The motor is unique because the outer casing of the motor spins. As a result, the motor must be mounted to a single plate on the back of the motor and a shaft support on the front, rather than multiple mounting points on the sides of the motor.
Figure 9: Motor Mounting Plates
Figure 9 shows the mounting plates. The plates were waterjet cut from ½ inch 6061 aluminum and mounts to the motor using 6 M8 bolts. The other side of the motor is supported by a sealed roller bearing on the ¾ steel shaft. These two plates are mounted to the frame via tabs welded directly to the frame. In order to simplify the chain tensioning system, this entire assembly will rotate about the bottom mounting holes (a) to tighten the chain. To achieve this, the front lower mounting holes (b), are slotted and the upper holes (c) are attached via threaded rods.
Analysis was done on the plates using FEA (Finite Element Analysis). The Emrax 208 motor produces 140 Nm (103 ft-lbs) of torque (Appendix Figure 16). Figure 10 shows the motor mount plates loaded with the appropriate torque loads. This final design of the motor and bearing side plates yield a Safety Factor of 8.61 and 8.34 respectively.
Figure 10: Loads and results on mounting plates
A keyed #50 sprocket will be used to drive the 530 motorcycle chain and transmit the power to the rear wheels. The sprocket used will be purchased from surplus center and will use key and keyway sizing according to specifications which exceed the tensile strength of the 530 motorcycle chain used (9700lbs).
Page | 20
The chain, rear sprocket, deferential, CV joints, half shafts, and hubs are being reused from the RREV1 which utilized a motor with higher peak torque so no analysis was done on these components.
Suspension The suspension on this year’s EV2 will consist of the full front suspension and outer rear suspension from the RR13 car. This restricts the front to a pull-rod configuration and the rear to a push-rod system. The reuse of the EV1 chassis restricts design, though the major problems have been addressed. The ride height has been increased by 0.5 inches and the upper control arm chassis points have been lowered by 0.25 inches. The EV1 also had a problem with the rear suspension being extremely stiff and has been addressed with a redesign of the rear rocker. To match the motion ratios of the front and the rocker, tabs will be fixture to ensure the system is in plane.
The outer control arm component will be produced in three parts, two rod connections and the main body. This allows the parts to be manufactured in house and allows for an inexpensive replacement of control arms when damaged. The parts will be made from aluminum billet and round stock.
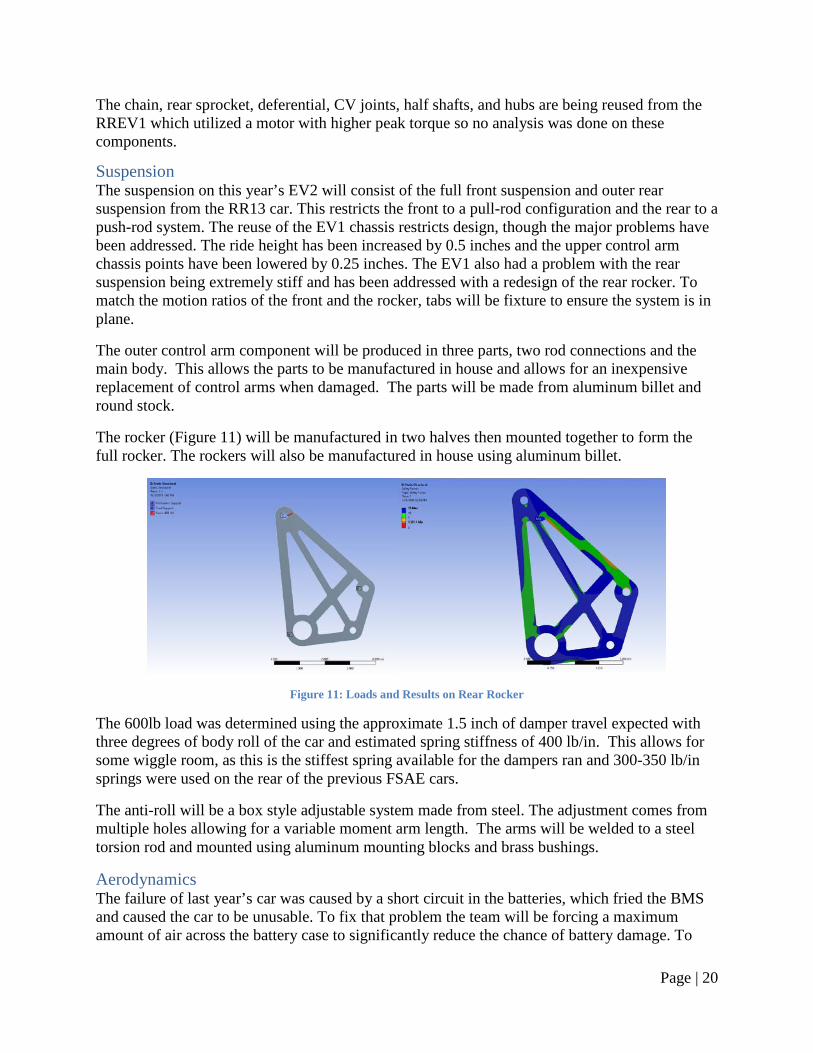
The rocker (Figure 11) will be manufactured in two halves then mounted together to form the full rocker. The rockers will also be manufactured in house using aluminum billet.
Figure 11: Loads and Results on Rear Rocker
The 600lb load was determined using the approximate 1.5 inch of damper travel expected with three degrees of body roll of the car and estimated spring stiffness of 400 lb/in. This allows for some wiggle room, as this is the stiffest spring available for the dampers ran and 300-350 lb/in springs were used on the rear of the previous FSAE cars.
The anti-roll will be a box style adjustable system made from steel. The adjustment comes from multiple holes allowing for a variable moment arm length. The arms will be welded to a steel torsion rod and mounted using aluminum mounting blocks and brass bushings.
Aerodynamics The failure of last year’s car was caused by a short circuit in the batteries, which fried the BMS and caused the car to be unusable. To fix that problem the team will be forcing a maximum amount of air across the battery case to significantly reduce the chance of battery damage. To

Page | 21
ensure battery damage does not occur they will need to be cooled below 60C at all times. This year’s sidepods will be validated with ANSYS to determine the stresses and deformation of the sidepod at max speeds and forces of a Formula SAE car. Fluent will also be utilized to show airflow through the sidepod and validate that it will be going directly to the battery case. 3-D printed models of the sidepod and battery case will also be put into a wind tunnel and analyzed to verify where the airflow will be directed.
Stress Analysis In ANSYS the design was put through 2 G’s of force on the front to simulate maximum racing conditions with wind speeds and sharp cornering of the vehicle. The strain energy may be used as a fatigue failure criterion for different composite materials. The goal is to build a sidepod out of a composite material that will deflect minutely and not break under racing conditions. The target material is fiberglass because of its material properties and how it deforms under compression and tensile forces.
Figure 12: Total Deformation and Maximum Shear Strain
Airflow Analysis Two different models were analyzed in fluent to verify the airflow. The first is just a sidepod to show the maximum amount of air entering through the inlet and the second model is a symmetry bluff body of the chassis with the sidepod fixed in place to show the air swirl. The airflow to the car was solved using fluent 16.2 and a realizable k-epsilon model with second order discretization schemes for momentum, kinetic energy and dissipation rate. A virtual wind tunnel was used to simulate a free stream velocity of 60 mph with the car going straight.
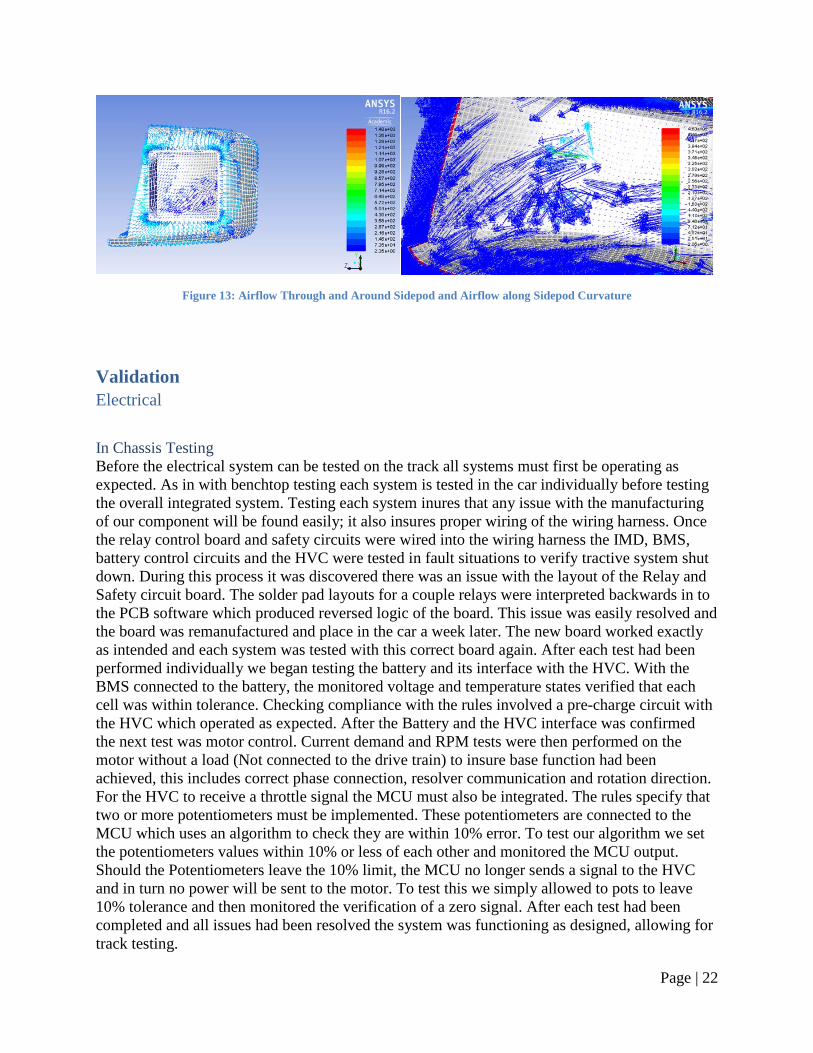
Figure 13 depicts airflow through and around the curvature of the sidepod using velocity vectors to show direction. It is important to note that the air velocity will increase along the inlet curvature causing a pressure drop and therefore more air is drawn into the sidepod. Figure 13 also shows the reaction of the airflow along the curvature. It is important that the air is sloping downward along the curvature and exiting the bottom left. This is good because the air will need to slope downward into the chassis in order to be vented directly towards the low mounted battery case.
Page | 22
Figure 13: Airflow Through and Around Sidepod and Airflow along Sidepod Curvature
Validation Electrical
In Chassis Testing Before the electrical system can be tested on the track all systems must first be operating as expected. As in with benchtop testing each system is tested in the car individually before testing the overall integrated system. Testing each system inures that any issue with the manufacturing of our component will be found easily; it also insures proper wiring of the wiring harness. Once the relay control board and safety circuits were wired into the wiring harness the IMD, BMS, battery control circuits and the HVC were tested in fault situations to verify tractive system shut down. During this process it was discovered there was an issue with the layout of the Relay and Safety circuit board. The solder pad layouts for a couple relays were interpreted backwards in to the PCB software which produced reversed logic of the board. This issue was easily resolved and the board was remanufactured and place in the car a week later. The new board worked exactly as intended and each system was tested with this correct board again. After each test had been performed individually we began testing the battery and its interface with the HVC. With the BMS connected to the battery, the monitored voltage and temperature states verified that each cell was within tolerance. Checking compliance with the rules involved a pre-charge circuit with the HVC which operated as expected. After the Battery and the HVC interface was confirmed the next test was motor control. Current demand and RPM tests were then performed on the motor without a load (Not connected to the drive train) to insure base function had been achieved, this includes correct phase connection, resolver communication and rotation direction. For the HVC to receive a throttle signal the MCU must also be integrated. The rules specify that two or more potentiometers must be implemented. These potentiometers are connected to the MCU which uses an algorithm to check they are within 10% error. To test our algorithm we set the potentiometers values within 10% or less of each other and monitored the MCU output. Should the Potentiometers leave the 10% limit, the MCU no longer sends a signal to the HVC and in turn no power will be sent to the motor. To test this we simply allowed to pots to leave 10% tolerance and then monitored the verification of a zero signal. After each test had been completed and all issues had been resolved the system was functioning as designed, allowing for track testing.
Page | 23
Track Testing Track testing is intended for tuning and gathering data from each system such as temperatures, current demand, fault states, and motor performance. A connected computer was used to communicate through a Controller Area Network (CAN) bus with the BMS and HVC to either adjust values on the fly or to monitor what conditions might cause a failure. This year’s intent is to obtain as much battery data and motor data for next year’s team so they can optimize their performance for future competition.
Accumulator Case and Sidepods Structural validation for the accumulator case is not easily done without building multiple cases and the fixturing necessary to impart the maximum force on them. The case is designed to withstand a force of 40g’s, this would only happen if another formula driver crashed into the back of the car during the endurance race. The accumulator case is also fully protected by the structure of the chassis and a force that large on the case is highly unlikely.
The air flow though the accumulator case and sidepods were validated by 3D printing the accumulator case as well as the side pods that direct the flow into the case. The 3D printed components were placed in a wind tunnel with a smoke machine in order to visualize the flow through the side pods. This ensured that the accumulator case and sidpods were getting the proper amount of air flow to effectively cool the battery cells. This validation showed the air flow was as expected from ANSYS.
Drivetrain Validation for the drivetrain was primarily done during testing on the car. Testing outside of the car was opposed due to lack of funding and time. The components in the drivetrain that were designed all have a relatively large safety factor and the components that were purchased all have torque/load ratings that are accurate and well above what is needed.
Failure of any of the drivetrain components should be fairly detectable (cracking or deformation) and in the event of a full failure the consequences are small being only an inoperable car or in an extreme case minor damage to other components.
Suspension Like the drivetrain, the suspension components were primarily tested while testing and tuning the completed car. Tensile pull tests were performed on sacrificial carbon tubes with bonded rod ends, verify bond gap and epoxy bond strength.
Page | 24
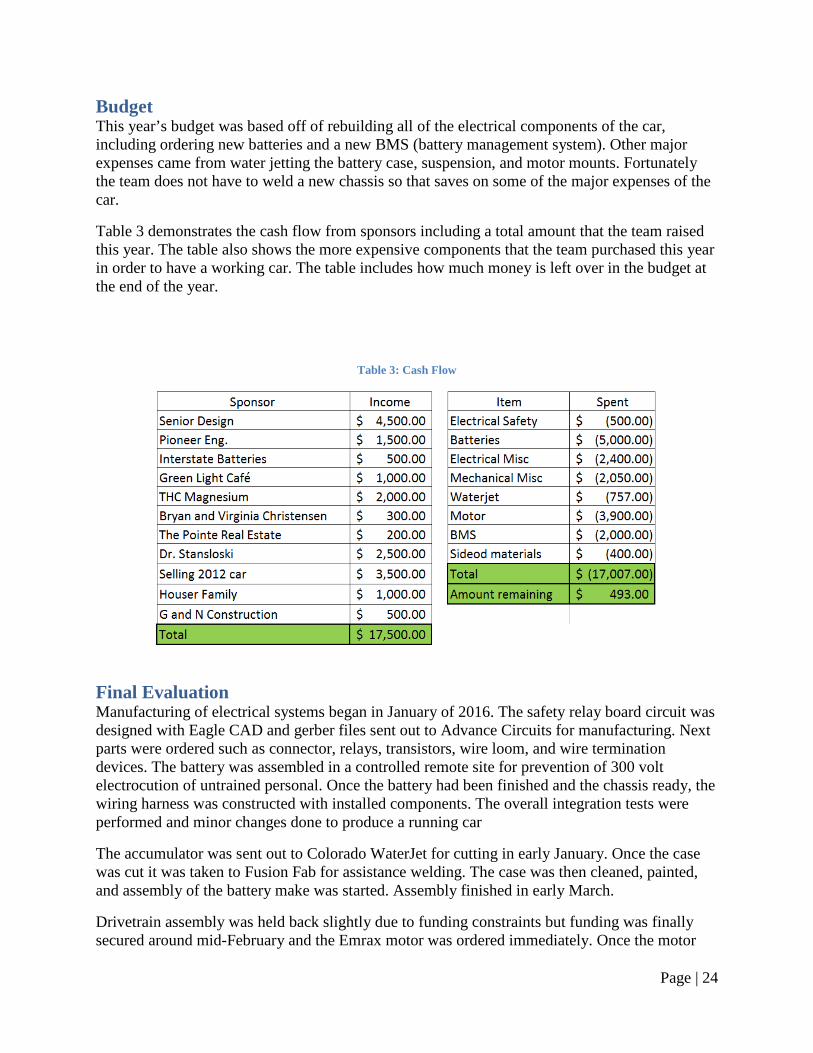
Budget This year’s budget was based off of rebuilding all of the electrical components of the car, including ordering new batteries and a new BMS (battery management system). Other major expenses came from water jetting the battery case, suspension, and motor mounts. Fortunately the team does not have to weld a new chassis so that saves on some of the major expenses of the car.
Table 3 demonstrates the cash flow from sponsors including a total amount that the team raised this year. The table also shows the more expensive components that the team purchased this year in order to have a working car. The table includes how much money is left over in the budget at the end of the year.
Table 3: Cash Flow
Final Evaluation Manufacturing of electrical systems began in January of 2016. The safety relay board circuit was designed with Eagle CAD and gerber files sent out to Advance Circuits for manufacturing. Next parts were ordered such as connector, relays, transistors, wire loom, and wire termination devices. The battery was assembled in a controlled remote site for prevention of 300 volt electrocution of untrained personal. Once the battery had been finished and the chassis ready, the wiring harness was constructed with installed components. The overall integration tests were performed and minor changes done to produce a running car
The accumulator was sent out to Colorado WaterJet for cutting in early January. Once the case was cut it was taken to Fusion Fab for assistance welding. The case was then cleaned, painted, and assembly of the battery make was started. Assembly finished in early March.
Drivetrain assembly was held back slightly due to funding constraints but funding was finally secured around mid-February and the Emrax motor was ordered immediately. Once the motor
Page | 25
was ordered, the motor mount plates were ordered to be cut by Colorado WaterJet and the bearing and sprockets were ordered. Once the motor came in the drivetrain assemble was completed and put into the chassis.
The suspension components can be split into two categories, components made in house and components made and donated by Woodward. Drawings for all upper and lower outer rod-ends were sent to Woodward’s rapid prototyping machine shop for manufacturing. These parts were chosen to be machined by Woodward due to their complex geometry and the manufacturing knowledge at Woodward would result in a higher quality part at a fraction of the time compared to in house machining down by team members. Woodward also agreed to donate aluminum stock for the rockers. With stock in hand the inner rod ends, outer rod attachment connections, and rear rockers were then machined in house at the CSU EMEC by various team members. Parts were manufactured using manual lathes and the HAAS 5-axis CNC. Carbon tubes were then measured and cut. A-arm assembly took place at the MERC using all machined parts, carbon tubes and aircraft grade two part epoxy. After bonding all components were then assembled onto the car, suspension set-up and ready for drive testing. Suspension was scheduled for completion with a rolling chassis by January first, but was not finished until mid-April, causing setbacks and major challenges for other team members.
Lastly the Aerodynamics for the car was manufactured by team members at the MERC, using the composites facilities. The sidepod layup was started mid-March and was completed shortly before E-days in mid-April. Aero fabric was also applied to the car after wiring was completed in order to improve airflow.
Assembly of main car components was completed by mid-April. After some in-car circuit testing and running motor tests, the car was first driven on April 23rd. This first track test day was very successful, with all main components functioning properly. The only minor issues were an overly sensitive brake switch causing safety shutdown and a possible weak battery cell fault from the BMS. The weak cell fault is currently being investigated to determine if cell replacement is needed or software parameters tweaked.
The minor issues were fixed and the car was tested again on April 29, 2016 in the shop and has a track day scheduled for the week of May 1, 2016. We designed and built an entire electrical system from the ground up. Some parts were bought from companies such as the HVC, however, our goal was to integrate them and to design a safety and control circuit from scratch. Our vehicle, had it gone to competition, would likely have been ready to compete in all events. However, looking forward, more water proofing has to be done to the circuit housing and battery case. Also, more energy storage would have been required for the endurance event, as we have only a half pack to allow for data acquisition.
Further testing will take place over the summer as a joint effort with both this year and next year’s senior design teams. The main objective of this project was to manufacture a test vehicle for the team to obtain data for next year. With testing underway and good cooperation with, next year’s team will set the team up for success. Another main focus was creating a functioning electrical circuit capable of passing tech inspection. With all safety circuits tested and functioning, the team is confident that the car is capable of passing tech with the current system.

Page | 26
The team experienced a few budget related deviations during the first semester but once the objectives were set to build a non-competition test vehicle, the plan stayed more consistent.
Conclusions and Recommendations The goals for the 2016 season were to create a bare bones, running vehicle with key subsystems that can be taken from the EV2 car and implemented on the EV3 car for the 2017 season. For the EV2 car to be considered a success, the first goal was to achieve a fully functional driving machine. Although there were significant schedule delays, all components of the car were completed and installed before the deadline of E-Days. In addition, the car has withstood initial testing days, making the team confident that reliable and valuable data can be collected. The second goal focused on the ability to acquire data from both the motor and the battery. The team has successfully completed test days, compiling data that has been analyzed for results. Future tests are anticipated to simulate competition course conditions. The last goal was to provide a complete safety circuit and wiring that would be able to pass safety inspection if we were to attend competition. Not only did the team complete all circuits, they surpassed expectations and will be able to implement this design into the EV3 car next year with few alterations expected.
Recommendations for next year largely draw on the challenges of the past. As a self-funded team, all members were responsible for raising funds. This meant a delay in design and manufacturing work to focus on business advancements. A valuable lesson for the upcoming teams would be to fundraise aggressively early in the senior design process to account for delays and challenges in funding that will come later. In addition, the 2016 team struggled to revive relationships with sponsors that had been damaged or dismissed over the 2015 year. In order to repair relations and set future years up for success, the team has made sponsors a serious priority. The team had reached out, inviting them to important events, sending updates and pictures, and writing thank you notes for their generosity. The team hopes that good sponsor relations will continue, as it has proven to be valuable and a significant aspect of support.
Additional challenges of the past include organization and leadership. The team leadership and organization of this year was a large improvement from 2015, however, there are still significant gaps in these areas that will need improvement for the success of 2017. FSAE is a university club as well as a design team. Though the team lead takes more responsibility than those of other projects, more focus should be placed on the upcoming club members without lagging in personal responsibilities to the design team. These young members are the upcoming success of the project and need to be taught and included though they are not part of the senior team. Organization of the project was lacking, deadlines were missed, and gaps in effort were apparent. Other members of the team carried uneven weight and surpassed expectations to still complete a successful car. Though some improvements were made from the past, organizational improvements will need to be met for a successful 2017 electric car. The future team has absorbed the finding and leadership issues and has embraced the challenge, already showing improvement.
Additional recommendations relate to more technical aspect of the car and design process. The electrical team suggests building off the safety circuits already in place, as they are already
Page | 27
expected to be competition ready. In addition, focus on Can communications and Data logging is encouraged. Furthermore, the team suggests making the battery system a set of two arrays of single row packs which can take regenerative braking and are positioned lower in the car to improve center of gravity. The mechanical team suggests a chassis redesign to not only account for competition rules, but better suit the smaller motor and new battery case suggestion. In addition, the suspension will need to account for the shift in weight of the batteries as well as the smaller chassis design. Furthermore, the sidepod mounts, placement and design will need improvement due to results of this year and the new battery design of next year.
The EV2 car was, in so many ways, an improvement of the EV1 vehicle. Mechanically, the car was more reliable and will be used for testing. Electrically, the systems in place are already expected to pass technical inspection at competition and will be implemented into the following design. Organizationally, the new team has embraced challenges and learned how to improve both sponsor relations and in-team leadership. The team looks forward to the bright future of the 2017 team as well as the CSU FSAE program.
Page | 28
Appendix Table 4 : Accumulator Case Material
Table 5 : Accumulator Case Design
Table 6: Motor Decision Matrix
Table 7: Gear ratio data
Motor Value Rank Value Rank Value Rank Value Rank TotalYasa-400 52 2 360 1 90 1 $12,000 3 7Emrax 207 20 1 140 3 65 3 $5,000 1 8Remy 250 108 3 325 2 70 2 $7,000 2 9
Weight(lbs) Peak Torque(Nm) Peak Power(kW) Price($)
Final Drive Ratio [-] 1 1.5 2 2.5 3 3.5 4 4.5 1 1.5 2 2.5 3 3.5 4 4.5Lap time [s] 18.22 15.25 13.39 12.07 11.08 10.29 9.64 9.1 91.6 85.43 82.08 79.88 78.03 76.41 75.04 73.87Average Speed [km/h] 16.22 19.74 22.77 25.47 27.96 30.3 32.51 34.62 46.13 49.8 52.05 53.59 55 56.32 57.51 58.59Energy Spent per lap/run [kJ] 8.63 13.04 17.53 22.12 26.82 31.65 36.61 41.72 140.6 201.3 254.2 293 344.9 397.7 445.2 490.8Total Energy Spent [kJ] 34.52 52.16 70.12 88.48 107.3 126.6 146.4 166.9 2531 3623 4575 5275 6209 7159 8014 8834Top Speed [km/h] 55.02 68.21 79.9 90.8 101.3 111.6 121.8 127.9 55.02 68.21 79.9 90.8 101.3 111.6 121.8 127.9
70m drag 2012 Lincoln endurance
Page | 29
Table 8: Anti-Roll Decision Matrix
Table 9: Sidepod design decision matrix
Table 10: Composite Material Decision
Blade BoxEase of
Adjustment2 0 0
Amount of Adjustment
2 1 -1
Ease of Manufacturing
5 -1 1
Simplicity of Design
4 -1 1
Weighted Total
-7 7
Style (-1,0,1)Catagories Weights (1-5)
Page | 30
Figure 14: Safety Circuit Schematic
Figure 15: Emrax 207 Torque and Power Curves
Page | 31
FMEA Table 11: FMEA
Battery Management System
Formula = (Rank/40)*R.O.D.*
D
Function Performance StandardsFunctional
Failures Failure Modes Failure Effects Consequence Category Rank (Total out of 40)Rate of
OccurrenceDetectibilit
y
Risk Ranking(1 = Lowest; 100 =
Highest)
Normalized Rank (1= high, 0 = low) Mitigation / Redesign Plan
BMS Controller Damaged Battery cells explode/catch fire, BMS Failure Indicator Light
Vehicle Non-Functional, ACC Unusable
0 (E), 2 (S), 10 (O), 4 (NO) 1 1 0.40 0.0889
AIR Fails to Open Battery cells explode/catch fire Vehicle Non-Functional, ACC Unusable
0 (E), 2 (S), 10 (O), 4 (NO) 1 1 0.40 0.0889
Battery Cell(s) non-functional
Battery cells explode/catch fire OR BMS has unclearible erroor,
BMS Failure Indicator Light
Vehicle Non-Functional, ACC Unusable 0 (E), 2 (S), 10 (O), 4 (NO) 5 1 0.40 0.0889
Microboards on cells Damaged Battery cells explode/catch fire
Vehicle Non-Functional, ACC Unusable 0 (E), 2 (S), 10 (O), 4 (NO) 1 1 0.40 0.0889
BMS Controller Damaged Battery cells explode/catch fire, BMS Failure Indicator Light
Vehicle Non-Functional, ACC Unusable
0 (E), 2 (S), 10 (O), 4 (NO) 1 1 0.40 0.0889
AIR Fails to Open Battery cells explode/catch fire Vehicle Non-Functional, ACC Unusable
0 (E), 2 (S), 10 (O), 4 (NO) 1 1 0.40 0.0889
Battery Cell(s) non-functional
Battery cells explode/catch fire, BMS Failure Indicator Light
Vehicle Non-Functional, ACC Unusable
0 (E), 2 (S), 10 (O), 4 (NO) 6 1 0.40 0.0889
Microboards on cells Damaged
Battery cells explode/catch fire, BMS Failure Indicator Light
Vehicle Non-Functional, ACC Unusable
0 (E), 2 (S), 10 (O), 4 (NO) 1 1 0.40 0.0889
Disconnect Accumulator from LiPO Charger if charge current
exceeds rate of Z A
Charger Does Not Disconnect
BMS Controller/Current Sense Damaged
Battery cells explode/catch fire, BMS Failure Indicator Light
Vehicle Non-Functional, ACC Unusable
0 (E), 2 (S), 10 (O), 4 (NO) 1 1 0.40 0.0889
BMS Controller Damaged Battery cells explode/catch fire Vehicle Non-Functional, ACC Unusable
0 (E), 2 (S), 10 (O), 4 (NO) 1 1 0.40 0.0889
AIR Fails to Open Battery cells explode/catch fire Vehicle Non-Functional, ACC Unusable
0 (E), 2 (S), 10 (O), 4 (NO) 1 1 0.40 0.0889
Charger/HVC Does Not Disconnect
BMS Controller/Temperature
Battery cells explode/catch fire, BMS Failure Indicator Light
Vehicle Non-Functional, ACC Unusable
0 (E), 2 (S), 10 (O), 4 (NO) 1 1 0.40 0.0889
AIR Fails to Open Battery cells explode/catch fire Vehicle Non-Functional, ACC Unusable
0 (E), 2 (S), 10 (O), 4 (NO) 1 1 0.40 0.0889
Battery Cell(s) Over-temperature from
Charge/Use
BMS turns off, BMS Failure Indicator Light
Vechicle Shuts down for cool down period
0 (E), 2 (S), 2 (O), 2 (NO) 9 1 1.35 0.3000
IMS Trips Due to Short of HV to LV system, IMS Failure
Vechicle Shuts down until Error is Corrected
0 (E), 2 (S), 2 (O), 2 (NO) 1 1 0.15 0.0333
Battery cells explode/catch fireVehicle Non-Functional, ACC
Unusable 0 (E), 2 (S), 10 (O), 4 (NO) 1 1 0.40 0.0889
Monitor Temperature of 4.2 V LiPO cell
(Primary)
Disconnect Accumulator from LiPO Charger/HVC if
temperature of 30% of cells exceed 60⁰C
HVC Does Not Disconnect
Validate inter-cell connection of 4.2 V LiPO cells via TAP
(Primary)
Validate series/parallel connection of cells to prevent damage main BMS Controller
TAP Gives False Validation TAP/BMS Damaged
Monitor State of Voltage of 4.2 V LiPO
cell (Primary)
Disconnect Accumulator from LiPO Charger if X% of
accumulator cells exceeds 4.2 V
Charger Does Not Disconnect
Balance Y cells to equal Voltage Cell(s) Do Not Balance
Monitor Current Output of 4.2 V LiPO
cell(s)(Primary) Disconnect Accumulator from HVC if operating current
exceeds Z A for T seconds
HVC Does Not Disconnect
Monitor State of Charge of 4.2 V LiPO
cell (Primary)
Disconnect Accumulator from LiPO Charger if accumulator exceeds 300 VDC (Nominal)
Charger Does Not Disconnect
Balance Y cells to equal Charge Cell(s) Do Not
Balance
IMD Formula = (Rank/40)*R.O.D.* D
Failure Modes Failure Effects Consequence Category Rank (Total out of 40)Rate of
Occurrence
Detectibility
Risk Ranking(1 = Lowest; 100 = Highest)
Normalized Rank (1= high, 0 = low) Mitigation / Redesign Plan
AIR Fails to Open Battery cells explode/catch fire, IMD Failure Indicator Light, Electric Shock
Vehicle Non-Functional, ACC Unusable , Injured Personel
2 (E), 2 (S), 10 (O), 2 (NO)
2 1 0.80 0.1778
IMD Damaged Battery cells explode/catch fire, IMD Failure Indicator Light, Electric Shock
Vehicle Non-Functional, ACC Unusable , Injured Personel
2 (E), 2 (S), 10 (O), 2 (NO)
2 1 0.80 0.1778
AIR Fails to Open Battery cells explode/catch fire, IMD Failure Indicator Light, Electric Shock
Vehicle Non-Functional, ACC Unusable , Injured Personel
2 (E), 2 (S), 10 (O), 2 (NO)
2 1 0.80 0.1778
IMD DamagedBattery cells explode/catch fire, IMD
Failure Indicator Light, Electric ShockVehicle Non-Functional, ACC
Unusable , Injured Personel2 (E), 2 (S), 10 (O), 2
(NO) 2 1 0.80 0.1778
Real-time MicroController
Formula = (Rank/40)*R.O.D.* D
Function Performance Standards
Functional Failures
Failure Modes Failure Effects Consequence Category Rank (Total out of 40) Rate of Occurrence
Detectibility
Risk Ranking(1 = Lowest; 100 = Highest)
Normalized Rank (1= high, 0 = low)
Mitigation / Redesign Plan
Data Sent to RMCU but Not Received
Data not recovered Data Not Recovered 1 (E), 1 (S), 2 (O), 1 (NO)
1 3 0.38 0.0833
Data Sent and Received by RMCU but improperly handled
Battery cells explode/catch fire
Data Not Recovered 1 (E), 1 (S), 2 (O), 1 (NO)
1 3 0.38 0.0844
Potentiometers Out-Of-Range No Signal Sent To HV Vechicle Doesn't Move 1 (E), 1 (S), 2 (O), 1 (NO)
10 1 1.25 0.2778
Potentiometer Cease To Work No Signal Sent To MCU/HV
Vechicle Doesn't Move 1 (E), 1 (S), 2 (O), 1 (NO)
10 1 1.25 0.2778
HV Controller Ceases To Work No Signal Sent To MCU/HV
Vechicle Doesn't Move 1 (E), 1 (S), 2 (O), 1 (NO)
10 1 1.25 0.2778
Signal Wiring Damaged/ EMF Interference of Signal
Bad Signal Sent To MCU/HV
Vechicle Responds Erratically 1 (E), 1 (S), 2 (O), 1 (NO)
10 1 1.25 0.3086
Monitor State Of Sensors (Primary)
Accept Real-time Signals and write data to Removable Storage
Data Not Recorded
Encode Accelerator Pedal as a Torque
Signal to HV (Primary)
Vote Potentiometers (2+) of Accelerator
Pedal by +/- 10% and pass voted signal to
HV
Accelerator Pedal Does Not
Work
HVC Formula = (Rank/40)*R.O.D.* D
Function Performance Standards Functional Failures Failure Modes Failure Effects Consequence Category Rank (Total out of 40) Rate of Occurren
Detectibility
Risk Ranking(1 = Lowest; 100 =
Normalized Rank (1= high, 0 = low)
Mitigation / Redesign Plan
Waveform Skewed Circuitry Damaged Poor/None Locomotion, Motor damaged
Vehicle Does Not Move, Motor Windings Damaged, HV must
1 (E), 1 (S), 10 (O), 5 (NO)
1 1 0.43 0.0944
Circuitry Fails to Convert DC to AC
Circuitry Damaged Poor/None Locomotion, Motor damaged
Vehicle Does Not Move, Motor Windings Damaged, HV must
1 (E), 1 (S), 10 (O), 5 (NO)
1 1 0.43 0.0944
Voltage Diminished Circuitry DamagedPoor/None Locomotion,
Motor damaged
Vehicle Does Not Move, Motor Windings Damaged, HV must
be ReplacedRepaired
1 (E), 1 (S), 10 (O), 5 (NO) 1 1 0.43 0.0944
Does Not Precharge Circuitry Damaged HVC Damaged due to Inrush current
HVC Damaged 1 (E), 1 (S), 10 (O), 5 (NO)
1 1 0.43 0.0944
Does Not Discharge Circuitry Damaged HVC Stays Charged Potential Shock Hazard 1 (E), 2 (S), 10 (O), 5 (NO)
1 1 0.45 0.1000
Rate Skewed Circuitry Damaged None Vehicle Unaffected 1 (E), 1 (S), 1 (O), 5 (NO)
1 1 0.20 0.1000
Does Not Receive Signal Communication Error/Line Noise
Poor/None Locomotion Vehicle Does Not Move, HV must be ReplacedRepaired
1 (E), 1 (S), 10 (O), 5 (NO)
1 1 0.43 0.0956
Does Not Enable Circuitry Damaged Poor/None Locomotion Vehicle Does Not Move, HV must be ReplacedRepaired
1 (E), 1 (S), 10 (O), 5 (NO)
1 1 0.43 0.0956
Convert VDC to VAC (Primary)
Convert 300 VDC to 300 VAC 3 Phase in Real-Time with No
Power Lag
Provide Pre-charge/Discharge
Circuitry (Primary)
1st Stage: 92% of HV Batt. Voltage 2nd Stage: 100% HV
Batt. Voltage ; All current under 5 Amps during Precharge
Provide Run-enable Capability (Primary)
Allow Power from HV Batteries to Motor after all
subsystems/disconnects enter “Ready to Run”
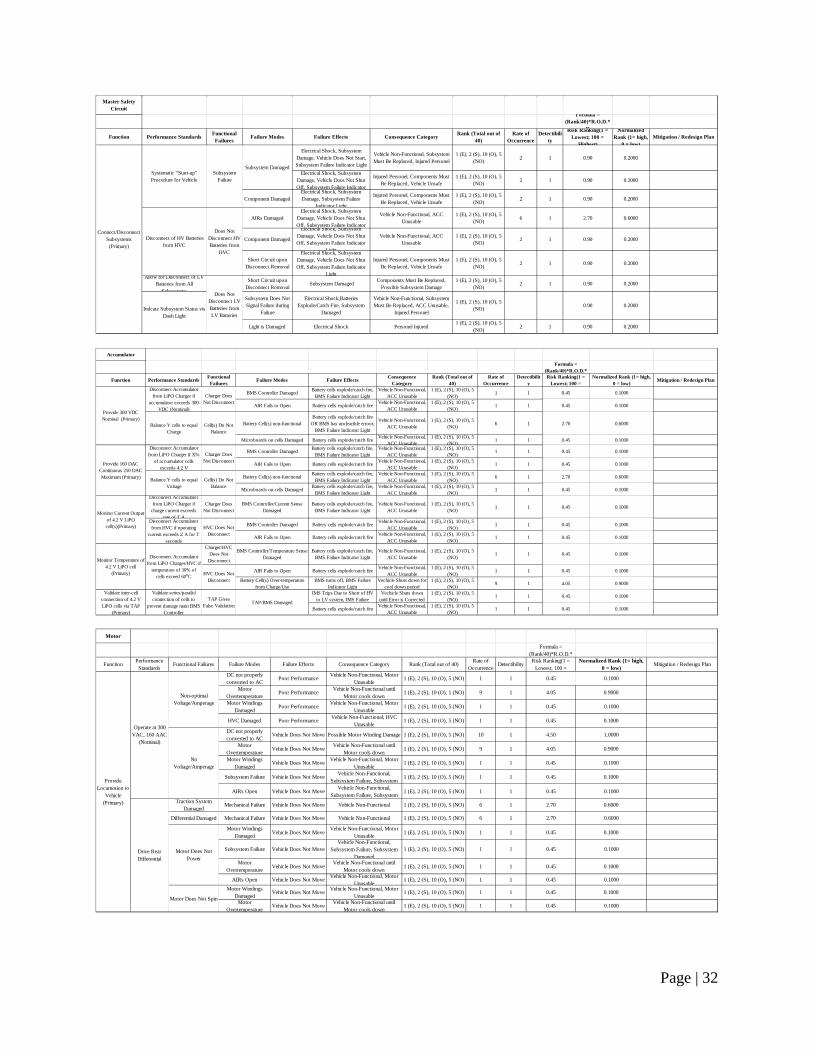
Page | 32
Master Safety Circuit
Formula = (Rank/40)*R.O.D.*
DFunction Performance Standards Functional
FailuresFailure Modes Failure Effects Consequence Category Rank (Total out of
40)Rate of
OccurrenceDetectibili
ty
Risk Ranking(1 = Lowest; 100 =
Highest)
Normalized Rank (1= high,
0 = low)Mitigation / Redesign Plan
Electrical Shock, Subsystem Damage, Vehicle Does Not Start, Subsystem Failure Indicator Light
Vehicle Non-Functional, Subsystem Must Be Replaced, Injured Personel
1 (E), 2 (S), 10 (O), 5 (NO) 2 1 0.90 0.2000
Electrical Shock, Subsystem Damage, Vehicle Does Not Shut Off, Subsystem Failure Indicator
Injured Personel, Components Must Be Replaced, Vehicle Unsafe
1 (E), 2 (S), 10 (O), 5 (NO) 2 1 0.90 0.2000
Component DamagedElectrical Shock, Subsystem Damage, Subsystem Failure
Indicator Light
Injured Personel, Components Must Be Replaced, Vehicle Unsafe
1 (E), 2 (S), 10 (O), 5 (NO) 2 1 0.90 0.2000
AIRs DamagedElectrical Shock, Subsystem
Damage, Vehicle Does Not Shut Off, Subsystem Failure Indicator
Vehicle Non-Functional, ACC Unusable
1 (E), 2 (S), 10 (O), 5 (NO) 6 1 2.70 0.6000
Component Damaged
Electrical Shock, Subsystem Damage, Vehicle Does Not Shut Off, Subsystem Failure Indicator
Light
Vehicle Non-Functional, ACC Unusable
1 (E), 2 (S), 10 (O), 5 (NO)
2 1 0.90 0.2000
Short Circuit upon Disconnect Removal
Electrical Shock, Subsystem Damage, Vehicle Does Not Shut Off, Subsystem Failure Indicator
Light
Injured Personel, Components Must Be Replaced, Vehicle Unsafe
1 (E), 2 (S), 10 (O), 5 (NO) 2 1 0.90 0.2000
Allow for Disconnect of LV Batteries from All
Subsystems
Short Circuit upon Disconnect Removal
Subsystem Damaged Components Must Be Replaced, Possible Subsystem Damage
1 (E), 2 (S), 10 (O), 5 (NO)
2 1 0.90 0.2000
Subsystem Does Not Signal Failure during
Failure
Electrical Shock,Batteries Explode/Catch Fire, Subsystem
Damaged
Vehicle Non-Functional, Subsystem Must Be Replaced, ACC Unusable,
Injured Personel
1 (E), 2 (S), 10 (O), 5 (NO) 0.90 0.2000
Light is Damaged Electrical Shock Personel Injured1 (E), 2 (S), 10 (O), 5
(NO) 2 1 0.90 0.2000
Connect/Disconnect Subsystems
(Primary)
Systematic “Start-up” Procedure for Vehicle
Subsystem Failure
Subsystem Damaged
Disconnect of HV Batteries from HVC
Does Not Disconnect HV Batteries from
HVC
Does Not Disconnect LV Batteries from LV Batteries
Indcate Subsystem Status vis Dash Light
Accumulator
Formula = (Rank/40)*R.O.D.*
Function Performance Standards Functional Failures
Failure Modes Failure Effects Consequence Category
Rank (Total out of 40)
Rate of Occurrence
Detectibility
Risk Ranking(1 = Lowest; 100 =
Normalized Rank (1= high, 0 = low)
Mitigation / Redesign Plan
BMS Controller Damaged Battery cells explode/catch fire, BMS Failure Indicator Light
Vehicle Non-Functional, ACC Unusable
1 (E), 2 (S), 10 (O), 5 (NO)
1 1 0.45 0.1000
AIR Fails to Open Battery cells explode/catch fire Vehicle Non-Functional, ACC Unusable
1 (E), 2 (S), 10 (O), 5 (NO)
1 1 0.45 0.1000
Battery Cell(s) non-functional Battery cells explode/catch fire
OR BMS has unclearible erroor, BMS Failure Indicator Light
Vehicle Non-Functional, ACC Unusable
1 (E), 2 (S), 10 (O), 5 (NO) 6 1 2.70 0.6000
Microboards on cells Damaged Battery cells explode/catch fire Vehicle Non-Functional, ACC Unusable
1 (E), 2 (S), 10 (O), 5 (NO)
1 1 0.45 0.1000
BMS Controller Damaged Battery cells explode/catch fire, BMS Failure Indicator Light
Vehicle Non-Functional, ACC Unusable
1 (E), 2 (S), 10 (O), 5 (NO)
1 1 0.45 0.1000
AIR Fails to Open Battery cells explode/catch fire Vehicle Non-Functional, ACC Unusable
1 (E), 2 (S), 10 (O), 5 (NO)
1 1 0.45 0.1000
Battery Cell(s) non-functional Battery cells explode/catch fire, BMS Failure Indicator Light
Vehicle Non-Functional, ACC Unusable
1 (E), 2 (S), 10 (O), 5 (NO)
6 1 2.70 0.6000
Microboards on cells Damaged Battery cells explode/catch fire, BMS Failure Indicator Light
Vehicle Non-Functional, ACC Unusable
1 (E), 2 (S), 10 (O), 5 (NO)
1 1 0.45 0.1000Disconnect Accumulator
from LiPO Charger if charge current exceeds
rate of Z A
Charger Does Not Disconnect
BMS Controller/Current Sense Damaged
Battery cells explode/catch fire, BMS Failure Indicator Light
Vehicle Non-Functional, ACC Unusable
1 (E), 2 (S), 10 (O), 5 (NO)
1 1 0.45 0.1000
BMS Controller Damaged Battery cells explode/catch fire Vehicle Non-Functional, ACC Unusable
1 (E), 2 (S), 10 (O), 5 (NO)
1 1 0.45 0.1000
AIR Fails to Open Battery cells explode/catch fire Vehicle Non-Functional, ACC Unusable
1 (E), 2 (S), 10 (O), 5 (NO)
1 1 0.45 0.1000
Charger/HVC Does Not
Disconnect
BMS Controller/Temperature Sense Damaged
Battery cells explode/catch fire, BMS Failure Indicator Light
Vehicle Non-Functional, ACC Unusable
1 (E), 2 (S), 10 (O), 5 (NO)
1 1 0.45 0.1000
AIR Fails to Open Battery cells explode/catch fire Vehicle Non-Functional, ACC Unusable
1 (E), 2 (S), 10 (O), 5 (NO)
1 1 0.45 0.1000
Battery Cell(s) Over-temperature from Charge/Use
BMS turns off, BMS Failure Indicator Light
Vechicle Shuts down for cool down period
1 (E), 2 (S), 10 (O), 5 (NO)
9 1 4.05 0.9000
IMS Trips Due to Short of HV to LV system, IMS Failure
Vechicle Shuts down until Error is Corrected
1 (E), 2 (S), 10 (O), 5 (NO)
1 1 0.45 0.1000
Battery cells explode/catch fire Vehicle Non-Functional, ACC Unusable
1 (E), 2 (S), 10 (O), 5 (NO)
1 1 0.45 0.1000
Monitor Temperature of 4.2 V LiPO cell
(Primary)
Disconnect Accumulator from LiPO Charger/HVC if
temperature of 30% of cells exceed 60⁰C HVC Does Not
Disconnect
Validate inter-cell connection of 4.2 V LiPO cells via TAP
(Primary)
Validate series/parallel connection of cells to
prevent damage main BMS Controller
TAP Gives False Validation TAP/BMS Damaged
Provide 160 DAC Continuous 250 DAC Maximum (Primary)
Disconnect Accumulator from LiPO Charger if X%
of accumulator cells exceeds 4.2 V
Charger Does Not Disconnect
Balance Y cells to equal Voltage
Cell(s) Do Not Balance
Monitor Current Output of 4.2 V LiPO cell(s)(Primary)
Disconnect Accumulator from HVC if operating
current exceeds Z A for T seconds
HVC Does Not Disconnect
Provide 300 VDC Nominal (Primary)
Disconnect Accumulator from LiPO Charger if
accumulator exceeds 300 VDC (Nominal)
Charger Does Not Disconnect
Balance Y cells to equal Charge
Cell(s) Do Not Balance
Motor
Formula = (Rank/40)*R.O.D.*
Function Performance Standards
Functional Failures Failure Modes Failure Effects Consequence Category Rank (Total out of 40) Rate of Occurrence
Detectibility Risk Ranking(1 = Lowest; 100 =
Normalized Rank (1= high, 0 = low)
Mitigation / Redesign Plan
DC not properly converted to AC
Poor Performance Vehicle Non-Functional, Motor Unusable
1 (E), 2 (S), 10 (O), 5 (NO) 1 1 0.45 0.1000
Motor Overtemperature
Poor Performance Vehicle Non-Functional until Motor cools down
1 (E), 2 (S), 10 (O), 1 (NO) 9 1 4.05 0.9000
Motor Windings Damaged
Poor Performance Vehicle Non-Functional, Motor Unusable
1 (E), 2 (S), 10 (O), 5 (NO) 1 1 0.45 0.1000
HVC Damaged Poor Performance Vehicle Non-Functional, HVC Unusable
1 (E), 2 (S), 10 (O), 5 (NO) 1 1 0.45 0.1000
DC not properly converted to AC
Vehicle Does Not Move Possible Motor Winding Damage 1 (E), 2 (S), 10 (O), 5 (NO) 10 1 4.50 1.0000
Motor Overtemperature
Vehicle Does Not Move Vehicle Non-Functional until Motor cools down
1 (E), 2 (S), 10 (O), 5 (NO) 9 1 4.05 0.9000
Motor Windings Damaged
Vehicle Does Not Move Vehicle Non-Functional, Motor Unusable
1 (E), 2 (S), 10 (O), 5 (NO) 1 1 0.45 0.1000
Subsystem Failure Vehicle Does Not Move Vehicle Non-Functional, Subsystem Failure, Subsystem
1 (E), 2 (S), 10 (O), 5 (NO) 1 1 0.45 0.1000
AIRs Open Vehicle Does Not Move Vehicle Non-Functional, Subsystem Failure, Subsystem
1 (E), 2 (S), 10 (O), 5 (NO) 1 1 0.45 0.1000
Traction System Damaged
Mechanical Failure Vehicle Does Not Move Vehicle Non-Functional 1 (E), 2 (S), 10 (O), 5 (NO) 6 1 2.70 0.6000
Differential Damaged Mechanical Failure Vehicle Does Not Move Vehicle Non-Functional 1 (E), 2 (S), 10 (O), 5 (NO) 6 1 2.70 0.6000
Motor Windings Damaged Vehicle Does Not Move
Vehicle Non-Functional, Motor Unusable 1 (E), 2 (S), 10 (O), 5 (NO) 1 1 0.45 0.1000
Subsystem Failure Vehicle Does Not MoveVehicle Non-Functional,
Subsystem Failure, Subsystem Damaged
1 (E), 2 (S), 10 (O), 5 (NO) 1 1 0.45 0.1000
Motor Overtemperature Vehicle Does Not Move
Vehicle Non-Functional until Motor cools down 1 (E), 2 (S), 10 (O), 5 (NO) 1 1 0.45 0.1000
AIRs Open Vehicle Does Not Move Vehicle Non-Functional, Motor Unusable
1 (E), 2 (S), 10 (O), 5 (NO) 1 1 0.45 0.1000Motor Windings
DamagedVehicle Does Not Move Vehicle Non-Functional, Motor
Unusable1 (E), 2 (S), 10 (O), 5 (NO) 1 1 0.45 0.1000
Motor Overtemperature
Vehicle Does Not Move Vehicle Non-Functional until Motor cools down
1 (E), 2 (S), 10 (O), 5 (NO) 1 1 0.45 0.1000
Provide Locamotion to
Vehicle (Primary)
Operate at 300 VAC, 160 AAC
(Nominal)
Non-optimal Voltage/Amperage
No Voltage/Amperage
Drive Rear Differential
Motor Does Not Power
Motor Does Not Spin
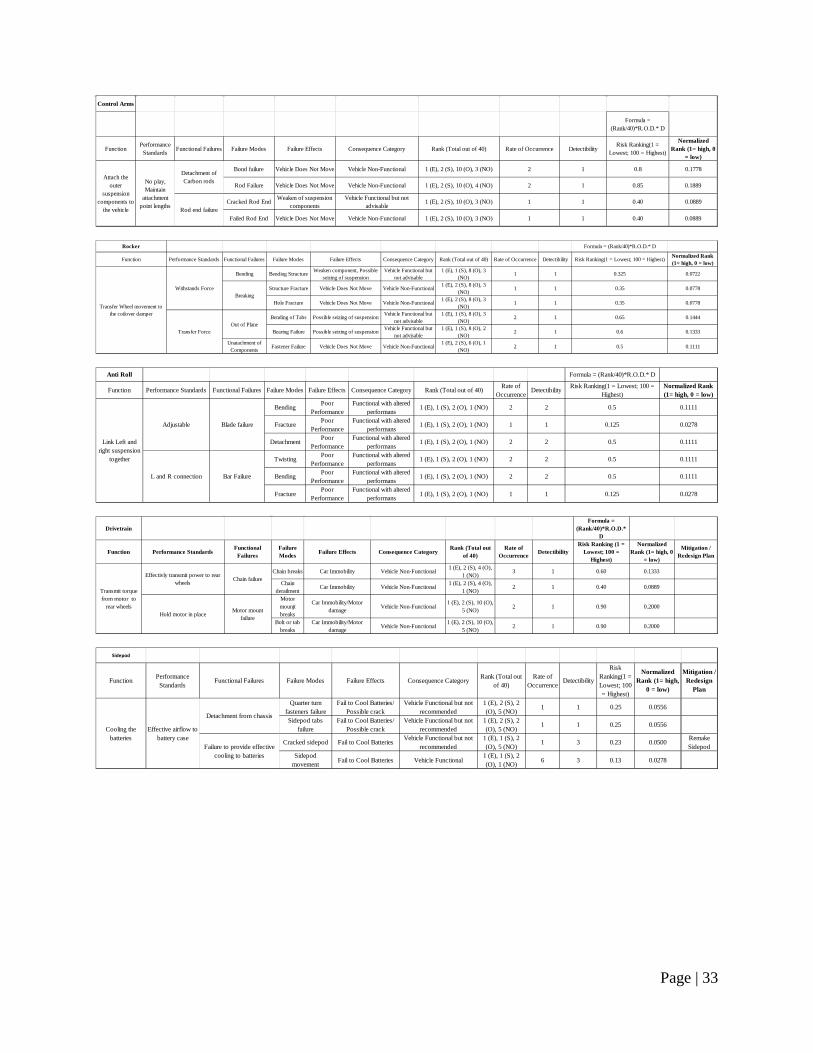
Page | 33
Control Arms
Formula = (Rank/40)*R.O.D.* D
FunctionPerformance
Standards Functional Failures Failure Modes Failure Effects Consequence Category Rank (Total out of 40) Rate of Occurrence DetectibilityRisk Ranking(1 =
Lowest; 100 = Highest)
Normalized Rank (1= high, 0
= low)
Bond failure Vehicle Does Not Move Vehicle Non-Functional 1 (E), 2 (S), 10 (O), 3 (NO) 2 1 0.8 0.1778
Rod Failure Vehicle Does Not Move Vehicle Non-Functional 1 (E), 2 (S), 10 (O), 4 (NO) 2 1 0.85 0.1889
Cracked Rod End Weaken of suspension components
Vehicle Functional but not advisable
1 (E), 2 (S), 10 (O), 3 (NO) 1 1 0.40 0.0889
Failed Rod End Vehicle Does Not Move Vehicle Non-Functional 1 (E), 2 (S), 10 (O), 3 (NO) 1 1 0.40 0.0889
Detachment of Carbon rods
Rod end failure
No play, Maintain
attachment point lengths
Attach the outer
suspension components to
the vehicle
Rocker Formula = (Rank/40)*R.O.D.* D
Function Performance Standards Functional Failures Failure Modes Failure Effects Consequence Category Rank (Total out of 40) Rate of Occurrence Detectibility Risk Ranking(1 = Lowest; 100 = Highest) Normalized Rank (1= high, 0 = low)
Bending Bending Structure Weaken component, Possible seizing of suspension
Vehicle Functional but not advisable
1 (E), 1 (S), 8 (O), 3 (NO)
1 1 0.325 0.0722
Structure Fracture Vehicle Does Not Move Vehicle Non-Functional 1 (E), 2 (S), 8 (O), 3 (NO)
1 1 0.35 0.0778
Hole Fracture Vehicle Does Not Move Vehicle Non-Functional 1 (E), 2 (S), 8 (O), 3 (NO)
1 1 0.35 0.0778
Bending of Tabs Possible seizing of suspension Vehicle Functional but not advisable
1 (E), 1 (S), 8 (O), 3 (NO)
2 1 0.65 0.1444
Bearing Failure Possible seizing of suspension Vehicle Functional but not advisable
1 (E), 1 (S), 8 (O), 2 (NO)
2 1 0.6 0.1333
Unatachment of Components Fastener Failure Vehicle Does Not Move Vehicle Non-Functional
1 (E), 2 (S), 6 (O), 1 (NO) 2 1 0.5 0.1111
BreakingWithstands Force
Out of PlaneTransfer Force
Transfer Wheel movement to the coilover damper
Anti Roll Formula = (Rank/40)*R.O.D.* D
Function Performance Standards Functional Failures Failure Modes Failure Effects Consequence Category Rank (Total out of 40) Rate of Occurrence
Detectibility Risk Ranking(1 = Lowest; 100 = Highest)
Normalized Rank (1= high, 0 = low)
Bending Poor Performance
Functional with altered performans
1 (E), 1 (S), 2 (O), 1 (NO) 2 2 0.5 0.1111
Fracture Poor Performance
Functional with altered performans
1 (E), 1 (S), 2 (O), 1 (NO) 1 1 0.125 0.0278
Detachment Poor Performance
Functional with altered performans
1 (E), 1 (S), 2 (O), 1 (NO) 2 2 0.5 0.1111
Twisting Poor Performance
Functional with altered performans
1 (E), 1 (S), 2 (O), 1 (NO) 2 2 0.5 0.1111
Bending Poor Performance
Functional with altered performans
1 (E), 1 (S), 2 (O), 1 (NO) 2 2 0.5 0.1111
FracturePoor
PerformanceFunctional with altered
performans 1 (E), 1 (S), 2 (O), 1 (NO) 1 1 0.125 0.0278
Blade failure
Bar Failure
Adjustable
L and R connection
Link Left and right suspension
together
DrivetrainFormula =
(Rank/40)*R.O.D.* D
Function Performance StandardsFunctional
FailuresFailure Modes Failure Effects Consequence Category
Rank (Total out of 40)
Rate of Occurrence Detectibility
Risk Ranking (1 = Lowest; 100 =
Highest)
Normalized Rank (1= high, 0
= low)
Mitigation / Redesign Plan
Chain breaks Car Immobility Vehicle Non-Functional 1 (E), 2 (S), 4 (O), 1 (NO)
3 1 0.60 0.1333
Chain derailment
Car Immobility Vehicle Non-Functional 1 (E), 2 (S), 4 (O), 1 (NO)
2 1 0.40 0.0889
Motor mounjt breaks
Car Immobility/Motor damage Vehicle Non-Functional
1 (E), 2 (S), 10 (O), 5 (NO) 2 1 0.90 0.2000
Bolt or tab breaks
Car Immobility/Motor damage Vehicle Non-Functional
1 (E), 2 (S), 10 (O), 5 (NO) 2 1 0.90 0.2000
Transmit torque from motor to
rear wheels
Effectivly transmit power to rear wheels Chain failure
Hold motor in placeMotor mount
failure
Sidepod
Function Performance Standards
Functional Failures Failure Modes Failure Effects Consequence Category Rank (Total out of 40)
Rate of Occurrence
Detectibility
Risk Ranking(1 = Lowest; 100 = Highest)
Normalized Rank (1= high,
0 = low)
Mitigation / Redesign
Plan
Quarter turn fasteners failure
Fail to Cool Batteries/ Possible crack
Vehicle Functional but not recommended
1 (E), 2 (S), 2 (O), 5 (NO)
1 1 0.25 0.0556
Sidepod tabs failure
Fail to Cool Batteries/ Possible crack
Vehicle Functional but not recommended
1 (E), 2 (S), 2 (O), 5 (NO)
1 1 0.25 0.0556
Cracked sidepod Fail to Cool Batteries Vehicle Functional but not recommended
1 (E), 1 (S), 2 (O), 5 (NO)
1 3 0.23 0.0500 Remake Sidepod
Sidepod movement Fail to Cool Batteries Vehicle Functional
1 (E), 1 (S), 2 (O), 1 (NO) 6 3 0.13 0.0278
Cooling the batteries
Effective airflow to battery case
Detachment from chassis
Failure to provide effective cooling to batteries
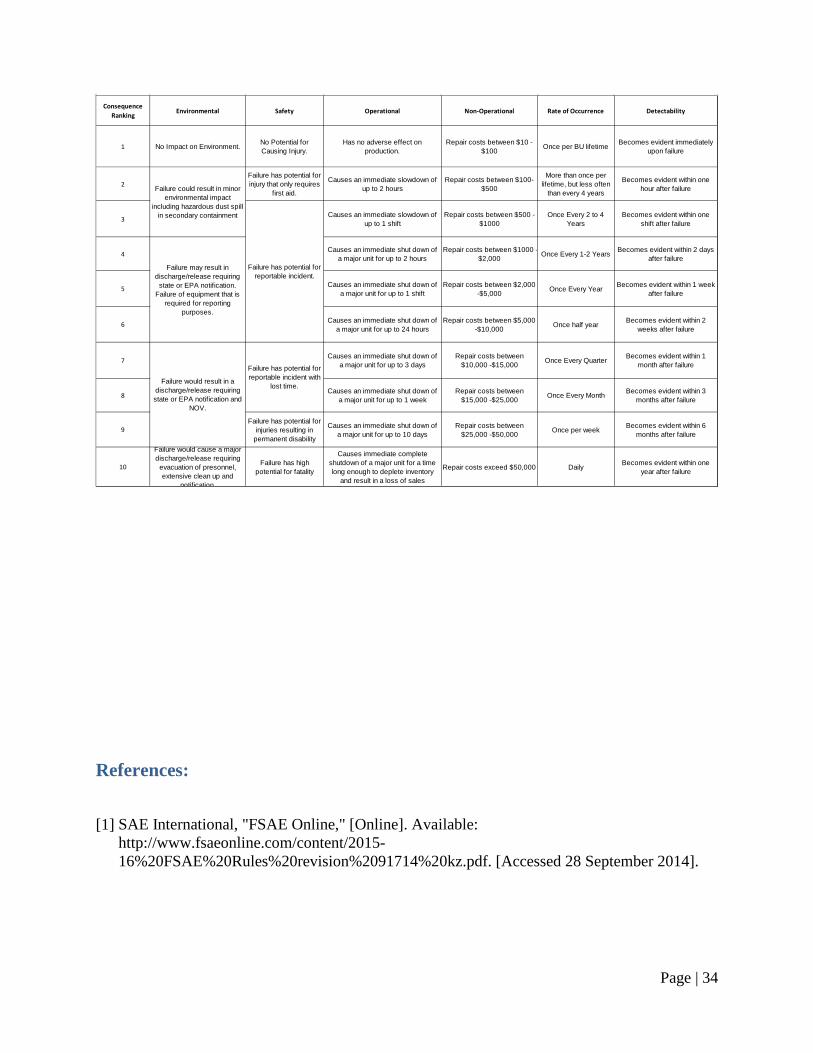
Page | 34
References:
[1] SAE International, "FSAE Online," [Online]. Available: http://www.fsaeonline.com/content/2015-16%20FSAE%20Rules%20revision%2091714%20kz.pdf. [Accessed 28 September 2014].
Consequence Ranking Environmental Safety Operational Non-Operational Rate of Occurrence Detectability
1 No Impact on Environment. No Potential for Causing Injury.
Has no adverse effect on production.
Repair costs between $10 - $100 Once per BU lifetime Becomes evident immediately
upon failure
2Failure has potential for injury that only requires
first aid.
Causes an immediate slowdown of up to 2 hours
Repair costs between $100-$500
More than once per lifetime, but less often
than every 4 years
Becomes evident within one hour after failure
3 Causes an immediate slowdown of up to 1 shift
Repair costs between $500 -$1000
Once Every 2 to 4 Years
Becomes evident within one shift after failure
4 Causes an immediate shut down of a major unit for up to 2 hours
Repair costs between $1000 -$2,000 Once Every 1-2 Years Becomes evident within 2 days
after failure
5 Causes an immediate shut down of a major unit for up to 1 shift
Repair costs between $2,000 -$5,000 Once Every Year Becomes evident within 1 week
after failure
6 Causes an immediate shut down of a major unit for up to 24 hours
Repair costs between $5,000 -$10,000 Once half year Becomes evident within 2
weeks after failure
7 Causes an immediate shut down of a major unit for up to 3 days
Repair costs between $10,000 -$15,000 Once Every Quarter Becomes evident within 1
month after failure
8 Causes an immediate shut down of a major unit for up to 1 week
Repair costs between $15,000 -$25,000 Once Every Month Becomes evident within 3
months after failure
9Failure has potential for
injuries resulting in permanent disability
Causes an immediate shut down of a major unit for up to 10 days
Repair costs between $25,000 -$50,000 Once per week Becomes evident within 6
months after failure
10
Failure would cause a major discharge/release requiring
evacuation of presonnel, extensive clean up and
notification
Failure has high potential for fatality
Causes immediate complete shutdown of a major unit for a time long enough to deplete inventory
and result in a loss of sales
Repair costs exceed $50,000 Daily Becomes evident within one year after failure
Failure could result in minor environmental impact
including hazardous dust spill in secondary containment
Failure has potential for reportable incident.
Failure may result in discharge/release requiring
state or EPA notification. Failure of equipment that is
required for reporting purposes.
Failure would result in a discharge/release requiring state or EPA notification and
NOV.
Failure has potential for reportable incident with
lost time.