2016 goldman sachs industrials conference industrials.pdf · chuck stevens executive vice president...
TRANSCRIPT

CHUCK STEVENSEXECUTIVE VICE PRESIDENT& CHIEF FINANCIAL OFFICER
2016 GOLDM AN SAC HS I N DUSTR IALS CON FER ENC E
Cadillac Escala Concept1
FO RWAR D LO O KI N G STATE ME NTS
In this presentation and in related comments by management, we use words like “anticipate,” “appears,” “approximately,” “believe,” “continue,” “could,” “designed,” “effect,” “estimate,” “evaluate,” “expect,” “forecast,” “goal,” “initiative,” “intend,” “may,” “objective,” “outlook,” “plan,” “potential,” “priorities,” “project,” “pursue,” “seek,” “will,” “should,” “target,” “when,” “would,” or the negative of any of those words or similar expressions to identify forward-looking statements that represent our current judgment about possible future events. In making these statements we rely on assumptions and analyses based on our experience and perception of historical trends, current conditions and expected future developments as well as other factors we consider appropriate under the circumstances. We believe these judgments are reasonable, but these statements are not guarantees of any events or financial results, and our actual results may differ materially due to a variety of important factors, both positive and negative. These factors include among others: (1) our ability to maintain profitability over the long-term, including our ability to fund and introduce new and improved vehicle models that are able to attract a sufficient number of consumers; (2) the success of our full-size pick-up trucks and SUVs; (3) global automobile market sales volume, which can be volatile; (4) the results of our joint ventures, which we cannot operate solely for our benefit and over which we may have limited control; (5) our ability to realize production efficiencies and to achieve reductions in costs as we implement operating effectiveness initiatives throughout our automotive operations; (6) our ability to maintain quality control over our vehicles and avoid material vehicle recalls and the cost and effect on our reputation and products; (7) our ability to maintain adequate liquidity and financing sources including as required to fund our new technology; (8) our ability to realize successful vehicle applications of new technology and our ability to deliver new products, services and customer experiences in response to new participants in the automotive industry; (9) volatility in the price of oil; (10) the ability of our suppliers to deliver parts, systems and components without disruption and at such times to allow us to meet production schedules; (11) risks associated with our manufacturing facilities around the world; (12) our ability to manage the distribution channels for our products; (13) our ability to successfully restructure our operations in various countries; (14) the continued availability of wholesale and retail financing in markets in which we operate to support the sale of our vehicles, which is dependent on those entities' ability to obtain funding and their continued willingness to provide financing; (15) changes in economic conditions, commodity prices, housing prices, foreign currency exchange rates or political stability in the markets in which we operate; (16) significant changes in the competitive environment, including the effect of competition and excess manufacturing capacity in our markets, on our pricing policies or use of incentives and the introduction of new and improved vehicle models by our competitors; (17) significant changes in economic, political, regulatory and market conditions in the countries in which we operate, particularly China, with the effect of competition from new market entrants and in the United Kingdom with passage of a referendum to discontinue membership in the European Union; (18) changes in existing, or the adoption of new, laws, regulations, policies or other activities of governments, agencies and similar organizations particularly laws, regulations and policies relating to vehicle safety including recalls, and including where such actions may affect the production, licensing, distribution or sale of our products, the cost thereof or applicable tax rates; (19) stricter or novel interpretations and consequent enforcement of existing laws, regulations and policies; (20) costs and risks associated with litigation and government investigations including the potential imposition of damages, substantial fines, civil lawsuits and criminal penalties, interruptions of business, modification of business practices, equitable remedies and other sanctions against us in connection with various legal proceedings and investigations relating to our various recalls; (21) our ability to comply with the terms of the DPA; (22) our ability to manage risks related to security breaches and other disruptions to our vehicles, information technology networks and systems; (23) significant increases in our pension expense or projected pension contributions resulting from changes in the value of plan assets, the discount rate applied to value the pension liabilities or mortality or other assumption changes; (24) our continued ability to develop captive financing capability through GM Financial; and (25) changes in accounting principles, or their application or interpretation, and our ability to make estimates and the assumptions underlying the estimates, which could have an effect on earnings.
GM’s most recent reports on Form 10-K and Form 10-Q filed with the U.S. Securities and Exchange Commission, provide information about these and other factors, which we may revise or supplement in future reports. GM does not undertake to update any forward-looking statements that it may make except as required by applicable law. All subsequent written and forward-looking statements attributed to GM or any person acting on its behalf are expressly qualified in their entirety by the factors referenced above.
GM’s Investor Relations website at http://www.gm.com/investors contains a significant amount of information about GM, including financial and other information for investors. GM encouragesinvestors to visit our website as information is updated and new information is posted.
2

GM IS A COMPELLI NG I NVESTMENT OPPORTU N ITY
3
Earnings Growth
Continued EPS growth trajectory
expected
Disciplined Capital Allocation
Disciplined reinvestment and
returning cash to shareholders
Robust Downside Protection
Enables sustained performance
through the cycle

GM HAS BU I LT A TR AC K R ECOR D OF STRONG AN D IMPROVI NG R ETU R NS
4
2013 20141 20151 2016 CYTD 2016 Guidance2
EPS-DILUTED-ADJ. $3.18 $4.12 $5.02 $4.84 $5.50 - $6.00
EBIT-ADJ. ($B) 8.6 9.3 10.8 10.1 > 2015 CY
EBIT-ADJ. MARGIN 5.5% 6.0% 7.1% 8.3% > 2015 CY
ADJ. AUTO FCF ($B) 3.7 4.7 4.8 5.2 ~6
ROIC-ADJ. 20.2% 20.8% 27.2% 30.6% > 2015 CY
Returned to Shareholders ($B)
0.0 2.1 5.7 3.3 3.8+
1Represents core operating performance (i.e., adjusted for major recall campaigns)2Expected EPS-diluted-adjusted near high end of guidance range of $5.50-$6.00 (10/25/16)

ANC HOR ED BY TH E I N DUSTRY-LEADI NG TRUC K PORTFOLIO
5
Aug '16 YTDvs Aug ’15 YTD Mid Truck Large Truck Large SUV
VOLUME ~30K ~22K ~17K
ATP ~$400 ~$2K ~$400
MARKET SHARE ~175 bps Flat ~470 bps
U.S. SALES % TO RETAIL CHANNEL
~85% ~75% ~88%
Source: J.D. Power and Associates Power Information Network (PIN)
Winning in all key areas

2016 IS TH E B EGI N N I NG OF TH E STRONG L AU NC H CADENC E
Product cadence drives brand strength and profit growth
19% 18%
30% 29%25%
36% 37%
30%
38%
46%
2011 2012 2013 2014 2015 2016 2017 2018 2019 2020
6
2011-2015Launch Cadence Average~24% Volume
2016-2020Launch Cadence AverageEstimated at ~38% Volume
1Includes China sales of global GM brands but excludes Baojun, Wuling, FAW
% of GM Global1 Sales from New or Refreshed Model Introductions(Less than 18 months in production)

2018 Chevrolet Equinox2017 Cadillac XT5
2017 GMC Acadia Denali2017 Buick Envision
TH E ONSET OF A R EFR ESH ED C ROSSOVER PORTFOLIO
7
... with more to come

GROWTH OPPORTU N ITI ES TH ROUGH ANC I LL ARY BUSI N ESSES
Global growth opportunities expected to contribute an incremental ~$2 billion of EBIT-adjusted in 2019 versus 2015
8

2015• Returned ~$6B to shareholders• Completed $3.5B in share
repurchases
2016• Returned >$3B to shareholders
in the first nine months• Increased quarterly dividend 6% • Added incremental $4B to share
repurchase program• Completed initial $5B of share
repurchases
DISC I PLI N ED CAPITAL ALLO CATION FR A MEWOR K
Reinvest in Business to Drive Growth and 20+% ROIC-Adj.
Maintain $20B Target Cash
Maintain Strong Investment Grade Balance Sheet
Return All AvailableFree Cash Flowto Shareholders
Driving shareholder value now and in the future
9

Disciplined supply/demand management and focus on high margin retail business leading to a stronger sustainable business
GM IS RU N N I NG A DI FFER ENT PL AY. . .WITH DI FFER ENT R ESU LTS
10
2013 Sept '16 YTD
U.S. LIGHT VEHICLE SAAR 15.6M 17.4M
GM U.S. DEALER DAYS SUPPLY 81 79
GM ATP ~$31K ~$35K
GM INCENTIVES AS % OF ATP VS. INDUSTRY 112% 102%
GM U.S. DAILY RENTAL AS A % OF TOTAL SALES 15.8% 9.8%
GM U.S. RETAIL SHARE 16.1% 16.6%
GMNA EBIT - ADJUSTED MARGIN 7.8% 10.7%

I NVENTORY WI LL BU I LD AH EAD OF STRONG YEAR-EN D SALES
11
October-November December Q1 2017
Inventory
Key Drivers
• Vehicle build-up ahead of holiday shut-down
• Truck build-up for strong December
• Crossover build ahead of 2017 launches
• Normalized launch product inventories
• Holiday shut-down
• Strong holiday truck sales
• Expect SAAR to remain strong
• Seasonal trend off strong December
• Crossover build ahead of 2017 launches resumes
Source: GM Internal Projections
We have a long-term strategy in place to ensure supply of critical vehicles
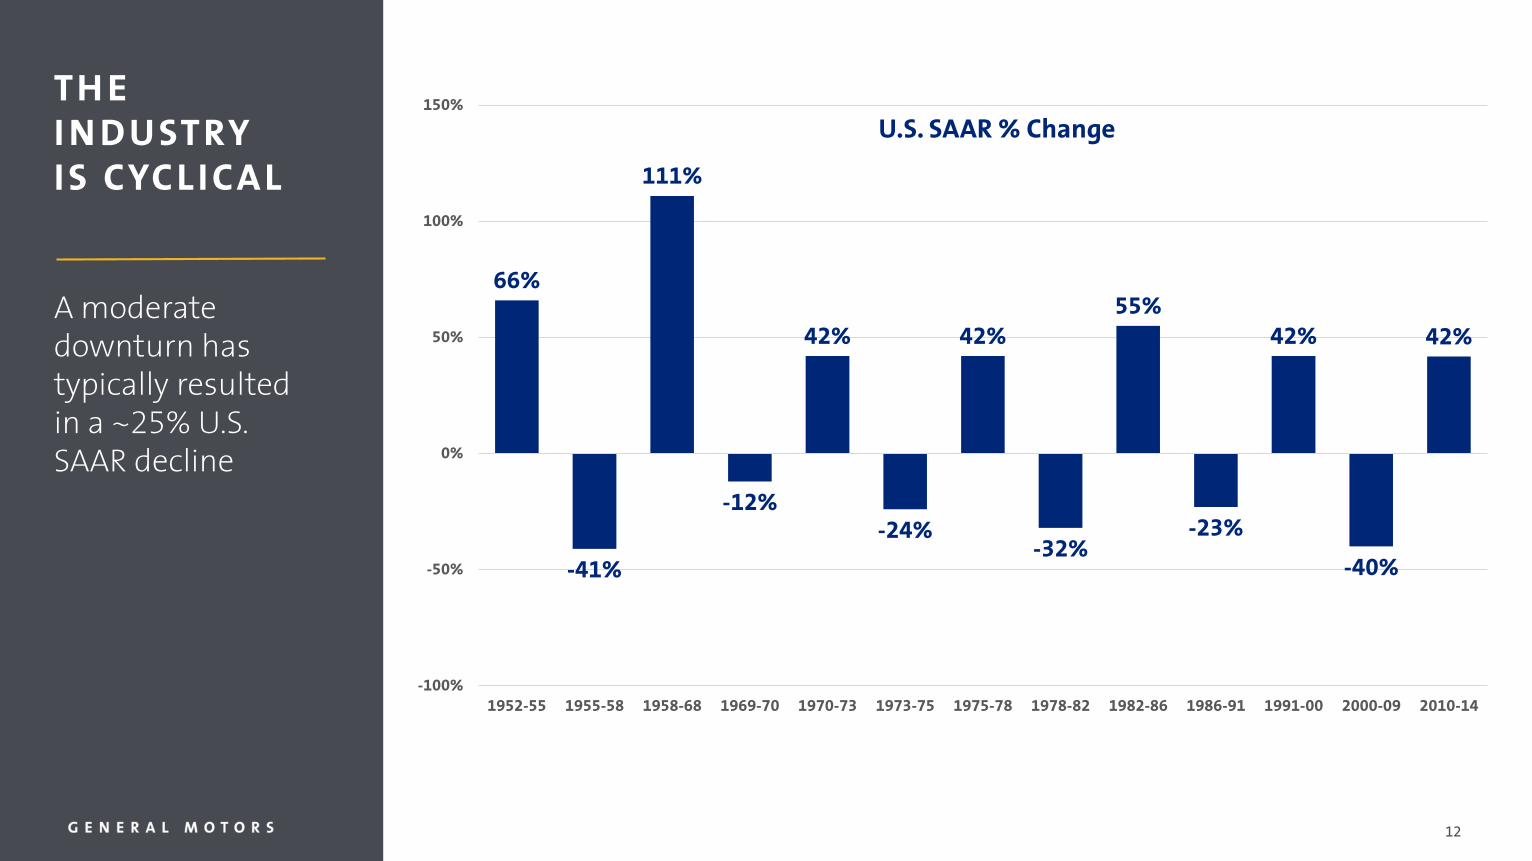
66%
-41%
111%
-12%
42%
-24%
42%
-32%
55%
-23%
42%
-40%
42%
-100%
-50%
0%
50%
100%
150%
1952-55 1955-58 1958-68 1969-70 1970-73 1973-75 1975-78 1978-82 1982-86 1986-91 1991-00 2000-09 2010-14
TH E I N DUSTRY IS CYC LICAL
A moderate downturn has typically resulted in a ~25% U.S. SAAR decline
U.S. SAAR % Change
12

FO CUSED ON TH E DOWNTU R N
13
Trend Certainty Assumption
VOLUME High 25% industry reduction
MIX LowTrucks decline ~4 pts
Crossovers decline ~1 pt
PRICE Medium ~1% decline
COST High Offset ~30% of headwind
Note: All assumptions based on a 2016 baseline
25% moderate U.S. downturn impact:
EBIT-adjusted first year negative impact:~$6B - $8B
Adjusted Auto FCF first year negative impact:
~$9B – $11B
EBIT-Adj.
Adj. AutoFCF
Trend Certainty Assumption
MWC UNWIND High In-line with volume decline
CAPEX High 10% reduction; non-product

U N DER TH IS SC ENAR IO. . .
14
Continued generation of positive returns
Generate positive EBIT-adjusted both globally and in North America
Continue investment in critical technologies and refreshed product portfolio
Maintain current dividend
Not draw on revolver
2017 Chevrolet Bolt EV

The industry is cyclical and our business is run accordingly
A strong product portfolio and increased refresh rate are critical to maintain margins
Growth opportunities provide additional upside
Prepared for the downturn
More levers can be pulled when the downturn comes
SUMMARY
15Buick Avista Concept

2016 GOLDM AN SAC HS I N DUSTR IALS CON FER ENC E
Cadillac Escala Concept
CHRIS CHOATEEXECUTIVE VICE PRESIDENT& CHIEF FINANCIAL OFFICER, GM FINANCIAL

GM Financial’s overall objective is to support GM vehicle sales while achieving
appropriate risk-adjusted returns
North American segment
International segment
GM FI NANC IAL COMPANY OVERVI EW
GM Financial (GMF) is General Motors’ global captive finance company
Earning assets of $74B, with operations in more than 20 countries
• Offering auto finance products to 16,000 dealers worldwide
• GM Financial’s global footprint covers over 85% of GM’s worldwide sales
GM Financial is a strategic business for GM and well positioned for profitable growth and contribution to overall enterprise value
17

Drive vehicle sales
• Offer attractive products and services with efficient delivery
Enhance customer experience and loyalty
• Integrate with GM initiatives to enrich the customer experience and increase retention
Support GM Customers and Dealers
• Provide financing support across economic cycles
Contribute to enterprise profitability
• Pre-tax income expected to double from 2014 when full captive penetration levels are achieved
GEN ER AL MOTORS STR ATEGIC PR IOR ITI ES
GM Financial strategic value
18

China AcquisitionGM Financial Acquisition
2010 2015
U.S. Floorplan Launch
2011 2012 2014
NA Lease Launch
2013
Canada Lease Acquisition of FinancialLinx
Canada sub-prime Launch
Canada Floorplan Launch
International Acquisitions
U.S. Prime Loan Launch
Commercial Lease Launch
GM Lease Exclusivity
U.S. Prime Loan Expansion
Commercial Loan Launch
2016
U.S. Lease Share Expansion
GM Loan Subvention Exclusivity
GM FI NANC IAL EVOLUTION
19
Captive Expansion
Increase share of prime loan in NA
Strategically grow NA floorplan
Expand Customer Relationship Management
Maintain IO’s dominant GM share; potential geographic/ product expansion
Full captive evolution substantially complete; GMF now in captive expansion phase
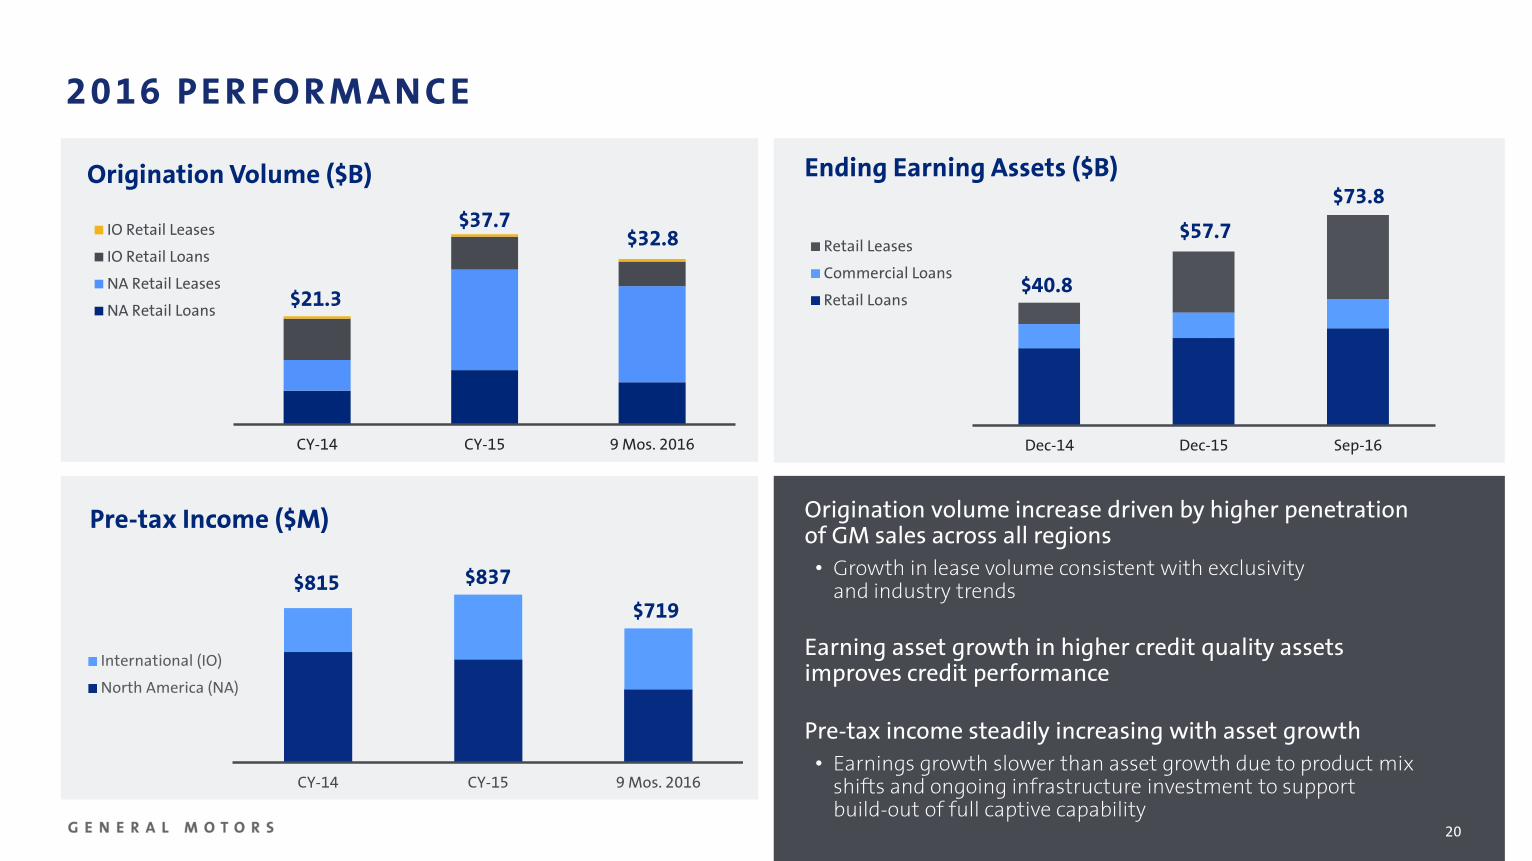
2016 PER FORM ANC E
$21.3
$37.7$32.8
CY-14 CY-15 9 Mos. 2016
Origination Volume ($B)
IO Retail Leases
IO Retail Loans
NA Retail Leases
NA Retail Loans
$40.8
$57.7
$73.8
Dec-14 Dec-15 Sep-16
Ending Earning Assets ($B)
Retail Leases
Commercial Loans
Retail Loans
$815 $837
$719
CY-14 CY-15 9 Mos. 2016
Pre-tax Income ($M)
International (IO)
North America (NA)
20
Origination volume increase driven by higher penetration of GM sales across all regions
• Growth in lease volume consistent with exclusivity and industry trends
Earning asset growth in higher credit quality assets improves credit performance
Pre-tax income steadily increasing with asset growth
• Earnings growth slower than asset growth due to product mix shifts and ongoing infrastructure investment to support build-out of full captive capability

EXPECTED GROWTH AN D CONTR I BUTIONS TO GM
Earning assets and EBT double from 2014 levels as full captive penetration levels achieved in North America
• Penetration of GM retail sales up strongly since 2014 in NA and IO segments including China
• GMF’s lease loyalty rates in NA reflect notable improvement over legacy financing providers
Asset growth in higher credit quality assets –prudent/disciplined origination strategy, not “buying” share
• Lower net interest margins due to credit mix shift and competitive conditions in non-subvented channels; persistently low interest rate environment impacts subvented mix and GMF origination volume
• Prospective funding cost benefits from upwards credit ratings trajectory
• Improving penetration in commercial lending (floorplan) key to building dealer loyalty and profitable retail loan (APR) share
With a full captive and scaled platform, GMF provides “through the cycle” financing capability/flexibility
$9
$41
2010 2014 ~2018/2019
Ending Earning Assets ($B)
1
1. GMF acquired in 2010
$0.5
$0.8
2010 2014 ~2018/2019 Incremental AutoBenefit
+
1
1. GMF acquired in 2010
Earnings Before Taxes ($B)
21

F O R A D D I T I O N A L I N F O R M AT I O N P L E A S E V I S I T:
https://www.gmfinancial.com/[email protected]
http://www.gm.com/[email protected]
Important information regarding reconciliations to the non-GAAP financial measures contained in this presentation can be found in our publically filed SEC documents (10Ks & 10Qs) also located
www.gm.com/investors