2016 half year results
TRANSCRIPT
2016 Half Year Results 17th August 2016

Agenda
Introduction David Stevens, CEO
Group overview Geraint Jones, CFO
UK Alistair Hargreaves, Head of Service Cristina Nestares, Head of Product
International Martin Coriat, Confused.com CEO David Stevens, CEO
Wrap up David Stevens, CEO
Q&A All
2

Agenda
Introduction David Stevens, CEO
Group overview Geraint Jones, CFO
UK Alistair Hargreaves, Head of Service Cristina Nestares, Head of Product
International Martin Coriat, Confused.com CEO David Stevens, CEO
Wrap up David Stevens, CEO
Q&A All
3

H1 2016: The Highlights
Customers Turnover1
Profit before tax2 Earnings per share
Return on equity Dividend per share3
15% 4.82m H1 15: 4.19m
£193m H1 15: £186m
49%
£1,261m H1 15: £1,058
55.9p H1 15: 54.8p
62.9p H1 15: 51.0p
Note: (1) Turnover comprises total premiums written plus other revenue. (2) Profit before tax adjusted to exclude minority interest share. (3) Includes 11.9p per share return of surplus capital.
4%
19%
2%
23% -2%
4
H1 15: 50%

Strong Growth in Turnover and Customers
Turnover
Customers
UK Car
International Car
Price Comparison
Household
and Van
£993m H1 15: £858m
£159m H1 15: £110m
£44m H1 15: £34m
3.52m H1 15: 3.18m
758k H1 15: 632k
543k H1 15: 381k
£64m H1 15: £55m
16%
44%
29%
16%
11%
20%
43%
5

112% 118% 115%
3%
-2% -1% -8% -6% -7% -7% -10% -7%
UK Car Insurance Price Comparison
International Insurance Other Group Items
Analysis of Half-Year Profit
UK Car profit up slightly to £223m; lower proportion of Group due to improved price comparison result and lower other costs
Overall international Insurance loss of £13m includes another ConTe profit offset by ongoing investment in USA and France
Improved comparison result (loss of £1m v loss of £4m) includes good result from Confused.com in the UK
Other includes Household (£1m profit), share scheme charges, debt servicing cost
Group Profit Before Tax 1
£193m £186m £185m
H1 2016 H1 2015 H1 2014
6
Note: (1) Profit before tax adjusted to exclude minority interest share.

Eligible Own Funds (Pre dividend)
Dividend (H1 2016) Eligible Own Funds (Post dividend)
Solvency Capital Requirement
Solvency position remains strong
Capital Position
Solvency ratios
Solvency ratio (Pre Dividend) 217%
Solvency ratio (Post Dividend) 180%
Group Solvency Capital Requirements (SCR) based on Solvency II Standard Formula plus an agreed Capital Add-On (CAO)
Post-Brexit yield curve movements reduced solvency ratio by approximately 20%
Post-dividend solvency ratio with volatility adjusted yield curve = 196%2
Admiral is developing a partial internal model to calculate the capital requirement and expects to apply for regulatory permission during 2017
Target solvency coverage range will be confirmed once partial internal model approved. Still expect 125%-150%
£1.02bn £0.17bn
£0.85bn
£0.47bn
Note: (1) Estimated (and unaudited) solvency II capital position at date of this report (17 August 2016). Includes impact of July 2016 yield curve movements based on EIOPA 31 July 2016 yield curve. Impact of deferred tax on SCR remains under discussion with PRA (maximum impact 3% of SCR). (2) Volatility adjustment application subject to approval by UK PRA and Gibraltar FSC.
7
1
Additional return of capital
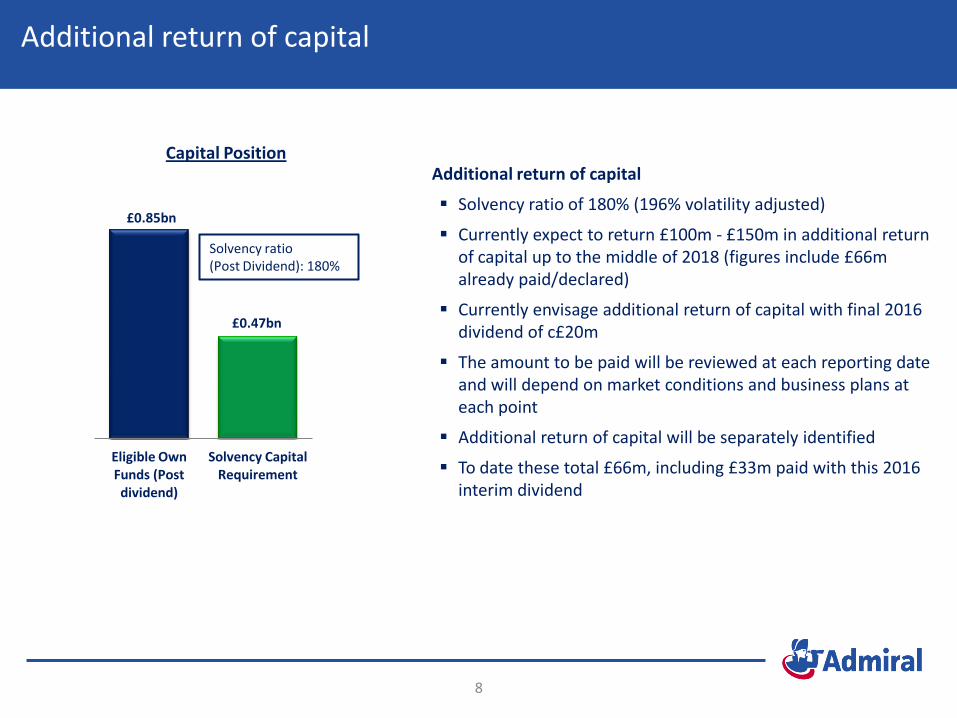
Additional return of capital
Solvency ratio of 180% (196% volatility adjusted)
Currently expect to return £100m - £150m in additional return of capital up to the middle of 2018 (figures include £66m already paid/declared)
Currently envisage additional return of capital with final 2016 dividend of c£20m
The amount to be paid will be reviewed at each reporting date and will depend on market conditions and business plans at each point
Additional return of capital will be separately identified
To date these total £66m, including £33m paid with this 2016 interim dividend
Eligible Own Funds (Post dividend)
Solvency Capital Requirement
£0.85bn
£0.47bn
Solvency ratio (Post Dividend): 180%
Capital Position
Needs to be updated for actual decision and clear guidance for expectations
8

Interim Dividend of 62.9p Per Share
H1 2016 Normal plus Special dividend = 51.0p per share (total = £142 v £140m interim 2015)
H1 2016 payout ratio = 91%
Additional return with interim 2016 dividend = 11.9p per share; £33m
Total interim dividend = £175m v £140m interim 2015
Interim 2016 dividend
Normal plus special dividend: 51.0p
Dividend Dates
Ex-dividend date: 8th September 2016
Record date: 9th September 2016
Payment date: 7th October 2016
Additional return dividend: 11.9p
Special dividend: 14.2p
Normal dividend (at 65%): 36.8p
H1 2016
9
Admiral will pay 65% of post-tax profits as a normal dividend each half-year (up from 45%)
Admiral expects to continue to distribute all earnings not required to be retained for solvency and buffers
Admiral expects Normal plus Special (before additional returns of capital) to be of the order of 90-95% of earnings for foreseeable future

Dividend History
33.6p 36.8p
17.9p 14.2p
11.9p 11.9p
H1 H2 H1 H2 H1 H2 H1 H2 H1 H2 H1 H2 H1 H2 H1 H2 H1 H2 H1 H2 H1
2006 2007 2008 2009 2010 2011 2012 2013 2014 2015 2016
10
Cumulative dividends since
flotation:
Normal: £1.10 billion
Special: £1.14 billion
Total: £2.24 billion
Normal dividend Return of capital Special dividend

Cash
Deposit
Gilts
Fixed income
MM funds
7m 5m
28m
9m 10m 13m
0
5
10
15
20
25
30
H1 2014 H1 2015 H1 2016
Reported Underlying
Investments update
Dec ‘15: £2,589m
Investment analysis
Net investment income1 (£m)
Note: (1) Investment income net of interest cost on bond. Income figures include interest on gilts purchased with bond issue proceeds.
Investment income
11
June ‘16: £2,651m H1 2015 and 2016 interest and investment income distorted by differences in accounting for income on quota share funds withheld
H1 2016 also includes £5.5m foreign exchange gain
Underlying net income increased by 30% to £13m due to higher rate of return on larger balances
AAA
AA
A
BBB

Agenda
Introduction David Stevens, CEO
Group overview Geraint Jones, CFO
UK Alistair Hargreaves, Head of Service Cristina Nestares, Head of Product
International Martin Coriat, Confused.com CEO David Stevens, CEO
Wrap up David Stevens, CEO
Q&A All
12

Market profitability in 2015 relies on reserve releases
13
Source: EY ‘UK Motor Insurance Results Seminar’ June 2016 Note: (1) Net/Gross Combined Ratio includes/excludes the impact of reserve releases respectively.
Breakeven relies on continued exceptional reserve releases
Market price increases started earlier than in previous cycles, is it likely that Gross CoR has peaked in 2015?
Gross combined ratio relatively flat from 2014 to 2015
Market reserve releases and combined ratio
12%
102%
114%
-10.0%
0.0%
10.0%
20.0%
30.0%
40.0%
50.0%
50.0%
60.0%
70.0%
80.0%
90.0%
100.0%
110.0%
120.0%
130.0%
1995 1996 1997 1998 1999 2000 2001 2002 2003 2004 2005 2006 2007 2008 2009 2010 2011 2012 2013 2014 2015
Reserve Releases Net Combined Ratio (Private Motor) Gross Combined Ratio (Private Motor) 1 1
14
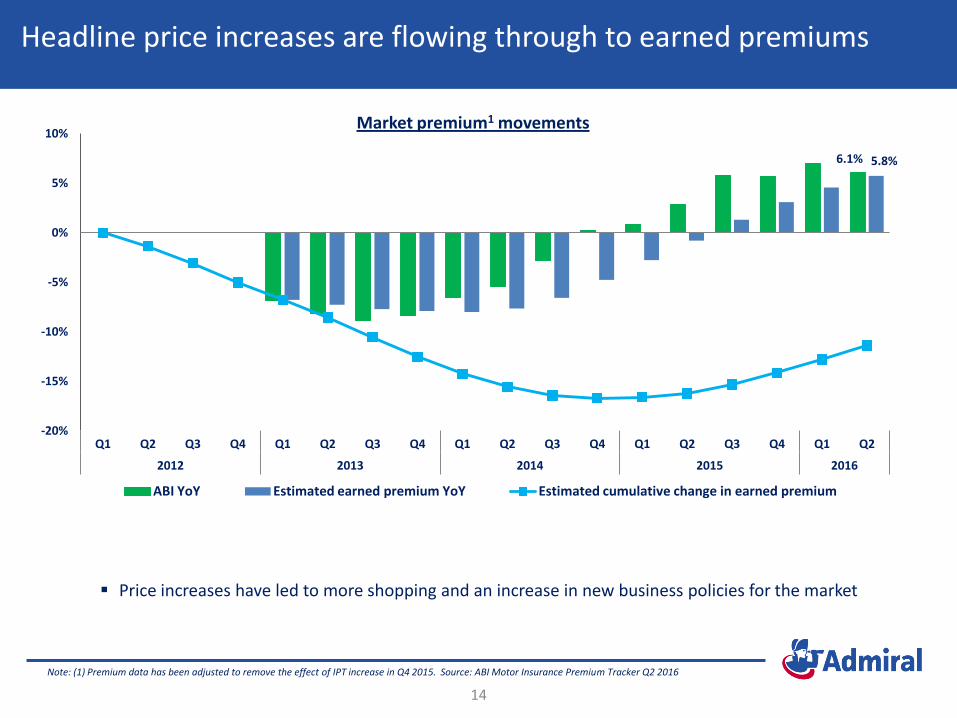
Note: (1) Premium data has been adjusted to remove the effect of IPT increase in Q4 2015. Source: ABI Motor Insurance Premium Tracker Q2 2016
Headline price increases are flowing through to earned premiums
6.1% 5.8%
-20%
-15%
-10%
-5%
0%
5%
10%
Q1 Q2 Q3 Q4 Q1 Q2 Q3 Q4 Q1 Q2 Q3 Q4 Q1 Q2 Q3 Q4 Q1 Q2
2012 2013 2014 2015 2016
ABI YoY Estimated earned premium YoY Estimated cumulative change in earned premium
Price increases have led to more shopping and an increase in new business policies for the market
Market premium1 movements

More shopping and strong competitiveness is fuelling Admiral growth
15
Note (1) Times top rolling 6 month average indexed to 100 from December 2013.
-
20
40
60
80
100
120
Dec-13 Apr-14 Aug-14 Dec-14 Apr-15 Aug-15 Dec-15 Apr-16
Admiral Times Top1
2014 – Admiral increased
prices ahead of the market
2015 – Admiral increased prices
slightly behind the market
HY 2016 – Admiral increased prices in line with the market
Resulted in 11% vehicle growth year on year
H1 2016 new business volumes have increased
Last 12 month price increases in line with market increases

87% (+1%) 87%
93% (-2%)
86% (-1%)
72% (-1%) 74% (-2%) 71% (-5%)
81% (-1%)
84%
69% (-1%) 69%
74%
69%
60% 60% (-1%) 60% (-3%)
74% (-3%)
78%
2007 2008 2009 2010 2011 2012 2013 2014 2015
Market Loss Ratio (Dec 15) Admiral Loss Ratio (Jun 16)
Admiral’s back year loss ratios continue to improve
16
Projected Ultimate Loss Ratio (Admiral vs Market)
Note: (1) Analysis of PRA returns as at 31 December 2015. Market excludes Admiral. Loss ratio: accident year. (2) Independent actuarial projection of ultimate loss ratio on accident year basis
1
Positive development of 2014 and prior
Cautious initial reserving of 2015, reflecting inherent uncertainty of large BI
H1 2016, we’re benefiting from price increases and claims inflation has been moderate
() shows movement Dec 15 to Jun 16
2
() shows movement Dec 14 to Dec 15

Loss ratio improvements and reinsurance commutations flow into reserve releases
Reserve releases and commutations
Strong reserve releases reflect very positive
evolution of ultimates
A similar level of reserve release in H2 2016
would require further large improvements in
ultimates
Reserves margin remains at the high end of
Admiral’s reserving policy range
17
2014 u/w year commuted at start of 2016
Prudent reserving means the 2014 commutation
reduced commuted reserve releases
Admiral releases as % of premium
£50m £56m
£43m £13m
H1 2015 H1 2016
Reserve release orginal net share Commuted reserve release
£93m
£69m
19% 17%
29%
19%
29%
H1 H2 H1 H2 H1
2014 2015 2016

Admiral maintains a strong expense ratio advantage
18
30% 31%
29%
24%
28%
30% 31%
32% 31%
17% 17% 17%
14% 13% 13%
15% 16% 16%
17%
2007 2008 2009 2010 2011 2012 2013 2014 2015 H1 2016
Market Expense Ratio Admiral Expense ratio
13% Gap 15% Gap
Expense ratio increases slightly in H1 2016 due to acquisition costs to drive 11% growth in active vehicles
We’re still maintaining our advantage
Note: (1) Admiral expense ratio is on a written basis. (2) Analysis of PRA returns as at 31 December 2015.
Admiral 1 and Market 2 expense ratios

2.46m
2.97m 3.02m 3.02m 3.15m 3.30m
3.52m
2010 2011 2012 2013 2014 2015 H1 2016
£850m £858m
£993m
H1 2014 H1 2015 H1 2016
Strong performance for UK car insurance
Turnover1
Profit Before Tax Customers
Higher insurance premium revenue and Other Revenue
resulting from growth in the portfolio over the past year
Improved combined ratio
Higher investment income
Lower reserve releases on business originally ceded under
quota share reinsurance contracts
£208m £219m £223m
H1 2014 H1 2015 H1 2016
19
Note: (1) Turnover is a non-GAAP measure and consists of total premiums written (including co-insurer’s share) and Other Revenue.

0
50,000
100,000
150,000
200,000
Admiral Insure the Box Direct Line Hastings
The largest telematics player
Market leader in active customers
Currently c5% of the market
We have a large amount of data that we can utilise effectively
Telematics policies 1
Note: (1) Admiral policy number from company data as of H1 2016. Competitor data from company FY 2015 disclosures.
20

Guidewire brings benefits
21
Modernisation
Strategic flexibility
Operational efficiency
Customer experience
Updates data warehouse to support ‘single customer view’
Add new products more easily
Allows smoother and faster operational changes Staff training is shorter and easier
Offers customers more options and product flexibility
Reduced scope for manual errors
Core administration system - renewed after 24 years of ‘I90’:
Claims administration system - in-house workflow remains in place

UK household market continues to move towards price comparison distribution
99%
89% 93% 92% 92% 95%
58%
47% 49% 45% 46% 50%
41% 42% 44% 47% 46% 46%
0%
20%
40%
60%
80%
100%
120%
2010 2011 2012 2013 2014 2015
Combined ratio Loss ratio Expense ratio
Market ratios UK Market % household new business sales through price comparison
Continued trend of customer migration online, in particular to price comparison
Over half of new business sales now originate through aggregators with potential for even more growth in this channel in the future
22
Note: (1) Market data from Deloitte Home Insurance Survey Reports 2013 - 2015. (2) UK market price comparison sales data from management information.
1
2
Market loss ratio has worsened as a result of weather events
2016:
Market expense ratio impacted by Flood Re levy
Market loss ratio affected by severe flooding events in the first six months
0%
20%
40%
60%
80%
100%
2009 2010 2011 2012 2013 2014 2015 H1 2016

Household policy growth continues and underwriting remains strong
Active customers Admiral vs Market
Over 380,000 customers at H1 2016 representing an increase of 23% on 31 December 2015
Continued improvement as the book matures
Admiral was largely unaffected by bad weather in 2015 and the first 6 months of 2016
0
100,000
200,000
300,000
400,000
500,000
Jun-13 Dec-13 Jun-14 Dec-14 Jun-15 Dec-15 Jun-16
64% 72% 71%
57% 40% 29%
92% 92% 95%
0%
20%
40%
60%
80%
100%
120%
140%
2013 2014 2015
Admiral loss ratio (written basis)
Admiral expense ratio (written basis)
Market combined operating ratio (earned basis)
23
1
Note: (1) Market data from Deloitte Home Insurance Survey Reports 2013 – 2015. Admiral data based on a written basis excluding the effects of ancillaries.

Agenda
Introduction David Stevens, CEO
Group overview Geraint Jones, CFO
UK Alistair Hargreaves, Head of Service Cristina Nestares, Head of Product
International Martin Coriat, Confused.com CEO David Stevens, CEO
Wrap up David Stevens, CEO
Q&A All
24

Launched: Mar 2009
Admiral owns: 75%
Launched: Jan 2010
Admiral owns: 100%
Launched: Mar 2013 Admiral owns: 71%
Launched: Mar 2002
Admiral owns: 100%
Launched: Oct 2015 Admiral owns: 50%
Price comparison across the globe
25

But! Industry competition remains at an all time high
Levels of marketing spend3 remain high and are at second highest ever level
Market continues to develop with the exit of Google
Growth of UK price comparison
0
2
4
6
8
10
12
2010 2011 2012 2013 2014 2015 2016
New Used
Number of cars sold in UK (millions)
90%
95%
100%
105%
110%
115%
H1 H1 H1 H1
2013 2014 2015 2016
Growth in PCW sales cumulatively from 2013
26
1
2
Note: (1) Source: New car sales – SMMT; Used car sales – BCA; 2016 data – estimated. (2) Growth in PCW sales from management information. (3) Source: Nielsen Research.

3.6m
3.9m
H1 2015 H1 2016
Confused.com had a good first six months
Drivers of confused.com result
Growth in UK PCW market
Media spend inflation slowed versus same period last year
Website improvement and strong promotional activity has led to better conversion
Future strategy
Driver centric strategy with a car specialist approach
Celebrity advertising to accelerate the campaign
Development of new products to help drivers save time and money on their car costs
Customers1
Profit before tax
£4.8m
£8.3m
H1 2015 H1 2016
27
Note: (1) Quote request per product per customer per month.

4.4m 4.1m
H1 2016 H1 2015
€19.6m
€21.5m
H1 2015 H1 2016
Rastreator and LeLynx momentum continues
Rastreator
Rapid growth in 3 main product lines of insurance, telephony and finance
Focused on TV and media advertising to deliver long-term multi-product strategy
LeLynx
Market leader in a competitive market
Has continued to educate the market on the benefits of price comparison with significant TV spend
Performance
Rastreator
Maintain market leadership and continue to expand product range
Grow multi-product strategy
LeLynx
Continue to develop and educate the French market
Develop a multi-product strategy with a focus on several insurance products
Outlook Turnover
Quotes
28

compare.com’s metrics continue to improve
Key Metrics Unique quotes
Jan 14 June 14 Jan 15 Jun 15 Jan 16 Jun 16
Cost per buy click
June 14 Jan 15 Jun 15 Jan 16 Jun 16
29
Signed 52%
Not signed
48%
Top 25 US insurers
Signed 40%
Not signed
60%
Top 10 US insurers Outlook
Continue to increase the number of carriers by state
Acquisition economics ahead of plan allowing for lower marketing spend
Overall losses on plan with H2 focus on further margin improvement
Forecast for 2016 remains $30-35 million loss
Panel development

International insurance – accelerating growth
30
Customers Turnover (€m)
460k 510k
607k
0k
350k
700k
H1 2014 H1 2015 H1 2016
95k 122k
150k
0k
350k
700k
H1 2014 H1 2015 H1 2016
Europe
$54m $63m
$92m
$0m
$70m
$140m
H1 2014 H1 2015 H1 2016
€87m €94m
€122m
€0m
€70m
€140m
H1 2014 H1 2015 H1 2016
Customers Turnover ($m)
US
£(3.2m) £(2.1m)
-12
-10
-8
-6
-4
-2
0
H1 2015 H1 2016
Loss Before Tax (£m) Loss Before Tax (£m)
£(8.0m)
£(10.8m) -12
-10
-8
-6
-4
-2
0
H1 2015 H1 2016

European insurance turnover and customers
Turnover (€)
Customers
€29.4m H1 15: €27.3m
€70.3m H1 15: €53.1m
€21.9m H1 15: €13.4m
170k H1 15: 169k
362k H1 15: 298k
75k H1 15: 43k
Admiral Seguros
ConTe
L’olivier
31
8%
32%
63%
1%
21%
74%

Key priority – grow share in price comparison
32
3%
8%
H1 2015 H1 2016
L’olivier
ConTe
Admiral Seguros
TV spend as a % of GWP
0%
7%
H1 2015 H1 2016
Wider footprint (France)
Maximum conversion efficiency (France in-sourcing)
Strengthen brands (marketing investments up from 2% GWP to 6%)
5% 4%
H1 2015 H1 2016

US Insurance
33
Everything's bigger in Texas!
$92.4m H1 15: $63.4m
150k H1 15: 122k
Elephant
46% 23%
Impact of hail on Elephant’s loss
Turnover ($) Customers
Note: (1) Whole account basis
-$8m
-$2m
-$6m
-9
-8
-7
-6
-5
-4
-3
-2
-1
0
H1 2016 Loss Normal Hail Loss Exceptional Hail Loss
1
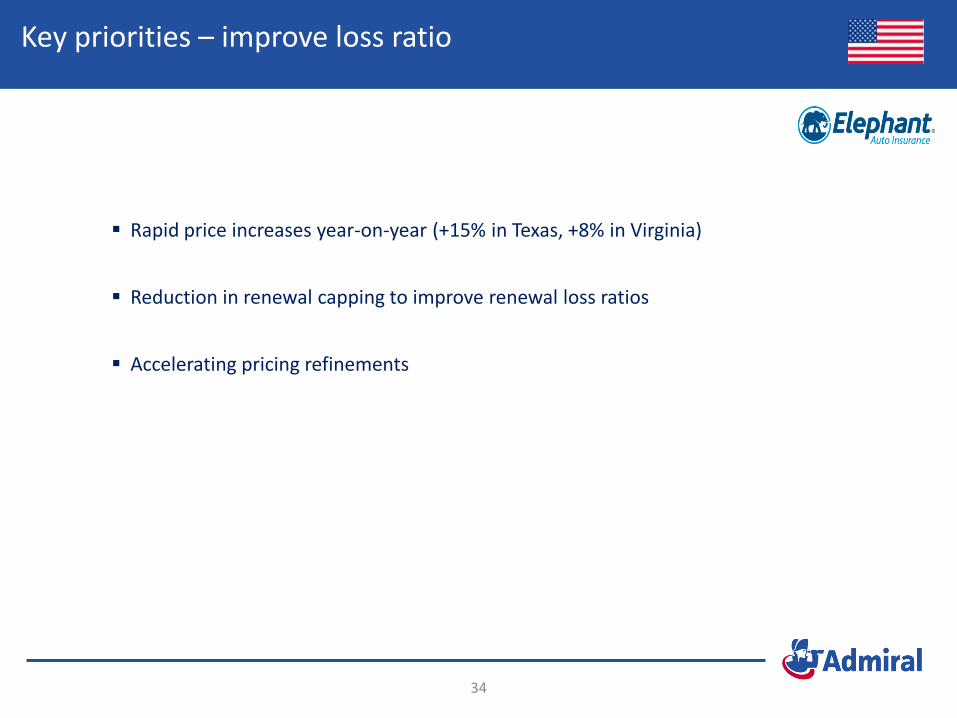
Key priorities – improve loss ratio
34
Rapid price increases year-on-year (+15% in Texas, +8% in Virginia)
Reduction in renewal capping to improve renewal loss ratios
Accelerating pricing refinements

35
Elephant’s new states
• Texas
• Illinois
• Maryland
• Virginia
• Tennessee
• Indiana
• Now in 6 states
• 91st largest auto insurer in the US!
• New states allow:
• Faster move to efficient scale
• Trials of different marketing strategies

Agenda
Introduction David Stevens, CEO
Group overview Geraint Jones, CFO
UK Alistair Hargreaves, Head of Service Cristina Nestares, Head of Product
International Martin Coriat, Confused.com CEO David Stevens, CEO
Wrap up David Stevens, CEO
Q&A All
36

Big picture
Investing in core businesses
◊ Sustained competitive advantage
◊ Continued growth
◊ Continued development
Investing in a number of likely sources of future value
◊ International insurance
◊ International price comparison
◊ UK new products
37

H1 2016: The Highlights
Customers Turnover1
Profit before tax2 Earnings per share
Return on equity Dividend per share3
15% 4.82m H1 15: 4.19m
£193m H1 15: £186m
49%
£1,261m H1 15: £1,058
55.9p H1 15: 54.8p
62.9p H1 15: 51.0p
Note: (1) Turnover comprises total premiums written plus other revenue. (2) Profit before tax adjusted to exclude minority interest share. (3) Includes 11.9p per share return of surplus capital.
4%
19%
2%
23% -2%
38
H1 15: 50%
Sunday Times Best Company To Work For - UK 6th Great Places To Work Best Workplaces – Italy 2nd

Appendix

Group Key Performance Indicators1
KPI 2006 2007 2008 2009 2010 2011 2012 2013 2014 2015 H1 13 H1 14 H1 15 H1 16
Group Financial
Turnover £m 698 808 910 1,077 1,585 2,190 2,215 2,030 1,971 2,119 1,089 1,037 1,058 1,261
Customers m 1.3 1.5 1.7 2.1 2.7 3.4 3.6 3.7 4.1 4.4 3,610 3,940 4,190 4,819
Adjusted1 Group pre-tax profit £m 147.3 182.1 202.5 215.8 265.5 299.1 344.6 370.7 356.5 376.8 181.6 184.9 186.1 193.3
Earnings per share 39.8p 48.6p 54.9p 59.0p 72.3p 81.9p 95.1p 104.6p 103.0p 107.3p 50.1p 52.7p 54.8p 55.9p
Dividend 36.1p 43.8p 52.5p 57.5p 68.1p 75.6p 90.6p 99.5p 98.4p 114.4p 48.9p 49.4p 51.0p 62.9p
UK Car Insurance
Customers (000) 1,240 1,382 1,587 1,862 2,459 2,966 3,019 3,021 3,154 3,302 3,016 3,149 3,177 3,519
Total premiums £m 566 617 690 805 1,238 1,729 1,749 1,553 1,453 1,540 851.7 776.0 779.0 899.7
Reported combined ratio*1 87.2% 83.4% 81.0% 84.9% 83.5% 91.9% 90.0% 83.0% 83.0% 81.0% 82.2% 80.2% 75.6% 75.0%
Other revenue per vehicle £ 77 84 84 79 67 67 63 73 67 64 64
UK car insurance pre-tax profit £m 121.1 142.2 179.9 206.9 275.8 313.6 372.8 393.9 398.0 443.0 192.7 207.7 219.2 222.8
International Car Insurance
Customers (000) 2 47 74 121 195 306 436 515 593 673 481 556 632 758
Total premiums £m 0.6 14.2 26.0 43.0 71.0 112.5 148.5 168.3 185.4 213.3 85.5 94.1 101.0 142.9
Adjusted1 combined ratio - 232% 198% 204% 166% 162% 168% 140% 127% 126% 137% 139% 137% 131%
Int’l car insurance result £m (0.1) (0.7) (4.1) (9.5) (8.0) (9.5) (24.5) (22.1) (19.9) (22.2) (10.8) (15.5) (11.2) (12.9)
Price Comparison
Total revenue £m 38.5 69.1 66.1 80.5 75.7 90.4 103.5 112.7 107.5 108.1 57.5 57.1 55.2 64.0
Operating profit/(loss) £m 23.1 36.7 25.6 25.1 12.3 10.3 17.6 21.1 3.6 (7.2) 10.0 5.9 (4.0) (1.1)
40
Note: (1) Profit before tax adjusted to exclude minority interest share. (2) Adjusted reported combined ratio is calculated on Admiral’s net share of premiums and excludes Other Revenue. It has been adjusted to remove the impact of reinsurer caps. Including the impact of reinsurer caps the reported combined ratio would be H1 2014: 167%; H1 2015: 149%; H1 2016: 145%; FY 2015: 146%.

Statutory summary income statement1
UK Car Insurance International Car
Insurance Price Comparison Other Admiral Group
£m H1 14 H1 15 H1 16 H1 14 H1 15 H1 16 H1 14 H1 15 H1 16 H1 14 H1 15 H1 16 H1 14 H1 15 H1 16
Turnover 849.8 857.9 993.2 104.3 110.3 159.2 57.1 55.2 64.0 25.9 34.1 44.3 1,037.1 1,057.5 1,260.7
Total premiums written 776.0 779.0 899.7 94.1 101.0 142.9 16.8 24.9 33.9 886.9 904.9 1,076.5
Gross premiums written 471.3 474.3 547.8 89.6 98.7 136.4 16.8 24.9 33.9 577.7 597.9 718.1
Net premiums written 202.5 205.2 235.9 30.9 35.0 47.3 8.2 6.5 9.4 241.6 246.7 292.6
Net earned premium 197.9 188.9 210.7 27.8 31.8 41.3 6.0 8.2 7.7 231.7 228.9 259.7
Investment income 6.0 6.3 24.5 0.1 - 0.2 - 2.6 8.2 6.1 8.9 32.9
Net insurance claims (92.6) (69.3) (108.9) (27.6) (25.6) (33.7) (4.3) (6.5) (5.8) (124.5) (101.4) (148.4)
Insurance related expenses (21.7) (26.2) (30.1) (18.9) (20.9) (25.5) (2.1) (2.4) (2.7) (42.7) (49.5) (58.3)
Underwriting result 89.6 99.7 96.2 (18.6) (14.7) (17.7) (0.4) 1.9 7.4 70.6 86.9 85.9
Profit commission 35.8 44.2 41.7 0.5 35.8 44.2 42.2
Gross ancillary revenue 89.6 84.6 90.7 3.4 3.9 4.7 0.6 0.6 1.4 93.6 89.1 96.8
Ancillary costs (18.4) (21.3) (21.1) (0.4) (0.6) (0.8) - - (0.4) (18.8) (21.9) (22.3)
Instalment income 11.1 12.0 15.3 0.1 0.2 0.9 0.3 0.3 0.5 11.5 12.5 16.7
Gladiator contribution 1.5 1.4 0.8 1.5 1.4 0.8
Price comparison revenue 57.1 55.2 64.0 57.1 55.2 64.0
Price comparison expenses (53.1) (63.8) (68.8) (53.1) (63.8) (68.8)
Interest income 0.6 0.7 0.5 0.6 0.7 0.5
Other (mainly share scheme) (15.5) (22.6) (26.3) (15.5) (22.6) (26.3)
Profit / (loss) before tax 207.7 219.2 222.8 (15.5) (11.2) (12.9) 4.0 (8.6) (4.8) (12.9) (17.7) (15.6) 183.3 181.7 189.5
41
Note: (1) Statutory financial information not adjusted to exclude minority interests’ share

Balance Sheet
June 2015 December
2015 June 2016 £m £m £m
ASSETS Property, plant and equipment 32.3 34.9 33.9 Intangible assets 119.3 142.3 156.2 Reinsurance contracts 720.5 878.7 914.1 Financial assets 2,242.8 2,323.5 2,355.4 Deferred income tax 29.5 20.6 25.4 Insurance and other receivables 499.3 537.1 697.4 Cash and cash equivalents 216.0 265.3 295.4
Total assets 3,859.7 4,202.4 4,477.8
EQUITY Share capital 0.3 0.3 0.3 Share premium 13.1 13.1 13.1 Retained earnings 574.2 599.6 600.6 Other reserves 3.1 2.7 34.5
590.7 615.7 648.5 Non-controlling interests 8.9 17.2 14.1
Total equity 599.6 632.9 662.6
LIABILITIES Insurance contracts 2,148.3 2,295.0 2,484.2 Subordinated liabilities 203.8 223.9 223.9 Trade and other payables 876.2 1,015.0 1,070.8 Corporation tax liabilities 31.8 35.6 36.3
Total liabilities 3,260.1 3,569.5 3,815.2
Total liabilities and equity 3,859.7 4,202.4 4,477.8
42

Group Profit Before Tax reconciliation
Admiral has five operations with shared ownership: Rastreator (Admiral share of ownership 75.0%); compare.com (71.1%); Admiral Law and BDE Law (90.0%); Preminen (50.0%)
Profit or losses in period accruing to minority parties reduce or increase the results respectively
compare.com is 29% owned by third parties. Total loss was £14.3 million, therefore £4.2 million is added back to Group Profit Before Tax
The impact of other minority interest is not significant
£189m £193m
£4m
Profit before tax (statutory)
compare.com Profit before tax (adjusted)
Reconciliation from statutory to adjusted profit before tax
43

87% (+1%) 87%
93% (-2%)
86% (-1%)
72% (-1%) 74% (-2%) 71% (-5%)
81% (-1%) 84%
69% (-1%) 69% 74%
69%
60% 60% (-1%) 60% (-3%)
74% (-3%)
78%
2007 2008 2009 2010 2011 2012 2013 2014 2015
Market Loss Ratio (Dec 15) Admiral Loss Ratio (Jun 16)
UK Car Insurance: Admiral vs Market Ultimate Loss Ratio, Expense Ratio and Combined Ratio
44
30% 31% 29%
24%
28% 30% 31% 32% 31%
17% 17% 17% 14% 13% 13%
15% 16% 16%
2007 2008 2009 2010 2011 2012 2013 2014 2015
Market Expense Ratio Admiral Expense ratio
117% 118% 122%
110%
100% 104% 102%
113% 115%
86% 86% 91%
83%
73% 73% 75%
90% 94%
2007 2008 2009 2010 2011 2012 2013 2014 2015
Market Combined Ratio Admiral Combined Ratio
Projected ultimate loss ratio: Admiral vs Market Expense ratio: Admiral vs Market
Ultimate combined ratio: Admiral vs Market
Note: (1) Analysis of PRA returns as at 31 December 2015. Market excludes Admiral. Loss ratio: accident year. (2) Independent actuarial projection of ultimate loss ratio on accident year basis. (3) Analysis of PRA returns as at 31 December 2015. These numbers include UKI (due to unusually high or low expense ratios, UKI numbers may be distorted). (4) Admiral expense ratio is on a written basis.
1 2 3 4
() shows movement Dec 15 to Jun 16
() shows movement Dec 14 to Dec 15

UK Car Insurance: Booked Loss Ratio development by underwriting year
The impact of a 1% improvement can also increase as the combined ratio drops and Admiral receives a higher share of the available profit.
The impact includes the change in net insurance claims along with the associated profit commission movements that result from changes in loss ratios. The figures are stated net of tax at the current rate.
The impact is not linear due to the nature of the profit commission arrangements eg. the impact of a 5% move cannot be calculated by multiplying the 1% impact by five.
Underwriting year
2012 2013 2014 2015
Booked loss ratio 64% 71% 83% 85%
PAT impact of 1% improvement
£13m £11m £7m £3m
Sensitivity of booked loss ratio UK car insurance booked loss ratio (%) Development by financial year (colour-coded)
Split by underwriting year (x axis)
Note: underwriting year basis, therefore direct comparison to ultimate loss ratios on accident year basis is inappropriate.
82%
76%
84%
72%
78%
85%
67%
73%
82%
92%
62% 66%
76%
89% 87%
61% 64%
71%
83% 85%
2011 2012 2013 2014 2015
2011 2012 2013 2014 2015 H1 2016
45

Reinsurance arrangements
25% 25% 22% 22%
40% 40% 40% 40%
35% 35% 38% 38%
2015 2016 2017 2018
Admiral Munich Re Other
Motor
Fully placed reinsurance arrangements until the end of 2018
Similar contract terms and conditions
Planned reduction of underwriting share from 25% to 22% with effect from 2017
Munich Re continues to underwrite 40% of the UK business until at least the end of 2018
30%
70%
Admiral Quota share
Household
Similar long term quota share contracts to UK motor
Admiral retains 30%
2015 and 2016
46

Solvency Ratio Sensitivity Analysis
Scenarios
1. Currency – 25% movement in € and $
2. ASHE – long term ASHE +0.5%
3. UK Motor – CAT 1 in 200 event
4. UK Household – CAT 1 in 200 event
5. UK Motor – incurred loss ratio +5% (2014 & 2015 u/w years)
6. UK Motor – incurred loss ratio +1% (2014 & 2015 u/w years)
7. Interest rate – negative yield curve -50 bps
8. Interest rate – positive yield curve +25 bps
9. Credit – spread +100 bps
The sensitivities below have been selected to show a range of impacts on the reported base case solvency ratio. They cover the two main material risk types - insurance risk and market risk. Within each risk type the sensitivities performed cover the underlying drivers of the risk profile. The sensitivities have not been calibrated to individual return periods.
Note: Estimated (and unaudited) solvency II capital position at date of this report. Impact of deferred tax on SCR remains under discussion with PRA (maximum impact 3% of SCR).
47
176%
192%
155%
174%
154%
178%
179%
160%
178%
180%
0% 50% 100% 150% 200% 250%
Scenario 9
Scenario 8
Scenario 7
Scenario 6
Scenario 5
Scenario 4
Scenario 3
Scenario 2
Scenario 1
Base

UK Car Insurance – whiplash regulatory reforms update
Focus area Update
Autumn Statement Reform has two main elements: • payment of general damages for minor whiplash injuries - departure from
current position and requires primary legislation. Will face stiff opposition claimant lawyers. The ABI are supportive of the change; and
• Small Claims Track limit rise from £1000 to £5000 - does not require primary
legislation and can be achieved by rewriting existing rules.
The whiplash reforms were announced in November 2015 and a consultation was scheduled for early 2016 which would centre around how to implement the new policy. The consultation has not yet materialised and key stakeholders in the project are no longer in the Government post Brexit. All, or part, of these reforms may still be implemented but it is likely that implementation will be delayed. Notwithstanding the above, the ABI continue to prepare for the second change and funding is being sought to amend the MOJ Portal to ensure that unrepresented claimants can access it as those running their own claim are likely to require more protection.
Credit hire market Tied in with the above whiplash reform are proposals to amend the credit hire market. There are a number of different proposals aimed at reducing costs and the bad practices that can accompany credit hire claims.
First party models are radical, though more likely is an attempt to apply better regulation and uniformity to the current market. As with whiplash reform, this resides with Government.
Other proposals • fix all legal fees for cases up to £250k (Lord Justice Jackson); and • introduce technology into the Courts (Lord Justice Briggs) - such that more
disputes are resolved online rather than in a Court room. Both changes have the aim of reducing cost and improving efficiency.
The new Justice Secretary/Lord Chancellor has indicated enthusiasm for introducing more technology into the legal system.
MOJ introduced
LASPO reforms (Jackson)
• ban of referral fees
• change to MOJ costs
• portal limit increase to £25k
• fixed recoverable costs
Fixed cost medical fees
MedCo introduced
Deregulation Act
Autumn Statement
Accreditation
2010 2013 Oct 2014 April 2015 June 2015 November
2015
January 2016
48

UK Car Insurance – other motor regulatory reforms update
Key regulatory reviews Implications for Admiral
Financial Conduct Authority (‘FCA’)
1. General Insurance Add-ons FCA published a market study on general insurance add-ons in July 2014. Review proposed remedies to address concerns that the market is not working in customers’ best interests. Most have been implemented and the FCA is now focusing on the final remedy – an industry-wide value measure. The regulator remains committed to conducting a 12-month pilot from summer 2016. FCA has also published a number of case studies to clarify expectations regarding the opt-out selling ban and information guidance with a 30 September 2016 deadline.
All insurers impacted: A. public disclosure of claims ratio by product; and B. changes to disclosure and process.
Admiral will ensure it adheres to the disclosure requirements.
2. Price Disclosure FCA has launched a consultation on new rules to require firms to disclose last year’s premium and remind long-standing customers to shop around to address the impact of differential pricing at renewal. A policy statement was published in August 2016 outlining the requirements to come into effect on 1 April 2017.
All insurers impacted: A. disclosure of last year’s premium on renewal documents.
Admiral will ensure it adheres to the disclosure requirements.
3. Vulnerable Customers FCA has published an Occasional Paper on the needs of vulnerable customers as well as a Discussion Paper specific to the ageing population, which highlight an expectation to provide additional support. The Association of British Insurers (ABI) and the British Insurance Brokers’ Association (BIBA) have jointly published a Code of Good Practice to improve renewal processes for vulnerable motor and home customers.
All insurers impacted. Admiral has a Vulnerable Customers Policy in place.
Competition and Markets Authority (‘CMA’)
In March 2015, CMA published the Private Motor Insurance Market Investigation Order 2015 concerning the implementation of the remedies contained in its private motor insurance final report; notably, in relation to protected and guaranteed No Claims Bonus (NCB). It looks to ensure customers can make an informed decision. This came into effect from 1 August 2016.
All insurers impacted: A. disclosure of detailed NCB information to customers; and B. specific statement that advises customer the NCB protection
does not protect the policy premium in the event of a claim.
European Union (‘EU’)
The Insurance Distribution Directive (IDD) was published on 2 February 2016. The Directive came into force on 22 February 2016, meaning Member States will have until 23 February 2018 to transpose the requirements into national law. The FCA does not anticipate major changes to existing UK training and competency requirements.
All insurers impacted. Admiral is monitoring any changes.
49

Organisational Chart
David Stevens Chief Executive Officer
Henry Engelhardt Price Comparison
James Armstrong Chief Risk Officer
Geraint Jones Chief Financial Officer
Alistair Hargreaves Head of Service
Charlotte Bennett Head of Support
Cristina Nestares Head of Product
50
UK Motor
Milena Mondini European Insurance
Kevin Chidwick US Insurance
Claire-Anne Coriat Beyond Insurance

International Car Insurance market statistics
(2015)
£8bn
(2015)
£12bn
(2015)
£128bn
(2015)
£12bn
21% of total market
3% of total market
26% of total market
11% of total market
22m
35m
220m
44m
99%
107%
105%
94%-96%
Gross Written Premium
Direct insurer share of market
Vehicles
Combined Ratio
51

Key definitions
Term Definition
Accident Year The year in which an accident takes place. It is also referred to as the earned basis or the calendar year basis.
Claims incurred are allocated to the calendar year in which the accident took place.
Underwriting Year The year in which the policy was incepted. It is also referred to as the written basis. Claims incurred are allocated to the calendar year in which the policy was written.
Written / Earned Basis A policy can be written in one calendar year but earned over a subsequent calendar year.
Loss Ratio The ratio can be calculated on an accident year or underwriting year basis.
Expressed as a percentage, of (i) claims incurred divided by (ii) net premiums.
Ultimate Loss Ratio The ratio can be calculated on an accident year or underwriting year basis.
It is the projected ratio for a particular accident or underwriting year. It is an estimate (calculated using actuarial analysis) of where the loss ratio ends when all claims are settled.
Reported / Booked / First-Picked Loss Ratio
The ratio can be reported on an accident year or underwriting year basis. This is the ratio reported in the financial statements for a particular accident or underwriting year.
It is used to calculate underwriting profit and profit commissions.
Expense Ratio The ratio can be calculated on an earned or written basis.
Expressed as a percentage, of (i) net operating expenses, either divided by (ii) written or earned premiums, net of reinsurance.
Combined Ratio The sum of the loss ratio and expense ratio.
Co-insurance An arrangement in which two or more insurance companies agree to underwrite insurance business on a specified portfolio in specified proportions.
Each co-insurer is directly liable to the policyholder for their proportional share.
Reinsurance An arrangement in which a reinsurance company agrees to indemnify another insurance company, against all or a portion of the insurance risks
underwritten by the ceding company under one or more policies. Reinsurance does not legally discharge the primary insurer from its liability with respect to its obligations to the insured.
XOL Reinsurance An arrangement in which a reinsurance company agrees to indemnify another insurance company for claims above a certain level. For example if XOL
reinsurance level is in excess of £5m, for any individual claim that is in excess of £5m the reinsurance company covers all the costs above £5m.
Total / Gross / Net Premiums Written
Total = total premiums written including coinsurance Gross = total premiums written including reinsurance but excluding coinsurance
Net = total premiums written excluding reinsurance and coinsurance
52

Admiral brand’s
53

Disclaimer
The information contained in this document has not been independently verified and no representation or warranty, express or implied, is made as to, and no reliance should be placed on, the fairness, accuracy, completeness or correctness of the information or opinions contained herein. None of the company, advisers or representatives shall have any liability whatsoever (in negligence or otherwise) for any loss howsoever arising from any use of this document or its contents or otherwise arising in connection with this document. Unless otherwise stated, all financial information contained herein is stated in accordance with generally accepted accounting principles in the UK at the date hereof.
The forward-looking information contained herein has been prepared on the basis of a number of assumptions which may prove to be incorrect, and accordingly, actual results may vary.
This document is being distributed only to, and is directed at (a) persons who have professional experience in matters relating to investments, being investment professionals as defined in article 19(5) of the Financial Services And Markets Act 2000 (Financial Promotion) Order 2005, as amended (the "Order") or (b) high net worth entities falling within article 49(2)(a) to (d) of the Order, and other persons to whom it may be lawfully be communicated under the Order (all such persons together being referred to as "Relevant Persons"). Any person who is not a Relevant Person should not act or rely on this document or any of its contents. Any investment or investment activity to which this document relates is available only to Relevant Persons and will be engaged in only with Relevant Persons.
The financial information set out in the presentation does not constitute the Company's statutory accounts in accordance with section 423 Companies Act 2006 for the half year ended 30 June 2016. The statutory accounts for the half year ended 30 June 2016 will be finalised on the basis of the financial information presented by the directors in this preliminary announcement and will be delivered to the Registrar of Companies following the Company’s Annual General Meeting.
54