half year results presentation
DESCRIPTION
Diversified funds management group Centuria Capital (ASX: CNI) today announced an underlying net profit after tax (“Underlying NPAT”) of $1.28 million and a statutory profit of $0.98 million for the half year ended 31 December 2011.TRANSCRIPT

Results Announcement for the half year ending 31 December 2011
Centuria Capital Limited
Presentation to Investors and Analysts 24 February 2012
Information in this presentation is general information only. Before you make any decision in relation to your investment, we recommend that you obtain financial advice from a licensed financial adviser.
31 December 2011 Half Year Result
Earnings• Increase in total revenue and statutory profit from the corresponding period
• Group underlying earnings have decreased from the corresponding period due to significant investments in new staff and people as well as no new property transactions during the period
Dividends• Interim dividend of 1.25 cps declared and payable in March 2012 – increase in franking from 30% to 100%
Gearing• Corporate debt / equity ratio maintained at modest levels with funding certainty to March 2013 and adequate headroom in the corporate debt facility
Liquidity• Continued healthy level of cash reserves on hand
Centuria Capital Limited
Presentation to Investors and Analysts 2
Centuria Capital Limited
Presentation to Investors and Analysts 3Information in this presentation is general information only. Before you make any decision in relation to your investment, we recommend that you obtain financial advice from a licensed financial adviser.
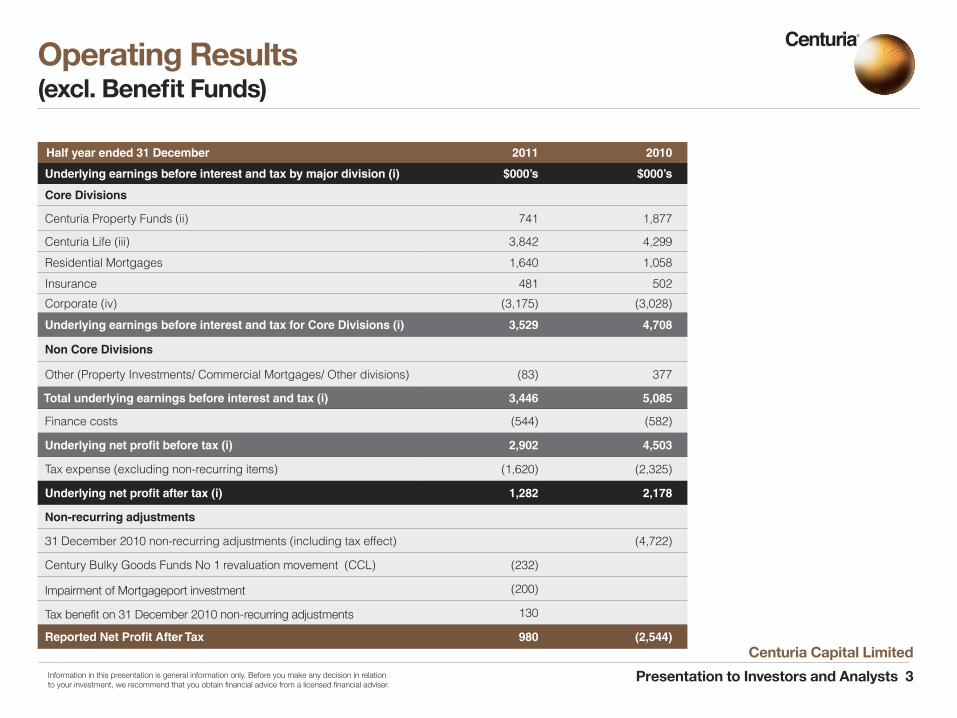
Operating Results (excl. Benefit Funds)
Half year ended 31 December 2011 2010
Underlying earnings before interest and tax by major division (i) $000’s $000’s
Core Divisions
Centuria Property Funds (ii) 741 1,877
Centuria Life (iii) 3,842 4,299
Residential Mortgages 1,640 1,058
Insurance 481 502
Corporate (iv) (3,175) (3,028)
Underlying earnings before interest and tax for Core Divisions (i) 3,529 4,708
Non Core Divisions
Other (Property Investments/ Commercial Mortgages/ Other divisions) (83) 377
Total underlying earnings before interest and tax (i) 3,446 5,085
Finance costs (544) (582)
Underlying net profit before tax (i) 2,902 4,503
Tax expense (excluding non-recurring items) (1,620) (2,325)
Underlying net profit after tax (i) 1,282 2,178
Non-recurring adjustments
31 December 2010 non-recurring adjustments (including tax effect) (4,722)
Century Bulky Goods Funds No 1 revaluation movement (CCL) (232)
Impairment of Mortgageport investment (200)
Tax benefit on 31 December 2010 non-recurring adjustments 130
Reported Net Profit After Tax 980 (2,544)
Information in this presentation is general information only. Before you make any decision in relation to your investment, we recommend that you obtain financial advice from a licensed financial adviser.
Notes relating to the prior page (i) Financial information noted as “underlying” represents the statutory result of the Group in accordance with International Financial Reporting Standards (“IFRS”), adjusted for items which are in accordance with IFRS, but which are considered to be of a non-recurring nature or are outside the normal course of business. Underlying net profit after tax results calculated above have not been subject to independent audit or review.
(ii) The half-year ended 31 December 2011 includes no new property funds however the Group is in advanced stages for the acquisition of a $58m property in Melbourne.
(iii) Strategic appointments have been made in the Centuria Life business including the appointment of a new Head of Distribution. These costs are reflected in the 31 December 2011 numbers but not in the 31 December 2010 numbers due to the timing of the appointments.
(iv) The Group has made significant investments in new staff and systems during 2011 which has impacted earnings in the half-year ended 31 December 2011.
Centuria Capital Limited
Presentation to Investors and Analysts 4
Operating Results (excl. Benefit Funds) (continued)
Centuria Capital Limited
Presentation to Investors and Analysts 5Information in this presentation is general information only. Before you make any decision in relation to your investment, we recommend that you obtain financial advice from a licensed financial adviser.
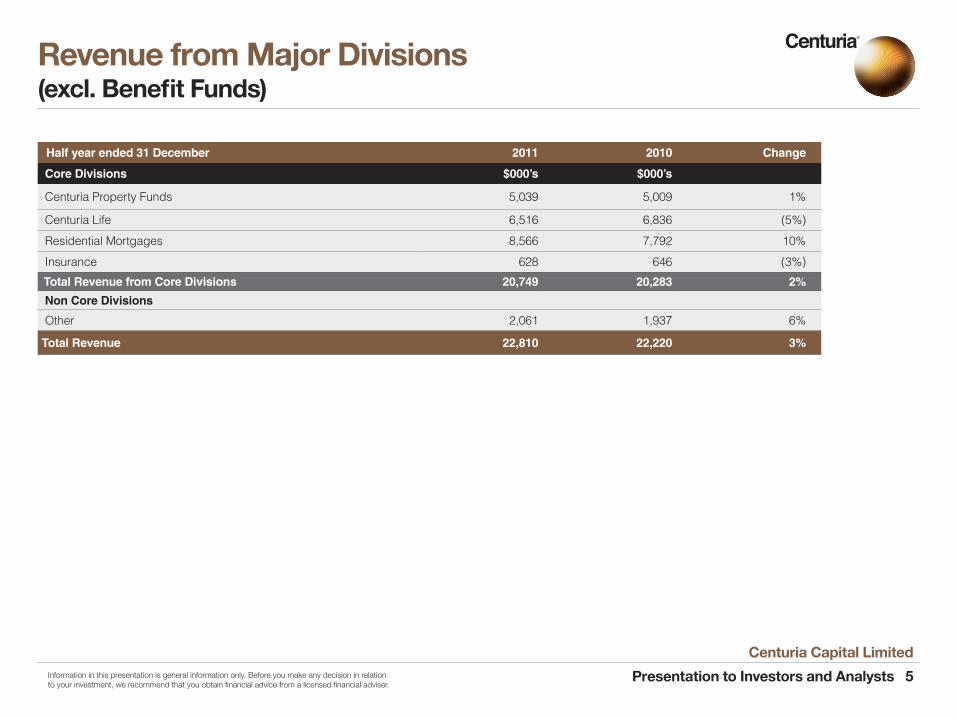
Revenue from Major Divisions (excl. Benefit Funds)
Half year ended 31 December 2011 2010 Change
Core Divisions $000’s $000’s
Centuria Property Funds 5,039 5,009 1%
Centuria Life 6,516 6,836 (5%)
Residential Mortgages 8,566 7,792 10%
Insurance 628 646 (3%)
Total Revenue from Core Divisions 20,749 20,283 2%
Non Core Divisions
Other 2,061 1,937 6%
Total Revenue 22,810 22,220 3%
Centuria Capital Limited
Presentation to Investors and Analysts 6Information in this presentation is general information only. Before you make any decision in relation to your investment, we recommend that you obtain financial advice from a licensed financial adviser.
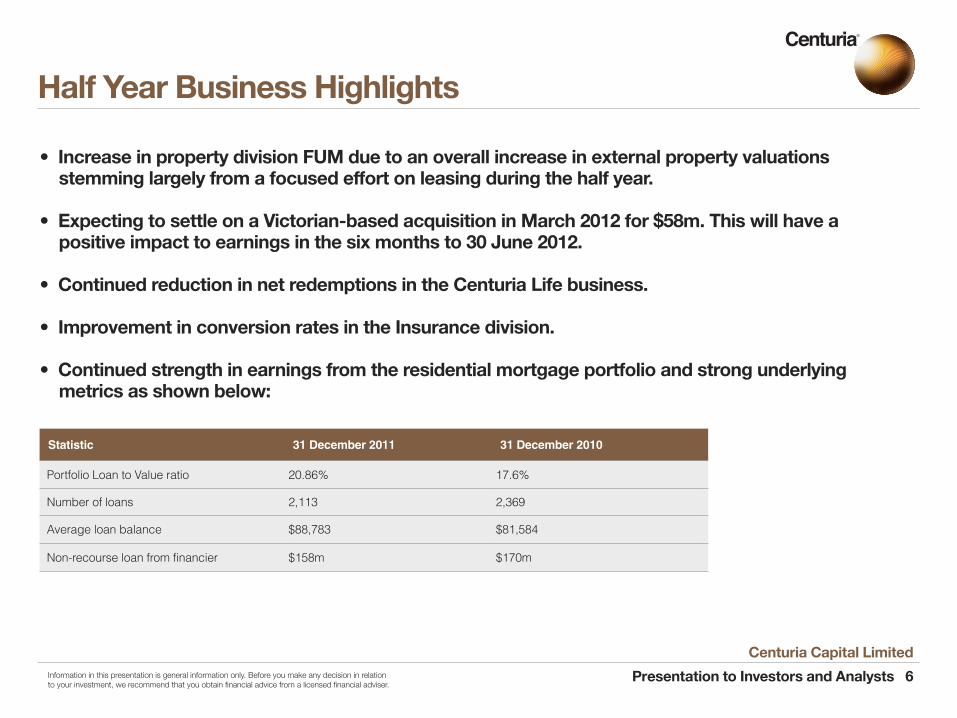
Half Year Business Highlights
• Increase in property division FUM due to an overall increase in external property valuations stemming largely from a focused effort on leasing during the half year.
• Expecting to settle on a Victorian-based acquisition in March 2012 for $58m. This will have a positive impact to earnings in the six months to 30 June 2012.
• Continued reduction in net redemptions in the Centuria Life business.
• Improvement in conversion rates in the Insurance division.
• Continued strength in earnings from the residential mortgage portfolio and strong underlying metrics as shown below:
Statistic 31 December 2011 31 December 2010
Portfolio Loan to Value ratio 20.86% 17.6%
Number of loans 2,113 2,369
Average loan balance $88,783 $81,584
Non-recourse loan from financier $158m $170m
Centuria Capital Limited
Presentation to Investors and Analysts 7Information in this presentation is general information only. Before you make any decision in relation to your investment, we recommend that you obtain financial advice from a licensed financial adviser.
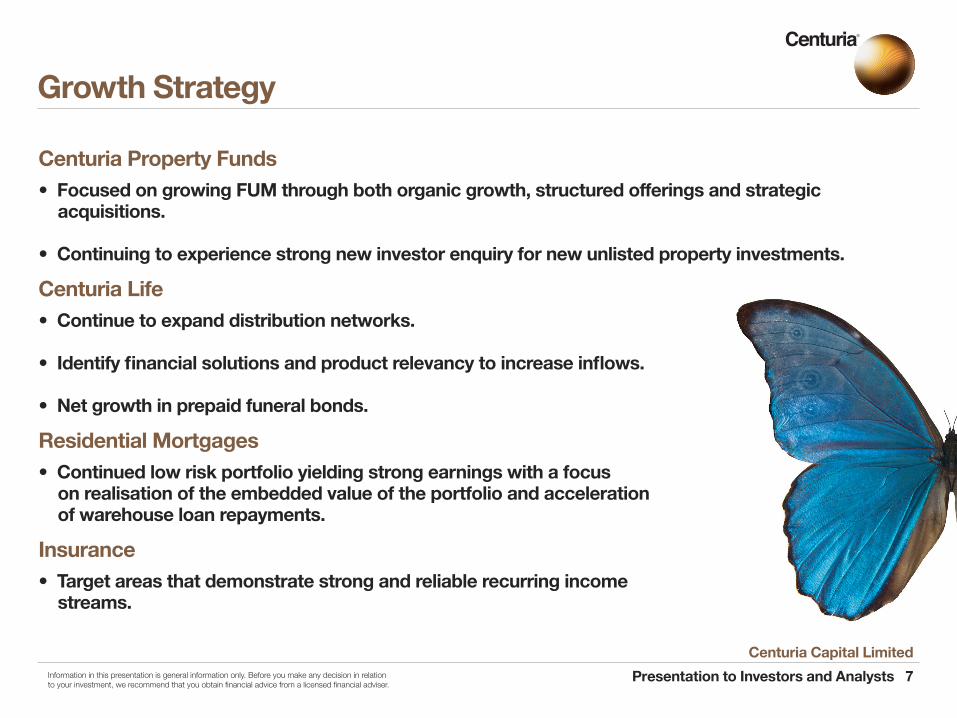
Growth Strategy
Centuria Property Funds• Focused on growing FUM through both organic growth, structured offerings and strategic acquisitions.
• Continuing to experience strong new investor enquiry for new unlisted property investments.
Centuria Life• Continue to expand distribution networks.
• Identify financial solutions and product relevancy to increase inflows.
• Net growth in prepaid funeral bonds.
Residential Mortgages• Continued low risk portfolio yielding strong earnings with a focus on realisation of the embedded value of the portfolio and acceleration of warehouse loan repayments.
Insurance • Target areas that demonstrate strong and reliable recurring income streams.
Centuria Capital Limited
Presentation to Investors and Analysts 8Information in this presentation is general information only. Before you make any decision in relation to your investment, we recommend that you obtain financial advice from a licensed financial adviser.
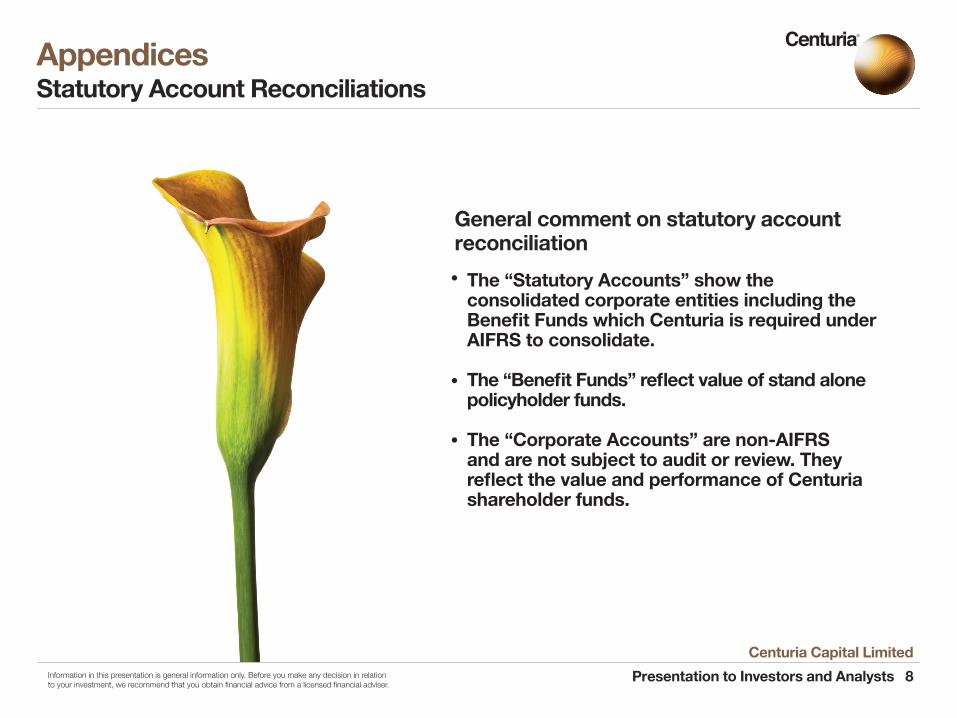
The “Statutory Accounts” show the consolidated corporate entities including the Benefit Funds which Centuria is required under AIFRS to consolidate.
The “Benefit Funds” reflect value of stand alone policyholder funds.
The “Corporate Accounts” are non-AIFRS and are not subject to audit or review. They reflect the value and performance of Centuria shareholder funds.
General comment on statutory account reconciliation
AppendicesStatutory Account Reconciliations
Centuria Capital Limited
Presentation to Investors and Analysts 9Information in this presentation is general information only. Before you make any decision in relation to your investment, we recommend that you obtain financial advice from a licensed financial adviser.
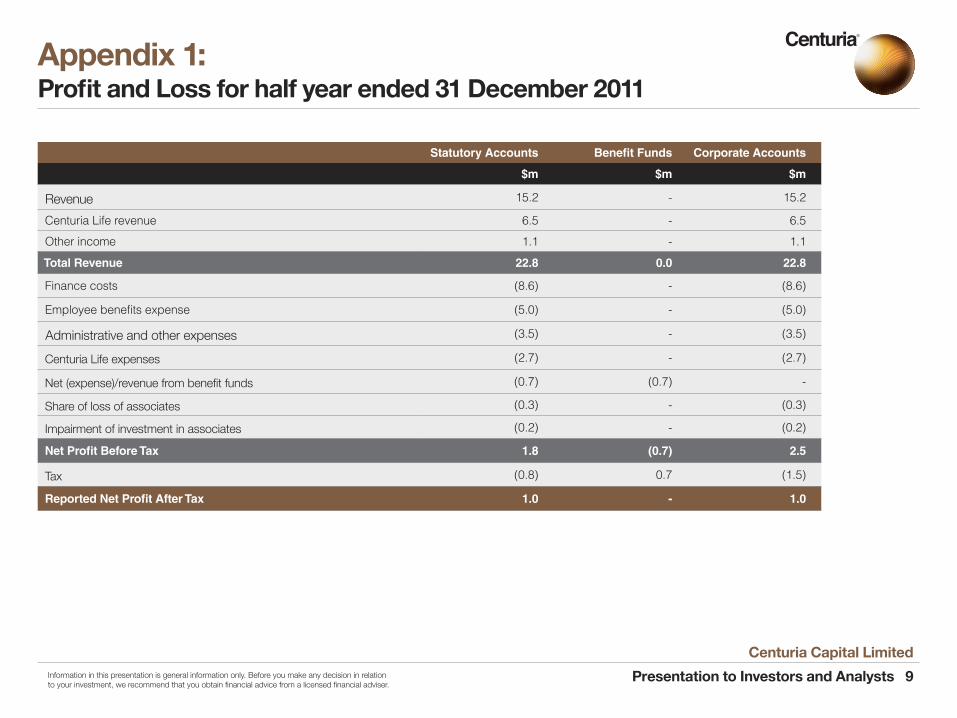
Appendix 1: Profit and Loss for half year ended 31 December 2011
Statutory Accounts Benefit Funds Corporate Accounts
$m $m $m
Revenue 15.2 - 15.2
Centuria Life revenue 6.5 - 6.5
Other income 1.1 - 1.1
Total Revenue 22.8 0.0 22.8
Finance costs (8.6) - (8.6)
Employee benefits expense (5.0) - (5.0)
Administrative and other expenses (3.5) - (3.5)
Centuria Life expenses (2.7) - (2.7)
Net (expense)/revenue from benefit funds (0.7) (0.7) -
Share of loss of associates (0.3) - (0.3)
Impairment of investment in associates (0.2) - (0.2)
Net Profit Before Tax 1.8 (0.7) 2.5
Tax (0.8) 0.7 (1.5)
Reported Net Profit After Tax 1.0 - 1.0
Centuria Capital Limited
Presentation to Investors and Analysts 10Information in this presentation is general information only. Before you make any decision in relation to your investment, we recommend that you obtain financial advice from a licensed financial adviser.
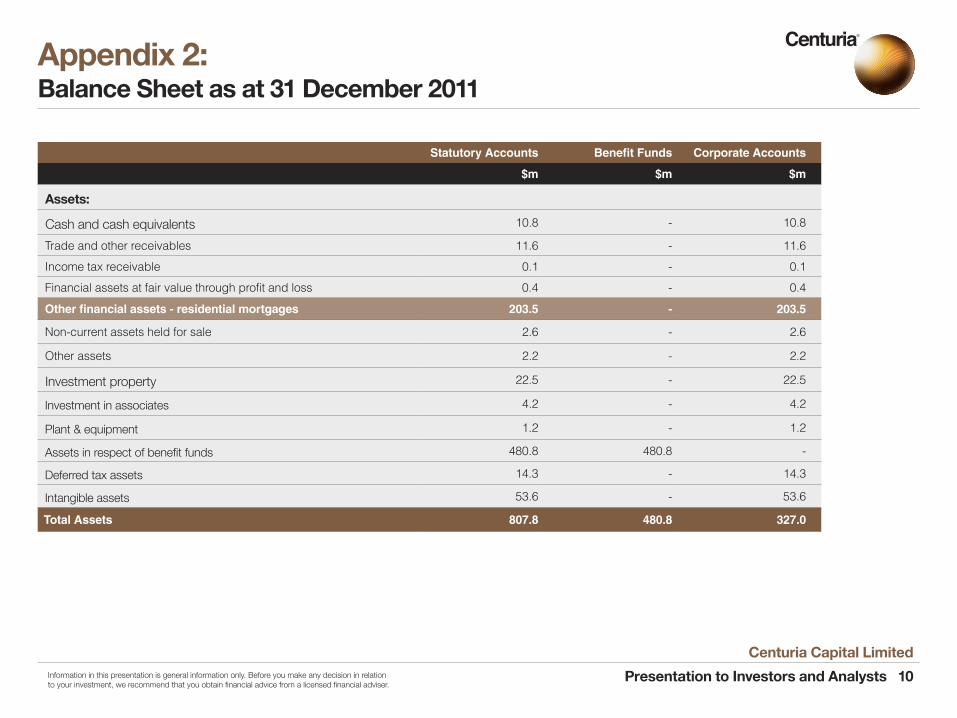
Appendix 2: Balance Sheet as at 31 December 2011
Statutory Accounts Benefit Funds Corporate Accounts
$m $m $m
Assets:
Cash and cash equivalents 10.8 - 10.8
Trade and other receivables 11.6 - 11.6
Income tax receivable 0.1 - 0.1
Financial assets at fair value through profit and loss 0.4 - 0.4
Other financial assets - residential mortgages 203.5 - 203.5
Non-current assets held for sale 2.6 - 2.6
Other assets 2.2 - 2.2
Investment property 22.5 - 22.5
Investment in associates 4.2 - 4.2
Plant & equipment 1.2 - 1.2
Assets in respect of benefit funds 480.8 480.8 -
Deferred tax assets 14.3 - 14.3
Intangible assets 53.6 - 53.6
Total Assets 807.8 480.8 327.0
Centuria Capital Limited
Presentation to Investors and Analysts 11Information in this presentation is general information only. Before you make any decision in relation to your investment, we recommend that you obtain financial advice from a licensed financial adviser.
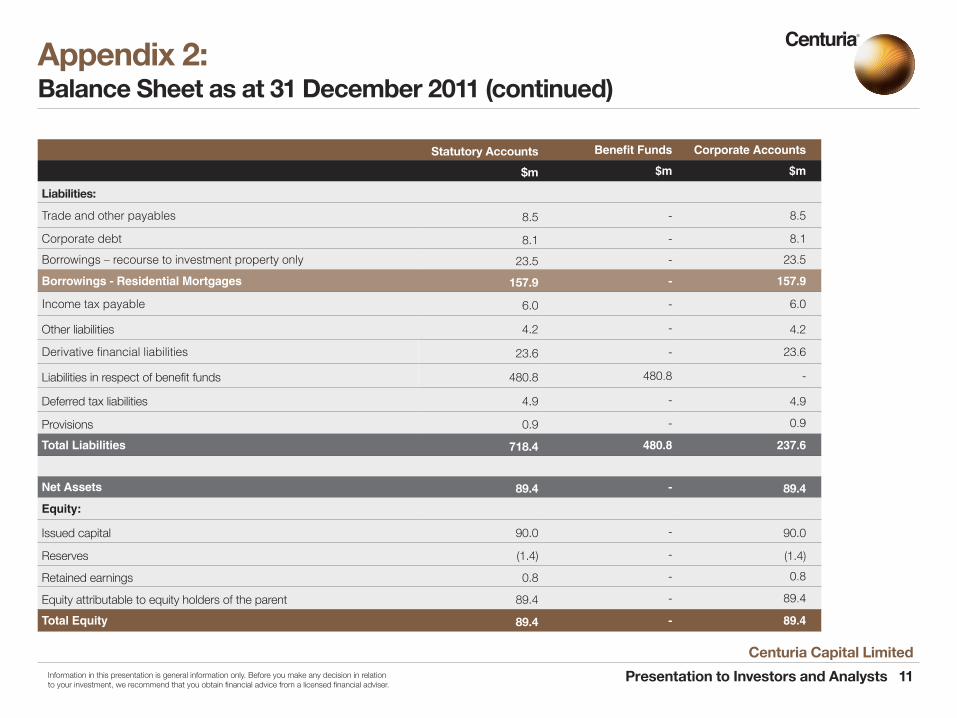
Appendix 2: Balance Sheet as at 31 December 2011 (continued)
Statutory Accounts Benefit Funds Corporate Accounts
$m $m $m
Liabilities:
Trade and other payables 8.5 - 8.5
Corporate debt 8.1 - 8.1
Borrowings – recourse to investment property only 23.5 - 23.5
Borrowings - Residential Mortgages 157.9 - 157.9
Income tax payable 6.0 - 6.0
Other liabilities 4.2 - 4.2
Derivative financial liabilities 23.6 - 23.6
Liabilities in respect of benefit funds 480.8 480.8 -
Deferred tax liabilities 4.9 - 4.9
Provisions 0.9 - 0.9
Total Liabilities 718.4 480.8 237.6
Net Assets 89.4 - 89.4
Equity:
Issued capital 90.0 - 90.0
Reserves (1.4) - (1.4)
Retained earnings 0.8 - 0.8
Equity attributable to equity holders of the parent 89.4 - 89.4
Total Equity 89.4 - 89.4
Centuria Capital Limited
Presentation to Investors and Analysts 12Information in this presentation is general information only. Before you make any decision in relation to your investment, we recommend that you obtain financial advice from a licensed financial adviser.
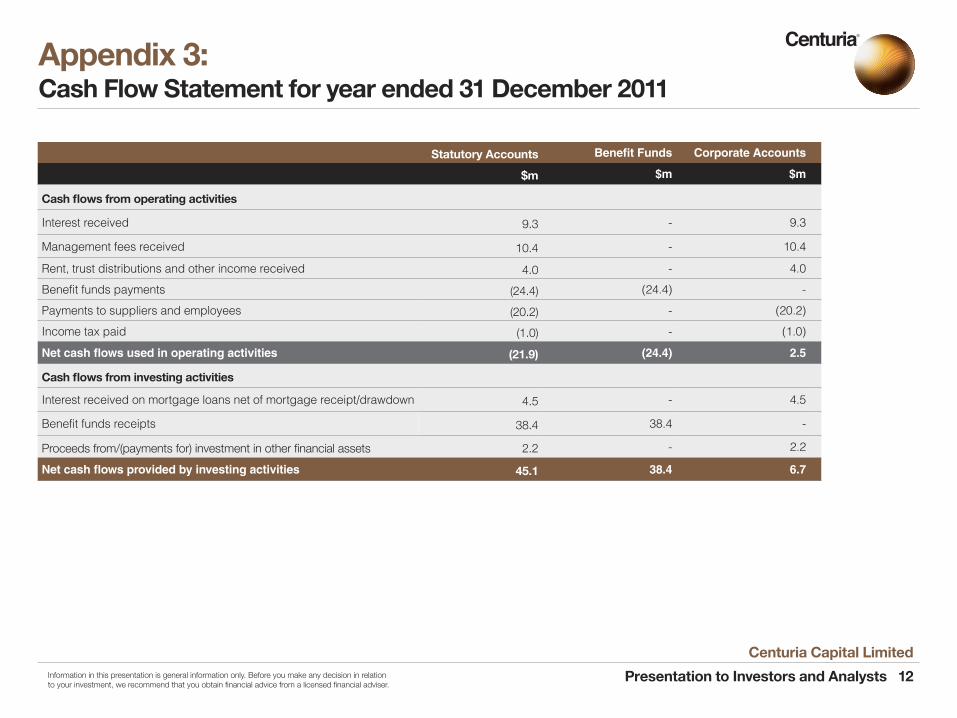
Appendix 3: Cash Flow Statement for year ended 31 December 2011
Statutory Accounts Benefit Funds Corporate Accounts
$m $m $m
Cash flows from operating activities
Interest received 9.3 - 9.3
Management fees received 10.4 - 10.4
Rent, trust distributions and other income received 4.0 - 4.0
Benefit funds payments (24.4) (24.4) -
Payments to suppliers and employees (20.2) - (20.2)
Income tax paid (1.0) - (1.0)
Net cash flows used in operating activities (21.9) (24.4) 2.5
Cash flows from investing activities
Interest received on mortgage loans net of mortgage receipt/drawdown 4.5 - 4.5
Benefit funds receipts 38.4 38.4 -
Proceeds from/(payments for) investment in other financial assets 2.2 - 2.2
Net cash flows provided by investing activities 45.1 38.4 6.7
Centuria Capital Limited
Presentation to Investors and Analysts 13Information in this presentation is general information only. Before you make any decision in relation to your investment, we recommend that you obtain financial advice from a licensed financial adviser.
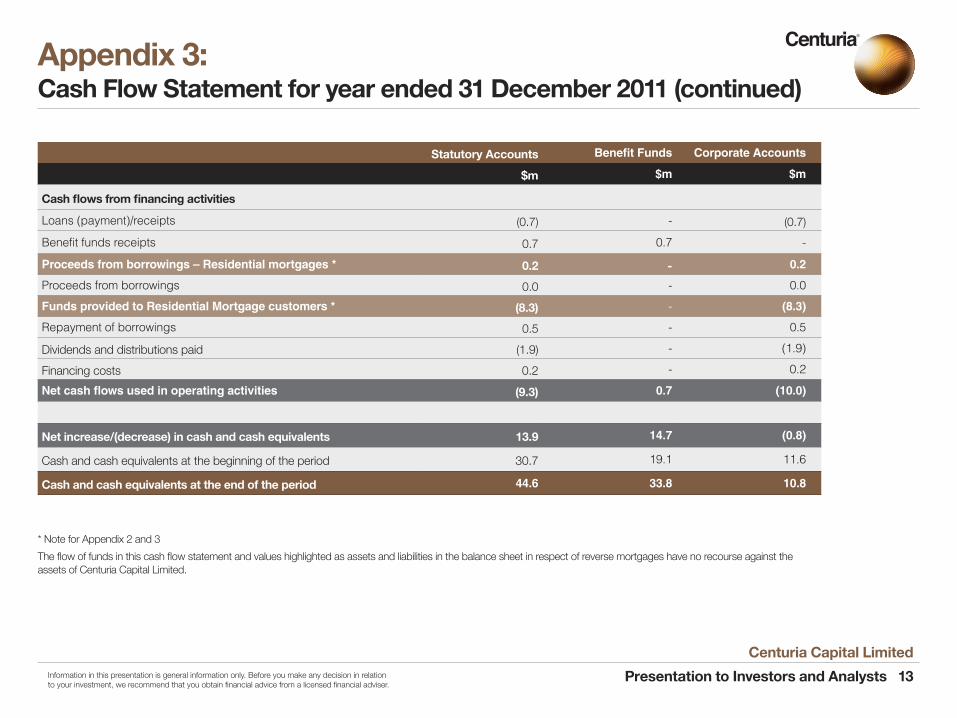
Appendix 3: Cash Flow Statement for year ended 31 December 2011 (continued)
Statutory Accounts Benefit Funds Corporate Accounts
$m $m $m
Cash flows from financing activities
Loans (payment)/receipts (0.7) - (0.7)
Benefit funds receipts 0.7 0.7 -
Proceeds from borrowings – Residential mortgages * 0.2 - 0.2
Proceeds from borrowings 0.0 - 0.0
Funds provided to Residential Mortgage customers * (8.3) - (8.3)
Repayment of borrowings 0.5 - 0.5
Dividends and distributions paid (1.9) - (1.9)
Financing costs 0.2 - 0.2
Net cash flows used in operating activities (9.3) 0.7 (10.0)
Net increase/(decrease) in cash and cash equivalents 13.9 14.7 (0.8)
Cash and cash equivalents at the beginning of the period 30.7 19.1 11.6
Cash and cash equivalents at the end of the period 44.6 33.8 10.8
* Note for Appendix 2 and 3
The flow of funds in this cash flow statement and values highlighted as assets and liabilities in the balance sheet in respect of reverse mortgages have no recourse against the assets of Centuria Capital Limited.
Centuria Capital Limited
Presentation to Investors and Analysts 14Information in this presentation is general information only. Before you make any decision in relation to your investment, we recommend that you obtain financial advice from a licensed financial adviser.
This document has been issued by Centuria Capital Limited ABN 22 095 454 336 and contains general information about Centuria Capital Limited and its related bodies corporate (“Centuria”) which is current as at 24 February 2011.
The information in this document is in summary form and does not purport to be complete. Due to the impact of rounding, the totals shown for charts, graphs or tables in this document may not equate to the sum of the individual components of the relevant chart, graph or table. Accordingly, it should be read in conjunction with all other information concerning Centuria filed with the Australian Securities Exchange.
The document has been prepared from information believed to be accurate, however, no representation or warranty is made as to the accuracy or adequacy of any information contained in the document. To the extent permitted by law, Centuria, its related bodies corporate and their respective directors, officers and employees, exclude liability for any loss or damage resulting from the issue or use of, or reliance on, anything contained in or omitted from this document.
This document is not a recommendation or personal advice in relation to Centuria or any product or service offered by Centuria and does not take into account the investment objectives, financial situation or needs of any particular person. Past performance is not indicative of future performance.
To the extent this document contains prospective financial information, that information has been based on current expectations about future events and is, however, subject to risks, uncertainties and assumptions that could cause actual results to differ materially from expectations.
Disclaimer