2016 professional serviceserp.financialforce.com/rs/572-xmb-986/images/2016_ps maturity... · 2016...
TRANSCRIPT

2016 Professional Services
Maturity™ Benchmark
February 2016
Service Performance Insight
www.SPIresearch.com
Service Performance Insight, LLC

Service Performance Insight
Service Performance Insight (SPI) is a global research, consulting and training organization dedicated to helping professional service organizations (PSOs) make quantum improvements in productivity and profit. In 2007, SPI developed the PS Maturity Model™ as a strategic planning and management framework. It is now the industry-leading performance improvement tool used by over 10,000 service and project-oriented organizations to chart their course to service excellence.
The core tenet of the PS Maturity Model™ is PSOs achieve success through the optimization of five Service Performance Pillars™:
Leadership
Client Relationships
Human Capital Alignment
Service Execution
Finance and Operations
The SPI Advantage – Research
Service Performance Insight provides an informed and actionable third-party perspective for clients and
industry audiences. Our market research and reporting forms the context in which both buyers and sellers of
information technology-based solutions maximize the effectiveness of solution development, selection,
deployment and use.
The SPI Advantage – Consulting
Service Performance Insight brings years of technology service leadership and experience to every consulting
project. SPI Research helps clients ignite performance by objectively assessing strengths and weaknesses to
develop a full-engagement improvement plan with measurable, time-bound objectives. SPI Research offers
configurable programs proven to accelerate behavioral change and improve bottom line results for our
clients.
To provide us with your feedback on this research, please send your comments to:
[email protected] or [email protected]
The information contained in this publication has been obtained from sources Service Performance Insight believes to be reliable, but is not guaranteed by SPI Research. All forecasts, analyses, recommendations, etc. whether delivered orally or in writing, are the opinions of SPI Research consultants, and while made in good faith and on the basis of information before us at the time, should be considered and relied on as such. Client agrees to indemnify and hold harmless SPI Research, its consultants, affiliates, employees and contractors for any claims or losses, monetary or otherwise, resulting from the use of strategies, programs, counsel, or information provided to client by SPI Research or its affiliates.
The trademarks and registered trademarks of the corporations mentioned in this publication are the property of their respective holders.
© 2016 Service Performance Insight, Liberty Township, Ohio
For more information on Service Performance Insight, please visit:
www.spiresearch.com

© 2016 Service Performance Insight www.FinancialForce.com i
Table of Contents
Report Sponsorship by FinancialForce ............................................................................................... xi
1. Foreword .......................................................................................................................... 1
It starts with the benchmark ............................................................................................................... 1
2015 Wrap-up ..................................................................................................................................... 3
Look Forward to 2016 ......................................................................................................................... 7
2. The Professional Services Maturity™ Model ................................................................. 8
Service Performance Pillars™ .............................................................................................................. 9
Professional Services Maturity™ Model Benchmark Levels ............................................................. 10
Building the Professional Services Maturity™ Model ....................................................................... 12
Why Maturity Matters ...................................................................................................................... 14
Pillar Importance and Organizational Maturity ................................................................................ 14
3. Survey Demographics ................................................................................................... 17
Vertical PS Markets — the North American Industry Classification System ..................................... 17
Global IT Spending ............................................................................................................................ 19
PS Maturity™ Benchmark Vertical Market Demographics ............................................................... 20
4. Best-of-the-Best ............................................................................................................. 31
Introducing the 2016 Best-of-the-Best Service Organizations .......................................................... 31
Best-of-the-Best Demographics ........................................................................................................ 41
Pillar Performance ............................................................................................................................. 42
The Best-of-the-Best PSOs Use and Integrate PS Applications ......................................................... 48
Best-of-the-Best Conclusions ............................................................................................................ 49
5. Professional Services Business Applications .............................................................. 50
Primary Professional Services Business Applications ........................................................................ 51
PS Solution Adoption......................................................................................................................... 52
Solution Satisfaction .......................................................................................................................... 58
The Professional Service IT Maturity™ Model .................................................................................. 73
6. Leadership Pillar ........................................................................................................... 75
Establishing the Leadership Index ..................................................................................................... 77
Survey Results ................................................................................................................................... 79
7. Client Relationships Pillar ............................................................................................ 86
PS Sales Maturity ............................................................................................................................... 87
PS Sales Effectiveness Metrics .......................................................................................................... 89

© 2016 Service Performance Insight www.FinancialForce.com ii
PS Marketing Maturity ...................................................................................................................... 90
Service Marketing Effectiveness ....................................................................................................... 91
Service Packaging .............................................................................................................................. 92
Solution Development Effectiveness ................................................................................................ 94
Survey Results ................................................................................................................................... 95
8. Human Capital Alignment Pillar ................................................................................. 114
The Talent Cliff ................................................................................................................................ 115
Talent Priorities ............................................................................................................................... 116
Talent Strategies ............................................................................................................................. 117
The Consulting Pyramid .................................................................................................................. 118
Important Changes in Workforce Composition .............................................................................. 119
Best Talent Practices ....................................................................................................................... 120
HRMS Business Applications come of age ...................................................................................... 121
Survey Results ................................................................................................................................. 122
9. Service Execution Pillar .............................................................................................. 143
Core Service Execution Business Processes .................................................................................... 144
Changing Client Demand ................................................................................................................. 145
Strategic Resource Management for PSOs ..................................................................................... 145
PSA is Critical for Service Delivery ................................................................................................... 149
Survey Results ................................................................................................................................. 151
10. Finance and Operations Pillar .................................................................................... 165
The Planning and Budgeting Maturity Model ................................................................................. 168
Survey results .................................................................................................................................. 169
Income Statements ......................................................................................................................... 187
11. 2016 Professional Services Maturity™ Model Results ............................................ 193
Maturity Levels ................................................................................................................................ 193
Model Improvements...................................................................................................................... 194
Model Inputs ................................................................................................................................... 195
Model Results .................................................................................................................................. 197
The Financial Benefits of Moving Up Levels .................................................................................... 198
Model Conclusions .......................................................................................................................... 200
12. Conclusions and Recommendations ......................................................................... 201
2015 Ended in Uncertainty .............................................................................................................. 201
The Promise of 2016 ....................................................................................................................... 201
The Professional Services Maturity™ Model ................................................................................... 202

© 2016 Service Performance Insight www.FinancialForce.com iii
Focus on performance improvement ............................................................................................. 203
13. Appendicies ................................................................................................................. 206
Appendix A: Acronyms Used in This Report ................................................................................... 206
Appendix B: Financial Terminology ................................................................................................ 207
About Service Performance Insight ................................................................................................. 214
Figures
Figure 1: Annual PS Revenue Growth vs. Headcount Growth ..................................................................... 2
Figure 2: New Client Penetration ................................................................................................................. 3
Figure 3: Bid-to-win Ratio ............................................................................................................................ 4
Figure 4: Employee Attrition ........................................................................................................................ 4
Figure 5: Annual Profit (EBITDA) .................................................................................................................. 5
Figure 6: Growth vs. Annual Profit for Selected Markets ............................................................................ 5
Figure 7: Integrated Information Drives Performance Higher! ................................................................... 6
Figure 8: Service Performance Pillars™ ........................................................................................................ 9
Figure 9: Services Maturity™ Model Levels ............................................................................................... 10
Figure 10: Service Performance Pillar Maturity™ ...................................................................................... 12
Figure 11: Professional Services Maturity™ Progression .......................................................................... 14
Figure 12: PS Performance Pillars – Core KPIs ........................................................................................... 15
Figure 13: Vertical Market Distribution ..................................................................................................... 21
Figure 14: Independent vs. Embedded Survey Orgs Surveyed (2007 – 2015) ........................................... 24
Figure 15: Organization Size ....................................................................................................................... 25
Figure 16: Headquarters Location – Region ............................................................................................... 26
Figure 17: Total Company Revenue ........................................................................................................... 26
Figure 18: Total Professional Services Revenue ......................................................................................... 27
Figure 19: Year-over-Year Change in PS Revenue ...................................................................................... 27
Figure 20: Year-over-Year Change in PS Headcount .................................................................................. 28
Figure 21: Percentage of Employees Billable/Chargeable ......................................................................... 28
Figure 22: Percentage of PS Rev. Delivered by 3rd-parties ....................................................................... 29
Figure 23: Mergers & Acquisitions over the Past Three Years ................................................................... 30
Figure 24: Core Professional Services Business Applications..................................................................... 51
Figure 25: Commercial Solution Adoption ................................................................................................. 53
Figure 26: Financial Management Solution Used ...................................................................................... 59
© 2016 Service Performance Insight www.FinancialForce.com iv
Figure 27: Client Relationship Management (CRM) Solution Used ........................................................... 60
Figure 28: Professional Services Automation (PSA) Solution Used ........................................................... 62
Figure 29: Human Capital Management (HCM) Solution Used ................................................................. 64
Figure 30: Business Intelligence (BI) Solution Used ................................................................................... 67
Figure 31: Project Portfolio Management (PPM) Solution Used ............................................................... 68
Figure 32: Knowledge Management (KM) Solution Used .......................................................................... 69
Figure 33: Remote Service Delivery and Collaboration Tool Used ............................................................ 70
Figure 34: Social Media (SM) Solution Used .............................................................................................. 71
Figure 35: Success depends on inter-departmental cooperation .............................................................. 71
Figure 36: Is CRM Integrated with PSA? .................................................................................................... 72
Figure 37: Professional Service IT Maturity™ Level ................................................................................... 73
Figure 38: PS Dashboard ............................................................................................................................ 74
Figure 39: Type of Work Sold ..................................................................................................................... 98
Figure 40: Primary Service Sales Measurement ...................................................................................... 100
Figure 41: Primary Service Target Buyer .................................................................................................. 102
Figure 42: Bid-to-win Ratio ...................................................................................................................... 103
Figure 43: Deal Pipeline Relative to Qtr. Bookings Forecast .................................................................... 104
Figure 44: Length of Sales Cycle ............................................................................................................... 104
Figure 45: Primary Group Responsible for New Solution Development ................................................. 107
Figure 46: 2016 Workforce Priorities ....................................................................................................... 117
Figure 47: The Consulting Pyramid - Finders, Minders and Grinders ...................................................... 119
Figure 48: Comparison 2011 to 2015 Workforce Distribution by Employee Role ................................... 120
Figure 49: Primary Organizational Structure ........................................................................................... 128
Figure 50: Why Employees Leave ............................................................................................................ 129
Figure 51: Billable Utilization: 2010-2015 ............................................................................................... 133
Figure 52: Primary business processes cross multiple departments ....................................................... 144
Figure 53: Quote-to-cash process ............................................................................................................ 145
Figure 54: Resource Management Process .............................................................................................. 148
Figure 55: Project Duration (man-months) 5-year trend ......................................................................... 153
Figure 56: Standardized Delivery Methodology use mapped against On-time Delivery 5-year trend .... 154
Figure 57: Project Staffing Time (days) .................................................................................................... 156
Figure 58: On-time Delivery Mapped to Project Overrun 5-year trend .................................................. 159
Figure 59: Referenceable Clients Mapped to Projects Cancelled 5-year trend ....................................... 160

© 2016 Service Performance Insight www.FinancialForce.com v
Figure 60: Revenue per Billable Consultant Five-year Trend ................................................................... 175
Figure 61: Revenue per Employee Five-year Trend ................................................................................. 176
Figure 62: Project Margin Five-year Trend .............................................................................................. 178
Figure 63: Project Margin......................................................................................................................... 178
Figure 64: Quarterly Non-Billable Expense per Employee ....................................................................... 185
Figure 65: Professional Services Maturity Model™ Levels....................................................................... 193
Figure 66: Normalized Finance & Operations Pillar Scores...................................................................... 196
Figure 67: Increase performance by focusing on low-performing KPIs ................................................... 196
Figure 68: Key Performance Indicators (KPIs) are Correlated ................................................................. 200
Tables
Table 1: Five-year PS Key Performance Metrics .......................................................................................... 1
Table 2: Maturity Matters! .......................................................................................................................... 8
Table 3: Performance Pillars Mapped Against Service .............................................................................. 12
Table 4: Service Pillar Importance by Organizational Maturity Level ........................................................ 15
Table 5: Vertical PS Markets — the North American Industry Classification System ................................ 18
Table 6: Worldwide IT Spending by Category (2014 to 2019) in Constant Currency ................................ 19
Table 7: Number of Participating Firms by Vertical Market (2007 through 2015) .................................... 21
Table 8: Demographics by Vertical Market ................................................................................................ 22
Table 9: Demographics by Vertical Market ................................................................................................ 23
Table 10: Demographics by Organization Type and Geographic Region ................................................... 23
Table 11: Demographics by Organization Size ........................................................................................... 24
Table 12: 2016 Best-of-the-Best Performance Advantage ........................................................................ 31
Table 13: Best-of-the-Best Comparison – Demographics .......................................................................... 41
Table 14: Best-of-the-Best Comparison – Leadership Pillar (1 to 5 Scale) ................................................. 43
Table 15: Best-of-the-Best Comparison – Client Relationships Pillar ........................................................ 44
Table 16: Best-of-the-Best Comparison – Human Capital Alignment Pillar ............................................... 45
Table 17: Best-of-the-Best Comparison – Service Execution Pillar ............................................................ 46
Table 18: Best-of-the-Best Comparison – Finance and Operations Pillar .................................................. 47
Table 19: Best-of-the-Best Business App. Adoption, Integration, Satisfaction ......................................... 48
Table 20: PSO Departments and Information Needs ................................................................................. 52
Table 21: Commercial Solution Adoption .................................................................................................. 53
Table 22: Business Application Use by Organization Type and Geographic Region .................................. 54
Table 23: Business Application Use by Organization Size .......................................................................... 55
© 2016 Service Performance Insight www.FinancialForce.com vi
Table 24: Business Application Use by Vertical Service Market ................................................................ 56
Table 25: Business Application Use by Vertical Service Market ................................................................ 57
Table 26: Solution Satisfaction ................................................................................................................... 58
Table 27: Impact – Client Relationship Management (CRM) Use .............................................................. 61
Table 28: Impact – Commercial CRM Integration ...................................................................................... 61
Table 29: Impact – Professional Services Automation (PSA) Use .............................................................. 63
Table 30: Impact – Commercial PSA Integration ....................................................................................... 63
Table 31: Impact – Human Capital Management (HCM) Use .................................................................... 65
Table 32: Impact – Commercial HCM Integration ..................................................................................... 65
Table 33: Impact – Business Intelligence (BI) Use ...................................................................................... 67
Table 34: Impact – Knowledge Management (KM) Use ............................................................................ 69
Table 35: Integration with Core Financials ................................................................................................ 72
Table 36: Leadership Pillar 5-year trend .................................................................................................... 75
Table 37: The Leadership Maturity Model ................................................................................................. 76
Table 38: Leadership Impact ...................................................................................................................... 78
Table 39: Year-over-year Change in Top Challenges ................................................................................. 79
Table 40: Leadership Demographics .......................................................................................................... 80
Table 41: Steps Taken to Improve Profitability Comparison ..................................................................... 80
Table 42: Year-over-year Leadership Comparison ..................................................................................... 81
Table 43: Impact – Well understood vision, mission and strategy ............................................................ 81
Table 44: Confidence in PS leadership ....................................................................................................... 82
Table 45: Ease of getting things done ........................................................................................................ 82
Table 46: Goals and measurement in alignment ....................................................................................... 83
Table 47: Impact – Employees Have Confidence in the PSO's Future ...................................................... 83
Table 48: Impact – Effective communication with employees .................................................................. 84
Table 49: Impact – Organization Embraces Change, is Nimble and Flexible ............................................ 84
Table 50: Impact – PS Innovation Focus .................................................................................................... 85
Table 51: PS Sales and Marketing Maturity Model™ ................................................................................. 86
Table 52: Client Relationships Pillar 5-year trend ...................................................................................... 87
Table 53: PS Sales Maturity Model™.......................................................................................................... 87
Table 54: PS Sales Maturity Progression .................................................................................................... 88
Table 55: Impact – Service Sales Effectiveness Impact on Performance ................................................... 89
Table 56: PS Marketing Maturity™ Levels.................................................................................................. 90
© 2016 Service Performance Insight www.FinancialForce.com vii
Table 57: Impact – Marketing Effectiveness Impact on Performance ....................................................... 92
Table 58: Service Packaging Benefits ......................................................................................................... 94
Table 59: Impact – Solution Development Effectiveness Impact on Performance ................................... 95
Table 60: Client Relationships KPIs by Organization Type and Geographic Region ................................... 96
Table 61: Client Relationships KPIs by Organization Size ........................................................................... 97
Table 62: Client Relationships KPIs by Vertical Service Market ................................................................. 97
Table 63: Client Relationships KPIs by Vertical Service Market ................................................................. 98
Table 64: Type of Work Sold by Organization Type and Geographic Region ............................................ 99
Table 65: Impact – Percentage of Business from New Clients................................................................. 100
Table 66: Impact – The Effect of Sales Measurements on Performance ................................................. 101
Table 67: Impact – The Effect of Primary Buyer Type on Performance ................................................... 102
Table 68: Impact – The effect of improving the Bid-to-Win Ratio ........................................................... 103
Table 69: Impact – Length of Sales Cycle on Performance ...................................................................... 105
Table 70: Impact – The effect of discounting ........................................................................................... 106
Table 71: Impact – Client “Referenceability” ........................................................................................... 107
Table 72: Fee Structure by Organization Type and Geographic Region .................................................. 108
Table 73: Fee Structure by Service Market Vertical ................................................................................. 109
Table 74: Fee Structure by Service Market Vertical ................................................................................. 109
Table 75: Professional Services Sales KPI’s by Organization Type and Geography ................................. 111
Table 76: Professional Services Sales KPI’s by Organization Size ............................................................. 111
Table 77: Sales Structure by Service Market Vertical .............................................................................. 112
Table 78: Sales Structure by Service Market Vertical .............................................................................. 113
Table 79: Human Capital Alignment Maturity Model .............................................................................. 114
Table 80: Human Capital Alignment performance indicators tied to Maturity levels ............................. 115
Table 81: Workforce Engagement Best Practices .................................................................................... 121
Table 82: Human Capital Alignment Pillar 5-year trend .......................................................................... 122
Table 83: Human Capital Alignment by Organization Type and Geographic Region ............................... 123
Table 84: Human Capital Alignment by Organization Size ....................................................................... 124
Table 85: Human Capital Alignment by Vertical Service Market ............................................................. 124
Table 86: Human Capital Alignment by Vertical Service Market ............................................................. 125
Table 87: Workforce Age and Gender by Organization Type and Geographic Region ............................ 125
Table 88: Workforce Age and Gender by Organization Size .................................................................... 126
Table 89: Workforce Age and Gender by Vertical Service Market .......................................................... 126

© 2016 Service Performance Insight www.FinancialForce.com viii
Table 90: Workforce Age and Gender by Vertical Service Market .......................................................... 127
Table 91: Impact – Annual Employee Attrition – Voluntary .................................................................... 127
Table 92: Impact – Annual Employee Attrition – Involuntary.................................................................. 128
Table 93: Impact – Recommend to Family and Friends ........................................................................... 130
Table 94: Impact – Management-to-Employee Ratio .............................................................................. 130
Table 95: Impact – Time to Recruit and Hire for Standard Positions ...................................................... 131
Table 96: Impact – Time to Become Productive ..................................................................................... 132
Table 97: Impact – Guaranteed Training................................................................................................. 132
Table 98: Impact – Well-understood Career Path ................................................................................... 133
Table 99: Impact – Billable Utilization...................................................................................................... 134
Table 100: Target Billable Hours and Rates Comparison 2011-2015 All PS Markets and Geographies .. 135
Table 101: Target Billable Hours by Geography ....................................................................................... 136
Table 102: Annual Hour Comparison by Organization Type .................................................................... 137
Table 103: Annual Hour Comparison by Region ...................................................................................... 137
Table 104: Annual Hour Comparison by Organization Size (< 100 employees) ....................................... 138
Table 105: Annual Hour Comparison by Organization Size (> 100 employees) ....................................... 138
Table 106: Annual Hour Comparison by Embedded Service Organization Type ..................................... 139
Table 107: Annual Hour Comparison by PS Market (IT & Management Consulting, Staffing) ................ 139
Table 108: Annual Hour Comparison by PS Market (Advertising, Arch./Engr., Other PS) ....................... 140
Table 109: Annual Hour Comparison by PS Market ................................................................................. 140
Table 110: Workforce Location by Organization Type and Geographic Region ...................................... 141
Table 111: Workforce Location by Organization Size .............................................................................. 141
Table 112: Workforce Location by Service Market Vertical .................................................................... 142
Table 113: Workforce Location by Service Market Vertical .................................................................... 142
Table 114: Service Execution Performance Pillar Mapped Against Service Maturity .............................. 143
Table 115: The Resource Management Maturity Model ......................................................................... 146
Table 116: Impact – Resource Management Strategy ............................................................................. 147
Table 117: PSA offers significant benefits ................................................................................................ 151
Table 118: Service Execution Pillar 5-year trend ..................................................................................... 152
Table 119: Service Execution KPIs by Organization Type and Geographic Region .................................. 153
Table 120: Service Execution KPIs by Organization Size .......................................................................... 154
Table 121: Service Execution KPIs by Vertical Service Market................................................................. 155
Table 122: Service Execution KPIs by Vertical Service Market................................................................. 156

© 2016 Service Performance Insight www.FinancialForce.com ix
Table 123: Impact – No. of Concurrent Projects Managed by Project Mgr. ............................................ 157
Table 124: Impact – Project Team Size (people) ...................................................................................... 157
Table 125: Impact – Project Duration ...................................................................................................... 158
Table 126: Impact – On-time Delivery ..................................................................................................... 159
Table 127: Impact – Project Cancellation ................................................................................................ 160
Table 128: Impact – Average Project Overrun ......................................................................................... 161
Table 129: Impact – Standardized Delivery Methodology Use ................................................................ 161
Table 130: Impact – Resource Management Effectiveness ..................................................................... 162
Table 131: Impact – Effectiveness of estimating processes and reviews ................................................ 162
Table 132: Impact – Effectiveness of change control processes ............................................................. 163
Table 133: Impact – Effectiveness of Project Quality Processes ............................................................. 164
Table 134: Impact – Effectiveness of Knowledge Management processes ............................................. 164
Table 135: Finance and Operations Performance Pillar Maturity ........................................................... 165
Table 136: Finance and Operations Pillar 5-year trend ........................................................................... 166
Table 137: Planning and Budgeting Maturity Model™ ............................................................................ 168
Table 138: Finance and Operations KPIs by Organization Type and Geographic Region ........................ 169
Table 139: Finance and Operations KPIs by Organization Size ................................................................ 170
Table 140: Finance and Operations KPIs by Vertical Service Market ...................................................... 171
Table 141: Finance and Operations KPIs by Vertical Service Market ...................................................... 172
Table 142: Bill Rate Summary – All PS Markets and Geographies ........................................................... 173
Table 143: Steps Taken to Improve Profitability Comparison: 2014-2015 ............................................. 174
Table 144: Published Bill Rate Comparisons: 2008 to 2015 .................................................................... 174
Table 145: Impact – Revenue per Billable Consultant ............................................................................. 175
Table 146: Impact – Annual Revenue per Employee ............................................................................... 176
Table 147: Impact – Revenue per Project Comparison............................................................................ 177
Table 148: Impact – Project Margin – Time and Expense Projects .......................................................... 179
Table 149: Impact – Project Margin – Fixed Price Projects ...................................................................... 179
Table 150: Impact – Project Margin – Subcontractors/Offshore ............................................................. 180
Table 151: Impact – Quarterly Revenue Target in Backlog ...................................................................... 181
Table 152: Impact – Percentage of annual target revenue achieved ...................................................... 181
Table 153: Impact – Percentage of Annual Target Margin Achieved ...................................................... 182
Table 154: Impact – Revenue Leakage ..................................................................................................... 183
Table 155: Invoices Redone due to Errors or Client Rejections ............................................................... 184
© 2016 Service Performance Insight www.FinancialForce.com x
Table 156: Days Sales Outstanding (DSO) ................................................................................................ 184
Table 157: Percentage of Billable Work Written-Off ............................................................................... 186
Table 158: Real-Time Visibility ................................................................................................................. 187
Table 159: Income Statement by Organization Type and Embedded Service Type ................................ 188
Table 160: Income Statement by Organization Size ................................................................................ 189
Table 161: Income Statement by PS Market Vertical .............................................................................. 190
Table 162: Income Statement by PS Market Vertical .............................................................................. 191
Table 163: Minimum Normalized Performance Pillar Scores .................................................................. 195
Table 164: Average Service Maturity by PSO Size (People) ..................................................................... 197
Table 165: Average Service Maturity by PSO Type .................................................................................. 197
Table 166: Average Service Maturity by Vertical Market ........................................................................ 198
Table 167: Key Performance Indicators (KPIs) by Maturity Levels .......................................................... 199
Table 168: Lexicon of Acronyms and Abbreviations ................................................................................ 206
Table 169: Standard Key Performance Indicator (KPI) Definitions .......................................................... 207

© 2016 Service Performance Insight www.FinancialForce.com xi
Report Sponsorship by FinancialForce
FinancialForce is proud to sponsor Service Performance Insight’s PS Maturity™ Benchmark Report. This
important industry report always sheds light on important trends and insights in the professional
services world, and is the industry standard for Professional Services benchmarking. Both current and
prospective FinancialForce customers leverage this report to compare their own performance against
other leading service-driven organizations, helping them to identify problems before they arise and
identify opportunities to drive improvement.
FinancialForce Professional Services Automation (PSA) customers are consistently top performers and
we are proud that two of our customers, CodeScience Inc. and Fruition Partners, are among this year’s
“Best of the Best” (the top 5% globally).
For the fifth year in a row, the report continues to show that PSA solutions are a must-have for the
professional services industry’s top performing organizations. Those organizations that use a PSA
solution achieved over 10% revenue growth and average net profit increase from 13.2% in 2014 to
15.5% in 2015.
That being said, major leading indicators such as the size of the sales pipeline, bid to win ratios and
backlog were all down sharply in 2015. At the same time, voluntary and involuntary attrition has risen to
12.9%, the highest level since the recession. This means it’s vital for leading edge firms to continually
evaluate best practices and optimize their business to ensure customer satisfaction and retention.
We hope that this eye-opening industry data helps you in your mission to improve your own
organization’s performance. We would enjoy the chance to learn more about the challenges your
company is facing and discuss how we can help you join our customers in being the “best-of-best” in the
industry. We look forward to speaking with you.
Sincerely,
Lori Ellsworth
General Manager, PSA Applications
FinancialForce.com
Americas: 1-866-743-2220
UK: 0808 2389791
Rest of World: +44 1423 532832

2016 Professional Services Maturity™ Benchmark
© 2016 Service Performance Insight www.FinancialForce.com 1
1. Foreword
Service Performance Insight (SPI Research) is proud to introduce the ninth-annual Professional Services
Maturity™ Benchmark. For a decade we have researched, benchmarked and built a maturity model to:
Help professional services (PS) executives better understand how their organization compares
to others that are both similar in size and scope of work, as well as to the broader professional
services market; and,
Provide an objective, fact-based framework for performance improvements that helps pinpoint
the areas that will provide the greatest impact.
In 2007, SPI Research developed the PS Maturity Model™ as a strategic planning and management
framework. It is now the industry-leading performance improvement tool used by over 10,000 service
and project-oriented organizations to chart their course to service excellence.
It starts with the benchmark
Each year SPI Research collects data on approximately 200 key performance indicators across all aspects
of professional services organizations. Many benchmarks focus solely on financial metrics, but do not
delve deeper into the root causes impacting those metrics. SPI Research believes each component of a
professional services organization can both positively and negatively impact performance, cash flow and
ultimately profit. The
purpose of this
benchmark is to provide
a holistic view of all
aspects of PS
performance and how
subtle changes in one
area, for example,
revenue growth, impact
all other areas.
The PS Maturity™
model helps executives
compare and analyze
their own performance so they can build consensus around the actions to take, and where to start,
while quantifying the benefits of change. Analyzing the benchmark data by vertical market, geographic
region and organization size gives PS executives an accurate comparison to their peers and the market
at large. Over 2,000 firms have completed SPI’s benchmarking surveys over the past nine years.
Table 1: Five-year PS Key Performance Metrics
Key Performance Indicator (KPI) 2011 2012 2013 2014 2015
Annual PS revenue growth 13.7% 11.5% 10.0% 10.0% 10.2%
Annual PS headcount growth 10.1% 8.9% 7.5% 8.1% 7.8%
Percentage of billable personnel 74.2% 75.2% 71.2% 75.1% 70.4%
Employee Attrition 7.4% 7.2% 8.3% 8.9% 12.9%
Annual revenue per consultant (k) $197 $206 $193 $197 $198
Annual revenue per employee (k) $167 $168 $155 $167 $157
Profit (EBITDA %) 13.5% 16.8% 11.4% 13.2% 15.5%
Source: Service Performance Insight, February 2016

2016 Professional Services Maturity™ Benchmark
© 2016 Service Performance Insight www.FinancialForce.com 2
Change is constant in professional services with each year bringing new geopolitical, socioeconomic and
technology disruption. After all, without disruption and change, professional services would not exist
because clients would not need expert help to navigate new opportunities and landmines. Over the
past nine years of benchmarking, Service Performance Insight has seen great change in the marketplace,
particularly in the ever growing adoption of integrated, cloud-based business applications which have
helped firms squeeze ever higher levels of productivity and profit out of this labor-based business. Ten
years ago, who could have predicted the growth in social, mobile, analytics and cloud (SMAC)
technologies which have transformed entire business segments and empowered individuals and line of
business executives with unprecedented information access and control?
This year’s survey reached more than twice as many respondents compared to all previous years. This
means the depth, breadth and accuracy of the benchmark continues to expand. This edition, based on a
much larger data set, includes expanded vertical market coverage including VARs (Value Added
Resellers); Managed Service providers; Research and Development and Staffing. We have significantly
improved the statistical depth and data validity for architects and engineers, accountancies and
marketing and advertising firms. We also garnered input from a host of new PS segments such as
contract research and engineering services. Every year SPI Research has worked to broaden the survey
to reach more geographic regions so that it truly represents a worldwide performance survey. While we
have not achieved all of our goals, we still feel as though this benchmark is the gold industry standard. It
is used by well over 10,000 billable professional services organizations to benchmark their operations
and gain insight into ways they can improve.
Productivity improvements
are critical in professional
services. As the global
economy sluggishly grows at
less than 2%, organizations
in every industry are having
to work harder to achieve
higher productivity, without
adding substantial cost.
Every year, PS revenue
growth exceeds headcount
growth, meaning the
industry as a whole is
continually ratcheting up
output. This year, although
top-line revenue growth was
still strong, headcount growth slowed significantly in large part due to a growing talent shortage. To
combat the lack of skilled consultants, firms are using a host of creative recruiting and skill-building
strategies to wring ever higher levels of efficiency from their workforces.
Figure 1: Annual PS Revenue Growth vs. Headcount Growth
Source: Service Performance Insight, February 2016

2016 Professional Services Maturity™ Benchmark
© 2016 Service Performance Insight www.FinancialForce.com 3
2015 Wrap-up
In last year’s benchmark, we characterized 2014 as a Goldilocks year – “not too hot, not too cold, just
right”. In 2015 the positive trend continued with greater than 10% revenue growth and higher net
profits but cracks in the foundation started to appear. Based on a much larger global sample survey
size, we saw declines in most of the major leading indicators – revenue from new clients, size of the
sales pipeline, backlog, bid-to-win ratios and significantly higher attrition. PSOs have increased the mix
of non-billable to billable headcount, perhaps adding in unaffordable overhead. By geography, the
Americas outperformed all other regions but with a big stock market correction and a major presidential
election, 2016 growth could be tepid. The PS market in Asia Pacific continues to expand but this region
is starting to feel the effects of a growing talent shortage accompanied by a slowdown in China’s
voracious growth. EMEA reported the worst performance, plagued by Eurozone uncertainty, refugees
and terrorism, it was a relatively tough year across all European markets including PS. 2016 appears to
be fraught with growing geopolitical and socioeconomic issues which will slow PS growth, however, the
sector as a whole will continue to outperform most industries. Fasten your seat belts, lock your doors
and double-down scrutiny of sales forecasts and discretionary spending. With these precautions, your
PS business should continue to thrive.
Where did the new clients go?
A key indicator of the strength and vitality of the professional services market is the percentage of
revenue from new clients. Unfortunately, new client revenue has declined to the lowest level we have
seen in the past nine years. Without an injection of new client revenue, PS growth is limited to mining
the installed base. Overtime, the potential at even the largest accounts diminishes. Without new
market growth, firms and consultant skills languish while existing clients may become complacent. The
percentage of revenue
from new clients is a very
important forward-looking
measurement. In 2016 as
market uncertainty
increases, PS organizations
should carefully watch this
metric. PSOs should act
now to expand their
markets, clients and service
portfolio to preempt
revenue erosion.
Figure 2: New Client Penetration
Source: Service Performance Insight, February 2016

2016 Professional Services Maturity™ Benchmark
© 2016 Service Performance Insight www.FinancialForce.com 4
Competition intensifies
A powerful indication of
increasing competition is
the bid-to-win ratio. This
metric measures the
number of winning bids or
proposals out of every 10
submitted. It is certainly
correlated with the size of
the sales pipeline and sales
effectiveness. Lower bid-
to-win ratios portray
heightened competition but
may also be a symptom of
underlying sales and
marketing issues. Strategies
to improve bid-to-win
ratios should start with a reexamination of market positioning and service packaging. Do target buyers
know about your firm? Do current clients provide a rich source of referrals and repeat business or are
they lukewarm on the value you provide? What is the common element in the deals you win? Lose?
How can you improve your hit ratio? Should you more carefully scrub your sales pipeline to remove
unreliable long shots?
Employee attrition is rising
In 2015 SPI Research asked
firms to report both
voluntary and involuntary
attrition rates which were as
follows:
Voluntary: 7.8%
Involuntary: 5.1%
It is likely answers for
previous years were only for
voluntary attrition.
Regardless, we know that
attrition is rising
dramatically. This is
undoubtedly one of the
Figure 3: Bid-to-win Ratio
Source: Service Performance Insight, February 2016
Figure 4: Employee Attrition
Source: Service Performance Insight, February 2016
2016 Professional Services Maturity™ Benchmark
© 2016 Service Performance Insight www.FinancialForce.com 5
most important metrics, as the cost to replace a valuable employee is in excess of $150,000.
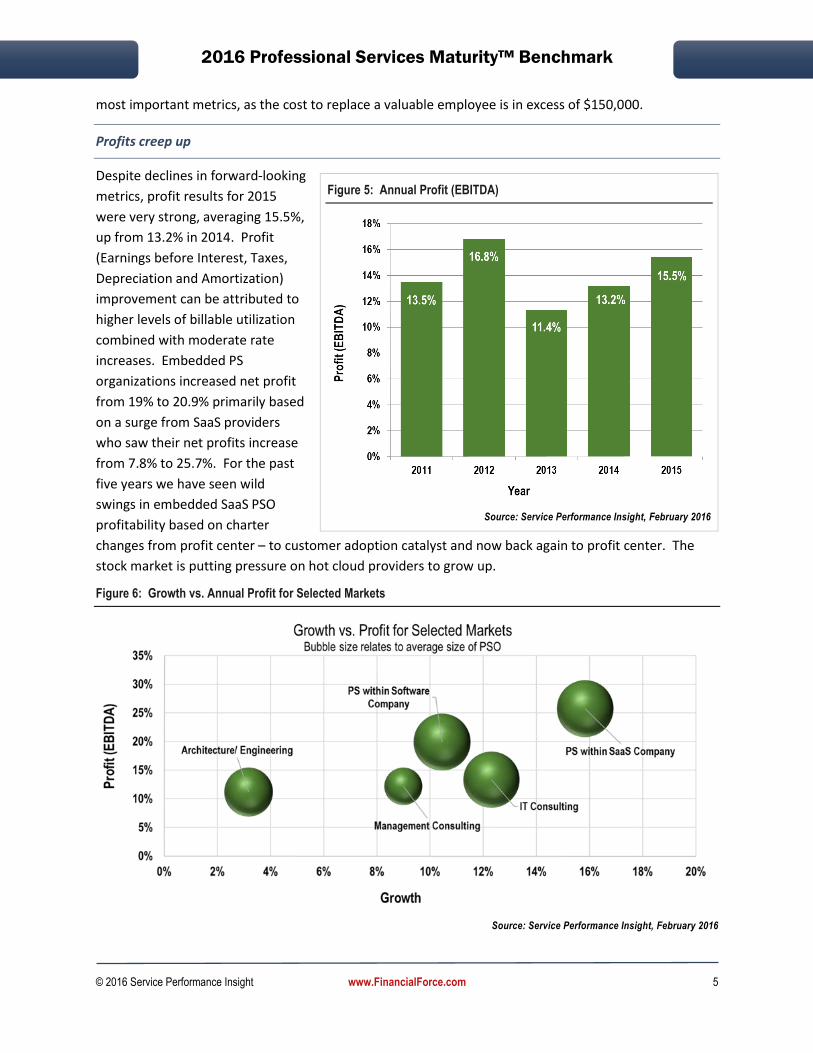
Profits creep up
Despite declines in forward-looking
metrics, profit results for 2015
were very strong, averaging 15.5%,
up from 13.2% in 2014. Profit
(Earnings before Interest, Taxes,
Depreciation and Amortization)
improvement can be attributed to
higher levels of billable utilization
combined with moderate rate
increases. Embedded PS
organizations increased net profit
from 19% to 20.9% primarily based
on a surge from SaaS providers
who saw their net profits increase
from 7.8% to 25.7%. For the past
five years we have seen wild
swings in embedded SaaS PSO
profitability based on charter
changes from profit center – to customer adoption catalyst and now back again to profit center. The
stock market is putting pressure on hot cloud providers to grow up.
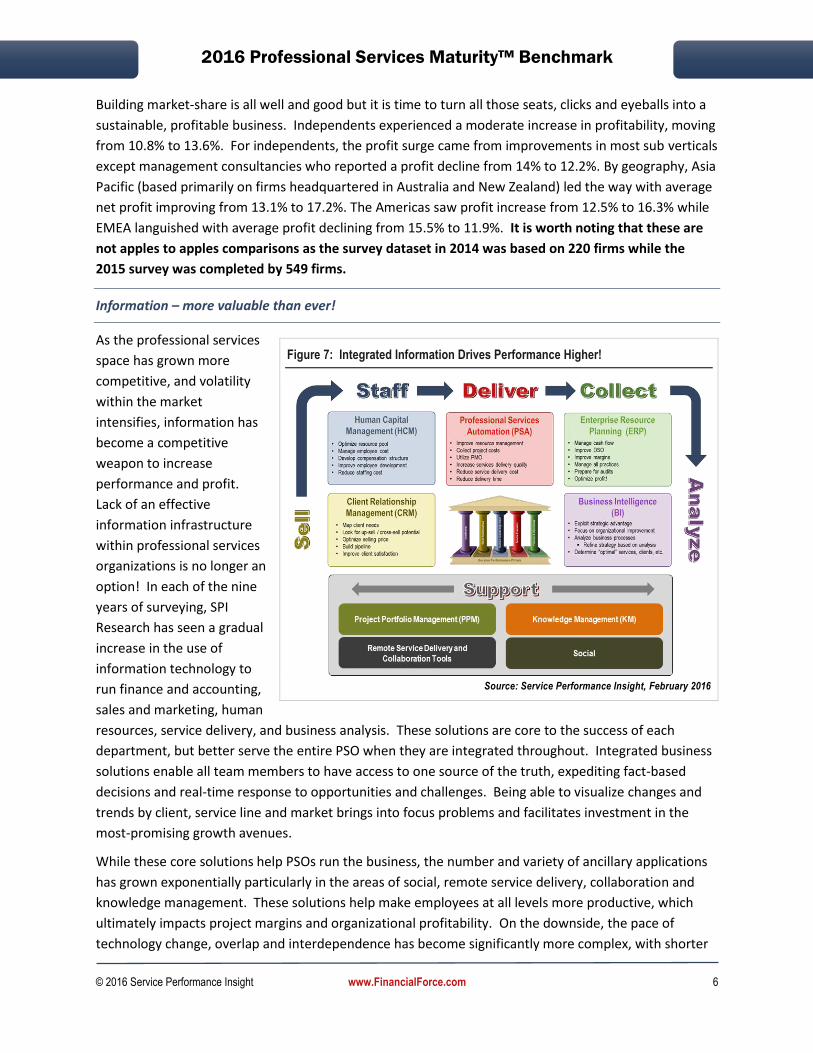
Figure 6: Growth vs. Annual Profit for Selected Markets
Source: Service Performance Insight, February 2016
Figure 5: Annual Profit (EBITDA)
Source: Service Performance Insight, February 2016
2016 Professional Services Maturity™ Benchmark
© 2016 Service Performance Insight www.FinancialForce.com 6
Building market-share is all well and good but it is time to turn all those seats, clicks and eyeballs into a
sustainable, profitable business. Independents experienced a moderate increase in profitability, moving
from 10.8% to 13.6%. For independents, the profit surge came from improvements in most sub verticals
except management consultancies who reported a profit decline from 14% to 12.2%. By geography, Asia
Pacific (based primarily on firms headquartered in Australia and New Zealand) led the way with average
net profit improving from 13.1% to 17.2%. The Americas saw profit increase from 12.5% to 16.3% while
EMEA languished with average profit declining from 15.5% to 11.9%. It is worth noting that these are
not apples to apples comparisons as the survey dataset in 2014 was based on 220 firms while the
2015 survey was completed by 549 firms.
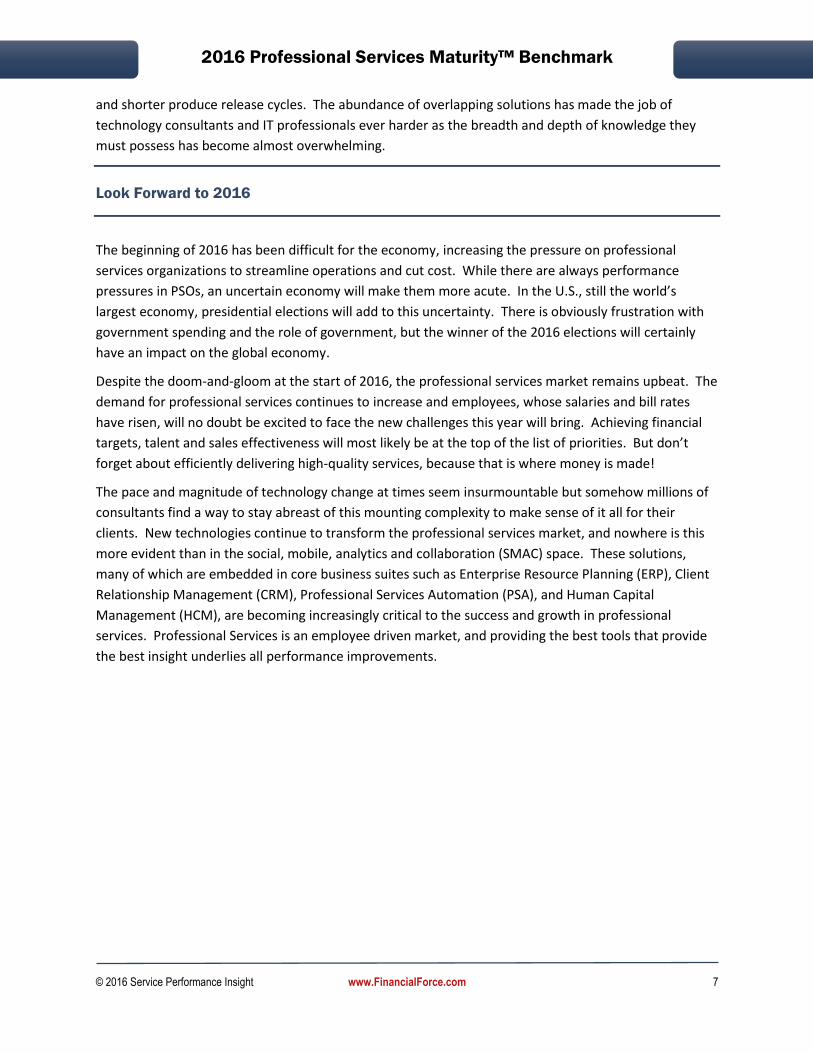
Information – more valuable than ever!
As the professional services
space has grown more
competitive, and volatility
within the market
intensifies, information has
become a competitive
weapon to increase
performance and profit.
Lack of an effective
information infrastructure
within professional services
organizations is no longer an
option! In each of the nine
years of surveying, SPI
Research has seen a gradual
increase in the use of
information technology to
run finance and accounting,
sales and marketing, human
resources, service delivery, and business analysis. These solutions are core to the success of each
department, but better serve the entire PSO when they are integrated throughout. Integrated business
solutions enable all team members to have access to one source of the truth, expediting fact-based
decisions and real-time response to opportunities and challenges. Being able to visualize changes and
trends by client, service line and market brings into focus problems and facilitates investment in the
most-promising growth avenues.
While these core solutions help PSOs run the business, the number and variety of ancillary applications
has grown exponentially particularly in the areas of social, remote service delivery, collaboration and
knowledge management. These solutions help make employees at all levels more productive, which
ultimately impacts project margins and organizational profitability. On the downside, the pace of
technology change, overlap and interdependence has become significantly more complex, with shorter
Figure 7: Integrated Information Drives Performance Higher!
Source: Service Performance Insight, February 2016
2016 Professional Services Maturity™ Benchmark
© 2016 Service Performance Insight www.FinancialForce.com 7
and shorter produce release cycles. The abundance of overlapping solutions has made the job of
technology consultants and IT professionals ever harder as the breadth and depth of knowledge they
must possess has become almost overwhelming.
Look Forward to 2016
The beginning of 2016 has been difficult for the economy, increasing the pressure on professional
services organizations to streamline operations and cut cost. While there are always performance
pressures in PSOs, an uncertain economy will make them more acute. In the U.S., still the world’s
largest economy, presidential elections will add to this uncertainty. There is obviously frustration with
government spending and the role of government, but the winner of the 2016 elections will certainly
have an impact on the global economy.
Despite the doom-and-gloom at the start of 2016, the professional services market remains upbeat. The
demand for professional services continues to increase and employees, whose salaries and bill rates
have risen, will no doubt be excited to face the new challenges this year will bring. Achieving financial
targets, talent and sales effectiveness will most likely be at the top of the list of priorities. But don’t
forget about efficiently delivering high-quality services, because that is where money is made!
The pace and magnitude of technology change at times seem insurmountable but somehow millions of
consultants find a way to stay abreast of this mounting complexity to make sense of it all for their
clients. New technologies continue to transform the professional services market, and nowhere is this
more evident than in the social, mobile, analytics and collaboration (SMAC) space. These solutions,
many of which are embedded in core business suites such as Enterprise Resource Planning (ERP), Client
Relationship Management (CRM), Professional Services Automation (PSA), and Human Capital
Management (HCM), are becoming increasingly critical to the success and growth in professional
services. Professional Services is an employee driven market, and providing the best tools that provide
the best insight underlies all performance improvements.

2016 Professional Services Maturity™ Benchmark
© 2016 Service Performance Insight www.FinancialForce.com 8
2. The Professional Services Maturity™ Model
SPI Research has spent the past nine years benchmarking varying levels of operational control or process
“maturity” to determine the characteristics and appropriate behaviors for PSOs based on their
organizational lifecycle stage. The primary questions SPI Research was seeking to answer when the PS
Maturity™ Benchmark was first conceived remain our primary focus today:
What are the most important focus areas for professional service organizations (PSOs) as their
businesses mature?
What is the optimum level of maturity or control at each phase of an organization’s lifecycle?
Can diagnostic tools be built for assessing and determining the health of key business
processes?
Are there key business characteristics and behaviors that spell the difference between success
and failure?
The original concept behind the SPI Research’s PS Maturity Model™ was to investigate whether
increasing levels of
standardization in operating
processes and management
controls improve financial
performance. The 2016 PS
Maturity™ Benchmark
demonstrates that increasing
levels of business process
maturity do indeed result in
significant performance
improvements (Table 2).
In fact, SPI Research found that
high levels of performance
have far more to do with
leadership focus,
organizational alignment, effective business processes and disciplined execution than "time in
grade." Relatively young and fast-growing organizations can and do demonstrate surprisingly high
levels of maturity and performance excellence if their charters are clear.
Further improvements accrue when their goals and measurements are aligned with their mission, and
they make the investments they need in talent and systems to provide visibility and appropriate levels of
business control. Of course, it certainly helps if they are also well-positioned within a fast-growing
market.
The core tenet of the PS Maturity Model™ is service and project-oriented organizations achieve success
through the optimization of five Service Performance Pillars™:
Table 2: Maturity Matters!
Key Performance Measurement Maturity Level 1-2
Maturity Level 3
Maturity Level 4-5
Percentage of respondents 55% 25% 20%
Year-over-year change in PS revenue 2.1% 8.5% 23.5%
Deal pipeline relative to qtr. bookings forecast
140% 186% 229%
Employee billable utilization 66.1% 72.7% 78.0%
Projects delivered on-time 69.7% 79.6% 85.0%
Annual rev. per billable consultant (k) $144 $231 $251
Annual revenue per employee (k) $112 $185 $202
PS EBITDA 2.1% 8.5% 23.5%
Source: Service Performance Insight, February 2016
2016 Professional Services Maturity™ Benchmark
© 2016 Service Performance Insight www.FinancialForce.com 9
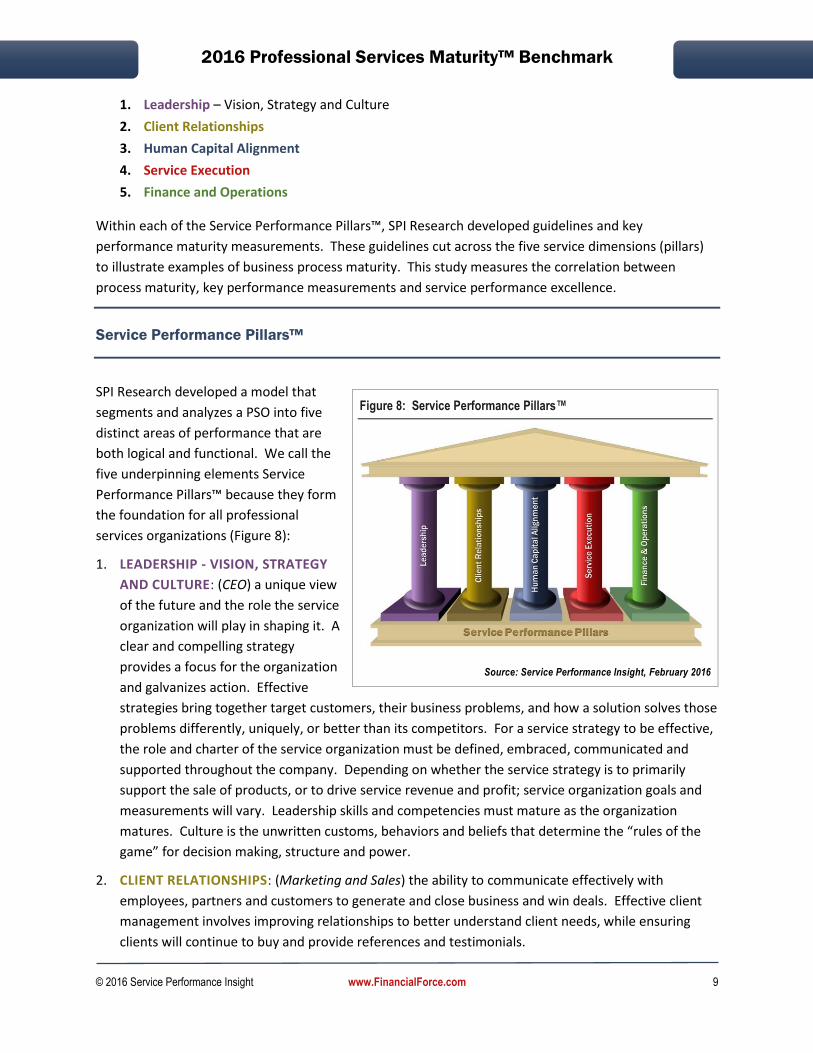
1. Leadership – Vision, Strategy and Culture
2. Client Relationships
3. Human Capital Alignment
4. Service Execution
5. Finance and Operations
Within each of the Service Performance Pillars™, SPI Research developed guidelines and key
performance maturity measurements. These guidelines cut across the five service dimensions (pillars)
to illustrate examples of business process maturity. This study measures the correlation between
process maturity, key performance measurements and service performance excellence.
Service Performance Pillars™
SPI Research developed a model that
segments and analyzes a PSO into five
distinct areas of performance that are
both logical and functional. We call the
five underpinning elements Service
Performance Pillars™ because they form
the foundation for all professional
services organizations (Figure 8):
1. LEADERSHIP - VISION, STRATEGY
AND CULTURE: (CEO) a unique view
of the future and the role the service
organization will play in shaping it. A
clear and compelling strategy
provides a focus for the organization
and galvanizes action. Effective
strategies bring together target customers, their business problems, and how a solution solves those
problems differently, uniquely, or better than its competitors. For a service strategy to be effective,
the role and charter of the service organization must be defined, embraced, communicated and
supported throughout the company. Depending on whether the service strategy is to primarily
support the sale of products, or to drive service revenue and profit; service organization goals and
measurements will vary. Leadership skills and competencies must mature as the organization
matures. Culture is the unwritten customs, behaviors and beliefs that determine the “rules of the
game” for decision making, structure and power.
2. CLIENT RELATIONSHIPS: (Marketing and Sales) the ability to communicate effectively with
employees, partners and customers to generate and close business and win deals. Effective client
management involves improving relationships to better understand client needs, while ensuring
clients will continue to buy and provide references and testimonials.
Figure 8: Service Performance Pillars™
Source: Service Performance Insight, February 2016

2016 Professional Services Maturity™ Benchmark
© 2016 Service Performance Insight www.FinancialForce.com 10
3. HUMAN CAPITAL ALIGNMENT: (Human Resources) the ability to attract, hire, retain and motivate
a high quality consulting staff. With changing workforce demographics, talent management has
increased in importance. High-caliber employees represent the essence, brand and reputation of
the firm. PSOs are starting to adopt hybrid on and off-site staffing models which put increased
pressure on customer-facing staff to develop client relationships and more carefully define client
requirements. Demands for career planning, skill development and flexible work options have
intensified.
4. SERVICE EXECUTION: (Engagement/Delivery) the methodologies, processes and tools to effectively
schedule, deploy and measure the quality of the service delivery process. Service execution involves
a number of factors: from resource management, to delivering projects in a predictable and
acceptable time frame, to reducing cost while improving project quality and harvesting knowledge.
Processes include resource management, project planning and quality control, knowledge
management and methodology and tool development.
5. FINANCE AND OPERATIONS: (CFO) the ability to manage services profit and loss — to generate
revenue and profit while developing repeatable operating processes. The finance and operations
pillar focuses on revenue, margin and cost and the financial, contractual and IT operating processes
and controls required to run a profitable and predictable business.
Professional Services Maturity™ Model Benchmark Levels
The model is built on the same
foundation as the Capability
Maturity Model (CMM), which
has been adopted for software
development; but is specifically
targeted toward billable PSOs,
that either exclusively sell and
execute professional services or
complement the sale of products
with services. Figure 9 depicts
maturity level progression and
outlines primary characteristics
for each maturity level:
∆ LEVEL 1 — INITIATED “HEROIC”: (APPROXIMATELY 30% OF PSOS) at maturity Level 1,
processes are ad hoc and fluid. The business environment is chaotic and opportunistic, and the
focus for a PSO is primarily on new client acquisition and reference building. Often professional
service employees at this level are chameleons — able to provide presales support one day and
develop interfaces and product workarounds the next. Success depends on the competence and
heroics of people in the organization, and not on the use of proven processes, methods or tools.
Figure 9: Services Maturity™ Model Levels
Source: Service Performance Insight, February 2016

2016 Professional Services Maturity™ Benchmark
© 2016 Service Performance Insight www.FinancialForce.com 11
Practices and procedures are informal and quality is based on individual experience and aptitude.
Level 1 organizations are often characterized as “informal” and “heroic”.
∆ LEVEL 2 — PILOTED “FUNCTIONAL EXCELLENCE”: (APPROXIMATELY 25% OF PSOS) at
maturity level 2, processes have started to become repeatable. Best practices may be
demonstrated in discrete functional areas or geographies but they are not yet documented and
codified for the entire organization. Basic processes have been established for the five Professional
Services Performance Pillars, but they are not yet universally embraced. Operational excellence
and best practices may be discerned within functions but not across functions. By Level 2
individual Functional Excellence should have emerged in key areas.
∆ LEVEL 3 — DEPLOYED “PROJECT EXCELLENCE”: (APPROXIMATELY 25% OF PSOS) at maturity
level 3, the PSO has created a set of standard processes and operating principles for all major
service performance pillars but renegades and “hold-outs” may still exist. Management has
established and started to enforce financial and quality objectives on a global basis. Processes have
been established to focus on effective execution and there is spotlight on alignment between and
across functions. By level 3 project delivery methodologies and quality measurements are in place
and enforced across the organization. Level 3 organizations should exhibit “Project Excellence”
with a consistent, repeatable project delivery methodology.
∆ LEVEL 4 — INSTITUTIONALIZED “PORTFOLIO EXCELLENCE”: (APPROXIMATELY 15% OF
PSOS) at maturity level 4, management uses precise measurements, metrics and controls, to
effectively manage the PSO. Each service performance pillar contains a detailed set of operating
principles, tools and measurements. Organizations at this level set quantitative and qualitative
goals for customer acquisition, retention and penetration, in addition to a complete set of financial
and quality operating controls and measurements. Processes are aligned to achieve leverage. The
portfolio is balanced with a focus on project selection and execution. Level 4 organizations should
exhibit “Portfolio Excellence”.
∆ LEVEL 5 — OPTIMIZED “COLLABORATIVE”: (APPROXIMATELY 5% OF PSOS) at maturity level
5 executives focus on continual improvement of all elements of the five performance pillars. A
disciplined, controlled process is in place to measure and optimize performance through both
incremental and innovative technological improvements. Quantitative process-improvement
objectives for the organization are established. They are continually revised to reflect changing
business objectives, and used as criteria in managing process improvement. Initiatives are in place
to ensure quality, cost control and client acquisition. The rough edges between disciplines,
functions, and specialties have been smoothed to ensure unique problems can be addressed
quickly without excessive bureaucracy or functional silos. Level 5 organizations are visionary and
collaborative both internally and with clients and external business partners.
2016 Professional Services Maturity™ Benchmark
© 2016 Service Performance Insight www.FinancialForce.com 12
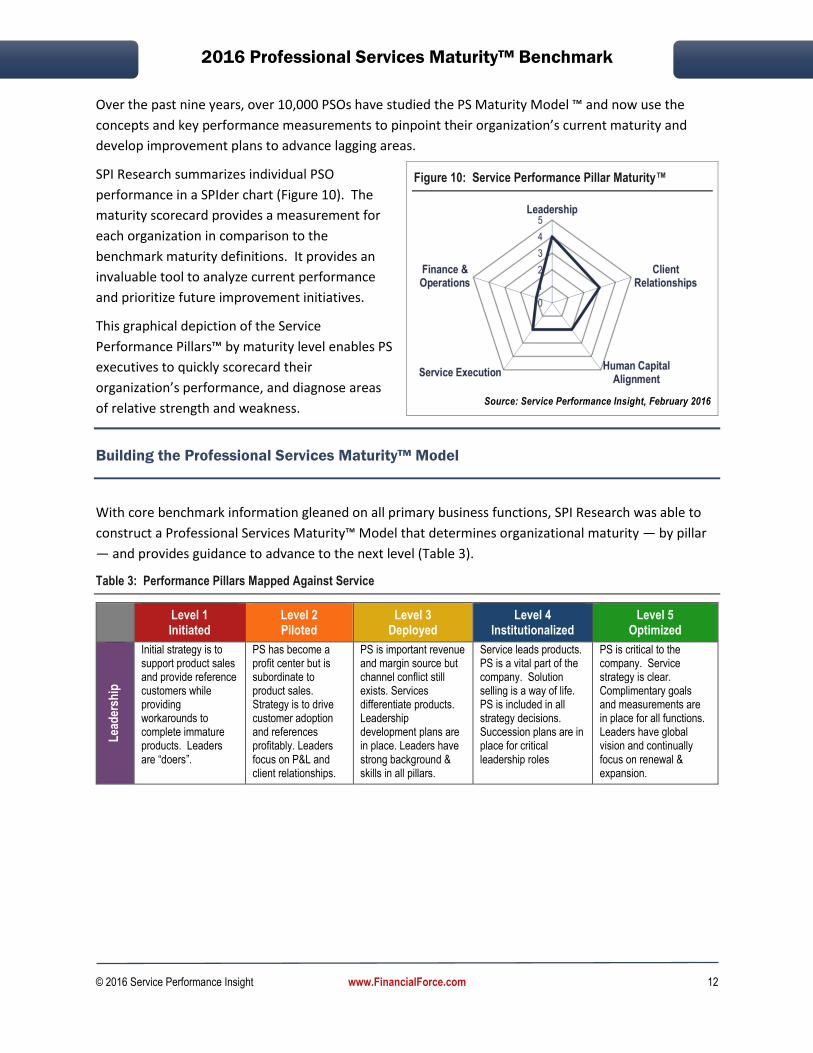
Over the past nine years, over 10,000 PSOs have studied the PS Maturity Model ™ and now use the
concepts and key performance measurements to pinpoint their organization’s current maturity and
develop improvement plans to advance lagging areas.
SPI Research summarizes individual PSO
performance in a SPIder chart (Figure 10). The
maturity scorecard provides a measurement for
each organization in comparison to the
benchmark maturity definitions. It provides an
invaluable tool to analyze current performance
and prioritize future improvement initiatives.
This graphical depiction of the Service
Performance Pillars™ by maturity level enables PS
executives to quickly scorecard their
organization’s performance, and diagnose areas
of relative strength and weakness.
Building the Professional Services Maturity™ Model
With core benchmark information gleaned on all primary business functions, SPI Research was able to
construct a Professional Services Maturity™ Model that determines organizational maturity — by pillar
— and provides guidance to advance to the next level (Table 3).
Table 3: Performance Pillars Mapped Against Service
Level 1 Initiated
Level 2 Piloted
Level 3 Deployed
Level 4 Institutionalized
Level 5 Optimized
Lea
der
ship
Initial strategy is to support product sales and provide reference customers while providing workarounds to complete immature products. Leaders are “doers”.
PS has become a profit center but is subordinate to product sales. Strategy is to drive customer adoption and references profitably. Leaders focus on P&L and client relationships.
PS is important revenue and margin source but channel conflict still exists. Services differentiate products. Leadership development plans are in place. Leaders have strong background & skills in all pillars.
Service leads products. PS is a vital part of the company. Solution selling is a way of life. PS is included in all strategy decisions. Succession plans are in place for critical leadership roles
PS is critical to the company. Service strategy is clear. Complimentary goals and measurements are in place for all functions. Leaders have global vision and continually focus on renewal & expansion.
Figure 10: Service Performance Pillar Maturity™
Source: Service Performance Insight, February 2016

2016 Professional Services Maturity™ Benchmark
© 2016 Service Performance Insight www.FinancialForce.com 13
Level 1 Initiated
Level 2 Piloted
Level 3 Deployed
Level 4 Institutionalized
Level 5 Optimized
Clie
nt
Rel
atio
nsh
ips
Opportunistic. No defined solution sets or Go to Market plan. Focus is on new customers and reference building. Individual heroics, no consistent sales, marketing or partnering plan or methodology. Ad hoc, one-off projects.
Start to use marketing to drive leads. Multiple sales models. Start investing in sales training, CRM & sales method-ology. Start measuring sales effectiveness & client satisfaction. Start developing partners and partner programs. Some level of proposal reviews and pricing control.
Marketing, inside sales, solution sales with defined solution sets. CRM integrated with financials and PSA. Deal, pricing and contract reviews. Partner plan and scorecard. Tight pricing and contract mgmt. controls. High levels of customer satisfaction.
CRM, PSA, ERP integration provides 360-degree view of client relationships. Business process, vertical and horizontal solutions. Vertical client centers of excellence. Top client and partner programs. Global contract and pricing management. Key partner relationships. Strong customer reference programs.
Executive relationships. Thought leadership. Brand building and awareness. High customer satisfaction. Integrated sales, marketing and partnering programs. High quality references.
Hu
man
Cap
ital
Alig
nm
ent
Hire as needed. Generalist skills. Chameleons, Jack of all Trades. Individual heroics. May perform presales as well as consulting delivery.
Begin forecasting workload. Start developing job and skill descriptions & compensation plans. Rudimentary career paths. Start measuring employee Satisfaction
Resource, skill and career management. Employee satisfaction surveys. Training plans. Goals and measurements aligned with compensation. Attrition <15%
Business process and vertical skills in addition to technical and project skills. Career ladder and mentoring programs. Training investments to support career. Low attrition, high satisfaction
Continually staff and train to meet future needs. Highly skilled, motivated workforce. Outsource commodity skills or peak demand. Sophisticated variable on and off-shore workforce model.
Ser
vice
Exe
cuti
on
No scheduling. Reactive. Ad hoc. Heroic. Scheduling by spreadsheet. No consistent project delivery methods. No project quality controls or knowledge management.
Skeleton methodology in place. Centralized resource mgmt. Initiating project mgmt. and technical skills. Starting to measure project satisfaction and harvest knowledge.
PSA deployed for resource and project management. Collaborative portal. Earned Value Analysis. Project dashboard. Global Project Management Office, project quality reviews and measurements. Effective change management.
Integrated project and resource management. Effective scheduling. Using portfolio management. Global PMO. Global project dashboard. Global Knowledge Management. Global resource management.
Integrated solutions. Continual checks and balances to assure superior utilization and bill rates. Complete visibility to global project quality. Multi-disciplinary resource management.
Fin
ance
an
d O
per
atio
ns
The PSO has been created but is not yet profitable. Rudimentary time & expense capture. Limited financial visibility and control. Unpredictable financial performance. Rudimentary contract management.
5 to 15% margin. PS becoming a profit center but still immature finance and operating processes. Investment in ERP and PSA to provide financial visibility. May not have real-time visibility or BI. Standard Library of Contracts and Statements of Work.
15 to 25% margin. PS operates as a tightly managed P&L. Standard methods for resource mgmt., time & expense mgmt., cost control & billing. In depth knowledge of all costs at the employee, sub-contractor & project level. Processes in place for contract management, legal and pricing decisions.
PS generates > 20% of overall company revenue & contributes > 30% margin.
Well-developed finance and operations processes and controls. Systems have been implemented for CRM, PSA, ERP and BI. IT integration and real-time visibility. Systems have been implemented for contract management, legal and pricing decisions.
> 30% margin. Continuous improvement and enhancement.
High profit. Integrated systems.
Global with disciplined process controls and optimization. Completely integrated financial, CRM, resource management, contracts and pricing systems, processes and controls.
Source: Service Performance Insight, February 2016

2016 Professional Services Maturity™ Benchmark
© 2016 Service Performance Insight www.FinancialForce.com 14
Why Maturity Matters
SPI Research believes wide support for the PS Maturity™ model is due to its holistic approach to
measuring performance. Maturity is determined through alignment and focus both within and across
functions. For example, although financial measurements are of primary importance they are equally
weighted and correlated with leadership and sales and quality measurements to ensure organizations
improve across all dimensions, not just in terms of financial performance. However, if the organization
is profit-motivated (which most are), increasing maturity levels do show up in significant bottom-line
profit. Figure 11 highlights major key performance measurements by maturity level, and should alone
be an important reason why PS executives should look deeper into using it to increase profits.
Figure 11: Professional Services Maturity™ Progression
Source: Service Performance Insight, February 2016
Pillar Importance and Organizational Maturity
The results and insights gained in the past seven years have confirmed SPI Research’s original hypothesis
that service organizations must develop a balanced and holistic approach to improving all aspects of
their business as they mature. SPI Research has discovered that the emphasis on individual service
pillar performance shifts as organizations mature. Excellence in only one particular service performance
pillar does not create overall organizational success – rather it is the appropriate balance and alignment
within and across performance pillars, which ultimately leads to sustainable success.
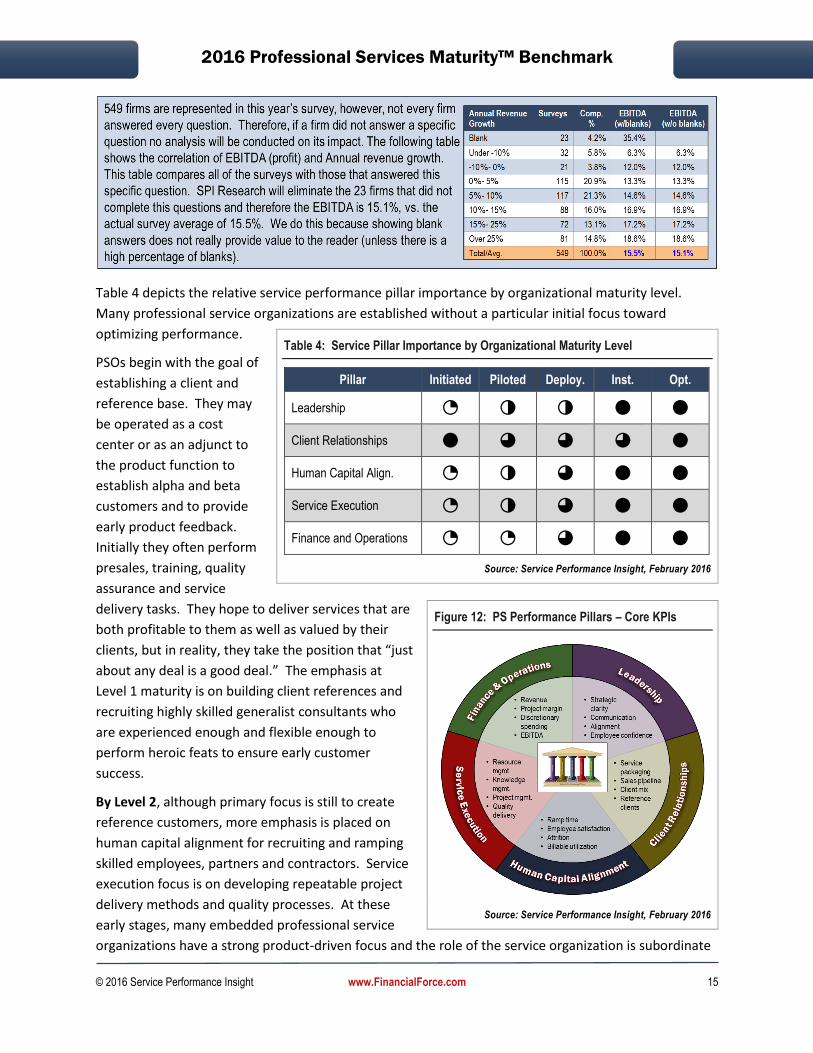
2016 Professional Services Maturity™ Benchmark
© 2016 Service Performance Insight www.FinancialForce.com 15
Table 4 depicts the relative service performance pillar importance by organizational maturity level.
Many professional service organizations are established without a particular initial focus toward
optimizing performance.
PSOs begin with the goal of
establishing a client and
reference base. They may
be operated as a cost
center or as an adjunct to
the product function to
establish alpha and beta
customers and to provide
early product feedback.
Initially they often perform
presales, training, quality
assurance and service
delivery tasks. They hope to deliver services that are
both profitable to them as well as valued by their
clients, but in reality, they take the position that “just
about any deal is a good deal.” The emphasis at
Level 1 maturity is on building client references and
recruiting highly skilled generalist consultants who
are experienced enough and flexible enough to
perform heroic feats to ensure early customer
success.
By Level 2, although primary focus is still to create
reference customers, more emphasis is placed on
human capital alignment for recruiting and ramping
skilled employees, partners and contractors. Service
execution focus is on developing repeatable project
delivery methods and quality processes. At these
early stages, many embedded professional service
organizations have a strong product-driven focus and the role of the service organization is subordinate
Table 4: Service Pillar Importance by Organizational Maturity Level
Pillar Initiated Piloted Deploy. Inst. Opt.
Leadership ◔ ◑ ◑ ● ● Client Relationships ● ◕ ◕ ◕ ● Human Capital Align. ◔ ◑ ◕ ● ● Service Execution ◔ ◑ ◕ ● ● Finance and Operations ◔ ◔ ◕ ● ●
Source: Service Performance Insight, February 2016
Figure 12: PS Performance Pillars – Core KPIs
Source: Service Performance Insight, February 2016
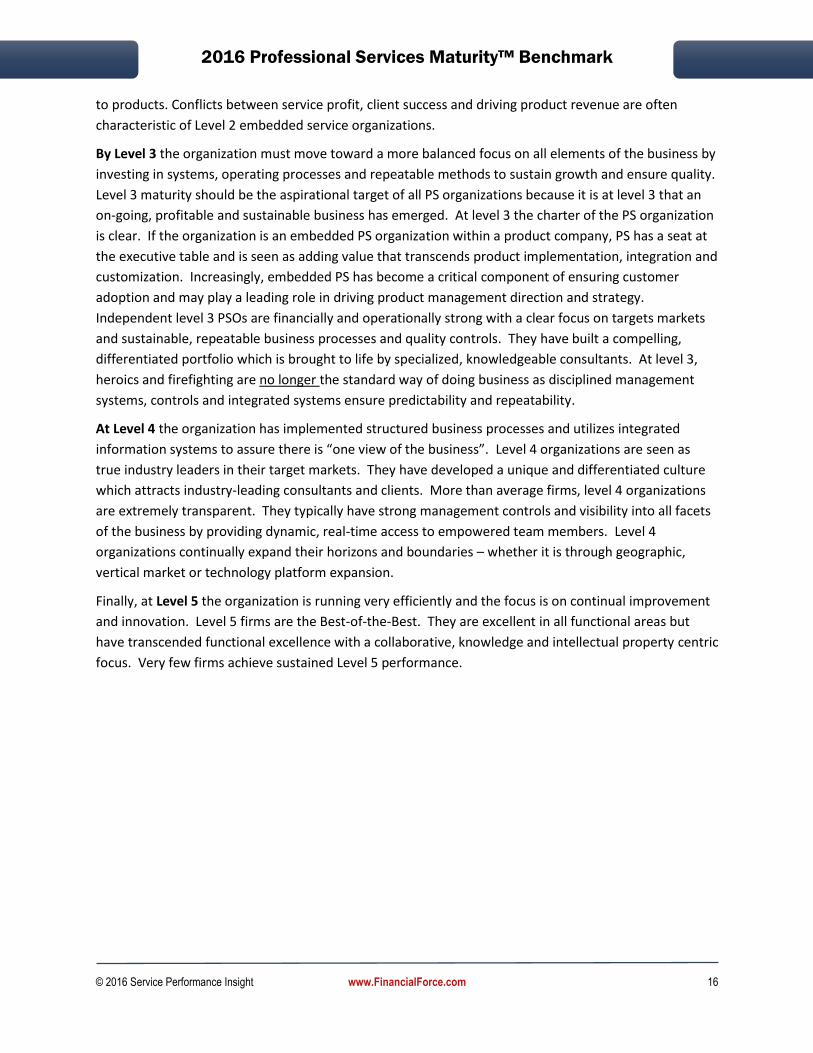
2016 Professional Services Maturity™ Benchmark
© 2016 Service Performance Insight www.FinancialForce.com 16
to products. Conflicts between service profit, client success and driving product revenue are often
characteristic of Level 2 embedded service organizations.
By Level 3 the organization must move toward a more balanced focus on all elements of the business by
investing in systems, operating processes and repeatable methods to sustain growth and ensure quality.
Level 3 maturity should be the aspirational target of all PS organizations because it is at level 3 that an
on-going, profitable and sustainable business has emerged. At level 3 the charter of the PS organization
is clear. If the organization is an embedded PS organization within a product company, PS has a seat at
the executive table and is seen as adding value that transcends product implementation, integration and
customization. Increasingly, embedded PS has become a critical component of ensuring customer
adoption and may play a leading role in driving product management direction and strategy.
Independent level 3 PSOs are financially and operationally strong with a clear focus on targets markets
and sustainable, repeatable business processes and quality controls. They have built a compelling,
differentiated portfolio which is brought to life by specialized, knowledgeable consultants. At level 3,
heroics and firefighting are no longer the standard way of doing business as disciplined management
systems, controls and integrated systems ensure predictability and repeatability.
At Level 4 the organization has implemented structured business processes and utilizes integrated
information systems to assure there is “one view of the business”. Level 4 organizations are seen as
true industry leaders in their target markets. They have developed a unique and differentiated culture
which attracts industry-leading consultants and clients. More than average firms, level 4 organizations
are extremely transparent. They typically have strong management controls and visibility into all facets
of the business by providing dynamic, real-time access to empowered team members. Level 4
organizations continually expand their horizons and boundaries – whether it is through geographic,
vertical market or technology platform expansion.
Finally, at Level 5 the organization is running very efficiently and the focus is on continual improvement
and innovation. Level 5 firms are the Best-of-the-Best. They are excellent in all functional areas but
have transcended functional excellence with a collaborative, knowledge and intellectual property centric
focus. Very few firms achieve sustained Level 5 performance.

2016 Professional Services Maturity™ Benchmark
© 2016 Service Performance Insight www.FinancialForce.com 17
3. Survey Demographics
For this benchmark, SPI Research surveyed 549 billable Professional Services Organizations (PSOs) from
September through December, 2015. The following sections outline the key markets which comprise
the global professional services industry and breakdown the 2015 survey demographics in a number of
key areas (market, organization size, and geographic region) to help PS firms compare their individual
results to the benchmark.
Vertical PS Markets — the North American Industry Classification System
SPI Research uses the North American Industry Classification System (NAICS) to analyze the services
market. The primary Professional Services designation is NAICS 54xx which defines PS sub-verticals as
“Those in this subsector engage in business processes where human capital is the major input. These
establishments provide the knowledge and skills of their employees, often on an assignment basis,
where an individual or team is responsible for the delivery of high value services to the client. The
individual industries of this subsector are defined on the basis of the particular expertise, training and
credentials of the services provider (Table 5)”.
Additional industry segments which generate substantial professional service revenue include software
(NAICS 5112); Data Services (NAICS 518) and Employment Services (NAICS 5613). Including these
segments, the US professional service industry generated approximately $2 trillion in revenue and
employed 12.5 million US-based workers. The US market represents roughly 60% of global professional
services revenue which leads to a global revenue estimate of $3.4 trillion, providing employment for
20.8 million professional service workers. These figures exclude revenues and PS employees in
telecommunications, financial services and healthcare services.
According to the 2015 US Census, professional, scientific, and technical services (NAICS 54xx) revenue
was $1.56 trillion, up 4.7 percent from 2014. Across the service industries, the fastest growing segments
in 2015 were employment services (recruiting and staffing) 11.4%; management consulting 11.3% and
accounting 10.4%. Two segments experienced market contraction from 2014 to 2015. Specialized
design service revenue declined -2.3% and architectural, engineering and related services declined -.7%.
Within professional services, the fastest growing and most vibrant segment is software and IT services.
There are more than 100,000 software and IT services companies in the United States, and more than 99
percent are small and medium-sized firms (i.e., under 500 employees). This total includes software
publishers, suppliers of custom computer programming services, computer systems design firms, and
facilities management companies. This segment of the PS industry draws on a highly educated and
skilled US-based workforce of nearly two million people.

2016 Professional Services Maturity™ Benchmark
© 2016 Service Performance Insight www.FinancialForce.com 18
Table 5: Vertical PS Markets — the North American Industry Classification System
Code Market Description
US Census
2015 Revenue
Employees (1,000s)
CAGR 2014-2015
5112 Software Software publishing, both public and private software companies. Total revenue is reported. PS typically represents ~ 20% of revenues.
$190.7B 386 3.6%
518 Data Services
Data processing, hosting and related services $104.5B 392 5.1%
5411 Legal
This industry is comprised of legal practitioners known as lawyers or attorneys (i.e., counselors-at-law) primarily engaged in the practice of law. Firms in this industry may provide a range of expertise or specialize in specific areas of law, such as criminal law, corporate law, family and estate planning, patent law, real estate law, or tax law.
$261.0B 1,114 4.8%
5412
Accounting/ Tax Prep/ Bookkeeping / Payroll
This industry comprises establishments primarily engaged in providing services, such as auditing and accounting, designing accounting systems, preparing financial statements, developing budgets, preparing tax returns, processing payrolls, bookkeeping, and billing. Accountants are certified to ensure they have and maintain competency in their field.
$163.4B 888 10.4%
5413
Architectural, Engineering and Related Services
This industry comprises establishments primarily engaged in planning and designing residential, institutional, leisure, commercial, and industrial buildings and structures by applying knowledge of design, construction procedures, zoning regulations, building codes, and building materials.
$223.5B 1,277 -0.7%
5414 Specialized Design Services
This industry group comprises establishments providing specialized design services (except architectural, engineering, and computer systems design).
$20.98B 111 -2.3%
5415
Computer Systems Design Services Related Services
(IT Consulting) – This industry comprises establishments primarily engaged in providing expertise in the field of information technologies through one or more of the following activities: (1) writing, modifying, testing, and supporting software to meet the needs of a particular customer; (2) planning and designing computer systems that integrate computer hardware, software, and communication technologies; (3) on-site management and operation of clients' computer systems and/or data processing facilities; and (4) other professional and technical computer-related advice and services.
$351.58B 1,442 4.4%
5416
Management Science and Technical Consulting Services
(Management Consulting) – This industry comprises establishments primarily engaged in providing advice and assistance to businesses and other organizations on management issues, such as strategy and organizational planning; financial planning and budgeting; marketing objectives and policies; human resource policies, practices, and planning; production scheduling; and control planning.
$207.34B 991 11.3%
5417
Scientific Research and Develop. Services
This industry group comprises establishments engaged in conducting original investigation on a systematic basis to gain new knowledge (research) and/or the application of research findings or other scientific knowledge for the creation of new or significantly improved products or processes (experimental development). The industries within this industry group are defined on the basis of the domain of research; that is, on the scientific expertise of the establishment.
$149.09B 620 0.3%

2016 Professional Services Maturity™ Benchmark
© 2016 Service Performance Insight www.FinancialForce.com 19
Code Market Description
US Census
2015 Revenue
Employees (1,000s)
CAGR 2014-2015
5418 Advertising and Related Services
(Marketing and Communications) – This industry comprises establishments primarily engaged in creating advertising or public relations campaigns and placing advertising in periodicals, newspapers, radio and television, or other media. These firms are organized to provide a full range of services (i.e., through in-house capabilities or subcontracting), including advice, creative services, account management, production of advertising material, media planning, and buying (i.e., placing advertising).
$112.76B 408 2.1%
5419
Other Professional, Scientific, Technical Services
(Other PS) – This industry group comprises establishments engaged in professional, scientific, and technical services not listed above.
$76.2B 573 7.8%
5613 Employment Services
Staffing, temporary employment, placement and employment search services
$324.7B 4,277 11.4%
2015 Total US Estimated Professional, Scientific and Technical Services $2.015 Trillion
12.479 Million
Source: US Census and Service Performance Insight, February 2016
Many of the concepts and uses of professional services described in this report also exist within product-
driven organizations. As a result, Service Performance Insight uses the term “services-driven
organization”, or embedded service organization (ESO) to describe the rapidly expanding market for
service organizations within product companies.
Global IT Spending
According to Gartner’s 2015 IT Spending report, IT and Telecom services represent almost 70 percent of
all IT spending with global revenues in excess of $2.9 trillion. Although the pace of service revenue
growth has slowed, unlike most other industries, year-over-year IT service revenue has only declined
once in the past ten years (2008-2009).
Table 6: Worldwide IT Spending by Category (2014 to 2019) in Constant Currency
2014 2015 2016 2017 2018 2019 CAGR
2014-2019
Data Center Systems $171 $185 $187 $190 $192 $193 2.5%
Software 319 339 360 383 407 434 6.4%
Devices 709 722 724 732 741 750 1.1%
IT Services 970 1,006 1,046 1,089 1,137 1,189 4.2%
Communications Services 1,647 1,662 1,668 1,698 1,723 1,745 1.2%
All IT $3,816 $3,912 $3,984 $4,091 $4,200 $ 4,311 2.7%
Source: Gartner, 2015

2016 Professional Services Maturity™ Benchmark
© 2016 Service Performance Insight www.FinancialForce.com 20
According to Gartner, 2015 IT services spending in constant currency will be $1 trillion, with 2015 and
2016 growth expected to be 3.7% and 4.0%, respectively (Table 6). Outsourcing will contribute more
than half of market growth. “In the data center outsourcing market, increased adoption of cloud
services and infrastructure utility services in Western Europe will cannibalize spending on data center
outsourcing, as the region shifts toward cloud-oriented providers and offshore-based vendors. As a
result, the forecast in Western Europe has been reduced from a constant-dollar CAGR of negative 4.3%
in the 2Q15 forecast to negative 4.9% in the 3Q15 forecast.”
PS Maturity™ Benchmark Vertical Market Demographics
The 2016 PS Maturity™ benchmark is the most comprehensive
global study of the professional services industry as it is based on
549 participating organizations representing over 350,000
consultants. The percentage of completed surveys representing the
top thirteen vertical market segments is as follows:
∆ IT Consulting: Systems Integrators and developers – 34.6%,
190 firms representing ~ 108,800 consultants;
∆ Software PS: Service divisions within software companies –
16.2%, representing 89 firms and ~ 52,485 consultants;
∆ Management Consulting: Management consultancies – 12.4% representing 68 firms and ~
17,315 consultants;
∆ Architects and Engineers: Architects and engineers – 9.1% representing 50 firms with ~ 21,425
architects and engineers;
∆ SaaS PS: Service divisions within software-as-a-service providers – 7.8% representing 43 firms
and ~ 25,020 consultants;
∆ Managed Services: Provide hosting and managed and outsourced services – 1.4% representing
17 firms with ~7,785 consultants;
∆ Hardware (and Networking) PS: Service divisions within hardware and networking
manufacturers – 2.9% representing 16 firms with ~ 23,500 consultants;
∆ Research and development: provide research and development services – 2.7% representing 15
firms with ~ 38,660 consultants
∆ Value-Added Resellers: resell hardware, software and provide technology services, training and
support – 2.6% representing 14 firms with ~ 9,425 consultants;
∆ Accountancies: Accounting firms – 2.4% representing 12 firms with ~ 1,970 accountants and
auditors;
∆ Marketing and Advertising: Advertising, marketing, communication firms – 2.4% representing
12 firms and ~ 2,475 consultants;
∆ Staffing: Recruiting, provide temporary resources and consultants – 1.6% representing 9 firms
and ~ 21,660 consultants.
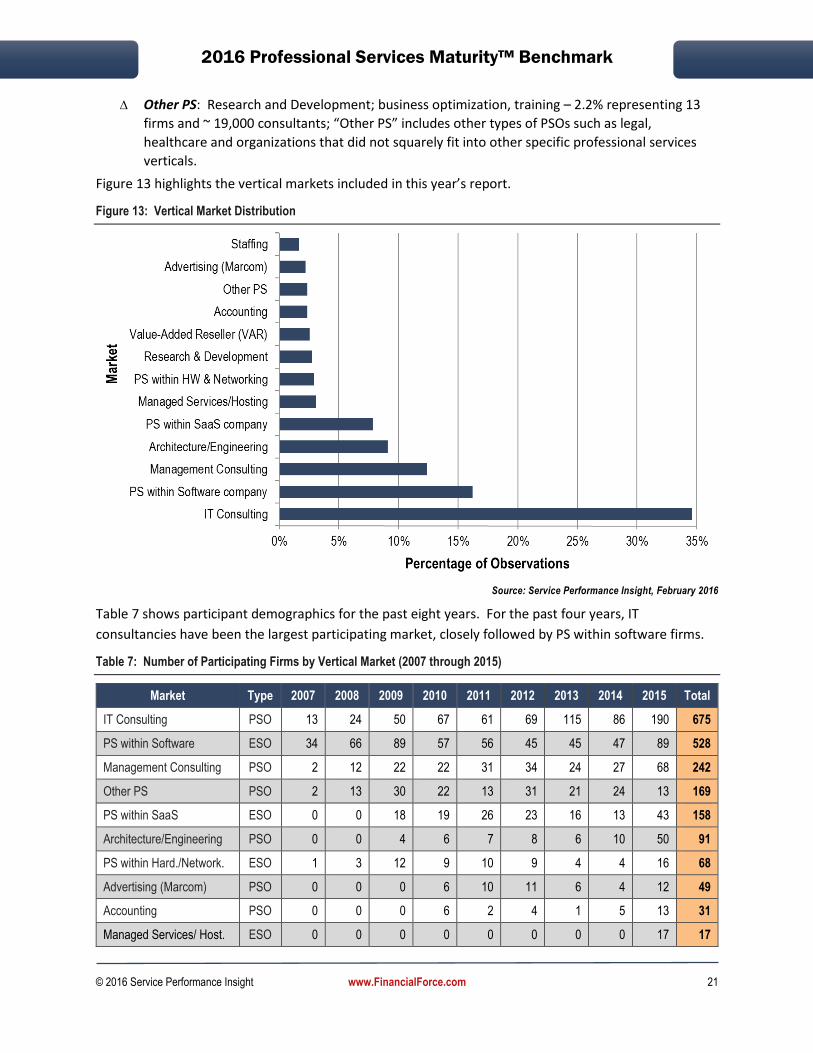
2016 Professional Services Maturity™ Benchmark
© 2016 Service Performance Insight www.FinancialForce.com 21
∆ Other PS: Research and Development; business optimization, training – 2.2% representing 13
firms and ~ 19,000 consultants; “Other PS” includes other types of PSOs such as legal,
healthcare and organizations that did not squarely fit into other specific professional services
verticals.
Figure 13 highlights the vertical markets included in this year’s report.
Figure 13: Vertical Market Distribution
Source: Service Performance Insight, February 2016
Table 7 shows participant demographics for the past eight years. For the past four years, IT
consultancies have been the largest participating market, closely followed by PS within software firms.
Table 7: Number of Participating Firms by Vertical Market (2007 through 2015)
Market Type 2007 2008 2009 2010 2011 2012 2013 2014 2015 Total
IT Consulting PSO 13 24 50 67 61 69 115 86 190 675
PS within Software ESO 34 66 89 57 56 45 45 47 89 528
Management Consulting PSO 2 12 22 22 31 34 24 27 68 242
Other PS PSO 2 13 30 22 13 31 21 24 13 169
PS within SaaS ESO 0 0 18 19 26 23 16 13 43 158
Architecture/Engineering PSO 0 0 4 6 7 8 6 10 50 91
PS within Hard./Network. ESO 1 3 12 9 10 9 4 4 16 68
Advertising (Marcom) PSO 0 0 0 6 10 11 6 4 12 49
Accounting PSO 0 0 0 6 2 4 1 5 13 31
Managed Services/ Host. ESO 0 0 0 0 0 0 0 0 17 17
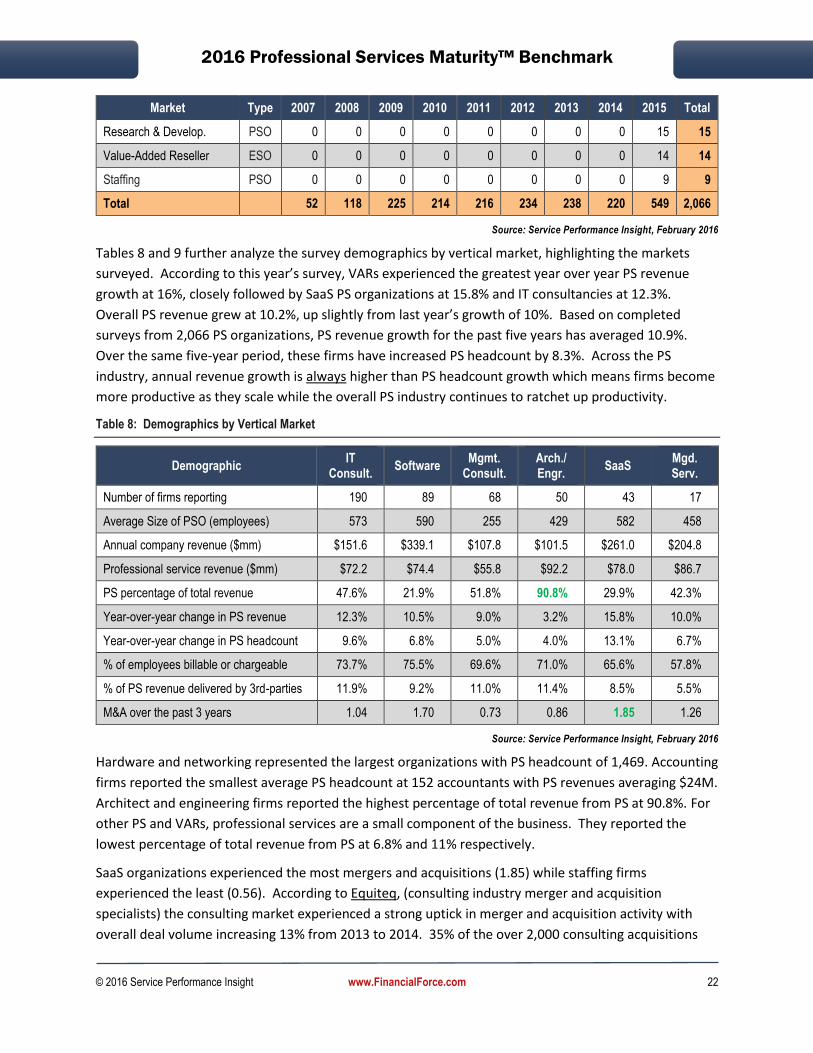
2016 Professional Services Maturity™ Benchmark
© 2016 Service Performance Insight www.FinancialForce.com 22
Market Type 2007 2008 2009 2010 2011 2012 2013 2014 2015 Total
Research & Develop. PSO 0 0 0 0 0 0 0 0 15 15
Value-Added Reseller ESO 0 0 0 0 0 0 0 0 14 14
Staffing PSO 0 0 0 0 0 0 0 0 9 9
Total 52 118 225 214 216 234 238 220 549 2,066
Source: Service Performance Insight, February 2016
Tables 8 and 9 further analyze the survey demographics by vertical market, highlighting the markets
surveyed. According to this year’s survey, VARs experienced the greatest year over year PS revenue
growth at 16%, closely followed by SaaS PS organizations at 15.8% and IT consultancies at 12.3%.
Overall PS revenue grew at 10.2%, up slightly from last year’s growth of 10%. Based on completed
surveys from 2,066 PS organizations, PS revenue growth for the past five years has averaged 10.9%.
Over the same five-year period, these firms have increased PS headcount by 8.3%. Across the PS
industry, annual revenue growth is always higher than PS headcount growth which means firms become
more productive as they scale while the overall PS industry continues to ratchet up productivity.
Table 8: Demographics by Vertical Market
Demographic IT
Consult. Software
Mgmt. Consult.
Arch./ Engr.
SaaS Mgd. Serv.
Number of firms reporting 190 89 68 50 43 17
Average Size of PSO (employees) 573 590 255 429 582 458
Annual company revenue ($mm) $151.6 $339.1 $107.8 $101.5 $261.0 $204.8
Professional service revenue ($mm) $72.2 $74.4 $55.8 $92.2 $78.0 $86.7
PS percentage of total revenue 47.6% 21.9% 51.8% 90.8% 29.9% 42.3%
Year-over-year change in PS revenue 12.3% 10.5% 9.0% 3.2% 15.8% 10.0%
Year-over-year change in PS headcount 9.6% 6.8% 5.0% 4.0% 13.1% 6.7%
% of employees billable or chargeable 73.7% 75.5% 69.6% 71.0% 65.6% 57.8%
% of PS revenue delivered by 3rd-parties 11.9% 9.2% 11.0% 11.4% 8.5% 5.5%
M&A over the past 3 years 1.04 1.70 0.73 0.86 1.85 1.26
Source: Service Performance Insight, February 2016
Hardware and networking represented the largest organizations with PS headcount of 1,469. Accounting
firms reported the smallest average PS headcount at 152 accountants with PS revenues averaging $24M.
Architect and engineering firms reported the highest percentage of total revenue from PS at 90.8%. For
other PS and VARs, professional services are a small component of the business. They reported the
lowest percentage of total revenue from PS at 6.8% and 11% respectively.
SaaS organizations experienced the most mergers and acquisitions (1.85) while staffing firms
experienced the least (0.56). According to Equiteq, (consulting industry merger and acquisition
specialists) the consulting market experienced a strong uptick in merger and acquisition activity with
overall deal volume increasing 13% from 2013 to 2014. 35% of the over 2,000 consulting acquisitions

2016 Professional Services Maturity™ Benchmark
© 2016 Service Performance Insight www.FinancialForce.com 23
reported were under $5 million and 70% were under $40M, reflecting the fact that the vast majority of
consulting firms are small with revenues below $100 million.
Table 9: Demographics by Vertical Market
Demographic Hardware/Network.
R&D VAR Acct. Advert.
(Marcom) Staff.
Number of firms reporting 16 15 14 13 12 9
Average Size of PSO (employees) 1,469 2,577 673 152 206 2,407
Annual company revenue ($mm) $974.2 $471.5 $247.1 $97.3 $59.2 $537.5
Professional service revenue ($mm) $208.0 $312.5 $27.3 $24.4 $21.9 $186.4
PS percentage of total revenue 21.4% 66.3% 11.0% 25.1% 37.0% 34.7%
Year-over-year change in PS revenue 7.2% 10.2% 16.0% -0.2% 1.7% 10.3%
Year-over-year change in PS headcount 6.7% 8.8% 14.4% 0.4% 5.7% 6.4%
% of employees billable or chargeable 58.7% 64.3% 74.2% 57.5% 67.1% 57.8%
% of PS revenue delivered by 3rd-parties 14.1% 11.3% 9.8% 6.7% 9.0% 14.7%
M&A over the past 3 years 1.53 1.77 1.46 1.31 0.71 0.56
Source: Service Performance Insight, February 2016
Table 10 compares demographic information for embedded (ESO) versus independent PSOs and by
geography. The size of the embedded (ESO) and independents (PSO) is roughly the same although the
survey was dominated by independents (370 out of 549 firms). ESOs experienced higher revenue and
headcount growth. By geography, the Americas experienced the greatest growth followed by APAC.
EMEA had the smallest firms with the lowest revenue and headcount growth. The Asia-Pacific region
showed the highest percentage of billable employees, which means lower management and non-billable
overhead. APAC relied the most heavily on third parties for additional revenue (11.8%).
Table 10: Demographics by Organization Type and Geographic Region
Key Performance Indicator (KPI) 2015 ESO PSO Americas EMEA APac
Number of firms reporting 549 179 370 371 141 37
Size of PS organization (employees) 637 660 625 666 522 776
Annual company revenue (mm) $221.2 $358.1 $158.0 $249.5 $163.2 $164.7
Total professional services revenue (mm) $80.9 $85.4 $78.7 $93.6 $49.4 $75.1
Year-over-year change in PS revenue 10.2% 11.9% 9.5% 11.7% 6.5% 10.1%
Year-over-year change in PS headcount 7.8% 8.9% 7.3% 9.0% 5.0% 6.8%
% of employees billable or chargeable 70.4% 69.9% 70.7% 70.9% 68.9% 71.2%
% of PS revenue delivered by 3rd-parties 10.9% 9.2% 11.7% 10.6% 11.4% 11.8%
No. of firms acquired over past 3 years 1.19 1.66 0.96 1.28 1.08 0.73
Source: Service Performance Insight, February 2016

2016 Professional Services Maturity™ Benchmark
© 2016 Service Performance Insight www.FinancialForce.com 24
By organization size, the smallest organizations grew the least while the largest organization grew the
fastest and added the most PS headcount. The smallest organizations experienced the fewest mergers
and acquisitions while the largest experienced the most; they also relied the most heavily on
subcontractors to generate revenue.
Table 11: Demographics by Organization Size
Key Performance Indicator (KPI) Under 10 10 - 30 31 – 100 101 - 300 301 - 700 Over 700
Number of firms reporting 55 90 147 123 55 79
Size of PS organization (employees) 5 20 65 200 500 3,618
Annual company revenue (mm) $47.9 $59.2 $71.5 $173.6 $360.5 $768.3
Total PS revenue (mm) $2.6 $4.4 $17.2 $45.7 $77.7 $395.3
Year-over-year change in PS revenue 6.2% 9.7% 11.3% 9.9% 9.0% 13.1%
Year-over-year change in PS headcount 0.0% 8.5% 8.0% 8.9% 6.8% 11.3%
% of employees billable or chargeable 62.5% 70.4% 73.3% 69.3% 72.1% 71.2%
% of PS revenue delivered by 3rd-parties 8.0% 11.7% 9.9% 10.9% 10.4% 14.1%
No. of firms acquired over past 3 years 0.40 0.51 0.69 1.27 2.03 2.73
Source: Service Performance Insight, February 2016
PSO Type
SPI Research analyzes billable
PSOs in a number of ways with
a focus on two macro segments
– independents and embedded
PS organizations:
Independent Professional Services Organizations (PSOs): Independent PSOs sell, deliver, and invoice for professional services to external clients. Clients hire systems integrators, IT consultancies (SIs) and Value-Added Resellers (VARs) to implement or integrate technology based on their strategic competence or specialized industry or product knowledge. Clients hire management consultancies to provide strategic insight, guidance, facilitation and coaching. Independent PSOs typically provide expertise, knowledge, skills and business practices that are more specialized than those found within internal organizations. In this study a majority of the independent PSOs were IT consultancies, Systems Integrators (SIs) or VARs, with the remainder representing Management Consultancies (MCs), Accountants, Marketing and Advertising and Architects and Engineers. The participating PSOs represented a broad spectrum from some of the largest independent service
Figure 14: Independent vs. Embedded Survey Orgs Surveyed (2007 – 2015)
Source: Service Performance Insight, February 2016

2016 Professional Services Maturity™ Benchmark
© 2016 Service Performance Insight www.FinancialForce.com 25
providers in the world to extremely small, independent regional and specialty service providers. The vast majority of responding independent PSO’s were privately held.
Embedded Services Organizations (ESOs): ESOs operate much like PSOs; however, they are part of a product-driven organization. The majority of ESO participants focus exclusively on their company’s own technology but many of the largest ESOs like IBM and HP services provide global IT consulting, managed services and outsourcing not associated with their company’s products. For the small to mid-size ESOs, their primary charter is to successfully implement their company’s products. Increasingly the charter of embedded PS has expanded to include client adoption with a focus on reducing time to value. While they are focused on professional service revenue and profit, they are often asked to perform non-billable presales, proof of concept and customer satisfaction services at little to no charge. They enable external clients but must also support internal sales, support and engineering constituencies. At maturity levels 1 and 2, their primary focus is on project delivery and building a reference base. For ESOs, lead generation, marketing and sales are primarily provided by the product sales organization. In this survey a majority of the ESOs were part of independent software vendors (ISVs) who primarily provide on-premise software however the percentage of respondents representing SaaS (cloud) providers is rapidly expanding. Almost all legacy on-premise software providers are moving to the cloud. SPI Research shows both on-premise and SaaS results.
SPI Research uses this segmentation because independent consultancies must fund sales and marketing
and back-office operations for finance, operations, facilities, IT and recruiting in a way that embedded
organizations generally do not. Independents incur a higher cost of operation than captive (embedded)
organizations do. However, the following chapters will demonstrate independent PSOs generally
outperform their embedded counterparts because their sole focus is on delivering high-quality services
at a profit. Independents generally are focused on client delight and service revenue and profit growth,
versus embedded where successful and profitable projects are often subordinate to customer product
adoption and incremental product sales.
Organization Size
The average size organization in the
Professional Services Maturity™ Benchmark
has grown, from 211 employees in 2012, to
637 in this year’s survey. This year’s survey
is based on firms who employee more than
350,000 consultants worldwide making it
the most comprehensive study of the
Professional Service industry.
Figure 15 highlights survey distribution by
PS headcount. The largest percentage of
firms have between 31 and 100 employees,
which has been the case for several years
now. Embedded services organizations
average 660 PS employees whereas
Figure 15: Organization Size
Source: Service Performance Insight, February 2016
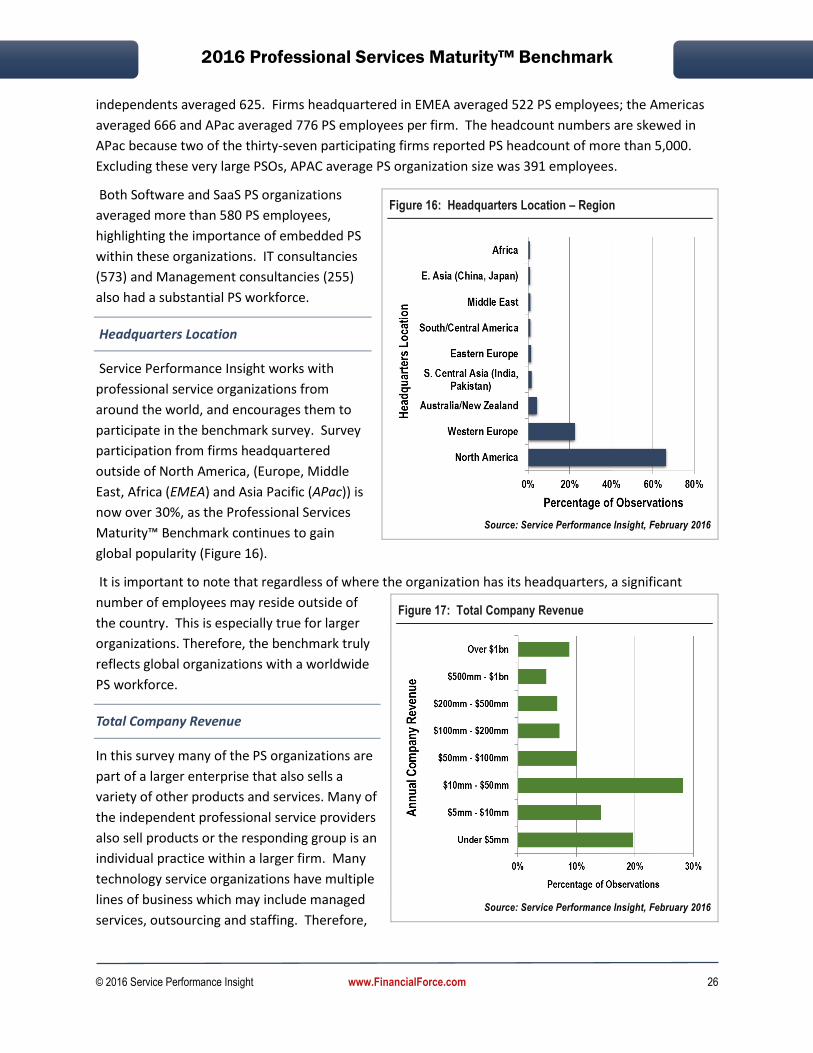
2016 Professional Services Maturity™ Benchmark
© 2016 Service Performance Insight www.FinancialForce.com 26
independents averaged 625. Firms headquartered in EMEA averaged 522 PS employees; the Americas
averaged 666 and APac averaged 776 PS employees per firm. The headcount numbers are skewed in
APac because two of the thirty-seven participating firms reported PS headcount of more than 5,000.
Excluding these very large PSOs, APAC average PS organization size was 391 employees.
Both Software and SaaS PS organizations
averaged more than 580 PS employees,
highlighting the importance of embedded PS
within these organizations. IT consultancies
(573) and Management consultancies (255)
also had a substantial PS workforce.
Headquarters Location
Service Performance Insight works with
professional service organizations from
around the world, and encourages them to
participate in the benchmark survey. Survey
participation from firms headquartered
outside of North America, (Europe, Middle
East, Africa (EMEA) and Asia Pacific (APac)) is
now over 30%, as the Professional Services
Maturity™ Benchmark continues to gain
global popularity (Figure 16).
It is important to note that regardless of where the organization has its headquarters, a significant
number of employees may reside outside of
the country. This is especially true for larger
organizations. Therefore, the benchmark truly
reflects global organizations with a worldwide
PS workforce.
Total Company Revenue
In this survey many of the PS organizations are
part of a larger enterprise that also sells a
variety of other products and services. Many of
the independent professional service providers
also sell products or the responding group is an
individual practice within a larger firm. Many
technology service organizations have multiple
lines of business which may include managed
services, outsourcing and staffing. Therefore,
Figure 16: Headquarters Location – Region
Source: Service Performance Insight, February 2016
Figure 17: Total Company Revenue
Source: Service Performance Insight, February 2016

2016 Professional Services Maturity™ Benchmark
© 2016 Service Performance Insight www.FinancialForce.com 27
it is important to note total annual company revenue. In this year’s survey the average organization
generated $221 million in total revenue including $80.9 million in PS revenue.
Total PS Revenue
Figure 18 shows 75% of the organizations
surveyed have professional services revenue of
less than $50 million. The global PS market is
primarily comprised of firms with less than $50
million in revenue, but SPI Research works
especially hard to survey larger professional
services providers to better understand the
dynamics impacting their business and how
they can improve organizational performance.
Embedded PSOs averaged $85.4 million in PS
revenue and the independents averaged $78.7
million. The average across all 549 participants
was $81 million compared to $55 million last
year.
In this year’s survey firms headquartered in the
Americas ($93.6 million) were larger than those
located in EMEA averaging $49.4 million and APac averaging $75.1 million.
Year over year change in PS Revenue
For the past three years, professional services
revenue growth across the benchmark, has
averaged slightly more than 10%. 30% of the
firms grew revenues by over 15% (Figure 19).
Another 15% of the firms grew revenues by
over 25% in 2015.
Independent providers averaged 9.5% revenue
growth whereas embedded service providers
grew at 11.9%. The largest firms (with more
than 700 PS employees) grew the fastest at
13.1% closely followed by firms with 31 to 100
PS employees who grew at 11.3%. All other
size PSOs grew at less than 10%. By geography
the Americas grew the fastest at 11.7%
followed by APAC at 10.1% with EMEA
experiencing the least revenue growth at
6.5%. EMEA has been plagued by the on-going
Figure 18: Total Professional Services Revenue
Source: Service Performance Insight, February 2016
Figure 19: Year-over-Year Change in PS Revenue
Source: Service Performance Insight, February 2016

2016 Professional Services Maturity™ Benchmark
© 2016 Service Performance Insight www.FinancialForce.com 28
sovereign debt crisis; unending waves of refugees and terrorist threats all of which have dampened
market growth. The professional services market can absorb growth rates of 5% to 10% through
efficiency gains and better management of external subcontractors without significant increases in
hiring. However, when growth rates rise above 10%, professional services organizations must add full-
time employees.
Year-over-year change in PS Headcount
Figure 20 shows that the year-over-year change
in headcount mirrors that of professional
services revenue growth rates, with embedded
organizations and larger firms leading the way.
Typically, revenue growth is higher than
employee headcount growth, as professional
services organizations are very attuned to
operational efficiency. However, employee
growth is a strong indicator that the professional
services market continues to make great strides.
PS market momentum and consulting demand
continue to build and represent a bright spot in
an overall lackluster economic picture. For the
past five years, the PS industry has averaged
8.3% per year headcount growth. This year the
average was 7.8%, down slightly from 8.1% the prior year.
Similar to revenue growth, the Americas
experienced 9% PS headcount growth; APAC
reported 10.1% with EMEA experiencing the
least PS employment growth at 5%.
Percentage of Employees Billable or Chargeable
In this year’s survey SPI Research found the
percentage of billable employees (70.4%)
declined significantly from the high water mark
of 75.1% achieved last year. Figure 21 highlights
the majority of organizations now have over 70%
of their employees billable. Obviously, this has a
direct correlation with increased profitability.
However, professional services organizations
should not try to drive this number over 80%, as
the lost overhead serves valuable functions from
Figure 20: Year-over-Year Change in PS Headcount
Source: Service Performance Insight, February 2016
Figure 21: Percentage of Employees Billable/Chargeable
Source: Service Performance Insight, February 2016

2016 Professional Services Maturity™ Benchmark
© 2016 Service Performance Insight www.FinancialForce.com 29
sales and marketing, through operations and IT. Keeping the organization balanced, which SPI Research
believes is approximately 75% billable headcount, should yield solid results.
Excessive non-billable headcount creates a top-heavy organization or is a symptom of poor sales and
marketing effectiveness and/or poor systems. But as in all things PS, there is a delicate balance that
must be maintained. Non-billable headcount and time is a necessary component of developing
infrastructure, systems and tools which support growth, consistency and quality.
Independents averaged 70.7% billable, whereas the embedded service providers averaged 69.9%.
These figures were fairly consistent across all sizes of organizations. The APac region led the way with
71.2% of their employees billable compared to 70.9% in the Americas and 68.9% in EMEA.
Percentage of PS Revenue Delivered by Third Parties
Figure 22 shows the distribution of survey
responses in terms of the amount of revenue
generated by third-party resources. The average
percent of PS revenue generated by
subcontractors was 10.9% down from 12.3% in
2014. This figure has remained fairly constant
between 11% and 13% for several years. This
year ESO revenue delivered by third parties
declined to 9.2% down from 12.2% the prior
year. Independents generated 11.7% of revenue
from subcontractors. Also, since the largest
organizations grew the fastest, the greater
potential was there for third-party resources.
Organizations with over 700 PS employees
derived 14.1% of revenue from third-party
resources. By geography, APAC generated the
most third-party revenue at 11.8%; EMEA
generated 11.4% and the Americas generated the least at 10.6%. Subcontractors are a valuable tool to
help manage variability in supply and demand for services.
Their bench cost is minimal, if anything, when they are not working. And they provide a valuable
incremental workforce to augment the employee work base when work picks up.
Mergers and Acquisitions over the Past Three Years
Four years ago SPI Research began tracking the number of mergers and acquisitions organizations have
been involved in (either as the acquirer or acquired). Software and SaaS firms lead the way in
acquisitions. Traditional companies like Oracle, SAP and Microsoft, who generate the majority of
technology profits, regularly buy up the highfliers in new market segments. But just as soon as today’s
rising stars are acquired new ones emerge with better, faster and more innovative technology…and so it
goes.
Figure 22: Percentage of PS Rev. Delivered by 3rd-parties
Source: Service Performance Insight, February 2016
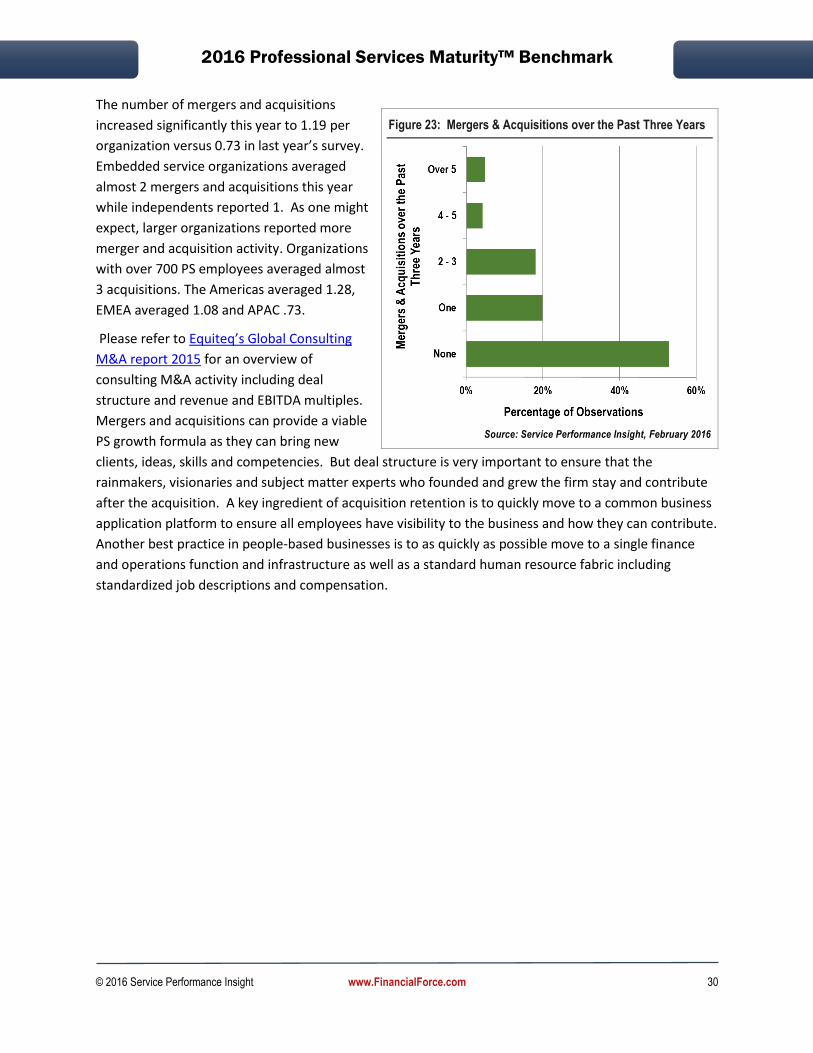
2016 Professional Services Maturity™ Benchmark
© 2016 Service Performance Insight www.FinancialForce.com 30
The number of mergers and acquisitions
increased significantly this year to 1.19 per
organization versus 0.73 in last year’s survey.
Embedded service organizations averaged
almost 2 mergers and acquisitions this year
while independents reported 1. As one might
expect, larger organizations reported more
merger and acquisition activity. Organizations
with over 700 PS employees averaged almost
3 acquisitions. The Americas averaged 1.28,
EMEA averaged 1.08 and APAC .73.
Please refer to Equiteq’s Global Consulting
M&A report 2015 for an overview of
consulting M&A activity including deal
structure and revenue and EBITDA multiples.
Mergers and acquisitions can provide a viable
PS growth formula as they can bring new
clients, ideas, skills and competencies. But deal structure is very important to ensure that the
rainmakers, visionaries and subject matter experts who founded and grew the firm stay and contribute
after the acquisition. A key ingredient of acquisition retention is to quickly move to a common business
application platform to ensure all employees have visibility to the business and how they can contribute.
Another best practice in people-based businesses is to as quickly as possible move to a single finance
and operations function and infrastructure as well as a standard human resource fabric including
standardized job descriptions and compensation.
Figure 23: Mergers & Acquisitions over the Past Three Years
Source: Service Performance Insight, February 2016

2016 Professional Services Maturity™ Benchmark
© 2016 Service Performance Insight www.FinancialForce.com 31
4. Best-of-the-Best
For the past seven years, Service Performance Insight has
conducted in-depth analysis of the top 5% of PS Maturity™
benchmark participants to uncover the reasons for their
superlative performance. The leading (according to the PS
Maturity™ model) organizations have been named “Best-of-the-
Best” after a careful audit of their survey responses and an in-
depth interview with their lead service executive.
In this year's benchmark, SPI Research names the top 20 firms,
each scoring 20 or above (out of 25) on the PS Maturity™ Model.
The following sections highlight some of the findings comparing the “best” preforming organizations to
the rest of the survey participants.
Introducing the 2016 Best-of-the-Best Service Organizations
According to Service
Performance Insight’s 2016
Professional Services
Maturity™ Benchmark out of
549 participating organizations,
twenty firms (5%) significantly
outperformed the benchmark
average by excelling in all five
service performance
dimensions – Leadership, Client
Relationships, Human Capital
Alignment, Service Execution
and Finance and Operations.
The Top 20 firms outperformed
their peers and the benchmark
average with significantly higher profit and more satisfied clients.
The one word that best describes this year’s top performers is “transparent”. Transparent is defined as
“visibility in context”. A key element of their success is to provide open books and communication so all
levels of the organization are empowered to make proactive, fact-based decisions. Transparency binds
employees to the direction and strategy of the firm, propelling superlative execution. They all have
created a culture of excellence by leading with honest, ethical and open communication and metrics.
Integrated business applications support high levels of employee and revenue growth.
Table 12: 2016 Best-of-the-Best Performance Advantage
Measurement Top 20 Firms
All Others
Advantage
EBITDA 20.4% 14.9% 37%
Size of PS Organization (employees) 776 630 23%
Year over year revenue growth 20.0% 9.8% 104%
Year over year PS headcount growth 17.2% 7.4% 132%
Average revenue per project (k) $339 $219 55%
Annual revenue per employee (k) $242 $153 58%
Projects delivered on-time 86.7% 75.6% 15%
Reference clients 81.0% 69.9% 16%
Source: Service Performance Insight, February 2016

2016 Professional Services Maturity™ Benchmark
© 2016 Service Performance Insight www.FinancialForce.com 32
SPI Research is proud to announce the 2016 top performers:
CodeScience
CodeScience supports the unique needs of SaaS companies by providing professional services across their entire lifecycle: Design, Product Build and Test, Distribution, Sales, Marketing, and Support. CodeScience has built over 70 B2B Salesforce products for clients and bolstered hundreds more with custom solutions. “The majority of our consultants have worked for, or founded, a SaaS startup; our shared passion. While often referred to as the fastest way to get a new product to market, we pride ourselves in bringing the right product to market. However, neither guarantee success. Our solutions, anchored in the Salesforce Clouds, enable clients to focus on customers, not process. That’s the key to owning a new market.” Brian Walsh, Partner and Chief Strategy Officer, CodeScience
Wolters Kluwer Financial Services
Wolters Kluwer Financial Services helps organizations around the world
proactively manage risk, compliance, finance and audit challenges, and
grow safely and profitably by providing software, expertise and
professional services to help them make critical business decisions.
“Wolters Kluwer Financial Services is pleased to be recognized as a ‘Best-
of-the-Best’ organization. We take pride in what we do and this honor
reaffirms our dedication to service excellence as we strive to help our
customers succeed amidst the intense regulatory standards and civic
responsibility inherent in the financial services industry today. The PS
Maturity Model™ has become a valuable benchmark in our efforts to
meet the evolving needs of our customers and a useful guide to pinpoint areas of success and those
that require improvement. Being recognized as a Best-of-the-Best winner is not only an incredible
honor, but also a reflection of the corporate values we try to embody daily—focus on customer
success, aim high and deliver, make it better and win as a team.”
Darin Byrne Senior Director of Professional Services, WKFS
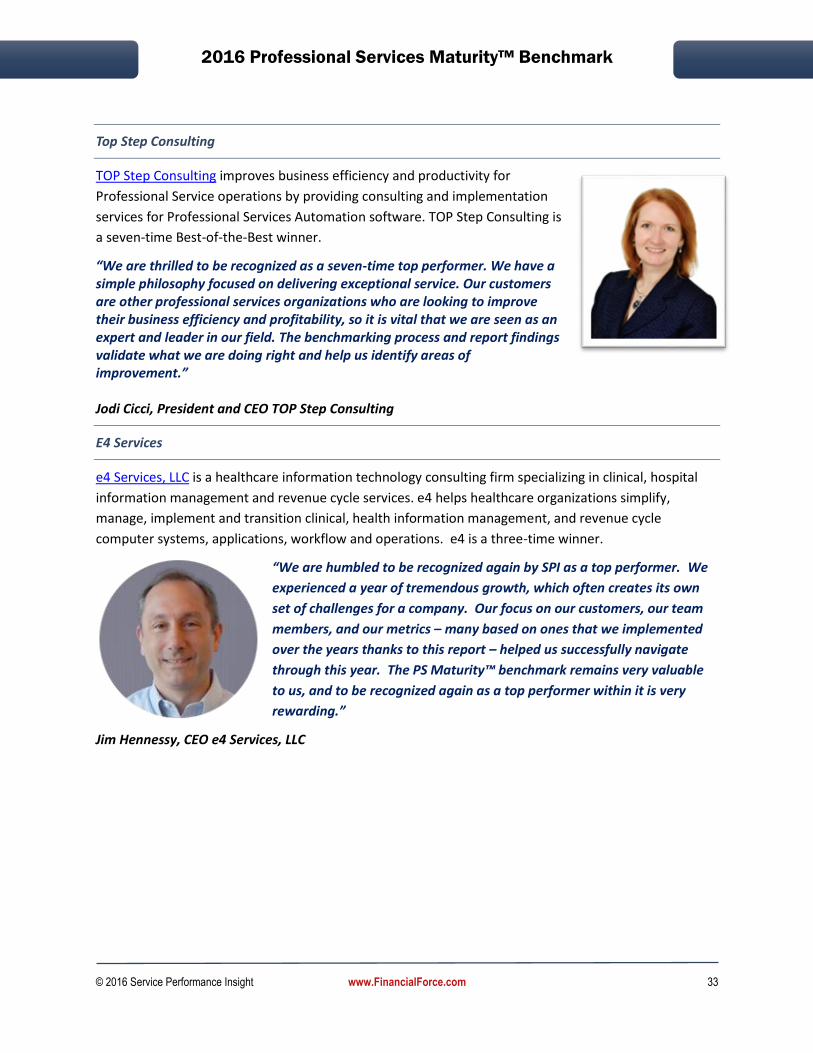
2016 Professional Services Maturity™ Benchmark
© 2016 Service Performance Insight www.FinancialForce.com 33
Top Step Consulting
TOP Step Consulting improves business efficiency and productivity for
Professional Service operations by providing consulting and implementation
services for Professional Services Automation software. TOP Step Consulting is
a seven-time Best-of-the-Best winner.
“We are thrilled to be recognized as a seven-time top performer. We have a simple philosophy focused on delivering exceptional service. Our customers are other professional services organizations who are looking to improve their business efficiency and profitability, so it is vital that we are seen as an expert and leader in our field. The benchmarking process and report findings validate what we are doing right and help us identify areas of improvement.” Jodi Cicci, President and CEO TOP Step Consulting
E4 Services
e4 Services, LLC is a healthcare information technology consulting firm specializing in clinical, hospital
information management and revenue cycle services. e4 helps healthcare organizations simplify,
manage, implement and transition clinical, health information management, and revenue cycle
computer systems, applications, workflow and operations. e4 is a three-time winner.
“We are humbled to be recognized again by SPI as a top performer. We
experienced a year of tremendous growth, which often creates its own
set of challenges for a company. Our focus on our customers, our team
members, and our metrics – many based on ones that we implemented
over the years thanks to this report – helped us successfully navigate
through this year. The PS Maturity™ benchmark remains very valuable
to us, and to be recognized again as a top performer within it is very
rewarding.”
Jim Hennessy, CEO e4 Services, LLC

2016 Professional Services Maturity™ Benchmark
© 2016 Service Performance Insight www.FinancialForce.com 34
Bristlecone
Bristlecone, part of the $17 billion Mahindra Group, is a supply chain and
business analytics advisor, serving customers across a wide range of
industries. Rated by Gartner as among the top ten system integrators in
the supply chain space, we are uniquely positioned to solve contemporary
supply chain problems, with supply chain and analytics focus as our
advantage. Based out of the Silicon Valley, our global team of 1600+
business advisors helps companies rapidly optimize the strategic value of
their supply chains through enabling technologies.
“We see ‘Supply Chain Analytics’ and BPaaS as a promising space to
grow. With our recently launched analytics platform ‘Bristlecone NEO’ we are helping customers in
various analytics initiatives – be it prescriptive, descriptive or predictive analytics. Another growth
driver is cloud based services as we see growing demand from customers transforming from on-
premise to integrated cloud solutions. We are honored to be recognized as one of this year’s Best-of-
the-Best service organizations.”
Irfan Khan, President and CEO, Bristlecone
Logical Design Solutions, Inc.
LDS is a consulting firm that envisions and designs digital solutions for global organizations. For 25
years, LDS has helped market leaders realize their most important business strategies through
technological innovations. LDS is hired by global companies, in all industries, that want to build
substantially better businesses through smart design for business consumers. LDS is a seven-time Best-
of-the-Best winner.
“LDS is honored to be named a “Best-of-the-Best” consulting firm for the
7th year in a row. We appreciate the value this award places on paying
attention to the metrics that drive our consulting firm, and we strive to
align to these best practices in our financial operations. Each year we do
an exhaustive review of our business and are always looking for ways to
improve. The PS Maturity Model™ and five Service Performance Pillars™
provide an important roadmap in this context. We compare our results to
the benchmark and identify areas that we can improve even slightly. Each
year we find something to work on and the report gives us the courage to
do it.”
Bruce Lovenberg, CPA Chief Financial Officer, Logical Design Solutions

2016 Professional Services Maturity™ Benchmark
© 2016 Service Performance Insight www.FinancialForce.com 35
Pariveda Solutions, Inc.
Pariveda Solutions, Inc. is a leading management consulting firm specializing in improving our clients’
performance. We focus on developing exceptional people to solve clients’ most complex and valuable
business problems through innovative technology solutions combined
with exceptional delivery.
“It is an honor to be a “Best-of-the-Best” services organization. Being
named to this list for two years in a row is remarkable and reflects
our dedication to growing our people to their fullest potential and to
delivering exceptional services to our clients.”
Kerry Stover, Chief Operating Officer, Pariveda Solutions
Alternative
Alternative brings the best of the cloud to manufacturers through services and solutions designed to
make technology faster, smarter, and easier to use. Alternative partners with leading cloud technology
providers including Salesforce and NetSuite to build and deliver solutions that meet manufacturers'
needs.
"Alternative will always have service at the heart of everything we
do. Alternative started as a pure services company focused on enhancing
and extending the use of ERP and CRM for our customers. As we all know,
companies typically only implement 40 to 50% of the functionality
available to them, and so our goal was--and is--to help customers realize
greater ROI and extend the functionality and usability of their
technology. We are thrilled to have been recognized as one of the Best-
of-the-Best Professional Services organizations, we think it is a real
testimony to our singular focus on helping our clients succeed."
Vivian Keena, Founder and CEO, Alternative

2016 Professional Services Maturity™ Benchmark
© 2016 Service Performance Insight www.FinancialForce.com 36
ConsultCRM
ConsultCRM, part of Advanced Business Solutions, is positioned in the top
5% of all Microsoft partners globally and specialises in helping
organisations implement, integrate and optimise Microsoft Dynamics
CRM. As a Tier One, Gold Certified, Strategic Microsoft Partner, Advanced’s
pedigree in Microsoft Dynamics CRM spans a decade working with
Microsoft since the first version came to market in 2004. The business is
professionally managed, and has shown consistent growth every year since
its inception, reinforcing the trust placed in Advanced by both Microsoft
and its clients.
“ConsultCRM brings together a blend of complimentary skill sets, effective
technology partnerships and robust implementation methodologies to
help our clients deliver results for their organisations. We have gone beyond the traditional idea of
support to help clients optimise their CRM investment over the long term. We believe that our
inclusion in the ‘Best-of-the-Best’ professional service organisations is testimony to our focus on
helping clients align CRM to their goals and objectives – at the start of their CRM journey and in the
long term as they grow and evolve.”
Simon Fowler, Managing Director, Advanced Business Solutions
Box
Founded in 2005, Box is transforming the way people and organizations work so they can achieve their
greatest ambitions. As the world's leading modern content platform, Box helps more than 54,000
businesses in every industry, including 55% of the Fortune 500, securely access and manage their critical
information in the cloud. Box is headquartered in Redwood City, CA, with offices in the United States,
Europe and Asia.
“Box Consulting is the professional services arm of Box, helping
customers realize the value of transforming the way they work and
maximize the benefits of their Box deployment. Box Consulting offers
implementation packages for customers ranging from 50 employees
to hundreds of thousands of employees and collaborators globally.
Additionally, Box Consulting helps customers optimize existing
deployments, move legacy ECM solutions to Box, and build customer
business applications on Box Platform. Meeting our customer's
objectives requires running an excellent professional services
operation and as such we are pleased to be recognized as one of this
year’s Best-of-the-Best Professional Services organizations.”
Tim Smith, VP Consulting, Box

2016 Professional Services Maturity™ Benchmark
© 2016 Service Performance Insight www.FinancialForce.com 37
Collaborative Solutions
Collaborative Solutions is a leading global Finance and HR
Transformation consultancy that leverages world-class cloud
solutions to help deliver successful outcomes for its customers. As
one of the longest-tenured consulting partners with Workday,
Collaborative Solutions has executed over 225 successful Workday
HCM, Payroll, and Financials deployments for global Fortune 500
companies, medium-sized businesses, and education and
government institutions. Collaborative Solutions has deployed in
over 110 countries and has experience with organizations ranging
from 200 to 200,000 employees. Collaborative Solutions is based
in the Washington, D.C., metro area with offices in Pleasanton,
Chicago, Atlanta, Tampa, New York City, Toronto and Dublin.
"At Collaborative Solutions we take pride in our unique culture and industry-leading customer satisfaction. We firmly believe that happy employees result in happy customers, and owe this achievement to our dedicated team of experts. This benchmark validates Collaborative's growing leadership position in the industry, and we are extremely proud to be recognized as a "Best-of-the-Best" Professional Services Organization by Service Performance Insight."
Bob Maller, President and Chief Culture Officer at Collaborative Solutions
Large Contract Research Organization headquartered in Australia
This contract research organization specializes in global drug development. They are instrumental in
helping global pharmaceutical firms get drugs to market, specializing in phase I through IV clinical trials.
Recognized for delivering high quality services throughout the drug development lifecycle.
Name withheld
Fiserv
Fiserv is a global organization with more than 13,000 clients and 21,000 associates worldwide and takes
pride in its mission to enable clients to achieve best-in-class results. The company is highly regarded for
its financial services technology and services innovation, including award-winning solutions for mobile
and online banking, payments, risk management, data analytics and core account processing.
Fiserv is helping its clients push the boundaries of what's possible in financial services, delivering deep
expertise and innovative solutions to help financial institutions, businesses and consumers move and
manage money faster and with greater ease than ever before.
2016 Professional Services Maturity™ Benchmark
© 2016 Service Performance Insight www.FinancialForce.com 38
Helmsman International
Helmsman International is a management consultancy, thought leader and product innovator. We love
turning big, ugly, complex capital asset situations into highly successful outcomes. For Helmsman, the
outcome is everything. We have built a reputation for being the
straight-talking, can-do and broad thinking specialists who can define
what needs to be done to deliver the best results. We use a
combination of art, science and expertise to determine where the
technical complexity lies, and what soft skills need to be applied to
deliver success. Many asset owners tend to concentrate on technical,
‘hard’ factors when managing complex assets. Our experience has
shown that it’s the people issues that determine how successful the
outcome will be. This is what turns good intentions into great
outcomes.
"Helmsman International is very pleased to be recognized by SPI Research as one of the top performing professional services organizations in the world. This achievement is borne of the hard work and commitment of our team to provide superb service to our clients as well as a great environment for our consultants."
Julian Mitton, Partner and CFO, Helmsman International
Stoneridge Software
Stoneridge Software draws on years of experience in the Microsoft Dynamics space to provide complex
ERP implementation and support. We look for the best and most experienced team members so that
our clients have a consistently good experience. Our mission at Stoneridge Software is to “Enable Your
Business”; we have the highly experienced Microsoft Dynamics resources who can help you reach your
goals.
"We are honored to be recognized as one of Service Performance Insight’s Best-of-the-Best for 2016. We appreciate the recognition for the quality of the organization we’ve built in three fast-paced years. The five pillars of Service Performance (Leadership, Client Relations, Human Capital Alignment, Service Execution and Finance and Operations) are aligned with our core values as a company. From the beginning our mission has been to be the best provider of Microsoft Dynamics ERP consulting and we are thrilled to be acknowledged for our operational excellence as we continue to grow our presence in the marketplace.”
Eric Newell, President and Founder of Stoneridge Software

2016 Professional Services Maturity™ Benchmark
© 2016 Service Performance Insight www.FinancialForce.com 39
Moorhouse Consulting, LTD
Moorhouse is a dynamic consulting firm, focused on delivering transformational change. We make sure
our clients succeed in their long-term goals by helping them turn their strategy into action; by
providing out of the ordinary delivery capability; and by establishing a culture of change.
“Irrespective of the size of a business, transformation is about more
than strategy: it is the implementation and delivery that will
determine the success of any such programme, since without these
even the best-laid plans will go to waste. We are proud of the
recognition of our own transformation and growth that this award
represents. It is a fantastic achievement and demonstrates not only
our ability to execute strategies on behalf of our clients, but that
Moorhouse practices what it preaches.”
Richard Goold, Partner, Moorhouse Consulting
Imperva
Imperva®, is a leading provider of cyber security solutions that protect business-critical data and
applications. The company’s SecureSphere, Incapsula and Skyfence product lines enable organizations to
discover assets and risks, protect information wherever it lives – in the cloud and on-premises – and
comply with regulations. The Imperva Application Defense Center, a research team comprised of some
of the world’s leading experts in data and application security, continually enhances Imperva products
with up-to-the-minute threat intelligence, and publishes reports that provide insight and guidance on
the latest threats and how to mitigate them. Imperva is headquartered in
Redwood Shores, California.
“We are honored to be named a “Best-of-the-Best” services
organization by Service Performance Insight. The worldwide services
and support team at imperva understands that security, compliance and
reliability are essential to our customers. We offer a comprehensive set of
support, professional services, and product training programs that deliver
immediate and effective results, giving our customers the confidence that
their security and compliance objectives are met and exceeded.”
Sunil Nagdev, SVP of Worldwide Services and Support at Imperva

2016 Professional Services Maturity™ Benchmark
© 2016 Service Performance Insight www.FinancialForce.com 40
Onesource Virtual
Founded in 2008, OSV started out as a disruptive force in the market offering a truly cloud-based
alternative to business process outsourcing. Dedicated exclusively to Workday, OSV’s services empower
and encourage customers’ HR to become strategic partners within their organizations, align to business
growth and scale by demand.
“OneSource Virtual is honored to be recognized by Service
Performance Insight as one of the Best-of-the-Best Professional
Services organizations in the industry. Not only do we approach every
project with a deep expertise, but strive to provide every customer
with an exceptional experience. Customer satisfaction and dedication
to service excellence is in the fabric of OSV and its employees, and has
been since day one. Receiving this award is a testimony to our efforts
and our accomplishments.”
Duncan Harwood, VP of Professional Services and Strategy
Integrated Project Management Company
Integrated Project Management Company, Inc. (IPM) is a leading project management consulting firm,
planning and implementing strategic and critical projects in the life sciences, healthcare, consumer
products (including CPG), and industrial sectors. The IPM leadership approach combines clients’ internal
capabilities and legacy knowledge with IPM’s proven ability to inspire stakeholder engagement and buy-
in to achieve project objectives. Since its inception in 1988, IPM has served over 300 clients, ranging
from Fortune 100 companies to startups, and completed over 3,500 projects.
“IPM is honored to be named a “Best-of-the-Best” Service
Organization. With a passion for excellence, honest and ethical
conduct, and uncompromising integrity, we focus on providing
extraordinary service while advising on and executing our clients’ most
complex initiatives. We recognize that our values-driven, self-
motivated, and highly skilled employees are our most important asset.
Our mission is honored each time we exceed a client’s expectations and
each time an employee achieves his or her dreams.”
Timothy J. Czech, Chief Financial Officer, IPM

2016 Professional Services Maturity™ Benchmark
© 2016 Service Performance Insight www.FinancialForce.com 41
Fruition Partners, a Division of CSC
Fruition Partners, a CSC company, is a global technology-enabled services firm focused on elevating
service management to the cloud. The company combines practical experience with technology-enabled
tools and services to help organizations attain success throughout the entire Service Management
process. With more than 1,700 ServiceNow projects to its credit, Fruition Partners is a Master tier
Solutions Partner of the leading enterprise cloud company,
ServiceNow. Fruition Partners team of over 300 cloud-integration
experts accelerate service management and ensure clients
experience cost and performance benefits quickly and easily.
“Fruition Partners is proud to be named a ‘Best-of-the-Best’ firm.
With our recent acquisition by CSC, we’ve realized that in many
ways we can serve as a model and enable other organizations
within the larger company. Culturally, we maintain a spirit of
honesty and continuous improvement. We are very proud to
celebrate our success and embrace our future potential.”
Scott Klein, Director of Business Operations, Fruition Partners
Best-of-the-Best Demographics
Table 13 compares the 20 best-of-
the-best performing PSOs to the
other 535 in this year's survey. As
we have seen for the past seven
years, Best-of-the-Best
organizations tend to be more
specialized than the average firm
in the benchmark. This year’s top
performers are slightly larger than
average firms with 776 PS
employees compared to 630 for
average firms. Nine are
independent IT consultancies;
three are embedded PS
organizations within fast-growing
software companies; four are
management consultancies; two are embedded PS organizations within cloud SaaS companies; one is a
Value-Added Reseller and one focuses on research and development. The IT consultancies specialize in
enterprise-class solutions for complex problems in government, healthcare, security and data centers or
Table 13: Best-of-the-Best Comparison – Demographics
KPI Best-of-the-Best
Rest ▲
Number of firms 20 529
Size of PS organization (employees) 776 630 23%
Annual company revenue (mm) $206.5 $221.9 -7%
Total professional services revenue (mm) $67.8 $81.5 -17%
Year-over-year change in PS revenue 20.0% 9.8% 104%
Year-over-year change in PS headcount 17.2% 7.4% 132%
% of employees billable or chargeable 82.1% 69.9% 17%
% of PS revenue delivered by 3rd-parties 10.2% 10.9% -6%
M&A over the past three years 1.71 1.16 47%
Source: Service Performance Insight, February 2016
2016 Professional Services Maturity™ Benchmark
© 2016 Service Performance Insight www.FinancialForce.com 42
high-growth cloud platform implementation, migration and integration. They serve a wide variety of
industries with specialized expertise and deep domain knowledge.
This year’s Best-of-the-Best are characterized by high growth, profit, and high levels of client
satisfaction. Every year we find the best firms are also the fastest growing; on average they grew year
over year PS revenue by 20% - more than double the revenue growth of average firms (9.8%). Year over
year employee headcount growth was even more impressive at 17.2% which is almost three times the
headcount growth of average firms (7.4%). For these fast growing firms their top challenge is finding and
growing the talent they need to sustain their dynamic growth while maintaining a culture of excellence.
The Best boasted a much higher percentage of billable employees, and depend slightly less on third-
party resources, preferring to recruit and deploy their own talented resources without heavily relying on
subcontractors which translated to higher levels of both employee and client satisfaction.
More than half of this year’s top performers augmented their organic growth with acquisitions or were
acquired by larger firms. Two firms completed over five acquisitions as they consolidated their market
dominance. Top-performing firms were able to use their own transformation and change management
capabilities to quickly integrate and take advantage of acquisitions as a catalyst for growth.
Pillar Performance
The following sections highlight the results of this year’s Best-of-the-best professional services
organizations (PSOs) and compare their results with the rest of the survey participants.
Leadership
The leading firms are highly specialized. They concentrate on specific high-growth IT segments or
vertical industries. The executives of top-performing firms are seasoned professionals – often with a
track record of founding and growing multiple prior consulting organizations.
A recurring theme from this year’s leaders is their strong sense of community. The leaders of the top
firms are seen as visionaries within the markets they serve, they see their role as one of truly helping
improve the lives of their clients and employees. They select clients and projects because they share the
same values, whether it is a love of transformational change or desire to make a difference through
healthcare and government programs. Their sense of pride and commitment comes through in the
organizations they have developed.
This year’s leaders discussed the importance of building a unique, employee-centric culture which in
turn becomes a source of competitive differentiation. In today’s competitive talent market establishing
a strong reputation as a great place to work and grow is paramount to building brand awareness and
success. While each leader discussed the importance of client success, they also discussed the
importance of creating engaged employees to carry on the culture and position the firm for the future. A
key area of differentiation is that top firms significantly invest in employee development. On average,
they provide 13.5 days of employee training compared to 8.7 days for average firms.

2016 Professional Services Maturity™ Benchmark
© 2016 Service Performance Insight www.FinancialForce.com 43
Table 14 compares the leadership
metrics of the highest performing
organizations with the remainder
of the survey. The two highest
differential scores are clarity of
vision, mission and strategy and
effective communication.
Leading PSOs emphasize the
importance of establishing a clear
and differentiating vision which is
widely communicated and shared
throughout the organization;
cemented by congruent goals
and measurements. This clarity
of purpose provides a powerful foundation for creating a unique culture which supports and accelerates
market differentiation, in turn leading to strong employee confidence in the future.
Client Relationships
SPI Research was surprised most of this year’s Best-of-the-Best do not employ traditional solution sales
people. The independent IT and management consultancies depend on their regional practice leaders
to be the chief rainmakers in their region or domain. Although practice leaders are charged with
developing a book of business they are also charged with personal billability goals to ensure they
continue to be recognized experts in their field. Independent Best-of-the-Best firms expect their
practice leaders to be consultants first… able to truly add value to executive relationships. Repeat
business and referrals are the primary source of new business, a strong testimony to superlative client
relationships and results.
The embedded PSOs primarily rely on the product sales force. They have forged a strong partnership
with product sales and have built sales tools and service packages to guide and shape consulting
engagements. These service packages enable the product sales force to position and quote services,
leading to higher product and service attach rates. PS is regarded as a significant and growing source of
top-line company revenue, not a necessary evil. In many cases, their lead services executive is
responsible for global support, professional services and account management with the title of Chief
Customer Success officer, acknowledging the important role services plays in ensuring client success. A
relatively new set of metrics has emerged for PS, focused on customer adoption. The cloud PSOs
measure not only the number of licenses, seats and client revenue but also the level of client adoption
and engagement by building dashboards and scorecards which depict the depth of client adoption.
Table 14: Best-of-the-Best Comparison – Leadership Pillar (1 to 5 Scale)
KPI Best Rest ▲
Well understood vision, mission and strategy 4.71 3.71 27%
Effectively communicates w/employees 4.54 3.60 26%
Employees have confidence in PSO's future 4.71 3.78 24%
Embraces change - nimble and flexible 4.50 3.64 24%
Ease of getting things done 4.50 3.66 23%
Goals and measurements in alignment 4.50 3.66 23%
Innovation focused 4.42 3.60 23%
Confidence in PS leadership 4.67 3.82 22%
Source: Service Performance Insight, February 2016
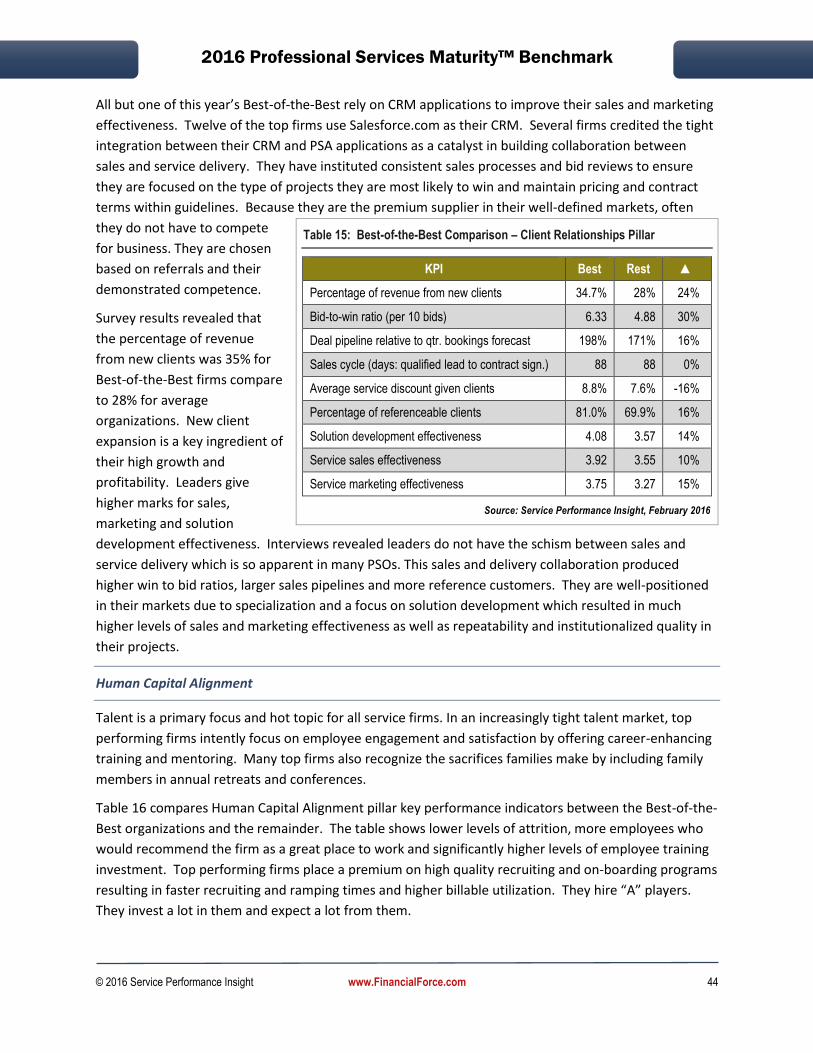
2016 Professional Services Maturity™ Benchmark
© 2016 Service Performance Insight www.FinancialForce.com 44
All but one of this year’s Best-of-the-Best rely on CRM applications to improve their sales and marketing
effectiveness. Twelve of the top firms use Salesforce.com as their CRM. Several firms credited the tight
integration between their CRM and PSA applications as a catalyst in building collaboration between
sales and service delivery. They have instituted consistent sales processes and bid reviews to ensure
they are focused on the type of projects they are most likely to win and maintain pricing and contract
terms within guidelines. Because they are the premium supplier in their well-defined markets, often
they do not have to compete
for business. They are chosen
based on referrals and their
demonstrated competence.
Survey results revealed that
the percentage of revenue
from new clients was 35% for
Best-of-the-Best firms compare
to 28% for average
organizations. New client
expansion is a key ingredient of
their high growth and
profitability. Leaders give
higher marks for sales,
marketing and solution
development effectiveness. Interviews revealed leaders do not have the schism between sales and
service delivery which is so apparent in many PSOs. This sales and delivery collaboration produced
higher win to bid ratios, larger sales pipelines and more reference customers. They are well-positioned
in their markets due to specialization and a focus on solution development which resulted in much
higher levels of sales and marketing effectiveness as well as repeatability and institutionalized quality in
their projects.
Human Capital Alignment
Talent is a primary focus and hot topic for all service firms. In an increasingly tight talent market, top
performing firms intently focus on employee engagement and satisfaction by offering career-enhancing
training and mentoring. Many top firms also recognize the sacrifices families make by including family
members in annual retreats and conferences.
Table 16 compares Human Capital Alignment pillar key performance indicators between the Best-of-the-
Best organizations and the remainder. The table shows lower levels of attrition, more employees who
would recommend the firm as a great place to work and significantly higher levels of employee training
investment. Top performing firms place a premium on high quality recruiting and on-boarding programs
resulting in faster recruiting and ramping times and higher billable utilization. They hire “A” players.
They invest a lot in them and expect a lot from them.
Table 15: Best-of-the-Best Comparison – Client Relationships Pillar
KPI Best Rest ▲
Percentage of revenue from new clients 34.7% 28% 24%
Bid-to-win ratio (per 10 bids) 6.33 4.88 30%
Deal pipeline relative to qtr. bookings forecast 198% 171% 16%
Sales cycle (days: qualified lead to contract sign.) 88 88 0%
Average service discount given clients 8.8% 7.6% -16%
Percentage of referenceable clients 81.0% 69.9% 16%
Solution development effectiveness 4.08 3.57 14%
Service sales effectiveness 3.92 3.55 10%
Service marketing effectiveness 3.75 3.27 15%
Source: Service Performance Insight, February 2016

2016 Professional Services Maturity™ Benchmark
© 2016 Service Performance Insight www.FinancialForce.com 45
Each top firm emphasized the importance of culture. Culture goes way beyond establishing a mission
statement – it must be unique and inspiring to attract the type of consultants and clients the firm can
best serve. Interestingly, many of
this year’s Best-of-the-Best have
also been recognized as “Best
Places to Work” by Fortune and
other publications. Innovative
employee engagement programs
include: annual company retreats
which may include spouses;
generous healthcare and parental
leave policies; flexible work
schedules; health and wellness
programs; significant investments
in employee training and career
development and a consistent
focus on fun, team-building,
collaboration and communication.
The leading firms use a variety of innovative recruiting strategies – from establishing strong partnerships
with local universities, to attracting more senior consultants from their competitors. Just as in selling,
referrals are a key source of new hires because the best and brightest invite their friends to join them.
Once on board, the best firms offer new hire orientation and on-boarding programs which include
shadowing and mentoring to quickly bring new hires up to speed. Leading firms have discovered they
simply cannot rely on stealing top talent from their competitors – they need to grow their own. Several
firms recruit from local universities (MIS and Engineering) and then invest over 90 days in teaching new
hires both the industry and technology. This strategy, although initially expensive, results in qualified
consultants who are able to hit the ground running after their on-boarding program has been
completed. Other fascinating recruiting strategies include personality testing for cultural fit,
communication and organizational skills in addition to technical knowledge.
Top firms also invest in helping consultants build their own networks and communities – they encourage
their young consultants to build strong college and network ties… to serve these communities with their
talents but also as a source of recruiting and business referrals. With young millennial consultants,
continuous learning is a perquisite which means top firms understand employee career and knowledge
aspirations and ensure top performers are assigned to the projects, clients and geographies they are
most interested in.
Just finding talent is not enough. This year’s Best-of-the-Best firms focused on ramping and employee
training to develop a qualified workforce. Some create rotational assignments to give their employees
greater exposure to other services and clients. Employees who are continually learning and expanding
their knowledge base tend to stay with their employer. When the work is not challenging or interesting,
morale suffers and attrition rises. Several of the smaller firms are 100% virtual – in other words, they
Table 16: Best-of-the-Best Comparison – Human Capital Alignment Pillar
KPI Best Rest ▲
Employee annual attrition (voluntary & involuntary)
10.3% 13.0% 20%
Recommend company to friends/family 4.71 4.17 13%
Management to employee ratio 12.29 11.48 7%
Time to recruit and hire for standard positions (days)
56.3 60.7 7%
Time for a new hire to become productive (days) 42.5 58.7 28%
Guaranteed training per employee per year (days)
13.48 8.70 55%
Well-understood career path for all emp. 4.00 3.26 23%
Billable employee utilization 78.3% 70.2% 12%
Source: Service Performance Insight, February 2016
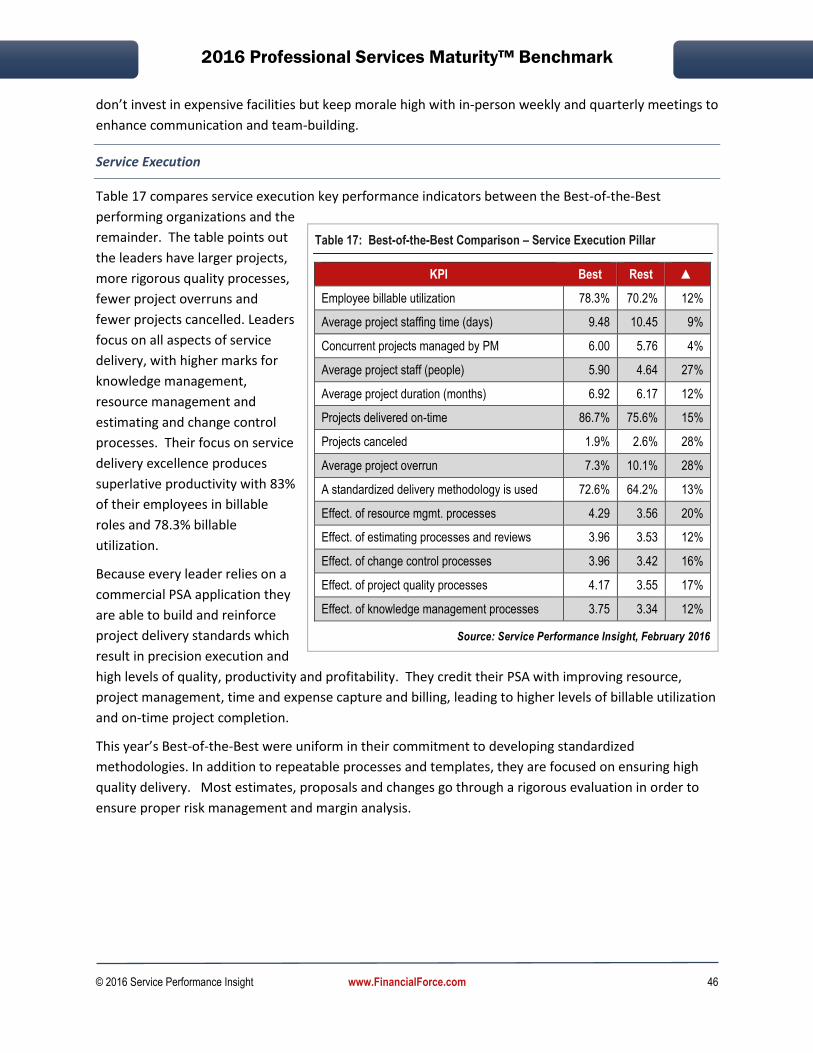
2016 Professional Services Maturity™ Benchmark
© 2016 Service Performance Insight www.FinancialForce.com 46
don’t invest in expensive facilities but keep morale high with in-person weekly and quarterly meetings to
enhance communication and team-building.
Service Execution
Table 17 compares service execution key performance indicators between the Best-of-the-Best
performing organizations and the
remainder. The table points out
the leaders have larger projects,
more rigorous quality processes,
fewer project overruns and
fewer projects cancelled. Leaders
focus on all aspects of service
delivery, with higher marks for
knowledge management,
resource management and
estimating and change control
processes. Their focus on service
delivery excellence produces
superlative productivity with 83%
of their employees in billable
roles and 78.3% billable
utilization.
Because every leader relies on a
commercial PSA application they
are able to build and reinforce
project delivery standards which
result in precision execution and
high levels of quality, productivity and profitability. They credit their PSA with improving resource,
project management, time and expense capture and billing, leading to higher levels of billable utilization
and on-time project completion.
This year’s Best-of-the-Best were uniform in their commitment to developing standardized
methodologies. In addition to repeatable processes and templates, they are focused on ensuring high
quality delivery. Most estimates, proposals and changes go through a rigorous evaluation in order to
ensure proper risk management and margin analysis.
Table 17: Best-of-the-Best Comparison – Service Execution Pillar
KPI Best Rest ▲
Employee billable utilization 78.3% 70.2% 12%
Average project staffing time (days) 9.48 10.45 9%
Concurrent projects managed by PM 6.00 5.76 4%
Average project staff (people) 5.90 4.64 27%
Average project duration (months) 6.92 6.17 12%
Projects delivered on-time 86.7% 75.6% 15%
Projects canceled 1.9% 2.6% 28%
Average project overrun 7.3% 10.1% 28%
A standardized delivery methodology is used 72.6% 64.2% 13%
Effect. of resource mgmt. processes 4.29 3.56 20%
Effect. of estimating processes and reviews 3.96 3.53 12%
Effect. of change control processes 3.96 3.42 16%
Effect. of project quality processes 4.17 3.55 17%
Effect. of knowledge management processes 3.75 3.34 12%
Source: Service Performance Insight, February 2016

2016 Professional Services Maturity™ Benchmark
© 2016 Service Performance Insight www.FinancialForce.com 47
Finance and Operations
The Best-of-the-Best are focused on financial success and stability. They all have deployed a commercial
finance and accounting solution which is partially integrated with their PSA application for billing and
revenue recognition. All the leading firms have invested in both a CRM and PSA application. Twelve use
Salesforce.com as their CRM. Commercial PSAs used are: NetSuite/OpenAir; Projector PSA;
FinancialForce PSA; Kimble; Microsoft/Assistance PSA, Changepoint, Deltek, Clarizen, Tenrox and
Workday. On the financial side of the business, they rely on QuickBooks; NetSuite; Microsoft Dynamics;
Workday; SAP; Deltek; FinancialForce and Oracle.
The Professional Services
Maturity Model™ scoring over-
weights financial success;
meaning the leaders in this
survey were much more
profitable than their peers.
Table 18 shows the enviable
financial results from this year’s
Best-of-the-Best. They produced
significantly more net profit
(20.4% compared to 14.9%) than
average firms in the benchmark.
This high level of profitability is
derived from more revenue per
employee, project and
consultant. All of the Best-of-the-
Best can be characterized as
running a very tight financial
ship. They are frugal with non-
essential expense. In particular,
they don’t invest in fancy offices
and non-billable travel, preferring
to heavily invest in the skill
development of their employees.
The Best-of-the-Best make money on every aspect of the business with high subcontractor margins
(35%); high time and materials project margins (49.6%); and high fixed price project margins (46.4%).
The leaders had a significantly larger amount of revenue in backlog (50.2%), which creates greater
financial stability and predictability. They were much more likely to have achieved both their annual
revenue and margin targets which shows they are running a predictable business.
Table 18: Best-of-the-Best Comparison – Finance and Operations Pillar
KPI Best Rest ▲
EBITDA 20.4% 14.9% 37%
Annual revenue per employee (k) $242 $153 58%
Average revenue per project (k) $339 $219 55%
Project margin for time & materials projects 49.6% 32.8% 51%
Annual revenue per billable consultant (k) $279 $194 44%
Average project margin — subs, offshore 35.2% 25.6% 37%
Project margin for fixed price projects 43.5% 32.4% 34%
Revenue leakage 2.9% 4.3% 33%
Executive real-time wide visibility 4.17 3.28 27%
Quarterly revenue target in backlog 50.2% 39.9% 26%
% of billable work is written off 2.3% 3.0% 24%
Percent of annual revenue target achieved 105.8% 90.7% 17%
Percent of annual margin target achieved 102.9% 88.7% 16%
% of inv. redone due to error/client rejections 2.6% 2.6% -1%
Days sales outstanding (DSO) 53.4 43.3 -23%
Quarterly non-billable expense per employee $2,625 $1,869 -40%
Source: Service Performance Insight, February 2016

2016 Professional Services Maturity™ Benchmark
© 2016 Service Performance Insight www.FinancialForce.com 48
The Best-of-the-Best PSOs Use and Integrate PS Applications
SPI is continually asked:
∆ At what size should a PSO start to evaluate and acquire business applications?
∆ What are the most prevalent business applications and what should our priority be for
application acquisition?
∆ What is the impact of each of the primary business applications?
∆ Which is better – a best
of breed stand-alone
application or an
integrated suite?
∆ What is the benefit of
application integration?
To answer these questions, an
evaluation of business
application usage comparing
this year’s Best-of-the-Best
PSOs to average organizations
provides a compelling picture
of the power and impact of
integrated business
applications. Table 19 shows
application usage, satisfaction
and integration of each of the
core PS business applications
for the top performing (top 5%)
survey participants compared
to the remainder. The table
provides a powerful illustration
of the benefits of PS application
usage and integration. Across
all application categories, top
performing firms are more
likely to have implemented a
commercial business application and much more likely to have integrated it with the core financial
application. Likewise, top performing organizations are much more likely to have integrated their CRM
and PSA applications to provide real-time visibility and collaboration between sales and service delivery.
This visibility gives them much greater insight into customer information and promotes sharing of
customer information which enhances both sales and service delivery effectiveness.
Table 19: Best-of-the-Best Business App. Adoption, Integration, Satisfaction
Solution Best Rest Delta
Financial solution used 100.0% 95.0% 5%
Satisfaction with financial solution 3.95 3.69 7%
Commercial CRM solution 91.7% 86.1% 7%
Satisfaction with CRM solution 4.17 4.00 4%
CRM is integrated with ERP 47.6% 42.9% 11%
Commercial PSA 95.8% 79.1% 21%
Satisfaction with PSA solution 4.17 3.77 11%
PSA is integrated with ERP 71.4% 55.5% 29%
Level of CRM and PSA Integration 58.3% 35.4% 65%
Commercial HCM solution 83.3% 55.5% 50%
Satisfaction with HCM solution 4.05 3.67 10%
HCM is integrated with ERP 52.8% 39.9% 32%
KM solution 88.9% 60.7% 46%
Satisfaction with KM solution 4.13 3.66 13%
Remote service delivery tool 91.7% 76.7% 20%
Satisfaction with RSD solution 4.33 3.86 12%
Social networking tool 91.3% 81.3% 12%
Satisfaction with social networking tool 4.00 3.68 9%
Source: Service Performance Insight, February 2016
2016 Professional Services Maturity™ Benchmark
© 2016 Service Performance Insight www.FinancialForce.com 49
Best-of-the-Best Conclusions
Each year it is inspiring to meet with leaders of the Best-of-the-Best organizations. They are justifiably
proud of the unique Professional Services organizations they have built, but their pride is focused on
their employees and client results, not on themselves. An area that sets the leaders apart is their in-
depth knowledge of their markets and solutions. They understand and have visibility to all aspects of
the business, despite the fact that many of them run very large organizations.
More than average firms, they are truly passionate about building an exceptional organization, not just
for today, but for decades to come. They are willing to honestly look at themselves and the business
and make changes to ensure they continue to be the premium firm. Their sterling reputation for
delivering high quality results is a key ingredient in their success as most often new business comes from
referrals. One executive spoke of a CIO client that had brought them into four different organizations as
he made career moves.
Many of this year’s Best-of-the-Best have been winners year-after-year both throughout the great
recession and now again when the consulting market is hot. The independents have aligned themselves
with the latest and greatest technologies. They are constantly reinventing themselves to ensure they
are on the cutting edge of the best technology solutions for their markets. The leaders of the embedded
PSOs have a seat at the executive table – PS is seen as a critical element of the business and a major
source of revenue, profit and client product adoption.
Excellence is within the grasp of all PS organizations – but it takes hard work, determination and
constant vigilance. Service Performance Insight finds it gratifying that leading organizations rely on the
PS Maturity™ benchmark to guide their investments and performance. “You get what you measure” so
reference the superlative results of this year’s Best-of-the-Best to build your own organizations for the
future!

2016 Professional Services Maturity™ Benchmark
© 2016 Service Performance Insight www.FinancialForce.com 50
5. Professional Services Business Applications
The growth engine of the world’s
economy has shifted from manufacturing
to project-based, people-centric services
businesses. These businesses rely on
project-based Enterprise Resource
Planning (ERP), also known as Services
Resource Planning (SRP), applications to
manage the financial aspects of the firm.
These solutions automate core business
processes such as quote-to-cash,
resource and talent management, time
capture and billing, and provide the real-time visibility necessary to improve organizational efficiency
and effectiveness.
Services firms are uniquely people-driven organizations. They depend on the knowledge and skills of a
talented workforce to sell, staff and deliver a range of services typically on a project or contract basis.
The fundamental financial requirements of service-based businesses are very different from classic
manufacturing and supply-chain focused ERP applications as they must include functionality for
managing resources (people) and projects (tasks). Increasingly, project-based ERP application providers
also add rich talent management capabilities to support recruiting, on-boarding, compensating and
rewarding the employees who are the core asset of service-based businesses.
Project- and service-based extensions to enterprise ERP applications started to appear in the late 1990’s
at the same time stand-alone Professional Service Automation (PSA) solutions supporting resource
scheduling and time capture and billing became available. Over the past fifteen years, project
accounting, resource management and time capture and billing modules have been added to many ERP
applications. Now most project-based ERP providers also add Human Capital Management (HCM) or
talent management extensions to accentuate the important role that recruitment and engagement of a
talented workforce has in today’s economy. Support for specialized billing methods and complex
revenue recognition rules for time and materials, work-in-process, deliverables-based or percentage
completion are also important project-based ERP extensions.
This chapter provides PS executives and software application providers insight into the level of market
adoption, integration and satisfaction with core Professional Services business applications from this
year’s benchmark survey. It is not intended to be an overall application market adoption survey. The
solutions highlighted in this chapter help PSOs optimize operational effectiveness through increased
visibility, streamlined business processes and cost management.

2016 Professional Services Maturity™ Benchmark
© 2016 Service Performance Insight www.FinancialForce.com 51
Primary Professional Services Business Applications
A project-based ERP system
is an integrated information
management system that
manages the capture and
flow of information across
departments and functions.
It includes a common
enterprise-wide database
and various application
modules to support
fundamental business
activities, such as
accounting, finance, sales,
marketing, resource and
project management and
human resources. An ERP
system is used to
standardize business
processes and provide
reports, insight and control for both revenue and costs.
The value of such a system is to enable critical information to be analyzed and shared across the
organization for more insightful and timely decision-making. For purposes of this report, SPI Research
considers Project-Based ERP solutions to have several modules that include:
Financial Management or Enterprise Resource Planning (ERP): The fundamental solution
required to accurately collect and report financial transactions.
Client Relationship Management (CRM): The automation of client relationship processes to
improve sales and marketing efficiency and effectiveness.
Professional Services Automation (PSA): The initiation, planning, execution, close and control of
projects and services through the management and scheduling of resources that include people
(both internal and partners), materials and equipment.
Human Capital Management (HCM): Talent management solutions for recruiting, hiring,
compensation, goal-setting and career and performance management which rely on integration
with and extracts from the employee database.
Business Intelligence (BI): The assembly and use of information to improve decision-making.
Both embedded and independent professional service organizations require similar functionality. The
service industry’s use of technology has typically lagged the manufacturing sector but the global size,
complexity and growth of today’s service businesses has increased the need for specialized applications
Figure 24: Core Professional Services Business Applications
Source: Service Performance Insight, February 2016
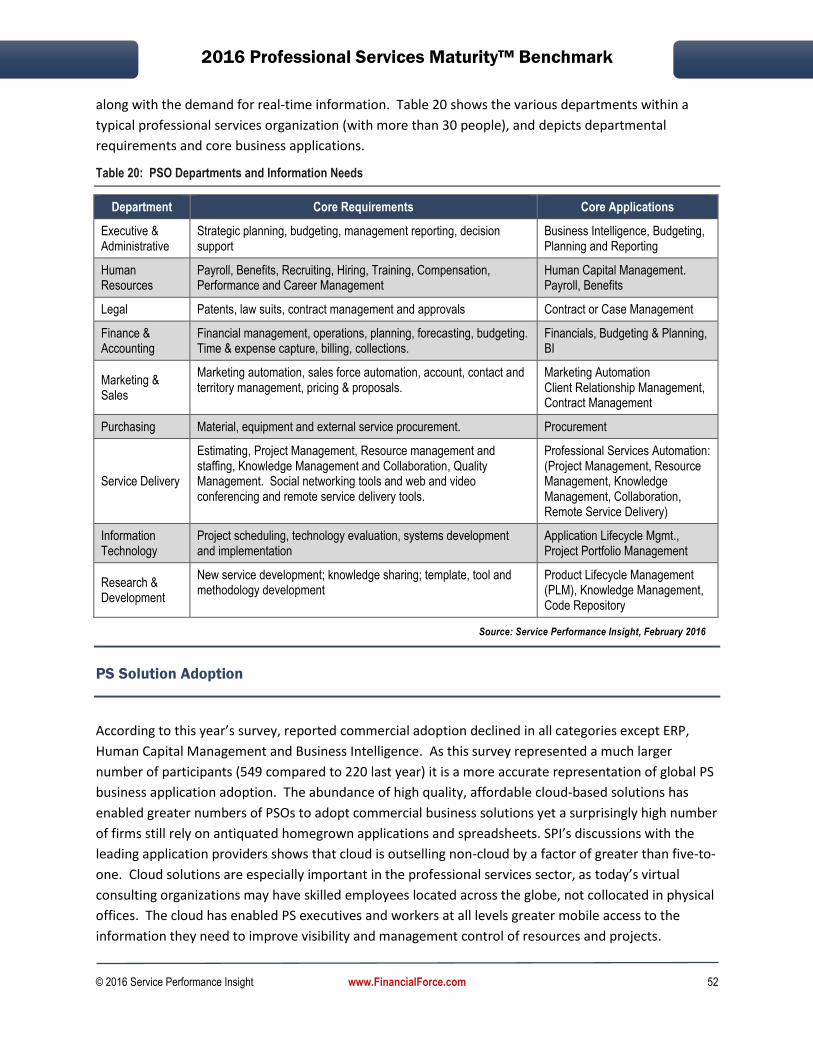
2016 Professional Services Maturity™ Benchmark
© 2016 Service Performance Insight www.FinancialForce.com 52
along with the demand for real-time information. Table 20 shows the various departments within a
typical professional services organization (with more than 30 people), and depicts departmental
requirements and core business applications.
Table 20: PSO Departments and Information Needs
Department Core Requirements Core Applications
Executive & Administrative
Strategic planning, budgeting, management reporting, decision support
Business Intelligence, Budgeting, Planning and Reporting
Human Resources
Payroll, Benefits, Recruiting, Hiring, Training, Compensation, Performance and Career Management
Human Capital Management. Payroll, Benefits
Legal Patents, law suits, contract management and approvals Contract or Case Management
Finance & Accounting
Financial management, operations, planning, forecasting, budgeting. Time & expense capture, billing, collections.
Financials, Budgeting & Planning, BI
Marketing & Sales
Marketing automation, sales force automation, account, contact and territory management, pricing & proposals.
Marketing Automation Client Relationship Management, Contract Management
Purchasing Material, equipment and external service procurement. Procurement
Service Delivery
Estimating, Project Management, Resource management and staffing, Knowledge Management and Collaboration, Quality Management. Social networking tools and web and video conferencing and remote service delivery tools.
Professional Services Automation: (Project Management, Resource Management, Knowledge Management, Collaboration, Remote Service Delivery)
Information Technology
Project scheduling, technology evaluation, systems development and implementation
Application Lifecycle Mgmt., Project Portfolio Management
Research & Development
New service development; knowledge sharing; template, tool and methodology development
Product Lifecycle Management (PLM), Knowledge Management, Code Repository
Source: Service Performance Insight, February 2016
PS Solution Adoption
According to this year’s survey, reported commercial adoption declined in all categories except ERP,
Human Capital Management and Business Intelligence. As this survey represented a much larger
number of participants (549 compared to 220 last year) it is a more accurate representation of global PS
business application adoption. The abundance of high quality, affordable cloud-based solutions has
enabled greater numbers of PSOs to adopt commercial business solutions yet a surprisingly high number
of firms still rely on antiquated homegrown applications and spreadsheets. SPI’s discussions with the
leading application providers shows that cloud is outselling non-cloud by a factor of greater than five-to-
one. Cloud solutions are especially important in the professional services sector, as today’s virtual
consulting organizations may have skilled employees located across the globe, not collocated in physical
offices. The cloud has enabled PS executives and workers at all levels greater mobile access to the
information they need to improve visibility and management control of resources and projects.
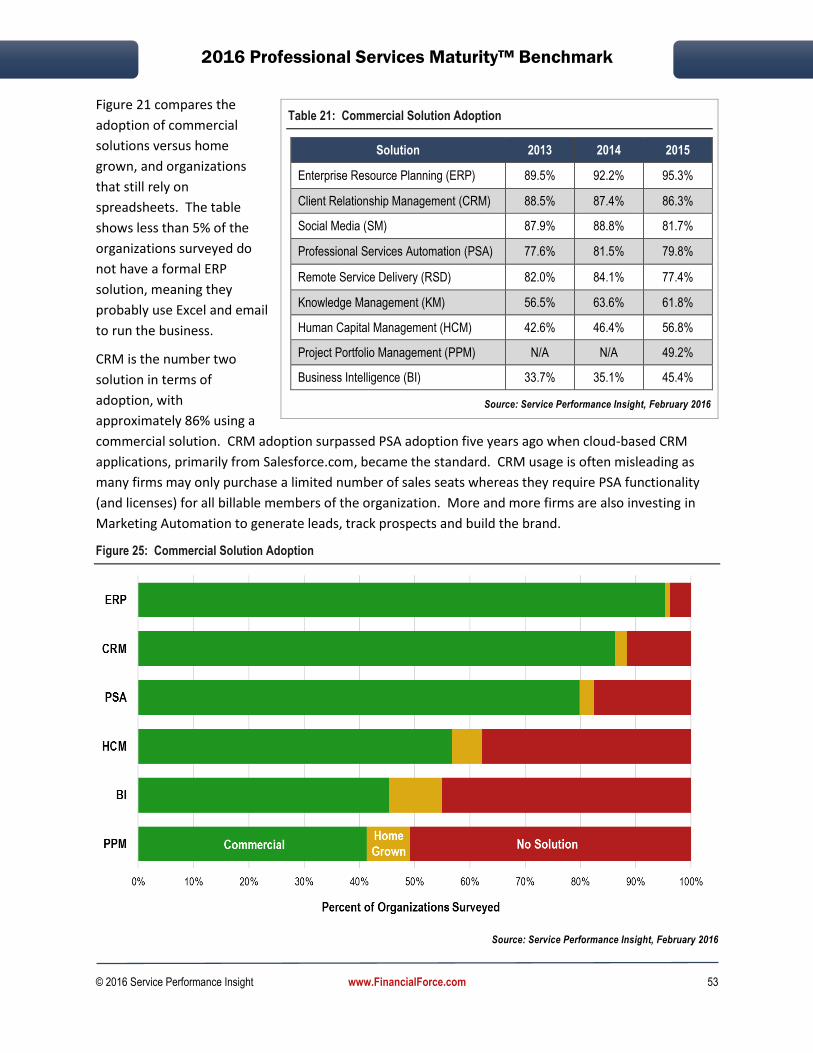
2016 Professional Services Maturity™ Benchmark
© 2016 Service Performance Insight www.FinancialForce.com 53
Figure 21 compares the
adoption of commercial
solutions versus home
grown, and organizations
that still rely on
spreadsheets. The table
shows less than 5% of the
organizations surveyed do
not have a formal ERP
solution, meaning they
probably use Excel and email
to run the business.
CRM is the number two
solution in terms of
adoption, with
approximately 86% using a
commercial solution. CRM adoption surpassed PSA adoption five years ago when cloud-based CRM
applications, primarily from Salesforce.com, became the standard. CRM usage is often misleading as
many firms may only purchase a limited number of sales seats whereas they require PSA functionality
(and licenses) for all billable members of the organization. More and more firms are also investing in
Marketing Automation to generate leads, track prospects and build the brand.
Figure 25: Commercial Solution Adoption
Source: Service Performance Insight, February 2016
Table 21: Commercial Solution Adoption
Solution 2013 2014 2015
Enterprise Resource Planning (ERP) 89.5% 92.2% 95.3%
Client Relationship Management (CRM) 88.5% 87.4% 86.3%
Social Media (SM) 87.9% 88.8% 81.7%
Professional Services Automation (PSA) 77.6% 81.5% 79.8%
Remote Service Delivery (RSD) 82.0% 84.1% 77.4%
Knowledge Management (KM) 56.5% 63.6% 61.8%
Human Capital Management (HCM) 42.6% 46.4% 56.8%
Project Portfolio Management (PPM) N/A N/A 49.2%
Business Intelligence (BI) 33.7% 35.1% 45.4%
Source: Service Performance Insight, February 2016

2016 Professional Services Maturity™ Benchmark
© 2016 Service Performance Insight www.FinancialForce.com 54
SPI Research continues to see increased adoption of PSA business solutions (80%). Increasingly legacy
on-premise applications are being replaced by cloud-based PSA applications. Many standalone PSA
solutions are not yet integrated with the core financial (ERP) solution. SPI’s research continually points
to application integration as a key enabler of superlative business performance.
Human Capital Management (HCM) applications have experienced the greatest growth in PS adoption.
As new cloud-based, powerful HCM applications have come to market expect to see adoption continue
to rise to equal or even surpass PSA. It only makes sense that people, the crown jewels of the consulting
profession, will benefit from applications which empower employees to manage their own skill and
career development. Further, the HCM financial benefits in improved recruiting are significant as the
average PSO spends more than 2% of total revenue on recruiting and another 1 to 2% on training.
Table 22 compares business solution adoption and satisfaction along with the level of ERP integration.
As the Professional Service industry is larger and more established in North America, business
application adoption for the major applications (ERP, CRM and PSA) leads both EMEA and APAC.
However, as cloud applications have become more pervasive, PS application usage in Asia Pacific has
significantly surpassed EMEA in all categories. Now Asia Pacific adoption of PPM (Project Portfolio
Management), KM (Knowledge Management), Remote Service Delivery and Social Networking have
even surpassed North America. Application satisfaction is highest in Asia Pacific and lowest in EMEA.
Table 22: Business Application Use by Organization Type and Geographic Region
Key Performance Indicator (KPI) 2015 ESO PSO Americas EMEA APac
Commercial ERP solution used 95.3% 96.9% 94.5% 96.9% 91.4% 94.1%
Satisfaction with ERP solution 3.70 3.55 3.78 3.70 3.64 3.93
Commercial CRM solution 86.3% 96.5% 81.4% 89.2% 79.3% 83.3%
Satisfaction with CRM solution 4.01 4.05 3.98 4.04 3.89 4.03
CRM is integrated with ERP 43.2% 50.0% 39.2% 43.9% 40.3% 45.2%
Commercial PSA solution 79.8% 82.1% 78.8% 81.1% 76.3% 80.6%
Satisfaction with PSA solution 3.79 3.65 3.86 3.76 3.87 3.80
PSA is integrated with ERP 56.4% 54.0% 57.6% 56.8% 54.5% 58.3%
Commercial HCM solution 56.8% 66.9% 52.0% 63.1% 41.1% 51.4%
Satisfaction with HCM solution 3.70 3.56 3.78 3.72 3.54 3.86
HCM is integrated with ERP 40.7% 39.7% 41.4% 43.1% 31.8% 40.9%
Commercial BI solution 45.4% 50.6% 42.9% 45.9% 46.2% 37.1%
Satisfaction with BI solution 3.70 3.74 3.68 3.70 3.70 3.74
BI is integrated with ERP 50.8% 60.2% 45.3% 54.9% 40.8% 44.7%
Commercial PPM solution 49.2% 51.0% 48.4% 50.0% 45.3% 55.9%
Satisfaction with PPM solution 3.67 3.80 3.59 3.74 3.49 3.58
PPM is integrated with ERP 28.1% 26.8% 28.8% 31.1% 24.0% 16.7%
Commercial KM solution 61.8% 70.3% 57.5% 62.4% 55.2% 79.4%

2016 Professional Services Maturity™ Benchmark
© 2016 Service Performance Insight www.FinancialForce.com 55
Key Performance Indicator (KPI) 2015 ESO PSO Americas EMEA APac
Satisfaction with KM solution 3.69 3.70 3.68 3.70 3.56 3.89
Comm. Remote service delivery tool 77.4% 88.2% 72.0% 80.8% 66.7% 83.3%
Satisfaction with RSD solution 3.88 3.95 3.84 3.90 3.72 4.14
Commercial Social networking tool 81.7% 73.8% 85.5% 80.1% 83.3% 91.4%
Sat. with social networking tool 3.70 3.70 3.70 3.73 3.62 3.73
CRM / PSA integration 36.4% 41.2% 34.1% 35.3% 37.5% 43.2%
Source: Service Performance Insight, February 2016
The level of solution adoption is generally higher within embedded PS organizations. Table 22 shows
CRM is significantly more prevalent in embedded service organizations than in independents (PSOs), but
this is to be expected because embedded service organizations (ESOs) tend to be larger and have a
strong product-oriented sales force who are responsible for bringing services into deals. Generally,
these organizations are part of a larger product organization; larger organizations must rely more
heavily on business applications to improve performance.
As one might expect, Table 23 shows higher levels of solution adoption as organizations grow in size.
And for the most part, greater solution integration with core financials also increases as organizations
grow. Even with the proliferation of affordable and easy-to-use cloud solutions, the smallest
organizations will always lag in their adoption rates. SPI Research has seen adoption increase in both
large and small organizations. This figure highlights the importance professional services organizations
have placed on building a strong financial application infrastructure to enhance visibility and
management control resulting in higher productivity and profit.
Table 23: Business Application Use by Organization Size
Key Performance Indicator (KPI) Under 10 10 - 30 31 - 100 101 - 300 301 - 700 Over 700
Commercial ERP solution used 66.7% 98.7% 97.0% 100.0% 100.0% 100.0%
Satisfaction with ERP solution 4.03 3.57 3.64 3.66 3.46 4.04
Commercial CRM solution 70.4% 81.8% 90.3% 84.0% 98.1% 92.3%
Satisfaction with CRM solution 3.97 4.08 3.96 4.00 3.94 4.08
CRM is integrated 36.1% 34.5% 36.5% 44.1% 48.0% 61.4%
Commercial PSA solution 58.2% 83.9% 82.6% 75.8% 82.7% 88.5%
Satisfaction with PSA solution 3.91 3.83 3.85 3.62 3.59 4.00
PSA is integrated 46.6% 50.7% 55.4% 61.0% 55.8% 61.9%
Commercial HCM solution 21.2% 40.7% 56.6% 65.0% 67.3% 84.6%
Satisfaction with HCM solution 3.73 3.75 3.73 3.62 3.43 3.86
HCM is integrated 45.5% 24.2% 40.8% 35.0% 44.4% 54.8%

2016 Professional Services Maturity™ Benchmark
© 2016 Service Performance Insight www.FinancialForce.com 56
Key Performance Indicator (KPI) Under 10 10 - 30 31 - 100 101 - 300 301 - 700 Over 700
Commercial BI solution 22.2% 34.5% 46.4% 48.7% 44.9% 76.9%
Satisfaction with BI solution 3.50 3.74 3.63 3.73 3.60 3.60
BI is integrated 30.8% 31.3% 52.3% 53.4% 53.4% 55.6%
Commercial PPM solution 34.0% 40.5% 51.7% 47.7% 56.8% 54.2%
Satisfaction with PPM solution 3.76 3.27 3.74 3.74 3.33 3.85
PPM is integrated 15.6% 19.0% 13.9% 37.8% 21.4% 45.5%
Commercial KM solution 45.8% 52.6% 61.1% 58.3% 71.7% 87.0%
Satisfaction with KM solution 3.57 3.75 3.63 3.55 3.63 4.00
Comm. Remote service delivery tool 52.8% 77.0% 80.0% 75.7% 84.3% 84.6%
Satisfaction with RSD solution 3.74 3.75 3.97 3.71 4.05 3.81
Commercial Social networking tool 83.0% 81.4% 86.9% 80.7% 73.5% 72.0%
Satisfaction with social networking tool 3.67 3.77 3.73 3.49 3.56 3.93
CRM / PSA integration 26.4% 41.7% 38.0% 28.9% 31.5% 53.6%
Source: Service Performance Insight, February 2016
Table 24 shows embedded services organizations (Software/SaaS/Hardware PS) have somewhat higher
adoption rates than independents. Generally, these organizations are part of a larger product
organization, larger organizations tend to rely more heavily on business applications to improve
performance. Architects and Engineers reported the lowest level of application usage across all
categories. This is clearly an area for improvement across the construction industries.
Table 24: Business Application Use by Vertical Service Market
Key Performance Indicator (KPI) IT Consult
Software PS
Mgmt. Consult
Arch./ Engr.
SaaS Mgd.
Services Hardware
Commercial ERP solution used 97.0% 96.3% 93.3% 86.7% 97.3% 93.3% 100.0%
Satisfaction with ERP solution 3.80 3.41 4.00 3.76 3.46 3.85 3.62
Commercial CRM solution 86.6% 95.3% 75.8% 69.6% 97.6% 93.8% 100.0%
Satisfaction with CRM solution 4.09 3.95 4.14 3.50 4.22 4.07 3.80
CRM is integrated 36.3% 50.6% 30.4% 53.1% 44.7% 50.0% 53.3%
Commercial PSA solution 86.5% 84.9% 65.2% 77.1% 85.7% 56.3% 93.3%
Satisfaction with PSA solution 3.89 3.59 3.96 3.84 3.58 3.91 3.71
PSA is integrated 57.0% 53.7% 43.2% 72.4% 45.9% 59.1% 57.1%
Commercial HCM solution 56.3% 65.4% 42.9% 43.5% 68.3% 73.3% 66.7%
Satisfaction with HCM solution 3.79 3.46 3.70 3.90 3.77 3.55 3.36

2016 Professional Services Maturity™ Benchmark
© 2016 Service Performance Insight www.FinancialForce.com 57
Key Performance Indicator (KPI) IT Consult
Software PS
Mgmt. Consult
Arch./ Engr.
SaaS Mgd.
Services Hardware
HCM is integrated 38.9% 35.2% 33.3% 54.8% 40.4% 33.3% 54.5%
Commercial BI solution 47.2% 48.1% 39.7% 38.3% 46.3% 56.3% 60.0%
Satisfaction with BI solution 3.77 3.67 3.39 3.75 3.96 3.80 3.27
BI is integrated 44.3% 52.4% 35.7% 50.0% 64.3% 65.0% 63.6%
Commercial PPM solution 48.4% 42.0% 52.6% 45.2% 57.5% 68.8% 66.7%
Satisfaction with PPM solution 3.71 3.72 3.50 3.50 4.05 3.90 3.70
PPM is integrated 34.3% 25.0% 14.0% 13.3% 25.0% 35.0% 38.9%
Commercial KM solution 64.2% 76.1% 56.1% 40.0% 70.0% 81.3% 66.7%
Satisfaction with KM solution 3.80 3.57 3.61 3.33 3.78 3.82 3.90
Comm. Remote service delivery 81.0% 91.6% 69.2% 53.2% 90.5% 68.8% 86.7%
Satisfaction with RSD solution 3.85 4.04 3.74 4.04 4.00 3.50 3.62
Comm. Social networking tool 88.7% 71.3% 90.8% 76.6% 76.9% 68.8% 73.3%
Sat. with social networking tool 3.77 3.70 3.72 3.40 3.75 3.44 3.40
CRM / PSA integration 38.1% 37.4% 30.9% 30.0% 41.7% 41.2% 50.0%
Source: Service Performance Insight, February 2016
Table 25 shows VARs and Marketing and Communication firms rely on ERP and CRM applications with
100% adoption reported. Across the board, application adoption for Accountancies lags other industry
segments. This clearly needs to change as accountancies are experiencing more price pressure and
commoditization than most other market segments. A key impediment is that many accountancies still
rely on complex, homegrown legacy applications. They should strongly consider moving more of their
applications to the new breed of cost-effective cloud-based solutions to modernize their operations.
Table 25: Business Application Use by Vertical Service Market
Key Performance Indicator (KPI) R&D VAR Account MarCom Staff Other PS
Commercial ERP solution used 93.3% 100.0% 100.0% 100.0% 87.5% 100.0%
Satisfaction with ERP solution 3.43 4.14 3.78 3.09 2.80 4.30
Commercial CRM solution 66.7% 100.0% 83.3% 100.0% 77.8% 75.0%
Satisfaction with CRM solution 3.60 4.36 3.60 3.83 3.43 4.33
CRM is integrated 70.0% 57.1% 55.0% 33.3% 35.7% 50.0%
Commercial PSA solution 86.7% 71.4% 50.0% 75.0% 66.7% 70.0%
Satisfaction with PSA solution 3.62 4.00 3.33 3.89 3.67 3.50
PSA is integrated 77.3% 75.0% 50.0% 44.4% 50.0% 83.3%

2016 Professional Services Maturity™ Benchmark
© 2016 Service Performance Insight www.FinancialForce.com 58
Key Performance Indicator (KPI) R&D VAR Account MarCom Staff Other PS
Commercial HCM solution 53.3% 64.3% 50.0% 45.5% 55.6% 80.0%
Satisfaction with HCM solution 3.88 3.67 3.67 3.83 3.40 3.88
HCM is integrated 78.6% 55.6% 41.7% 25.0% 30.0% 50.0%
Commercial BI solution 35.7% 61.5% 50.0% 20.0% 55.6% 22.2%
Satisfaction with BI solution 3.60 4.00 3.33 4.00 3.33 4.00
BI is integrated 90.0% 77.8% 60.0% 25.0% 58.3% 33.3%
Commercial PPM solution 42.9% 38.5% 25.0% 66.7% 55.6% 55.6%
Satisfaction with PPM solution 3.50 3.20 3.00 3.50 3.20 3.80
PPM is integrated 70.0% 0.0% 16.7% 20.0% 30.0% 50.0%
Commercial KM solution 71.4% 30.8% 41.7% 50.0% 33.3% 66.7%
Satisfaction with KM solution 3.30 4.25 3.00 4.75 4.33 3.17
Comm. Remote service delivery 78.6% 85.7% 50.0% 80.0% 55.6% 50.0%
Satisfaction with RSD solution 3.73 4.00 4.00 3.63 4.20 3.40
Comm. Social networking tool 71.4% 85.7% 66.7% 90.0% 100.0% 60.0%
Sat. with social networking tool 3.56 4.00 3.63 4.00 3.56 3.40
CRM / PSA integration 36.7% 53.6% 15.4% 29.2% 44.4% 16.7%
Source: Service Performance Insight, February 2016
Solution Satisfaction
Table 26 shows
application
satisfaction (1: very
dissatisfied to 5:
very satisfied).
Satisfaction with
CRM tops the list
followed by Remote
Service Delivery and
PSA. Satisfaction
levels are the same
for ERP, Social
Media, Human
Capital Management
Table 26: Solution Satisfaction
Solution 2012 2013 2014 2015
Client Relationship Management (CRM) 3.92 4.04 3.93 4.01
Remote Service Delivery and Collaboration 4.25 4.05 3.86 3.88
Professional Services Automation (PSA) 3.84 3.85 4.07 3.79
Enterprise Resource Planning (ERP) 3.67 3.74 3.68 3.70
Social Media 4.02 3.91 3.89 3.70
Human Capital Management (HCM) 3.66 3.55 3.61 3.70
Project Portfolio Management (PPM) NA NA NA 3.67
Business Intelligence (BI) 3.68 3.65 3.76 3.70
Knowledge Management (KM) 3.67 3.56 3.74 3.69
Source: Service Performance Insight, February 2016

2016 Professional Services Maturity™ Benchmark
© 2016 Service Performance Insight www.FinancialForce.com 59
and Business Intelligence (BI) satisfaction. Knowledge Management garnered the lowest satisfaction
ratings.
Financial Management Applications (Enterprise or Service Resource Planning)
Finance and Accounting, (ERP or SRP), is the primary application required
to accurately collect, bill and report financial transactions. ERP collects
and manages all financial information (expenses, invoices, etc.) to
provide management reporting and visibility into total service revenue,
cost and profitability. Project-driven, human capital intense businesses
like professional services have unique financial management
requirements including support for complex contract types and billing
arrangements. Revenue recognition is also complex and must conform
to local accounting and taxation rules while providing support for
multicurrency, multilingual transactions for global firms. Seamless
integration between the system of record (PSA) for managing resources
and projects and the financial management solution for payroll, expense
management, invoicing, revenue recognition and project accounting is
critical.
Figure 26: Financial Management Solution Used
Source: Service Performance Insight, February 2016
Figure 26 shows NetSuite is the leading financial solution in this year's benchmark with over 26% of
survey respondents using it. QuickBooks from Intuit, typically number one, declined to the number two
position. QuickBooks market-share is expected to continue to decline as more cost effective low end

2016 Professional Services Maturity™ Benchmark
© 2016 Service Performance Insight www.FinancialForce.com 60
solutions come to market with the project accounting and resource management functionality required
by PS firms. Microsoft Dynamics, SAP and Oracle are also strong competitors in this market. SAP and
Oracle financials still dominate with the largest organizations but they are increasingly feeling pressure
from Workday as Workday’s people-centric ERP is more appropriate for PS organizations. Many of the
smaller organizations (less than 10 employees) do not use a financial management solution. Also, a few
of the larger organizations said they did not have an ERP solution, as their financial information is
managed by the corporate solution, which they did not list.
The figure highlights (light green) that a number of firms use either homegrown solutions, other
commercial solutions not included on the list, or no official financial solution at all. The financial
management solution is critical for managing PS finance and accounting, regulatory reporting and profit
analysis.
Client Relationship Management (CRM)
CRM supports the management of client relationships and is designed to
improve sales and marketing effectiveness. CRM automates lead,
contact and campaign management, sales pipeline forecasting and
territory management. Many CRM applications also provide powerful
call center functionality for issue management; call handling; trouble
ticketing and problem resolution. CRM allows PSOs to track clients
through the engagement (bid to bill) lifecycle, and to specifically target
customer segments and offers by understanding details of the
relationship. CRM supports analysis by client, geography and portfolio.
Figure 27: Client Relationship Management (CRM) Solution Used
Source: Service Performance Insight, February 2016

2016 Professional Services Maturity™ Benchmark
© 2016 Service Performance Insight www.FinancialForce.com 61
Figure 27 shows Salesforce.com dominance once again with use by 42% of the organizations surveyed.
Microsoft Dynamics CRM, is again number two, with slightly over 15%. Its cloud offering is rapidly
growing in market share.
NetSuite is the third leading CRM
provider in this year’s
benchmark. Because of the
dominance of Salesforce.com,
there are very few independent
CRM providers found in the
benchmark. Most of the others
are part of an ERP suite, which
support SPI’s research that shows
approximately 50% of
organizations prefer independent
best-of-breed solutions, while
the other 50% prefer
comprehensive integrated
solutions provided by the ERP
vendors.
Table 27 compares organizations using CRM to those who do not. 13% of the organizations surveyed do
not use any type of CRM solution. The table shows organizations using CRM are larger than those who
do not use it. As the table shows, CRM definitely benefits organizations in terms of growth. CRM users
have larger sales pipelines, more revenue from new clients and substantially more revenue per
consultant and employee. It also has a positive impact on the profitability of the work delivered, as
improved sales effectiveness leads to a more efficient use of resources down the line. Profitability is
clearly enhanced when CRM is integrated with PSA and the ERP application.
Table 28 further depicts CRM
impact, comparing those
organizations not using CRM at
all to those organizations using
non-integrated CRM, and
comparing them to organizations
using CRM integrated to the core
financial solution. This table
highlights the benefits
organizations receive as they
move from nonintegrated CRM
to integrated CRM. While these
benefits might not be
revolutionary, they do underscore greater visibility and improved alignment between sales and service
delivery. These benefits are amplified as organizations grow.
Table 27: Impact – Client Relationship Management (CRM) Use
KPI CRM Used
CRM Not Used
▲
Survey responses (commercial CRM) 460 73
PSO size (employees) 674 330 105%
Year-over-year change in PS revenue 10.7% 7.1% 51%
Year-over-year change in PS headcount 8.2% 5.4% 52%
Deal pipeline relative to qtr. bookings forecast
178% 129% 38%
New Clients 28.9% 19.8% 46%
Annual revenue per billable consultant (k) $200 $179 12%
Annual revenue per employee (k) $160 $137 17%
EBITDA 15.5% 13.7% 14%
Source: Service Performance Insight, February 2016
Table 28: Impact – Commercial CRM Integration
KPI CRM Not
Used Used, Not Integrated
Used, Integrated
Survey responses 73 167 262
Revenue from new clients 19.8% 29.5% 29.0%
Year-over-year change in PS headcount
5.4% 7.4% 8.9%
Deal pipeline relative to qtr. bookings forecast
129% 181% 175%
EBITDA 13.7% 13.9% 17.5%
Source: Service Performance Insight, February 2016

2016 Professional Services Maturity™ Benchmark
© 2016 Service Performance Insight www.FinancialForce.com 62
Professional Service Automation (PSA)
PSA provides the systems basis for initiation, planning, execution, close
and control of projects and service delivery. It helps manage key service
execution processes including resource management and staffing, project
management and collaboration, along with time and expense capture
and billing. As management and control of service execution has become
more important, and the applications have matured to become easy to
use and implement, PSA solutions have become increasingly popular.
Some software vendors use the term “Services Resource Planning (SRP)”
to distinguish their solutions from PSA. SRP solutions typically include
both CRM and invoicing capabilities, as those are generally handled by
the core CRM and ERP modules. Larger PSOs rely more heavily on their core ERP solutions to manage
any external transactions which means PSA integration is imperative as billing, collection, expense
management and payroll are all managed in the ERP solution.
Figure 28: Professional Services Automation (PSA) Solution Used
Source: Service Performance Insight, February 2016
Figure 28 shows NetSuite/OpenAir as the most adopted PSA solution in this year's survey with
approximately 28% (149 firms) of the survey. None is the second-most prevalent solution with 20% (93
firms) of survey respondents not using a PSA. Interestingly, the average size of the organizations who do
not use a PSA is quite large at 329 PS employees. Assistance PSA, a newcomer to this benchmark, came
in third with 10% (51 firms) primarily based in EMEA. Projector came in fourth with 9% (50 firms).
FinancialForce, based on the Salesforce 1 platform and jointly funded by UNIT4 and Salesforce, moved
into fifth place with 6% (33 firms.). Kimble, a PSA provider built on the Salesforce 1 platform, has gained
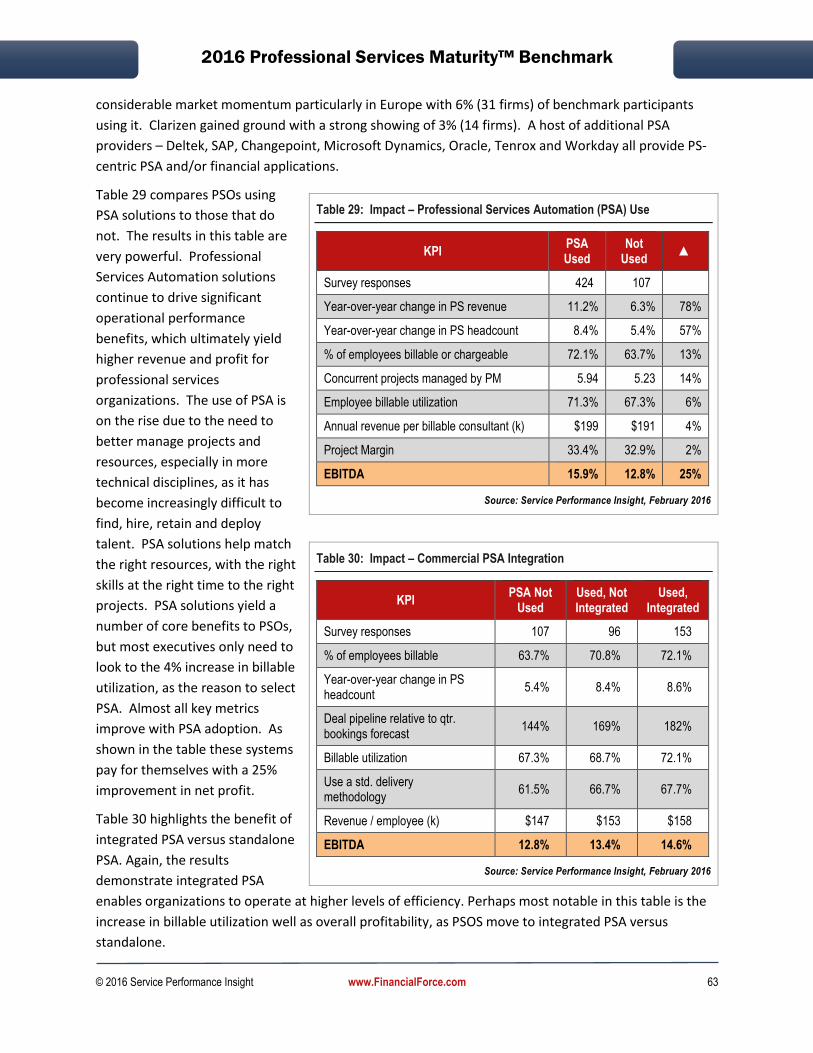
2016 Professional Services Maturity™ Benchmark
© 2016 Service Performance Insight www.FinancialForce.com 63
considerable market momentum particularly in Europe with 6% (31 firms) of benchmark participants
using it. Clarizen gained ground with a strong showing of 3% (14 firms). A host of additional PSA
providers – Deltek, SAP, Changepoint, Microsoft Dynamics, Oracle, Tenrox and Workday all provide PS-
centric PSA and/or financial applications.
Table 29 compares PSOs using
PSA solutions to those that do
not. The results in this table are
very powerful. Professional
Services Automation solutions
continue to drive significant
operational performance
benefits, which ultimately yield
higher revenue and profit for
professional services
organizations. The use of PSA is
on the rise due to the need to
better manage projects and
resources, especially in more
technical disciplines, as it has
become increasingly difficult to
find, hire, retain and deploy
talent. PSA solutions help match
the right resources, with the right
skills at the right time to the right
projects. PSA solutions yield a
number of core benefits to PSOs,
but most executives only need to
look to the 4% increase in billable
utilization, as the reason to select
PSA. Almost all key metrics
improve with PSA adoption. As
shown in the table these systems
pay for themselves with a 25%
improvement in net profit.
Table 30 highlights the benefit of
integrated PSA versus standalone
PSA. Again, the results
demonstrate integrated PSA
enables organizations to operate at higher levels of efficiency. Perhaps most notable in this table is the
increase in billable utilization well as overall profitability, as PSOS move to integrated PSA versus
standalone.
Table 29: Impact – Professional Services Automation (PSA) Use
KPI PSA Used
Not Used
▲
Survey responses 424 107
Year-over-year change in PS revenue 11.2% 6.3% 78%
Year-over-year change in PS headcount 8.4% 5.4% 57%
% of employees billable or chargeable 72.1% 63.7% 13%
Concurrent projects managed by PM 5.94 5.23 14%
Employee billable utilization 71.3% 67.3% 6%
Annual revenue per billable consultant (k) $199 $191 4%
Project Margin 33.4% 32.9% 2%
EBITDA 15.9% 12.8% 25%
Source: Service Performance Insight, February 2016
Table 30: Impact – Commercial PSA Integration
KPI PSA Not
Used Used, Not Integrated
Used, Integrated
Survey responses 107 96 153
% of employees billable 63.7% 70.8% 72.1%
Year-over-year change in PS headcount
5.4% 8.4% 8.6%
Deal pipeline relative to qtr. bookings forecast
144% 169% 182%
Billable utilization 67.3% 68.7% 72.1%
Use a std. delivery methodology
61.5% 66.7% 67.7%
Revenue / employee (k) $147 $153 $158
EBITDA 12.8% 13.4% 14.6%
Source: Service Performance Insight, February 2016

2016 Professional Services Maturity™ Benchmark
© 2016 Service Performance Insight www.FinancialForce.com 64
Because the delivery of services is where PSOs make their money, and because PSA is the primary
application utilized by project managers and others responsible for services delivery, it is easy to
understand why the operational and financial benefits are so significant. SPI Research has always
recommended organizations with more than 20 employees utilize PSA. With the cloud-based solutions
now available, PSA should also be considered by smaller organizations.
Human Capital Management (HCM)
Human Capital Management (HCM) solutions (also known as talent management solutions) give
employers the tools to effectively recruit, manage, evaluate and compensate employees. By tracking
performance, skills and career progression, HCM helps companies create and maintain a high-
performance workforce. Key software modules include recruiting, employee learning, skills tracking,
compensation, performance management, policy compliance, and succession planning — each of which
help organizations manage personnel growth and development.
HCM benefits the PSO by maintaining a database of skills, benefits
and pay rate information that is used for resource scheduling,
recruiting and performance and career management. Effective HCM
solutions provide rich applications that allow consultants to manage
their own careers and skill development (training) and bid on the
projects of greatest interest for them.
Figure 29: Human Capital Management (HCM) Solution Used
Source: Service Performance Insight, February 2016
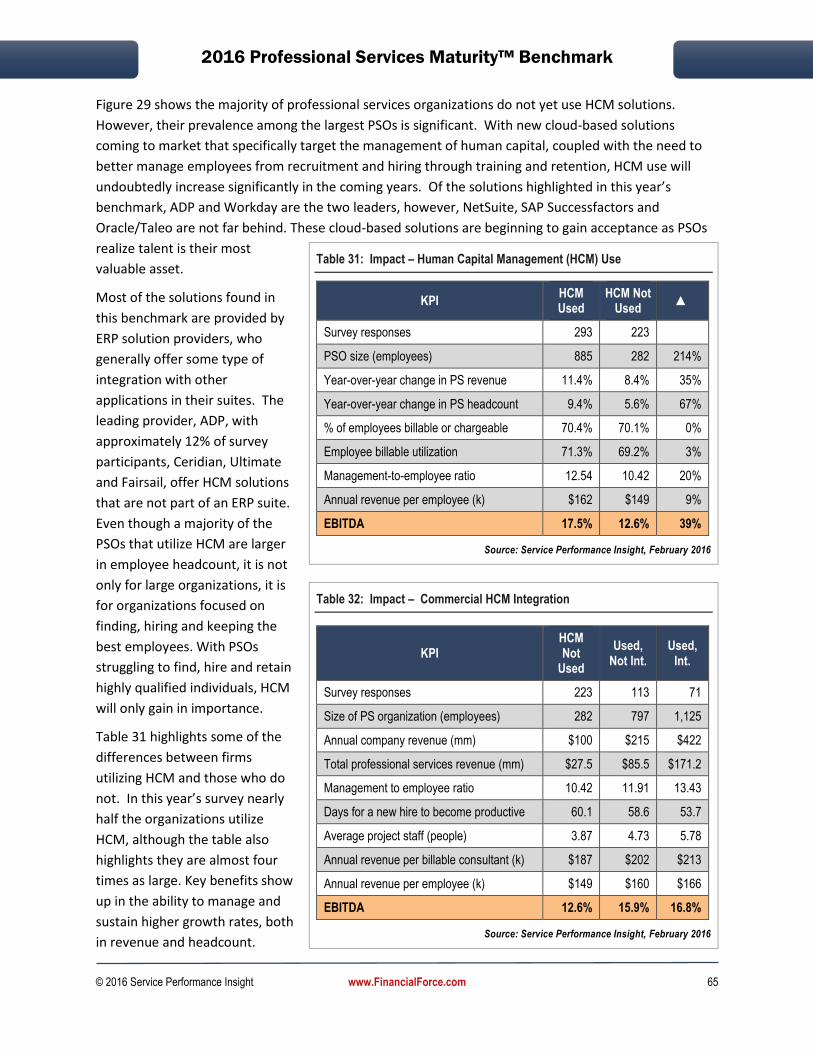
2016 Professional Services Maturity™ Benchmark
© 2016 Service Performance Insight www.FinancialForce.com 65
Figure 29 shows the majority of professional services organizations do not yet use HCM solutions.
However, their prevalence among the largest PSOs is significant. With new cloud-based solutions
coming to market that specifically target the management of human capital, coupled with the need to
better manage employees from recruitment and hiring through training and retention, HCM use will
undoubtedly increase significantly in the coming years. Of the solutions highlighted in this year’s
benchmark, ADP and Workday are the two leaders, however, NetSuite, SAP Successfactors and
Oracle/Taleo are not far behind. These cloud-based solutions are beginning to gain acceptance as PSOs
realize talent is their most
valuable asset.
Most of the solutions found in
this benchmark are provided by
ERP solution providers, who
generally offer some type of
integration with other
applications in their suites. The
leading provider, ADP, with
approximately 12% of survey
participants, Ceridian, Ultimate
and Fairsail, offer HCM solutions
that are not part of an ERP suite.
Even though a majority of the
PSOs that utilize HCM are larger
in employee headcount, it is not
only for large organizations, it is
for organizations focused on
finding, hiring and keeping the
best employees. With PSOs
struggling to find, hire and retain
highly qualified individuals, HCM
will only gain in importance.
Table 31 highlights some of the
differences between firms
utilizing HCM and those who do
not. In this year’s survey nearly
half the organizations utilize
HCM, although the table also
highlights they are almost four
times as large. Key benefits show
up in the ability to manage and
sustain higher growth rates, both
in revenue and headcount.
Table 31: Impact – Human Capital Management (HCM) Use
KPI HCM Used
HCM Not Used
▲
Survey responses 293 223
PSO size (employees) 885 282 214%
Year-over-year change in PS revenue 11.4% 8.4% 35%
Year-over-year change in PS headcount 9.4% 5.6% 67%
% of employees billable or chargeable 70.4% 70.1% 0%
Employee billable utilization 71.3% 69.2% 3%
Management-to-employee ratio 12.54 10.42 20%
Annual revenue per employee (k) $162 $149 9%
EBITDA 17.5% 12.6% 39%
Source: Service Performance Insight, February 2016
Table 32: Impact – Commercial HCM Integration
KPI HCM Not
Used
Used, Not Int.
Used, Int.
Survey responses 223 113 71
Size of PS organization (employees) 282 797 1,125
Annual company revenue (mm) $100 $215 $422
Total professional services revenue (mm) $27.5 $85.5 $171.2
Management to employee ratio 10.42 11.91 13.43
Days for a new hire to become productive 60.1 58.6 53.7
Average project staff (people) 3.87 4.73 5.78
Annual revenue per billable consultant (k) $187 $202 $213
Annual revenue per employee (k) $149 $160 $166
EBITDA 12.6% 15.9% 16.8%
Source: Service Performance Insight, February 2016

2016 Professional Services Maturity™ Benchmark
© 2016 Service Performance Insight www.FinancialForce.com 66
Higher billable utilization occurs because the right people with the right skills are available to do the
work. Larger management span of control reduces the cost of non-billable management and enhances
the bottom-line. HCM produces impressive gains in revenue per employee and net profit. The fact is
that as organizations grow, human capital management becomes increasingly important.
HCM solutions provide greater visibility into employee skills, preferences, training and career
advancement. They ensure equitable compensation and are an integral component of pay for
performance and reward systems.
Talent management is central to PS performance as the skills and attitudes of the consulting workforce
provide tangible evidence of consulting value. And with better management of personnel, PSOs can
ensure talent is on staff and available when needed, which helps the organization grow faster. HCM
solutions, in conjunction with PSA, drive greater billable utilization, which ultimately results in higher
revenue per employee and profitability. Most of the new breed of cloud-based HCM applications offer
mobile access from anywhere, making it easy for employees to keep their profiles and time-off requests
up-to-date. Several HCM vendors are adding rich predictive analytics, providing visibility into levels of
employee engagement and which employees are likely to quit. Their recruiting tools are very powerful
with out-of-the-box integration with top job sites like Monster and LinkedIn.
Business Intelligence (BI)
Business Intelligence integrates information from core business
applications to improve strategic analysis, demand and capacity planning,
budgeting, forecasting and financial planning. BI solutions continue to
increase their adoption in PSOs. As professional services organizations
mature, BI becomes a more critical tool to provide real-time visibility to
all aspects of the operation — allowing executives to spot trends and
take corrective action early. It also is an important solution for annual
planning, as PS executives try to uncover areas where additional growth
and profit can be extracted.
Figure 30 shows relatively low adoption levels of Business Intelligence in this year's survey, similar to
those in the past. However, SPI Research has seen increased adoption over the past eight years. None,
other and homegrown are the most prevalent BI solutions. Of the application suite providers, NetSuite,
Microsoft Dynamics, IBM/Cognos/SPSS, Oracle/Hyperion and Deltek each have a wide following.
Informatica and Adaptive Insights round out the line-up with their Best-of-Breed solutions. The trend
continues toward leading providers offering BI in the cloud, providing greater accessibility for executives
around the world as well as ease of deployment and mobile access.

2016 Professional Services Maturity™ Benchmark
© 2016 Service Performance Insight www.FinancialForce.com 67
Figure 30: Business Intelligence (BI) Solution Used
Source: Service Performance Insight, February 2016
The results in this table highlight
some of the core benefits
organizations have achieved that use
BI solutions. While each
improvement is impressive, it is
increased profitability that stands out
the most. The fact is BI is a strategic
solution that helps PSOs plan, budget
and forecast the business. Its
powerful “what if” analysis tools help
PSOs model capacity and resource
plans to achieve optimal results.
Going forward BI will continue to
gain in importance and penetration
into the services sector.
Project Portfolio Management (PPM)
Project portfolio management (PPM) solutions enable PSOs to plan and align project-based work with
corporate strategy, as well as to monitor and measure performance. PPM provides visibility into
operational data to better control project costs and to support audit requirements as part of the
corporate governance infrastructure. It also enables companies to efficiently depict and manage a
portfolio of projects to make priority decisions. It also helps model and manage business processes.
Table 33: Impact – Business Intelligence (BI) Use
KPI BI
Used BI Not Used
▲
Survey responses 231 278
PSO size (employees) 822 430 91%
Total professional services revenue (mm) $113.7 $43.5 161%
Year-over-year change in PS headcount 8.5% 7.2% 17%
Deal pipeline relative to qtr. bookings forecast
178% 166% 7%
EBITDA 17.4% 14.2% 22%
Source: Service Performance Insight, February 2016

2016 Professional Services Maturity™ Benchmark
© 2016 Service Performance Insight www.FinancialForce.com 68
PPM is used to plan, prioritize, manage, assess value and provide insight into the people, processes and
capital used throughout a project’s lifecycle. PPM provides integration with project opportunities,
resources, time and cost, and is built upon a robust reporting engine that gives executives greater
visibility and decision-making to link enterprise strategy with operational activities. These solutions are
most often found in IT and internal services organizations.
PPM is both critical and necessary given the complexity of many project-based initiatives. In many cases
one group sponsors a project and another group delivers the work, while a third group is responsible for
managing performance. Complexities arise as executives require visibility into how budgeted funds are
actually spent on a particular project, by what organization, and the value realized at the end of the
project. However, all PPM solutions are not alike. An ideal solution should provide for financial
management capabilities that deliver both top-down guidance coupled with bottom-up execution.
In professional services organizations, PPM is used to help develop new services, as well as manage
projects in internal IT and other departments. Less than 30% of the organizations surveyed utilize PPM
solutions. Billable consulting organizations prefer to use Professional Services Automation (PSA) to
accurately capture and bill for time as making project portfolio decisions is not as important.
Figure 31: Project Portfolio Management (PPM) Solution Used
Source: Service Performance Insight, February 2016
Knowledge Management (KM)
Knowledge Management should be a core application for all PSOs as knowledge, unique intellectual
property, methods and tools are the primary source of service provider differentiation. Approximately
35% of the organizations surveyed reported they do not use a knowledge management application. As
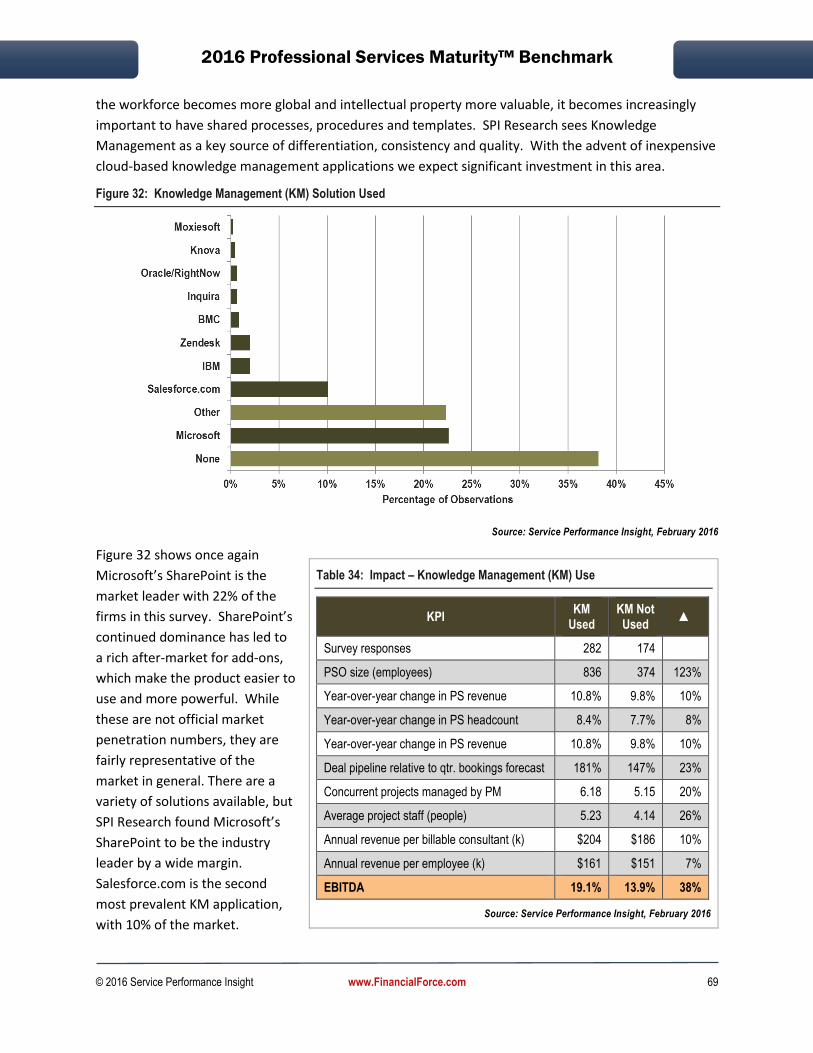
2016 Professional Services Maturity™ Benchmark
© 2016 Service Performance Insight www.FinancialForce.com 69
the workforce becomes more global and intellectual property more valuable, it becomes increasingly
important to have shared processes, procedures and templates. SPI Research sees Knowledge
Management as a key source of differentiation, consistency and quality. With the advent of inexpensive
cloud-based knowledge management applications we expect significant investment in this area.
Figure 32: Knowledge Management (KM) Solution Used
Source: Service Performance Insight, February 2016
Figure 32 shows once again
Microsoft’s SharePoint is the
market leader with 22% of the
firms in this survey. SharePoint’s
continued dominance has led to
a rich after-market for add-ons,
which make the product easier to
use and more powerful. While
these are not official market
penetration numbers, they are
fairly representative of the
market in general. There are a
variety of solutions available, but
SPI Research found Microsoft’s
SharePoint to be the industry
leader by a wide margin.
Salesforce.com is the second
most prevalent KM application,
with 10% of the market.
Table 34: Impact – Knowledge Management (KM) Use
KPI KM
Used KM Not Used
▲
Survey responses 282 174
PSO size (employees) 836 374 123%
Year-over-year change in PS revenue 10.8% 9.8% 10%
Year-over-year change in PS headcount 8.4% 7.7% 8%
Year-over-year change in PS revenue 10.8% 9.8% 10%
Deal pipeline relative to qtr. bookings forecast 181% 147% 23%
Concurrent projects managed by PM 6.18 5.15 20%
Average project staff (people) 5.23 4.14 26%
Annual revenue per billable consultant (k) $204 $186 10%
Annual revenue per employee (k) $161 $151 7%
EBITDA 19.1% 13.9% 38%
Source: Service Performance Insight, February 2016
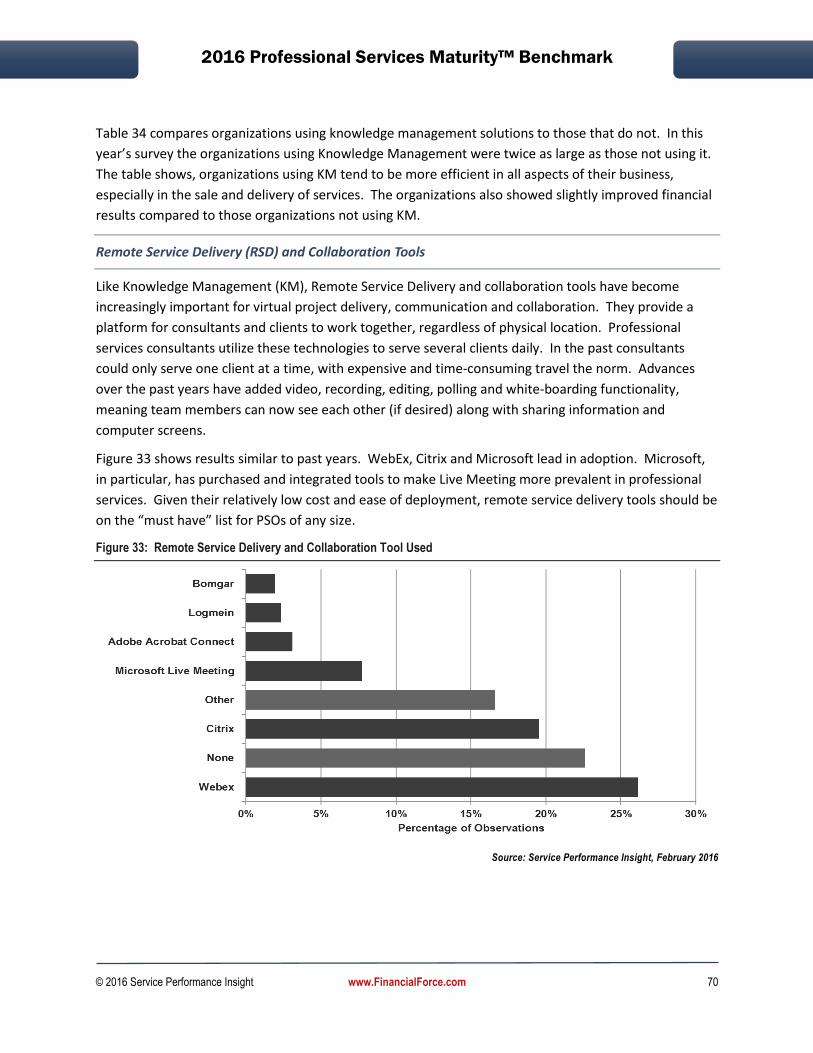
2016 Professional Services Maturity™ Benchmark
© 2016 Service Performance Insight www.FinancialForce.com 70
Table 34 compares organizations using knowledge management solutions to those that do not. In this
year’s survey the organizations using Knowledge Management were twice as large as those not using it.
The table shows, organizations using KM tend to be more efficient in all aspects of their business,
especially in the sale and delivery of services. The organizations also showed slightly improved financial
results compared to those organizations not using KM.
Remote Service Delivery (RSD) and Collaboration Tools
Like Knowledge Management (KM), Remote Service Delivery and collaboration tools have become
increasingly important for virtual project delivery, communication and collaboration. They provide a
platform for consultants and clients to work together, regardless of physical location. Professional
services consultants utilize these technologies to serve several clients daily. In the past consultants
could only serve one client at a time, with expensive and time-consuming travel the norm. Advances
over the past years have added video, recording, editing, polling and white-boarding functionality,
meaning team members can now see each other (if desired) along with sharing information and
computer screens.
Figure 33 shows results similar to past years. WebEx, Citrix and Microsoft lead in adoption. Microsoft,
in particular, has purchased and integrated tools to make Live Meeting more prevalent in professional
services. Given their relatively low cost and ease of deployment, remote service delivery tools should be
on the “must have” list for PSOs of any size.
Figure 33: Remote Service Delivery and Collaboration Tool Used
Source: Service Performance Insight, February 2016

2016 Professional Services Maturity™ Benchmark
© 2016 Service Performance Insight www.FinancialForce.com 71
Social Media
Three years ago SPI Research began to include social media as part of our application analysis. These
tools are being relied on, now more than ever, as organizations work both internally and externally to
find, hire and communicate and market to the best people. Social media has become essential to help
professional services organizations build their brand through thought leadership and market outreach.
Collaboration tools like Yammer, Chatter and Jive have replaced email as the preferred method of
communication for millennials.
Figure 34: Social Media (SM) Solution Used
Source: Service Performance Insight, February 2016
Even the most controlling organizations must recognize and support the trend toward personal devices
and social media if they wish to attract and retain young, connected workers. The downside of the
social media explosion is that it can easily become a time-sink and source of unproductive web-surfing
hours so the trick is to exploit
collaboration, knowledge-sharing
and crowd-sourcing without lost
productive time. Figure 34
shows LinkedIn continues to be
the dominant social media
platform, with more than 40% of
the organizations surveyed using
it. Yammer at 15% and Chatter
at 9% are second and third.
Figure 35: Success depends on inter-departmental cooperation
Source: Service Performance Insight, February 2016
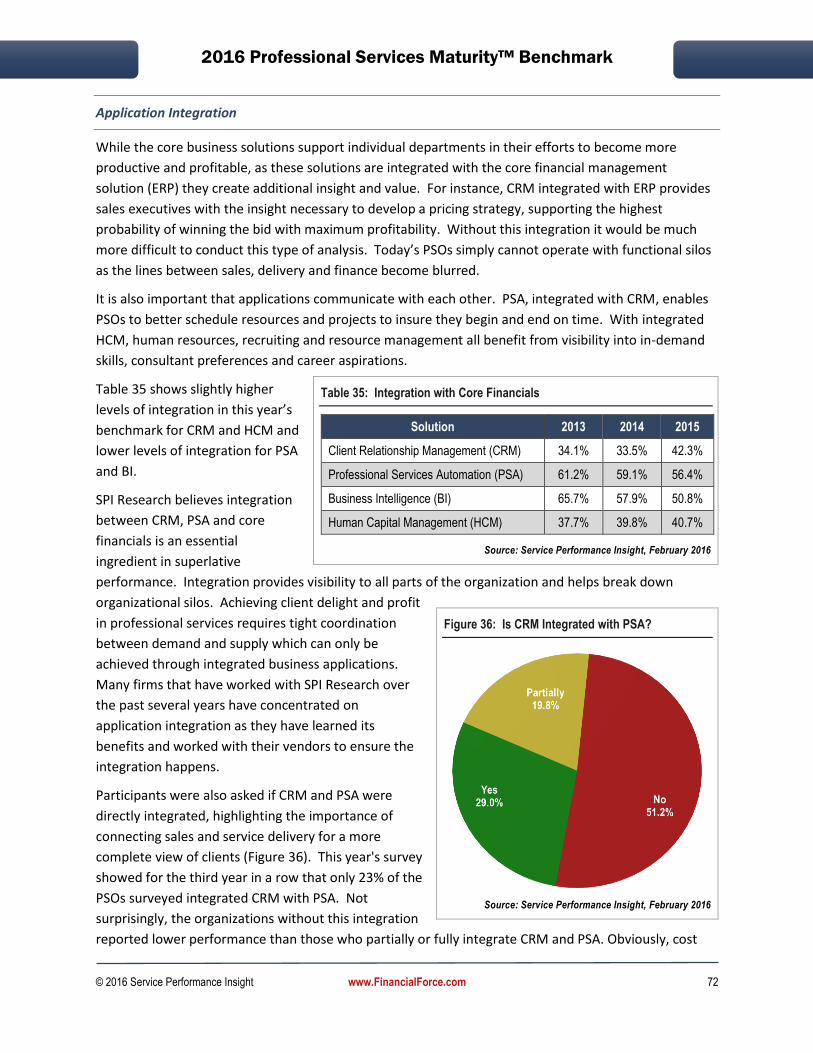
2016 Professional Services Maturity™ Benchmark
© 2016 Service Performance Insight www.FinancialForce.com 72
Application Integration
While the core business solutions support individual departments in their efforts to become more
productive and profitable, as these solutions are integrated with the core financial management
solution (ERP) they create additional insight and value. For instance, CRM integrated with ERP provides
sales executives with the insight necessary to develop a pricing strategy, supporting the highest
probability of winning the bid with maximum profitability. Without this integration it would be much
more difficult to conduct this type of analysis. Today’s PSOs simply cannot operate with functional silos
as the lines between sales, delivery and finance become blurred.
It is also important that applications communicate with each other. PSA, integrated with CRM, enables
PSOs to better schedule resources and projects to insure they begin and end on time. With integrated
HCM, human resources, recruiting and resource management all benefit from visibility into in-demand
skills, consultant preferences and career aspirations.
Table 35 shows slightly higher
levels of integration in this year’s
benchmark for CRM and HCM and
lower levels of integration for PSA
and BI.
SPI Research believes integration
between CRM, PSA and core
financials is an essential
ingredient in superlative
performance. Integration provides visibility to all parts of the organization and helps break down
organizational silos. Achieving client delight and profit
in professional services requires tight coordination
between demand and supply which can only be
achieved through integrated business applications.
Many firms that have worked with SPI Research over
the past several years have concentrated on
application integration as they have learned its
benefits and worked with their vendors to ensure the
integration happens.
Participants were also asked if CRM and PSA were
directly integrated, highlighting the importance of
connecting sales and service delivery for a more
complete view of clients (Figure 36). This year's survey
showed for the third year in a row that only 23% of the
PSOs surveyed integrated CRM with PSA. Not
surprisingly, the organizations without this integration
reported lower performance than those who partially or fully integrate CRM and PSA. Obviously, cost
Table 35: Integration with Core Financials
Solution 2013 2014 2015
Client Relationship Management (CRM) 34.1% 33.5% 42.3%
Professional Services Automation (PSA) 61.2% 59.1% 56.4%
Business Intelligence (BI) 65.7% 57.9% 50.8%
Human Capital Management (HCM) 37.7% 39.8% 40.7%
Source: Service Performance Insight, February 2016
Figure 36: Is CRM Integrated with PSA?
Source: Service Performance Insight, February 2016

2016 Professional Services Maturity™ Benchmark
© 2016 Service Performance Insight www.FinancialForce.com 73
and complexity come into play when the solutions are developed by different providers. Typically,
application suites, such as Deltek, FinancialForce.com, Microsoft, NetSuite and SAP offer out-of-the-box
integration between their core business solutions making a 360-degree view of clients and projects
possible.
The Professional Service IT Maturity™ Model
While every PSO uses
technology somewhat
differently — with
different applications and
varying levels of
integration — SPI
Research believes one of
the best ways to improve
organizational
performance is to deploy
integrated applications to
provide a 360-degree view
of clients and projects to
facilitate decision-making.
Figure 38 highlights the PS
IT Maturity™ Model. As PSOs move from “manual” solutions (spreadsheet or paper-based) toward
integrated and single user-interface solutions, performance improves. SPI Research’s PS IT Maturity™
Model levels are:
Level 1: Initiated – Ad Hoc: Most PSOs begin with manual or spreadsheet-based tools to run the
business. Time and expense capture is manual, sporadic and ad hoc. Billing is performed
manually or through the backend financial application.
∆ Level 2: Piloted – Application Specific: As they grow and engage in more structured processes,
organizations deploy task specific applications (time and expense), project management (PM) and
Knowledge Management (KM), Client Relationship Management (CRM), etc. to better manage
work and to create an audit trail, albeit rudimentary, for tracking work. Many of these task
specific applications provide a database to improve reporting.
∆ Level 3: Deployed – Integrated Applications: As organizations mature they deploy greater
integration of business applications with the core financial (Enterprise Resource Planning (ERP))
solution. At this Level they begin to evaluate the time and cost factors associated with integration
of various point releases. Emphasis at this level is on creating effective management reports to
provide visibility into all facets of the business.
∆ Level 4: Institutionalized – Extended ERP: An increasing number of PSOs at this level of maturity
begin to add various components of ERP applications rather than continually integrate disparate
Figure 37: Professional Service IT Maturity™ Level
Source: Service Performance Insight, February 2016

2016 Professional Services Maturity™ Benchmark
© 2016 Service Performance Insight www.FinancialForce.com 74
applications. SPI Research uses the term extended ERP or SRP (Service Resource Planning). Now
professional services organizations are purchasing both core financials as well as other pre-
integrated application suites from the same ERP solution provider. Currently CRM is the most
popular application that is purchased pre-integrated with financials, closely followed by
Professional Services Automation (PSA). Other applications that are being acquired from the same
ERP vendor include human capital management, business intelligence, and procurement.
∆ Level 5: Optimized – Extended ERP and Analytics: Finally, as the PSO has significant integration
in its application infrastructure it turns the solution loose to efficiently surface and report data to
optimally measure and transform the organization. Most, if not all, core applications are
integrated to provide visibility into the work being sold, executed, and closed.
While not every PSO is run with a completely integrated set of business applications, SPI Research has
seen the level of integration increase significantly over the past eight years. This development will
continue regardless of the economy as many PS firms see IT as a way to not only cut costs, but also as a
means to improve operational efficiency and effectiveness.
Figure 38: PS Dashboard
Source: Service Performance Insight, February 2016

2016 Professional Services Maturity™ Benchmark
© 2016 Service Performance Insight www.FinancialForce.com 75
6. Leadership Pillar
Growth, growth and more growth. Each year SPI
Research finds a direct correlation between growth and
success in Professional services. Given that the PS
industry is built on the application of unique knowledge
and domain expertise it is sometimes hard to understand
why the growth dynamic is so important. But… it is. In
the professional services and technology industry,
leading firms create dominant market positions. There is
a compounding effect of how customers make decisions,
the networks and ecosystems that are created, and the
ability to scale as a firm that mean that there is a
significant advantage for the companies that grow the fastest and are able to establish market-leading
positions. The premium PS firms create unique competitive advantage and are able to command
significantly higher bill rates. They become known as the innovators in their markets, industries,
technologies and business processes. They produce tangible results and are able to harvest the
knowledge gained to do an even better job the next time. They build a culture which embodies their
brand and values which further attracts prospective consultants and clients who identify with those
attributes.
Table 36: Leadership Pillar 5-year trend
Key Performance Indicator (KPI) 2011 2012 2013 2014 2015
Well understood vision, mission and strategy 3.81 N/A 3.85 3.81 3.75
Confidence in PS leadership 4.03 N/A 4.05 4.01 3.86
Ease of getting things done 3.72 N/A 3.75 3.68 3.69
Goals and measurement alignment 3.60 N/A 3.73 3.62 3.70
Employees have confidence in PSO's future 3.83 N/A 4.01 3.87 3.82
Effectively communicates w/employees 3.58 N/A 3.74 3.67 3.64
Embraces change - nimble and flexible 3.79 N/A 3.90 3.76 3.68
Innovation focused 3.65 N/A 3.69 3.66 3.64
Source: Service Performance Insight, February 2016
But growth comes with a price. The unique knowledge, vision and passion that a consulting leader
brings to founding a hot new firm must be nurtured and continuously kindled within new employees.
The leader must simultaneously learn to let go and grow at the same time. Micro managing does not
work in PS, cultivating a reputation and repeatable skills, competencies and processes does. Most
independent consulting firms can easily grow from 20 to 50 consultants, but after that things get more
interesting. This is when firms must move from heroic to repeatable and founders must move from
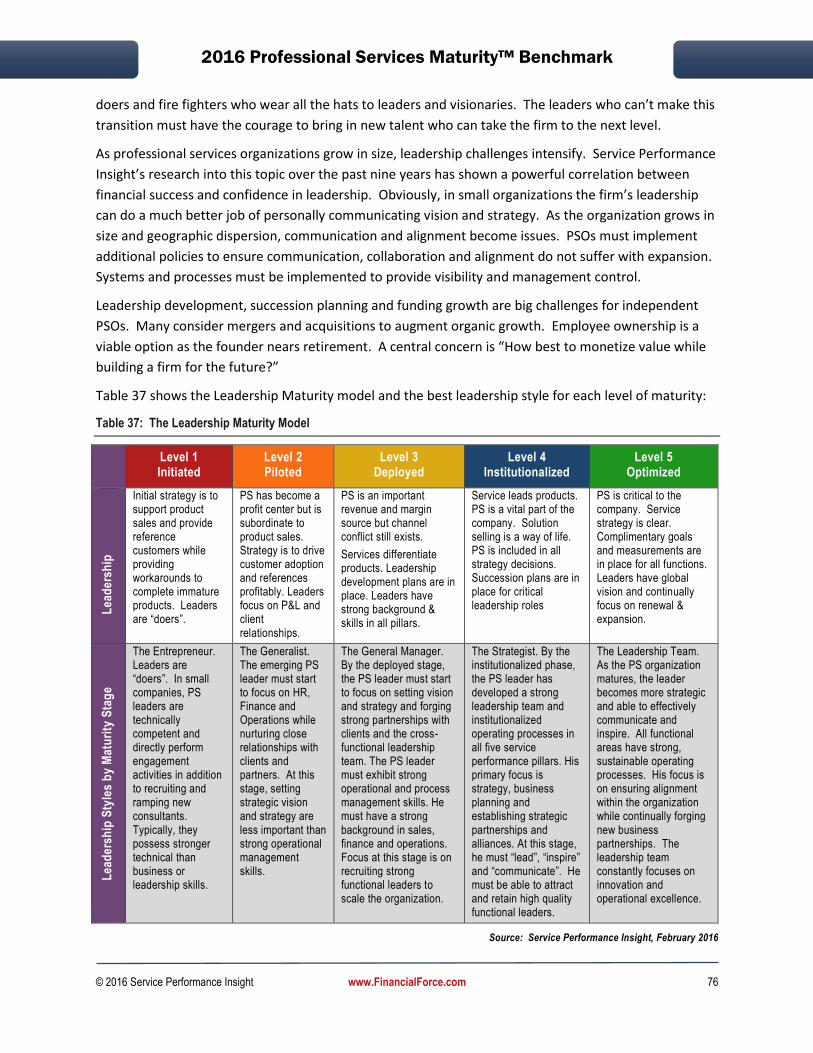
2016 Professional Services Maturity™ Benchmark
© 2016 Service Performance Insight www.FinancialForce.com 76
doers and fire fighters who wear all the hats to leaders and visionaries. The leaders who can’t make this
transition must have the courage to bring in new talent who can take the firm to the next level.
As professional services organizations grow in size, leadership challenges intensify. Service Performance
Insight’s research into this topic over the past nine years has shown a powerful correlation between
financial success and confidence in leadership. Obviously, in small organizations the firm’s leadership
can do a much better job of personally communicating vision and strategy. As the organization grows in
size and geographic dispersion, communication and alignment become issues. PSOs must implement
additional policies to ensure communication, collaboration and alignment do not suffer with expansion.
Systems and processes must be implemented to provide visibility and management control.
Leadership development, succession planning and funding growth are big challenges for independent
PSOs. Many consider mergers and acquisitions to augment organic growth. Employee ownership is a
viable option as the founder nears retirement. A central concern is “How best to monetize value while
building a firm for the future?”
Table 37 shows the Leadership Maturity model and the best leadership style for each level of maturity:
Table 37: The Leadership Maturity Model
Level 1 Initiated
Level 2 Piloted
Level 3 Deployed
Level 4 Institutionalized
Level 5 Optimized
Lea
de
rsh
ip
Initial strategy is to support product sales and provide reference customers while providing workarounds to complete immature products. Leaders are “doers”.
PS has become a profit center but is subordinate to product sales. Strategy is to drive customer adoption and references profitably. Leaders focus on P&L and client relationships.
PS is an important revenue and margin source but channel conflict still exists.
Services differentiate products. Leadership development plans are in place. Leaders have strong background & skills in all pillars.
Service leads products. PS is a vital part of the company. Solution selling is a way of life. PS is included in all strategy decisions. Succession plans are in place for critical leadership roles
PS is critical to the company. Service strategy is clear. Complimentary goals and measurements are in place for all functions. Leaders have global vision and continually focus on renewal & expansion.
Lea
de
rsh
ip S
tyle
s b
y M
atu
rity
Sta
ge
The Entrepreneur. Leaders are “doers”. In small companies, PS leaders are technically competent and directly perform engagement activities in addition to recruiting and ramping new consultants. Typically, they possess stronger technical than business or leadership skills.
The Generalist. The emerging PS leader must start to focus on HR, Finance and Operations while nurturing close relationships with clients and partners. At this stage, setting strategic vision and strategy are less important than strong operational management skills.
The General Manager. By the deployed stage, the PS leader must start to focus on setting vision and strategy and forging strong partnerships with clients and the cross-functional leadership team. The PS leader must exhibit strong operational and process management skills. He must have a strong background in sales, finance and operations. Focus at this stage is on recruiting strong functional leaders to scale the organization.
The Strategist. By the institutionalized phase, the PS leader has developed a strong leadership team and institutionalized operating processes in all five service performance pillars. His primary focus is strategy, business planning and establishing strategic partnerships and alliances. At this stage, he must “lead”, “inspire” and “communicate”. He must be able to attract and retain high quality functional leaders.
The Leadership Team. As the PS organization matures, the leader becomes more strategic and able to effectively communicate and inspire. All functional areas have strong, sustainable operating processes. His focus is on ensuring alignment within the organization while continually forging new business partnerships. The leadership team constantly focuses on innovation and operational excellence.
Source: Service Performance Insight, February 2016
2016 Professional Services Maturity™ Benchmark
© 2016 Service Performance Insight www.FinancialForce.com 77
The leadership challenges are much the same but also very different in embedded PSOs. These
organizations exist to ensure the successful implementation and adoption of the company’s products.
They are not given the latitude to develop services for services sake, but rather must serve the best
interests of the company’s products, even if those interests undermine PS productivity and profitability.
In embedded PSOs the primary leadership challenge is one of charter conflict and forging cross-
functional relationships. Embedded PS executives are tasked with developing high quality consulting
businesses but consulting is most often subordinate to product proliferation. A new, more strategic role
is emerging to drive client adoption and optimization. This role requires significantly greater alignment
with sales, support and product development so collaboration and team-building skills are paramount.
Establishing the Leadership Index
In the benchmark survey, SPI Research asks a series of questions regarding various aspects of
professional services vision, strategy and leadership including confidence, clarity and alignment.
Strategic decisions set the direction and tone for the PSO and affect all functions because vision and
strategy dictate the goals and objectives for the organization, the types of clients to pursue, the types of
services to offer and the interrelationship between functions.
The leadership questions have evolved into eight core questions that examine how various dimensions
of leadership impact performance. The questions ask, “please rate the following aspects of your
organization in terms of how well it operates (1: not well - 5: very well)”:
1. The vision, mission and strategy of the PSO is well understood and clearly communicated
2. Employees have confidence in PS leadership
3. It is easy to get things done within the PS organization
4. Goals and measurements are in alignment for the service organization
5. Employees have confidence in the future of the PS organization
6. The organization effectively communicates with employees
7. The organization embraces change, it is nimble and flexible
8. The organization focuses on innovation and is able to rapidly take advantage of changing market
conditions
SPI Research has created a “Leadership Index” by ranking the aggregate leadership scores for all eight
questions by survey participant. The minimum score for the leadership index would be eight, if the
survey participant stated “1 - not well” for each of the eight questions. The maximum would be 40, if
the participant stated “5 - very well”, for each question.
As statisticians, a perfect day is when a key performance measurement clearly correlates with most
measures of performance. Well, the dimensions of leadership are one of those perfect statistics. As the
leadership dimensions improve, so do all major key performance metrics. One might expect
“Confidence in Leadership” and “Confidence in the Future” to improve along with clarity of vision and
strategy but the truly remarkable finding around leadership is that all the major operational metrics –
revenue per person, utilization, project margin and on-time project completion improve as well. It is

2016 Professional Services Maturity™ Benchmark
© 2016 Service Performance Insight www.FinancialForce.com 78
amazing how strategic clarity permeates all aspects of operational performance. If the strategy is clear
and compelling, people-based organizations will find a way to accomplish it.
With strong leadership, employees understand what’s required of them, and can go about conducting
their daily business with the confidence their work supports corporate objectives. Strong leadership
helps employees get on the same page, working toward a common goal. With this knowledge,
employees are more productive, ultimately delivering higher levels of client satisfaction and profitability
to the organization.
Table 38 depicts the
percentage of survey
respondents by overall
leadership index rating
compared to key
operational
measurements. As
shown in the table,
effective leadership
has a powerful impact
on all aspects of
performance.
More than any other
factor, good, or poor
leadership impacts all
facets of the business
delivering stronger
growth, higher billable
utilization, better on-
time project delivery,
more winning
proposals and higher levels of customer satisfaction. The reverse is also true. Poor leaders can
sabotage cross-functional alignment, leading to organizational alienation and functional silos. Leaders
who are not able to transition to more strategic roles can create heroic, reactive organizations
characterized by fire-fighting, in-fighting and burnout. Many top-performing organizations have
reported adding SPI’s leadership questions to their employee surveys to help them measure and
quantify employee confidence in leadership.
Table 38: Leadership Impact
Key Performance Indicator (KPI) 8 - 25 26 - 30 31 - 35 36 - 40
Percentage of respondents 22.2% 27.8% 35.4% 14.6%
Year-over-year change in PS revenue 7.2% 8.2% 11.0% 16.3%
% of employees billable or chargeable 65.3% 69.4% 72.2% 75.5%
Revenue from new clients 25.0% 27.1% 29.0% 29.7%
Bid-to-win ratio (per 10 bids) 4.31 4.70 5.22 5.69
Percentage of referenceable clients 66.6% 66.8% 72.4% 78.8%
Ramp time (days) 131 121 114 107
Recommend company to friends/family 3.46 4.06 4.52 4.80
Well-understood career path for all employees 2.69 3.14 3.44 4.04
Employee billable utilization 68.6% 69.3% 71.4% 73.8%
Projects delivered on-time 67.3% 73.3% 79.2% 86.2%
Use a standardized delivery methodology 57.2% 63.2% 66.4% 72.8%
Annual revenue per billable consultant (k) $174 $188 $210 $228
Annual revenue per employee (k) $141 $149 $164 $181
Source: Service Performance Insight, February 2016

2016 Professional Services Maturity™ Benchmark
© 2016 Service Performance Insight www.FinancialForce.com 79
Survey Results
Organizational Challenges
Each year SPI Research asks participants to rank the key challenges facing them. This year “achieving
revenue and margin targets” overtook “talent management” as the number one challenge.
Interestingly, the importance of these challenges has increased year over year indicating growth,
expansion and competitive pressures are more significantly impacting all PS organizations. In 2015 it
was a lot tougher to achieve revenue and margin targets with an influx of new competitors and market
consolidation in legacy markets. Going forward the ever-growing technical talent shortage will continue
to be a top challenge as
attracting the best and brightest
talent is becoming more and
more difficult without enough
workers with requisite Science,
Technology, Math and
Engineering (STEM) skills.
After two years of torrid growth
and expansion, many firms are
now struggling to keep up with
the tremendous growth they
have experienced. In
interviews, several firms
reported they plan to slow
growth and acquisitions
because their infrastructure and
culture cannot keep up. For the fastest growing firms, 2016 will be an investment year – they plan to
update or replace systems; enhance training and invest in their culture to ensure they will be able to
recruit and retain a high quality workforce.
Organizational Challenges by Organization Type
When comparing the key challenges of embedded versus independent service providers (Table 40), the
number one challenge for independent PSO’s is “talent management”. For embedded ESOs the number
one challenge is “achieving revenue and margin targets”. “Improving quality and consistency” has now
risen to become a top 3 challenge. With more choices than ever before, PS buyers are demanding higher
levels of quality and consistency from their PS providers.
In the geographies with the greatest growth, the Americas and Asia Pacific (APac), talent is by far the
greatest challenge as there simply are not enough qualified candidates to meet demand.
Table 39: Year-over-year Change in Top Challenges
Challenge 2013 2014 2015
Achieve revenue and margin targets 4.18 4.07 4.19
Talent management 3.94 4.11 4.18
Improve quality and consistency 4.12 3.85 4.13
Communication across PSO 3.93 3.90 4.12
Support rapid growth and expansion 4.06 4.01 4.12
Improve sales and marketing 4.21 4.10 4.06
Vision and strategy 3.79 3.90 4.03
Improve / expand portfolio and markets 3.83 3.83 3.92
Alignment between functions or groups 3.59 3.45 3.81
Source: Service Performance Insight, February 2016
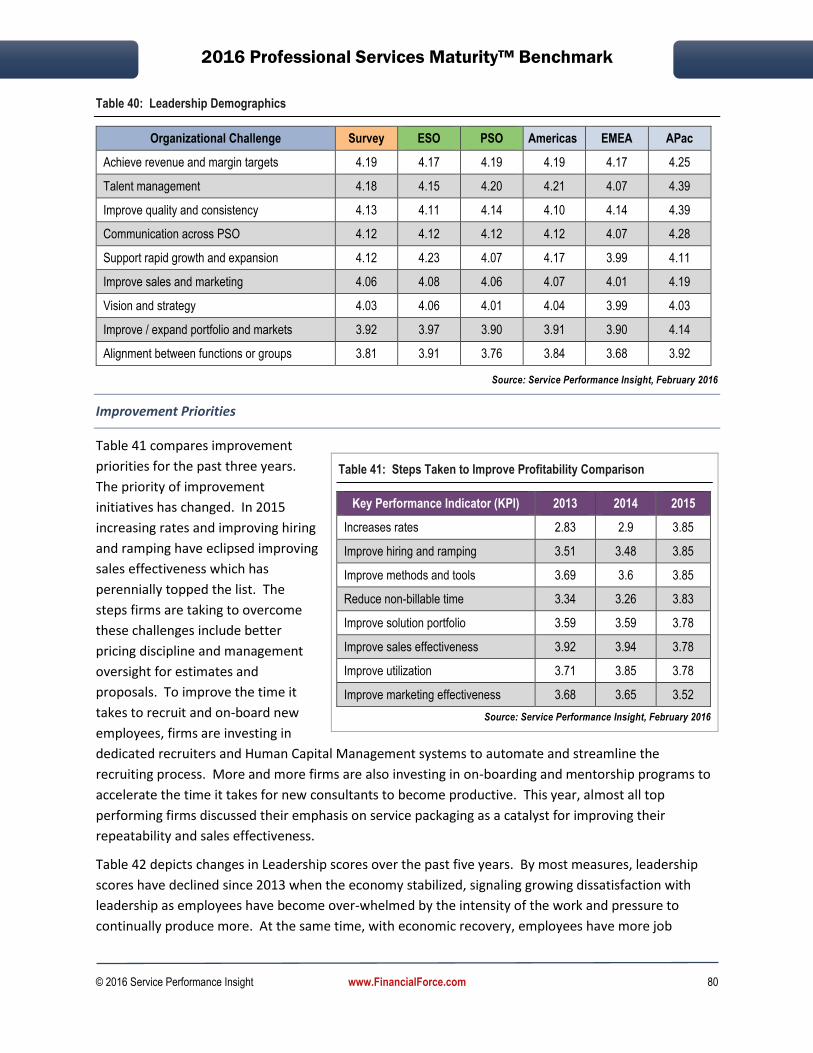
2016 Professional Services Maturity™ Benchmark
© 2016 Service Performance Insight www.FinancialForce.com 80
Table 40: Leadership Demographics
Source: Service Performance Insight, February 2016
Improvement Priorities
Table 41 compares improvement
priorities for the past three years.
The priority of improvement
initiatives has changed. In 2015
increasing rates and improving hiring
and ramping have eclipsed improving
sales effectiveness which has
perennially topped the list. The
steps firms are taking to overcome
these challenges include better
pricing discipline and management
oversight for estimates and
proposals. To improve the time it
takes to recruit and on-board new
employees, firms are investing in
dedicated recruiters and Human Capital Management systems to automate and streamline the
recruiting process. More and more firms are also investing in on-boarding and mentorship programs to
accelerate the time it takes for new consultants to become productive. This year, almost all top
performing firms discussed their emphasis on service packaging as a catalyst for improving their
repeatability and sales effectiveness.
Table 42 depicts changes in Leadership scores over the past five years. By most measures, leadership
scores have declined since 2013 when the economy stabilized, signaling growing dissatisfaction with
leadership as employees have become over-whelmed by the intensity of the work and pressure to
continually produce more. At the same time, with economic recovery, employees have more job
Organizational Challenge Survey ESO PSO Americas EMEA APac
Achieve revenue and margin targets 4.19 4.17 4.19 4.19 4.17 4.25
Talent management 4.18 4.15 4.20 4.21 4.07 4.39
Improve quality and consistency 4.13 4.11 4.14 4.10 4.14 4.39
Communication across PSO 4.12 4.12 4.12 4.12 4.07 4.28
Support rapid growth and expansion 4.12 4.23 4.07 4.17 3.99 4.11
Improve sales and marketing 4.06 4.08 4.06 4.07 4.01 4.19
Vision and strategy 4.03 4.06 4.01 4.04 3.99 4.03
Improve / expand portfolio and markets 3.92 3.97 3.90 3.91 3.90 4.14
Alignment between functions or groups 3.81 3.91 3.76 3.84 3.68 3.92
Table 41: Steps Taken to Improve Profitability Comparison
Key Performance Indicator (KPI) 2013 2014 2015
Increases rates 2.83 2.9 3.85
Improve hiring and ramping 3.51 3.48 3.85
Improve methods and tools 3.69 3.6 3.85
Reduce non-billable time 3.34 3.26 3.83
Improve solution portfolio 3.59 3.59 3.78
Improve sales effectiveness 3.92 3.94 3.78
Improve utilization 3.71 3.85 3.78
Improve marketing effectiveness 3.68 3.65 3.52
Source: Service Performance Insight, February 2016
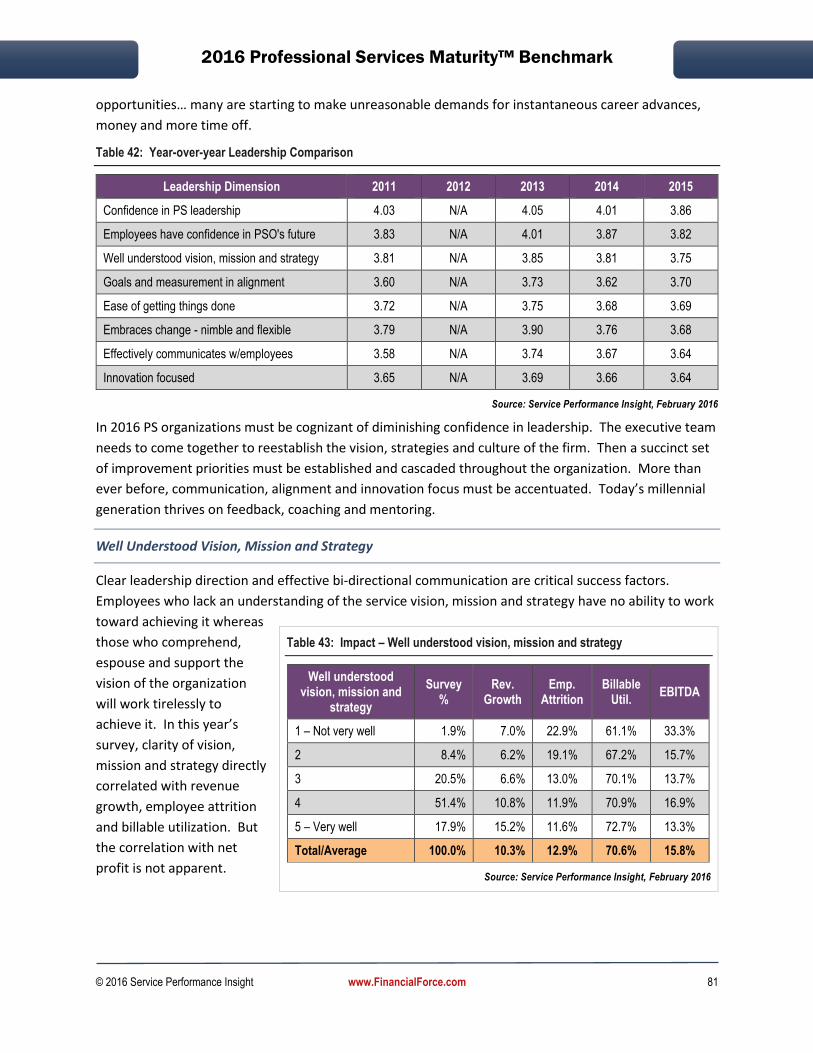
2016 Professional Services Maturity™ Benchmark
© 2016 Service Performance Insight www.FinancialForce.com 81
opportunities… many are starting to make unreasonable demands for instantaneous career advances,
money and more time off.
Table 42: Year-over-year Leadership Comparison
Leadership Dimension 2011 2012 2013 2014 2015
Confidence in PS leadership 4.03 N/A 4.05 4.01 3.86
Employees have confidence in PSO's future 3.83 N/A 4.01 3.87 3.82
Well understood vision, mission and strategy 3.81 N/A 3.85 3.81 3.75
Goals and measurement in alignment 3.60 N/A 3.73 3.62 3.70
Ease of getting things done 3.72 N/A 3.75 3.68 3.69
Embraces change - nimble and flexible 3.79 N/A 3.90 3.76 3.68
Effectively communicates w/employees 3.58 N/A 3.74 3.67 3.64
Innovation focused 3.65 N/A 3.69 3.66 3.64
Source: Service Performance Insight, February 2016
In 2016 PS organizations must be cognizant of diminishing confidence in leadership. The executive team
needs to come together to reestablish the vision, strategies and culture of the firm. Then a succinct set
of improvement priorities must be established and cascaded throughout the organization. More than
ever before, communication, alignment and innovation focus must be accentuated. Today’s millennial
generation thrives on feedback, coaching and mentoring.
Well Understood Vision, Mission and Strategy
Clear leadership direction and effective bi-directional communication are critical success factors.
Employees who lack an understanding of the service vision, mission and strategy have no ability to work
toward achieving it whereas
those who comprehend,
espouse and support the
vision of the organization
will work tirelessly to
achieve it. In this year’s
survey, clarity of vision,
mission and strategy directly
correlated with revenue
growth, employee attrition
and billable utilization. But
the correlation with net
profit is not apparent.
Table 43: Impact – Well understood vision, mission and strategy
Well understood vision, mission and
strategy
Survey %
Rev. Growth
Emp. Attrition
Billable Util.
EBITDA
1 – Not very well 1.9% 7.0% 22.9% 61.1% 33.3%
2 8.4% 6.2% 19.1% 67.2% 15.7%
3 20.5% 6.6% 13.0% 70.1% 13.7%
4 51.4% 10.8% 11.9% 70.9% 16.9%
5 – Very well 17.9% 15.2% 11.6% 72.7% 13.3%
Total/Average 100.0% 10.3% 12.9% 70.6% 15.8%
Source: Service Performance Insight, February 2016
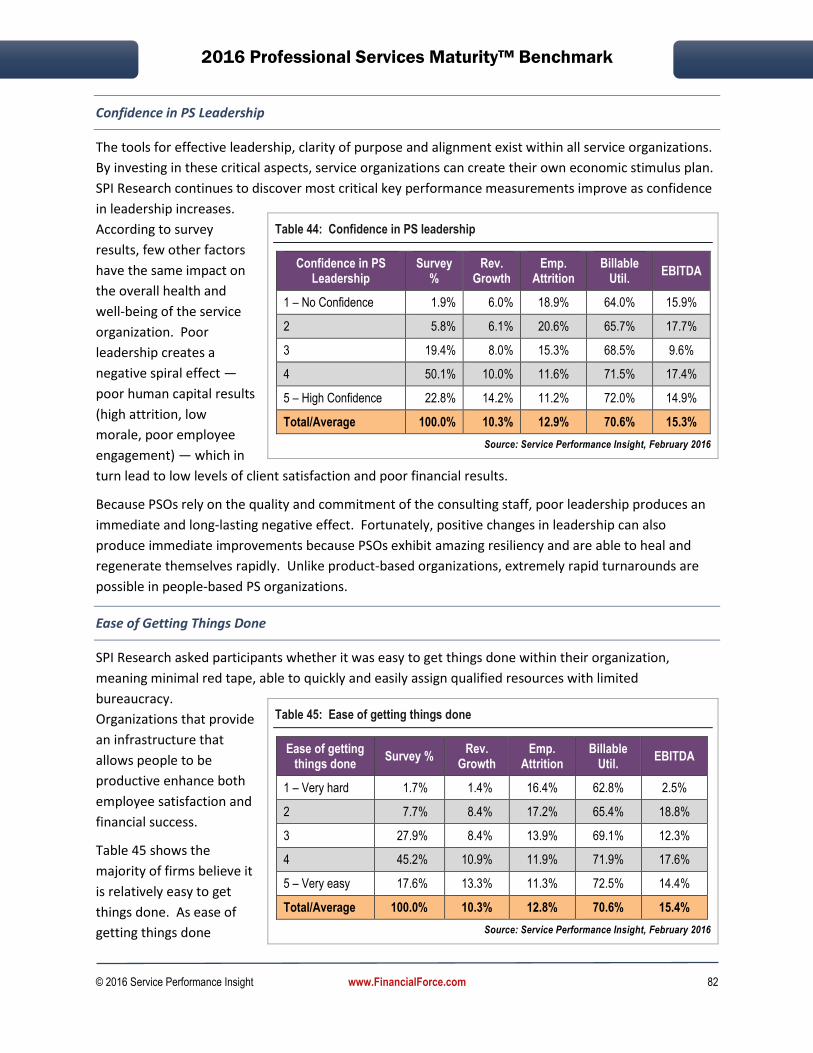
2016 Professional Services Maturity™ Benchmark
© 2016 Service Performance Insight www.FinancialForce.com 82
Confidence in PS Leadership
The tools for effective leadership, clarity of purpose and alignment exist within all service organizations.
By investing in these critical aspects, service organizations can create their own economic stimulus plan.
SPI Research continues to discover most critical key performance measurements improve as confidence
in leadership increases.
According to survey
results, few other factors
have the same impact on
the overall health and
well-being of the service
organization. Poor
leadership creates a
negative spiral effect —
poor human capital results
(high attrition, low
morale, poor employee
engagement) — which in
turn lead to low levels of client satisfaction and poor financial results.
Because PSOs rely on the quality and commitment of the consulting staff, poor leadership produces an
immediate and long-lasting negative effect. Fortunately, positive changes in leadership can also
produce immediate improvements because PSOs exhibit amazing resiliency and are able to heal and
regenerate themselves rapidly. Unlike product-based organizations, extremely rapid turnarounds are
possible in people-based PS organizations.
Ease of Getting Things Done
SPI Research asked participants whether it was easy to get things done within their organization,
meaning minimal red tape, able to quickly and easily assign qualified resources with limited
bureaucracy.
Organizations that provide
an infrastructure that
allows people to be
productive enhance both
employee satisfaction and
financial success.
Table 45 shows the
majority of firms believe it
is relatively easy to get
things done. As ease of
getting things done
Table 44: Confidence in PS leadership
Confidence in PS Leadership
Survey %
Rev. Growth
Emp. Attrition
Billable Util.
EBITDA
1 – No Confidence 1.9% 6.0% 18.9% 64.0% 15.9%
2 5.8% 6.1% 20.6% 65.7% 17.7%
3 19.4% 8.0% 15.3% 68.5% 9.6%
4 50.1% 10.0% 11.6% 71.5% 17.4%
5 – High Confidence 22.8% 14.2% 11.2% 72.0% 14.9%
Total/Average 100.0% 10.3% 12.9% 70.6% 15.3%
Source: Service Performance Insight, February 2016
Table 45: Ease of getting things done
Ease of getting things done
Survey % Rev.
Growth Emp.
Attrition Billable
Util. EBITDA
1 – Very hard 1.7% 1.4% 16.4% 62.8% 2.5%
2 7.7% 8.4% 17.2% 65.4% 18.8%
3 27.9% 8.4% 13.9% 69.1% 12.3%
4 45.2% 10.9% 11.9% 71.9% 17.6%
5 – Very easy 17.6% 13.3% 11.3% 72.5% 14.4%
Total/Average 100.0% 10.3% 12.8% 70.6% 15.4%
Source: Service Performance Insight, February 2016

2016 Professional Services Maturity™ Benchmark
© 2016 Service Performance Insight www.FinancialForce.com 83
improves, so do other metrics including billable utilization, revenue per employee and revenue target
attainment. Interestingly, the fastest growing firms reported the greatest ease of getting things done
while contracting organizations reported difficulty in getting things done.
Goals and Measurements in Alignment
Another survey question
asked, "Are goals and
measurements in
alignment for the service
organization?" Alignment
speaks to a clearly
articulated strategy with
goals and measurements
reinforcing the
organization’s purpose
and stimulating action.
Alignment or lack of
alignment has a significant
impact on bottom-line performance. Lack of alignment emanates from a lack of clarity and conflicting or
too many priorities. It is characterized by low levels of employee engagement and functional silos or
factions. The highest performing service organizations exhibit clarity of purpose and alignment around a
succinct set of core values and initiatives. Effective measurements and compensation reinforce those
values, linking strategy to execution. As shown in Table 46 goals and measurements in alignment had a
profound impact on service execution. Revenue growth, billable utilization and net profit improved with
better alignment.
Employees Have Confidence in the PSO's Future
The level of employee
confidence in the future of
the PS organization has a
profound impact on
almost all key
performance
measurements. Firms
with the highest levels of
employee confidence
experienced the highest
levels of billable utilization
and revenue and margin
target attainment. In fact, almost every key performance measurement, from project margins to
Table 46: Goals and measurement in alignment
Goal and measurements
in alignment
Survey %
Rev. Growth
Emp. Attrition
Billable Util.
EBITDA
1 – Not aligned 1.7% 8.6% 16.2% 66.1% 20.4%
2 7.9% 10.2% 19.1% 68.6% 12.9%
3 25.4% 8.6% 13.1% 69.0% 11.6%
4 49.2% 10.2% 11.8% 71.0% 16.6%
5 – Very aligned 15.9% 13.5% 12.1% 73.3% 18.4%
Total/Average 100.0% 10.3% 12.8% 70.6% 15.4%
Source: Service Performance Insight, February 2016
Table 47: Impact – Employees Have Confidence in the PSO's Future
Confidence in the PSO's Future
Survey %
Rev. Growth
Emp. Attrition
Billable Util.
EBITDA
1 – Not confident 1.7% -1.9% 18.3% 61.7% 0.0%
2 5.2% 5.0% 21.3% 68.3% 20.0%
3 22.6% 6.9% 13.8% 68.2% 11.6%
4 49.9% 10.9% 12.1% 71.7% 15.7%
5 – Very confident 20.6% 14.5% 11.3% 71.9% 17.6%
Total/Average 100.0% 10.2% 12.9% 70.6% 15.1%
Source: Service Performance Insight, February 2016

2016 Professional Services Maturity™ Benchmark
© 2016 Service Performance Insight www.FinancialForce.com 84
attrition to annual revenue target attainment had a positive correlation with employee confidence in
the future of the PS organization.
“The world loves a winner” seems to be an appropriate description for the positive results of the
organizations with the highest level of employee confidence. A key “chicken or egg question” always
arises around “confidence in the future” as typically the highest performing and fastest growing
organizations propel employees to have confidence in the future, while low confidence is indicative of
organizations in turmoil or going through massive change as they reposition themselves to take better
advantage of the future.
Effective Employee Communication
Respondents were asked to rate “our organization effectively communicates with employees”.
Independents reported
better communication
than ESOs. The level of
effective communication
declined directly in
proportion to the size of
the organization. In other
words, the smallest
organizations exhibited
the best communication
while the largest showed
the worst.
Talk may be cheap but without bidirectional communication, employees quickly become
disenfranchised. Creating an effective communication plan should make the short list for any
improvement plan.
Organization Embraces
Change, is Nimble and
Flexible
Change is a way of life for
21st century professional
service organizations. One
of the primary reasons
why more and more
companies out-task IT,
accounting, law, strategy
and marketing to
specialized PS
organizations is that the
Table 48: Impact – Effective communication with employees
Effective Communication
Survey %
Rev. Growth
Emp. Attrition
Billable Util.
EBITDA
1 – Poor communication 1.9% 5.8% 22.7% 62.5% 35.0%
2 9.4% 8.2% 17.3% 68.8% 11.7%
3 27.0% 8.2% 13.6% 70.4% 13.7%
4 46.3% 10.3% 11.6% 70.7% 16.6%
5 – Great communication 15.5% 15.2% 11.8% 72.5% 17.3%
Total/Average 100.0% 10.2% 12.9% 70.6% 15.8%
Source: Service Performance Insight, February 2016
Table 49: Impact – Organization Embraces Change, is Nimble and Flexible
Organization Embraces Change
Survey %
Rev. Growth
Emp. Attrition
Billable Util.
EBITDA
1 – Does not embrace 2.4% 7.7% 16.5% 64.2% 9.2%
2 10.2% 6.0% 16.4% 70.5% 16.5%
3 24.4% 8.6% 13.5% 68.9% 19.4%
4 43.0% 10.8% 11.8% 70.9% 13.2%
5 – Very much embrace 19.9% 13.5% 12.0% 72.9% 16.7%
Total/Average 100.0% 10.2% 12.8% 70.6% 15.6%
Source: Service Performance Insight, February 2016

2016 Professional Services Maturity™ Benchmark
© 2016 Service Performance Insight www.FinancialForce.com 85
pace and amount of change and complexity is impossible to keep up with so they must reply on
consultants and specialists.
Each leadership dimension impacts all other leadership dimensions. Nimble organizations that are able
to easily adapt to change have higher levels of strategic clarity, confidence in leadership, lower levels of
attrition and higher revenue growth.
Innovation Focused
Innovation is a hot topic these days as technology innovators like Apple have created new markets and
destroyed leaders like
Research in Motion who
were not able to see and
respond to a “consumer-
based” future. Research
into the science of
innovation shows
innovators are more likely
to take risks and have a
high tolerance for failure.
In professional services,
innovation comes from
exploring and embracing
new business models, processes and technologies to improve productivity and quality. To the extent
thought leadership can be considered a component of innovation, PSOs excel at innovation. The
benchmark results depict the importance of striving for new and innovative solutions to problems.
Innovative organizations provide employees with the confidence to know the organization will be
around for years to come, and they will be continually challenged and personally grow as the
organization expands. Innovation focus is not organization size dependent. One of this year’s Best-of-
the-Best PSOs said their belief is “great ideas come from anywhere”. This organization has built a
culture or empowerment, embracing innovation. Any employee with a great idea, at any level, can build
a business case and receive funding and support to tackle internal problems or create new solutions.
Table 50: Impact – PS Innovation Focus
Innovation Focused Survey
% Rev.
Growth Emp.
Attrition Billable
Util. EBITDA
1 – Not innovative 3.0% 7.0% 19.6% 60.6% 14.5%
2 8.8% 4.1% 15.5% 68.8% 15.4%
3 28.7% 10.2% 13.2% 70.3% 18.9%
4 40.6% 9.7% 12.0% 70.9% 14.1%
5 – Very innovative 18.9% 14.5% 12.3% 72.7% 13.8%
Total/Average 100.0% 10.2% 12.9% 70.6% 15.5%
Source: Service Performance Insight, February 2016

2016 Professional Services Maturity™ Benchmark
© 2016 Service Performance Insight www.FinancialForce.com 86
7. Client Relationships Pillar
The Client Relationships pillar focuses on the activities associated with
business development and client management. Finding and retaining
customers is a primary means of growing a business, and is always one of
the top challenges for PS firms.
In this chapter SPI Research provides the PS Sales and Marketing Maturity
Model™, along with statistics showing the benefits of sales and marketing
investments. This report examines service sales roles, compensation,
client mix and a host of sales and marketing effectiveness metrics. Since
referrals are a primary driver of repeat business SPI Research also explores
the correlation between client satisfaction and business success.
Cultivating new and repeat clients is the lifeblood of the service industry. Professional services
organizations are in business to provide knowledge, expertise and guidance. Their sales and marketing
organizations must define target markets and clients by understanding their key challenges. The job of
service sales and marketing is to generate awareness and identify and close opportunities. Services are
intangible so the job of service sales and marketing has the added difficulty of creating concrete proof of
the firm’s knowledge, experience and differentiation.
The effectiveness of the organization’s sales and marketing efforts determines the quality and size of the
pipeline; bid-to-win ratios; discounts; client satisfaction and the length of the sales cycle. Effective sales
and marketing organizations continually uncover new opportunities while ensuring existing customers
continue to buy and refer. Today’s successful PSO, whether embedded or independent, is increasingly
taking charge of its own destiny by investing in sales, marketing and service packaging.
Table 51: PS Sales and Marketing Maturity Model™
Level 1
Level 2
Level 3
Level 4
Level 5
Cli
ent
Re
lati
on
ship
s
Opportunistic. No defined solution sets or go to market plan. Focus is on new customers and reference building. Individual heroics, no consistent sales, marketing or partnering plan or methodology. Ad hoc, one-off projects.
Start to use marketing to drive leads. Multiple sales models. Start investing in sales training, CRM & sales methodology. Manual integration with PSA. Start measuring sales effectiveness & customer satisfaction. Start developing partners and partner programs. Some level of proposal reviews and pricing control.
Marketing, inside sales, solution sales with defined solution sets. CRM integrated with PSA. Deal, pricing and contract reviews. Partner plan and scorecard. Tight pricing and contract mgmt. controls. High levels of customer satisfaction.
CRM, PSA, ERP integration provides 360-degree view of client relationships. Business process, vertical and horizontal solutions. Vertical centers of excellence. Top client and partner programs. Global contract and pricing management. Key partner relationships. Strong customer reference programs.
Executive relationships and client advisory board. Thought leadership. Brand building and awareness. High customer satisfaction. Integrated sales, marketing and partnering programs. High quality references.
Source: Service Performance Insight, February 2016
Table 51 highlights the five levels of maturity in the Client Relationships pillar. As sales and service
delivery processes mature, organizations move from selling anything and everything to anyone, to a
more careful and selective approach to client selection; solution creation; deal capture; contract and
pricing management, reference building and partnering.

2016 Professional Services Maturity™ Benchmark
© 2016 Service Performance Insight www.FinancialForce.com 87
Table 52: Client Relationships Pillar 5-year trend
Key Performance Indicator (KPI) 2011 2012 2013 2014 2015
Bid-to-win ratio (per 10 bids) 5.21 5.19 4.96 4.92 4.95
Deal pipeline relative to qtr. bookings forecast 203% 193% 190% 199% 172%
Sales cycle (days: qualified lead to contract signing) 100 96 95 91 88
Average service discount given N/A N/A N/A 7.3% 7.7%
Solution development effectiveness 3.07 3.02 2.99 3.00 3.59
Service sales effectiveness 3.25 3.20 3.24 3.14 3.57
Service marketing effectiveness 2.39 2.61 2.70 2.72 3.29
Percentage of referenceable clients 71.4% 75.4% 74.5% 73.7% 70.4%
Time & materials % of work sold 52.8% 54.7% 51.7% 58.8% 46.7%
Fixed time / fixed fee % of work sold 45.5% 42.8% 44.0% 36.3% 39.7%
Shared risk / performance-based % of work sold 1.3% 1.4% 2.8% 2.1% 6.4%
Other 0.4% 1.1% 1.5% 2.9% 7.2%
Source: Service Performance Insight, February 2016
PS Sales Maturity
As part of the PS Sales and Marketing Maturity Model™, Service Performance Insight focuses on key
success criteria and processes associated with PS sales, marketing and partnering. SPI Research charts
its definitions of sales maturity levels and shows how they progress as the organization enhances the
knowledge and practice of solution selling resulting in superior client value (Table 53).
Table 53: PS Sales Maturity Model™
Level 1 Level 2 Level 3 Level 4 Level 5
Ad Hoc, Opportunistic,
Heroic
Piloted, Experimental, Pockets of Excellence
Deployed, Basics in Place for All Key
Elements
Institutionalized, in the Company
DNA / Fabric
Visionary, Agile, Innovative,
Continuous Renewal and Improvement
Clie
nt
Val
ue
Handcrafted projects, unique, highly dependent on individual team member skills.
Limited replication or codification of service solutions. Point product solutions primarily focused on rapid implementation. Starting to focus on adoption.
Clear, value-based sales and marketing messages developed for product / vertical /geographic audiences. Some level of client value and ROI measurement.
Client-centric, high value services developed and packaged. Demonstrated, measurable business value.
Partnerships exist with most strategic, forward-thinking clients to develop and enhance leading edge services. Solutions deliver clear and significant value.

2016 Professional Services Maturity™ Benchmark
© 2016 Service Performance Insight www.FinancialForce.com 88
Level 1 Level 2 Level 3 Level 4 Level 5 S
ales
Pro
cess
Opportunistic and instinctive with ad hoc service offerings. No consistent sales methodology. Variation in pricing methods. Inconsistent proposals, quotes, contracts. Limited to no investment in sales training, methods or tools.
Dedicated solution selling teams. Repeatable process for point solutions. Implementing sales methodology, reinforced in CRM. Reusable proposal boilerplate. Informal proposal roles and self-governing proposal teams. Standard price list and discount authority. Developing standard estimating tools.
Consistent solution selling methods & tools reinforced and supported in CRM. Solution-oriented best practices. Consistent estimating and risk evaluations. Bid qualification criteria. Standard contracts and statements of work. Clear roles, responsibilities and timelines. Sales organization trained to effectively sell solutions.
Solution and value selling is a way of life with appropriate measurements and controls with fully integrated supporting systems and tools. Sophisticated selling strategies including quantified client value with improved KPIs and positive ROI.
Established thought leadership and trusted advisor at highest levels. Continual investment in improving and expanding service portfolio as a means of market expansion. Effective proposal center delivers timely, high-quality estimates, proposals, contract and risk reviews.
Par
tner
s
Ad hoc and opportunistic without clearly defined roles.
Partner plan in place, but conflicts still exist. Defined partner programs to extend market reach.
Solution sets designed with partners in mind (defined roles and deliverables for prime, hybrid, sub). Top partner program.
Co-development with partners. Partners are integral part of service packaging and rollout.
Co-opetition. Partners contribute to company's overall service innovation by providing SME feedback and insights.
Clie
nt
Sat
Pro
gra
ms
Ad hoc reference requests. No formal program. Heroic.
Client reference programs established to extend market reach.
Proof, testimonials and references to support solution client value. Consistent, ongoing satisfaction measures.
Client advisory board influences roadmap, participates in beta programs.
Strategic clients are company and service evangelists.
Source: Service Performance Insight, February 2016
Table 54 depicts PS sales maturity progression. As organizations enhance their solution selling
capabilities, methods, systems and tools, overall sales effectiveness improves dramatically. These
efforts pay for themselves in higher percentages of sales quota achievement; better sales forecasting
accuracy; improved pricing and estimating accuracy resulting in fewer project overruns; faster sales
cycles due to better deal qualification; larger deals; more PS revenue by account; larger pipelines and
significantly better reference clients.
Table 54: PS Sales Maturity Progression
Initiated Level 1
Piloted Level 2
Deployed Level 3
Institution. Level 4
Optimized Level 5
Percent in each level 29.4% 24.6% 25.1% 15.0% 5.9%
Service selling spend as a % of service revenue 10.0% 7.5% 10.3% 6.0% 4.6%
FTEs dedicated to service sales 7.19 9.60 8.11 9.18 2.86
Annual service sales revenue quota / person (mm)
$1.13 $1.47 $1.86 $1.95 $1.92
% of service sales people achieving annual quota 63.0% 63.9% 68.1% 72.2% 75.0%
Average quarterly sales bookings forecast variance (Forecast/Actual)
21.2% 19.3% 16.9% 14.3% 7.5%
Service pricing accuracy (proposed price to actual delivery cost)
80.5% 83.5% 82.9% 83.6% 84.2%
Sales cycle from qual. lead to contract sign. (days) 109 97 94 89 125

2016 Professional Services Maturity™ Benchmark
© 2016 Service Performance Insight www.FinancialForce.com 89
Initiated Level 1
Piloted Level 2
Deployed Level 3
Institution. Level 4
Optimized Level 5
Average closed deal size (k) $77 $111 $124 $121 $171
Average annual service revenue by account (k) $148 $142 $157 $345 $271
Percentage of revenue from new clients 25.0% 26.3% 25.9% 29.8% 31.4%
Bid-to-win ratio (per 10 bids) 4.30 5.05 5.58 5.93 6.20
Deal pipeline relative to qtr. bookings forecast 147% 203% 187% 209% 200%
Annual days of sales training taken / sales rep. 2.17 3.54 5.11 3.95 4.30
Service sales effectiveness (1 to 5 scale) 2.76 3.04 3.02 3.18 3.91
% of "Referenceable" Clients 71.1% 67.9% 71.6% 76.5% 84.1%
Source: Service Performance Insight, PS Sales and Marketing Benchmark October 2013
PS Sales Effectiveness Metrics
Service sales effectiveness is a subjective question but typically refers to the percentage of sales people
who achieve quota and the probability that the sales organization will achieve its targets. SPI Research
asked respondents to rank the effectiveness of the service sales organization on a scale from 1 to 5 with
5 representing perfection (Table 55). Sales effectiveness has a profound impact on all aspects of PS but
unfortunately more than 10% give sales effectiveness a failing grade of 1 or 2; 32% give sales
effectiveness an “OK” score of 3; 60% give sales effectiveness high marks. These sales effectiveness
scores are substantially higher than in past surveys. This year’s rating of sales effectiveness scored 3.57
out of 5 (71%) which is substantially higher than last year’s score of 3.14 (62.8%) but there is still room
for improvement. With economic recovery, the age old schism between sales and PS delivery is not as
apparent. Another significant sales effectiveness catalyst has been the changing role of PS within
product-driven organizations. No longer the ugly stepchild; PS is now seen as the primary customer
usage and adoption engine, fueling product expansion and incremental product and service sales.
Table 55: Impact – Service Sales Effectiveness Impact on Performance
Sales Effectiveness
Survey Annual
Revenue Growth
Bid-Win
Ratio
Size of Sales
Pipeline
Revenue per
consultant
Revenue per
employee Backlog EBITDA
1 - Low 1.3% 8.9% 4.57 179% $154 $121 21.4% 12.5%
2 9.4% 6.6% 4.38 154% 185 147 40.0% 15.9%
3 32.1% 9.1% 4.75 158% 195 151 40.9% 13.0%
4 45.2% 10.8% 5.11 179% 201 160 41.2% 16.2%
5 - High 11.9% 13.6% 5.53 191% 205 172 38.7% 23.0%
Total/Avg. 100.0% 10.1% 4.97 172% $197 $157 40.4% 15.9%
Source: Service Performance Insight, February 2016

2016 Professional Services Maturity™ Benchmark
© 2016 Service Performance Insight www.FinancialForce.com 90
PS Marketing Maturity
The global economy has evolved into a services economy with services like health care, technology and
consulting representing the hottest areas of growth. Marketing services is an important skill, and a
tough one, for businesses to develop. Without a tangible product to show and tell customers about,
service marketers must be adept at pulling together all the pieces of the marketing mix to demonstrate
value for their target clients. Services are inherently intangible, are consumed simultaneously at the
time of their production, and cannot be stored, saved or resold once they have been used. Service
offerings are unique and cannot be exactly repeated even by the same service provider. Service
marketing has become a big business with a focus on establishing the services brand, generating
awareness and leads while providing powerful tools and collateral to support service sales and delivery.
Relationships Are Key
In service marketing, because there is no tangible product, relationships are key – both with the services
sales force and clients. Service marketers must listen to and understand the needs of customers and
prospects to identify the compelling reasons they buy and what attributes they most care about to build
differentiation for the firm. The role of service marketing is to identify target markets and clients and to
position the firm and its solutions while supporting the sales force with lead generation and reference
building activities. In many organizations, service marketing is also responsible for developing customer
references, testimonials, case studies and client advisory boards.
Services Marketing versus Service Lifecycle Management
A key finding from this benchmark is most PS organizations are confusing service marketing with service
lifecycle management. Service marketing is clearly an aspect of service lifecycle management but most
often does not encompass the truly transformational elements of building repeatable service delivery
methods and tools, which we include in the larger scope of service lifecycle management.
Table 56: PS Marketing Maturity™ Levels
Level 1 Level 2 Level 3 Level 4 Level 5
Ad Hoc, Opportunistic,
Heroic
Piloted, Experimental, Pockets of Excellence
Deployed, Basics in Place for All Key
Elements
Institutionalized, in the Company DNA /
Fabric
Visionary, Agile, Innovative, Continuous
Renewal and Improvement
Clie
nt
Val
ue
Handcrafted projects, unique, highly dependent on individual team member skills.
Limited replication or codification of service solutions. Point product solutions primarily focused on rapid implementation.
Clear, value-based sales and marketing messages for product, vertical, geographic audiences. Some level of client value and ROI measurement.
Client-centric, high value services developed and packaged. Demonstrated, measurable business value.
Partnerships exist with most strategic, forward-thinking clients to develop and enhance leading edge services.
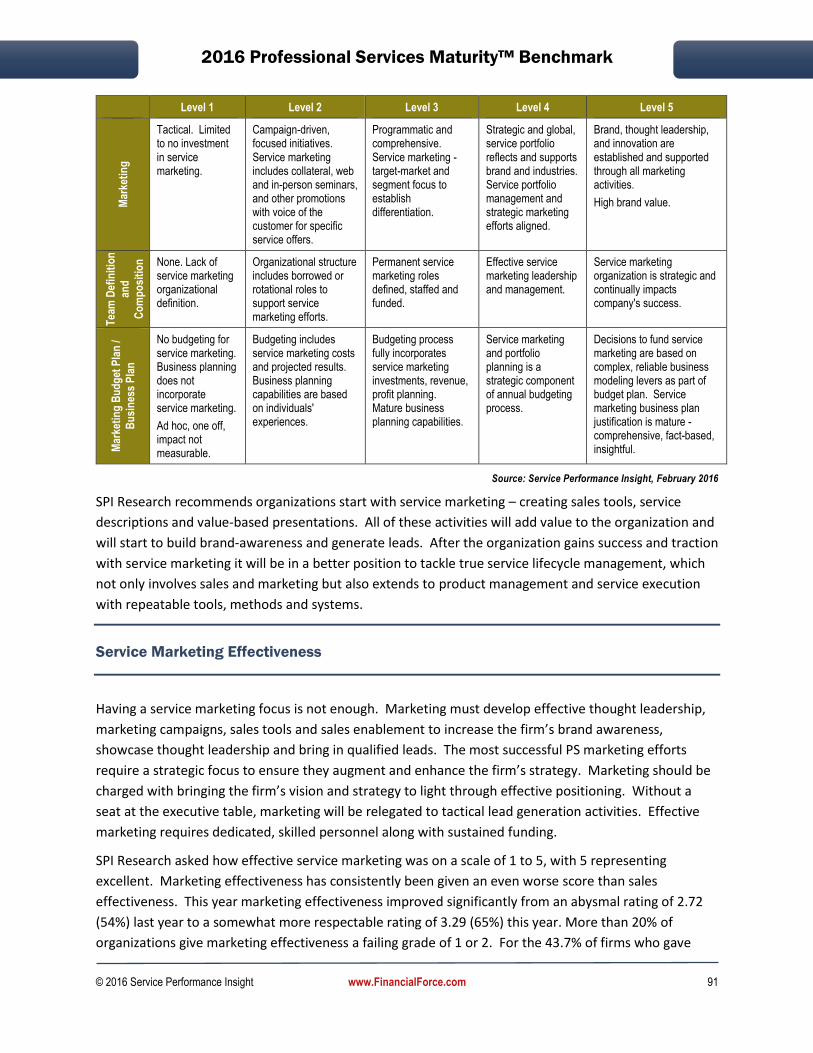
2016 Professional Services Maturity™ Benchmark
© 2016 Service Performance Insight www.FinancialForce.com 91
Level 1 Level 2 Level 3 Level 4 Level 5
Mar
keti
ng
Tactical. Limited to no investment in service marketing.
Campaign-driven, focused initiatives. Service marketing includes collateral, web and in-person seminars, and other promotions with voice of the customer for specific service offers.
Programmatic and comprehensive. Service marketing - target-market and segment focus to establish differentiation.
Strategic and global, service portfolio reflects and supports brand and industries. Service portfolio management and strategic marketing efforts aligned.
Brand, thought leadership, and innovation are established and supported through all marketing activities.
High brand value.
Tea
m D
efin
itio
n
and
Co
mp
osi
tio
n
None. Lack of service marketing organizational definition.
Organizational structure includes borrowed or rotational roles to support service marketing efforts.
Permanent service marketing roles defined, staffed and funded.
Effective service marketing leadership and management.
Service marketing organization is strategic and continually impacts company's success.
Mar
keti
ng
Bu
dg
et P
lan
/
Bu
sin
ess
Pla
n
No budgeting for service marketing. Business planning does not incorporate service marketing.
Ad hoc, one off, impact not measurable.
Budgeting includes service marketing costs and projected results. Business planning capabilities are based on individuals' experiences.
Budgeting process fully incorporates service marketing investments, revenue, profit planning. Mature business planning capabilities.
Service marketing and portfolio planning is a strategic component of annual budgeting process.
Decisions to fund service marketing are based on complex, reliable business modeling levers as part of budget plan. Service marketing business plan justification is mature - comprehensive, fact-based, insightful.
Source: Service Performance Insight, February 2016
SPI Research recommends organizations start with service marketing – creating sales tools, service
descriptions and value-based presentations. All of these activities will add value to the organization and
will start to build brand-awareness and generate leads. After the organization gains success and traction
with service marketing it will be in a better position to tackle true service lifecycle management, which
not only involves sales and marketing but also extends to product management and service execution
with repeatable tools, methods and systems.
Service Marketing Effectiveness
Having a service marketing focus is not enough. Marketing must develop effective thought leadership,
marketing campaigns, sales tools and sales enablement to increase the firm’s brand awareness,
showcase thought leadership and bring in qualified leads. The most successful PS marketing efforts
require a strategic focus to ensure they augment and enhance the firm’s strategy. Marketing should be
charged with bringing the firm’s vision and strategy to light through effective positioning. Without a
seat at the executive table, marketing will be relegated to tactical lead generation activities. Effective
marketing requires dedicated, skilled personnel along with sustained funding.
SPI Research asked how effective service marketing was on a scale of 1 to 5, with 5 representing
excellent. Marketing effectiveness has consistently been given an even worse score than sales
effectiveness. This year marketing effectiveness improved significantly from an abysmal rating of 2.72
(54%) last year to a somewhat more respectable rating of 3.29 (65%) this year. More than 20% of
organizations give marketing effectiveness a failing grade of 1 or 2. For the 43.7% of firms who gave
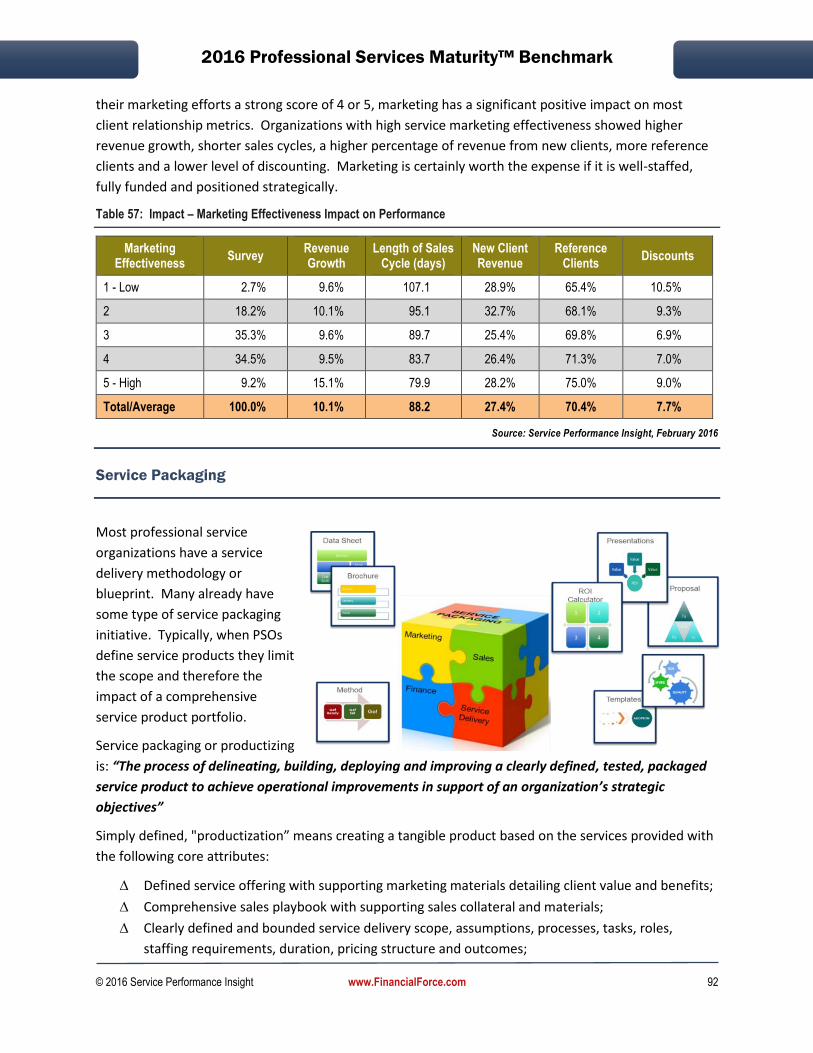
2016 Professional Services Maturity™ Benchmark
© 2016 Service Performance Insight www.FinancialForce.com 92
their marketing efforts a strong score of 4 or 5, marketing has a significant positive impact on most
client relationship metrics. Organizations with high service marketing effectiveness showed higher
revenue growth, shorter sales cycles, a higher percentage of revenue from new clients, more reference
clients and a lower level of discounting. Marketing is certainly worth the expense if it is well-staffed,
fully funded and positioned strategically.
Table 57: Impact – Marketing Effectiveness Impact on Performance
Marketing Effectiveness
Survey Revenue Growth
Length of Sales Cycle (days)
New Client Revenue
Reference Clients
Discounts
1 - Low 2.7% 9.6% 107.1 28.9% 65.4% 10.5%
2 18.2% 10.1% 95.1 32.7% 68.1% 9.3%
3 35.3% 9.6% 89.7 25.4% 69.8% 6.9%
4 34.5% 9.5% 83.7 26.4% 71.3% 7.0%
5 - High 9.2% 15.1% 79.9 28.2% 75.0% 9.0%
Total/Average 100.0% 10.1% 88.2 27.4% 70.4% 7.7%
Source: Service Performance Insight, February 2016
Service Packaging
Most professional service
organizations have a service
delivery methodology or
blueprint. Many already have
some type of service packaging
initiative. Typically, when PSOs
define service products they limit
the scope and therefore the
impact of a comprehensive
service product portfolio.
Service packaging or productizing
is: “The process of delineating, building, deploying and improving a clearly defined, tested, packaged
service product to achieve operational improvements in support of an organization’s strategic
objectives”
Simply defined, "productization” means creating a tangible product based on the services provided with
the following core attributes:
Defined service offering with supporting marketing materials detailing client value and benefits;
Comprehensive sales playbook with supporting sales collateral and materials;
Clearly defined and bounded service delivery scope, assumptions, processes, tasks, roles,
staffing requirements, duration, pricing structure and outcomes;
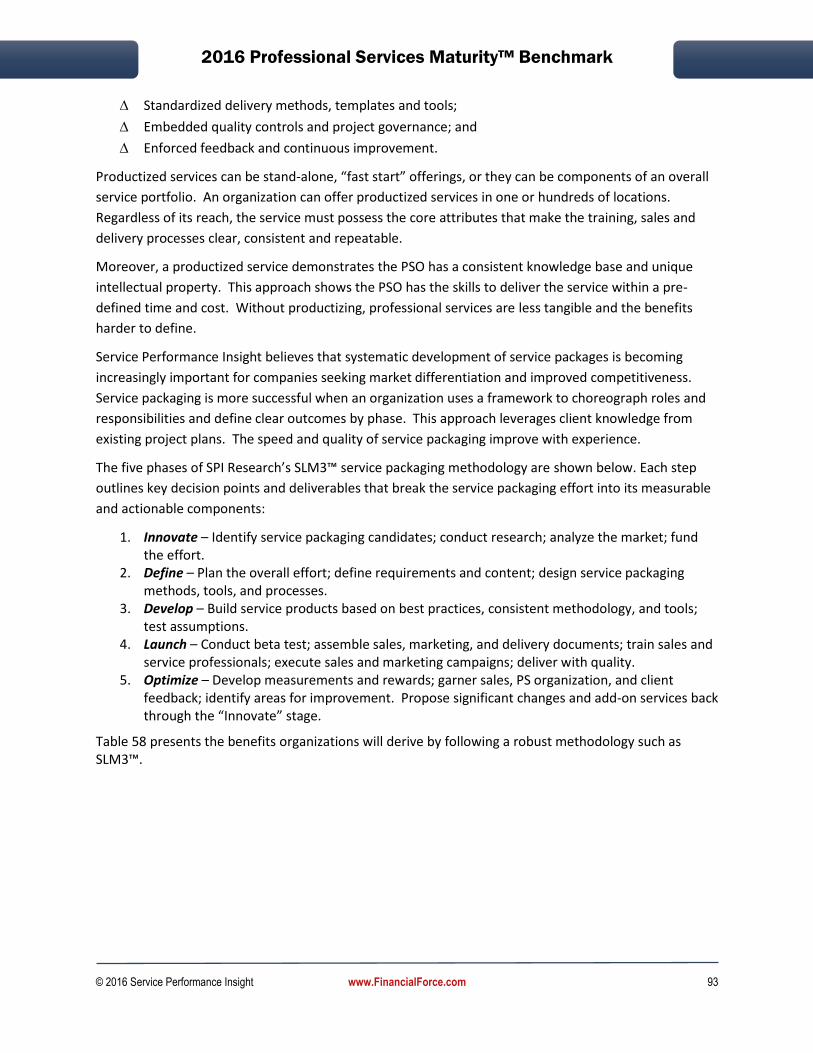
2016 Professional Services Maturity™ Benchmark
© 2016 Service Performance Insight www.FinancialForce.com 93
Standardized delivery methods, templates and tools;
Embedded quality controls and project governance; and
Enforced feedback and continuous improvement.
Productized services can be stand-alone, “fast start” offerings, or they can be components of an overall
service portfolio. An organization can offer productized services in one or hundreds of locations.
Regardless of its reach, the service must possess the core attributes that make the training, sales and
delivery processes clear, consistent and repeatable.
Moreover, a productized service demonstrates the PSO has a consistent knowledge base and unique
intellectual property. This approach shows the PSO has the skills to deliver the service within a pre-
defined time and cost. Without productizing, professional services are less tangible and the benefits
harder to define.
Service Performance Insight believes that systematic development of service packages is becoming
increasingly important for companies seeking market differentiation and improved competitiveness.
Service packaging is more successful when an organization uses a framework to choreograph roles and
responsibilities and define clear outcomes by phase. This approach leverages client knowledge from
existing project plans. The speed and quality of service packaging improve with experience.
The five phases of SPI Research’s SLM3™ service packaging methodology are shown below. Each step
outlines key decision points and deliverables that break the service packaging effort into its measurable
and actionable components:
1. Innovate – Identify service packaging candidates; conduct research; analyze the market; fund the effort.
2. Define – Plan the overall effort; define requirements and content; design service packaging methods, tools, and processes.
3. Develop – Build service products based on best practices, consistent methodology, and tools; test assumptions.
4. Launch – Conduct beta test; assemble sales, marketing, and delivery documents; train sales and service professionals; execute sales and marketing campaigns; deliver with quality.
5. Optimize – Develop measurements and rewards; garner sales, PS organization, and client feedback; identify areas for improvement. Propose significant changes and add-on services back through the “Innovate” stage.
Table 58 presents the benefits organizations will derive by following a robust methodology such as SLM3™.

2016 Professional Services Maturity™ Benchmark
© 2016 Service Performance Insight www.FinancialForce.com 94
Table 58: Service Packaging Benefits
Phase Benefits
Innovate
Easier to sell and position complete service portfolio
Clients understand business value – shortened sales cycle
Faster, more iterative projects produce superior client business value
Able to clobber the competition
Define
Well documented and understood service portfolio
Faster time to value, more projects delivered on-time, on-budget
Clear policies, roles, blueprints, templates and tools facilitate new-hire ramping
Reuse, consistency and quality are the norm
Develop
Consistent global service portfolio
Repeatable blueprints, methods, tools and IP
Lower project delivery costs, higher utilization, better margins
Launch
Clear Sales and Marketing plan improves Sales and Marketing effectiveness
Better Bid-to-Win Ratio
Larger pipelines
Satisfied, reference clients
Optimize
More extension and upgrade opportunities for add-on revenue
Higher client retention and repurchase
Improved visibility to future client needs
Source: Service Performance Insight, February 2016
Solution Development Effectiveness
Solution development effectiveness requires consistent PS and Sales executive funding and support. Ad
hoc teams of benched consultants cannot be effective in developing a compelling and meaningful
solution development strategy and program. Based on the Service Lifecycle Management Maturity
Model™ benchmark, very few organizations are effective at service productization. Creating an effective
and efficient solution development process is, in itself, a difficult undertaking. Most firms are struggling
to do this because solution development crosses over traditional functional boundaries and requires
both collaboration and change. Getting all of the constituent groups - professional services, sales,
marketing, product management and channel partners - on the same page to create compelling
solutions for the targeted markets is a daunting task.
Solution development requires significant leadership, organizational commitment and change
management. Service Performance Insight believes that the following are critical success factors for
instantiating and sustaining a successful solution development program:
∆ Articulated and understood services strategy;
∆ Service productization program vision;
∆ Active executive sponsorship;
∆ Market-driven focus;

2016 Professional Services Maturity™ Benchmark
© 2016 Service Performance Insight www.FinancialForce.com 95
∆ Global company adoption of program;
∆ Resource commitment;
∆ Cross-functional participation; and
∆ Common sales and delivery method, tools, and templates.
Service Performance Insight’s recommended SLM3™ organizational structure, foundation, and
methodology are architected to enable the committed organization to be successful.
SPI Research asked how effective solution development was on a scale of 1 to 5, with 5 representing
excellent. Solution Development effectiveness has consistently been given a lower score than sales
effectiveness but higher than marketing effectiveness. This year solution development effectiveness
(3.59 or 72%) surpassed sales effectiveness (3.57 or 71%) for the first time. The highest solution
development scores were posted by SaaS organizations (3.83 or 77%) who rely on packaged solutions to
help them sell and drive customer adoption (Table 59). For the 58.5% of firms who gave their solution
development efforts a passing score of 4 or 5, solution development had a significant positive impact on
most client relationship metrics. Organizations with high solution development effectiveness showed
higher revenue growth, better bid-win ratios and significantly higher revenues per consultant and
employee. Solution development should be a strategic priority for all PS organizations.
Table 59: Impact – Solution Development Effectiveness Impact on Performance
Sales Effectiveness
Survey Annual
Revenue Growth
Bid-Win
Ratio
Size of Sales
Pipeline
Revenue per
consultant
Revenue per
employee Backlog EBITDA
1 - Low 2.5% 9.4% 3.96 192% $144 $104 23.6% 10.1%
2 9.6% 6.9% 4.11 173% 194 149 40.9% 17.2%
3 29.4% 9.5% 4.93 164% 194 156 46.2% 13.5%
4 43.1% 10.5% 4.87 175% 198 160 38.5% 15.4%
5 - High 15.4% 12.6% 5.83 171% 213 160 36.4% 20.3%
Total/Avg. 100.0% 10.1% 4.97 172% $197 $157 40.4% 15.9%
Source: Service Performance Insight, February 2016
Survey Results
The following section reviews and analyzes 2016 PS Maturity™ benchmark results from 549 participating
Professional services organizations. In this section SPI Research analyzes 35 Client Relationship key
performance measurements that are critical for measuring sales, marketing and solution development
effectiveness.
The size of the deal pipeline is an important predictor of future revenue. The size of the deal pipeline
has declined precipitously from last year (172% this year compared to 199% last year). This significant
decline is a powerful predictor of future declines in PS revenues. Caution must be paid!

2016 Professional Services Maturity™ Benchmark
© 2016 Service Performance Insight www.FinancialForce.com 96
Table 60 shows the size of the deal pipeline compared to the quarterly bookings forecast is stronger for
embedded ESOs however both ESO and PSO pipelines have declined dramatically from last year. ESO
pipelines declined from 215% to 178% (-37%) while independent pipelines declined from 192% to 160%
(-32%). By geography the deal pipeline is strongest for APac followed by the Americas with EMEA last.
These figures are down significantly from last year’s results. The deal pipeline in APAC has declined
from 213% to 184%; Americas from 196% to 178% and EMEA from 204% to 153%. This metric portends
stormy seas ahead across the PS industry. Firms should take heed to reexamine 2016 revenue forecasts.
Just as we have seen the size of the deal pipeline decline year over year, so too has the percentage of
revenue from new clients. Across the benchmark, new client revenue declined from 29% last year to
27.5% (-1.5%) this year. Both of these declines are significant and portend trouble ahead. PS
organizations should carefully review leading sales indicators before they make significant
investments in expansion as the PS market may be softening, particularly in EMEA. Revenue from new
clients declined from 29.7% to 29.5% in the Americas; 27% to 22.9% in EMEA and 27.8% to 25.5% in
APAC.
Table 60: Client Relationships KPIs by Organization Type and Geographic Region
Key Performance Indicator (KPI) 2015 ESO PSO Americas EMEA APac
Revenue from new clients 27.5% 34.9% 23.9% 29.5% 22.9% 25.5%
Bid-to-win ratio (per 10 bids) 4.95 4.98 4.94 5.08 4.49 5.43
Deal pipeline relative to qtr. bookings forecast
172% 196% 160% 178% 153% 184%
Sales cycle (days: qualified lead to contract signing)
88 98 83 90 83 86
Average service discount given clients 7.7% 10.8% 6.2% 8.2% 6.6% 6.8%
Percentage of referenceable clients 70.4% 65.4% 72.8% 71.2% 68.8% 69.6%
Service sales effectiveness 3.59 3.63 3.57 3.60 3.50 3.81
Service marketing effectiveness 3.57 3.56 3.57 3.60 3.49 3.53
Solution development effectiveness 3.29 3.20 3.34 3.29 3.26 3.44
Source: Service Performance Insight, February 2016
Another indicator of softening demand is the level of discounting. Average discounts edged up from
7.3% last year to 7.7% this year. Embedded PSOs reported significantly higher levels of discounting,
longer sales cycles and fewer client references than independents. The highest average discounts were
reported by embedded SaaS and Software PSOs at 11.8%. They also gave poorer ratings for sales,
marketing and solution development effectiveness. Larger embedded PSOs should invest in their own
solution architects and service marketing and packaging. These efforts pay dividends in reduced
discounting and higher levels of client referenceability and satisfaction.
By organization size, the deal pipeline is strongest for the largest organizations and weakest for the
smallest. The smallest firms tend to live deal to deal with limited future visibility. Interestingly, client
referenceability declines with organization size as larger PSOs cannot afford to provide a personalized

2016 Professional Services Maturity™ Benchmark
© 2016 Service Performance Insight www.FinancialForce.com 97
touch and approach to each client. For small firms, making every client a success is a business
imperative. The largest organizations reported the best bid-win ratios, strongest pipelines and highest
effectiveness scores but they also produced the fewest reference clients and gave the highest discounts.
Of particular note is the decline in the size of the sales pipeline. It has dropped precipitously, in most
cases by more than 20%. This should signal caution and scrutiny. Firms of all sizes are well-advised to
carefully scrub their sales pipeline before they make significant growth investments.
Table 61: Client Relationships KPIs by Organization Size
Key Performance Indicator (KPI) Under 10 10 - 30 31 – 100 101 - 300 301 - 700 Over 700
Revenue from new clients 27.7% 28.7% 29.0% 26.0% 23.9% 28.4%
Bid-to-win ratio (per 10 bids) 4.96 4.89 5.14 4.63 4.74 5.31
Deal pipeline relative to qtr. bookings forecast
143% 159% 171% 175% 184% 196%
Sales cycle (days: qualified lead to contract signing)
73 88 91 96 86 83
Average service discount given clients 6.3% 7.5% 6.9% 7.5% 8.8% 9.8%
Percentage of referenceable clients 73.0% 70.2% 73.6% 68.5% 72.0% 64.9%
Service sales effectiveness 3.58 3.51 3.49 3.66 3.52 3.86
Service marketing effectiveness 3.47 3.50 3.45 3.64 3.65 3.77
Solution development effectiveness 3.06 3.15 3.24 3.39 3.27 3.60
Source: Service Performance Insight, February 2016
By vertical, embedded software PSOs reported the strongest deal pipeline while architects and
engineers reported the weakest. Architects reported the highest levels of client referenceability,
software PSOs reported the poorest. Service discounting is prevalent in embedded PSOs, particularly if
they work on a time and materials basis with known rate cards. SaaS PSOs reported the best sales,
marketing and solution development effectiveness; hardware PSOs reported the worst.
Tables 62 and 63 show key client relationships metrics by vertical market. Best performing verticals are
highlighted in green, worst are highlighted in red. Accountancies had the worst scores.
Table 62: Client Relationships KPIs by Vertical Service Market
Key Performance Indicator (KPI) IT
Consult. Software
Mgmt. Consult.
Arch./ Engr.
SaaS Mgd. Serv.
Hard. & Network
Revenue from new clients 25.9% 31.8% 23.2% 21.7% 44.2% 19.7% 37.9%
Bid-to-win ratio (per 10 bids) 4.79 5.04 5.39 4.62 5.18 4.32 4.93
Deal pipeline relative to qtr. bookings forecast
172% 212% 151% 142% 190% 167% 157%
Sales cycle (days: qualified lead to contract signing)
88 104 78 93 93 84 75
Average service discount given clients 7.6% 11.8% 4.9% 4.0% 11.8% 8.3% 8.6%
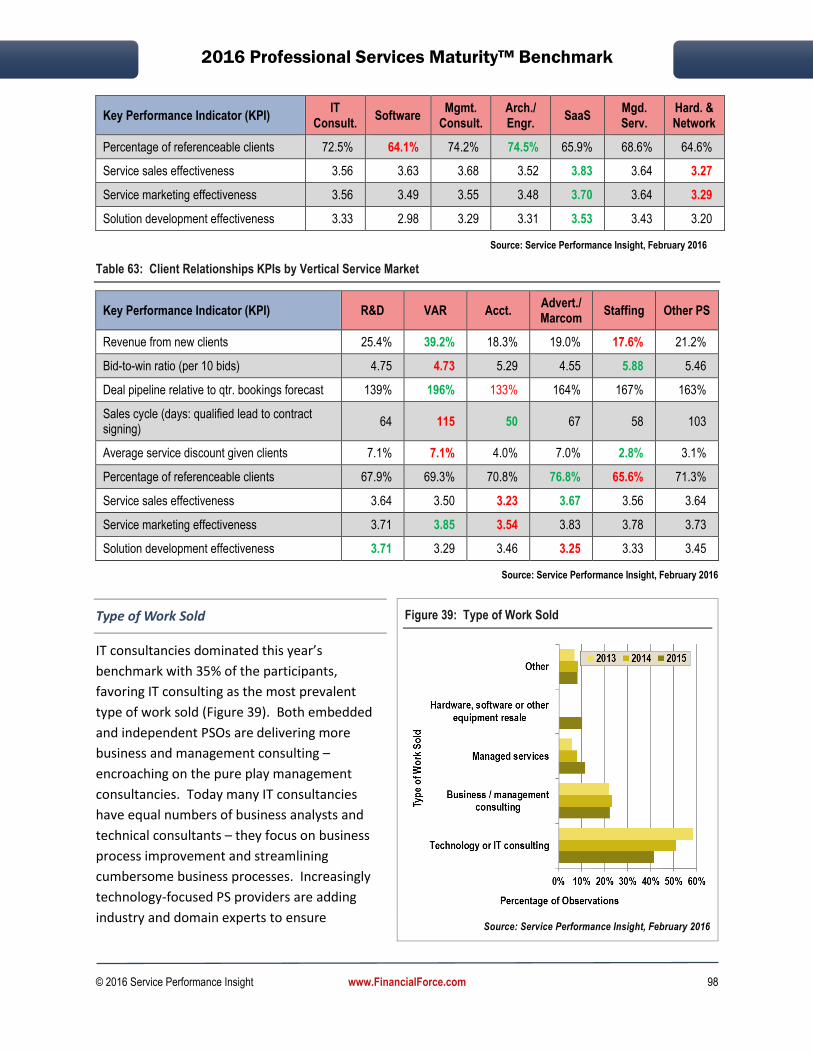
2016 Professional Services Maturity™ Benchmark
© 2016 Service Performance Insight www.FinancialForce.com 98
Key Performance Indicator (KPI) IT
Consult. Software
Mgmt. Consult.
Arch./ Engr.
SaaS Mgd. Serv.
Hard. & Network
Percentage of referenceable clients 72.5% 64.1% 74.2% 74.5% 65.9% 68.6% 64.6%
Service sales effectiveness 3.56 3.63 3.68 3.52 3.83 3.64 3.27
Service marketing effectiveness 3.56 3.49 3.55 3.48 3.70 3.64 3.29
Solution development effectiveness 3.33 2.98 3.29 3.31 3.53 3.43 3.20
Source: Service Performance Insight, February 2016
Table 63: Client Relationships KPIs by Vertical Service Market
Key Performance Indicator (KPI) R&D VAR Acct. Advert./ Marcom
Staffing Other PS
Revenue from new clients 25.4% 39.2% 18.3% 19.0% 17.6% 21.2%
Bid-to-win ratio (per 10 bids) 4.75 4.73 5.29 4.55 5.88 5.46
Deal pipeline relative to qtr. bookings forecast 139% 196% 133% 164% 167% 163%
Sales cycle (days: qualified lead to contract signing)
64 115 50 67 58 103
Average service discount given clients 7.1% 7.1% 4.0% 7.0% 2.8% 3.1%
Percentage of referenceable clients 67.9% 69.3% 70.8% 76.8% 65.6% 71.3%
Service sales effectiveness 3.64 3.50 3.23 3.67 3.56 3.64
Service marketing effectiveness 3.71 3.85 3.54 3.83 3.78 3.73
Solution development effectiveness 3.71 3.29 3.46 3.25 3.33 3.45
Source: Service Performance Insight, February 2016
Type of Work Sold
IT consultancies dominated this year’s
benchmark with 35% of the participants,
favoring IT consulting as the most prevalent
type of work sold (Figure 39). Both embedded
and independent PSOs are delivering more
business and management consulting –
encroaching on the pure play management
consultancies. Today many IT consultancies
have equal numbers of business analysts and
technical consultants – they focus on business
process improvement and streamlining
cumbersome business processes. Increasingly
technology-focused PS providers are adding
industry and domain experts to ensure
Figure 39: Type of Work Sold
Source: Service Performance Insight, February 2016

2016 Professional Services Maturity™ Benchmark
© 2016 Service Performance Insight www.FinancialForce.com 99
horizontal technologies can be adopted and modified to reflect the unique needs of vertical industry
clients.
Underlying technologies no longer require customization and integration; they have become easier to
install and integrate with standard data loaders and connectors. Ensuring user adoption has become
the primary concern of embedded PSOs. This means today’s consultants need to understand business
processes and what business users want and need to drive user adoption. Technology consulting now
includes workflow mapping, business process modelling, rollout plans and administrator and end-user
training with a focus on user adoption.
This year we saw a spike in managed services revenue, growing from 8.0% to 11.6% of all work sold.
Embedded SaaS organizations are responsible for this spike as they saw their managed service revenues
grow from 2.4% last year to 21.9% this year. Most SaaS embedded PSOs have started adding managed
service offers as they out task all elements of running their applications for their clients. For many
independents, the promise of managed services as a source of annuity revenue has not been fully
realized because technology vendors have grabbed these opportunities from independents by offering
better economies of scale. In this benchmark, staff augmentation has declined to only 6.5% of work sold.
Staffing providers have been squeezed by vendor service agreements and have moved upstream to offer
business and IT consulting. Pure play staffing and managed services are drifting toward
commoditization – with too many competitors chasing too few opportunities. The margins in this low
end of the market have become razor thin as large buyers demand vendor service agreements with low
rates for common skills. Mergers and acquisitions in both staff augmentation and managed services are
common as suppliers seek to improve their own economies of scale.
Table 64 depicts the types of work sold by embedded and independent service providers and by major
geographic regions. This year embedded PSOs delivered 15.2% of their work as management
consulting, showing the shift towards business process consulting, away from technical consulting. They
also grew their managed service revenues from 5.5% last year to 15.1% this year.
Table 64: Type of Work Sold by Organization Type and Geographic Region
Type of Work Sold Survey ESO PSO Americas EMEA APac
Business/Management Consulting 22.2% 15.2% 25.5% 20.9% 24.0% 27.7%
Technology or IT Consulting 41.3% 45.7% 39.2% 41.3% 42.0% 39.7%
Managed Services 11.6% 15.1% 10.0% 12.6% 9.3% 10.8%
Staff Augmentation 6.5% 4.8% 7.3% 7.3% 4.7% 4.7%
Hardware, software, equipment 10.3% 7.0% 11.8% 9.3% 13.8% 6.9%
Other 8.1% 12.2% 6.2% 8.7% 6.2% 10.1%
Total 100.0% 100.0% 100.0% 100.0% 100.0% 100.0%
Source: Service Performance Insight, February 2016
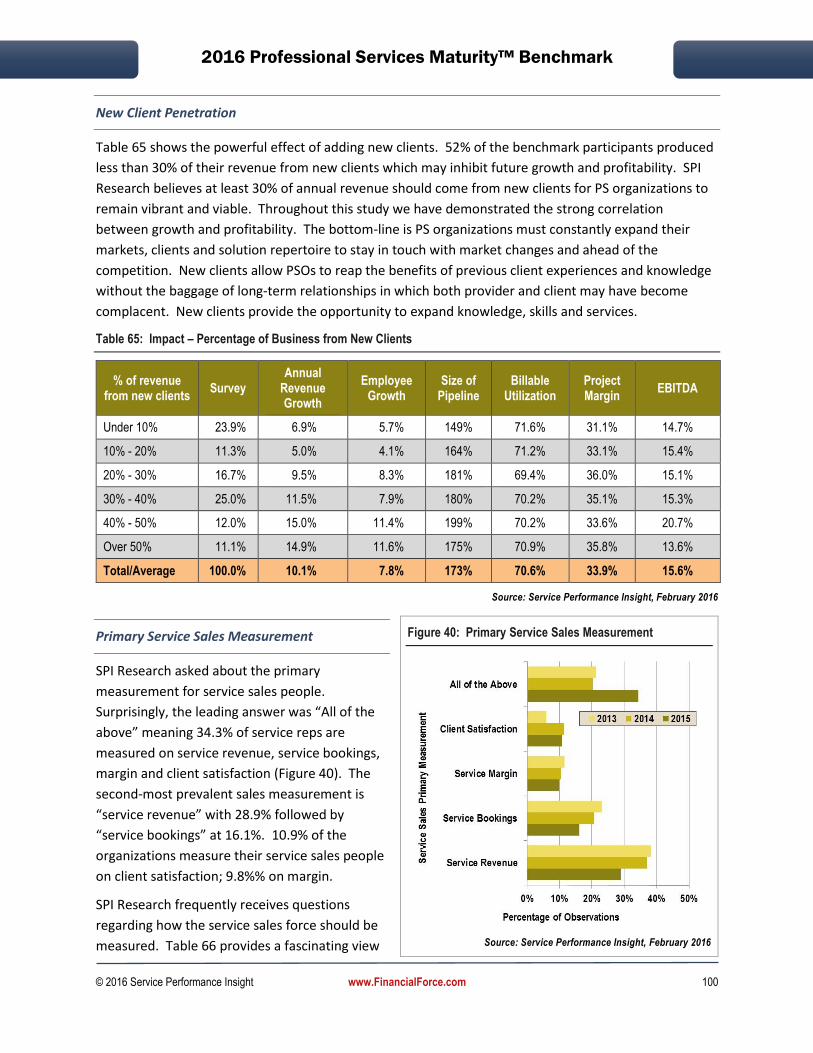
2016 Professional Services Maturity™ Benchmark
© 2016 Service Performance Insight www.FinancialForce.com 100
New Client Penetration
Table 65 shows the powerful effect of adding new clients. 52% of the benchmark participants produced
less than 30% of their revenue from new clients which may inhibit future growth and profitability. SPI
Research believes at least 30% of annual revenue should come from new clients for PS organizations to
remain vibrant and viable. Throughout this study we have demonstrated the strong correlation
between growth and profitability. The bottom-line is PS organizations must constantly expand their
markets, clients and solution repertoire to stay in touch with market changes and ahead of the
competition. New clients allow PSOs to reap the benefits of previous client experiences and knowledge
without the baggage of long-term relationships in which both provider and client may have become
complacent. New clients provide the opportunity to expand knowledge, skills and services.
Table 65: Impact – Percentage of Business from New Clients
% of revenue from new clients
Survey Annual
Revenue Growth
Employee Growth
Size of Pipeline
Billable Utilization
Project Margin
EBITDA
Under 10% 23.9% 6.9% 5.7% 149% 71.6% 31.1% 14.7%
10% - 20% 11.3% 5.0% 4.1% 164% 71.2% 33.1% 15.4%
20% - 30% 16.7% 9.5% 8.3% 181% 69.4% 36.0% 15.1%
30% - 40% 25.0% 11.5% 7.9% 180% 70.2% 35.1% 15.3%
40% - 50% 12.0% 15.0% 11.4% 199% 70.2% 33.6% 20.7%
Over 50% 11.1% 14.9% 11.6% 175% 70.9% 35.8% 13.6%
Total/Average 100.0% 10.1% 7.8% 173% 70.6% 33.9% 15.6%
Source: Service Performance Insight, February 2016
Primary Service Sales Measurement
SPI Research asked about the primary
measurement for service sales people.
Surprisingly, the leading answer was “All of the
above” meaning 34.3% of service reps are
measured on service revenue, service bookings,
margin and client satisfaction (Figure 40). The
second-most prevalent sales measurement is
“service revenue” with 28.9% followed by
“service bookings” at 16.1%. 10.9% of the
organizations measure their service sales people
on client satisfaction; 9.8%% on margin.
SPI Research frequently receives questions
regarding how the service sales force should be
measured. Table 66 provides a fascinating view
Figure 40: Primary Service Sales Measurement
Source: Service Performance Insight, February 2016

2016 Professional Services Maturity™ Benchmark
© 2016 Service Performance Insight www.FinancialForce.com 101
of the cause and effect of service sales measurements. This is the first year “all of above” has been the
primary sales measurement. With so many variables in this type of compensation, accurate
measurements are difficult and time consuming but appear to be worth the effort as it produces
superior bid-win ratios, reference clients, utilization, on-time project delivery and most importantly, net
profit. A big drawback to incenting sales with too many metrics is that they become hard to measure
and enforce. Although service revenue measurements are common (28.9%), they appear to produce
mediocre performance particularly in net margin.
Table 66: Impact – The Effect of Sales Measurements on Performance
Primary Service Sales
Measurement Survey
Annual Revenue Growth
Bid-Win
Ratio
Size of Pipeline
Refer. Clients
Util. On-time project delivery
Rev. per billable consult.
EBITDA
Service Revenue 28.9% 10.7% 4.81 176% 69.5% 69.9% 76.8% $197 13.4%
Service Bookings 16.1% 10.9% 4.90 198% 69.1% 68.7% 74.0% 213 15.2%
Service Margin 9.8% 9.2% 4.59 172% 68.6% 69.4% 71.5% 219 15.8%
Client Satisfaction 10.9% 8.7% 5.03 154% 71.3% 70.4% 74.4% 166 16.7%
All of the Above 34.3% 10.5% 5.16 160% 72.0% 72.2% 78.6% 197 17.9%
Total / Average 100.0% 10.3% 4.95 171% 70.4% 70.5% 76.2% $198 15.8%
Source: Service Performance Insight, February 2016
This year service bookings measurements produced the most revenue growth and largest pipelines.
Service margin targets are harder to measure and calculate plus they can only be measured after the
project has been completed. Many firms are switching to “Service Margin” as a primary metric but they
use “average cost” figures to calculate deal margin to simplify sales compensation. Interestingly, service
margin as the primary sales measurement produced the poorest results in bid-win ratios, reference
clients and on-time project delivery.
Surprisingly, the worst service sales measurement is “client satisfaction” reported by 10.9% of the
benchmark respondents. With client satisfaction as the primary measurement, service sales people
have a vested interest in the quality and timeliness of project delivery. In this year’s survey, for sales
teams based on client satisfaction, their firms delivered mediocre on-time project delivery and the
poorest revenue and pipeline growth and lowest consultant revenue yield. The pursuit of client
satisfaction at any cost may incent the sales force to drive service delivery “to do whatever it takes”
without regard to margin or future growth.
Regardless of primary sales measurement, clarity and fairness drive the best results. SPI recommends
an open book approach to allow sales people to measure and improve their own performance.
Primary Service Target Buyer
SPI Research asked “who is the primary buyer for your services”? For the 549 benchmark respondents,
the primary target buyer is most likely to be a line of business executive (40%); CIO (23.6%); other
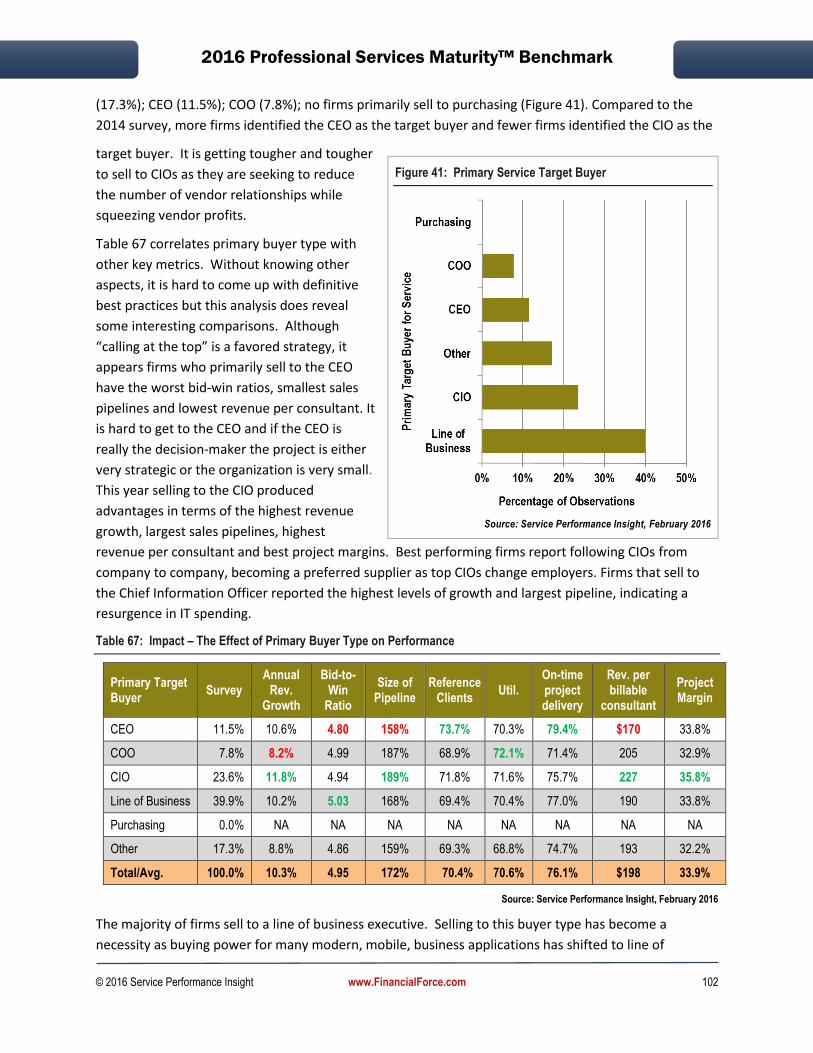
2016 Professional Services Maturity™ Benchmark
© 2016 Service Performance Insight www.FinancialForce.com 102
(17.3%); CEO (11.5%); COO (7.8%); no firms primarily sell to purchasing (Figure 41). Compared to the
2014 survey, more firms identified the CEO as the target buyer and fewer firms identified the CIO as the
target buyer. It is getting tougher and tougher
to sell to CIOs as they are seeking to reduce
the number of vendor relationships while
squeezing vendor profits.
Table 67 correlates primary buyer type with
other key metrics. Without knowing other
aspects, it is hard to come up with definitive
best practices but this analysis does reveal
some interesting comparisons. Although
“calling at the top” is a favored strategy, it
appears firms who primarily sell to the CEO
have the worst bid-win ratios, smallest sales
pipelines and lowest revenue per consultant. It
is hard to get to the CEO and if the CEO is
really the decision-maker the project is either
very strategic or the organization is very small.
This year selling to the CIO produced
advantages in terms of the highest revenue
growth, largest sales pipelines, highest
revenue per consultant and best project margins. Best performing firms report following CIOs from
company to company, becoming a preferred supplier as top CIOs change employers. Firms that sell to
the Chief Information Officer reported the highest levels of growth and largest pipeline, indicating a
resurgence in IT spending.
Table 67: Impact – The Effect of Primary Buyer Type on Performance
Primary Target Buyer
Survey Annual
Rev. Growth
Bid-to-Win
Ratio
Size of Pipeline
Reference Clients
Util. On-time project delivery
Rev. per billable
consultant
Project Margin
CEO 11.5% 10.6% 4.80 158% 73.7% 70.3% 79.4% $170 33.8%
COO 7.8% 8.2% 4.99 187% 68.9% 72.1% 71.4% 205 32.9%
CIO 23.6% 11.8% 4.94 189% 71.8% 71.6% 75.7% 227 35.8%
Line of Business 39.9% 10.2% 5.03 168% 69.4% 70.4% 77.0% 190 33.8%
Purchasing 0.0% NA NA NA NA NA NA NA NA
Other 17.3% 8.8% 4.86 159% 69.3% 68.8% 74.7% 193 32.2%
Total/Avg. 100.0% 10.3% 4.95 172% 70.4% 70.6% 76.1% $198 33.9%
Source: Service Performance Insight, February 2016
The majority of firms sell to a line of business executive. Selling to this buyer type has become a
necessity as buying power for many modern, mobile, business applications has shifted to line of
Figure 41: Primary Service Target Buyer
Source: Service Performance Insight, February 2016
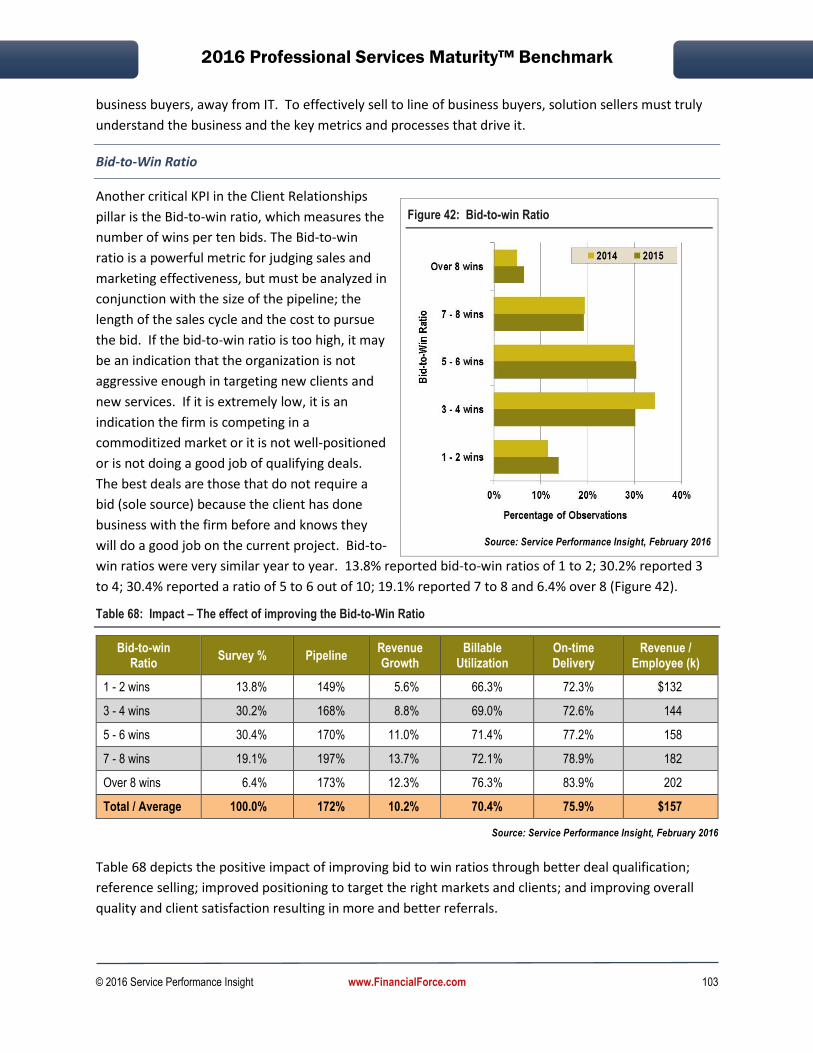
2016 Professional Services Maturity™ Benchmark
© 2016 Service Performance Insight www.FinancialForce.com 103
business buyers, away from IT. To effectively sell to line of business buyers, solution sellers must truly
understand the business and the key metrics and processes that drive it.
Bid-to-Win Ratio
Another critical KPI in the Client Relationships
pillar is the Bid-to-win ratio, which measures the
number of wins per ten bids. The Bid-to-win
ratio is a powerful metric for judging sales and
marketing effectiveness, but must be analyzed in
conjunction with the size of the pipeline; the
length of the sales cycle and the cost to pursue
the bid. If the bid-to-win ratio is too high, it may
be an indication that the organization is not
aggressive enough in targeting new clients and
new services. If it is extremely low, it is an
indication the firm is competing in a
commoditized market or it is not well-positioned
or is not doing a good job of qualifying deals.
The best deals are those that do not require a
bid (sole source) because the client has done
business with the firm before and knows they
will do a good job on the current project. Bid-to-
win ratios were very similar year to year. 13.8% reported bid-to-win ratios of 1 to 2; 30.2% reported 3
to 4; 30.4% reported a ratio of 5 to 6 out of 10; 19.1% reported 7 to 8 and 6.4% over 8 (Figure 42).
Table 68: Impact – The effect of improving the Bid-to-Win Ratio
Bid-to-win Ratio
Survey % Pipeline Revenue Growth
Billable Utilization
On-time Delivery
Revenue / Employee (k)
1 - 2 wins 13.8% 149% 5.6% 66.3% 72.3% $132
3 - 4 wins 30.2% 168% 8.8% 69.0% 72.6% 144
5 - 6 wins 30.4% 170% 11.0% 71.4% 77.2% 158
7 - 8 wins 19.1% 197% 13.7% 72.1% 78.9% 182
Over 8 wins 6.4% 173% 12.3% 76.3% 83.9% 202
Total / Average 100.0% 172% 10.2% 70.4% 75.9% $157
Source: Service Performance Insight, February 2016
Table 68 depicts the positive impact of improving bid to win ratios through better deal qualification;
reference selling; improved positioning to target the right markets and clients; and improving overall
quality and client satisfaction resulting in more and better referrals.
Figure 42: Bid-to-win Ratio
Source: Service Performance Insight, February 2016

2016 Professional Services Maturity™ Benchmark
© 2016 Service Performance Insight www.FinancialForce.com 104
Deal Pipeline Relative to Quarterly Bookings Forecast
The deal pipeline as compared to the quarterly
bookings forecast is an important leading
indicator that provides insight into sales
effectiveness and future revenue. The size of
the deal pipeline shows direct correlation to all
major growth indicators – revenue growth;
revenue per billable employee; percentage
achievement of the annual revenue plan and
billable utilization. A sure sign of trouble ahead
is that 50% of benchmark participants reported
their deal pipeline was the same or less than
forecast! Only 22.2% (down from 37.7% last
year) reported their deal pipelines were three
times or larger than their forecasts which leads
to strong growth and profitability (Figure 43).
SPI Research recommends firms pay very
careful attention to this metric and take
corrective action if their pipelines dip below
200% of forecast.
Length of the Sales Cycle
The length of the sales cycle measures the time
it takes to move a qualified lead to a signed
contract. Sales cycle length is a leading indicator
of demand as sales cycles elongate when the
economy is contracting and shrink when the
economy is expanding. The overall average
length of the sales cycle dropped this year from
95 days to 91 days. Embedded PSOs reported
much longer sales cycles (100 days) than
independents (87 days). The length of the sales
cycle increases proportionately with the size of
the organization as larger organizations have
more players involved and focus on larger, more
complex deals.
Organizations from EMEA showed the most
improvement in reducing the length of the sales
cycle from 113 days in 2012 to 89 in 2013, 87 in 2014 and 83 in 2015. This is one of the few EMEA bright
Figure 43: Deal Pipeline Relative to Qtr. Bookings Forecast
Source: Service Performance Insight, February 2016
Figure 44: Length of Sales Cycle
Source: Service Performance Insight, February 2016
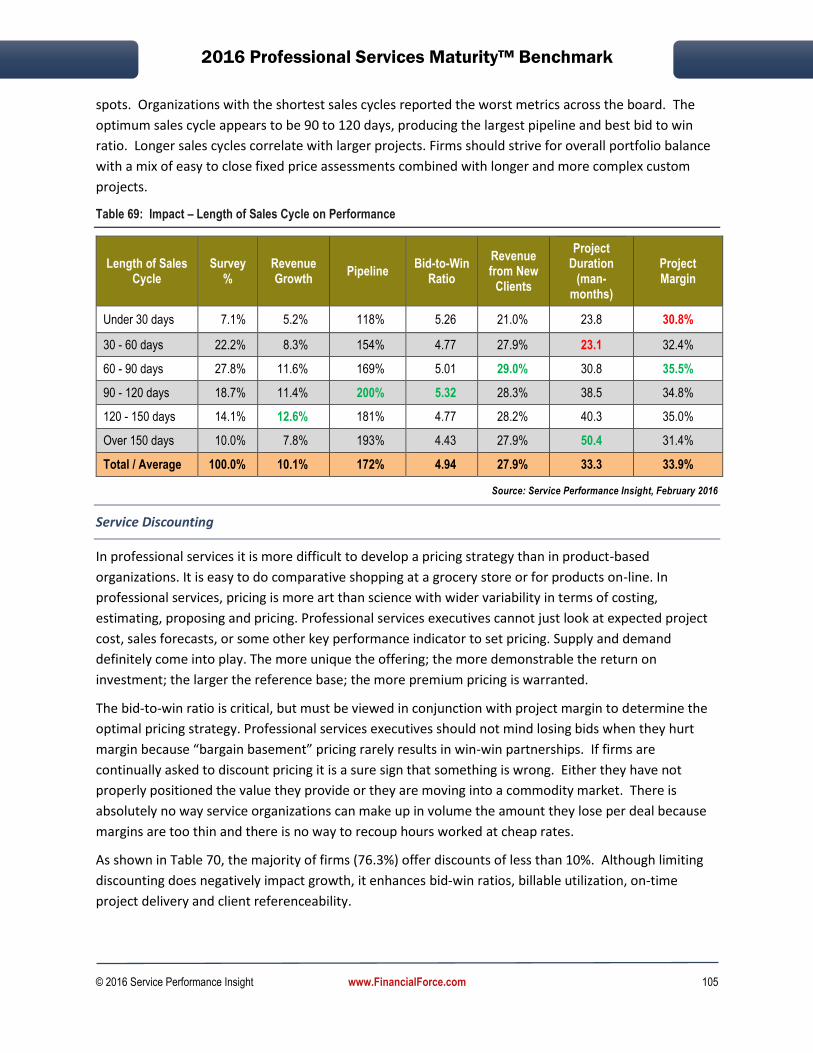
2016 Professional Services Maturity™ Benchmark
© 2016 Service Performance Insight www.FinancialForce.com 105
spots. Organizations with the shortest sales cycles reported the worst metrics across the board. The
optimum sales cycle appears to be 90 to 120 days, producing the largest pipeline and best bid to win
ratio. Longer sales cycles correlate with larger projects. Firms should strive for overall portfolio balance
with a mix of easy to close fixed price assessments combined with longer and more complex custom
projects.
Table 69: Impact – Length of Sales Cycle on Performance
Length of Sales Cycle
Survey %
Revenue Growth
Pipeline Bid-to-Win
Ratio
Revenue from New
Clients
Project Duration
(man-months)
Project Margin
Under 30 days 7.1% 5.2% 118% 5.26 21.0% 23.8 30.8%
30 - 60 days 22.2% 8.3% 154% 4.77 27.9% 23.1 32.4%
60 - 90 days 27.8% 11.6% 169% 5.01 29.0% 30.8 35.5%
90 - 120 days 18.7% 11.4% 200% 5.32 28.3% 38.5 34.8%
120 - 150 days 14.1% 12.6% 181% 4.77 28.2% 40.3 35.0%
Over 150 days 10.0% 7.8% 193% 4.43 27.9% 50.4 31.4%
Total / Average 100.0% 10.1% 172% 4.94 27.9% 33.3 33.9%
Source: Service Performance Insight, February 2016
Service Discounting
In professional services it is more difficult to develop a pricing strategy than in product-based
organizations. It is easy to do comparative shopping at a grocery store or for products on-line. In
professional services, pricing is more art than science with wider variability in terms of costing,
estimating, proposing and pricing. Professional services executives cannot just look at expected project
cost, sales forecasts, or some other key performance indicator to set pricing. Supply and demand
definitely come into play. The more unique the offering; the more demonstrable the return on
investment; the larger the reference base; the more premium pricing is warranted.
The bid-to-win ratio is critical, but must be viewed in conjunction with project margin to determine the
optimal pricing strategy. Professional services executives should not mind losing bids when they hurt
margin because “bargain basement” pricing rarely results in win-win partnerships. If firms are
continually asked to discount pricing it is a sure sign that something is wrong. Either they have not
properly positioned the value they provide or they are moving into a commodity market. There is
absolutely no way service organizations can make up in volume the amount they lose per deal because
margins are too thin and there is no way to recoup hours worked at cheap rates.
As shown in Table 70, the majority of firms (76.3%) offer discounts of less than 10%. Although limiting
discounting does negatively impact growth, it enhances bid-win ratios, billable utilization, on-time
project delivery and client referenceability.

2016 Professional Services Maturity™ Benchmark
© 2016 Service Performance Insight www.FinancialForce.com 106
Table 70: Impact – The effect of discounting
Level of Discounting
Survey %
New Client
Revenue
Revenue Growth
Bid to Win
Sales Pipeline
Billable Utilization
On-time projects
Project Margin
None 20.0% 22.1% 8.7% 5.11 165% 72.6% 80.5% 33.9%
Under 5% 23.1% 25.2% 8.6% 4.94 166% 71.2% 76.6% 33.6%
5% - 10% 33.2% 28.1% 10.9% 4.89 167% 69.3% 75.4% 33.1%
10% - 20% 16.5% 35.7% 13.9% 5.06 190% 71.9% 74.8% 36.8%
20% - 30% 5.0% 30.5% 8.1% 4.85 192% 66.9% 70.8% 30.5%
Over 30% 2.1% 42.3% 14.8% 3.68 209% 60.0% 55.0% 33.8%
Total / Avg. 100.0% 27.9% 10.3% 4.95 172% 70.5% 75.9% 33.9%
Source: Service Performance Insight, February 2016
Profit is the fuel that drives expansion. While not every project achieves its desired profitability goal,
one or two money-losing projects can quickly undermine all net profit. Critical analysis should be
undertaken to review the project and client portfolio to determine the types of clients and projects that
make the most money. Quite often this analysis reveals 80% of profit is coming from only 20% of clients
and conversely, the firm may make no money at all on smaller transactions or certain customers.
Professional services organizations must use both their application infrastructure, as well as pricing tools
to improve financial performance. This combination can help PS executives better understand the range
of pricing available to them, combined with the probability of winning bids.
When creating a large bid all costs including sales costs should be measured. Very few projects are
delivered precisely on time and on budget, so change control is an important element of pricing. If a
client demands pricing concessions, scope must be contained, but the client must also understand and
accept the risks. Best practices in pricing include creating a dedicated proposal center to ensure all
proposals are of the highest quality. Bid, estimate, pricing and contract reviews are all good investments
which pay dividends by improving project margins and reducing the risk of overruns and losses.
Referenceable Clients
The percentage of reference clients is considered one of the most important KPIs in the professional
services sector. Average “client referenceability” has steadily declined from 74.5% in 2013 to 73.8% in
2014 to a new low of 70.4% in 2015. Table 71 shows only 33.2% of the benchmark respondent’s claim
over 80% of their clients are referenceable. On the other hand, 45.2%, up from 27.7% last year, report
less than 70% of their clients are referenceable. This is another very concerning metric trend.
Embedded organizations reported only 65.4% of their clients are referenceable, down from 67% last
year. Independents fared a little better with 72.8% referenceable clients this year compared to 76.8%
last year. Clearly these numbers must improve to sustain PS industry growth.
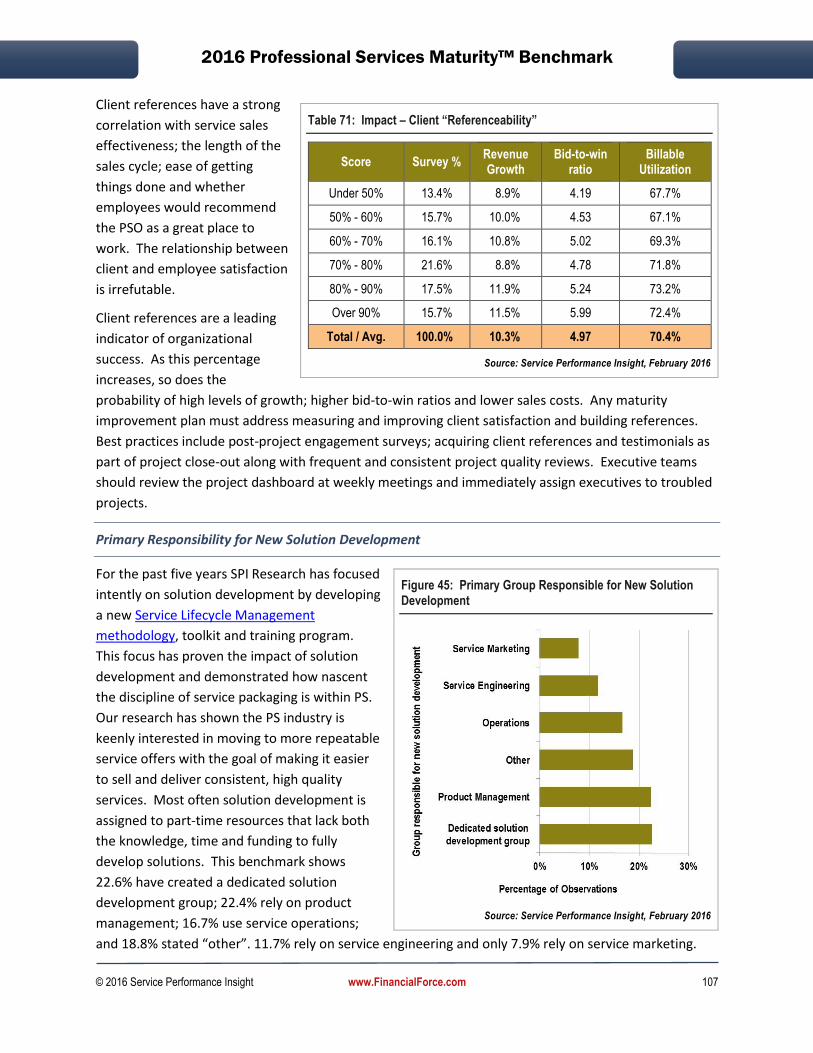
2016 Professional Services Maturity™ Benchmark
© 2016 Service Performance Insight www.FinancialForce.com 107
Client references have a strong
correlation with service sales
effectiveness; the length of the
sales cycle; ease of getting
things done and whether
employees would recommend
the PSO as a great place to
work. The relationship between
client and employee satisfaction
is irrefutable.
Client references are a leading
indicator of organizational
success. As this percentage
increases, so does the
probability of high levels of growth; higher bid-to-win ratios and lower sales costs. Any maturity
improvement plan must address measuring and improving client satisfaction and building references.
Best practices include post-project engagement surveys; acquiring client references and testimonials as
part of project close-out along with frequent and consistent project quality reviews. Executive teams
should review the project dashboard at weekly meetings and immediately assign executives to troubled
projects.
Primary Responsibility for New Solution Development
For the past five years SPI Research has focused
intently on solution development by developing
a new Service Lifecycle Management
methodology, toolkit and training program.
This focus has proven the impact of solution
development and demonstrated how nascent
the discipline of service packaging is within PS.
Our research has shown the PS industry is
keenly interested in moving to more repeatable
service offers with the goal of making it easier
to sell and deliver consistent, high quality
services. Most often solution development is
assigned to part-time resources that lack both
the knowledge, time and funding to fully
develop solutions. This benchmark shows
22.6% have created a dedicated solution
development group; 22.4% rely on product
management; 16.7% use service operations;
and 18.8% stated “other”. 11.7% rely on service engineering and only 7.9% rely on service marketing.
Table 71: Impact – Client “Referenceability”
Score Survey % Revenue Growth
Bid-to-win ratio
Billable Utilization
Under 50% 13.4% 8.9% 4.19 67.7%
50% - 60% 15.7% 10.0% 4.53 67.1%
60% - 70% 16.1% 10.8% 5.02 69.3%
70% - 80% 21.6% 8.8% 4.78 71.8%
80% - 90% 17.5% 11.9% 5.24 73.2%
Over 90% 15.7% 11.5% 5.99 72.4%
Total / Avg. 100.0% 10.3% 4.97 70.4%
Source: Service Performance Insight, February 2016
Figure 45: Primary Group Responsible for New Solution Development
Source: Service Performance Insight, February 2016

2016 Professional Services Maturity™ Benchmark
© 2016 Service Performance Insight www.FinancialForce.com 108
These percentages are similar to last year with the exception of product management which has
significantly increased from 12.7% to 22.4% this year.
Pricing and Deal Structure
Every year, SPI Research has seen a shift in pricing and deal structure, as clients have become
increasingly concerned about risk and cost overruns, and have pushed more accountability to the PSO
through fixed fee or shared risk contracts. Until 2014 the percentage of fixed fee work steadily
increased from 35.5% in 2009 to 44% in 2013. In 2014 we saw a resurgence in time and materials
priced contracts – signaling increased demand for services. 2014 was the first time in eight years that
we saw an increase in time and materials pricing from 51.7% in 2013 to 58.8% in 2014. This trend
reversed in 2015 with time and materials contracts representing only 46.7% of all contracts. This KPI is
important to watch. Time and materials based pricing puts emphasis on accurate resource
management, time collection and reporting. Fixed price pricing puts an emphasis on accurate estimates,
project costing and change management. Either way PSA applications are critical to support accurate
time and cost capture and billing.
Table 72 compares billing models for embedded and independent PSOs. ESOs have been steadily
shifting to fixed fee contracts – moving from 34% in 2009 to 46.6% in 2013. The trend reversed in 2014
with ESOs shifting back to time and materials contracts 56.3% of the time. Now in 2015 we see ESOs
slightly favor time and materials contracts (46.7%) but have started to venture into shared risk and
gain-sharing contracts. Independents have always preferred time and materials contracts but they too
have shifted to more fixed price work, from 37% in 2009 to 42.9% in 2013. Independents decreased
their reliance on fixed price contracts to 35.2% in 2014 and now in 2015 price 38.7% of their contracts as
fixed price. By Geography, time and materials is the prevalent pricing structure. In this survey, only the
largest organizations favored fixed fee contracts. This year the number of shared risk or performance-
based contracts increased from 2.8% to 6.4% of total deals.
Table 72: Fee Structure by Organization Type and Geographic Region
Fee Structure 2014
Survey
2015 Survey ESO PSO Americas EMEA APac
Time & Materials 58.8% 46.7% 44.7% 47.6% 47.6% 44.9% 44.6%
Fixed Time / Fixed Fee 36.3% 39.7% 41.9% 38.7% 40.0% 38.8% 40.7%
Shared Risk / Perform.-based 2.1% 6.4% 5.1% 7.0% 5.5% 8.3% 8.8%
None of the Above 2.9% 7.2% 8.2% 6.7% 6.9% 8.1% 5.9%
Total / Average 100.0% 100.0% 100.0% 100.0% 100.0% 100.0% 100.0%
Source: Service Performance Insight, February 2016
By vertical, architects and SaaS PSOs rely on fixed price contracts. IT consultancies favor time and
materials contracts. All verticals have moved to more shared risk/performance and other types of
contracts this year. As the SaaS market has become more mature a greater emphasis is being placed on
customer adoption so SaaS firms focus on “time to value” with fixed price rapid implementation
contracts. Net profit is not necessarily tied to pricing structure as it is possible to make good service
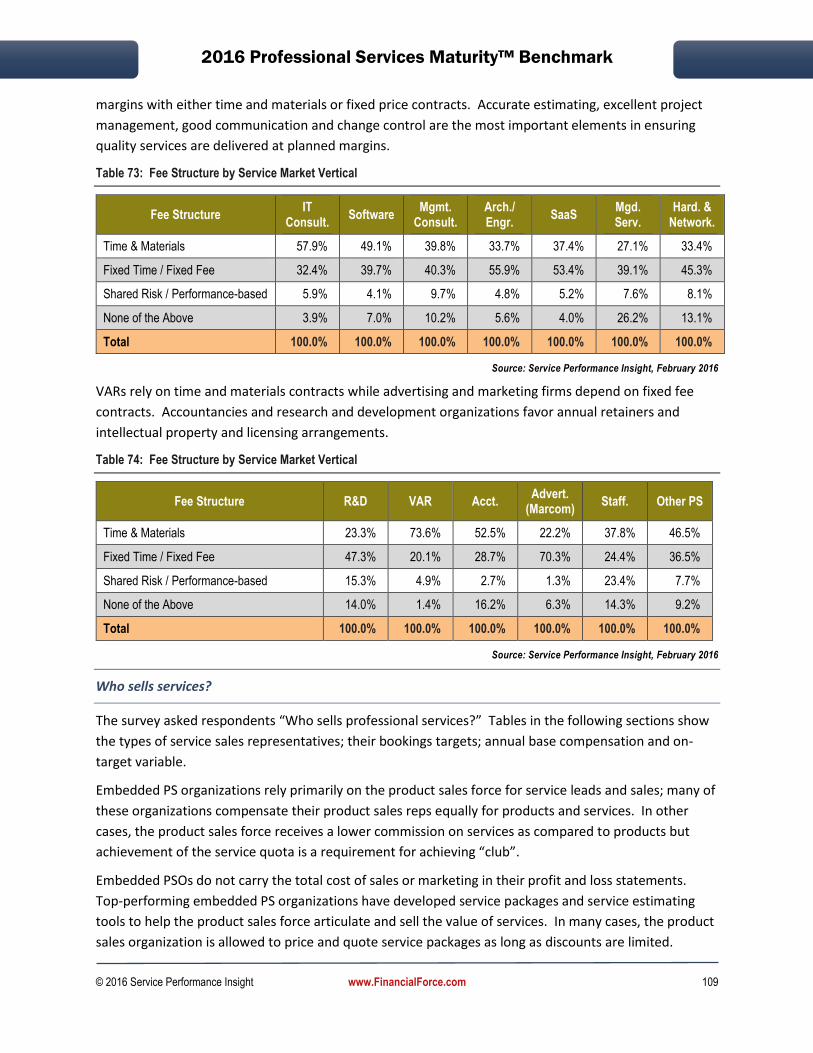
2016 Professional Services Maturity™ Benchmark
© 2016 Service Performance Insight www.FinancialForce.com 109
margins with either time and materials or fixed price contracts. Accurate estimating, excellent project
management, good communication and change control are the most important elements in ensuring
quality services are delivered at planned margins.
Table 73: Fee Structure by Service Market Vertical
Fee Structure IT
Consult. Software
Mgmt. Consult.
Arch./ Engr.
SaaS Mgd. Serv.
Hard. & Network.
Time & Materials 57.9% 49.1% 39.8% 33.7% 37.4% 27.1% 33.4%
Fixed Time / Fixed Fee 32.4% 39.7% 40.3% 55.9% 53.4% 39.1% 45.3%
Shared Risk / Performance-based 5.9% 4.1% 9.7% 4.8% 5.2% 7.6% 8.1%
None of the Above 3.9% 7.0% 10.2% 5.6% 4.0% 26.2% 13.1%
Total 100.0% 100.0% 100.0% 100.0% 100.0% 100.0% 100.0%
Source: Service Performance Insight, February 2016
VARs rely on time and materials contracts while advertising and marketing firms depend on fixed fee
contracts. Accountancies and research and development organizations favor annual retainers and
intellectual property and licensing arrangements.
Table 74: Fee Structure by Service Market Vertical
Fee Structure R&D VAR Acct. Advert.
(Marcom) Staff. Other PS
Time & Materials 23.3% 73.6% 52.5% 22.2% 37.8% 46.5%
Fixed Time / Fixed Fee 47.3% 20.1% 28.7% 70.3% 24.4% 36.5%
Shared Risk / Performance-based 15.3% 4.9% 2.7% 1.3% 23.4% 7.7%
None of the Above 14.0% 1.4% 16.2% 6.3% 14.3% 9.2%
Total 100.0% 100.0% 100.0% 100.0% 100.0% 100.0%
Source: Service Performance Insight, February 2016
Who sells services?
The survey asked respondents “Who sells professional services?” Tables in the following sections show
the types of service sales representatives; their bookings targets; annual base compensation and on-
target variable.
Embedded PS organizations rely primarily on the product sales force for service leads and sales; many of
these organizations compensate their product sales reps equally for products and services. In other
cases, the product sales force receives a lower commission on services as compared to products but
achievement of the service quota is a requirement for achieving “club”.
Embedded PSOs do not carry the total cost of sales or marketing in their profit and loss statements.
Top-performing embedded PS organizations have developed service packages and service estimating
tools to help the product sales force articulate and sell the value of services. In many cases, the product
sales organization is allowed to price and quote service packages as long as discounts are limited.

2016 Professional Services Maturity™ Benchmark
© 2016 Service Performance Insight www.FinancialForce.com 110
Product sales reps are backed up with PS engagement managers or solution architects based on a team
selling approach. This “hunter-skinner” model is reasonably effective with “hunters” focused on new
business development while skinners bring in business domain and consulting knowledge to develop
requirements and proposals and upsell existing accounts.
Independents have two primary sales models: senior partner-led or dedicated solution sales. There are
pluses and minuses with both approaches. In the traditional consulting pyramid, new college hires (at
the bottom of the pyramid) work their way up to partner status over a period of years or even decades.
The traditional consulting pyramid relies on junior consultants, fresh out of college or graduate school,
to perform the majority of analysis and technical work. As they grow in domain knowledge, consulting
and leadership acumen they move up the pyramid to become case team leaders, project leaders,
program leaders and ultimately, if they are good enough, they are offered partnership status to share in
the firm’s direction and profits. The benefit of the traditional consulting pyramid is that it provides a
constant source of fresh new talent and ideas from leading universities while offering significant
rewards to those who stay with the firm and make it to the top. The downside is that it is an expensive
model, and the cost to recruit the top students from the top universities has become prohibitive.
Further, today’s top college graduates are no longer apt to stay with the same firm for decades to repay
their years of apprenticeship.
The new model for independents is to hire dedicated solution sellers – often from technology firms.
This model is far less expensive – the cost to recruit and ramp a new hire is a fraction of the
apprenticeship model but the downside is that very few product sales people are able to become
effective solution sellers. There simply is no substitute for domain knowledge and experience gained
from years of delivering consulting. In this model SPI Research sees a revolving door of sales people
who don’t make the grade because they are unable to develop new opportunities without substantial
support from the consulting organization.
The most effective model is a hybrid combination of the two whereby senior solution consultants are
groomed to become solution sellers. This new approach ensures domain expertise and intimate
consulting delivery knowledge without the overhead of partnership profit and loss management. The
challenge is to convince senior consultants and solution architects to move into full-time business
development roles. Selling aptitude, training and compensation are required.
Table 75 is interesting to SPI Research because it shows the average number of services sales people by
organization type and geography. It also shows their target quotas, base and variable compensation.
Dedicated service sales professionals carry higher service quotas but also have a higher base than
product sales people who also sell services. Firm or practice managers carry the highest service quotas
but also receive the highest base and variable. For both product sales and service sales quotas and
compensation are higher in APac and the Americas and lower in EMEA. Service managers and partners
make considerably more in the Americas than in EMEA or APac.
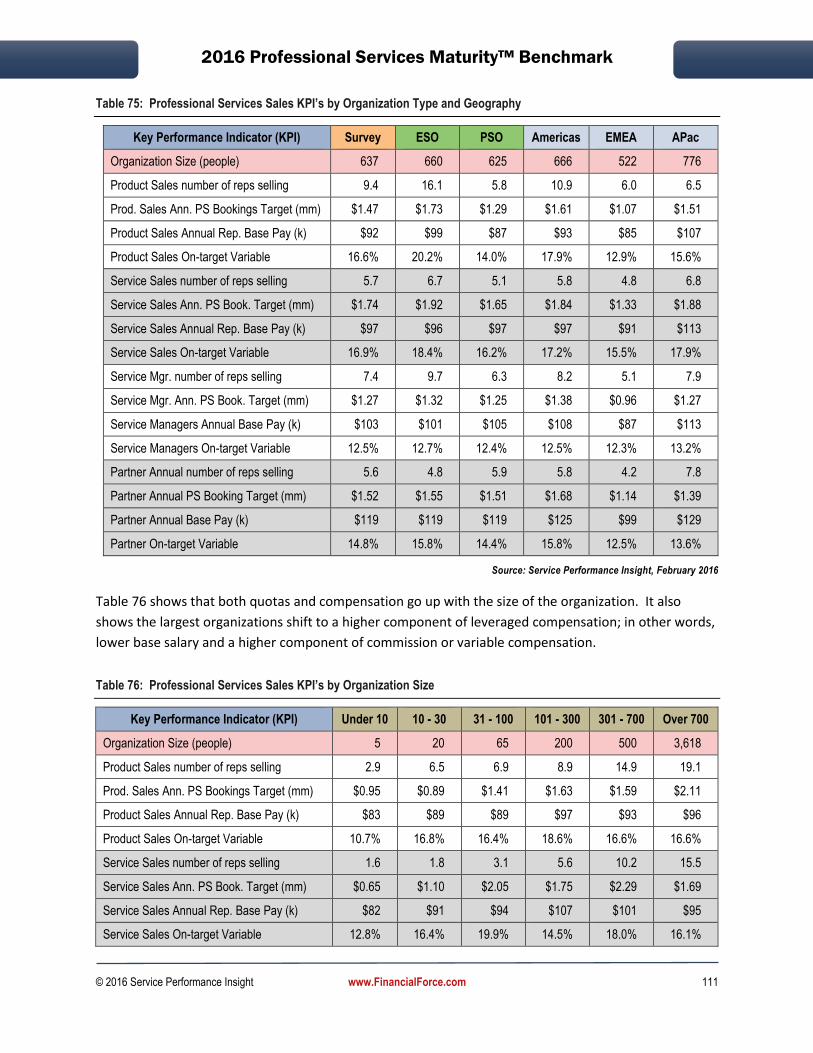
2016 Professional Services Maturity™ Benchmark
© 2016 Service Performance Insight www.FinancialForce.com 111
Table 75: Professional Services Sales KPI’s by Organization Type and Geography
Key Performance Indicator (KPI) Survey ESO PSO Americas EMEA APac
Organization Size (people) 637 660 625 666 522 776
Product Sales number of reps selling 9.4 16.1 5.8 10.9 6.0 6.5
Prod. Sales Ann. PS Bookings Target (mm) $1.47 $1.73 $1.29 $1.61 $1.07 $1.51
Product Sales Annual Rep. Base Pay (k) $92 $99 $87 $93 $85 $107
Product Sales On-target Variable 16.6% 20.2% 14.0% 17.9% 12.9% 15.6%
Service Sales number of reps selling 5.7 6.7 5.1 5.8 4.8 6.8
Service Sales Ann. PS Book. Target (mm) $1.74 $1.92 $1.65 $1.84 $1.33 $1.88
Service Sales Annual Rep. Base Pay (k) $97 $96 $97 $97 $91 $113
Service Sales On-target Variable 16.9% 18.4% 16.2% 17.2% 15.5% 17.9%
Service Mgr. number of reps selling 7.4 9.7 6.3 8.2 5.1 7.9
Service Mgr. Ann. PS Book. Target (mm) $1.27 $1.32 $1.25 $1.38 $0.96 $1.27
Service Managers Annual Base Pay (k) $103 $101 $105 $108 $87 $113
Service Managers On-target Variable 12.5% 12.7% 12.4% 12.5% 12.3% 13.2%
Partner Annual number of reps selling 5.6 4.8 5.9 5.8 4.2 7.8
Partner Annual PS Booking Target (mm) $1.52 $1.55 $1.51 $1.68 $1.14 $1.39
Partner Annual Base Pay (k) $119 $119 $119 $125 $99 $129
Partner On-target Variable 14.8% 15.8% 14.4% 15.8% 12.5% 13.6%
Source: Service Performance Insight, February 2016
Table 76 shows that both quotas and compensation go up with the size of the organization. It also
shows the largest organizations shift to a higher component of leveraged compensation; in other words,
lower base salary and a higher component of commission or variable compensation.
Table 76: Professional Services Sales KPI’s by Organization Size
Key Performance Indicator (KPI) Under 10 10 - 30 31 - 100 101 - 300 301 - 700 Over 700
Organization Size (people) 5 20 65 200 500 3,618
Product Sales number of reps selling 2.9 6.5 6.9 8.9 14.9 19.1
Prod. Sales Ann. PS Bookings Target (mm) $0.95 $0.89 $1.41 $1.63 $1.59 $2.11
Product Sales Annual Rep. Base Pay (k) $83 $89 $89 $97 $93 $96
Product Sales On-target Variable 10.7% 16.8% 16.4% 18.6% 16.6% 16.6%
Service Sales number of reps selling 1.6 1.8 3.1 5.6 10.2 15.5
Service Sales Ann. PS Book. Target (mm) $0.65 $1.10 $2.05 $1.75 $2.29 $1.69
Service Sales Annual Rep. Base Pay (k) $82 $91 $94 $107 $101 $95
Service Sales On-target Variable 12.8% 16.4% 19.9% 14.5% 18.0% 16.1%

2016 Professional Services Maturity™ Benchmark
© 2016 Service Performance Insight www.FinancialForce.com 112
Key Performance Indicator (KPI) Under 10 10 - 30 31 - 100 101 - 300 301 - 700 Over 700
Service Mgr. number of reps selling 2.0 2.4 4.4 8.5 13.8 17.9
Service Mgr. Ann. PS Book. Target (mm) $0.63 $0.75 $1.03 $1.64 $1.80 $1.58
Service Managers Annual Base Pay (k) $94 $94 $106 $106 $109 $104
Service Managers On-target Variable 9.3% 12.6% 11.8% 11.3% 16.3% 14.3%
Partner Annual number of reps selling 2.0 1.8 3.5 5.8 9.1 14.6
Partner Annual PS Booking Target (mm) $0.46 $1.01 $1.59 $1.74 $2.40 $1.61
Partner Annual Base Pay (k) $104 $108 $127 $120 $130 $116
Partner On-target Variable 13.0% 13.5% 15.9% 14.0% 16.8% 14.9%
Source: Service Performance Insight, February 2016
Table 77 compares the base, service bookings quota and variable by PS Market. For the most part there
is consistency in base salaries, quotas and on-target variable between software, SaaS and hardware
PSOs. Executives in management consultancies and marketing and advertising firms have the potential
to make more money than their counterparts within technology product companies but they also incur
greater risk and must be experts in their fields. It appears SaaS companies have shifted a greater burden
for service sales to the product sales force as their overlay PS sales force carries lower PS quotas. SPI
Research sees a proliferation of sales roles in product companies – major account sales; vertical industry
sales; product specialty sales; consulting sales; engagement managers; account managers; territory
managers and the list goes on and on. From an outsider’s point of view the sheer array of solution
sellers is overwhelming and must be confusing for clients. Product companies would be well-served to
curtail the proliferation of sales people and overlay sales people in favor of real solution selling experts.
Embedded hardware reps have greater earning potential based on a considerably higher variable
(leveraged) compensation component.
Table 77: Sales Structure by Service Market Vertical
Key Performance Indicator (KPI) IT
Consult. Software
Mgmt. Consult.
Arch./ Engr.
SaaS Mgd. Serv.
Hard. & Netwrk.
Organization Size (people) 573 590 255 429 582 458 1,469
Prod. Sales number of reps selling 7.2 18.7 2.8 2.5 17.9 7.5 17.5
Prod. Sales Ann. PS Bookings Target (mm)
$1.30 $1.82 $1.20 $1.46 $1.79 $1.48 $1.58
Product Sales Annual Rep. Base Pay (k)
$86 $103 $94 $84 $101 $87 $79
Product Sales On-target Variable 15.4% 20.0% 10.5% 14.3% 24.0% 11.0% 19.4%
Service Sales number of reps selling
5.5 5.0 4.8 4.4 10.2 4.7 13.5
Service Sales Ann. PS Book. Target (mm)
$1.73 $1.90 $1.35 $1.93 $2.50 $1.57 $2.03
Service Sales Annual Rep. Base Pay (k)
$94 $100 $107 $99 $105 $82 $86
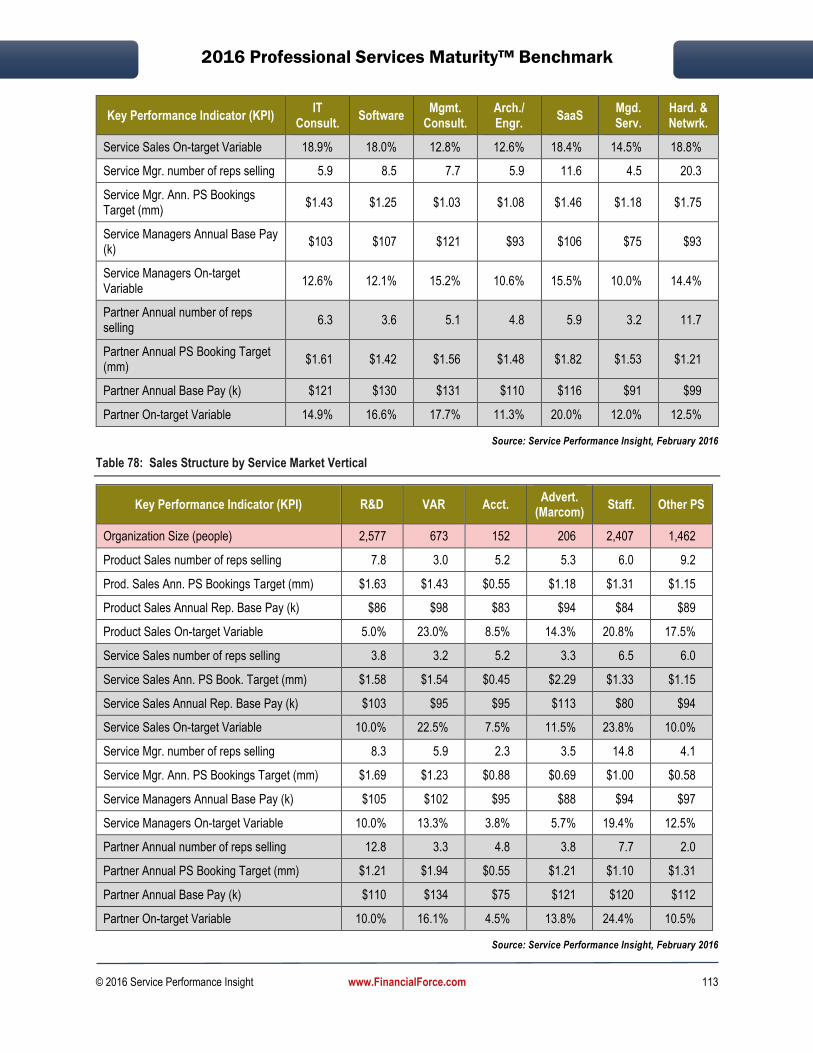
2016 Professional Services Maturity™ Benchmark
© 2016 Service Performance Insight www.FinancialForce.com 113
Key Performance Indicator (KPI) IT
Consult. Software
Mgmt. Consult.
Arch./ Engr.
SaaS Mgd. Serv.
Hard. & Netwrk.
Service Sales On-target Variable 18.9% 18.0% 12.8% 12.6% 18.4% 14.5% 18.8%
Service Mgr. number of reps selling 5.9 8.5 7.7 5.9 11.6 4.5 20.3
Service Mgr. Ann. PS Bookings Target (mm)
$1.43 $1.25 $1.03 $1.08 $1.46 $1.18 $1.75
Service Managers Annual Base Pay (k)
$103 $107 $121 $93 $106 $75 $93
Service Managers On-target Variable
12.6% 12.1% 15.2% 10.6% 15.5% 10.0% 14.4%
Partner Annual number of reps selling
6.3 3.6 5.1 4.8 5.9 3.2 11.7
Partner Annual PS Booking Target (mm)
$1.61 $1.42 $1.56 $1.48 $1.82 $1.53 $1.21
Partner Annual Base Pay (k) $121 $130 $131 $110 $116 $91 $99
Partner On-target Variable 14.9% 16.6% 17.7% 11.3% 20.0% 12.0% 12.5%
Source: Service Performance Insight, February 2016
Table 78: Sales Structure by Service Market Vertical
Key Performance Indicator (KPI) R&D VAR Acct. Advert.
(Marcom) Staff. Other PS
Organization Size (people) 2,577 673 152 206 2,407 1,462
Product Sales number of reps selling 7.8 3.0 5.2 5.3 6.0 9.2
Prod. Sales Ann. PS Bookings Target (mm) $1.63 $1.43 $0.55 $1.18 $1.31 $1.15
Product Sales Annual Rep. Base Pay (k) $86 $98 $83 $94 $84 $89
Product Sales On-target Variable 5.0% 23.0% 8.5% 14.3% 20.8% 17.5%
Service Sales number of reps selling 3.8 3.2 5.2 3.3 6.5 6.0
Service Sales Ann. PS Book. Target (mm) $1.58 $1.54 $0.45 $2.29 $1.33 $1.15
Service Sales Annual Rep. Base Pay (k) $103 $95 $95 $113 $80 $94
Service Sales On-target Variable 10.0% 22.5% 7.5% 11.5% 23.8% 10.0%
Service Mgr. number of reps selling 8.3 5.9 2.3 3.5 14.8 4.1
Service Mgr. Ann. PS Bookings Target (mm) $1.69 $1.23 $0.88 $0.69 $1.00 $0.58
Service Managers Annual Base Pay (k) $105 $102 $95 $88 $94 $97
Service Managers On-target Variable 10.0% 13.3% 3.8% 5.7% 19.4% 12.5%
Partner Annual number of reps selling 12.8 3.3 4.8 3.8 7.7 2.0
Partner Annual PS Booking Target (mm) $1.21 $1.94 $0.55 $1.21 $1.10 $1.31
Partner Annual Base Pay (k) $110 $134 $75 $121 $120 $112
Partner On-target Variable 10.0% 16.1% 4.5% 13.8% 24.4% 10.5%
Source: Service Performance Insight, February 2016
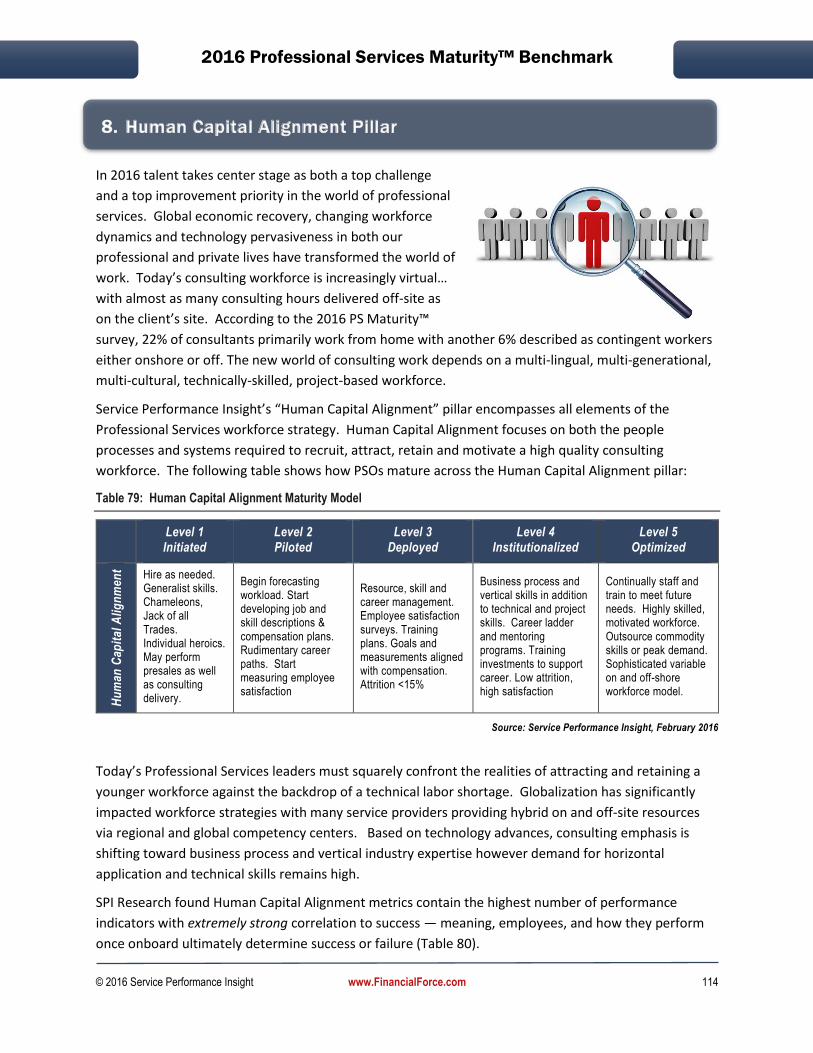
2016 Professional Services Maturity™ Benchmark
© 2016 Service Performance Insight www.FinancialForce.com 114
8. Human Capital Alignment Pillar
In 2016 talent takes center stage as both a top challenge
and a top improvement priority in the world of professional
services. Global economic recovery, changing workforce
dynamics and technology pervasiveness in both our
professional and private lives have transformed the world of
work. Today’s consulting workforce is increasingly virtual…
with almost as many consulting hours delivered off-site as
on the client’s site. According to the 2016 PS Maturity™
survey, 22% of consultants primarily work from home with another 6% described as contingent workers
either onshore or off. The new world of consulting work depends on a multi-lingual, multi-generational,
multi-cultural, technically-skilled, project-based workforce.
Service Performance Insight’s “Human Capital Alignment” pillar encompasses all elements of the
Professional Services workforce strategy. Human Capital Alignment focuses on both the people
processes and systems required to recruit, attract, retain and motivate a high quality consulting
workforce. The following table shows how PSOs mature across the Human Capital Alignment pillar:
Table 79: Human Capital Alignment Maturity Model
Level 1 Initiated
Level 2 Piloted
Level 3 Deployed
Level 4 Institutionalized
Level 5 Optimized
Hu
man
Cap
ita
l A
lig
nm
ent Hire as needed.
Generalist skills. Chameleons, Jack of all Trades. Individual heroics. May perform presales as well as consulting delivery.
Begin forecasting workload. Start developing job and skill descriptions & compensation plans. Rudimentary career paths. Start measuring employee satisfaction
Resource, skill and career management. Employee satisfaction surveys. Training plans. Goals and measurements aligned with compensation. Attrition <15%
Business process and vertical skills in addition to technical and project skills. Career ladder and mentoring programs. Training investments to support career. Low attrition, high satisfaction
Continually staff and train to meet future needs. Highly skilled, motivated workforce. Outsource commodity skills or peak demand. Sophisticated variable on and off-shore workforce model.
Source: Service Performance Insight, February 2016
Today’s Professional Services leaders must squarely confront the realities of attracting and retaining a
younger workforce against the backdrop of a technical labor shortage. Globalization has significantly
impacted workforce strategies with many service providers providing hybrid on and off-site resources
via regional and global competency centers. Based on technology advances, consulting emphasis is
shifting toward business process and vertical industry expertise however demand for horizontal
application and technical skills remains high.
SPI Research found Human Capital Alignment metrics contain the highest number of performance
indicators with extremely strong correlation to success — meaning, employees, and how they perform
once onboard ultimately determine success or failure (Table 80).
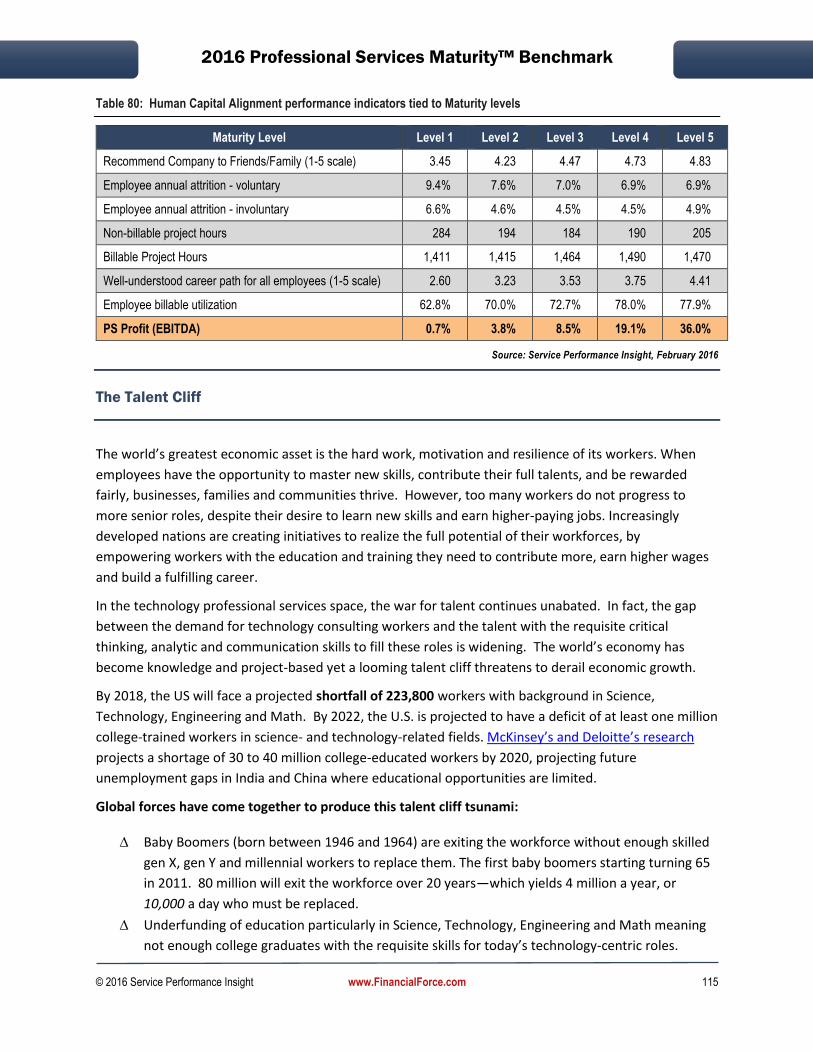
2016 Professional Services Maturity™ Benchmark
© 2016 Service Performance Insight www.FinancialForce.com 115
Table 80: Human Capital Alignment performance indicators tied to Maturity levels
Maturity Level Level 1 Level 2 Level 3 Level 4 Level 5
Recommend Company to Friends/Family (1-5 scale) 3.45 4.23 4.47 4.73 4.83
Employee annual attrition - voluntary 9.4% 7.6% 7.0% 6.9% 6.9%
Employee annual attrition - involuntary 6.6% 4.6% 4.5% 4.5% 4.9%
Non-billable project hours 284 194 184 190 205
Billable Project Hours 1,411 1,415 1,464 1,490 1,470
Well-understood career path for all employees (1-5 scale) 2.60 3.23 3.53 3.75 4.41
Employee billable utilization 62.8% 70.0% 72.7% 78.0% 77.9%
PS Profit (EBITDA) 0.7% 3.8% 8.5% 19.1% 36.0%
Source: Service Performance Insight, February 2016
The Talent Cliff
The world’s greatest economic asset is the hard work, motivation and resilience of its workers. When
employees have the opportunity to master new skills, contribute their full talents, and be rewarded
fairly, businesses, families and communities thrive. However, too many workers do not progress to
more senior roles, despite their desire to learn new skills and earn higher-paying jobs. Increasingly
developed nations are creating initiatives to realize the full potential of their workforces, by
empowering workers with the education and training they need to contribute more, earn higher wages
and build a fulfilling career.
In the technology professional services space, the war for talent continues unabated. In fact, the gap
between the demand for technology consulting workers and the talent with the requisite critical
thinking, analytic and communication skills to fill these roles is widening. The world’s economy has
become knowledge and project-based yet a looming talent cliff threatens to derail economic growth.
By 2018, the US will face a projected shortfall of 223,800 workers with background in Science,
Technology, Engineering and Math. By 2022, the U.S. is projected to have a deficit of at least one million
college-trained workers in science- and technology-related fields. McKinsey’s and Deloitte’s research
projects a shortage of 30 to 40 million college-educated workers by 2020, projecting future
unemployment gaps in India and China where educational opportunities are limited.
Global forces have come together to produce this talent cliff tsunami:
Baby Boomers (born between 1946 and 1964) are exiting the workforce without enough skilled
gen X, gen Y and millennial workers to replace them. The first baby boomers starting turning 65
in 2011. 80 million will exit the workforce over 20 years—which yields 4 million a year, or
10,000 a day who must be replaced.
Underfunding of education particularly in Science, Technology, Engineering and Math meaning
not enough college graduates with the requisite skills for today’s technology-centric roles.

2016 Professional Services Maturity™ Benchmark
© 2016 Service Performance Insight www.FinancialForce.com 116
Education systems are struggling to keep up with the need to arm the workers of tomorrow with
active, hands-on technology-based learning. At the same time, efforts must be made to
overcome the traditional gender bias which persists for learners, employees and employers in
technology fields.
A growing gender gap in which less than 25% of IT jobs in developed countries are held by
women. According to HR Magazine, lack of gender diversity in IT costs the UK over $4 billion
annually. Further, in a 2014 TechWeek study of the UK, only one in 20 IT job applicants is a
woman. This growing gender gap starts at an early age with parental and education bias which
mushrooms throughout education and employment systems to solidify IT gender bias.
Combined with unenlightened immigration policies which have capped the number of visas for
skilled knowledge workers. This year in the United States, 233,000 foreigners applied for the H-
1B, the most common visa for high-skilled foreign workers. That's up significantly from 2014
(172,500 applications) and nearly double the applicants from two years ago (124,000) but only
85,000 H1B visas were granted, primarily for workers with Masters’ degrees.
All of this at exactly the same time that growth in professional service revenue is surging and “buy local”
has become a new mantra! Highly skilled workers are in great demand, making it critical for
organizations to become a “talent magnet” to create a steady pipeline of top people.
Talent Priorities
Changing workforce dynamics are driving PS executives to create a different type of workforce that
requires technical and client management competency with equal parts of flexibility, autonomy and
accountability. One of the most important challenges for today’s Professional Services leaders is
competing for top talent in a level, global, web-enabled playing field of “digital natives” who value
collaboration and “cool” new technologies more than security and remuneration. Today’s Human
Capital Alignment challenges include:
∆ Attracting, retaining and motivating top talent;
∆ Managing through a technical labor shortage;
∆ Overcoming traditional gender biases to educate, attract and retain more female and minority
workers;
∆ Taking on the increased burden of healthcare costs which continue to rise faster than workforce
productivity improvements;
∆ Worldwide growing income and wealth inequality which reduces the ability of low-skilled
workers to climb the economic and educational ladder to become the professional services
employees of the future;
∆ Managing a global, multi-lingual, multi-cultural, multi-generational workforce; and,
∆ Managing a variable and/or contingent workforce.

2016 Professional Services Maturity™ Benchmark
© 2016 Service Performance Insight www.FinancialForce.com 117
Figure 46: 2016 Workforce Priorities
Source: Service Performance Insight, February 2016
Talent Strategies
To fill the workforce void, more and more PSOs are developing innovative new talent strategies: close
partnerships with local universities; new hire internships; job-sharing programs; flexible work – study –
childcare options; on-boarding programs; on-the-job training and mentoring combined with extensive
“on-shore” assignments for “off-shore” employees. Increasingly the reputation of the firm as a “great
place to work” is just as important and intimately intertwined with “client referrals.” What this all boils
down to is that talent is fast becoming the number one make-it or break-it element in professional
services growth – or even survival.
To meet these demands, top PSOS are:
∆ Focusing on programs to hire and train entry-level talent with skills in science, technology, math
and engineering combined with strong written and oral communication skills.
∆ Investing in internships and college hiring to groom the next generation of consultants.
∆ Cross-training current employees who have strong analytic and communication abilities.
∆ Sponsoring training and work visas for international workers with strong backgrounds and skills.
∆ Offering flexible work arrangements – work from home, job-sharing, remote service delivery
and child care options along with generous time-off and sabbatical arrangements.
∆ Building a culture of excellence – the best and brightest are attracted by leading edge
technologies, clients and projects including a culture that supports collaboration and innovation.
∆ Paying for performance – linking compensation to knowledge and skills growth along with
contributions to the practice – not just revenue generation alone.
∆ Investing in employee engagement – Communication, training, recognition, equitable pay, team
building events and flexible work arrangements are essential to keeping a talented workforce
engaged.

2016 Professional Services Maturity™ Benchmark
© 2016 Service Performance Insight www.FinancialForce.com 118
Finding, attracting and engaging a talented workforce is both the top challenge and the top success
factor for today’s professional services organizations. The age-old tactic of stealing skilled consultants
from competitors and clients is no longer effective with too many firms competing for too few experts.
More than ever before, the hallmark of the Best-of-the-Best PS organizations is their focus on college
hiring and developing their own young consultants from the ground up. This focus favors rapidly
growing firms who are able to build and sustain recruiting relationships with top universities. Top firms
are developing summer internship programs and new hire on-boarding programs. Although these
programs are expensive, they are well worth the effort when they manifest in young, highly skilled and
highly motivated consultants who feel they are part of a vibrant culture which promises them career and
knowledge advancement.
The impact of technology on the new world of work is all-encompassing – social interconnectivity
through LinkedIn, Facebook, Twitter, Glassdoor and a host of other networking sites has transformed
recruiting and retention. So much so that in-demand consultants with hard-to-find skills are besieged by
unsolicited job opportunities. The concepts of brand and employee engagement have never been more
important. This means PS firms must not only be a great place to work but must increasingly
differentiate themselves through their unique cultures, using their reputation as a primary recruiting
and retention tool. At the same time, consultants are building their own brands – publishing their own
opinions, thought leadership and intellectual property making it harder than ever before to safeguard
the firm’s knowledge assets.
The Consulting Pyramid
The traditional consulting pyramid (Figure 47) is a workforce model based on “Finders, Minders and
Grinders.” The Managing Partner (PS VP) is the chief client relationship manager, responsible for
developing a trusted advisor relationship with key clients. The Managing Partner is responsible for
developing new business and managing the profitability of the practice. The “Minders” are the regional
managers, project managers, engagement managers and case team leaders responsible for translating
the customer’s requirements into a project plan and then managing all aspects of project delivery. In
the traditional consulting pyramid, the “Grinders” are the technology and business consultants who
perform the majority of the work. In the traditional model, the “Grinders” (young consultants fresh out-
of-college or graduate school), deliver the majority of project billable hours and profit.
Many independent PS firms have developed a solution selling sales force, often with lackluster results.
The fundamental reason why the classic consulting pyramid has lasted for hundreds of years is that PS
clients do not want to be “sold” – they seek consulting firms based on their demonstrated ability in
solving specific business problems. Prospective consulting clients require the senior practice leader to
help them articulate and design a solution. On the other hand, embedded PSOs rely heavily on the
product sales force to bring them into deals so the role of embedded PS leaders is one of forging
alliances with other cross-functional executives as well as building the overall PS governance structure.
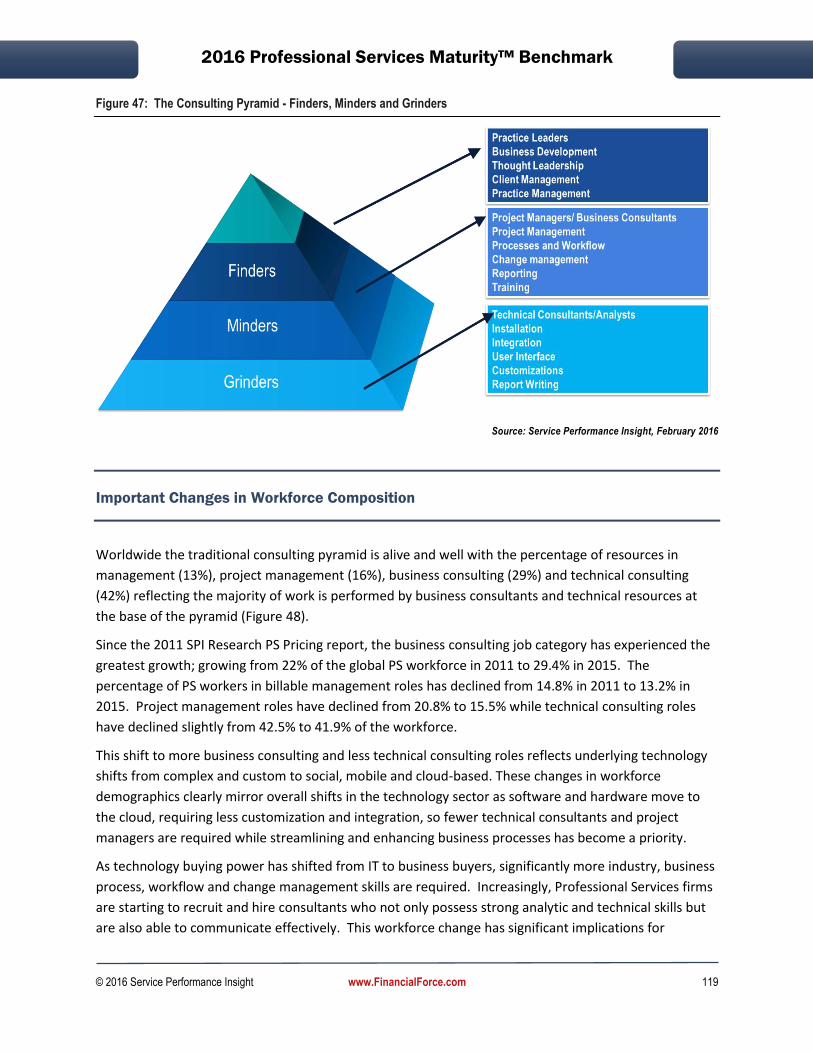
2016 Professional Services Maturity™ Benchmark
© 2016 Service Performance Insight www.FinancialForce.com 119
Figure 47: The Consulting Pyramid - Finders, Minders and Grinders
Source: Service Performance Insight, February 2016
Important Changes in Workforce Composition
Worldwide the traditional consulting pyramid is alive and well with the percentage of resources in
management (13%), project management (16%), business consulting (29%) and technical consulting
(42%) reflecting the majority of work is performed by business consultants and technical resources at
the base of the pyramid (Figure 48).
Since the 2011 SPI Research PS Pricing report, the business consulting job category has experienced the
greatest growth; growing from 22% of the global PS workforce in 2011 to 29.4% in 2015. The
percentage of PS workers in billable management roles has declined from 14.8% in 2011 to 13.2% in
2015. Project management roles have declined from 20.8% to 15.5% while technical consulting roles
have declined slightly from 42.5% to 41.9% of the workforce.
This shift to more business consulting and less technical consulting roles reflects underlying technology
shifts from complex and custom to social, mobile and cloud-based. These changes in workforce
demographics clearly mirror overall shifts in the technology sector as software and hardware move to
the cloud, requiring less customization and integration, so fewer technical consultants and project
managers are required while streamlining and enhancing business processes has become a priority.
As technology buying power has shifted from IT to business buyers, significantly more industry, business
process, workflow and change management skills are required. Increasingly, Professional Services firms
are starting to recruit and hire consultants who not only possess strong analytic and technical skills but
are also able to communicate effectively. This workforce change has significant implications for

2016 Professional Services Maturity™ Benchmark
© 2016 Service Performance Insight www.FinancialForce.com 120
business and academic leaders as education and management systems must change to support an
increasingly virtual, mobile and technology savvy workforce.
Figure 48: Comparison 2011 to 2015 Workforce Distribution by Employee Role
Source: Service Performance Insight, 2015 SPI PS Global Pricing Report
Best Talent Practices
Based on our research and discussions with top-performing PS organizations, four areas must be
addressed to develop best consulting talent practices.
1. Confidence in leadership - Like everything else, it starts with effective leadership. Leaders who
are clear about the future direction of the firm, who understand and are able to take advantage
of changing market dynamics and are able to openly and honestly communicate the direction of
the company and the role employees play in shaping it are crucial to success. PS is a logical,
knowledge-driven business so leaders must focus on clarity and a few but impactful
improvement priorities. Each of the best firms emphasize open and transparent communication
based on a foundation of ethical leadership, open books and systems.
2. Great place to work – top performing firms find innovative ways to help over-worked
consultants maintain life/work balance. From a facility point of view, firms focus on two
priorities – creating open, team-centric workspaces where project teams can meet and
collaborate as well as virtual work-from-anywhere environments with state-of-the-art
collaboration and remote access tools. Despite the fact that most work is delivered virtually or
at the client’s site, top firms ensure there are opportunities throughout the year for consultants
to meet to enhance their knowledge and skills while celebrating achievements. An ethical, open
and recognition rich environment provides the cornerstone of great work places.
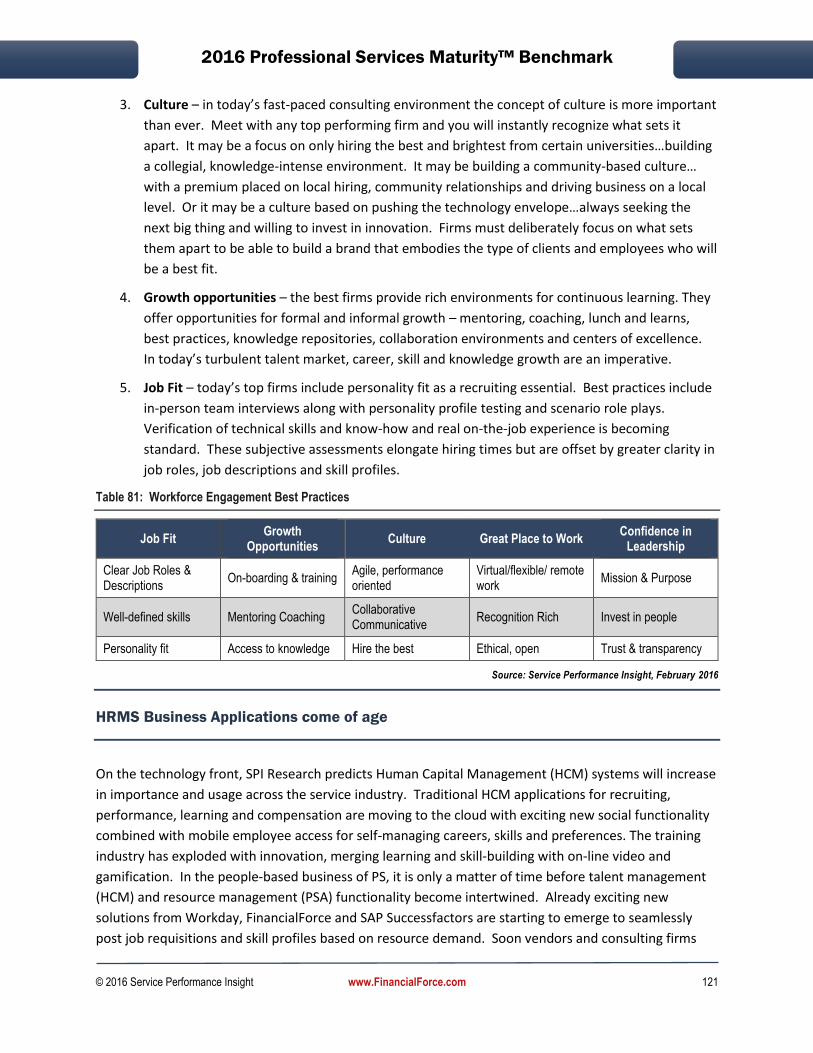
2016 Professional Services Maturity™ Benchmark
© 2016 Service Performance Insight www.FinancialForce.com 121
3. Culture – in today’s fast-paced consulting environment the concept of culture is more important
than ever. Meet with any top performing firm and you will instantly recognize what sets it
apart. It may be a focus on only hiring the best and brightest from certain universities…building
a collegial, knowledge-intense environment. It may be building a community-based culture…
with a premium placed on local hiring, community relationships and driving business on a local
level. Or it may be a culture based on pushing the technology envelope…always seeking the
next big thing and willing to invest in innovation. Firms must deliberately focus on what sets
them apart to be able to build a brand that embodies the type of clients and employees who will
be a best fit.
4. Growth opportunities – the best firms provide rich environments for continuous learning. They
offer opportunities for formal and informal growth – mentoring, coaching, lunch and learns,
best practices, knowledge repositories, collaboration environments and centers of excellence.
In today’s turbulent talent market, career, skill and knowledge growth are an imperative.
5. Job Fit – today’s top firms include personality fit as a recruiting essential. Best practices include
in-person team interviews along with personality profile testing and scenario role plays.
Verification of technical skills and know-how and real on-the-job experience is becoming
standard. These subjective assessments elongate hiring times but are offset by greater clarity in
job roles, job descriptions and skill profiles.
Table 81: Workforce Engagement Best Practices
Job Fit Growth
Opportunities Culture Great Place to Work
Confidence in Leadership
Clear Job Roles & Descriptions
On-boarding & training Agile, performance oriented
Virtual/flexible/ remote work
Mission & Purpose
Well-defined skills Mentoring Coaching Collaborative Communicative
Recognition Rich Invest in people
Personality fit Access to knowledge Hire the best Ethical, open Trust & transparency
Source: Service Performance Insight, February 2016
HRMS Business Applications come of age
On the technology front, SPI Research predicts Human Capital Management (HCM) systems will increase
in importance and usage across the service industry. Traditional HCM applications for recruiting,
performance, learning and compensation are moving to the cloud with exciting new social functionality
combined with mobile employee access for self-managing careers, skills and preferences. The training
industry has exploded with innovation, merging learning and skill-building with on-line video and
gamification. In the people-based business of PS, it is only a matter of time before talent management
(HCM) and resource management (PSA) functionality become intertwined. Already exciting new
solutions from Workday, FinancialForce and SAP Successfactors are starting to emerge to seamlessly
post job requisitions and skill profiles based on resource demand. Soon vendors and consulting firms

2016 Professional Services Maturity™ Benchmark
© 2016 Service Performance Insight www.FinancialForce.com 122
alike will make employees central to their value proposition by designing systems that mirror and
automate all facets of the employee lifecycle from recruitment to retirement. Supporting global
workforce flexibility comes with a price and makes it impossible to run a PS organization by spreadsheet.
Resource management and HCM applications are mandatory to accommodate global mobility, staffing
and career management. No longer do employees need offices and laptops to stay abreast of business.
Now, a smart phone is all they need. This tool enables them to be better connected with coworkers and
clients alike, and to better understand current project dynamics, so that they can take appropriate
actions readily as conditions change. Alerts help consultants better understand critical issues to be
addressed. At the same time, this ubiquitous and ever-expanding flow of information has obsolesced
traditional hierarchical management and communication structures, requiring a new form of leadership.
Survey Results
SPI Research analyzed 26 Human Capital Alignment key performance measurements that are critical to
attaining superior employee performance. Table 82 portrays two alarming trends in human capital
alignment. The chief issue facing PS employers is that of retention. Skilled employees have more career
choices than ever before resulting in the high levels of voluntary attrition. Fewer employees would
recommend their company as a great place to work. Many overwhelmed consultants are choosing to
leave professional services altogether, preferring the stability and lower stress of corporate positions.
Management span of control continues to increase potentially undermining the role of leadership in
being able to support employee development. At the same time, several positive trends have
emerged. Enhanced recruiting and ramping systems and practices have reduced the time it takes for
find, hire and ramp new employees. A significant factor underlying this improvement is an increase in
the number of guaranteed training days per employee. Another positive trend is that firms are
providing more clarity around job roles and career path options.
Table 82: Human Capital Alignment Pillar 5-year trend
Key Performance Indicator (KPI) 2011 2012 2013 2014 2015
Voluntary attrition 7.4% 7.2% 8.3% 8.9% 7.9%
Recommend company to friends/family (1 to 5 scale) 4.20 4.29 4.28 4.24 4.19
Management to employee ratio 9.76 9.24 10.13 10.05 11.52
Days to recruit and hire for standard positions 60.1 62.8 61.2 61.8 60.5
Days for a new hire to become productive 66.6 64.4 68.7 64.1 57.9
Guaranteed annual training days / employee 8.09 7.67 9.01 8.20 8.92
Well-understood career path for all employees (1 to 5 scale) 3.28 3.10 3.23 3.14 3.29
Employee billable utilization 69.6% 70.3% 70.1% 71.0% 70.6%
Source: Service Performance Insight, February 2016
Table 83 summarizes important talent management questions by organization type and location.
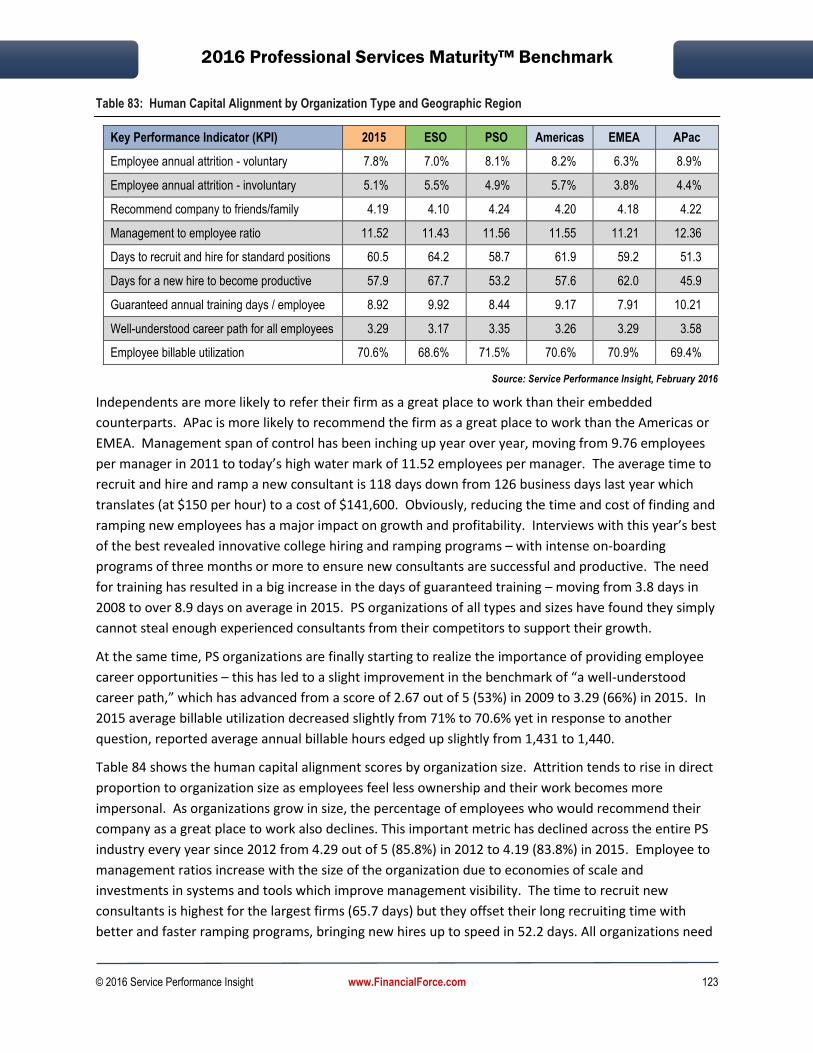
2016 Professional Services Maturity™ Benchmark
© 2016 Service Performance Insight www.FinancialForce.com 123
Table 83: Human Capital Alignment by Organization Type and Geographic Region
Key Performance Indicator (KPI) 2015 ESO PSO Americas EMEA APac
Employee annual attrition - voluntary 7.8% 7.0% 8.1% 8.2% 6.3% 8.9%
Employee annual attrition - involuntary 5.1% 5.5% 4.9% 5.7% 3.8% 4.4%
Recommend company to friends/family 4.19 4.10 4.24 4.20 4.18 4.22
Management to employee ratio 11.52 11.43 11.56 11.55 11.21 12.36
Days to recruit and hire for standard positions 60.5 64.2 58.7 61.9 59.2 51.3
Days for a new hire to become productive 57.9 67.7 53.2 57.6 62.0 45.9
Guaranteed annual training days / employee 8.92 9.92 8.44 9.17 7.91 10.21
Well-understood career path for all employees 3.29 3.17 3.35 3.26 3.29 3.58
Employee billable utilization 70.6% 68.6% 71.5% 70.6% 70.9% 69.4%
Source: Service Performance Insight, February 2016
Independents are more likely to refer their firm as a great place to work than their embedded
counterparts. APac is more likely to recommend the firm as a great place to work than the Americas or
EMEA. Management span of control has been inching up year over year, moving from 9.76 employees
per manager in 2011 to today’s high water mark of 11.52 employees per manager. The average time to
recruit and hire and ramp a new consultant is 118 days down from 126 business days last year which
translates (at $150 per hour) to a cost of $141,600. Obviously, reducing the time and cost of finding and
ramping new employees has a major impact on growth and profitability. Interviews with this year’s best
of the best revealed innovative college hiring and ramping programs – with intense on-boarding
programs of three months or more to ensure new consultants are successful and productive. The need
for training has resulted in a big increase in the days of guaranteed training – moving from 3.8 days in
2008 to over 8.9 days on average in 2015. PS organizations of all types and sizes have found they simply
cannot steal enough experienced consultants from their competitors to support their growth.
At the same time, PS organizations are finally starting to realize the importance of providing employee
career opportunities – this has led to a slight improvement in the benchmark of “a well-understood
career path,” which has advanced from a score of 2.67 out of 5 (53%) in 2009 to 3.29 (66%) in 2015. In
2015 average billable utilization decreased slightly from 71% to 70.6% yet in response to another
question, reported average annual billable hours edged up slightly from 1,431 to 1,440.
Table 84 shows the human capital alignment scores by organization size. Attrition tends to rise in direct
proportion to organization size as employees feel less ownership and their work becomes more
impersonal. As organizations grow in size, the percentage of employees who would recommend their
company as a great place to work also declines. This important metric has declined across the entire PS
industry every year since 2012 from 4.29 out of 5 (85.8%) in 2012 to 4.19 (83.8%) in 2015. Employee to
management ratios increase with the size of the organization due to economies of scale and
investments in systems and tools which improve management visibility. The time to recruit new
consultants is highest for the largest firms (65.7 days) but they offset their long recruiting time with
better and faster ramping programs, bringing new hires up to speed in 52.2 days. All organizations need

2016 Professional Services Maturity™ Benchmark
© 2016 Service Performance Insight www.FinancialForce.com 124
to focus on reducing their recruiting and ramping time and costs. Billable utilization increases with
organization size as the largest organization reported the highest utilization of 72.6%.
Table 84: Human Capital Alignment by Organization Size
Key Performance Indicator (KPI) Under 10 10 - 30 31 – 100 101 - 300 301 - 700 Over 700
Employee annual attrition - voluntary 4.8% 6.8% 7.6% 8.9% 8.4% 9.2%
Employee annual attrition - involuntary 3.4% 4.1% 5.4% 5.2% 6.3% 6.3%
Recommend company to friends/family 4.15 4.32 4.28 4.18 3.98 4.08
Management to employee ratio 9.22 8.43 10.70 12.20 13.10 16.34
Days to recruit and hire for standard positions 56.3 63.8 59.5 58.7 59.1 65.7
Days for a new hire to become productive 62.9 64.6 58.6 57.2 48.9 52.2
Guaranteed annual training days / employee 7.36 7.59 8.76 8.49 9.47 12.43
Well-understood career path for all emp. 3.10 3.30 3.29 3.23 3.32 3.49
Employee billable utilization 68.0% 69.7% 70.7% 70.3% 72.4% 72.6%
Source: Service Performance Insight, February 2016
Tables 85 and 86 show key Human Capital Alignment metrics by market. Embedded Software PS
reported the poorest human capital alignment scores across most dimensions which may contribute to
the longest times to recruit and ramp new consultants. However, Software PSOs offer the most training.
Billable utilization is highest for staffing firms at 76.6%, followed by Managed Service providers at 74.2%.
Architects and engineers provide the fewest guaranteed training days at 5.83. Voluntary and involuntary
attrition is highest for research and development organizations at 19.2% followed by IT consultancies at
14%. Accounting firms reported the lowest overall attrition at 9%.
Table 85: Human Capital Alignment by Vertical Service Market
Key Performance Indicator (KPI) IT
Consult. Software
Mgmt. Consult.
Arch./ Engr.
SaaS Mgd. Serv.
Hard. & Netwrk.
Employee annual attrition - voluntary 8.7% 7.5% 8.3% 5.6% 7.0% 7.4% 5.9%
Employee annual attrition - involuntary 5.3% 6.1% 3.1% 4.7% 4.4% 4.8% 3.9%
Recommend company to friends/family 4.26 4.07 4.27 4.42 4.12 4.00 4.00
Management to employee ratio 12.90 12.14 9.10 10.73 10.38 11.43 12.31
Days to recruit and hire for std. positions 56.1 70.5 63.9 58.4 60.8 58.9 53.6
Days for a new hire to become productive 53.9 73.4 48.2 54.4 73.1 49.6 46.1
Guaranteed annual training days / emp. 8.88 10.39 8.84 5.83 9.34 10.00 8.75
Well-understood career path for all emp. 3.39 3.08 3.45 3.34 3.17 3.20 3.29
Employee billable utilization 71.4% 68.0% 70.9% 73.3% 67.9% 74.2% 69.6%
Source: Service Performance Insight, February 2016

2016 Professional Services Maturity™ Benchmark
© 2016 Service Performance Insight www.FinancialForce.com 125
Table 86: Human Capital Alignment by Vertical Service Market
Key Performance Indicator (KPI) R&D VAR Acct. Advert.
(Marcom) Staff. Other PS
Employee annual attrition - voluntary 10.0% 5.0% 4.5% 9.0% 6.5% 9.5%
Employee annual attrition - involuntary 9.2% 7.0% 4.5% 4.1% 7.6% 4.5%
Recommend company to friends/family 3.57 4.43 3.77 4.36 4.11 4.31
Management to employee ratio 13.21 9.29 10.38 7.73 11.88 11.15
Days to recruit and hire for standard positions 57.9 52.5 58.8 55.9 60.0 72.7
Days for a new hire to become productive 45.0 56.8 72.5 45.0 42.9 68.8
Guaranteed annual training days / employee 9.29 9.82 10.63 7.95 8.13 7.71
Well-understood career path for all emp. 3.31 3.50 3.00 2.91 2.88 3.31
Employee billable utilization 71.4% 67.5% 71.7% 71.8% 75.6% 66.7%
Source: Service Performance Insight, February 2016
Workforce Age and Gender
∆ 1927 - 1945 - Silent Generation or Traditionalists
∆ 1946 - 1964 - Baby Boomers
∆ 1965 - 1983 - Gen X or the Busters
∆ 1984 - 2002 - Gen Y or the Millennials
∆ 2003 - Current Gen Z or the Digital Generation
SPI Research asked questions about the age and gender of the global PS workforce. PS is a young man’s
game with 60.8% of the workforce under 40 while 63.6% of the workforce is male. This year the
percentage of employees under 30 increased from 20.7% to 24.4% while over 50 employees declined
from 18.2% to 15.1%. Embedded PSOs reported slightly younger workforces as they tend to provide
better on-boarding programs than their independent counterparts and require the latest technical skills.
EMEA has the oldest workforce with the most employees over 40 (40.6%). EMEA and APac are the most
male-dominated with 66.7% male PS employees. The percentage of females has increased each year
with the Americas leading the way in bringing women into the PS workforce with 37.9% females.
Table 87: Workforce Age and Gender by Organization Type and Geographic Region
Workforce Age (years) 2015 ESO PSO Americas EMEA APac
Under 30 24.4% 25.3% 24.0% 25.3% 21.6% 25.4%
30 - 40 36.4% 39.1% 35.1% 35.9% 37.8% 35.9%
40 - 50 24.1% 24.4% 24.0% 23.9% 25.6% 21.3%
Over 50 15.1% 11.1% 17.0% 15.0% 15.0% 17.3%
Average Age (Years) 38.4 37.4 38.8 38.2 38.8 38.5
Percentage Male 63.6% 64.9% 63.0% 62.1% 66.7% 67.1%
Source: Service Performance Insight, February 2016
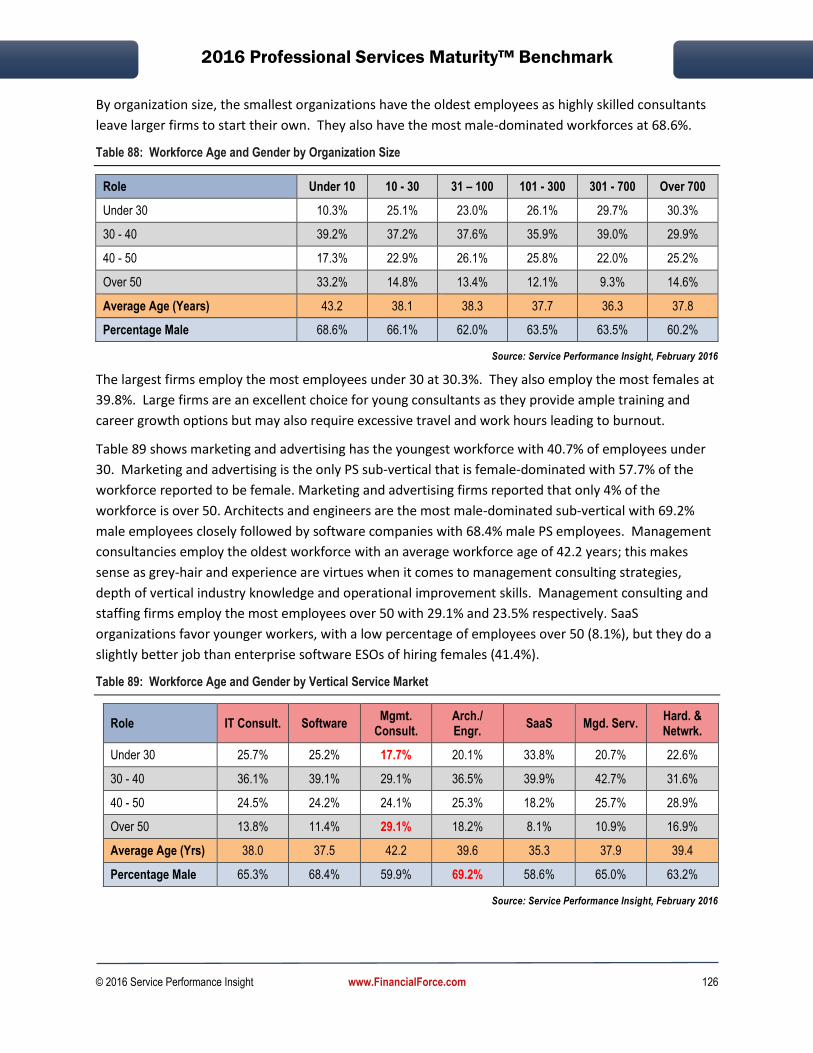
2016 Professional Services Maturity™ Benchmark
© 2016 Service Performance Insight www.FinancialForce.com 126
By organization size, the smallest organizations have the oldest employees as highly skilled consultants
leave larger firms to start their own. They also have the most male-dominated workforces at 68.6%.
Table 88: Workforce Age and Gender by Organization Size
Role Under 10 10 - 30 31 – 100 101 - 300 301 - 700 Over 700
Under 30 10.3% 25.1% 23.0% 26.1% 29.7% 30.3%
30 - 40 39.2% 37.2% 37.6% 35.9% 39.0% 29.9%
40 - 50 17.3% 22.9% 26.1% 25.8% 22.0% 25.2%
Over 50 33.2% 14.8% 13.4% 12.1% 9.3% 14.6%
Average Age (Years) 43.2 38.1 38.3 37.7 36.3 37.8
Percentage Male 68.6% 66.1% 62.0% 63.5% 63.5% 60.2%
Source: Service Performance Insight, February 2016
The largest firms employ the most employees under 30 at 30.3%. They also employ the most females at
39.8%. Large firms are an excellent choice for young consultants as they provide ample training and
career growth options but may also require excessive travel and work hours leading to burnout.
Table 89 shows marketing and advertising has the youngest workforce with 40.7% of employees under
30. Marketing and advertising is the only PS sub-vertical that is female-dominated with 57.7% of the
workforce reported to be female. Marketing and advertising firms reported that only 4% of the
workforce is over 50. Architects and engineers are the most male-dominated sub-vertical with 69.2%
male employees closely followed by software companies with 68.4% male PS employees. Management
consultancies employ the oldest workforce with an average workforce age of 42.2 years; this makes
sense as grey-hair and experience are virtues when it comes to management consulting strategies,
depth of vertical industry knowledge and operational improvement skills. Management consulting and
staffing firms employ the most employees over 50 with 29.1% and 23.5% respectively. SaaS
organizations favor younger workers, with a low percentage of employees over 50 (8.1%), but they do a
slightly better job than enterprise software ESOs of hiring females (41.4%).
Table 89: Workforce Age and Gender by Vertical Service Market
Role IT Consult. Software Mgmt.
Consult. Arch./ Engr.
SaaS Mgd. Serv. Hard. & Netwrk.
Under 30 25.7% 25.2% 17.7% 20.1% 33.8% 20.7% 22.6%
30 - 40 36.1% 39.1% 29.1% 36.5% 39.9% 42.7% 31.6%
40 - 50 24.5% 24.2% 24.1% 25.3% 18.2% 25.7% 28.9%
Over 50 13.8% 11.4% 29.1% 18.2% 8.1% 10.9% 16.9%
Average Age (Yrs) 38.0 37.5 42.2 39.6 35.3 37.9 39.4
Percentage Male 65.3% 68.4% 59.9% 69.2% 58.6% 65.0% 63.2%
Source: Service Performance Insight, February 2016

2016 Professional Services Maturity™ Benchmark
© 2016 Service Performance Insight www.FinancialForce.com 127
Table 90: Workforce Age and Gender by Vertical Service Market
Role R&D VAR Acct. Advert.
(Marcom) Staff. Other PS
Under 30 24.1% 10.4% 27.9% 40.7% 34.4% 21.2%
30 - 40 38.1% 41.5% 45.0% 36.0% 27.9% 35.8%
40 - 50 24.6% 36.4% 19.3% 19.3% 14.3% 25.4%
Over 50 13.1% 11.7% 7.8% 4.0% 23.5% 17.7%
Average Age (Yrs) 38.0 40.2 35.9 33.8 38.3 39.4
Percentage Male 58.3% 61.4% 53.5% 42.3% 58.8% 59.2%
Source: Service Performance Insight, February 2016
Employee Annual Attrition
Employee attrition or turnover is defined as the average number of employees who left the company,
either voluntarily or involuntarily, over the past year divided by the number of starting employees.
Voluntary attrition, employees who leave that are not asked to leave, is one of the most important key
performance indicators in the services sector as employees are the most valuable resource. Involuntary
turnover typically refers to an employer decision to terminate the employee. Reasons for involuntary
turnover include poor performance, excessive absenteeism or violation of a workplace policy that is
considered a terminable offense. Attrition due to layoff, reduction in force or job elimination is typically
involuntary because the employment relationship ends based on the employer's circumstances, not the
employee's decision to leave. Annual attrition in the professional services sector has been steadily
climbing since the recession ended. With the economy continuing to pick up, and more new jobs
available, average attrition has climbed to 12.9% in 2015 from 7.2% in 2012 coming out of the recession.
Table 91 shows the correlation between voluntary attrition and revenue growth and profit. This table
demonstrates the
negative consequences
of high voluntary attrition
rates. As attrition rises,
most other aspects of
performance suffer. The
probability of on-time
project delivery
decreases while average
project overruns
increase. Remaining
employees have to pick
up the pieces from
exiting workers and must
quickly come up to speed
Table 91: Impact – Annual Employee Attrition – Voluntary
Annual Employee Attrition
Survey Percent
% of employees
billable
On-time projects
Annual Rev.
Growth EBITDA
None 12.9% 67.5% 79.4% 8.5% 12.3%
1% - 5% 32.4% 71.8% 77.8% 11.5% 18.3%
5% - 10% 26.2% 68.8% 72.8% 9.9% 14.6%
10% - 15% 17.4% 70.1% 76.0% 10.7% 18.3%
15% - 25% 6.8% 73.4% 75.3% 11.2% 8.0%
Over 25% 4.3% 74.1% 75.2% 6.1% 11.3%
Total/Avg. 100.0% 70.4% 76.1% 10.3% 15.5%
Source: Service Performance Insight, February 2016

2016 Professional Services Maturity™ Benchmark
© 2016 Service Performance Insight www.FinancialForce.com 128
and reestablish client relationships. Clients are forced to back-track to reestablish previous decisions and
vendor commitments.
The costs of high voluntary attrition permeate all aspects of the firm. Lower employee engagement
influences the firm’s ability to recruit top talent based on employee referrals. The very real cost to
replace leaving employees shows up in 118 work days on average to find, recruit, hire and ramp new
consultants. But this lost time is just the tip of the iceberg, as it does not measure lost productivity time
for recruiters and managers nor the impact on the remaining workforce from taking over work after a
valuable employee has left. SPI
Research believes the real cost to
replace a valuable consultant is in
excess of $150,000 causing a big
bottom-line profit impact and
making it hard to increase revenue
and margins when firms must
backfill leaving employees.
Table 92 shows the correlation
between involuntary attrition and
revenue growth. Involuntary
attrition or layoffs have a temporary
positive impact on per consultant
and per employee revenue yield as
well as utilization because available work is performed by fewer employees. However, the long term
effects of involuntary attrition show up in lower top-line growth and long term poor employee
engagement. Interestingly, voluntary attrition
rises directly in response to involuntary attrition
as non-impacted employees fear they will be
next or become disenfranchised with their
prospects for long-term career growth.
Organizational Structure
Figure 49 depicts organization structure with
functional predominant. This means most PSOs
have defined functions for sales and marketing,
project delivery, finance and operations, service
engineering, human resources, etc. The second
most prevalent structure is line of business or
product-oriented meaning groups are organized
by vertical industries or products. Matrix-
oriented structures are favored, particularly by
larger organizations which may have double-line
Table 92: Impact – Annual Employee Attrition – Involuntary
Annual Employee Attrition
Survey Percent
Revenue / Billable
Consult (k)
Voluntary Attrition
Annual Rev.
Growth
None 22.5% $178 5.1% 9.8%
1% - 5% 46.1% 201 6.7% 10.9%
5% - 10% 18.0% 204 9.9% 10.6%
10% - 15% 7.0% 204 10.7% 7.8%
15% - 25% 4.3% 213 14.1% 9.0%
Over 25% 2.1% 230 17.5% 8.6%
Total/Avg. 100.0% $198 7.7% 10.3%
Source: Service Performance Insight, February 2016
Figure 49: Primary Organizational Structure
Source: Service Performance Insight, February 2016

2016 Professional Services Maturity™ Benchmark
© 2016 Service Performance Insight www.FinancialForce.com 129
reporting by geography, vertical, competency or product. Increasingly large organizations are creating
technical and vertical competency centers of experts who are deployed to support geographical or
account-based teams with specialized expertise. Geographic organizations are prevalent for new, young
organizations as they expand city to city, state to state and country to country. Only 10% of
organizations are structured primarily by account although account-specific teams exist within most
large organizations.
Why Employees Leave
Why do employees leave? Obviously, employees
leave for a variety of reasons, but in many cases
there is one primary catalyst which is the reason
for moving on. Figure 50 shows the top reasons
why employees leave professional services
organizations. The number one rationale (38.4%)
is “better opportunity” which translates to a
better work environment, perhaps better
compensation or more opportunity for
advancement. “Other (17.7%)” moved into
second place. “Other” covers a magnitude of
issues – “work/life” balance or leaving the
industry entirely. “Money” was cited as the third
reason (12.7%) followed by “Lack of career
advancement” (12.1%) as the fourth most
prevalent reason employees leave. A younger,
less traditional workforce requires challenging
projects; exposure to hot new technologies and leading edge clients plus training, communication and
teamwork to remain engaged. “Management dissatisfaction” is cited by 7.7%. “Travel (5.8%)” is and will
continue to be a major reason consultants quit, oftentimes for less-interesting, but more stable internal
positions. Fortunately, remote service delivery tools and the ability to deliver more work virtually are
having a beneficial effect on reducing travel time, cost and employee burnout. The Best-of-the-Best
firms place a premium on their employees – finding ways to combine career development; challenging
and exciting projects; with family/life/work balance and a measure of fun.
Recommend Company to Friends and Family
One of the most important employee engagement measurements is whether an employee would
recommend their company “as a great place to work” to their friends and family. More than any other
key performance measurement in the Human Capital Alignment pillar, recommending one’s company as
a great place to work is considered the litmus test of employee engagement.
Figure 50: Why Employees Leave
Source: Service Performance Insight, February 2016
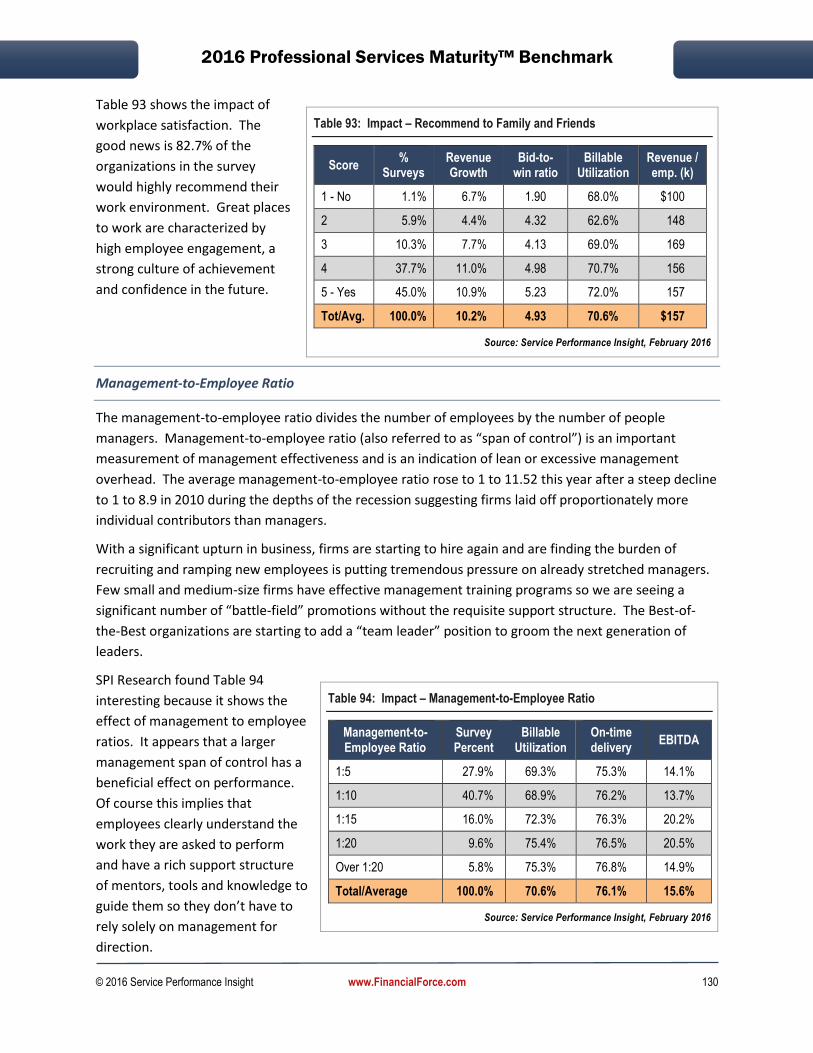
2016 Professional Services Maturity™ Benchmark
© 2016 Service Performance Insight www.FinancialForce.com 130
Table 93 shows the impact of
workplace satisfaction. The
good news is 82.7% of the
organizations in the survey
would highly recommend their
work environment. Great places
to work are characterized by
high employee engagement, a
strong culture of achievement
and confidence in the future.
Management-to-Employee Ratio
The management-to-employee ratio divides the number of employees by the number of people
managers. Management-to-employee ratio (also referred to as “span of control”) is an important
measurement of management effectiveness and is an indication of lean or excessive management
overhead. The average management-to-employee ratio rose to 1 to 11.52 this year after a steep decline
to 1 to 8.9 in 2010 during the depths of the recession suggesting firms laid off proportionately more
individual contributors than managers.
With a significant upturn in business, firms are starting to hire again and are finding the burden of
recruiting and ramping new employees is putting tremendous pressure on already stretched managers.
Few small and medium-size firms have effective management training programs so we are seeing a
significant number of “battle-field” promotions without the requisite support structure. The Best-of-
the-Best organizations are starting to add a “team leader” position to groom the next generation of
leaders.
SPI Research found Table 94
interesting because it shows the
effect of management to employee
ratios. It appears that a larger
management span of control has a
beneficial effect on performance.
Of course this implies that
employees clearly understand the
work they are asked to perform
and have a rich support structure
of mentors, tools and knowledge to
guide them so they don’t have to
rely solely on management for
direction.
Table 93: Impact – Recommend to Family and Friends
Score %
Surveys Revenue Growth
Bid-to-win ratio
Billable Utilization
Revenue / emp. (k)
1 - No 1.1% 6.7% 1.90 68.0% $100
2 5.9% 4.4% 4.32 62.6% 148
3 10.3% 7.7% 4.13 69.0% 169
4 37.7% 11.0% 4.98 70.7% 156
5 - Yes 45.0% 10.9% 5.23 72.0% 157
Tot/Avg. 100.0% 10.2% 4.93 70.6% $157
Source: Service Performance Insight, February 2016
Table 94: Impact – Management-to-Employee Ratio
Management-to-Employee Ratio
Survey Percent
Billable Utilization
On-time delivery
EBITDA
1:5 27.9% 69.3% 75.3% 14.1%
1:10 40.7% 68.9% 76.2% 13.7%
1:15 16.0% 72.3% 76.3% 20.2%
1:20 9.6% 75.4% 76.5% 20.5%
Over 1:20 5.8% 75.3% 76.8% 14.9%
Total/Average 100.0% 70.6% 76.1% 15.6%
Source: Service Performance Insight, February 2016

2016 Professional Services Maturity™ Benchmark
© 2016 Service Performance Insight www.FinancialForce.com 131
The table compares the management-to-employee ratio to other key performance indicators for the 549
PSOs in the survey. 68.9% of the organizations maintain a 1:10 or less management to employee ratio.
As the ratio increases, so do many of the key financial metrics. The key to profitable growth is finding
the right balance of respected managers to employees. Integrated business applications and strong
communication practices along with standardized methods, tools and knowledge sharing all contribute
to higher productivity with less reliance on management overhead.
Time to Recruit and Hire for Standard Positions
SPI Research considers the length of time to recruit and ramp new employees to be very important
determinants of overall performance and sustainable growth. “Ramping” time is critical because it not
only focuses on making employees productive faster, but also reduces the non-billable time and cost of
other resources who support the hiring and on-boarding process.
Most firms do not track the full cost of recruiting and hiring, but it is substantial (in many cases over 50%
of the first year new hire base salary). This year the average cost of recruiting is over 1% of total
revenue. The most mature firms create a dedicated recruiting function, armed with in-depth skill and
personality profiles for targeted positions. Since all indicators point to a continuing talent shortage in PS
– firms would be well-served to examine and improve their recruiting, on-boarding and training
functions. Recruiting must be closely aligned with the sales pipeline and resource management plan.
Table 95 compares the time required to recruit for standard positions (such as consultants) to other key
performance indicators. As it takes longer to recruit and hire, billable utilization suffers, as current
employees spend more time
helping out with the process,
which limits their billable time.
However, profitability improves
with longer recruiting times
because current employees must
take on extra work. Although
expensive and time consuming,
recruiting time does not appear
to be a major determinant of
bottom-line profitability as it is
better to spend extra time
ensuring new hires will fit in.
Time for a New Hire to Become Productive
Table 96 shows 41.5% of the PSOs in the survey reported over 60 days for a new consultant to become
productive. Well-structured on-boarding and mentoring programs are mandatory for organizations
planning on significant growth. This year the average time for a new hire to become productive
declined to 57.9 days down from 64.1 days last year. This 6.2-day improvement in ramping time is
Table 95: Impact – Time to Recruit and Hire for Standard Positions
Time to recruit and hire for standard positions
Survey Percent
Billable Util.
On-time Projects
EBITDA
Under 1 month 12.0% 70.0% 75.1% 14.1%
30 - 60 days 45.8% 71.6% 76.5% 14.8%
60 - 90 days 28.8% 68.8% 76.9% 15.3%
90 - 120 days 7.9% 72.4% 72.7% 20.5%
Over 120 days 5.4% 69.6% 73.5% 23.1%
Total/Average 100.0% 70.6% 76.0% 15.8%
Source: Service Performance Insight, February 2016

2016 Professional Services Maturity™ Benchmark
© 2016 Service Performance Insight www.FinancialForce.com 132
significant. At $150 per hour,
faster on-boarding translates to a
potential gain in revenue per
consultant of $7,440 per year.
Guaranteed Training Days per Employee per Year
The guaranteed number of training days per employee per year is the average number of training days
budgeted each year per employee. Similar to the annual training budget, this indicator, while promised
to employees, is not necessarily utilized, but does reflect the organization's commitment to employee
development and shows the organization is investing in the future of its employees. Across the
benchmark the average cost of training is 1.5% of total revenue.
Best-of-the-Best organizations mandate more than two weeks of training per year. Some firms provide
over four weeks of training per year. Several best of the best firms put new hires through intensive
three-month scenario-based training programs where they work as a team to develop requirements,
architect and implement real-world solutions. PSOs find investments in both technical and
interpersonal skill building pays dividends. In this year’s benchmark, higher numbers of guaranteed
training days positively correlate with revenue growth, on-time project delivery and revenue per
consultant (Table 97). Access to
high quality training is a major
attraction driver. Many firms
report they bring together the
entire consulting team twice a
year for skill-building, reinforcing
the company’s direction and
strengthening collaboration and
team-building. Team meetings
give road warriors a break and
allow them to establish new
friendships and partnerships
while rejuvenating. Several of
the Best-of-the-Best firms include
Table 96: Impact – Time to Become Productive
Time to become productive
Survey Percent
Billable Util.
Rev. / Employee
(k)
Staffing Time
(days)
Under 1 month 27.8% 75.1% $150 9.6
30 - 60 days 30.7% 69.8% 163 10.5
60 - 90 days 23.3% 69.6% 165 10.6
90 - 120 days 10.8% 66.8% 152 9.7
Over 120 days 7.4% 66.6% 158 12.5
Total/Average 100.0% 70.6% $158 10.3
Source: Service Performance Insight, February 2016
Guaranteed Training Days per
Employee per Year
Survey Percent
Revenue Growth
On-time delivery
Rev. / Billable Con. (k)
None 3.7% 6.0% 68.1% $181
Under 5 days 24.6% 7.1% 73.8% 181
5 - 10 days 38.7% 10.2% 75.8% 200
10 - 15 days 18.8% 12.8% 77.5% 207
15 - 20 days 7.0% 11.0% 79.9% 212
Over 20 days 7.4% 12.8% 79.9% 216
Total/Average 100.0% 10.0% 75.9% $198
Table 97: Impact – Guaranteed Training
Source: Service Performance Insight, February 2016

2016 Professional Services Maturity™ Benchmark
© 2016 Service Performance Insight www.FinancialForce.com 133
significant others and spouses in their annual events to thank them for holding down the fort while their
road-warrior partners delight clients.
Well-Understood Career Path for all Employees
The survey asked if the organization provides a well understood employee career path, meaning as
employees are hired and move
within different positions, is
there a planned next step for
their career progression (Table
98). This KPI is important
because it shows the firm’s
commitment to employee skill
growth and career development.
Even though this question is
subjective, and answered by PS
executives, who might have a
bias, the results show how
important career development is.
It shows employees with a well-defined career path are much more engaged with their work, delivering
more on-time projects, more revenue per employee and more likely to achieve margin targets.
The table highlights the important role management plays in helping employees plan their careers while
ensuring they have both the tools and
opportunity for career growth. Numerous
studies have shown that employees become
increasingly productive with longer tenure with
the same firm so keeping them engaged is an
investment worth making.
Consultant Billable Utilization
SPI Research defines employee utilization on a
2,000 hour per year basis. Employee utilization
is calculated by dividing the total annual
billable hours by 2,000. This key performance
indicator is central to organizational
profitability. Utilization is consistently the most
measured key performance indicator but must
be examined in conjunction with overall
revenue and profit per person along with
leading indicators like backlog and size of the
Table 98: Impact – Well-understood Career Path
Well-understood Career Path
Survey Percent
On-time Delivery
Rev. / Emp. (k)
Meet Margin Target
1 – Not very well 5.7% 64.8% $138 86.1%
2 16.7% 69.6% 153 87.4%
3 29.4% 77.3% 166 90.3%
4 39.4% 77.0% 150 88.1%
5 – Very well 8.8% 84.8% 161 99.0%
Total/Average 100.0% 75.9% $156 89.5%
Source: Service Performance Insight, February 2016
Figure 51: Billable Utilization: 2010-2015
Source: Service Performance Insight, February 2016

2016 Professional Services Maturity™ Benchmark
© 2016 Service Performance Insight www.FinancialForce.com 134
sales pipeline to become truly meaningful. Utilization is a major indicator of opportunity and workload
balance. It provides a signal to expand or contract the workforce.
To improve margins, PS executives must continually focus on increasing employee billable utilization, as
well as increasing the percentage of billable employees. The primary gain from increased utilization is a
significant increase in revenue per employee.
Table 99 shows the actual (not theoretical) benefits this year’s firms experienced from increasing
employee utilization. The optimal level of utilization is 70 to 80% with the best revenue growth, highest
consultant and per employee revenue yields along with the best net margin achievement. According to
this year’s survey, extremely high utilization, over 80%, actually diminishes revenue per consultant and
net profit. Billable utilization over 90% clearly leads to voluntary attrition and burnout.
Table 99: Impact – Billable Utilization
Billable Utilization
Survey Percent
Revenue Growth
Client Ref.
Billable Utilization
Revenue / billable
cons. (k)
Revenue / employee
Voluntary Attrition
EBITDA
Under 50% 6.0% 8.6% 61.0% 69.0% $171 $133 6.6% 6.0%
50% - 60% 12.4% 10.5% 65.0% 70.6% 185 147 9.6% 13.2%
60% - 70% 24.3% 10.2% 71.4% 75.8% 197 157 7.8% 16.7%
70% - 80% 35.7% 11.2% 73.7% 76.9% 210 170 7.1% 16.6%
80% - 90% 17.6% 8.6% 70.5% 79.5% 195 156 7.5% 13.6%
Over 90% 4.1% 9.0% 74.0% 83.8% 192 134 11.3% 15.9%
Total/Average 100.0% 10.2% 70.7% 76.1% $198 $158 7.8% 15.0%
Source: Service Performance Insight, February 2016
Although PS firms would like to abandon the billable utilization metric (and all the accompanying time
tracking it entails), unfortunately there is no other metric which provides as good a picture of workforce
productivity. Perhaps as more and more firms shift to fixed price work the focus on billable utilization
will decline but if this is the case firms will have to ratchet up their focus on project accounting and
budget to actual performance. But here again, how can budget to actual performance be measured
without tracking work hours?
Billable Utilization from the 2015 PS Global Pricing Report
Based on the 2015 PS Global Pricing report, Table 100 provides a snapshot comparison by role of the
2015 PS Pricing survey compared to the 2011 survey. The headline reads “lower bill rates” are offset
by “significantly higher billable utilization targets” resulting in “significant increases in consulting
revenue yields and profits”. What this means is that the consulting industry is demanding more from
their workforces to offset rate erosion. These productivity advances are a direct result of more virtual
(off-site) consulting delivery, stronger consulting demand (more work) and productivity tools (less
time spent on non-billable activities). The question which must be asked is “can the consulting

2016 Professional Services Maturity™ Benchmark
© 2016 Service Performance Insight www.FinancialForce.com 135
industry continue to ratchet up consultant productivity and billability, or are we near a breaking
point?”
Table 100: Target Billable Hours and Rates Comparison 2011-2015 All PS Markets and Geographies
Level
2011 2015 Target
Revenue Yield
Delta (k)
Target Annual Billable
Hrs.
Realized Hourly Bill rate
Target Revenue
Yield PP (k)
Target Annual Billable
Hrs.
Realized Hourly Bill rate
Target Revenue
Yield PP (k)
VP / Executive Management 743 $265 $197 706 $235 $166 ($31)
Director 771 217 167 785 213 167 0
Manager 852 178 152 879 176 155 3
Program Manager 1,211 167 202 1,368 174 238 36
Senior Project Manager 1,289 166 214 1,472 177 260 46
Project Manager 1,272 153 195 1,505 164 246 51
Principal Business Consult. 1,113 217 242 1,450 196 284 42
Sr. Business Consultant 1,298 193 251 1,519 169 256 4
Business Consultant 1,330 152 202 1,512 149 225 23
Solution Architect 1,316 185 243 1,391 178 248 5
Senior Technical Consultant 1,374 166 228 1,563 168 263 35
Technical Consultant 1,401 151 212 1,566 146 228 16
Non-weighted average 1,249 $177 $214 1,353 $175 $237 $23
Source: Service Performance Insight, 2015 PS Global Pricing report
Key findings from comparing the 2011 to 2015 PS Pricing report:
Target annual billable hours have increased dramatically for all job categories except Executive
Management. Target annual hours across all roles and geographies have increased from 1,249
in 2011 to 1,353 hours in 2015! The average PS consultant is targeted to bill almost 200 more
hours per year! Most consulting job roles are now targeted at 75% billable utilization or higher.
The only job category which has not experienced a decline in realized bill rates is the Project
Management job category. At the same time, project managers are being asked to bill more
hours. The combined impact of slightly higher rates and significantly higher utilization targets
manifests in the greatest increase in per capita target revenue. A contributing factor to these
increases is that the project management category has experienced the most significant decline
in employee numbers as a percent of the overall consulting workforce. This means the
remaining project managers are being asked to do more and scarcity has led to higher rates.
The Business Consulting job category has experienced the steepest decline in realized bill rates
at the same time this job category has experienced a sharp increase in billable utilization
targets. The increase in billability has more than offset the decrease in rates, making the
business consulting job category the richest revenue producers in the study.

2016 Professional Services Maturity™ Benchmark
© 2016 Service Performance Insight www.FinancialForce.com 136
The Technical Consulting job category has experienced a moderate decline in realized rates and
a moderate increase in annual billable targets. The net result manifests in moderately increased
revenue targets.
In the technical consulting job category, only senior technical consultants have experienced a
slight increase in realized bill rates from $166 to $168 per hour. However, their billable
utilization targets have soared from 1,374 hours in 2011 to 1,563 hours in 2015. The net result
is they are targeted to generated $263K in annual revenue, up from $228K in 2011!
Table 101 shows a comparison of target billable hours by role for the major geographies represented in
the 2015 PS Pricing study. India clearly expects the most from its consultants with annual target hours
of 92% for its program managers; 82.5% for its senior business consultants and 86% for its technical
consultants. EMEA targets the fewest billable hours.
Table 101: Target Billable Hours by Geography
Role Level
Target Billable Hours Target Billable Utilization
North Amer.
West. Europe
ANZ India North Amer.
West. Europe
ANZ India
Mgmt.
VP / Executive Mgmt. 658 407 460 758 32.9% 20.3% 23.0% 37.9%
Director 827 636 679 975 41.4% 31.8% 34.0% 48.8%
Manager 979 883 700 672 49.0% 44.2% 35.0% 33.6%
Project Mgmt.
Program Manager 1,403 1,439 1,099 1,841 70.2% 72.0% 55.0% 92.1%
Senior Project Manager 1,500 1,379 1,384 1,700 75.0% 69.0% 69.2% 85.0%
Project Manager 1,525 1,469 1,466 1,688 76.3% 73.5% 73.3% 84.4%
Business Consulting
Principal Business Consult. 1,476 1,225 1,317 1,424 73.8% 61.3% 65.9% 71.2%
Sr. Business Consultant 1,515 1,456 1,487 1,650 75.7% 72.8% 74.3% 82.5%
Business Consultant 1,548 1,475 1,221 1,516 77.4% 73.7% 61.1% 75.8%
Technical Consulting
Solution Architect 1,421 1,351 1,127 1,680 71.0% 67.5% 56.3% 84.0%
Senior Technical Consult. 1,586 1,480 1,530 1,775 79.3% 74.0% 76.5% 88.8%
Technical Consultant 1,605 1,431 1,499 1,713 80.2% 71.6% 75.0% 85.6%
Source: Service Performance Insight 2015 PS Global Pricing Report
Annual Hours
Always one of the most anticipated metrics from the annual PS Maturity™ benchmark survey is the
breakdown of work hours. Most organizations put a lot of focus on consultant time spent on both
billable and non-billable tasks. Embedded organizations reported a 2.5% increase in billable hours from
1,317 to 1,350 while independents reported a slight decrease in billable hours from 1,488 to 1,481.

2016 Professional Services Maturity™ Benchmark
© 2016 Service Performance Insight www.FinancialForce.com 137
Across all job titles, billable utilization is higher for independents than embedded service organizations
as embedded organizations must contend with more non-billable work to support product sales or to fix
product or relationship issues.
Table 102: Annual Hour Comparison by Organization Type
Annual Hours Survey ESO PSO
2014 2015 Change 2014 2015 Change 2014 2015 Change
Vacation/personal/holiday 176 169 -4.0% 188 157 -16.5% 169 175 3.6%
Education/training 72 77 6.9% 84 94 11.9% 65 69 6.2%
Administrative 180 171 -5.0% 213 187 -12.2% 164 164 0.0%
Non-billable project hours 233 213 -8.6% 313 269 -14.1% 194 186 -4.1%
Total Billable Hours 1,431 1,439 0.6% 1,317 1,350 2.5% 1,488 1,481 -0.5%
Billable hours on-site 811 803 -1.0% 696 622 -10.6% 868 887 2.2%
Billable hours off-site 620 637 2.7% 620 729 17.6% 620 594 -4.2%
Total Hours 2,092 2,069 -1.1% 2,115 2,058 -2.7% 2,080 2,075 -0.2%
Source: Service Performance Insight, February 2016
Table 102 provides a year-over-year comparison of annual work hours by comparing embedded to
independent organizations. The trend in total annual hours this year was very positive with fewer hours
spent on administration and non-billable project hours contributing to fewer total hours worked with
approximately the same number of billable hours (1,439). ESOs reduced non-billable vacation,
administration and non-billable project hours but increased training time from 84 to 94 hours.
Independents increased vacation and education time but decreased non-billable project hours.
Independent consultants billed 131 more hours (16 more days) than their embedded counterparts!
Table 103: Annual Hour Comparison by Region
Annual Hours Americas EMEA APac
2014 2015 Change 2014 2015 Change 2014 2015 Change
Vacation/personal/holiday 160 150 -6.3% 222 219 -1.4% 196 176 -10.2%
Education/training 67 74 10.4% 86 80 -7.0% 76 87 14.5%
Administrative 173 181 4.6% 210 136 -35.2% 170 206 21.2%
Non-billable project hours 242 219 -9.5% 201 198 -1.5% 237 211 -11.0%
Total Billable Hours 1,457 1,450 -0.5% 1,327 1,415 6.6% 1,458 1,427 -2.1%
Billable hours on-site 801 740 -7.6% 821 922 12.3% 869 982 13.0%
Billable hours off-site 655 710 8.4% 506 493 -2.6% 589 445 -24.4%
Total Hours 2,099 2,073 -1.2% 2,046 2,048 0.1% 2,136 2,108 -1.3%
Source: Service Performance Insight, February 2016

2016 Professional Services Maturity™ Benchmark
© 2016 Service Performance Insight www.FinancialForce.com 138
Table 103 shows employees in Asia work more hours than either American or European consultants.
EMEA PS firms work the least due to more vacation and training time. In 2015 APAC firms invested the
most in education and training followed by EMEA. Workaholic Americans spend the least amount of
time on vacations and training but the most on non-billable project hours, and they reported a decrease
in non-billable administrative time. Excessive administrative time usually results from not having
enough billable work combined with poor systems and processes. By region, EMEA firms reported the
biggest increase in both billable time and total work hours but still work less than in any other
geography. The average consultant in APac worked 60 more hours than their European counterparts!
Table 104 shows firms become more productive as they grow from small to large. Both total work hours
and billable hours per year increase as firms grow. The benefits of growing from a small to mid-size firm
show up in more vacation hours and fewer hours spent on administration and non-billable project
hours. More work is delivered on-site as firms grow.
Table 104: Annual Hour Comparison by Organization Size (< 100 employees)
Annual Hours Under 10 10 - 30 31 - 100
2014 2015 Change 2014 2015 Change 2014 2015 Change
Vacation/personal/holiday 141 158 12.1% 181 175 -3.3% 180 177 -1.7%
Education/training 72 51 -29.2% 80 57 -28.8% 60 87 45.0%
Administrative 201 190 -5.5% 160 152 -5.0% 197 177 -10.2%
Non-billable project hours 234 261 11.5% 261 262 0.4% 263 213 -19.0%
Total Billable Hours 1,356 1,361 0.4% 1,396 1,415 1.4% 1,401 1,430 2.1%
Billable hours on-site 548 726 32.5% 770 786 2.1% 762 769 0.9%
Billable hours off-site 807 634 -21.4% 626 629 0.5% 639 661 3.4%
Total Hours 2,003 2,022 0.9% 2,079 2,060 -0.9% 2,102 2,083 -0.9%
Source: Service Performance Insight, February 2016
Table 105: Annual Hour Comparison by Organization Size (> 100 employees)
Annual Hours 101 - 300 301 – 700 Over 700
2014 2015 Change 2014 2015 Change 2014 2015 Change
Vacation/personal/holiday 163 163 0.0% 198 157 -20.7% 181 169 -6.6%
Education/training 62 73 17.7% 86 75 -12.8% 113 104 -8.0%
Administrative 153 155 1.3% 229 173 -24.5% 132 200 51.5%
Non-billable project hours 197 174 -11.7% 187 173 -7.5% 160 212 32.5%
Total Billable Hours 1,537 1,477 -3.9% 1,415 1,515 7.1% 1,514 1,429 -5.6%
Billable hours on-site 985 813 -17.5% 835 996 19.3% 995 805 -19.1%
Billable hours off-site 552 664 20.3% 581 520 -10.5% 520 624 20.0%
Total Hours 2,112 2,042 -3.3% 2,116 2,094 -1.0% 2,100 2,114 0.7%
Source: Service Performance Insight, February 2016

2016 Professional Services Maturity™ Benchmark
© 2016 Service Performance Insight www.FinancialForce.com 139
Table 105 shows mid-size and large organizations bill almost 1,500 hours (75%) annually – making them
generally more productive than their smaller counterparts. Organizations with over 700 PS employees
logged less vacation and training time but significantly more administrative and non-billable project
hours this year. To offset this lost productivity time, they required more annual work hours from their
employees than smaller firms. This chart is a good reminder of the economies of scale that larger
people-based organizations are able to achieve if they are appropriately sized and skilled for the amount
of work available.
For embedded service organizations, hardware, SaaS and software PSOs all reported more billable hours
in 2015 with hardware PSOs reporting the largest increase (3.1%). Unfortunately, higher billability came
at the price of vacations for software and hardware PSOs. Average billable utilization for embedded
PSOs was 67.5% in 2015 compared to 74% for independents. The average embedded consultant billed
1,351 hours compared to independents that billed 1,481.
Table 106: Annual Hour Comparison by Embedded Service Organization Type
Annual Hours Software PS SaaS PS Hardware/Network PS
2014 2015 Change 2014 2015 Change 2014 2015 Change
Vacation/personal/holiday 209 160 -23.4% 128 155 21.1% 207 146 -29.5%
Education/training 86 91 5.8% 85 90 5.9% 93 150 61.3%
Administrative 208 182 -12.5% 215 175 -18.6% 228 346 51.8%
Non-billable project hours 293 290 -1.0% 367 299 -18.5% 263 127 -51.7%
Total Billable Hours 1,320 1,336 1.2% 1,313 1,351 2.9% 1,280 1,320 3.1%
Billable hours on-site 716 638 -10.9% 732 323 -55.9% 635 1,013 59.5%
Billable hours off-site 604 698 15.6% 581 1,028 76.9% 645 308 -52.2%
Total Hours 2,117 2,058 -2.8% 2,107 2,069 -1.8% 2,070 2,089 0.9%
Source: Service Performance Insight, February 2016
As shown in Tables 107, 108 and 109, IT consultants billed the most hours (1,521) while other PS billed
the least (1,132). Management consultants spend the most time working on-site (993 hours) while SaaS
PS spends the least (323). Independents reported an average decrease of 7 billable hours per consultant
(1,481) compared to (1,488) in 2014 and 1,457 in 2013.
Table 107: Annual Hour Comparison by PS Market (IT & Management Consulting, Staffing)
Annual Hours IT Consulting Management Consulting Staffing
2014 2015 Change 2014 2015 Change 2014 2015 Change
Vacation/personal/holiday 176 166 -5.7% 145 176 21.4% N/A 214 N/A
Education/training 66 69 4.5% 52 69 32.7% N/A 116 N/A
Administrative 143 162 13.3% 217 146 -32.7% N/A 202 N/A
Non-billable project hours 176 170 -3.4% 190 216 13.7% N/A 94 N/A
Total Billable Hours 1,513 1,521 0.5% 1,454 1,475 1.4% N/A 1,457 N/A

2016 Professional Services Maturity™ Benchmark
© 2016 Service Performance Insight www.FinancialForce.com 140
Billable hours on-site 948 860 -9.3% 657 993 51.1% N/A 831 N/A
Billable hours off-site 565 662 17.2% 797 481 -39.6% N/A 626 N/A
Total Hours 2,073 2,088 0.7% 2,058 2,082 1.2% N/A 2,083 N/A
Source: Service Performance Insight, February 2016
Table 107 shows IT consultancies average 1,521 hours per consultant compared to 1,454 hours for
management consultants. Unfortunately, their high levels of billability are more than offset by their low
rate structure. According to the 2015 Global PS Pricing report the average management consulting rate
is $197/hour while the average IT Consulting rate is only $163/hour for billable consultants.
Table 108: Annual Hour Comparison by PS Market (Advertising, Arch./Engr., Other PS)
Annual Hours Advertising Architecture/Engineering Other PS
2014 2015 Change 2014 2015 Change 2014 2015 Change
Vacation/personal/holiday 168 141 -16.1% 173 175 1.2% 162 227 40.1%
Education/training 98 101 3.1% 65 44 -32.3% 69 60 -13.0%
Administrative 135 202 49.6% 157 138 -12.1% 201 293 45.8%
Non-billable project hours 196 385 96.4% 201 155 -22.9% 284 270 -4.9%
Total Billable Hours 1,520 1,192 -21.6% 1,486 1,514 1.9% 1,415 1,132 -20.0%
Billable hours on-site 903 303 -66.4% 822 858 4.4% 747 680 -9.0%
Billable hours off-site 617 889 44.1% 664 656 -1.2% 668 452 -32.3%
Total Hours 2,117 2,022 -4.5% 2,082 2,025 -2.7% 2,132 1,982 -7.0%
Source: Service Performance Insight, February 2016
Table 109: Annual Hour Comparison by PS Market
Annual Hours Accounting Research & Development Value-added Reseller
2014 2015 Change 2014 2015 Change 2014 2015 Change
Vacation/personal/holiday N/A 198 N/A N/A 207 N/A N/A 147 N/A
Education/training N/A 55 N/A N/A 130 N/A N/A 87 N/A
Administrative N/A 126 N/A N/A 221 N/A N/A 148 N/A
Non-billable project hours N/A 294 N/A N/A 110 N/A N/A 242 N/A
Total Billable Hours N/A 1,373 N/A N/A 1,560 N/A N/A 1,385 N/A
Billable hours on-site N/A 1,218 N/A N/A 1,333 N/A N/A 648 N/A
Billable hours off-site N/A 154 N/A N/A 228 N/A N/A 738 N/A
Total Hours N/A 2,046 N/A N/A 2,228 N/A N/A 2,008 N/A
Source: Service Performance Insight, February 2016
Table 108 shows marketing and communication consultants reported significantly lower billable hours
this year (1,192) while architects reported slightly more billable hours this year (1,514) than last year.
Architects and engineers reported the steepest decline in administrative time (-12.1%) and non-billable

2016 Professional Services Maturity™ Benchmark
© 2016 Service Performance Insight www.FinancialForce.com 141
time (-22.9%) as business picked up in the construction industry. There was not enough information
from the 2014 survey to statistically compare Accountancies, Research & Development Firms and VARs.
Employee Location
A fascinating topic is the composition and location of employees in the new world of project-based
work. This year SPI Research saw an increase in the percentage of the overall PS workforce working
from headquarters and offshore while the percentage of workers based in branch offices and home
offices declined slightly. Over one-quarter of American PS workers work from home while only 11.6% of
EMEA and 14.6% of APac workers do. APac reported the sharpest increase in home workers (from 8.4%
in 2014 to 14.6% in 2015). EMEA has the largest concentration of employees working from a
headquarters office. Both the Americas and APAC reported a decline in offshore workers from 2014 to
2015; declining from 5.7% to 5.6% in the Americas and from 6% to 4.2% in APAC. EMEA increased its
reliance on offshore workers moving from 4.8% to 6.3%. Independents increased their reliance on
offshore workers from 4.8% to 6% while embedded PSOs decreased their offshore workers from 7.6% to
5%. Many PS firms are reducing their usage of offshore workers as labor costs and turnover have
skyrocketed in favored offshore destinations like India. Offshore quality and security concerns are also
starting to offset labor cost advantages.
Table 110: Workforce Location by Organization Type and Geographic Region
Employee Location 2014 2015 ESO PSO Americas EMEA APac
Headquarters 50.5% 53.1% 41.6% 57.9% 49.0% 66.1% 45.5%
Branch offices 20.8% 19.5% 27.0% 16.5% 19.2% 15.9% 35.8%
Home based 23.2% 21.6% 26.4% 19.7% 26.3% 11.6% 14.6%
2015 Offshore / Nearshore 5.6% 5.7% 5.0% 6.0% 5.6% 6.3% 4.2%
2014 Offshore/Nearshore 7.6% 4.8% 5.7% 4.8% 6.0%
Total 100.0% 100.0% 100.0% 100.0% 100.0% 100.0% 100.0%
Source: Service Performance Insight, February 2016
Table 111: Workforce Location by Organization Size
Employee Location Under 10 10 - 30 31 – 100 101 - 300 301 - 700 Over 700
Headquarters 67.9% 56.0% 53.6% 50.9% 36.6% 35.9%
Branch offices 1.8% 12.6% 19.9% 26.3% 33.1% 35.3%
Home based 27.6% 26.4% 23.0% 14.5% 20.4% 14.9%
2015 Offshore / Nearshore 2.7% 5.0% 3.5% 8.3% 9.9% 13.9%
2014 Offshore/Nearshore 0.0% 1.4% 5.0% 10.8% 7.7% 13.7%
Total 100.0% 100.0% 100.0% 100.0% 100.0% 100.0%
Source: Service Performance Insight, February 2016
Table 111 shows the use of offshore workers increases with organization size while the percentage of
home-based workers’ declines. Large organizations are becoming increasingly comfortable with virtual

2016 Professional Services Maturity™ Benchmark
© 2016 Service Performance Insight www.FinancialForce.com 142
work teams with less than 40% of their workforces co-located at the headquarters location. Small
organizations increased offshore use while midsize organizations decreased offshore use.
By vertical market, software and managed service providers have the largest percentage of home-based
workers, closely followed by management consultancies. IT consultancies use the most offshore workers
while managed service providers use the least. Many firms are opening onshore managed service,
hosting and development centers in low cost areas like the Midwest and the South with excellent results
in terms of costs and quality. Architect and engineering firms still favor centralized, headquarters based
workstyles while hardware and networking providers invest in branch offices.
Table 112: Workforce Location by Service Market Vertical
Employee Location IT
Consult. Software
Mgmt. Consult.
Arch./ Engr.
SaaS Mgd. Serv.
Hard. & Netwrk.
Headquarters 52.8% 35.6% 55.4% 77.2% 52.6% 64.4% 29.5%
Branch offices 16.9% 27.1% 13.2% 15.8% 27.1% 8.3% 49.0%
Home based 22.1% 29.9% 24.8% 5.1% 17.8% 25.9% 20.0%
Off /Nearshore 8.2% 7.4% 6.5% 1.9% 2.6% 1.4% 1.5%
Total 100.0% 100.0% 100.0% 100.0% 100.0% 100.0% 100.0%
Source: Service Performance Insight, February 2016
Table 113 shows Research and Development and Accountancies reported the use of no offshore
workers. Almost one-third of VAR and Marketing and Advertising employees work from home.
Table 113: Workforce Location by Service Market Vertical
Employee Location R&D VAR Acct. Advert.
(Marcom) Staff. Other PS
Headquarters 41.5% 44.6% 57.8% 49.9% 58.2% 76.4%
Branch offices 36.4% 22.0% 33.3% 13.1% 19.2% 3.3%
Home based 22.1% 31.3% 8.9% 31.8% 17.6% 20.3%
Off /Nearshore 0.0% 2.1% 0.0% 5.2% 5.0% 0.0%
Total 100.0% 100.0% 100.0% 100.0% 100.0% 100.0%
Source: Service Performance Insight, February 2016
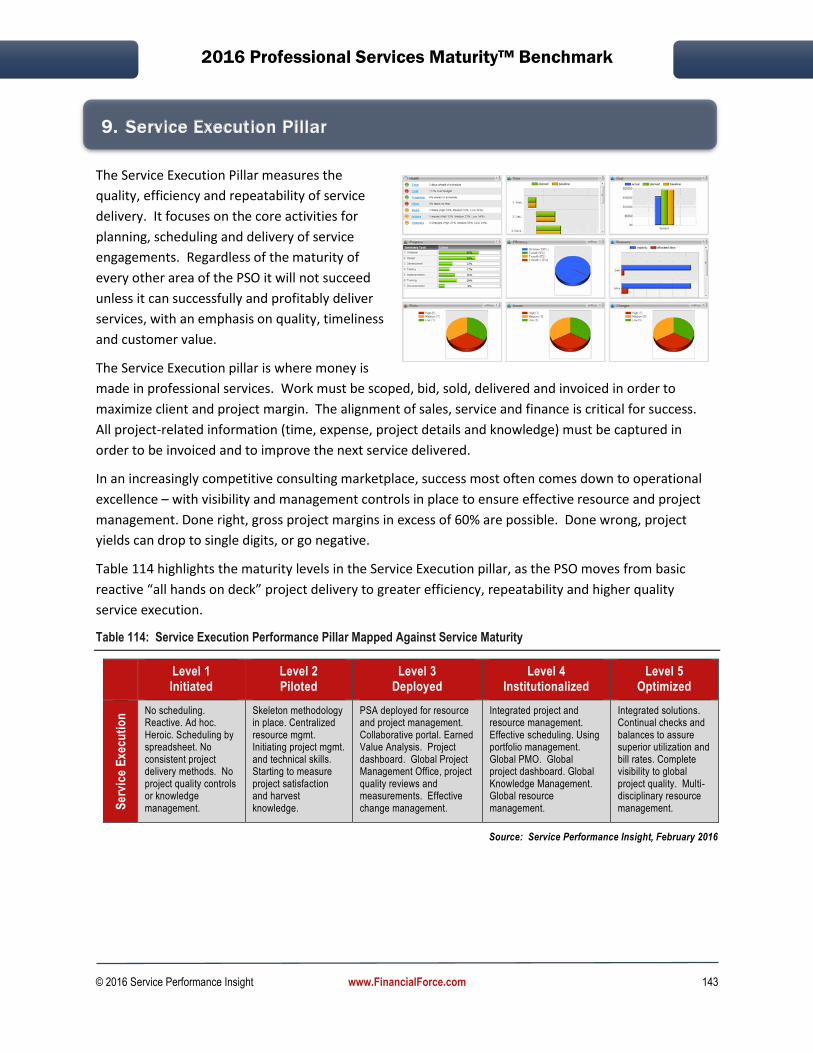
2016 Professional Services Maturity™ Benchmark
© 2016 Service Performance Insight www.FinancialForce.com 143
9. Service Execution Pillar
The Service Execution Pillar measures the
quality, efficiency and repeatability of service
delivery. It focuses on the core activities for
planning, scheduling and delivery of service
engagements. Regardless of the maturity of
every other area of the PSO it will not succeed
unless it can successfully and profitably deliver
services, with an emphasis on quality, timeliness
and customer value.
The Service Execution pillar is where money is
made in professional services. Work must be scoped, bid, sold, delivered and invoiced in order to
maximize client and project margin. The alignment of sales, service and finance is critical for success.
All project-related information (time, expense, project details and knowledge) must be captured in
order to be invoiced and to improve the next service delivered.
In an increasingly competitive consulting marketplace, success most often comes down to operational
excellence – with visibility and management controls in place to ensure effective resource and project
management. Done right, gross project margins in excess of 60% are possible. Done wrong, project
yields can drop to single digits, or go negative.
Table 114 highlights the maturity levels in the Service Execution pillar, as the PSO moves from basic
reactive “all hands on deck” project delivery to greater efficiency, repeatability and higher quality
service execution.
Table 114: Service Execution Performance Pillar Mapped Against Service Maturity
Level 1 Initiated
Level 2 Piloted
Level 3 Deployed
Level 4 Institutionalized
Level 5 Optimized
Se
rvic
e E
xec
uti
on
No scheduling. Reactive. Ad hoc. Heroic. Scheduling by spreadsheet. No consistent project delivery methods. No project quality controls or knowledge management.
Skeleton methodology in place. Centralized resource mgmt. Initiating project mgmt. and technical skills. Starting to measure project satisfaction and harvest knowledge.
PSA deployed for resource and project management. Collaborative portal. Earned Value Analysis. Project dashboard. Global Project Management Office, project quality reviews and measurements. Effective change management.
Integrated project and resource management. Effective scheduling. Using portfolio management. Global PMO. Global project dashboard. Global Knowledge Management. Global resource management.
Integrated solutions. Continual checks and balances to assure superior utilization and bill rates. Complete visibility to global project quality. Multi-disciplinary resource management.
Source: Service Performance Insight, February 2016

2016 Professional Services Maturity™ Benchmark
© 2016 Service Performance Insight www.FinancialForce.com 144
Core Service Execution Business Processes
The power of modern PSA solutions is that they provide workflow, rules, alerts and reporting that mimic
best practices in business management. Decades ago services businesses had few viable options as they
were forced to build their own, or substantially customize manufacturing-oriented applications, to
handle projects and resources. Now, PSA solutions provide modules that support essential business
processes, including the critical “quote-to-cash” process (Figure 52).
Figure 52: Primary business processes cross multiple departments
PSA solutions are designed to integrate core business processes across the organization so that each
department has a clear understanding of their specific goals and measurements and how they ultimately
impact the organization’s ability to succeed. Success can be defined in many terms, such as growth,
profit, quality, streamlined operations or reduced administration and rework. Regardless, when
everyone works with the same set of information and is focused on the critical path to quality
completion of project-based work, results tend to improve.
The most important reason why project- and services-based organizations purchase integrated PSA
solutions is their ability to support and streamline business processes across the entire organization.
No longer can solutions only provide visibility into specific functions. Now, as each department adds
value, the business processes that enable success must be mirrored in the PSA solution. The following
sections highlight two of the most critical business processes within project- and services-based
organizations: 1) quote-to-cash, and 2) resource management.
Quote-to-cash business processes
In today’s economy, cash flow rules. Every organization must focus on cash flow to maintain a solid
financial position and maximize profitability and liquidity. In service-oriented organizations this process
begins with a client quote and ends once payment is received and the money is in the bank. This macro
process of converting sales opportunities into paying customers is often referred to as “quote-to-cash,”
and its optimization is essential for financial well-being.
Figure 53 shows quote-to-cash is a series of interrelated processes supported by client relationship
management (CRM), PSA and enterprise resource planning (ERP) modules. To optimize these
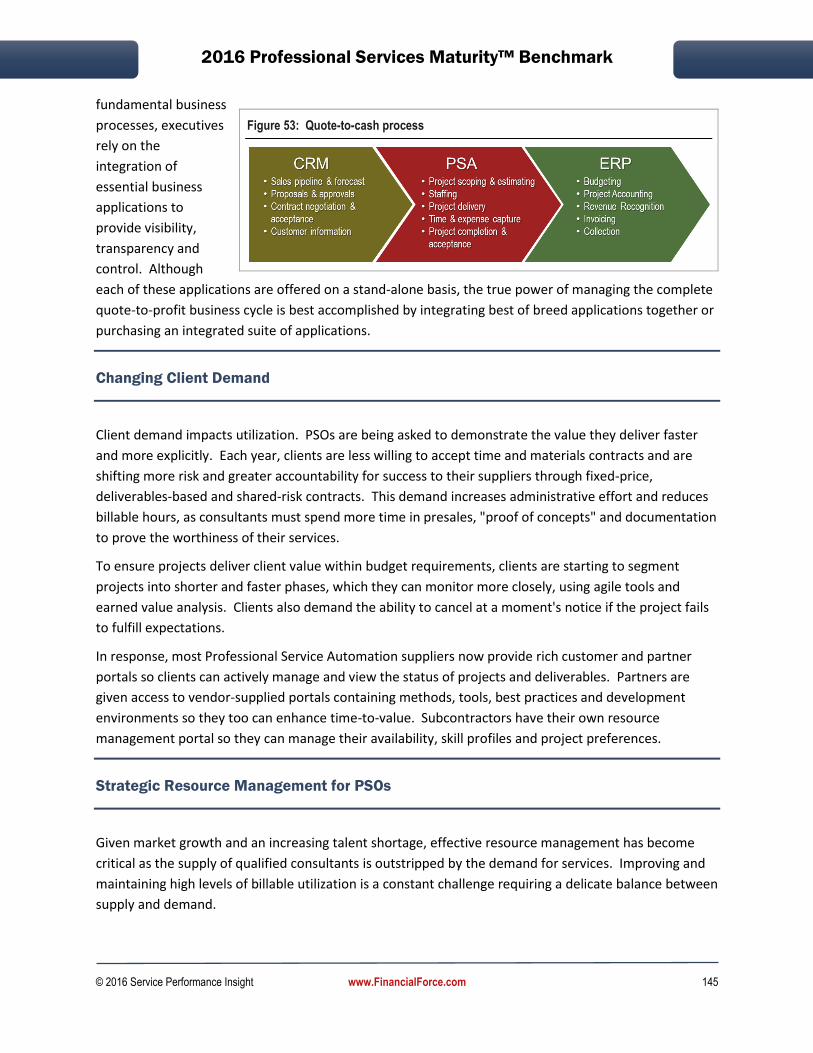
2016 Professional Services Maturity™ Benchmark
© 2016 Service Performance Insight www.FinancialForce.com 145
fundamental business
processes, executives
rely on the
integration of
essential business
applications to
provide visibility,
transparency and
control. Although
each of these applications are offered on a stand-alone basis, the true power of managing the complete
quote-to-profit business cycle is best accomplished by integrating best of breed applications together or
purchasing an integrated suite of applications.
Changing Client Demand
Client demand impacts utilization. PSOs are being asked to demonstrate the value they deliver faster
and more explicitly. Each year, clients are less willing to accept time and materials contracts and are
shifting more risk and greater accountability for success to their suppliers through fixed-price,
deliverables-based and shared-risk contracts. This demand increases administrative effort and reduces
billable hours, as consultants must spend more time in presales, "proof of concepts" and documentation
to prove the worthiness of their services.
To ensure projects deliver client value within budget requirements, clients are starting to segment
projects into shorter and faster phases, which they can monitor more closely, using agile tools and
earned value analysis. Clients also demand the ability to cancel at a moment's notice if the project fails
to fulfill expectations.
In response, most Professional Service Automation suppliers now provide rich customer and partner
portals so clients can actively manage and view the status of projects and deliverables. Partners are
given access to vendor-supplied portals containing methods, tools, best practices and development
environments so they too can enhance time-to-value. Subcontractors have their own resource
management portal so they can manage their availability, skill profiles and project preferences.
Strategic Resource Management for PSOs
Given market growth and an increasing talent shortage, effective resource management has become
critical as the supply of qualified consultants is outstripped by the demand for services. Improving and
maintaining high levels of billable utilization is a constant challenge requiring a delicate balance between
supply and demand.
Figure 53: Quote-to-cash process
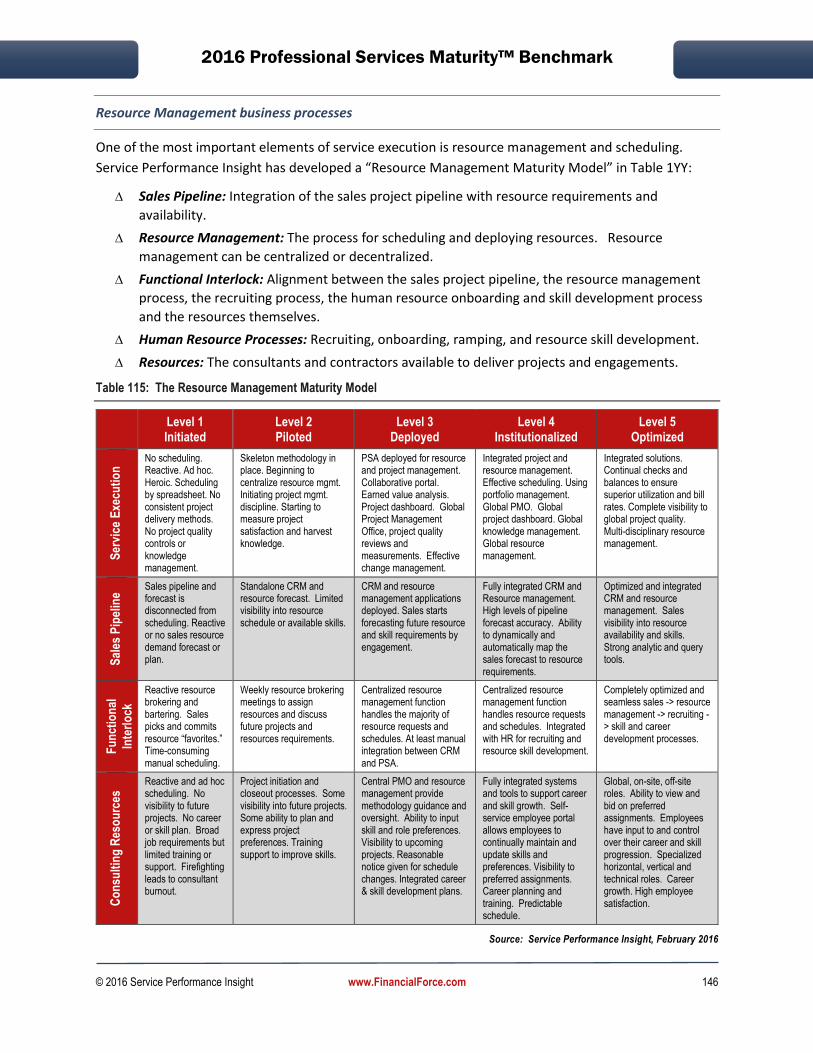
2016 Professional Services Maturity™ Benchmark
© 2016 Service Performance Insight www.FinancialForce.com 146
Resource Management business processes
One of the most important elements of service execution is resource management and scheduling.
Service Performance Insight has developed a “Resource Management Maturity Model” in Table 1YY:
∆ Sales Pipeline: Integration of the sales project pipeline with resource requirements and
availability.
∆ Resource Management: The process for scheduling and deploying resources. Resource
management can be centralized or decentralized.
∆ Functional Interlock: Alignment between the sales project pipeline, the resource management
process, the recruiting process, the human resource onboarding and skill development process
and the resources themselves.
∆ Human Resource Processes: Recruiting, onboarding, ramping, and resource skill development.
∆ Resources: The consultants and contractors available to deliver projects and engagements.
Table 115: The Resource Management Maturity Model
Level 1 Initiated
Level 2 Piloted
Level 3 Deployed
Level 4 Institutionalized
Level 5 Optimized
Ser
vice
Exe
cuti
on
No scheduling. Reactive. Ad hoc. Heroic. Scheduling by spreadsheet. No consistent project delivery methods. No project quality controls or knowledge management.
Skeleton methodology in place. Beginning to centralize resource mgmt. Initiating project mgmt. discipline. Starting to measure project satisfaction and harvest knowledge.
PSA deployed for resource and project management. Collaborative portal. Earned value analysis. Project dashboard. Global Project Management Office, project quality reviews and measurements. Effective change management.
Integrated project and resource management. Effective scheduling. Using portfolio management. Global PMO. Global project dashboard. Global knowledge management. Global resource management.
Integrated solutions. Continual checks and balances to ensure superior utilization and bill rates. Complete visibility to global project quality. Multi-disciplinary resource management.
Sal
es P
ipel
ine
Sales pipeline and forecast is disconnected from scheduling. Reactive or no sales resource demand forecast or plan.
Standalone CRM and resource forecast. Limited visibility into resource schedule or available skills.
CRM and resource management applications deployed. Sales starts forecasting future resource and skill requirements by engagement.
Fully integrated CRM and Resource management. High levels of pipeline forecast accuracy. Ability to dynamically and automatically map the sales forecast to resource requirements.
Optimized and integrated CRM and resource management. Sales visibility into resource availability and skills. Strong analytic and query tools.
Fu
nct
ion
al
Inte
rlo
ck
Reactive resource brokering and bartering. Sales picks and commits resource “favorites.” Time-consuming manual scheduling.
Weekly resource brokering meetings to assign resources and discuss future projects and resources requirements.
Centralized resource management function handles the majority of resource requests and schedules. At least manual integration between CRM and PSA.
Centralized resource management function handles resource requests and schedules. Integrated with HR for recruiting and resource skill development.
Completely optimized and seamless sales -> resource management -> recruiting -> skill and career development processes.
Co
nsu
ltin
g R
eso
urc
es Reactive and ad hoc
scheduling. No visibility to future projects. No career or skill plan. Broad job requirements but limited training or support. Firefighting leads to consultant burnout.
Project initiation and closeout processes. Some visibility into future projects. Some ability to plan and express project preferences. Training support to improve skills.
Central PMO and resource management provide methodology guidance and oversight. Ability to input skill and role preferences. Visibility to upcoming projects. Reasonable notice given for schedule changes. Integrated career & skill development plans.
Fully integrated systems and tools to support career and skill growth. Self-service employee portal allows employees to continually maintain and update skills and preferences. Visibility to preferred assignments. Career planning and training. Predictable schedule.
Global, on-site, off-site roles. Ability to view and bid on preferred assignments. Employees have input to and control over their career and skill progression. Specialized horizontal, vertical and technical roles. Career growth. High employee satisfaction.
Source: Service Performance Insight, February 2016
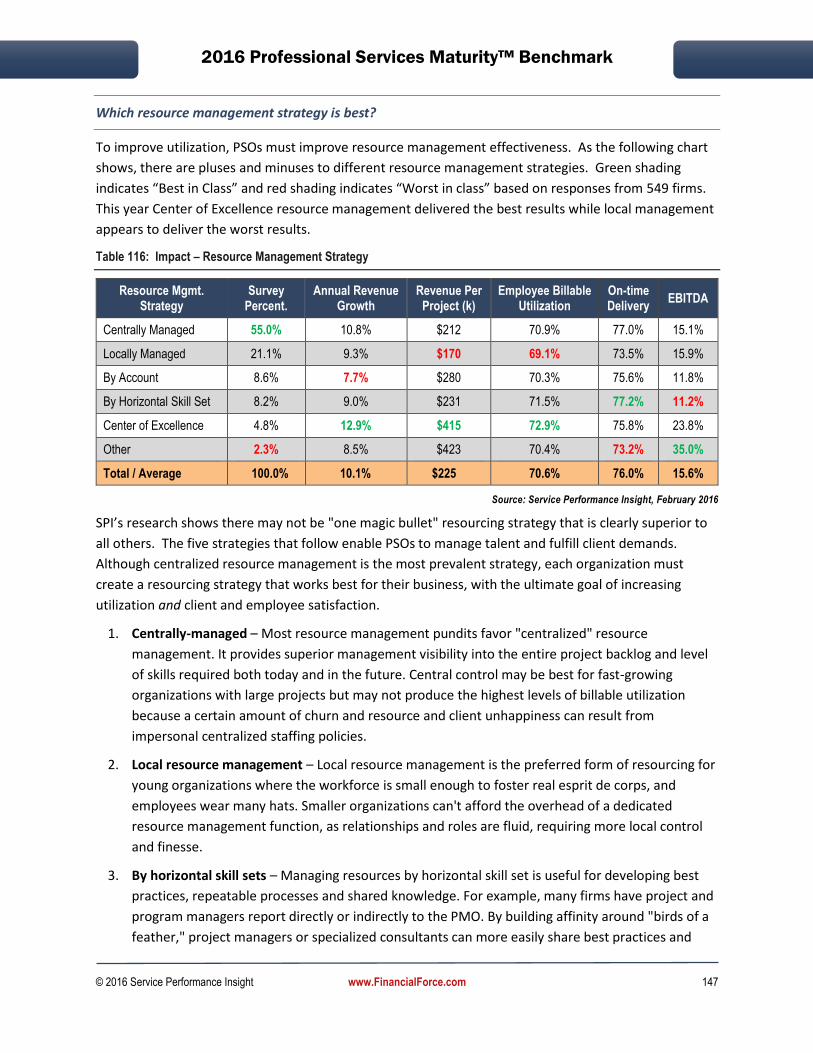
2016 Professional Services Maturity™ Benchmark
© 2016 Service Performance Insight www.FinancialForce.com 147
Which resource management strategy is best?
To improve utilization, PSOs must improve resource management effectiveness. As the following chart
shows, there are pluses and minuses to different resource management strategies. Green shading
indicates “Best in Class” and red shading indicates “Worst in class” based on responses from 549 firms.
This year Center of Excellence resource management delivered the best results while local management
appears to deliver the worst results.
Table 116: Impact – Resource Management Strategy
Resource Mgmt. Strategy
Survey Percent.
Annual Revenue Growth
Revenue Per Project (k)
Employee Billable Utilization
On-time Delivery
EBITDA
Centrally Managed 55.0% 10.8% $212 70.9% 77.0% 15.1%
Locally Managed 21.1% 9.3% $170 69.1% 73.5% 15.9%
By Account 8.6% 7.7% $280 70.3% 75.6% 11.8%
By Horizontal Skill Set 8.2% 9.0% $231 71.5% 77.2% 11.2%
Center of Excellence 4.8% 12.9% $415 72.9% 75.8% 23.8%
Other 2.3% 8.5% $423 70.4% 73.2% 35.0%
Total / Average 100.0% 10.1% $225 70.6% 76.0% 15.6%
Source: Service Performance Insight, February 2016
SPI’s research shows there may not be "one magic bullet" resourcing strategy that is clearly superior to
all others. The five strategies that follow enable PSOs to manage talent and fulfill client demands.
Although centralized resource management is the most prevalent strategy, each organization must
create a resourcing strategy that works best for their business, with the ultimate goal of increasing
utilization and client and employee satisfaction.
1. Centrally-managed – Most resource management pundits favor "centralized" resource
management. It provides superior management visibility into the entire project backlog and level
of skills required both today and in the future. Central control may be best for fast-growing
organizations with large projects but may not produce the highest levels of billable utilization
because a certain amount of churn and resource and client unhappiness can result from
impersonal centralized staffing policies.
2. Local resource management – Local resource management is the preferred form of resourcing for
young organizations where the workforce is small enough to foster real esprit de corps, and
employees wear many hats. Smaller organizations can't afford the overhead of a dedicated
resource management function, as relationships and roles are fluid, requiring more local control
and finesse.
3. By horizontal skill sets – Managing resources by horizontal skill set is useful for developing best
practices, repeatable processes and shared knowledge. For example, many firms have project and
program managers report directly or indirectly to the PMO. By building affinity around "birds of a
feather," project managers or specialized consultants can more easily share best practices and

2016 Professional Services Maturity™ Benchmark
© 2016 Service Performance Insight www.FinancialForce.com 148
standardize methodologies, templates, etc. As organizations grow, a horizontal or competency-
based overlay reporting structure can help firms develop repeatable best practices and deep,
shared expertise while still enjoying the efficiency of centralized management.
4. Account-based – Resource management by account may be a good strategy for very large
accounts where there is a strong backlog of projects, but account-based resourcing can cause big
issues if account revenue dries up. An example was Electronic Data Systems' (EDS) reliance on
revenue from General Motors. As the relationship with General Motors soured, and its fortunes
began to wane, Electronic Data Systems was left holding the bag. The other drawback to account-
based resourcing is that it narrows consultant range of experience as teams are not exposed to
different business models and challenges.
5. Centers of excellence – The current trend towards vertical Centers of Excellence (COE) was
pioneered by Accenture over the last decade. The advantage of industry-specific "Centers of
Excellence" is the development of deep business-domain knowledge. In theory, each Center of
Excellence acts as a clearinghouse for specialized knowledge, expertise and solutions. Clients and
prospects delight in seeing a "Vision of the Future" for their unique industry challenges. The
downside of COE can be excessive overhead, the creation of an ivory tower mentality and the
inability to learn from emerging new horizontal and vertical trends. Further, use of horizontal skills
sets and technologies outside the COE can become cumbersome and inefficient. Centers of
Excellence are favored for outsourced consulting – particularly development and managed service
centers where consultants are collocated to maximize collaboration, design and quality control
while minimizing cost.
Figure 54 shows over 55% of respondents manage
resource management centrally, with locally
managed resource management coming in second
at 21%. It is important to remember professional
service organizations are based on the unique
knowledge, skills and personalities of a highly
motivated and compensated workforce. So, erring
too far in making resource management more
science than art may not always take best
advantage of hard-to-find experts. Leading firms
understand the skills required and available, and
work toward providing additional training to
improve employee performance, while ensuring
individual travel and project-types and career
aspirations are factored in.
Investment in people, process and systems allows
these organizations to minimize employee attrition and drive utilization to extremely high levels. SPI’s
research shows PSOs that create standard job positions clarify the skills their workers must have.
Figure 54: Resource Management Process
Source: Service Performance Insight, February 2016
2016 Professional Services Maturity™ Benchmark
© 2016 Service Performance Insight www.FinancialForce.com 149
Providing visibility and additional training helps increase both productivity and morale, both of which
improve organizational performance.
PSA is Critical for Service Delivery
Professional Services Automation provides the systems basis for initiation, planning, resource
management, scheduling, execution, close and control of projects and services. PSA provides a resource
and project dashboard including the demand forecast. It helps manage service delivery by overseeing
opportunities, staffing, project management, and collaboration. PSA is typically the system of record for
resource skills, competencies and preferences with integration to the employee and contractor
database. It is used to collect time and expense by project and resource down to the task level so it is
the system of record for resource utilization and project cost and estimating. Most PSA applications
now offer billing modules with some level of revenue recognition by type of billing method – time and
materials, work in process or fixed price. They also support accurate time and expense capture. PSA
extensions for the construction industry include modules for material costs and procurement.
Core modules
PSA vendors segment their products into application modules that emphasize the management of costs,
clients and resources:
∆ Opportunity Management: The management of client information, sales activities, proposals,
and contracts to improve sales effectiveness. Some PSA solutions let a CRM tool handle
opportunity management; and instead focus on resource demand management and forecasting
functions based on the opportunities tracked in the CRM application.
∆ Engagement Management: The management and control of the overall set of project
deliverables.
∆ Resource Management: The management processes associated with resources (people,
material, equipment, etc.) used during the services delivery lifecycle.
∆ Project Management: The initiation, planning, execution, close and control of projects.
∆ Project Accounting: The tracking of project-related costs to determine budget to actual costs
and profitability.
∆ Time and Expense Management: The capture and tracking of project-related time and expense
information.
∆ Invoice Management: The preparation and presentation of invoices based on information
captured from the time and expense module or from pre-assigned time or project completion
milestones.
∆ Practice / Management Reporting: Core reports include project dashboards, resource
management and utilization dashboards, capacity planning and forecasting, project profitability,
etc.
2016 Professional Services Maturity™ Benchmark
© 2016 Service Performance Insight www.FinancialForce.com 150
Additional modules
While every PSA solution is unique, some have expanded their capabilities through additional modules.
Additional modules include:
∆ Social: The ability to easily incorporate social channel information from LinkedIn, Facebook,
Twitter, etc. along with social collaboration to facilitate knowledge sharing.
∆ Collaboration Management: The management of information used to create effective
communication and iterative knowledge sharing during the services delivery lifecycle.
∆ Knowledge Management: The centralization of information improves operational efficiency.
This information can be anything related to the ongoing business and includes information on
resources, projects, capital and clients.
∆ Revenue Management: PSA solutions provide deferred revenue and work in progress tracking
and revenue reporting to automate revenue reporting for time and materials, fixed bid,
milestone-based and term engagements.
∆ Performance Management: The use of information to determine effectiveness and budget to
actual performance for different aspects of the organization.
PSA Benefits
Each year SPI Research’s Professional Services Maturity™ benchmark quantifies the benefits achieved
by services organizations with solutions that integrate Client Relationship Management and financial
processes, Human Capital Management and financial processes, and Professional Services Automation
and financial processes. Of course, the systems themselves are only part of a broader firm-wide
commitment to behavioral change that fosters collaboration and enhanced communication,
coordination and quality management.
When it comes to PSA software, project- and services-based organizations now have a range of
attractive choices – systems that are designed to support the needs of the always-on, virtual, mobile
service economy by providing a number of key benefits:
∆ Project revenue and cost data is contained in a central database.
∆ The user interface is consistent across all applications.
∆ Costs and deliverables reside in the same place so productivity can be measured, analyzed and
improved at the territory, account, project and individual resource level.
∆ Reporting and analytics are embedded within the application, alerting decision-makers to issues
before they become problems.
∆ A more seamless audit trail to better identify success and failure points.
∆ Enhanced support for global operations with multicurrency, multilingual applications, which
conform to local regulations and taxes.
∆ Lower administration costs due to fewer manual, error-prone spreadsheets and costly data re-
entry.
∆ One-source of the truth – real-time information visibility, constantly updated.

2016 Professional Services Maturity™ Benchmark
© 2016 Service Performance Insight www.FinancialForce.com 151
There are many more benefits provided by integrated PSA solutions. It is intuitively obvious that with
one consistent set of information, decision-makers have the visibility and control they need to improve
organizational performance.
The case for PSA
After nearly 20 years of research on the performance of PSOs, the benefits of PSA speak for themselves.
Service Performance Insight research, provides an example of how PSOs have improved performance in
all areas when professional services automation has been deployed. PSA provides the necessary
visibility to efficiently run projects with fewer overhead resources, resulting in better resource
management and profit.
Table 117 shows a few of the most
critical key performance indicators
(KPIs) and how adopting a PSA can
affect them. While increased
billable utilization tends to be the
primary measurement, there are
many other metrics positively
impacted by these applications.
PSOs can manage the business
with lower administrative
overhead and deliver more
projects on time, driving better
financial performance. The
bottom line is that organizations that use a PSA solution grow faster, are much more profitable, and
simply operate far more efficiently.
Service Performance Insight’s research into PSA also highlights many qualitative benefits, some of which
include:
∆ Improved time and expense processing ∆ Improved communication and collaboration
∆ Improved management effectiveness ∆ Improved client satisfaction
∆ Increased resource utilization ∆ Improved resource investments
∆ Improved forecasting capabilities ∆ Reduced revenue leakage
∆ Improved project effectiveness ∆ Reduced total administration costs
Survey Results
The following section reviews and analyzes 2016 PS Maturity™ benchmark results from 549 participating
professional services organizations. In this section SPI Research analyzes 14 Service Execution KPIs that
are critical to attaining superior service delivery performance.
Table 117: PSA offers significant benefits
Key Performance Indicator (KPI) PSA Used
No PSA Used
▲
Employee billable utilization 71.3% 67.3% 6%
Year-over-year change in PS revenue 11.2% 6.3% 78%
Concurrent projects managed by PM 5.94 5.23 14%
Projects delivered on-time 76.4% 74.3% 3%
Use a standardized delivery methodology 65.3% 61.5% 6%
Annual revenue per billable consultant (k) $199 $191 4%
Profit (EBITDA) 15.9% 12.8% 25%
Source: Service Performance Insight, February 2016

2016 Professional Services Maturity™ Benchmark
© 2016 Service Performance Insight www.FinancialForce.com 152
Table 118 shows Service Execution trends for the last five years. Several positive trends include: more
projects concurrently managed by a project manager (lowering the overall cost of project management);
larger and longer projects (improving firm’s ability to forecast demand). Across the subjective
dimensions of effectiveness of resource management; estimating; change control; project quality and
knowledge management processes all improved. However, several negative trends have emerged.
Based on a skills shortage, it is taking longer to staff projects; this is probably a contributing factor to
fewer projects being delivered on-time with significantly greater project overruns. Sadly, the use of
standardized delivery methods and tools which could mitigate project delivery problems has declined.
Table 118: Service Execution Pillar 5-year trend
Key Performance Indicator (KPI) 2011 2012 2013 2014 2015
Average project staffing time (days) 12.64 12.48 9.48 9.41 10.40
Concurrent projects managed by PM 4.18 5.30 5.16 4.23 5.77
Average project staff (people) 3.96 3.73 3.76 4.85 4.70
Average project duration (months) 5.17 5.31 5.15 5.57 6.21
Projects delivered on-time 76.5% 78.6% 77.3% 78.3% 76.1%
Projects canceled 2.1% 3.7% 1.9% 1.7% 2.6%
Average project overrun 8.3% 9.2% 8.5% 8.9% 10.0%
A standardized delivery methodology is used 66.6% 63.6% 65.1% 66.2% 64.6%
Effectiveness of resource management process 3.47 3.53 3.47 3.59 3.60
Effectiveness of estimating processes and reviews 3.59 3.44 3.49 3.37 3.55
Effectiveness of change control processes 3.38 3.39 3.36 3.26 3.44
Effectiveness of project quality processes 3.43 3.45 3.38 3.36 3.58
Effectiveness of knowledge management processes 3.04 2.95 3.04 3.01 3.36
Source: Service Performance Insight, February 2016
Table 119 shows little difference in the average project staffing times between embedded and
independent service organizations, with most organizations requiring two working weeks to commence
project initiation. Each year the number of projects managed per project manager has inched up from
4.18 in 2011 to 5.77 in 2015. Today’s project managers receive more training and PMI/PMP certification
than ever before. At the same time, the nature of projects is shifting towards more configuration, user
interfaces and report design away from the complex, custom mega projects of the past making them
somewhat easier to manage and keep within scope. A host of accelerators, configuration, project and
knowledge management tools have come to market to enhance knowledge sharing and collaboration
while facilitating more natural oversight, guidance and real-time quality reviews to mitigate risks.

2016 Professional Services Maturity™ Benchmark
© 2016 Service Performance Insight www.FinancialForce.com 153
Table 119: Service Execution KPIs by Organization Type and Geographic Region
Key Performance Indicator (KPI) 2011 2015 ESO PSO Americas EMEA APac
Average project staffing time (days) 12.64 10.40 11.13 10.05 10.46 10.00 11.29
Concurrent projects managed by PM 4.18 5.77 6.59 5.39 6.28 4.67 4.82
Average project staff (people) 3.96 4.70 4.64 4.73 4.89 4.19 4.72
Average project duration (months) 5.17 6.21 5.59 6.50 6.22 6.45 5.20
Projects delivered on-time 76.5% 76.1% 72.0% 78.0% 76.2% 75.6% 77.0%
Projects canceled 2.1% 2.6% 2.4% 2.7% 2.6% 2.7% 2.2%
Average project overrun 8.3% 10.0% 11.2% 9.5% 10.0% 10.2% 9.2%
Use of a standardized delivery meth. 66.6% 64.6% 65.4% 64.2% 65.7% 61.1% 66.6%
Effect. of resource management 3.47 3.60 3.55 3.62 3.60 3.57 3.69
Effect. of estimating and reviews 3.59 3.55 3.52 3.56 3.58 3.42 3.71
Effect. of change control 3.38 3.44 3.45 3.44 3.45 3.38 3.60
Effect. of project quality N/A 3.58 3.41 3.66 3.58 3.51 3.83
Effect. of knowledge management N/A 3.36 3.30 3.39 3.37 3.32 3.47
Source: Service Performance Insight, February 2016
Across all types of organizations and geographies the average project staff is 4.7 people. As shown in
Figure 55 project staff size has been inching up since the recession, growing from 3.96 in 2011 to 4.7 in
2015. Project duration has likewise been growing from 5.17 months in 2011 to 6.21 months in 2015.
With economic recovery, project sizes are growing as companies have more time and money to spend
on improving their businesses. In the past five years the average project has grown from 20.5 man
months to 29.2 man months, representing 42% growth. Quite significant!
Unfortunately, while improvements have
been made in the number of projects
concurrently managed by a project
manager and project staff size and
duration have increased, almost no
improvements have been reported in the
number of projects delivered on-time.
This is an important metric which
depends on a host of other processes such
as accurate estimates, clear
requirements, great client communication
and scope control. But the sad reality
exists, in 2011 76.5% of projects were
delivered on-time while only 76.1% were
delivered on-time in 2015. ESOs do a
poorer job of on-time project delivery due
Figure 55: Project Duration (man-months) 5-year trend
Source: Service Performance Insight, February 2016

2016 Professional Services Maturity™ Benchmark
© 2016 Service Performance Insight www.FinancialForce.com 154
in large part to their role of ensuring client adoption. When faced with product problems, the PS team
must continue to trudge on, often at no charge to ensure the client receives a useful solution.
Figure 56: Standardized Delivery Methodology use mapped against On-time Delivery 5-year trend
Source: Service Performance Insight, February 2016
Unfortunately, over the same five-year time horizon, the magnitude of project overruns has increased
substantially from 8.3% in 2011 to 10% in 2015. The sad fact is the one thing that could improve on-
time project delivery and reduce project overruns is not being used. The use of standardized service
delivery methods has actually declined from 66.6% of all projects in 2011 to only 64.6% in 2015. Very
disappointing at a time when the PS industry is undergoing tremendous growth and gaining stature and
global visibility. Just think of the myriad news headlines heralding poor project management and
ineffective service delivery processes – mine explosions, gas line leaks, oil spills…. All of which could
have been prevented with quality service delivery processes and reviews! Areas of improvement in
service execution have been in resource management, estimating, change control, quality and
knowledge management processes.
Table 120 shows the differences in service execution metrics by size of organization. The smallest
organizations do the best job of on-time project delivery. The largest organizations gave themselves the
best marks for estimating, change control, project quality and knowledge management. They certainly
need these processes as they manage the largest, most risk intense projects.
Table 120: Service Execution KPIs by Organization Size
Key Performance Indicator (KPI) Under 10 10 - 30 31 – 100 101 - 300 301 - 700 Over 700
Average project staffing time (days) 7.98 8.10 9.98 12.02 10.65 12.84
Concurrent projects managed by PM 6.33 5.79 5.52 5.89 5.17 6.12
Average project staff (people) 2.65 3.35 4.09 5.46 5.86 6.98
Average project duration (months) 5.61 5.59 5.94 6.75 6.15 7.10

2016 Professional Services Maturity™ Benchmark
© 2016 Service Performance Insight www.FinancialForce.com 155
Key Performance Indicator (KPI) Under 10 10 - 30 31 – 100 101 - 300 301 - 700 Over 700
Projects delivered on-time 79.1% 76.0% 75.8% 74.6% 76.3% 77.3%
Projects canceled 3.3% 2.6% 1.7% 2.7% 3.4% 3.2%
Average project overrun 8.9% 10.3% 10.4% 9.9% 9.9% 10.0%
Use of a standardized delivery meth. 62.8% 62.9% 68.3% 61.6% 65.4% 65.3%
Effect. of resource management 3.57 3.78 3.54 3.43 3.65 3.77
Effect. of estimating and reviews 3.65 3.54 3.51 3.49 3.48 3.71
Effect. of change control 3.60 3.34 3.28 3.41 3.38 3.91
Effect. of project quality 3.72 3.52 3.43 3.56 3.53 3.92
Effect. of knowledge management 3.58 3.20 3.22 3.31 3.38 3.77
Source: Service Performance Insight, February 2016
Table 121 shows service execution metrics by vertical market. Remarkably, most service execution
metrics are very similar across markets. Management consultants do the best job of on-time project
delivery as the majority of their projects are fixed price with clear value-added deliverables. SaaS PSOs
reported the worst on-time project delivery which directly contradicts their claims of “No more
software”. SaaS PSOs have the greatest opportunity to develop repeatable, packaged services with the
highest use of standardized service delivery methods (72.7%) yet their service execution metrics are
among the poorest. Clearly their thirst for market expansion has sidelined their quest for service
delivery excellence.
Table 121: Service Execution KPIs by Vertical Service Market
Key Performance Indicator (KPI) IT Cons. Soft-ware
Mgmt. Consult.
Arch./ Engr.
SaaS Mgd. Serv.
Hard. & Netwrk.
Average project staffing time (days) 10.58 11.89 10.37 8.56 9.53 9.23 11.35
Concurrent projects managed by PM 5.19 6.89 4.07 7.38 6.90 6.38 6.15
Average project staff (people) 5.08 4.54 4.17 4.13 4.38 5.65 5.54
Average project duration (months) 6.24 5.84 6.55 8.52 5.09 5.88 5.36
Projects delivered on-time 77.4% 71.4% 83.6% 76.8% 70.9% 72.7% 76.3%
Projects canceled 2.4% 2.7% 2.1% 3.9% 2.1% 2.2% 2.5%
Average project overrun 10.0% 12.3% 6.8% 8.9% 11.4% 11.5% 7.1%
Use of a standardized delivery meth. 67.5% 63.4% 61.6% 65.2% 72.7% 68.5% 50.0%
Effect. of resource management 3.63 3.51 3.77 3.43 3.49 3.93 3.62
Effect. of estimating and reviews 3.57 3.40 3.82 3.30 3.51 3.71 3.92
Effect. of change control 3.49 3.37 3.57 3.15 3.33 3.86 3.50
Effect. of project quality 3.63 3.38 3.85 3.55 3.33 3.71 3.54
Effect. of knowledge management 3.33 3.16 3.55 3.47 3.49 3.80 3.31
Source: Service Performance Insight, February 2016

2016 Professional Services Maturity™ Benchmark
© 2016 Service Performance Insight www.FinancialForce.com 156
Table 122: Service Execution KPIs by Vertical Service Market
Key Performance Indicator (KPI) R&D VAR Acct. Advert.
(Marcom) Staff. Other PS
Average project staffing time (days) 12.32 12.32 6.82 5.68 11.56 9.79
Concurrent projects managed by PM 4.96 4.35 7.00 5.79 4.63 6.58
Average project staff (people) 6.25 4.29 3.14 5.13 4.94 3.83
Average project duration (months) 6.86 5.36 2.91 4.04 6.39 7.54
Projects delivered on-time 70.7% 73.6% 70.5% 80.5% 74.4% 77.1%
Projects canceled 3.2% 1.9% 3.3% 2.5% 5.4% 2.7%
Average project overrun 11.7% 7.7% 14.8% 8.8% 11.6% 9.2%
Use of a standardized delivery meth. 47.1% 67.1% 60.9% 64.5% 65.0% 48.3%
Effect. of resource management 3.62 3.57 3.55 3.75 3.44 3.46
Effect. of estimating and reviews 3.75 3.64 3.27 3.33 3.22 3.69
Effect. of change control 3.85 3.79 3.36 3.17 3.00 3.38
Effect. of project quality 3.92 3.36 3.27 3.42 3.33 4.00
Effect. of knowledge management 3.69 3.07 3.36 3.08 3.22 3.38
Source: Service Performance Insight, February 2016
Project Staffing Time
As PSOs grow in size and the scope of projects
increases, project staffing complexity increases
exponentially. Now, many PSOs take days or weeks
to staff projects, waiting to find the “right”
resources. Average project staffing time in 2015 is
10.4 days, one day worse than the 9.4 days reported
in 2014. ESOs reported slightly longer staffing time
(11.1 days) than their independent counterparts
(10.1 days).
This key performance indicator is important because
it is an early warning sign of too much demand when
it takes longer and longer to assemble the right
team. It is a leading indicator of tightening resource
availability and can be a signal to start recruiting and
hiring. Rapid resource deployment can only be
attained with accurate visibility to current and future
demand along with the right mix of required resource skills, schedules and preferences.
Figure 57: Project Staffing Time (days)
Source: Service Performance Insight, February 2016

2016 Professional Services Maturity™ Benchmark
© 2016 Service Performance Insight www.FinancialForce.com 157
Concurrent Projects Managed by Project Manager
The number of concurrent projects managed by a project manager is a measurement of project
management efficiency and effectiveness. Larger more complex projects require more skilled,
dedicated project or program managers, while multiple, smaller concurrent projects tax the scheduling
and multi-tasking ability of even the most skilled project managers. It is also a good indicator of project
complexity and risk. Typically, firms use a 20-20 rule for project management, 20% of the overall cost of
the project is allocated to project management and a project manager is usually assigned at least 20% of
his/her time to a given project. Project management effort is most intense at the beginning and end of
the project.
Table 123 shows mixed results in
terms of utilization but revenue
per employee and net profit
improved with more projects
managed by each project
manager. The greater the
number of projects managed
shows a higher net profit,
meaning less overhead on a per
project basis. As shown in the
table, the percentage of the
workforce in dedicated project
management roles is declining in
favor of tasking either business consultants and/or technical consultants to perform this role in addition
to their own billability.
Project Staff Size
Based on technology
advancements in ease of use,
integration and configurability,
there has been a trend toward
shorter project durations with
smaller project team sizes
particularly for cloud
deployments. However, this
situation is changing as cloud
technologies have moved to the
enterprise, with greater
complexity and business process
change. Shorter, more iterative
Table 123: Impact – No. of Concurrent Projects Managed by Project Mgr.
Concurrent Projects Managed
Survey Percent
Billable Utilization
Revenue / Emp. (k)
EBITDA
1 - 2 20.8% 71.9% $155 13.8%
3 - 5 39.9% 69.7% 157 15.6%
6 - 8 18.9% 70.5% 147 14.5%
9 - 11 7.9% 70.4% 149 19.2%
Over 11 12.6% 70.6% 182 17.0%
Total/Average 100.0% 70.5% $157 15.5%
Source: Service Performance Insight, February 2016
Table 124: Impact – Project Team Size (people)
Project Team Size (people)
Survey Percent
Billable Utilization
Revenue / Billable Emp. (k)
Revenue / Emp. (k)
1 - 2 23.5% 68.0% $175 $150
3 - 5 49.3% 70.7% 209 161
6 - 8 17.7% 71.4% 200 157
9 - 11 4.9% 76.0% 164 140
Over 11 4.7% 74.6% 219 181
Total/Average 100.0% 70.6% $198 $157
Source: Service Performance Insight, February 2016

2016 Professional Services Maturity™ Benchmark
© 2016 Service Performance Insight www.FinancialForce.com 158
“agile” projects usually result in improved project value and ROI plus clients can cancel projects that fail
to meet objectives. Smaller, faster projects make it more difficult to plan and schedule resources,
increasing resource management complexity and bench time, which reduces overall profitability. This
situation creates more resource churn, and must be accounted for in terms of higher bill rates or greater
projected hour padding.
Table 124 shows that 72% of projects have five or fewer people. Overall firm profitability increases with
project team size because firms have greater visibility and lower resource churn with large project
teams. Today’s PSOs must learn to effectively manage a project portfolio of both short and longer
projects. Effective resource management, use of standard methods, tools and templates and high
quality project management are best practices regardless of project size.
Project Duration
The average project duration,
expressed in months, depicts the
effectiveness, or lack thereof, of
selling longer term projects. The
average project duration, like
average project staff size, is
important in that it shows the
average length and scale of
today’s projects. Longer projects
are easier to staff but are not
necessarily more profitable
because longer and larger
projects may involve significantly
more risk and complexity.
Table 125 shows 55% of project are six months or less in duration while 45% are longer than 6 months.
Obviously, revenue per project increases as the duration increases, and billable utilization also rises as
the duration increases. Interestingly, project duration does not seem to impact on-time project delivery
as both the shortest and longest duration projects reported the best on-time project delivery.
On-time Project Delivery
The percentage of projects delivered on time is a measurement that divides the number of projects
completed on-time by the total number of projects. This KPI is critical for billable service organizations,
because when it decreases, both profitability and client satisfaction decline. Unfortunately, on-time
project delivery rates tend to be less than 80% on average for PSOs.
In 2015 the percentage of projects delivered on-time declined to the lowest level in five years (76.1%).
Independents do a much better job of on-time project delivery (78%) than embedded PSOs (72%). On-
time delivery is an extremely important key performance indicator because it impacts both client
Table 125: Impact – Project Duration
Project Duration (months)
Survey Percent
Billable Utilization
On-time project delivery
Revenue per billable
consult. (k)
Under 1 7.0% 65.4% 75.4% $171
1 - 3 17.2% 67.8% 79.0% 184
3 - 6 31.1% 68.7% 74.4% 199
6 - 9 23.4% 72.4% 75.3% 212
9 - 12 11.5% 74.4% 75.8% 194
Over 12 9.8% 76.2% 78.5% 207
Total/Average 100.0% 70.6% 76.0% $198
Source: Service Performance Insight, February 2016
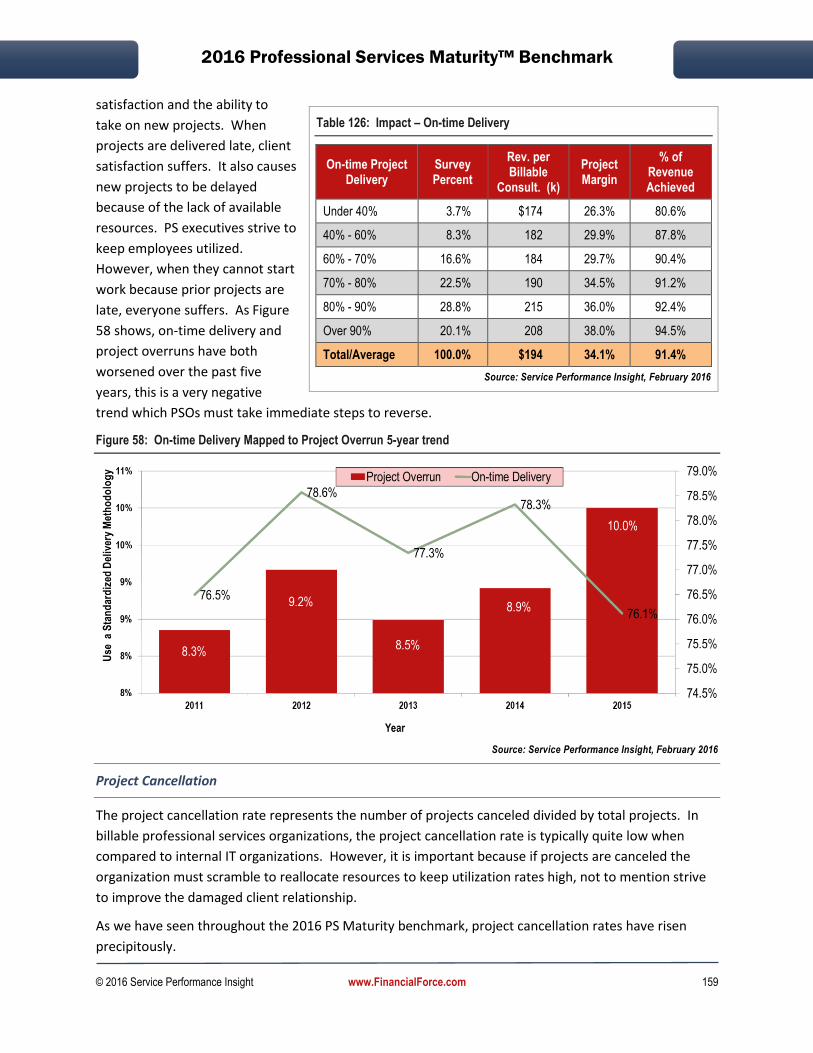
2016 Professional Services Maturity™ Benchmark
© 2016 Service Performance Insight www.FinancialForce.com 159
satisfaction and the ability to
take on new projects. When
projects are delivered late, client
satisfaction suffers. It also causes
new projects to be delayed
because of the lack of available
resources. PS executives strive to
keep employees utilized.
However, when they cannot start
work because prior projects are
late, everyone suffers. As Figure
58 shows, on-time delivery and
project overruns have both
worsened over the past five
years, this is a very negative
trend which PSOs must take immediate steps to reverse.
Figure 58: On-time Delivery Mapped to Project Overrun 5-year trend
Source: Service Performance Insight, February 2016
Project Cancellation
The project cancellation rate represents the number of projects canceled divided by total projects. In
billable professional services organizations, the project cancellation rate is typically quite low when
compared to internal IT organizations. However, it is important because if projects are canceled the
organization must scramble to reallocate resources to keep utilization rates high, not to mention strive
to improve the damaged client relationship.
As we have seen throughout the 2016 PS Maturity benchmark, project cancellation rates have risen
precipitously.
Table 126: Impact – On-time Delivery
On-time Project Delivery
Survey Percent
Rev. per Billable
Consult. (k)
Project Margin
% of Revenue Achieved
Under 40% 3.7% $174 26.3% 80.6%
40% - 60% 8.3% 182 29.9% 87.8%
60% - 70% 16.6% 184 29.7% 90.4%
70% - 80% 22.5% 190 34.5% 91.2%
80% - 90% 28.8% 215 36.0% 92.4%
Over 90% 20.1% 208 38.0% 94.5%
Total/Average 100.0% $194 34.1% 91.4%
Source: Service Performance Insight, February 2016
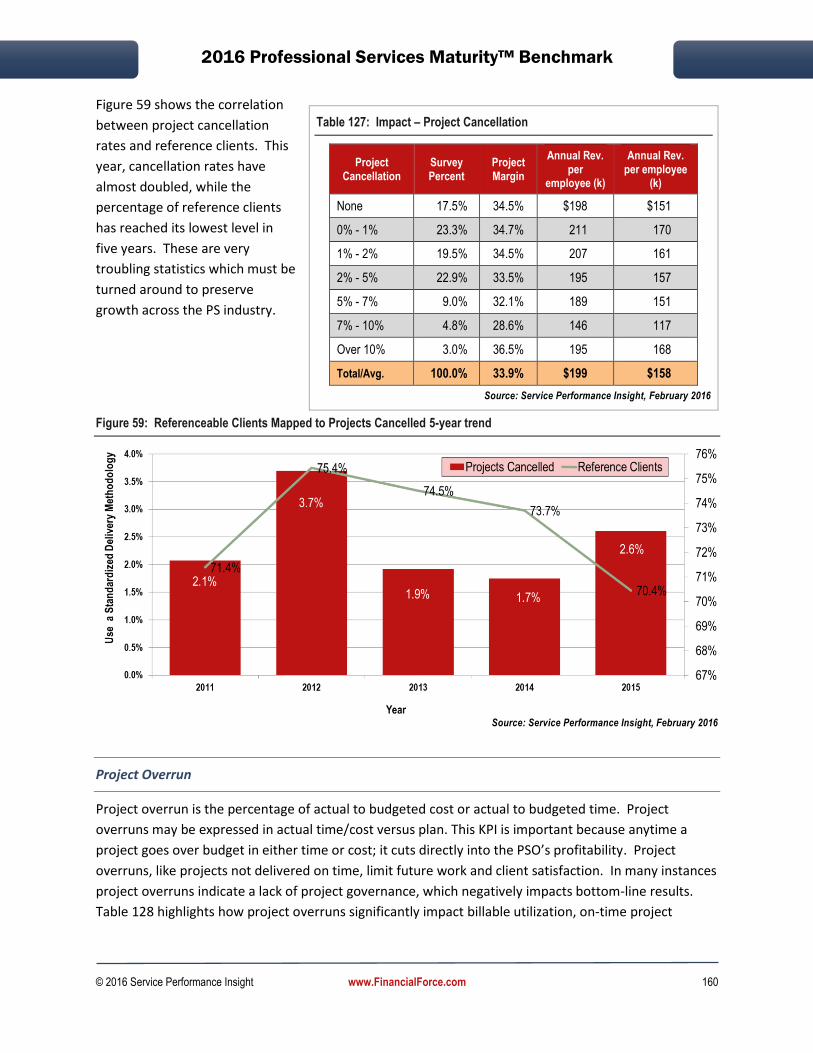
2016 Professional Services Maturity™ Benchmark
© 2016 Service Performance Insight www.FinancialForce.com 160
Figure 59 shows the correlation
between project cancellation
rates and reference clients. This
year, cancellation rates have
almost doubled, while the
percentage of reference clients
has reached its lowest level in
five years. These are very
troubling statistics which must be
turned around to preserve
growth across the PS industry.
Figure 59: Referenceable Clients Mapped to Projects Cancelled 5-year trend
Source: Service Performance Insight, February 2016
Project Overrun
Project overrun is the percentage of actual to budgeted cost or actual to budgeted time. Project
overruns may be expressed in actual time/cost versus plan. This KPI is important because anytime a
project goes over budget in either time or cost; it cuts directly into the PSO’s profitability. Project
overruns, like projects not delivered on time, limit future work and client satisfaction. In many instances
project overruns indicate a lack of project governance, which negatively impacts bottom-line results.
Table 128 highlights how project overruns significantly impact billable utilization, on-time project
Table 127: Impact – Project Cancellation
Project Cancellation
Survey Percent
Project Margin
Annual Rev. per
employee (k)
Annual Rev. per employee
(k)
None 17.5% 34.5% $198 $151
0% - 1% 23.3% 34.7% 211 170
1% - 2% 19.5% 34.5% 207 161
2% - 5% 22.9% 33.5% 195 157
5% - 7% 9.0% 32.1% 189 151
7% - 10% 4.8% 28.6% 146 117
Over 10% 3.0% 36.5% 195 168
Total/Avg. 100.0% 33.9% $199 $158
Source: Service Performance Insight, February 2016

2016 Professional Services Maturity™ Benchmark
© 2016 Service Performance Insight www.FinancialForce.com 161
completion and
the percentage
of work which
much be written-
off. Employee
morale is also
negatively
impacted when
projects go awry
as evidenced by
higher levels of
voluntary
attrition.
Standardized Delivery Methodology
SPI Research asked PSOs what percentage of the time they used a standard delivery methodology to
manage projects. Mature firms
invest significant time and
attention to methodology
development as a means to
standardize project processes;
define expectations and
institutionalize quality. Using a
standardized delivery
methodology is a critical
component of a services
productization strategy. It helps
improve project forecasting,
resource management, cost and
profitability. PSOs that can
accurately plan and execute services in a structured way, are not only more productive but also more
likely to deliver quality results. There is significant effort involved in developing, implementing and
adhering to standardized delivery methodologies, but the net impact for PSOs is beneficial.
Table 129 compares the percentage of time a standardized delivery methodology is used to other key
performance indicators for the PSOs answering the question. The table shows that PSOs using a
standardized delivery methodology have improved bid-win rates, higher utilization and are much more
likely to deliver projects on-time.
Table 128: Impact – Average Project Overrun
Avg. Project Overrun
Survey Percent
Billable Utilization
On-time Completion
% of Work Written Off
Voluntary Attrition
Never 5.9% 74.2% 81.6% 1.7% 7.8%
0% - 5% 29.4% 72.8% 84.0% 1.8% 6.4%
5% - 10% 28.4% 68.9% 78.3% 2.7% 7.6%
10% - 20% 25.2% 68.3% 69.2% 4.1% 8.0%
20% - 30% 7.3% 69.6% 66.7% 3.7% 9.8%
Over 30% 3.9% 56.1% 53.4% 8.3% 12.1%
Total/Average 100.0% 69.8% 76.1% 3.0% 7.7%
Source: Service Performance Insight, February 2016
Table 129: Impact – Standardized Delivery Methodology Use
Standardized Delivery
Methodology Use
Survey Percent
Bid-to-win ratio
Billable Utilization
On-time Project
Completion
Under 20% 10.9% 4.35 67.2% 66.4%
20% - 40% 10.1% 4.85 68.9% 70.2%
40% - 60% 14.7% 4.98 70.4% 69.9%
60% - 80% 23.6% 5.06 71.4% 76.9%
Over 80% 40.6% 5.06 71.3% 81.2%
Total/Average 100.0% 4.95 70.5% 75.8%
Source: Service Performance Insight, February 2016
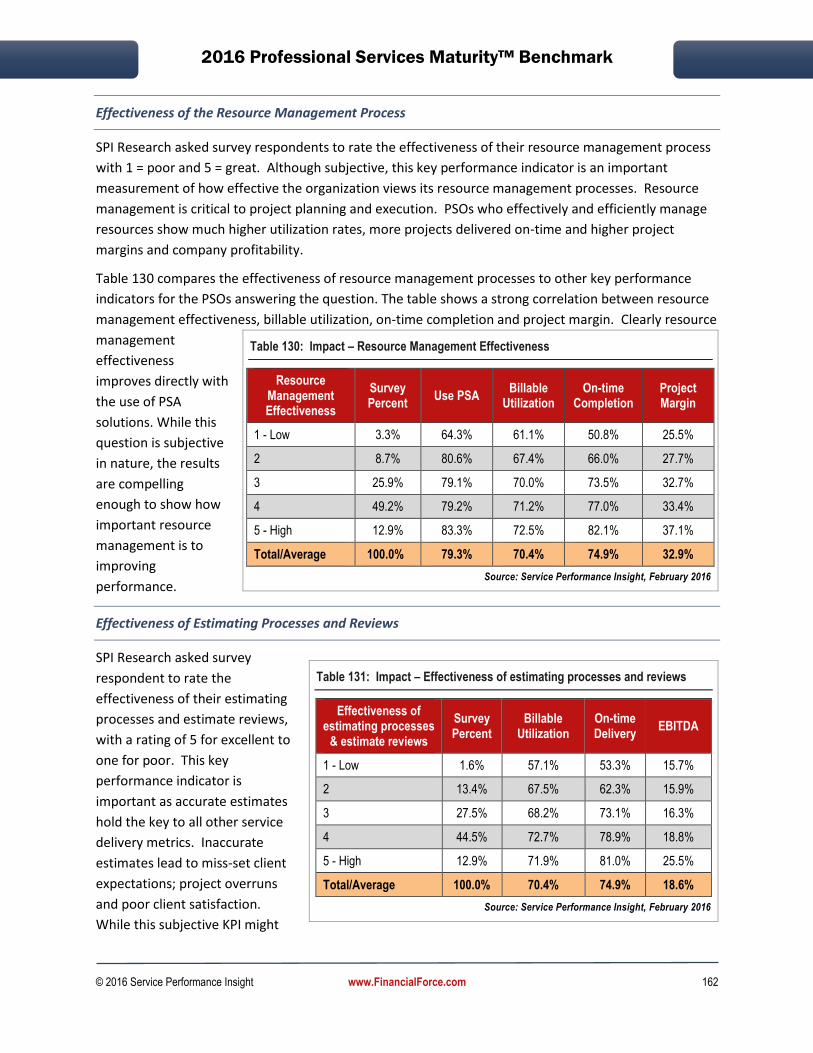
2016 Professional Services Maturity™ Benchmark
© 2016 Service Performance Insight www.FinancialForce.com 162
Effectiveness of the Resource Management Process
SPI Research asked survey respondents to rate the effectiveness of their resource management process
with 1 = poor and 5 = great. Although subjective, this key performance indicator is an important
measurement of how effective the organization views its resource management processes. Resource
management is critical to project planning and execution. PSOs who effectively and efficiently manage
resources show much higher utilization rates, more projects delivered on-time and higher project
margins and company profitability.
Table 130 compares the effectiveness of resource management processes to other key performance
indicators for the PSOs answering the question. The table shows a strong correlation between resource
management effectiveness, billable utilization, on-time completion and project margin. Clearly resource
management
effectiveness
improves directly with
the use of PSA
solutions. While this
question is subjective
in nature, the results
are compelling
enough to show how
important resource
management is to
improving
performance.
Effectiveness of Estimating Processes and Reviews
SPI Research asked survey
respondent to rate the
effectiveness of their estimating
processes and estimate reviews,
with a rating of 5 for excellent to
one for poor. This key
performance indicator is
important as accurate estimates
hold the key to all other service
delivery metrics. Inaccurate
estimates lead to miss-set client
expectations; project overruns
and poor client satisfaction.
While this subjective KPI might
Table 130: Impact – Resource Management Effectiveness
Resource Management Effectiveness
Survey Percent
Use PSA Billable
Utilization On-time
Completion Project Margin
1 - Low 3.3% 64.3% 61.1% 50.8% 25.5%
2 8.7% 80.6% 67.4% 66.0% 27.7%
3 25.9% 79.1% 70.0% 73.5% 32.7%
4 49.2% 79.2% 71.2% 77.0% 33.4%
5 - High 12.9% 83.3% 72.5% 82.1% 37.1%
Total/Average 100.0% 79.3% 70.4% 74.9% 32.9%
Source: Service Performance Insight, February 2016
Table 131: Impact – Effectiveness of estimating processes and reviews
Effectiveness of estimating processes
& estimate reviews
Survey Percent
Billable Utilization
On-time Delivery
EBITDA
1 - Low 1.6% 57.1% 53.3% 15.7%
2 13.4% 67.5% 62.3% 15.9%
3 27.5% 68.2% 73.1% 16.3%
4 44.5% 72.7% 78.9% 18.8%
5 - High 12.9% 71.9% 81.0% 25.5%
Total/Average 100.0% 70.4% 74.9% 18.6%
Source: Service Performance Insight, February 2016
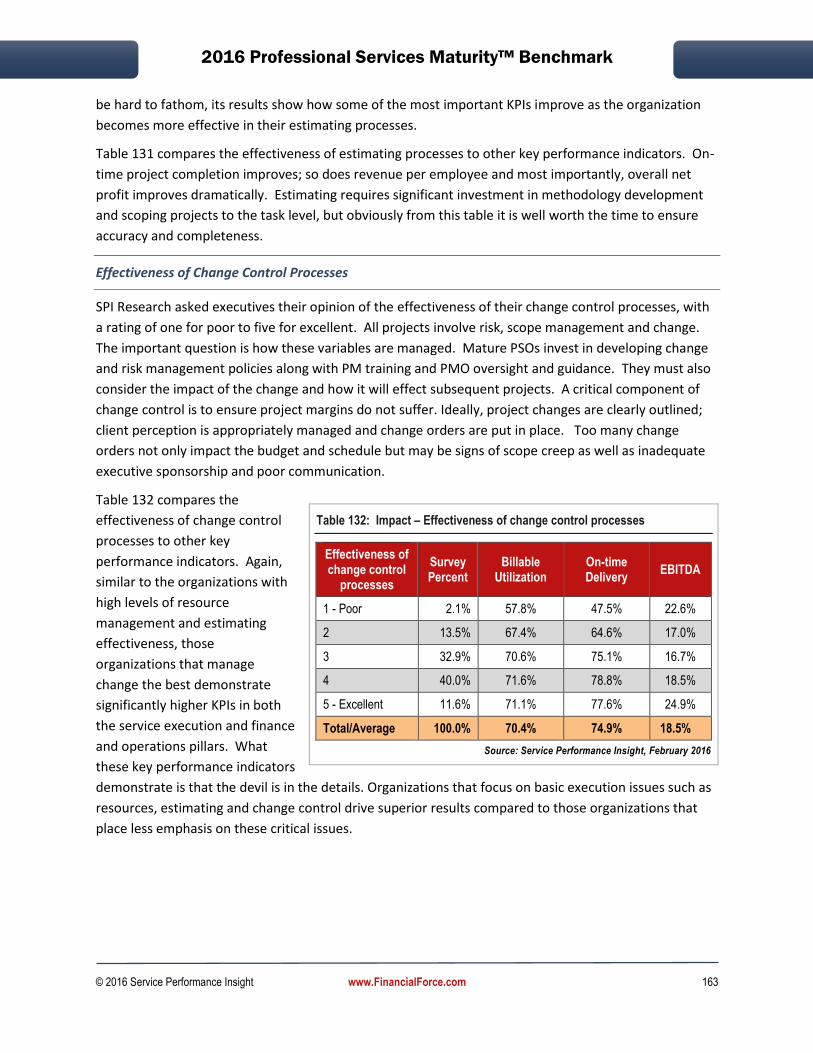
2016 Professional Services Maturity™ Benchmark
© 2016 Service Performance Insight www.FinancialForce.com 163
be hard to fathom, its results show how some of the most important KPIs improve as the organization
becomes more effective in their estimating processes.
Table 131 compares the effectiveness of estimating processes to other key performance indicators. On-
time project completion improves; so does revenue per employee and most importantly, overall net
profit improves dramatically. Estimating requires significant investment in methodology development
and scoping projects to the task level, but obviously from this table it is well worth the time to ensure
accuracy and completeness.
Effectiveness of Change Control Processes
SPI Research asked executives their opinion of the effectiveness of their change control processes, with
a rating of one for poor to five for excellent. All projects involve risk, scope management and change.
The important question is how these variables are managed. Mature PSOs invest in developing change
and risk management policies along with PM training and PMO oversight and guidance. They must also
consider the impact of the change and how it will effect subsequent projects. A critical component of
change control is to ensure project margins do not suffer. Ideally, project changes are clearly outlined;
client perception is appropriately managed and change orders are put in place. Too many change
orders not only impact the budget and schedule but may be signs of scope creep as well as inadequate
executive sponsorship and poor communication.
Table 132 compares the
effectiveness of change control
processes to other key
performance indicators. Again,
similar to the organizations with
high levels of resource
management and estimating
effectiveness, those
organizations that manage
change the best demonstrate
significantly higher KPIs in both
the service execution and finance
and operations pillars. What
these key performance indicators
demonstrate is that the devil is in the details. Organizations that focus on basic execution issues such as
resources, estimating and change control drive superior results compared to those organizations that
place less emphasis on these critical issues.
Table 132: Impact – Effectiveness of change control processes
Effectiveness of change control
processes
Survey Percent
Billable Utilization
On-time Delivery
EBITDA
1 - Poor 2.1% 57.8% 47.5% 22.6%
2 13.5% 67.4% 64.6% 17.0%
3 32.9% 70.6% 75.1% 16.7%
4 40.0% 71.6% 78.8% 18.5%
5 - Excellent 11.6% 71.1% 77.6% 24.9%
Total/Average 100.0% 70.4% 74.9% 18.5%
Source: Service Performance Insight, February 2016

2016 Professional Services Maturity™ Benchmark
© 2016 Service Performance Insight www.FinancialForce.com 164
Effectiveness of Project Quality Processes
SPI Research asked executives their
opinion of the effectiveness of their
project quality processes, with a
rating of one for poor to five for
excellent. Quality must be a core
organizational attribute that is built
into projects and project
management processes. Most
leading professional services
organizations build in quality checks
and balances to assure the work is
done correctly.
As more PSOs work to productize
their services offerings, they must incorporate quality processes and procedures, as well as metrics. High
quality service delivery underlies client satisfaction and drives referrals and repeat business. Table 133
shows results improve across the board as quality processes are implemented.
Effectiveness of Knowledge Management Processes
SPI Research asked benchmark respondents their opinion of the effectiveness of their knowledge
management processes, with a rating of one for poor to five for excellent (Table 134). Knowledge
management has become a critical component of service execution. Best practices and other quality-
driven initiatives are built-in into project delivery. Assuring the right information is available to all those
who need it is paramount to
success. Over the past five years’
knowledge management,
especially through the use of
social media and collaboration
tools, has moved to the forefront
of service execution. Team
members now work more
collaboratively to achieve project
objectives. The table shows that
effectiveness of Knowledge
Management processes has a
positive impact on both service
delivery and financial results.
Table 133: Impact – Effectiveness of Project Quality Processes
Effectiveness of Project Quality
Processes
Survey Percent
On-time Completion
Revenue/ Consult.
(k)
Revenue/ Emp. (k)
1 - Poor 1.9% 54.3% $132 $133
2 12.7% 63.2% 188 149
3 24.7% 73.1% 185 153
4 46.1% 76.8% 195 154
5 - Excellent 14.6% 84.8% 228 179
Total/Average 100.0% 74.9% $195 $156
Source: Service Performance Insight, February 2016
Table 134: Impact – Effectiveness of Knowledge Management processes
Effectiveness of Knowledge Mgmt.
processes
Survey Percent
Billable Utilization
On-time Completion
EBITDA
1 - Poor 3.1% 59.2% 57.5% 12.1%
2 16.5% 70.4% 66.7% 19.4%
3 28.1% 68.7% 74.0% 14.8%
4 38.7% 71.4% 78.1% 20.1%
5 - Excellent 13.7% 73.6% 82.0% 16.3%
Total/Average 100.0% 70.4% 75.0% 17.7%
Source: Service Performance Insight, February 2016

2016 Professional Services Maturity™ Benchmark
© 2016 Service Performance Insight www.FinancialForce.com 165
10. Finance and Operations Pillar
The Finance and Operations pillar represents the realm of the CFO for
large PS organizations, and is an intrinsic part of the role of the chief
service executive for all PS organizations, regardless of size. In this
service performance pillar SPI Research examines 38 key performance
measurements for revenue, margin and operating expense. We have
added detailed profit and loss statements and expense ratios by
organization size, geography and vertical.
Table 135 highlights attributes of the Finance and Operations pillar as
the organization matures.
Table 135: Finance and Operations Performance Pillar Maturity
Level 1 Initiated
Level 2 Piloted
Level 3 Deployed
Level 4 Institutionalized
Level 5 Optimized
Fin
ance
an
d O
pe
rati
on
s
The PSO has been created but is not yet profitable. Rudimentary time & expense capture. Limited financial visibility and control. Unpredictable financial performance. Rudimentary contract management. Manual systems and processes.
5 to 20% margin. PS becoming a profit center but still immature finance and operating processes. Investment in ERP and PSA to provide financial visibility. May not have real-time visibility or BI. Standard Library of Contracts and Statements of Work.
20 to 30% margin. PS operates as a tightly managed P&L. Standard methods for resource mgmt., time & expense mgmt., cost control & billing. In depth knowledge of all costs at the employee, sub-contractor & project level. Processes in place for contract management, legal and pricing decisions.
PS generates > 20% of overall company revenue & contributes > 30% margin. Well-developed finance and operations processes and controls. Systems have been implemented for CRM, PSA, ERP and BI. IT integration and real-time visibility. Systems have been implemented for contract management, legal and pricing decisions.
> 30% margin. Continuous improvement and enhancement.
High profit. Integrated systems. Real-time visibility. Global with disciplined process controls and optimization. Completely integrated financial, CRM, resource management, contracts and pricing systems, processes and controls.
Source: Service Performance Insight, February 2016
As shown in Table 136, in 2015 almost all financial metrics trended down. The only major area of
improvement was in larger project sizes, growing from an average of $189K per project in 2014 to
$225K in 2015. Financial metrics declined significantly in several important areas, particularly, revenue
per employee, which declined from $167K in 2014 to $157K in 2015. Given the scope of this
benchmark, (representing 350,000 PS employees) this decline represents as much as $3.5 billion in lost
revenue. Other KPIs which declined significantly include project margins for both time and materials
and fixed price contracts as well as subcontractor margins.
Falling leading indicators portend rough sledding in 2016. On top of the dramatic decline in sales
pipelines outlined in the CRM chapter, project backlog declined significantly from a relatively healthy
48.4% of quarter-starting forecast in 2014 to only 40.4% in 2015. This is the lowest level of backlog we
have seen since the great recession of 2009 when backlog declined to 41.9%.
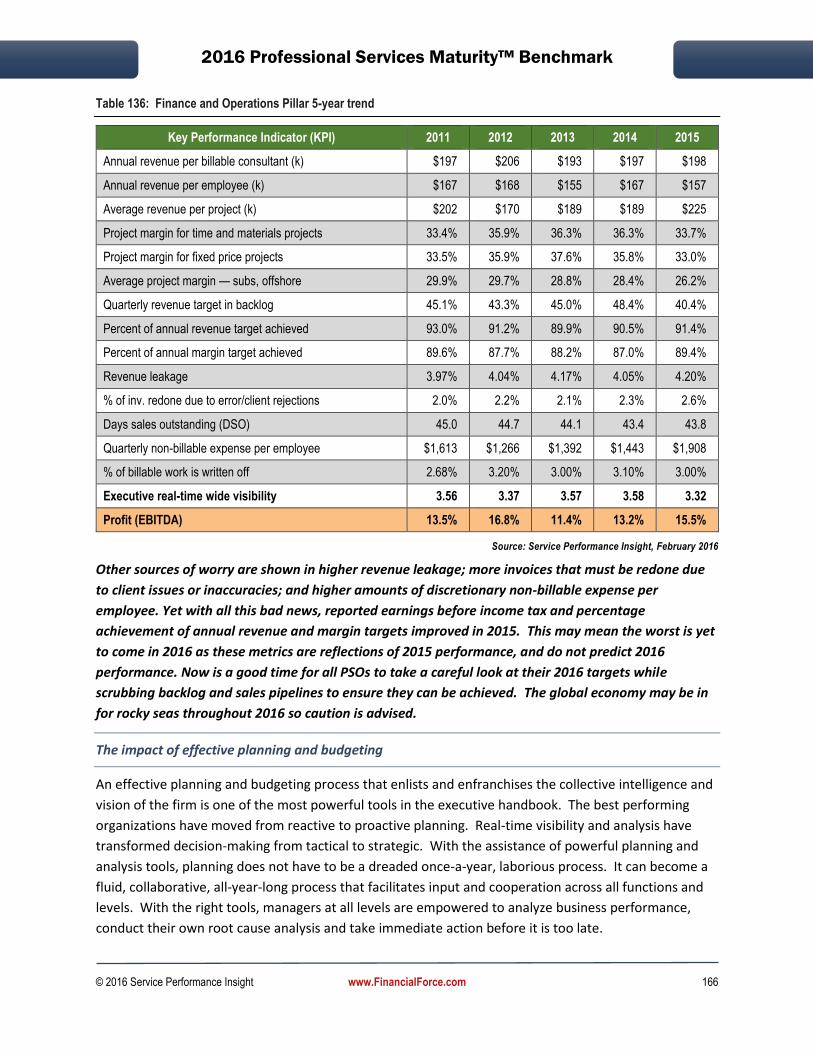
2016 Professional Services Maturity™ Benchmark
© 2016 Service Performance Insight www.FinancialForce.com 166
Table 136: Finance and Operations Pillar 5-year trend
Key Performance Indicator (KPI) 2011 2012 2013 2014 2015
Annual revenue per billable consultant (k) $197 $206 $193 $197 $198
Annual revenue per employee (k) $167 $168 $155 $167 $157
Average revenue per project (k) $202 $170 $189 $189 $225
Project margin for time and materials projects 33.4% 35.9% 36.3% 36.3% 33.7%
Project margin for fixed price projects 33.5% 35.9% 37.6% 35.8% 33.0%
Average project margin — subs, offshore 29.9% 29.7% 28.8% 28.4% 26.2%
Quarterly revenue target in backlog 45.1% 43.3% 45.0% 48.4% 40.4%
Percent of annual revenue target achieved 93.0% 91.2% 89.9% 90.5% 91.4%
Percent of annual margin target achieved 89.6% 87.7% 88.2% 87.0% 89.4%
Revenue leakage 3.97% 4.04% 4.17% 4.05% 4.20%
% of inv. redone due to error/client rejections 2.0% 2.2% 2.1% 2.3% 2.6%
Days sales outstanding (DSO) 45.0 44.7 44.1 43.4 43.8
Quarterly non-billable expense per employee $1,613 $1,266 $1,392 $1,443 $1,908
% of billable work is written off 2.68% 3.20% 3.00% 3.10% 3.00%
Executive real-time wide visibility 3.56 3.37 3.57 3.58 3.32
Profit (EBITDA) 13.5% 16.8% 11.4% 13.2% 15.5%
Source: Service Performance Insight, February 2016
Other sources of worry are shown in higher revenue leakage; more invoices that must be redone due
to client issues or inaccuracies; and higher amounts of discretionary non-billable expense per
employee. Yet with all this bad news, reported earnings before income tax and percentage
achievement of annual revenue and margin targets improved in 2015. This may mean the worst is yet
to come in 2016 as these metrics are reflections of 2015 performance, and do not predict 2016
performance. Now is a good time for all PSOs to take a careful look at their 2016 targets while
scrubbing backlog and sales pipelines to ensure they can be achieved. The global economy may be in
for rocky seas throughout 2016 so caution is advised.
The impact of effective planning and budgeting
An effective planning and budgeting process that enlists and enfranchises the collective intelligence and
vision of the firm is one of the most powerful tools in the executive handbook. The best performing
organizations have moved from reactive to proactive planning. Real-time visibility and analysis have
transformed decision-making from tactical to strategic. With the assistance of powerful planning and
analysis tools, planning does not have to be a dreaded once-a-year, laborious process. It can become a
fluid, collaborative, all-year-long process that facilitates input and cooperation across all functions and
levels. With the right tools, managers at all levels are empowered to analyze business performance,
conduct their own root cause analysis and take immediate action before it is too late.
2016 Professional Services Maturity™ Benchmark
© 2016 Service Performance Insight www.FinancialForce.com 167
Each year organizations should devote time to reenergizing their vision and strategies as they plan the
upcoming year’s business. The business planning process can be a valuable catalyst for growth and
profit. Enlightened firms use the planning process to sharpen vision; align leadership; reevaluate and
improve go to market and sales strategies; discuss new and better ways to motivate the workforce and
streamline processes and systems.
For many people-based organizations, annual planning has become an empty ritual. Firms often waste
too much time and energy reliving past failures instead of exploring new avenues for growth. Done
right, instead of a necessary evil, business planning can open up fresh new ideas and facilitate playing to
strengths rather than shoring up weaknesses. The best-of-the-best project and service-focused
organizations each year find new and better ways to do the things they love to do – and are especially
good at – while minimizing the hassles and tedium of repeating the things that hold them back or waste
precious time and resources.
Before embarking on a planning and budgeting exercise, SPI has explored some of the reasons why
organizations fail to deliver their desired results. Our experience has shown that when things go wrong,
it most often starts at the top and then cascades downward throughout the organization, ultimately
showing up in lackluster financial performance with poor predictability. Eliminating the root causes of
dysfunction and inefficiency goes a long way toward driving organizational success. Common issues:
Unclear strategy – lack of clarity around target markets, target clients and why we win. Inability to capitalize on market opportunities due to lack of alignment, lack of employee engagement or leadership and cultural issues. No leverage to drive repeat sales, limited competitive differentiation, poor sales and marketing execution.
Lack of alignment – unclear service charters – particularly a problem for embedded service organizations – with conflict between driving revenue and margin versus helping the overall company achieve its objectives of market expansion and client delight.
Silos – exist in all companies – they usually occur in the choppy waters between groups or functions where responsibility and accountability are blurry. A classic example… who is responsible for driving new service revenues – is it sales or delivery? How can disconnected processes and poor handoffs be improved?
Reactive not proactive – planning is seen as a necessary evil with finance-imposed tops down targets combined with grudging business unit participation. The planning process itself is either overly burdensome with endless rounds of manual spreadsheet inputs or chaotic and reactive. Managers have no ability to analyze and recalibrate to take advantage of changing market conditions leading to missed targets and a demoralized workforce.
Rearview mirror instead of focused on best growth alternatives – because the planning process is reactive and manual, business unit leaders and finance executives must rely on past business performance rather than being able to spot trends and take advantage of them in real-time. Business units are often working from stale data from disparate systems and tools.
Poor financial performance – All of the above factors – lack of strategic clarity, poor alignment, silos, and of out-of-date information contribute to reactive, rearview mirror business forecasting and planning. The net result is revenue and margin below targets, poor forecasting accuracy, unpredictability and high levels of risk.

2016 Professional Services Maturity™ Benchmark
© 2016 Service Performance Insight www.FinancialForce.com 168
The Planning and Budgeting Maturity Model
Service Performance Insight has extended its industry-leading Professional Service Maturity Model™ to
focus on advancing maturity in planning and budgeting. The Planning and Budgeting Maturity Model™
provides a view of the transformational power of shifting planning from reactive, heroic and painful to
become a core competence leading to renewal and growth (Table 137).
Table 137: Planning and Budgeting Maturity Model™
Level 1 Level 2 Level 3 Level 4 Level 5
Ad Hoc, Opportunistic,
Heroic and Reactive
Piloted, Experimental,
Pockets of Excellence
Deployed, Basics in Place for All Key
Elements
Institutionalized, in the Company DNA /
Fabric
Visionary, Agile, Innovative,
Continuous Renewal and Improvement
People
Budgeting and planning is considered a necessary evil. Tops down, reactive, silo’ed. Business ignores targets, no feedback processes or ability to modify based on changes. Limited commitment and accountability.
Starting to see the need to incorporate business units in planning and budgeting. Finance-driven. Discrete functions starting to collaborate, participate and take accountability for planning.
Starting to align corporate vision and strategy to business planning. Goals and measurements in alignment. Real-time measurements and controls. Business is accountable for planning, goal setting and achievement.
Budgeting and planning becomes a core competence – driving critical business decisions, goals and growth. Collaborative, business-driven. Business is committed to planning and achievement.
Budgeting and planning is fully automated & reflects & capitalizes on changing market dynamics. Fluid, flexible, collaborative based on fact-based decisions. Able to spot trends in real-time. Business is enfranchised.
Processes
Planning is a painful nuisance. No consistent budgeting and planning processes. Ad hoc, reactive.
Planning is reactive but tolerated. Starting to align business processes, systems, measurements and controls. Piloting streamlined processes. Pockets of excellence
Planning has become a powerful catalyst to drive alignment and growth. Proactive, integrated planning process incorporates & consolidates real-time information.
Planning process has become core to driving strategy, alignment and collaboration across the business. Optimized systems, tools, processes.
Fully automated global planning and budgeting process, systems and tools continually monitor, measure and take advantage of shifting business priorities.
Systems
Budgeting and planning by spreadsheet. Manual, inconsistent, error prone. Limited investment in systems and tools. Reactive, rearview mirror.
Starting to invest in systems for major processes – ERP, CRM and PSA. Piloting CPM applications. IT and Finance-centric.
Fully integrated information infrastructure including CPM applications for budgeting, planning and performance management. Business centric.
Fully integrated and optimized information infrastructure with powerful, easy-to-use management tools. Mobile, agile.
Global, integrated, optimized information infrastructure provides high levels of management visibility and control. Able to capitalize on emerging trends. Optimized.
Source: Service Performance Insight, February 2016
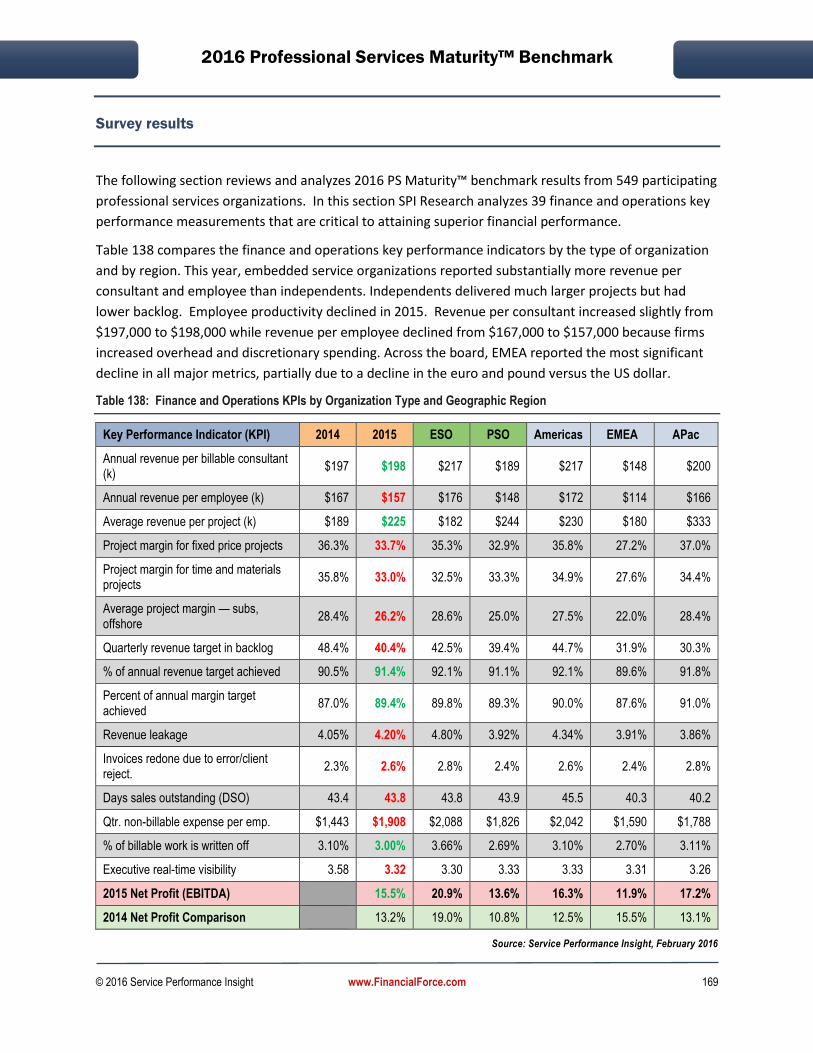
2016 Professional Services Maturity™ Benchmark
© 2016 Service Performance Insight www.FinancialForce.com 169
Survey results
The following section reviews and analyzes 2016 PS Maturity™ benchmark results from 549 participating
professional services organizations. In this section SPI Research analyzes 39 finance and operations key
performance measurements that are critical to attaining superior financial performance.
Table 138 compares the finance and operations key performance indicators by the type of organization
and by region. This year, embedded service organizations reported substantially more revenue per
consultant and employee than independents. Independents delivered much larger projects but had
lower backlog. Employee productivity declined in 2015. Revenue per consultant increased slightly from
$197,000 to $198,000 while revenue per employee declined from $167,000 to $157,000 because firms
increased overhead and discretionary spending. Across the board, EMEA reported the most significant
decline in all major metrics, partially due to a decline in the euro and pound versus the US dollar.
Table 138: Finance and Operations KPIs by Organization Type and Geographic Region
Key Performance Indicator (KPI) 2014 2015 ESO PSO Americas EMEA APac
Annual revenue per billable consultant (k)
$197 $198 $217 $189 $217 $148 $200
Annual revenue per employee (k) $167 $157 $176 $148 $172 $114 $166
Average revenue per project (k) $189 $225 $182 $244 $230 $180 $333
Project margin for fixed price projects 36.3% 33.7% 35.3% 32.9% 35.8% 27.2% 37.0%
Project margin for time and materials projects
35.8% 33.0% 32.5% 33.3% 34.9% 27.6% 34.4%
Average project margin — subs, offshore
28.4% 26.2% 28.6% 25.0% 27.5% 22.0% 28.4%
Quarterly revenue target in backlog 48.4% 40.4% 42.5% 39.4% 44.7% 31.9% 30.3%
% of annual revenue target achieved 90.5% 91.4% 92.1% 91.1% 92.1% 89.6% 91.8%
Percent of annual margin target achieved
87.0% 89.4% 89.8% 89.3% 90.0% 87.6% 91.0%
Revenue leakage 4.05% 4.20% 4.80% 3.92% 4.34% 3.91% 3.86%
Invoices redone due to error/client reject.
2.3% 2.6% 2.8% 2.4% 2.6% 2.4% 2.8%
Days sales outstanding (DSO) 43.4 43.8 43.8 43.9 45.5 40.3 40.2
Qtr. non-billable expense per emp. $1,443 $1,908 $2,088 $1,826 $2,042 $1,590 $1,788
% of billable work is written off 3.10% 3.00% 3.66% 2.69% 3.10% 2.70% 3.11%
Executive real-time visibility 3.58 3.32 3.30 3.33 3.33 3.31 3.26
2015 Net Profit (EBITDA) 15.5% 20.9% 13.6% 16.3% 11.9% 17.2%
2014 Net Profit Comparison 13.2% 19.0% 10.8% 12.5% 15.5% 13.1%
Source: Service Performance Insight, February 2016

2016 Professional Services Maturity™ Benchmark
© 2016 Service Performance Insight www.FinancialForce.com 170
Based on more than twice as many completed surveys in 2015 compared to 2014, average net profit
(Earnings before Interest, Taxes, Depreciation and Amortization) improved this year to 15.5% compared
to 13.2% in 2014. Embedded PSOs saw net profit improve slightly to 20.9% compared to 19% in 2014.
Independents also saw net profit increase to 13.6% compared to 10.8% in 2014. By geography, profit
was up in the America’s and APAC but down appreciably in EMEA to 11.9% in 2015 compared to 15.5%
in 2014.
Backlog is always a very important KPI. Backlog declined across the board from 48.4% to 40.4%, a sure
sign of stormy seas ahead. The Americas reported the strongest backlog of 44.7% down from 50% in
2014. Firms in EMEA were hit especially hard with a downturn in business. EMEA backlog declined to
31.9% in 2015, down from 46.9% in 2014. Backlog declined in APac for the third year in a row from
45.8% in 2013 to 41.3% in 2014 and now 30.3% in 2015. These alarmingly low levels of backlog are an
important predictor of slower growth in 2016. SPI Research recommends firms maintain at least a 50%
quarter-beginning backlog. 2016 is getting off to an ominous start with more bad news daily.
Non-billable expense per employee soared in 2015. Excessive non-billable expense is a danger signal
directly related to poor cost management and ineffective business development processes. Embedded
PSOs increased non-billable expense per employee; they spent $1,671 per consultant per quarter in
2014 compared to $2,088 in 2015, a jump of 25%! Independents reported an increase in non-billable
expense from $1,173 in 2013 to $1,344 in 2014 and now $1,826 in 2015; a whopping 36% increase!
Higher discretionary spending will directly impact bottom-line net profit.
Table 139 compares finance and operations KPI’s by organization size. Mid-size and larger firms
reported net profit improvement while profit declined in small firms. Project size increased with
organization size with organizations over 700 consultants delivering the largest average projects at
$315,000. Midsize organizations from 31 to 300 consultants reported the strongest backlog at 43%.
Larger firms had a much higher backlog than the smaller firms providing them greater financial stability.
Smaller organizations did the best job of containing non-billable expense per employee. One area of
concern as organizations grow in size is the time to collect payment (days sales outstanding (DSO)). The
largest firms had a DSO 50% higher than that of the smaller firms, which negatively impacts cash flow,
and profitability. The largest firms reported high non-billable expense for their employees.
Table 139: Finance and Operations KPIs by Organization Size
Key Performance Indicator (KPI) Under 10 10 - 30 31 – 100 101 - 300 301 - 700 Over 700
Annual revenue per billable consultant (k) $162 $186 $214 $199 $206 $199
Annual revenue per employee (k) $129 $146 $166 $161 $164 $164
Average revenue per project (k) $102 $113 $228 $279 $282 $315
Project margin for fixed price projects 29.6% 31.2% 35.8% 33.7% 34.3% 34.9%
Project margin for time & materials projects 31.0% 30.8% 35.7% 31.6% 34.3% 33.1%
Average project margin — subs, offshore 21.2% 25.1% 28.4% 23.7% 25.2% 31.4%
Quarterly revenue target in backlog 29.3% 38.1% 43.5% 42.5% 39.0% 41.9%
% of annual revenue target achieved 91.0% 87.0% 91.2% 91.8% 92.8% 96.0%
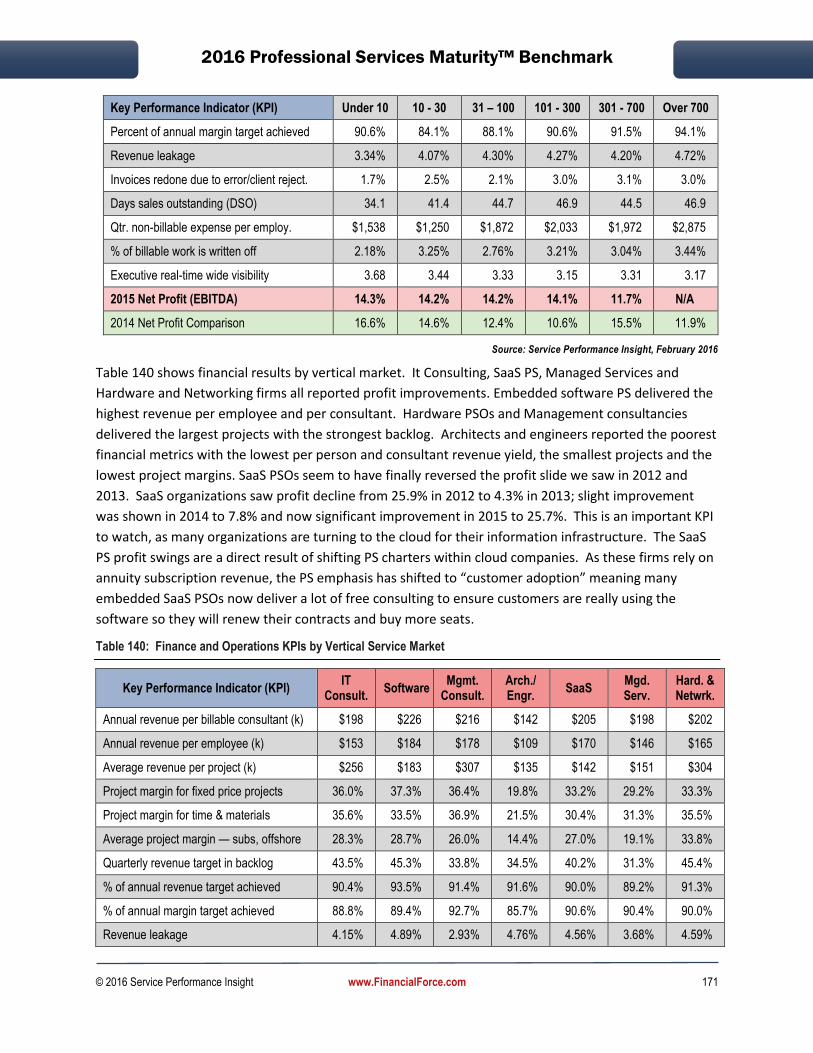
2016 Professional Services Maturity™ Benchmark
© 2016 Service Performance Insight www.FinancialForce.com 171
Key Performance Indicator (KPI) Under 10 10 - 30 31 – 100 101 - 300 301 - 700 Over 700
Percent of annual margin target achieved 90.6% 84.1% 88.1% 90.6% 91.5% 94.1%
Revenue leakage 3.34% 4.07% 4.30% 4.27% 4.20% 4.72%
Invoices redone due to error/client reject. 1.7% 2.5% 2.1% 3.0% 3.1% 3.0%
Days sales outstanding (DSO) 34.1 41.4 44.7 46.9 44.5 46.9
Qtr. non-billable expense per employ. $1,538 $1,250 $1,872 $2,033 $1,972 $2,875
% of billable work is written off 2.18% 3.25% 2.76% 3.21% 3.04% 3.44%
Executive real-time wide visibility 3.68 3.44 3.33 3.15 3.31 3.17
2015 Net Profit (EBITDA) 14.3% 14.2% 14.2% 14.1% 11.7% N/A
2014 Net Profit Comparison 16.6% 14.6% 12.4% 10.6% 15.5% 11.9%
Source: Service Performance Insight, February 2016
Table 140 shows financial results by vertical market. It Consulting, SaaS PS, Managed Services and
Hardware and Networking firms all reported profit improvements. Embedded software PS delivered the
highest revenue per employee and per consultant. Hardware PSOs and Management consultancies
delivered the largest projects with the strongest backlog. Architects and engineers reported the poorest
financial metrics with the lowest per person and consultant revenue yield, the smallest projects and the
lowest project margins. SaaS PSOs seem to have finally reversed the profit slide we saw in 2012 and
2013. SaaS organizations saw profit decline from 25.9% in 2012 to 4.3% in 2013; slight improvement
was shown in 2014 to 7.8% and now significant improvement in 2015 to 25.7%. This is an important KPI
to watch, as many organizations are turning to the cloud for their information infrastructure. The SaaS
PS profit swings are a direct result of shifting PS charters within cloud companies. As these firms rely on
annuity subscription revenue, the PS emphasis has shifted to “customer adoption” meaning many
embedded SaaS PSOs now deliver a lot of free consulting to ensure customers are really using the
software so they will renew their contracts and buy more seats.
Table 140: Finance and Operations KPIs by Vertical Service Market
Key Performance Indicator (KPI) IT
Consult. Software
Mgmt. Consult.
Arch./ Engr.
SaaS Mgd. Serv.
Hard. & Netwrk.
Annual revenue per billable consultant (k) $198 $226 $216 $142 $205 $198 $202
Annual revenue per employee (k) $153 $184 $178 $109 $170 $146 $165
Average revenue per project (k) $256 $183 $307 $135 $142 $151 $304
Project margin for fixed price projects 36.0% 37.3% 36.4% 19.8% 33.2% 29.2% 33.3%
Project margin for time & materials 35.6% 33.5% 36.9% 21.5% 30.4% 31.3% 35.5%
Average project margin — subs, offshore 28.3% 28.7% 26.0% 14.4% 27.0% 19.1% 33.8%
Quarterly revenue target in backlog 43.5% 45.3% 33.8% 34.5% 40.2% 31.3% 45.4%
% of annual revenue target achieved 90.4% 93.5% 91.4% 91.6% 90.0% 89.2% 91.3%
% of annual margin target achieved 88.8% 89.4% 92.7% 85.7% 90.6% 90.4% 90.0%
Revenue leakage 4.15% 4.89% 2.93% 4.76% 4.56% 3.68% 4.59%

2016 Professional Services Maturity™ Benchmark
© 2016 Service Performance Insight www.FinancialForce.com 172
Key Performance Indicator (KPI) IT
Consult. Software
Mgmt. Consult.
Arch./ Engr.
SaaS Mgd. Serv.
Hard. & Netwrk.
Invoices redone due to error/client reject. 2.5% 2.7% 1.8% 2.9% 3.2% 3.8% 1.3%
Days sales outstanding (DSO) 42.5 49.0 40.6 49.4 39.5 34.6 35.0
Qtr. non-billable expense per employee $1,842 $2,474 $1,886 $1,826 $1,820 $1,417 $2,100
% of billable work is written off 3.02% 4.15% 1.78% 3.73% 3.21% 2.83% 3.23%
Executive real-time wide visibility (1 to 5) 3.39 3.30 3.66 3.02 3.46 3.27 2.42
2015 Net Profit (EBITDA) 13.3% 19.9% 12.2% 11.2% 25.7% 15.6% 32.3%
2014 Net Profit Comparison 10.2% 20.5% 14.0% 12.3% 7.8% N/A 24.5%
Source: Service Performance Insight, February 2016
Table 141: Finance and Operations KPIs by Vertical Service Market
Key Performance Indicator (KPI) R&D VAR Acct. Advert.
(Marcom) Staff. Other PS
Annual revenue per billable consultant (k) $188 $232 $150 $155 $153 $184
Annual revenue per employee (k) $155 $184 $136 $128 $97 $143
Average revenue per project (k) $537 $214 $93 $68 $150 $147
Project margin for fixed price projects 34.6% 36.1% 32.7% 32.2% 21.9% 28.2%
Project margin for time & materials proj. 31.2% 31.1% 30.9% 39.0% 25.0% 26.8%
Average project margin — subs, offshore 25.8% 35.4% 18.3% 27.2% 14.3% 23.5%
Quarterly revenue target in backlog 47.3% 39.2% 19.5% 42.2% 37.5% 34.5%
% of annual revenue target achieved 88.9% 92.1% 96.4% 91.5% 93.1% 93.2%
Percent of annual margin target achieved 92.5% 89.6% 97.3% 81.5% 88.1% 88.0%
Revenue leakage 5.00% 5.93% 2.25% 2.55% 3.69% 3.65%
Invoices redone due to error/client reject. 3.1% 3.1% 1.5% 1.5% 6.2% 2.2%
Days sales outstanding (DSO) 52.7 41.9 50.5 43.5 48.6 38.6
Qtr. non-billable expense per employ. $1,625 $1,038 $2,023 $1,125 $1,969 $1,864
% of billable work is written off 1.33% 3.04% 1.45% 2.90% 1.88% 1.35%
Executive real-time wide visibility 2.77 3.64 3.33 3.30 2.63 2.91
2015 Net Profit (EBITDA) N/A 20.1% 20.9% 14.7% 3.4% 14.4%
2014 Net Profit Comparison N/A N/A N/A 1.7% N/A N/A
Source: Service Performance Insight, February 2016
Bill Rates (taken from SPI’s 2015 Global Pricing Report)
SPI's PS Global Pricing Report is a large and comprehensive PS pricing study based on pricing information
provided by 140 organizations representing almost 12,000 consultants worldwide. The study provides

2016 Professional Services Maturity™ Benchmark
© 2016 Service Performance Insight www.FinancialForce.com 173
analysis of list price and realized bill rates across a broad range of PS verticals, geographies and job
levels. It provides analysis of pricing strategies: time and materials; fixed price and shared risk with an
unprecedented view of PS workforce distribution and composition by industry segment.
Table 142 provides a glimpse of the pricing information provided in the 2015 PS Global Pricing Report.
Based on the weighted average across all job categories, the typical PS organization in this study was
comprised of approximately 104 billable people. Management comprises 13% of the workforce, project
management 16%, business consultants 29% and technical consultants 42% respectively. The majority
of the work, billable hours and revenue is produced by business consultants and technical consultants.
Both business consultants and technical consultants work on-site approximately 50% of their time.
Table 142: Bill Rate Summary – All PS Markets and Geographies
Role Level No. of
People in the role
% billable work on
site
Target Annual
Billable Hrs.
Published Hourly Bill rate
Realized Hourly Bill rate
Disc.
Management
VP / Executive Management 2.7 17.9% 706 $271 $235 13.5%
Director 3.9 21.8% 785 242 213 11.8%
Manager 7.2 25.4% 879 202 176 12.9%
Project Management
Program Manager 5.2 48.0% 1,368 200 174 12.8%
Senior Project Manager 4.5 46.0% 1,472 202 177 12.4%
Project Manager 6.5 42.8% 1,505 190 164 14.1%
Business Consulting
Principal Business Consult. 6.0 50.6% 1,450 232 196 15.6%
Sr. Business Consultant 11.0 49.0% 1,519 189 169 10.8%
Business Consultant 13.8 47.9% 1,512 173 149 14.0%
Technical Consulting
Solution Architect 9.5 46.9% 1,391 205 178 12.9%
Senior Technical Consultant 15.2 53.6% 1,563 194 168 13.2%
Technical Consultant 19.1 47.7% 1,566 167 146 13.0%
Total Weighted Average 104.4 41.3% 1,363 $202 $175 13.1%
Source: Service Performance Insight, 2015 PS Global Pricing Report
Based on SPI’s 2015 PS Global Pricing report, bill rates reached their highest level in 2008 and then
subsided as the economy stalled and moved into a prolonged recession. Table 144 highlights bill rate
trends over the past seven years by role. It shows rates for the primary consulting job categories of
project management, business consulting and technical consulting have remained flat or have slightly
declined. Only senior manager and solution architect roles have experienced a moderate increase over
this seven-year period.

2016 Professional Services Maturity™ Benchmark
© 2016 Service Performance Insight www.FinancialForce.com 174
Steps Taken to Improve Profitability
For the fifth year in a row SPI Research asked “What steps will your organization take to improve
profitability?” For the first time, increasing rates rose to the top of the list of improvement priorities,
tied with improving hiring and ramping and improving methods and tools.
Interviews with this year’s Best-of-
the-Best revealed that top
performing firms are considering
moderate rate increases as the
demand for their services has
outstripped supply. Healthcare and
recruiting costs have risen sharply;
salaries have also risen for the
most in demand skills and locations
– like the Silicon Valley and Boston
so rate increases are warranted.
On the other hand, the glut of low
cost offshore providers is a
constant competitive threat.
Lower cost offshore firms will
continue to cause rate pressure and commoditization in legacy skills.
For the first time, improving methods and tools has risen to become a top priority. SPI’s research
demonstrates the powerful impact integrated business solutions can have on productivity and profit. It
is remarkable that 30% of surveyed organizations still have not invested in Professional Service
Automation. 45% have not yet invested in Human Capital Management applications. Both of these
application areas should make the short list for improving profitability. Business applications should be
a component of any plan to reduce non-billable administrative time. It is shocking how many PSOs still
rely primarily on spreadsheets for resource management, project accounting, forecasting and analysis.
Other
improvement
priorities include
improving
solution
development,
and sales and
marketing
effectiveness.
Why is it so hard
to effectively
package and sell professional services? The answer lies in the intangible nature of services and the fact
Table 143: Steps Taken to Improve Profitability Comparison: 2014-2015
Key Performance Indicator (KPI) 2014 2015 ▲
Increases rates 2.90 3.85 32.8%
Improve hiring and ramping 3.48 3.85 10.7%
Improve methods and tools 3.60 3.85 6.9%
Reduce non-billable time 3.26 3.83 17.7%
Improve solution portfolio 3.59 3.78 5.2%
Improve sales effectiveness 3.94 3.78 -4.0%
Improve utilization 3.85 3.78 -2.0%
Improve marketing effectiveness 3.65 3.52 -3.7%
Source: Service Performance Insight, February 2016
Table 144: Published Bill Rate Comparisons: 2008 to 2015
Level 2008 2009 2010 2011 2015
Senior Manager $222 $232 $222 $211 - $239 $202 - $271
Project/Program Manager 191 186 191 173 - 205 190 - 202
Business Consultant 176 171 179 174 173
Technical Consultant 170 158 166 168 - 185 167
Solution Architect 186 181 181 211 205
Source: Service Performance Insight, 2015 PS Global Pricing Report

2016 Professional Services Maturity™ Benchmark
© 2016 Service Performance Insight www.FinancialForce.com 175
that typically the best consulting sellers are quite often the best consultants – which creates a dilemma
around whether to sell or deliver?
Annual Revenue per Billable Consultant
Annual revenue per billable
consultant depicts the service
organization’s total revenue
divided by the number of billable
consultants. Alternatively, this
metric is derived by multiplying
the consultant’s average bill rate
times billable hours. Revenue
per consultant provides an
indication of consultant
productivity; the likelihood the
firm will be profitable is foretold
by the labor multiplier. SPI
Research considers revenue per
billable consultant to be one of the most important KPIs, but it must be viewed in conjunction with labor
cost. Revenue per billable consultant should minimally equal 1.5 times the fully loaded cost of the
consultant. Revenue multipliers of three and higher are typical for engineering and architecture firms
while a labor multiplier greater than three is standard in management consulting and legal professional
services.
Billable consultant revenue yield is a
strong predictor of PS profit.
Average consultant revenue
production declined from $206K in
2012 to $193K in 2013 but
increased to $197K in 2014 and now
$198K in 2015. Simple math shows
a $1,000 increase in revenue
produced by each of the 350,000
consultants represented in this
benchmark means overall revenue
could have increased by $350
million for the 549 firms in this
study. A slight improvement in
billable utilization is the primary
catalyst for this increase.
Table 145: Impact – Revenue per Billable Consultant
Revenue per Billable Consultant
Survey Percent
Revenue Growth
Pipeline Billable Util.
Under $100k 13.5% 4.3% 128% 68.3%
$100k - $150k 18.0% 7.6% 148% 69.8%
$150k - $200k 19.3% 9.6% 164% 70.8%
$200k - $250k 21.2% 13.1% 187% 69.3%
$250k - $300k 14.6% 11.1% 202% 75.4%
Over $300k 13.5% 15.2% 198% 69.6%
Total/Average 100.0% 10.2% 171% 70.5%
Source: Service Performance Insight, February 2016
Figure 60: Revenue per Billable Consultant Five-year Trend
Source: Service Performance Insight, February 2016

2016 Professional Services Maturity™ Benchmark
© 2016 Service Performance Insight www.FinancialForce.com 176
Annual Revenue per Employee
This calculation looks at the
overall revenue yield for all PS
employees – both billable and
non-billable. Annual revenue per
employee is similar to annual
revenue per billable consultant; it
divides total PS revenue by the
total number of employees. It
includes both billable and non-
billable headcount. Revenue per
employee is a powerful indicator
of the overall profitability of the
firm. If the average cost per
employee is known, profit can be
estimated by comparing cost per
employee to revenue per employee. Similar to revenue per consultant, this KPI is highly correlated with
profitability, utilization and bill rates.
PSOs with a high percentage of non-billable employees have lower annual revenue per employee.
Revenue per employee is very important in determining the appropriate size and financial health of the
organization. Based on the high cost of talented consulting staff, SPI Research believes this figure
should be close to two times the fully loaded cost per person to maintain strong financial viability. If the
organization achieves an acceptable revenue yield per billable consultant but is below the benchmark
for revenue per employee, this is an
indication of excessive non-billable
overhead. Figure 61 shows revenue
per employee dropped dramatically in
2015. Since revenue per consultant
trended up slightly, the primary reason
for this drop in per person revenue is
firms have added in loads of non-
billable headcount. The percentage of
non-billable headcount increased
dramatically from 25% in 2014 to 30%
in 2015. Discretionary spending also
increased significantly. This trend must
to be reversed in 2016 for firms to be
able to maintain the excellent net profit
margins shown in 2015.
Table 146: Impact – Annual Revenue per Employee
Revenue per Employee
Survey Percent
Annual Rev. Target
Achieved
Recruit Exp. as a % of Revenue
EBITDA
Under $100k 23.0% 84.7% 0.6% 9.3%
$100k - $150k 25.4% 91.8% 0.7% 14.8%
$150k - $200k 24.7% 89.7% 1.0% 13.9%
$200k - $250k 15.2% 94.1% 1.2% 19.8%
$250k - $300k 5.9% 93.8% 1.6% 21.4%
Over $300k 5.9% 92.5% 3.5% 16.5%
Total/Average 100.0% 91.3% 1.0% 14.6%
Source: Service Performance Insight, February 2016
Figure 61: Revenue per Employee Five-year Trend
Source: Service Performance Insight, February 2016

2016 Professional Services Maturity™ Benchmark
© 2016 Service Performance Insight www.FinancialForce.com 177
Revenue per Project
Average revenue per project is calculated by dividing the total revenue of the service organization by the
total number of projects. This KPI provides insight into the size, number of employees involved, and
duration of projects. Many PSOs have lots of small projects along with a few really big ones which may
skew revenue per project. Wide variability in project size stresses resource management predictability.
Project size has varied greatly over the past five years, but this year revenue per project rose to $225K
compared to $189K in 2014. Independents grew average project size significantly from $190K in 2013 to
$219K in 2014 to $244K in 2015. Embedded PSOs saw their average project size increase from $121K in
2014 for $182K in 2015.
Although net profit margin is not directly related to project size it is harder to manage and make money
on smaller projects. Smaller projects can strain utilization levels and cause resource churn, meaning
effective resource management and service packaging is critical.
Smaller projects imply greater resource churn and are harder to manage based on transaction volumes.
If the majority of projects are small, PSOs must focus on efficiency and repeatability. The worst possible
scenario is a series of short projects requiring unique skills with little potential for repeat or referral
business. The trend toward shorter, faster, more iterative projects bodes well for project success and
client satisfaction, but adds additional business development costs and resource scheduling strain to
quickly staff projects and dynamically reassign resources.
Table 147 compares the average revenue per project to other key performance indicators. The results
show as projects become larger
in size, PSOs are able to improve
per consultant and per employee
revenue yields. The results also
show larger projects produced
higher on-time project
completion rates and better
gross project profit margins.
Large projects are easier to plan
and staff but mega projects (over
$500K) involve substantial risk. If
not carefully managed, mega
projects can deliver big losses
and unwarranted levels of risk. It
is important to note that the use
of standard project
methodologies and project management governance practices must increase with project size and
complexity. The good news is that the project management discipline has improved significantly over
the past 20 years with many organizations investing in PMI training and certification.
Table 147: Impact – Revenue per Project Comparison
Revenue / Project
Survey Percent
On-time Delivery
Rev./ Bill.
Emp. (k)
Rev./ Emp. (k)
Proj. Margin
Under $25k 23.0% 72.7% $111 $88 25.3%
$25k - $50k 14.1% 76.1% 178 148 33.6%
$50k - $100k 16.8% 76.8% 206 160 34.1%
$100k - $250k 20.2% 73.4% 215 166 35.2%
$250k - $500k 22.1% 76.7% 227 176 37.4%
$500k - $1mm 14.5% 80.0% 234 197 37.2%
Over $1mm 8.4% 80.3% 264 217 34.6%
Total / Avg. 100.0% 75.7% $198 $157 33.8%
Source: Service Performance Insight, February 2016

2016 Professional Services Maturity™ Benchmark
© 2016 Service Performance Insight www.FinancialForce.com 178
Project Margin
Project margin is the percentage of revenue which remains after accounting for the direct costs of
project delivery. Projects can be fixed-price, milestone-based, “not to exceed” or time and materials,
where the PSO essentially charges by the hour with additional payment for any materials used during
the engagement. Typically, time and materials based projects produce the best profitability as long as
bill rates are set appropriately. “Not to
exceed” projects should be avoided as
they provide none of the benefits of
fixed price projects but carry all of the
risks. Cost-plus contracts are also
undesirable; they are most prevalent in
government work which tends to be
penny-wise and pound-foolish. Clients
and service providers alike should be
focused on paying fairly for work that
delivers promised results. If the project
benefit is substantial, then assuring
successful delivery is of paramount
importance. Figure 62 shows average
project margins improved in 2013 but
declined in 2014 and declined further to
32% in 2015, the lowest project margins we have seen since the recession. This metric underscores the
importance of a holistic view of PS, as one
important metric like project profit can
cause a ripple effect leading to lower
overall net profit.
Leading professional services organizations
strive to achieve project margins over 35%
but as Figure 63 shows, less than 20% of
organizations consistently achieve project
margins greater than 40%. Low margin
projects are caused by a variety of issues
including poor estimates, significant scope
change, lack of a clear project charter, poor
management, poor execution and poor
communication. Organizations with lower
project margins struggle to meet annual
revenue targets.
Figure 62: Project Margin Five-year Trend
Source: Service Performance Insight, February 2016
Figure 63: Project Margin
Source: Service Performance Insight, February 2016
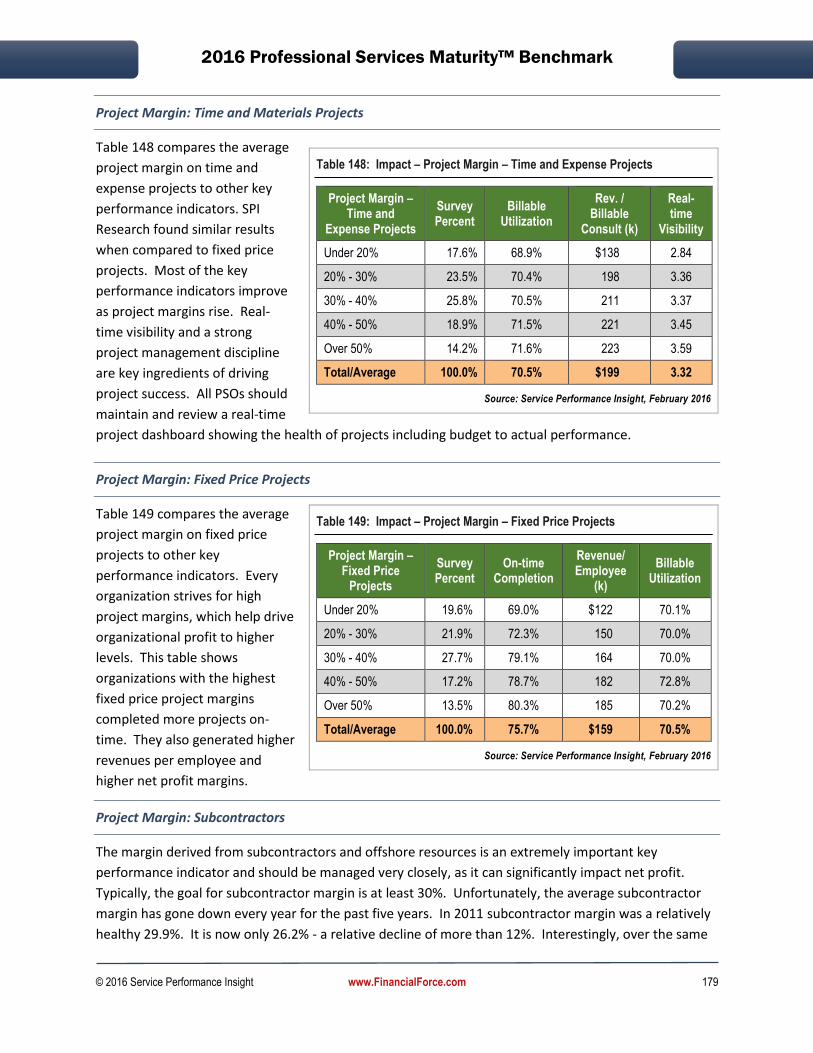
2016 Professional Services Maturity™ Benchmark
© 2016 Service Performance Insight www.FinancialForce.com 179
Project Margin: Time and Materials Projects
Table 148 compares the average
project margin on time and
expense projects to other key
performance indicators. SPI
Research found similar results
when compared to fixed price
projects. Most of the key
performance indicators improve
as project margins rise. Real-
time visibility and a strong
project management discipline
are key ingredients of driving
project success. All PSOs should
maintain and review a real-time
project dashboard showing the health of projects including budget to actual performance.
Project Margin: Fixed Price Projects
Table 149 compares the average
project margin on fixed price
projects to other key
performance indicators. Every
organization strives for high
project margins, which help drive
organizational profit to higher
levels. This table shows
organizations with the highest
fixed price project margins
completed more projects on-
time. They also generated higher
revenues per employee and
higher net profit margins.
Project Margin: Subcontractors
The margin derived from subcontractors and offshore resources is an extremely important key
performance indicator and should be managed very closely, as it can significantly impact net profit.
Typically, the goal for subcontractor margin is at least 30%. Unfortunately, the average subcontractor
margin has gone down every year for the past five years. In 2011 subcontractor margin was a relatively
healthy 29.9%. It is now only 26.2% - a relative decline of more than 12%. Interestingly, over the same
Table 148: Impact – Project Margin – Time and Expense Projects
Project Margin – Time and
Expense Projects
Survey Percent
Billable Utilization
Rev. / Billable
Consult (k)
Real-time
Visibility
Under 20% 17.6% 68.9% $138 2.84
20% - 30% 23.5% 70.4% 198 3.36
30% - 40% 25.8% 70.5% 211 3.37
40% - 50% 18.9% 71.5% 221 3.45
Over 50% 14.2% 71.6% 223 3.59
Total/Average 100.0% 70.5% $199 3.32
Source: Service Performance Insight, February 2016
Table 149: Impact – Project Margin – Fixed Price Projects
Project Margin – Fixed Price
Projects
Survey Percent
On-time Completion
Revenue/ Employee
(k)
Billable Utilization
Under 20% 19.6% 69.0% $122 70.1%
20% - 30% 21.9% 72.3% 150 70.0%
30% - 40% 27.7% 79.1% 164 70.0%
40% - 50% 17.2% 78.7% 182 72.8%
Over 50% 13.5% 80.3% 185 70.2%
Total/Average 100.0% 75.7% $159 70.5%
Source: Service Performance Insight, February 2016
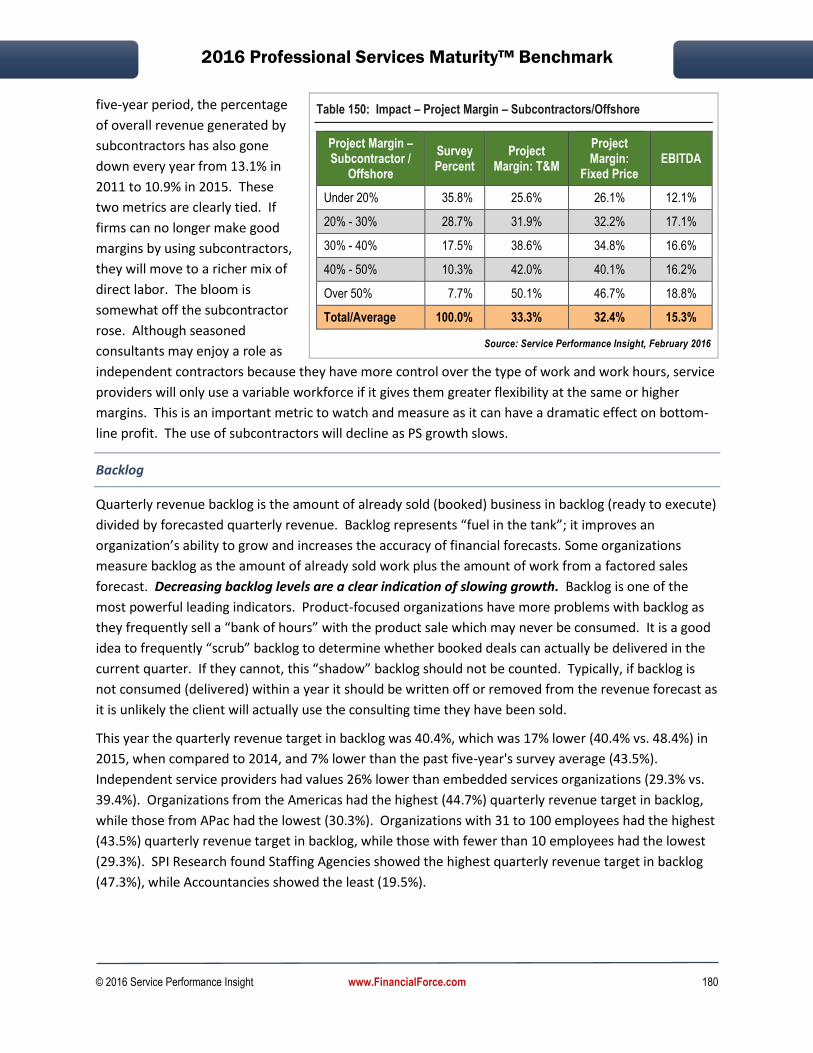
2016 Professional Services Maturity™ Benchmark
© 2016 Service Performance Insight www.FinancialForce.com 180
five-year period, the percentage
of overall revenue generated by
subcontractors has also gone
down every year from 13.1% in
2011 to 10.9% in 2015. These
two metrics are clearly tied. If
firms can no longer make good
margins by using subcontractors,
they will move to a richer mix of
direct labor. The bloom is
somewhat off the subcontractor
rose. Although seasoned
consultants may enjoy a role as
independent contractors because they have more control over the type of work and work hours, service
providers will only use a variable workforce if it gives them greater flexibility at the same or higher
margins. This is an important metric to watch and measure as it can have a dramatic effect on bottom-
line profit. The use of subcontractors will decline as PS growth slows.
Backlog
Quarterly revenue backlog is the amount of already sold (booked) business in backlog (ready to execute)
divided by forecasted quarterly revenue. Backlog represents “fuel in the tank”; it improves an
organization’s ability to grow and increases the accuracy of financial forecasts. Some organizations
measure backlog as the amount of already sold work plus the amount of work from a factored sales
forecast. Decreasing backlog levels are a clear indication of slowing growth. Backlog is one of the
most powerful leading indicators. Product-focused organizations have more problems with backlog as
they frequently sell a “bank of hours” with the product sale which may never be consumed. It is a good
idea to frequently “scrub” backlog to determine whether booked deals can actually be delivered in the
current quarter. If they cannot, this “shadow” backlog should not be counted. Typically, if backlog is
not consumed (delivered) within a year it should be written off or removed from the revenue forecast as
it is unlikely the client will actually use the consulting time they have been sold.
This year the quarterly revenue target in backlog was 40.4%, which was 17% lower (40.4% vs. 48.4%) in
2015, when compared to 2014, and 7% lower than the past five-year's survey average (43.5%).
Independent service providers had values 26% lower than embedded services organizations (29.3% vs.
39.4%). Organizations from the Americas had the highest (44.7%) quarterly revenue target in backlog,
while those from APac had the lowest (30.3%). Organizations with 31 to 100 employees had the highest
(43.5%) quarterly revenue target in backlog, while those with fewer than 10 employees had the lowest
(29.3%). SPI Research found Staffing Agencies showed the highest quarterly revenue target in backlog
(47.3%), while Accountancies showed the least (19.5%).
Table 150: Impact – Project Margin – Subcontractors/Offshore
Project Margin – Subcontractor /
Offshore
Survey Percent
Project Margin: T&M
Project Margin:
Fixed Price EBITDA
Under 20% 35.8% 25.6% 26.1% 12.1%
20% - 30% 28.7% 31.9% 32.2% 17.1%
30% - 40% 17.5% 38.6% 34.8% 16.6%
40% - 50% 10.3% 42.0% 40.1% 16.2%
Over 50% 7.7% 50.1% 46.7% 18.8%
Total/Average 100.0% 33.3% 32.4% 15.3%
Source: Service Performance Insight, February 2016

2016 Professional Services Maturity™ Benchmark
© 2016 Service Performance Insight www.FinancialForce.com 181
Table 151 compares the quarterly
revenue target in backlog to
other key performance
indicators. As one might expect
higher backlog is an indication of
future demand and produces
better financial metrics. This
table shows that once PSOs
achieve greater than 50% of their
quarterly revenue target in
backlog their financial results are
very impressive.
Annual Revenue Target Achieved
The annual revenue target achieved is the percentage of the annual revenue goal that is attained. PSOs
create detailed annual business plans; this figure shows how accurate they are in business planning and
execution. If the organization does not meet its annual revenue target it is a sure bet that the annual
margin or profit target will be missed as well as most organizations plan expenses from their revenue
projections. On the other hand, if the organization exceeds its revenue projections by a wide margin
this results in quality issues, staff burnout and potentially client satisfaction issues because the
organization is understaffed to meet demand.
The percentage of annual revenue target achieved was 1% higher (91.4% vs. 90.5%) in 2015, when
compared to 2014, and basically the same as the past five-year's survey average (91.2%). Independents
and embedded services organizations achieved the same percentage of their annual revenue targets
(91.0% vs. 91.1%). Organizations
from the Americas had the
highest (92.1%) percent of annual
revenue target attainment, while
those from EMEA had the lowest
(89.6%). Organizations with over
700 employees had the highest
(96.0%) percent of annual
revenue target attainment, while
those with between 10 and 30
employees had the lowest
(87.0%). SPI Research found
Accountancies showed the
Table 151: Impact – Quarterly Revenue Target in Backlog
Quarterly Revenue Target
in Backlog
Survey Percent
Annual Revenue Growth
Bid to Win Ratio
Sales Pipeline
Under 20% 24.3% 7.1% 4.81 143%
20% - 40% 25.7% 9.5% 4.85 179%
40% - 50% 15.9% 9.5% 4.79 157%
50% - 60% 11.5% 12.7% 4.99 170%
60% - 70% 8.7% 14.4% 5.03 200%
Over 70% 13.9% 14.6% 5.35 211%
Total/Average 100.0% 10.4% 4.93 172%
Source: Service Performance Insight, February 2016
Table 152: Impact – Percentage of annual target revenue achieved
Percentage of annual target revenue
achieved
Survey Percent
Revenue Growth
Billable Utilization
On-time Delivery
Under 80% 16.3% 6.9% 66.4% 70.6%
80% - 90% 31.0% 8.6% 71.1% 75.0%
90% - 100% 29.4% 9.1% 70.4% 75.8%
100% - 110% 15.0% 14.7% 72.5% 81.3%
Over 110% 8.3% 19.7% 73.3% 82.1%
Total/Average 100.0% 10.3% 70.5% 76.0%
Source: Service Performance Insight, February 2016

2016 Professional Services Maturity™ Benchmark
© 2016 Service Performance Insight www.FinancialForce.com 182
highest percent of annual revenue target achieved (96.4%), while Staffing Agencies showed the least
(88.9%).
As Table 152 shows there is a direct correlation between achieving revenue targets, revenue growth and
on-time delivery. PSOs that exceeded their revenue goals produced higher margins, higher revenue
growth and superior billable utilization. There is also a strong positive correlation between meeting
annual revenue targets and profitability, assuming revenue and profit targets are set appropriately. SPI
Research also found organizations who achieved their revenue targets had lower attrition rates,
reflecting financial stability and the organization’s ability to reward performance and reinvest in the
business. Complex revenue accounting rules have negatively impacted revenue forecasting.
Annual Margin Target Achieved
The annual margin target achieved, similar to the annual revenue target achieved, is the percentage of
the annual profit goal which was attained. SPI Research measures revenue and margin target
attainment to calibrate the accuracy of annual business plans. Even if PSOs don’t accurately measure
other benchmark metrics, they usually do know if they achieved their targets or not. Target attainment
is important from a planning and investment perspective. If the organization does not meet its margin
goals it might have to scale back future initiatives, potentially limiting growth.
The percentage of annual margin target achieved was 3% higher (89.4% vs. 87.0%) in 2015, when
compared to 2014, and 1% higher than the past five-year's survey average (88.6%). Independent service
providers had values 1% lower than embedded services organizations (90.6% vs. 89.3%). SPI Research
found organizations from APac had the highest (91.0%) percent of annual margin target achieved, while
those from EMEA had the lowest (87.6%). Organizations with over 700 employees had the highest
(94.1%) percent of annual margin target achieved, while those with between 10 and 30 employees had
the lowest (84.1%). SPI Research found Accountancies showed the highest percent of annual margin
target achieved (97.3%), while marketing and communication firms showed the least (81.5%).
Perhaps one of the most important gauges of financial maturity is the ability to consistently achieve
annual margin targets.
Consistently the percentage of
firms who are able to achieve
their margin targets is less than
the percentage of firms who are
able to achieve their revenue
targets. Only 19.5% of survey
respondents achieved 100% or
more of their annual margin
target! Table 153 compares the
percentage of annual target
margin achieved to other key
performance indicators. This KPI
Table 153: Impact – Percentage of Annual Target Margin Achieved
Percentage of annual target
margin achieved
Survey Percent
Revenue Growth
On-time Delivery
Project Margin
Under 80% 22.7% 6.6% 70.2% 29.2%
80% - 90% 27.9% 9.7% 75.8% 32.5%
90% - 100% 29.8% 10.7% 77.9% 36.7%
100% - 110% 13.1% 15.2% 78.1% 36.8%
Over 110% 6.4% 15.3% 84.7% 38.2%
Total/Average 100.0% 10.4% 76.0% 33.9%
Source: Service Performance Insight, February 2016
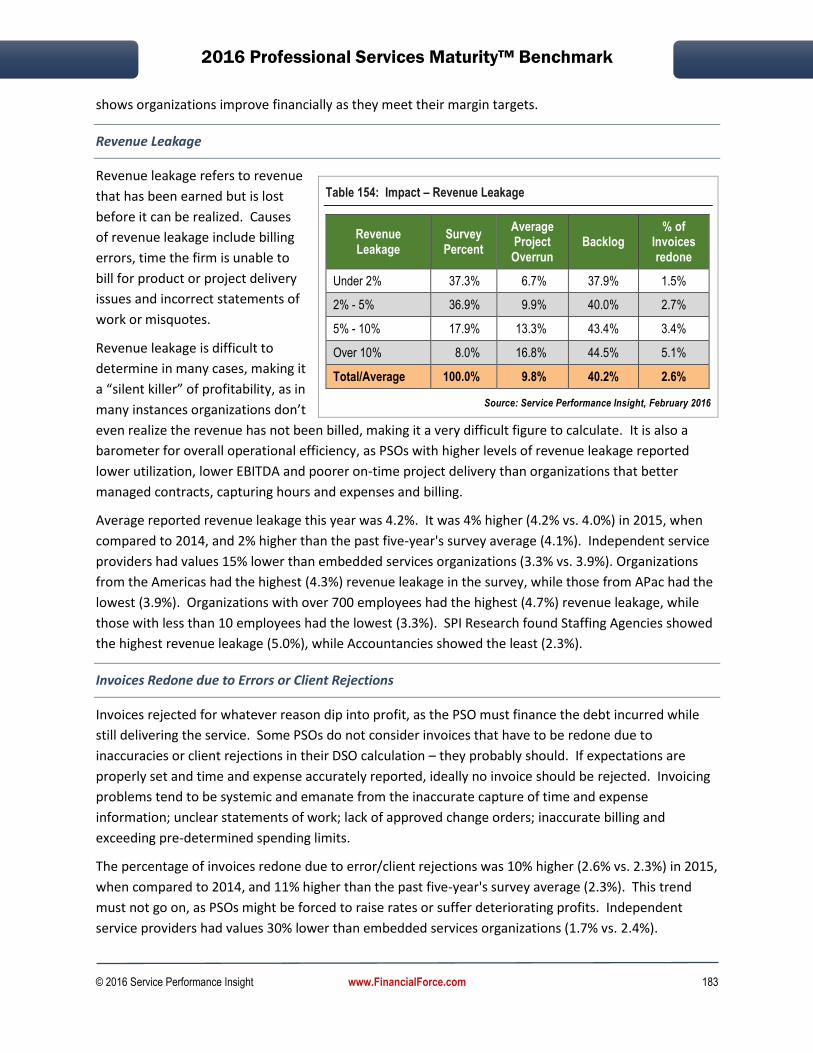
2016 Professional Services Maturity™ Benchmark
© 2016 Service Performance Insight www.FinancialForce.com 183
shows organizations improve financially as they meet their margin targets.
Revenue Leakage
Revenue leakage refers to revenue
that has been earned but is lost
before it can be realized. Causes
of revenue leakage include billing
errors, time the firm is unable to
bill for product or project delivery
issues and incorrect statements of
work or misquotes.
Revenue leakage is difficult to
determine in many cases, making it
a “silent killer” of profitability, as in
many instances organizations don’t
even realize the revenue has not been billed, making it a very difficult figure to calculate. It is also a
barometer for overall operational efficiency, as PSOs with higher levels of revenue leakage reported
lower utilization, lower EBITDA and poorer on-time project delivery than organizations that better
managed contracts, capturing hours and expenses and billing.
Average reported revenue leakage this year was 4.2%. It was 4% higher (4.2% vs. 4.0%) in 2015, when
compared to 2014, and 2% higher than the past five-year's survey average (4.1%). Independent service
providers had values 15% lower than embedded services organizations (3.3% vs. 3.9%). Organizations
from the Americas had the highest (4.3%) revenue leakage in the survey, while those from APac had the
lowest (3.9%). Organizations with over 700 employees had the highest (4.7%) revenue leakage, while
those with less than 10 employees had the lowest (3.3%). SPI Research found Staffing Agencies showed
the highest revenue leakage (5.0%), while Accountancies showed the least (2.3%).
Invoices Redone due to Errors or Client Rejections
Invoices rejected for whatever reason dip into profit, as the PSO must finance the debt incurred while
still delivering the service. Some PSOs do not consider invoices that have to be redone due to
inaccuracies or client rejections in their DSO calculation – they probably should. If expectations are
properly set and time and expense accurately reported, ideally no invoice should be rejected. Invoicing
problems tend to be systemic and emanate from the inaccurate capture of time and expense
information; unclear statements of work; lack of approved change orders; inaccurate billing and
exceeding pre-determined spending limits.
The percentage of invoices redone due to error/client rejections was 10% higher (2.6% vs. 2.3%) in 2015,
when compared to 2014, and 11% higher than the past five-year's survey average (2.3%). This trend
must not go on, as PSOs might be forced to raise rates or suffer deteriorating profits. Independent
service providers had values 30% lower than embedded services organizations (1.7% vs. 2.4%).
Table 154: Impact – Revenue Leakage
Revenue Leakage
Survey Percent
Average Project Overrun
Backlog % of
Invoices redone
Under 2% 37.3% 6.7% 37.9% 1.5%
2% - 5% 36.9% 9.9% 40.0% 2.7%
5% - 10% 17.9% 13.3% 43.4% 3.4%
Over 10% 8.0% 16.8% 44.5% 5.1%
Total/Average 100.0% 9.8% 40.2% 2.6%
Source: Service Performance Insight, February 2016

2016 Professional Services Maturity™ Benchmark
© 2016 Service Performance Insight www.FinancialForce.com 184
SPI Research found
organizations from APac had
the highest (2.8%) percentage
of invoices redone due to
error/client rejections, while
those from EMEA had the
lowest (2.4%). Organizations
with 301 to 700 employees had
the highest (3.1%) percentage
of invoices redone due to
error/client rejections, while
those with less than 10
employees had the lowest
(1.7%). SPI Research found
Managed Services providers
showed the highest percentage of invoices redone due to error/client rejections (3.8%).
Days Sales Outstanding (DSO)
Days Sales Outstanding (DSO) is still one of the most important KPIs for financial executives. It reflects
the importance of accurately producing invoices and efficiently collecting payment. DSO is also a
powerful measurement of
client satisfaction, strong
operating controls and client
credit-worthiness.
This year the average DSO was
43.8 days, which was 1% higher
(43.8 vs. 43.4) in 2015, when
compared to 2014, and 1%
lower than the past five-year's
survey average (44.1).
Independent service providers
had values 22% higher than
embedded services
organizations (34.1 vs. 43.9). Organizations from the Americas had the highest DSO (45.5), while those
from APac had the lowest (40.2). Organizations with over 700 employees had the highest DSO (46.9),
while those with less than 10 employees had the lowest (34.1). SPI Research found Staffing Agencies
showed the highest DSO (52.7), while Managed Services providers showed the least (34.6). DSO goes up
as PSOs sell to larger companies, utilities or the government as these clients are notorious for slow
payment. Firms must carefully manage DSO to maintain healthy cash flow.
Table 155: Invoices Redone due to Errors or Client Rejections
Invoices Redone due to Errors or
Client Rejections
Survey Percent
On-time Delivery
Revenue Leakage
EBITDA
None 9.1% 80.6% 2.8% 21.7%
Under 1% 33.8% 78.4% 3.2% 16.1%
1% - 3% 30.8% 75.1% 4.1% 14.9%
3% - 5% 14.6% 73.9% 5.8% 10.5%
5% - 10% 7.8% 69.3% 5.8% 22.6%
Over 10% 4.0% 74.4% 8.1% 14.0%
Total/Average 100.0% 76.0% 4.2% 15.8%
Source: Service Performance Insight, February 2016
Table 156: Days Sales Outstanding (DSO)
Invoices Redone due to Errors or
Client Rejections
Survey Percent
Leadership Index
% of annual margin target
achieved EBITDA
Under 30 days 24.0% 29.5 90.3% 16.8%
30 - 50 days 45.4% 30.5 88.6% 14.0%
50 - 70 days 20.0% 28.5 88.5% 14.8%
70 - 100 days 7.4% 28.3 89.7% 26.6%
Over 100 days 3.1% 25.6 89.6% 10.3%
Total/Average 100.0% 29.6 89.1% 15.7%
Source: Service Performance Insight, February 2016

2016 Professional Services Maturity™ Benchmark
© 2016 Service Performance Insight www.FinancialForce.com 185
Quarterly Non-Billable Expense per Employee
Quarterly non-billable expense per employee
shows how well PSOs manage employee
expenses not related to billable work. Ideally,
this metric is minimized, but there are always
expenses due to travel, training, IT and
business development that cannot be billed.
The quarterly non-billable expense per
employee for 2015 was $1,908, and was 32%
higher ($1,908 vs. $1,443) when compared to
2014, and 19% higher than the past five-year's
survey average ($1,607). This rise should cause
concern for PS executives who are struggling to
cut costs. Excessive non-billable employee
expense is usually a symptom of poor or
ineffective business expense policies. It may
also be a symptom of runaway business
development expenses with non-essential
personnel wasting valuable time and money
chasing non-qualified opportunities.
Independent service providers had values 16% lower than embedded services organizations ($1,538 vs.
$1,826). Organizations from the Americas had the highest ($2,042) quarterly non-billable expense per
employee, while those from EMEA had the lowest ($1,590). PSOs with over 700 employees had the
highest ($2,875) quarterly non-billable expense per employee, while those with between 10 and 30
employees had the lowest ($1,250). SPI Research found Software PS organizations showed the highest
quarterly non-billable expense per employee ($2,474), while marketing and communication firms
showed the least ($1,125).
These figures are still below pre-recession discretionary spending of more than $3,000 per employee.
Common causes of high non-billable discretionary spending are high business development and training
expenses or employee expense misuse. Unlike other metrics, non-billable expense per employee does
not appear to have a direct correlation with overall profit, utilization, reference clients or employee
satisfaction. In fact, very few key metrics appear to have been greatly impacted by non-billable
spending. By no means is this a recommendation for PSOs to increase discretionary expense, but
perhaps those that did so found other ways to improve profit and increase revenue.
Percentage of Billable Work Written-Off
Inaccurate invoicing, improperly accounting for time, project overruns and other project-related issues
force many PSOs to write-off billable work, which naturally hurts profits. The formula is simple. The
more work written off, the lower the firm’s profit. The differential is significant. Obviously, no firm
Figure 64: Quarterly Non-Billable Expense per Employee
Source: Service Performance Insight, February 2016

2016 Professional Services Maturity™ Benchmark
© 2016 Service Performance Insight www.FinancialForce.com 186
wants to write-off billable hours as doing so implies clients were not satisfied with some aspect of the
work. However, to accomplish this feat requires significant effort to clearly define requirements and
deliverables; assure work is scoped correctly; projects are delivered on-time and within budget; and
invoices are accurate. SPI Research believes this initiative is well worth the effort.
The percentage of billable work that is written off was 3% lower (3.0% vs. 3.1%) in 2015, when
compared to 2014, and the same as the five-year survey average (3.0%). Independent service providers
had values 19% lower than embedded services organizations (2.2% vs. 2.7%).
SPI Research found organizations from APac had the highest (3.1%) percentage of billable work that was
written off, while those from EMEA had the lowest (2.7%). Organizations with over 700 employees had
the highest (3.4%) percentage of billable work written off, while those with under 10 employees had the
lowest (2.2%). SPI Research found Software PS organizations showed the highest percentage of billable
work is written off (4.1%),
while Staffing Agencies
showed the least (1.3%).
Table 157 shows a clear
correlation between
increased levels of work being
written off and lower
performance in terms of on-
time delivery and other
financial metrics. Billable
work written off does not
show up in utilization
percentages, but is directly
related to essentially throwing
money away, which limits an organization’s ability to grow and meet profit objectives.
Real-Time Visibility
Real-time information visibility is one of the most important management tools. SPI Research asked
survey respondents whether their executives had real-time visibility into all business activities (sales,
service, marketing, finance, etc.). The rewards are significant for organizations who have integrated
systems and management dashboards that allow them to pinpoint issues and spot trends in real-time.
Executives who have real-time visibility run companies that are much more profitable than those that
are not as they are able to take advantage of changing market conditions.
This year’s survey found executive real-time wide visibility was 7% lower (3.32 vs. 3.58) in 2015, when
compared to 2014, and 4% lower than the past five-year's survey average (3.44). Independent service
providers had values 11% higher than embedded services organizations (3.68 vs. 3.33). Organizations
from the Americas had the highest (3.33) executive real-time wide visibility, while those from APac had
the lowest (3.26).
Table 157: Percentage of Billable Work Written-Off
Percentage of Billable Work Written-Off
Survey Percent
Billable Utilization
On-time Delivery
EBITDA
None 14.4% 71.0% 77.1% 20.1%
Under 1% 22.8% 70.6% 77.5% 16.5%
1% - 3% 28.9% 71.5% 78.2% 15.3%
3% - 5% 18.1% 70.8% 74.1% 14.9%
5% - 10% 10.3% 68.3% 72.8% 14.3%
Over 10% 5.4% 66.6% 68.2% 6.6%
Total/Average 100.0% 70.5% 76.0% 15.6%
Source: Service Performance Insight, February 2016

2016 Professional Services Maturity™ Benchmark
© 2016 Service Performance Insight www.FinancialForce.com 187
Organizations with less than 10 employees had the highest (3.68) executive real-time wide visibility,
while those with between 101 and 300 employees had the lowest (3.15). SPI Research found
Management Consultancies showed the highest executive real-time wide visibility (3.66).
Real-time visibility is a very important key performance indicator. As Table 158 shows, organizations
that have comprehensive visibility can make the decisions necessary to grow and achieve high levels of
profitability. And it is not for just those KPI’s listed in this table, it is for a majority of the other metrics
tracked by SPI Research as well.
Table 158: Real-Time Visibility
Real-Time Visibility
Survey Percent
Revenue Growth
Bid-to-win ratio
Revenue / Billable
Employee (k)
Revenue / Employee (k)
EBITDA
1 - None 6.0% 4.7% 3.54 $165 $131 12.1%
2 - Minimal 16.6% 9.0% 4.74 178 143 13.0%
3 - Some 31.5% 10.5% 4.92 196 158 17.4%
4 - Substantial 31.3% 11.2% 5.02 212 165 14.2%
5 - Comprehensive 14.5% 12.6% 5.37 210 162 18.2%
Total/Average 100.0% 10.4% 4.90 $198 $157 15.5%
Source: Service Performance Insight, February 2016
Extended real-time visibility is only attained through application integration. “Extended” means
information that flows across departments and functions, so that employees have a more complete
picture of operations, and can make quick, fact-based decisions. Without real-time visibility, decision-
making can be subjective and reactive which hurts business performance. SPI Research believes these
results help organizations justify expenditures in IT to provide the systems and tools they need to
visualize, monitor and control the business.
Income Statements
In this section SPI Research analyzes income statements by organizational type and size. Inputs were:
Revenue
Direct gross PS revenue: Directly delivered PS revenue (not including re-billable travel)
Reimbursable travel and expense revenue: (includes re-billable travel and expense revenue)
Indirect gross revenue: (revenue from subcontractors, outside resources)
Pass-thru revenue: (revenue from hardware, software, materials, etc.)
Expense
Direct Labor expense: (does not include fringe benefits, vacation, sick time or overhead)

2016 Professional Services Maturity™ Benchmark
© 2016 Service Performance Insight www.FinancialForce.com 188
Fringe benefit expense: as a percentage of direct labor (for healthcare, pensions, vacation and
sick pay)
Billable travel and business expense: business expenses that can be billed to clients
Non-billable travel and business expense: business expenses that cannot be billed to clients
Subcontractor/outside consultant expense: cost of subcontractors and outside consultants
Pass-thru expense: (expense for hardware, software, materials, etc.)
Recruiting expense: (includes recruiting headcount, fees and signing bonuses)
Sales expense: (includes sales headcount, bonus and non-reimbursable sales expense)
Marketing expense: (includes marketing headcount, bonus and marketing program expense)
Education, training and certification expense:
PS IT expense: supporting the IT infrastructure (personnel, applications, networking, etc.)
All other G and A: non-billable headcount, general and administration costs, facilities,
headcount and overhead
Profits rose in 2015 when compared to 2014, showing the strength of the Professional Services market
(Table 159). Both embedded and independent profit improved as did the profit reported by both the
Americas and APac. Unfortunately, profit declined in EMEA. Average profit for the entire benchmark
increased to 15.7% in 2015 as compared to 13.2% in 2014.
Table 159: Income Statement by Organization Type and Embedded Service Type
Key performance indicator (KPI) Survey ESO PSO Americas EMEA APac
Surveys 549 179 370 371 141 37
REVENUE
Direct gross PS revenue 82.5% 79.7% 83.5% 83.9% 79.7% 75.0%
Reimbursable Travel & Expense revenue 4.3% 4.6% 4.2% 3.5% 6.8% 5.2%
Indirect gross revenue 8.8% 10.0% 8.4% 8.8% 7.8% 11.8%
Pass-thru revenue 4.4% 5.8% 3.9% 3.7% 5.7% 7.9%
Total Revenue 100.0% 100.0% 100.0% 100.0% 100.0% 100.0%
EXPENSES
Direct Labor 41.1% 40.4% 41.3% 39.5% 46.4% 42.6%
Fringe benefit 6.3% 6.6% 6.1% 6.9% 5.0% 3.1%
Billable Travel & Expense 3.2% 4.7% 2.7% 3.3% 3.1% 3.0%
Non-billable Travel & Expense 1.9% 2.2% 1.9% 1.9% 2.4% 1.3%
Subcontractor /outside consultant 7.8% 6.9% 8.2% 8.2% 6.1% 9.0%
Pass-thru Expense 2.4% 1.5% 2.7% 1.8% 3.6% 5.5%
Recruiting Expense 1.0% 1.0% 1.1% 1.0% 1.1% 0.8%
Sales 5.3% 5.1% 5.4% 5.6% 4.9% 4.3%
Marketing 2.0% 1.6% 2.2% 2.1% 1.7% 1.9%
Education, training, certification 1.4% 1.5% 1.4% 1.3% 2.0% 1.0%

2016 Professional Services Maturity™ Benchmark
© 2016 Service Performance Insight www.FinancialForce.com 189
Key performance indicator (KPI) Survey ESO PSO Americas EMEA APac
PS IT 2.4% 2.0% 2.6% 2.5% 2.4% 2.0%
All other G&A 9.5% 5.8% 10.8% 9.6% 9.4% 8.2%
Total Expenses 84.3% 79.3% 86.4% 83.7% 88.1% 82.7%
2015 EBITDA 15.7% 20.7% 13.6% 16.3% 11.9% 17.3%
2014 EBITDA Comparison 13.2% 19.0% 10.8% 12.5% 15.5% 13.1%
Source: Service Performance Insight, February 2016
Profitability (EBITDA) rose for the second straight year in 2015 for the overall benchmark survey. EBITDA
was 17% higher (15.5% vs. 13.2%) in 2015, when compared to 2014, and 7% higher than the past five-
year survey average (14.4%). Both embedded and independent professional services organizations
showed solid profitability growth with the independents showing the largest increase. In their income
statements, embedded service organizations typically do not pay for much of the infrastructure borne
by the independents, and therefore their profitability is typically higher.
On a regional basis both the Americas and the Asia-Pacific region showed strong profitability growth
from 2014 to 2015. However, Europe, the Middle East and Africa suffered a significant drop in
profitability. In 2014 EMEA reported the highest profitability and one year later it showed the lowest.
What hurt Europe the most was the high direct labor cost relative to the other regions.
As organizations grow in size, they typically report lower profitability. In 2015, different size
organizations with under 300 employees averaged virtually the same profit, at around 14%. SPI
Research did not have enough income statement data from firms with over 700 employees to feel
comfortable enough to publish.
Table 160: Income Statement by Organization Size
Key performance indicator (KPI) Under 10 10 - 30 31 – 100 101 - 300 301 - 700
Surveys 55 90 147 123 55
REVENUE
Direct gross PS revenue 89.5% 84.9% 86.3% 80.0% 79.9%
Reimbursable Travel & Expense revenue 4.2% 3.4% 2.9% 4.8% 3.9%
Indirect gross revenue 4.4% 8.3% 8.0% 9.0% 14.2%
Pass-thru revenue 1.8% 3.4% 2.7% 6.1% 2.0%
Total Revenue 100.0% 100.0% 100.0% 100.0% 100.0%
EXPENSES
Direct Labor 46.3% 41.1% 45.1% 37.7% 45.2%
Fringe benefit 7.2% 6.8% 6.1% 6.8% 6.0%
Billable Travel & Expense 3.9% 3.4% 2.9% 4.0% 2.8%
Non-billable Travel & Expense 1.9% 2.2% 1.5% 1.5% 3.3%
Subcontractor /outside consultant 6.6% 9.8% 6.7% 9.2% 9.1%

2016 Professional Services Maturity™ Benchmark
© 2016 Service Performance Insight www.FinancialForce.com 190
Key performance indicator (KPI) Under 10 10 - 30 31 – 100 101 - 300 301 - 700
Pass-thru Expense 2.3% 2.3% 1.3% 4.5% 1.0%
Recruiting Expense 0.7% 0.8% 1.0% 0.7% 2.7%
Sales 3.7% 4.3% 6.6% 4.2% 4.1%
Marketing 2.0% 2.6% 2.0% 2.0% 1.3%
Education, training, certification 2.5% 2.2% 0.9% 0.8% 2.4%
PS IT 2.7% 2.5% 1.9% 2.8% 2.8%
All other G&A 5.9% 7.8% 9.9% 11.8% 7.5%
Total Expenses 85.7% 85.8% 85.9% 86.0% 88.2%
2015 EBITDA 14.3% 14.2% 14.1% 14.0% 11.8%
2014 EBITDA Comparison 16.6% 14.6% 12.4% 10.6% 15.5%
Source: Service Performance Insight, February 2016
In this year’s survey, SPI Research received excellent profitability metrics from most of the vertical
markets (Only markets with sufficient income statement data are shown). However, some, with fewer
than 10 employees, did not provide enough information to be statistically valid. For the organizations
with plenty of observations (Table 161) SPI Research found that both SaaS and software’s service
providers reported the highest profitability. This increase by SaaS providers was very important, as in
2014 their profitability was less than 10%. The two main independent groups, IT and management
consultancies showed solid profitability albeit less than the survey average. SPI Research found
Architecture and Engineering firms showed the poorest profitability (11.2%).
Table 161: Income Statement by PS Market Vertical
Key performance indicator (KPI) IT
Consulting Software
Management Consulting
Architects / Engineers
SaaS
Surveys 190 89 68 50 43
REVENUE
Direct gross PS revenue 81.4% 80.4% 82.5% 87.2% 77.8%
Reimbursable T&E rev. 4.1% 4.1% 6.1% 2.1% 11.5%
Indirect gross revenue 9.0% 10.6% 9.2% 8.6% 4.8%
Pass-thru revenue 5.5% 4.8% 2.2% 2.1% 5.9%
Total Revenue 100.0% 100.0% 100.0% 100.0% 100.0%
EXPENSES
Direct Labor 41.4% 38.8% 40.0% 44.2% 42.0%
Fringe benefit 5.7% 6.1% 5.9% 6.8% 8.7%
Billable Travel & Expense 2.9% 5.7% 3.7% 2.1% 3.8%
Non-billable Travel & Exp. 1.6% 2.5% 1.8% 1.2% 1.6%
Sub. /outside consultant 8.5% 7.4% 6.4% 11.0% 2.1%

2016 Professional Services Maturity™ Benchmark
© 2016 Service Performance Insight www.FinancialForce.com 191
Key performance indicator (KPI) IT
Consulting Software
Management Consulting
Architects / Engineers
SaaS
Pass-thru Expense 3.1% 0.8% 2.1% 3.1% 0.7%
Recruiting Expense 1.2% 1.2% 1.9% 0.1% 0.5%
Sales 7.0% 4.7% 5.0% 2.1% 5.4%
Marketing 2.3% 1.6% 2.2% 1.9% 1.7%
Education/ training, cert. 1.3% 1.8% 1.6% 1.8% 0.9%
PS IT 2.4% 2.7% 3.4% 2.4% 1.2%
All other G&A 9.3% 6.8% 13.8% 12.2% 5.6%
Total Expenses 86.7% 80.1% 87.8% 88.9% 74.2%
2015 EBITDA 13.3% 19.9% 12.2% 11.1% 25.8%
2014 EBITDA Comp. 10.2% 20.5% 14.0% 12.3% 7.8%
Source: Service Performance Insight, February 2016
Table 162: Income Statement by PS Market Vertical
Key performance indicator (KPI) Managed. Services
VAR Accounting Advertising (Marcom)
Staffing
Surveys 17 14 13 12 9
REVENUE
Direct gross PS revenue 99.2% 77.0% 78.4% 92.3% 100.0%
Reimbursable T&E rev. 0.8% 3.9% 8.3% 0.7% 0.0%
Indirect gross revenue 0.0% 9.2% 9.1% 3.7% 0.0%
Pass-thru revenue 0.0% 9.9% 4.2% 3.4% 0.0%
Total Revenue 100.0% 100.0% 100.0% 100.0% 100.0%
EXPENSES
Direct Labor 72.1% 40.8% 52.0% 33.2% 49.2%
Fringe benefit 6.8% 6.9% 5.1% 5.8% 13.1%
Billable Travel & Expense 0.5% 3.1% 0.3% 0.8% 0.0%
Non-billable Travel & Exp. 0.3% 1.9% 0.7% 1.8% 10.1%
Sub. /outside consultant 0.0% 6.5% 4.0% 5.7% 2.4%
Pass-thru Expense 0.0% 3.0% 2.6% 2.2% 4.2%
Recruiting Expense 0.0% 0.8% 0.6% 0.6% 0.4%
Sales 2.1% 8.9% 0.4% 7.4% 6.6%
Marketing 1.9% 1.6% 1.1% 4.3% 3.4%
Education/ training, cert. 0.1% 1.6% 0.8% 1.3% 1.4%
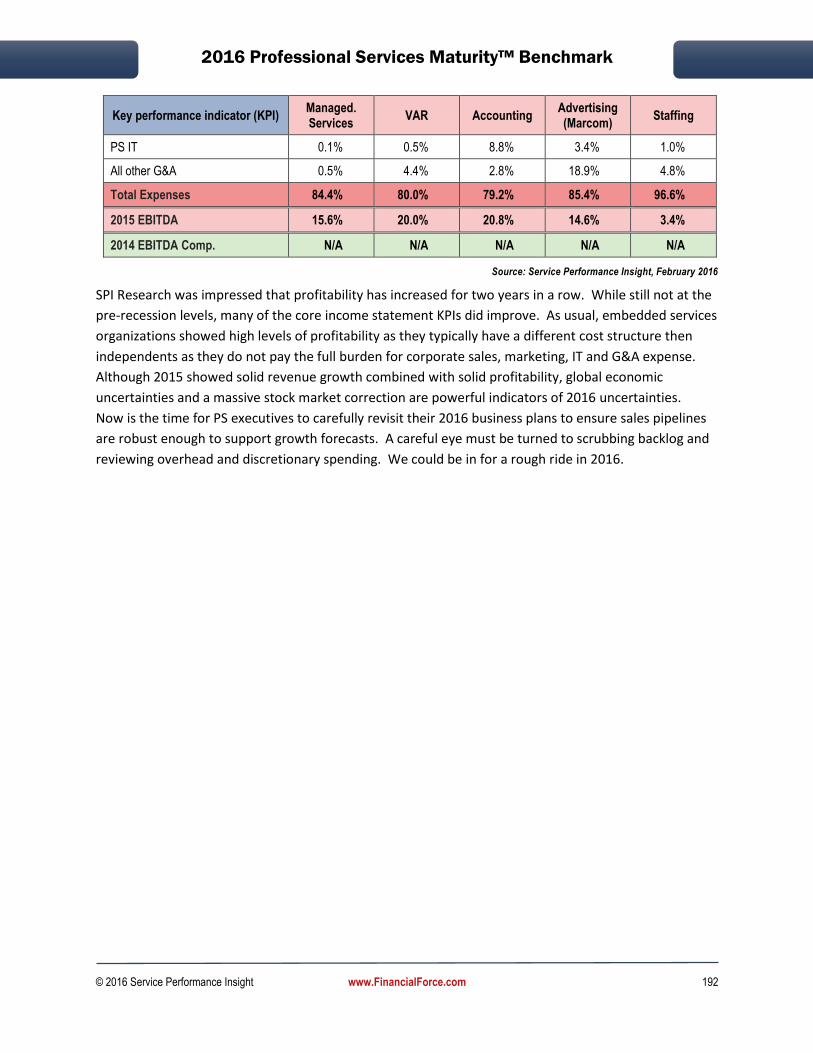
2016 Professional Services Maturity™ Benchmark
© 2016 Service Performance Insight www.FinancialForce.com 192
Key performance indicator (KPI) Managed. Services
VAR Accounting Advertising (Marcom)
Staffing
PS IT 0.1% 0.5% 8.8% 3.4% 1.0%
All other G&A 0.5% 4.4% 2.8% 18.9% 4.8%
Total Expenses 84.4% 80.0% 79.2% 85.4% 96.6%
2015 EBITDA 15.6% 20.0% 20.8% 14.6% 3.4%
2014 EBITDA Comp. N/A N/A N/A N/A N/A
Source: Service Performance Insight, February 2016
SPI Research was impressed that profitability has increased for two years in a row. While still not at the
pre-recession levels, many of the core income statement KPIs did improve. As usual, embedded services
organizations showed high levels of profitability as they typically have a different cost structure then
independents as they do not pay the full burden for corporate sales, marketing, IT and G&A expense.
Although 2015 showed solid revenue growth combined with solid profitability, global economic
uncertainties and a massive stock market correction are powerful indicators of 2016 uncertainties.
Now is the time for PS executives to carefully revisit their 2016 business plans to ensure sales pipelines
are robust enough to support growth forecasts. A careful eye must be turned to scrubbing backlog and
reviewing overhead and discretionary spending. We could be in for a rough ride in 2016.

2016 Professional Services Maturity™ Benchmark
© 2016 Service Performance Insight www.FinancialForce.com 193
11. 2016 Professional Services Maturity™ Model Results
SPI Research has spent over nine years developing and improving the Professional Services Maturity™
Model. Over 10,000 billable professional services organizations use the model to benchmark and
improve organizational performance. With over 2,000 billable services organizations participating over
the past eight years, SPI Research has further refined the model to improve its accuracy.
549 firms participated in 2015 representing approximately 350,000 consultants worldwide, continuing
to make this one of the most comprehensive studies of the global PS industry. While a majority of the
participating organizations are headquartered in North America, the firms surveyed have employees
distributed globally, and SPI Research believes it to be an accurate representation of the global PS
industry. SPI Research clients continue to use the model to develop, prioritize and implement
performance gains.
In this chapter SPI Research reveals the analytic basis of the model and gives insight into our survey
techniques. For this year’s model, SPI Research used the current database of 549 firms surveyed over
the last three months of 2015.
Maturity Levels
The maturity rating for each
Service Performance Pillar
varies based on the
performance of the
organization. In each of the
five performance pillars,
every firm operates at one
of the five maturity levels
(Figure 65):
∆ Level 1 (Initiated –
30% of the
respondents): In
the initial stages,
the focus of the organization is primarily on client acquisition and building a reference base. In
order to accomplish this core mission, the organization must recruit and hire excellent staff.
Therefore, at Maturity Level 1 the priority focus areas are Customer Relationships and Human
Capital Management.
∆ Level 2 (Piloted – 25% of the respondents): The organization is becoming a profit center so
focus is still on client relationships but human capital and finance and operations have become
more important as the organization moves from a cost center to a profit center.
Figure 65: Professional Services Maturity Model™ Levels
Source: Service Performance Insight, February 2016

2016 Professional Services Maturity™ Benchmark
© 2016 Service Performance Insight www.FinancialForce.com 194
∆ Level 3 (Deployed – 25% of the respondents): The organization has now deployed core
operating processes in all five service performance pillars. At this point, the organization must
continue to accentuate Human Capital Alignment but the key focus has shifted to Finance and
Operations and Service Execution. The organization must start to consider strategy and vision to
ensure the focus is on the right clients, markets and competition. At this level, the organization
must have deployed standard business processes across all dimensions.
∆ Level 4 (Institutionalized – 15% of the respondents): At this level, the organization must start
optimizing across all dimensions. However, maintaining and growing service revenue and
margin is of paramount importance. The organization must start developing a differentiated
approach to clients with vertical and horizontal market segments and geographies so a focus on
the Client Relationship pillar is critical.
∆ Level 5 (Optimized – 5% of the respondents): By definition, the organization has achieved
“black belt” status in all functional areas. Processes are fully developed, deployed and
institutionalized. The organization is now developing comprehensive measurement, monitoring,
and optimization processes across all pillars.
While every organization should strive to attain Maturity Level 5 in each of the five service performance
pillars, some areas are more important than others depending on the overall maturity of the company
or its market. For instance, early in the life of a professional services organization client relationships
are far more important than profitability because without clients there can be no future. Over time,
client relationships always remain important, but the organization must equally focus efforts on other
Pillars. To be a truly optimized organization, the firm must aspire to reach Level 5 in all dimensions.
Model Improvements
Each year SPI Research makes modifications to improve the model based on additional surveys, its own
analysis, and feedback from PSOs that use the model. This year, there are several changes to the model
that should improve its accuracy and validity. These changes include:
Questions concerning bill rates were eliminated and put into the 2015 PS Global Pricing Study.
This change enabled SPI Research to reduce the survey length to 177 questions.
Value-added Resellers (VARs) and Managed Service providers were added as an increasing
number of VARs and hosting providers focus on professional services as a differentiator.
Hardware, software or other equipment resale was incorporated into the question on PS
revenue makeup to reflect how product sales have become increasingly important to
independent PS providers.
Project Portfolio Management (PPM) solutions were added as a solution category.
Service revenue was further delineated by new (logo) and existing clients and new versus
existing services to show how PSOs grow revenue.
Annual employee attrition was split into voluntary and involuntary to provide greater insight
into turnover.

2016 Professional Services Maturity™ Benchmark
© 2016 Service Performance Insight www.FinancialForce.com 195
Recruiting costs were added to the income statement as recruiting costs are large and growing
as firms combat the war for talent.
Similar to every other year, not every question is included in the PS Maturity™ model. Demographic
information in particular is not part of the PS Maturity™ model but helps PS executives better compare
their organizations to the benchmark.
Model Inputs
SPI Research conducts correlation analysis between the questions to determine what, if any, impact
each of the key performance indicators (KPIs) have on each other. The questions were then rated by
relative importance from 0.0 (unimportant) to 1.0 (very important) for each of the KPIs. Each question
was assigned a maximum value based on the answer given and the weight of the question. At the
bottom of each of the following tables is the total maximum value possible in each maturity rating. Here
is a synopsis of the SPI Research methodology:
∆ Factor: Respondent’s unique answers to the given question. Some questions are answered
within a range to reduce the time to complete the survey.
∆ Weight: The relative value of the question as compared to others. Questions were weighted
from 0.0 to 1.0 depending on the overall importance of the question. Questions with a weight
of 1.0 are the most important in determining organizational maturity.
∆ Pillar Correlation: SPI Research incorporates a correlation coefficient for each question to all
pillars, reflecting the inter-relationship that exists between different functions and key
performance metrics within PSOs. Correlations range from -1.0 to 1.0 depending on the KPI’s
negative or positive impact on performance.
∆ Maximum Score: The maximum score for each question is determined by multiplying the
normalized value of the question by its weight. Scores are normalized on a scale from 1 to 100
and then assigned a Maturity Level based on a score from 1 to 5.
The minimum scores for each Pillar are summarized in Table 163. The maximum value is 100, which
means the organization is at the “Optimized” level. By design, maturity scores are relative to the size of
the survey with approximately 5% of organizations designated at Level 5 (Optimized) in any given pillar.
Table 163: Minimum Normalized Performance Pillar Scores
Pillar Level 1 Level 2 Level 3 Level 4 Level 5 Maximum
Leadership (LE) 0.0 47.3 56.1 62.9 71.1 100.0
Client Relationships (CR) 0.0 36.2 43.1 50.8 58.9 100.0
Human Capital (HC) 0.0 47.1 53.7 60.0 66.1 100.0
Service Execution (SE) 0.0 36.1 43.7 50.7 58.0 100.0
Finance & Operations (FO) 0.0 24.7 31.8 41.5 57.3 100.0
Source: Service Performance Insight, February 2016
Moreover, SPI Research assumes 15% perform at Level 4; 25% perform at Level 3; 25% perform at Level
2 and the other 30% perform at Level 1. These scores are slightly different from the 2015 report in most
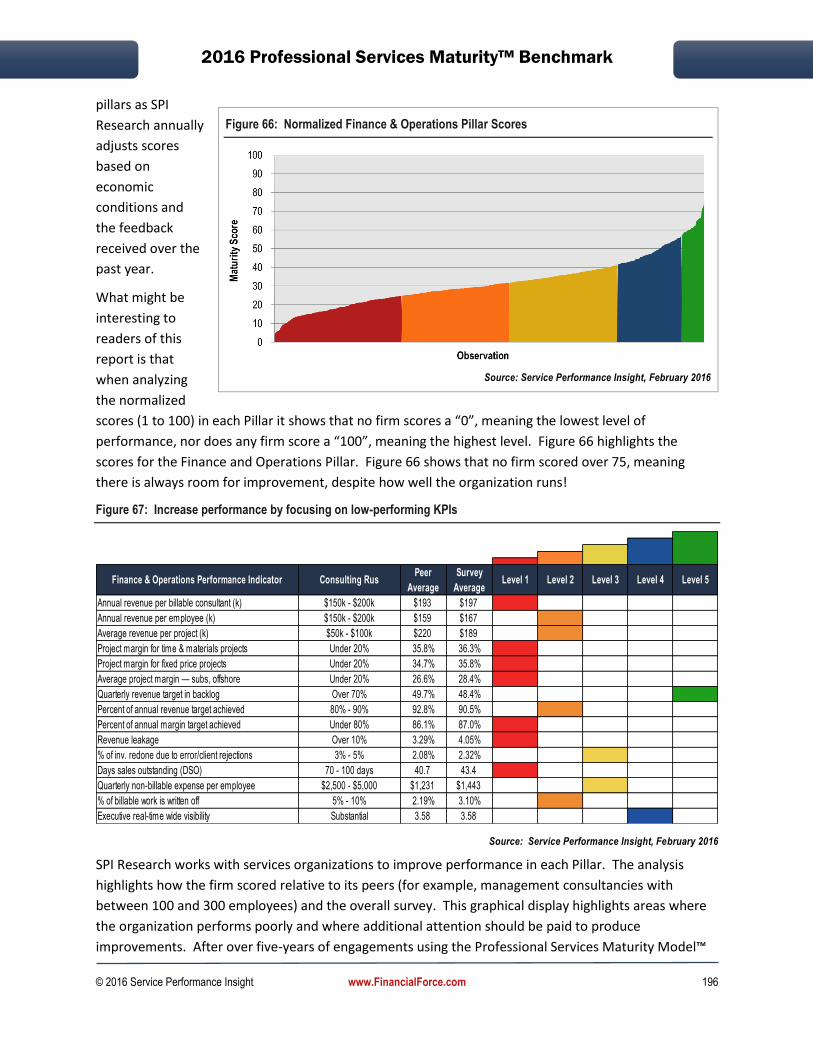
2016 Professional Services Maturity™ Benchmark
© 2016 Service Performance Insight www.FinancialForce.com 196
pillars as SPI
Research annually
adjusts scores
based on
economic
conditions and
the feedback
received over the
past year.
What might be
interesting to
readers of this
report is that
when analyzing
the normalized
scores (1 to 100) in each Pillar it shows that no firm scores a “0”, meaning the lowest level of
performance, nor does any firm score a “100”, meaning the highest level. Figure 66 highlights the
scores for the Finance and Operations Pillar. Figure 66 shows that no firm scored over 75, meaning
there is always room for improvement, despite how well the organization runs!
Figure 67: Increase performance by focusing on low-performing KPIs
Source: Service Performance Insight, February 2016
SPI Research works with services organizations to improve performance in each Pillar. The analysis
highlights how the firm scored relative to its peers (for example, management consultancies with
between 100 and 300 employees) and the overall survey. This graphical display highlights areas where
the organization performs poorly and where additional attention should be paid to produce
improvements. After over five-years of engagements using the Professional Services Maturity Model™
Finance & Operations Performance Indicator Consulting RusPeer
Average
Survey
AverageLevel 1 Level 2 Level 3 Level 4 Level 5
Annual revenue per billable consultant (k) $150k - $200k $193 $197
Annual revenue per employee (k) $150k - $200k $159 $167
Average revenue per project (k) $50k - $100k $220 $189
Project margin for time & materials projects Under 20% 35.8% 36.3%
Project margin for fixed price projects Under 20% 34.7% 35.8%
Average project margin — subs, offshore Under 20% 26.6% 28.4%
Quarterly revenue target in backlog Over 70% 49.7% 48.4%
Percent of annual revenue target achieved 80% - 90% 92.8% 90.5%
Percent of annual margin target achieved Under 80% 86.1% 87.0%
Revenue leakage Over 10% 3.29% 4.05%
% of inv. redone due to error/client rejections 3% - 5% 2.08% 2.32%
Days sales outstanding (DSO) 70 - 100 days 40.7 43.4
Quarterly non-billable expense per employee $2,500 - $5,000 $1,231 $1,443
% of billable work is written off 5% - 10% 2.19% 3.10%
Executive real-time wide visibility Substantial 3.58 3.58
Figure 66: Normalized Finance & Operations Pillar Scores
Source: Service Performance Insight, February 2016
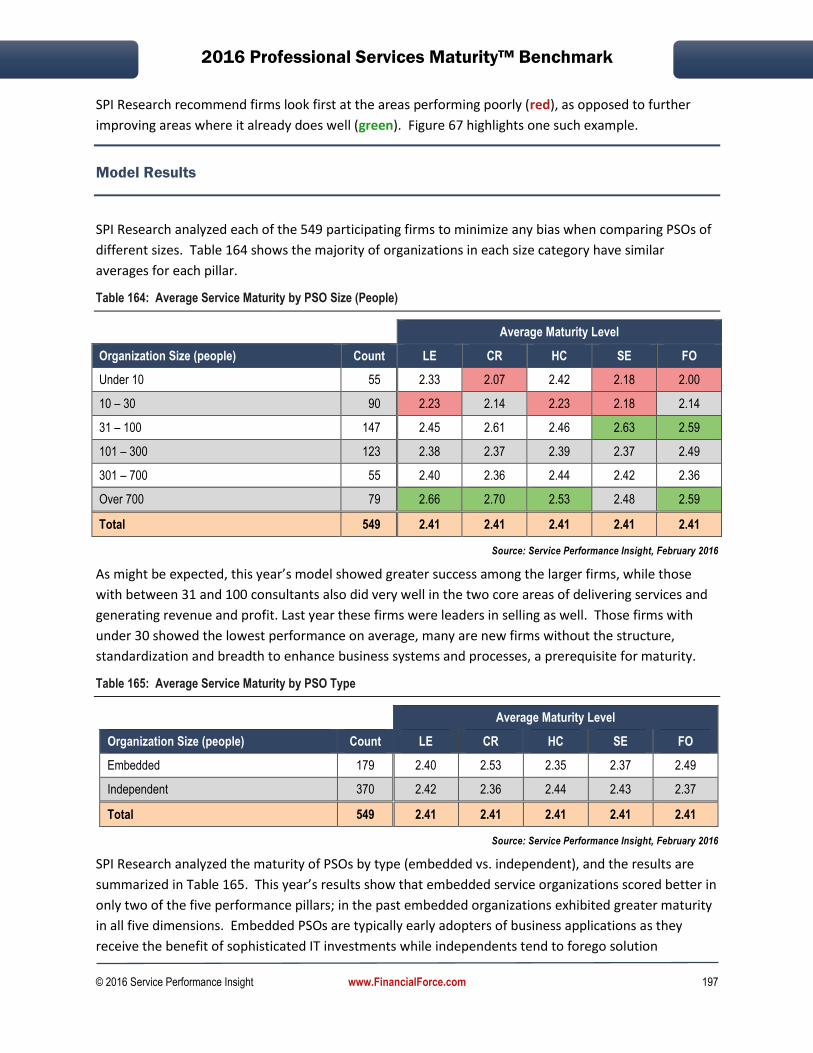
2016 Professional Services Maturity™ Benchmark
© 2016 Service Performance Insight www.FinancialForce.com 197
SPI Research recommend firms look first at the areas performing poorly (red), as opposed to further
improving areas where it already does well (green). Figure 67 highlights one such example.
Model Results
SPI Research analyzed each of the 549 participating firms to minimize any bias when comparing PSOs of
different sizes. Table 164 shows the majority of organizations in each size category have similar
averages for each pillar.
Table 164: Average Service Maturity by PSO Size (People)
Average Maturity Level
Organization Size (people) Count LE CR HC SE FO
Under 10 55 2.33 2.07 2.42 2.18 2.00
10 – 30 90 2.23 2.14 2.23 2.18 2.14
31 – 100 147 2.45 2.61 2.46 2.63 2.59
101 – 300 123 2.38 2.37 2.39 2.37 2.49
301 – 700 55 2.40 2.36 2.44 2.42 2.36
Over 700 79 2.66 2.70 2.53 2.48 2.59
Total 549 2.41 2.41 2.41 2.41 2.41
Source: Service Performance Insight, February 2016
As might be expected, this year’s model showed greater success among the larger firms, while those
with between 31 and 100 consultants also did very well in the two core areas of delivering services and
generating revenue and profit. Last year these firms were leaders in selling as well. Those firms with
under 30 showed the lowest performance on average, many are new firms without the structure,
standardization and breadth to enhance business systems and processes, a prerequisite for maturity.
Table 165: Average Service Maturity by PSO Type
Average Maturity Level
Organization Size (people) Count LE CR HC SE FO
Embedded 179 2.40 2.53 2.35 2.37 2.49
Independent 370 2.42 2.36 2.44 2.43 2.37
Total 549 2.41 2.41 2.41 2.41 2.41
Source: Service Performance Insight, February 2016
SPI Research analyzed the maturity of PSOs by type (embedded vs. independent), and the results are
summarized in Table 165. This year’s results show that embedded service organizations scored better in
only two of the five performance pillars; in the past embedded organizations exhibited greater maturity
in all five dimensions. Embedded PSOs are typically early adopters of business applications as they
receive the benefit of sophisticated IT investments while independents tend to forego solution
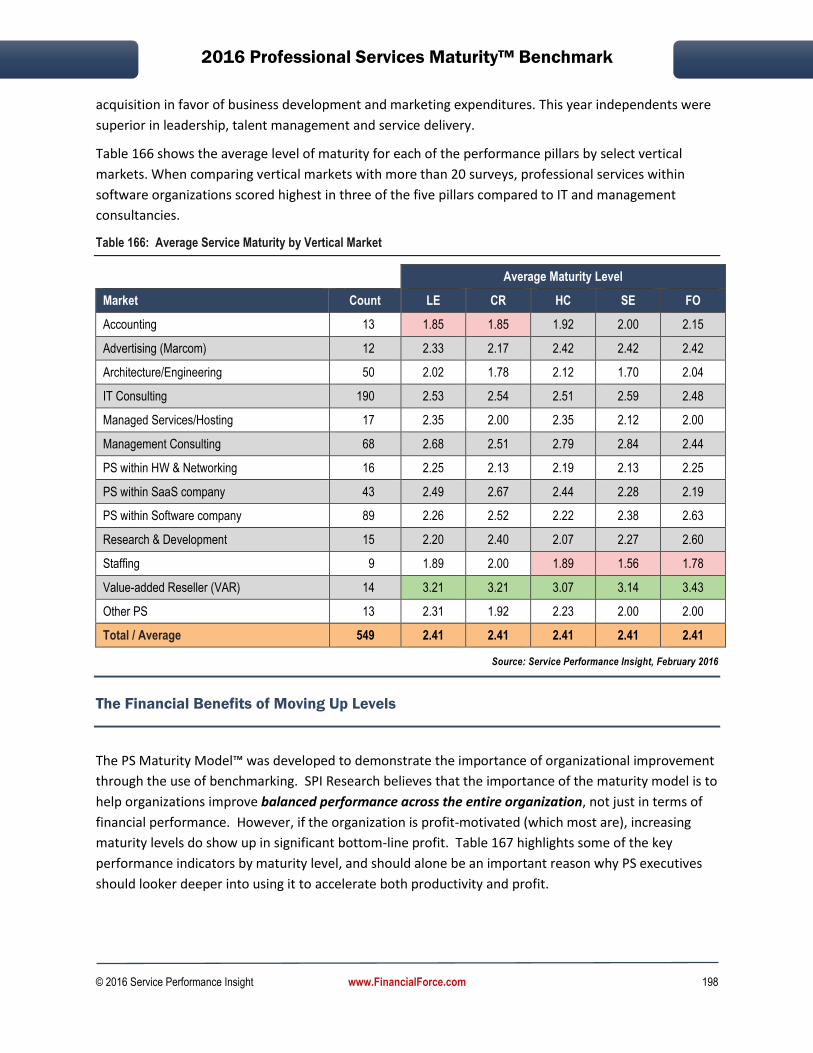
2016 Professional Services Maturity™ Benchmark
© 2016 Service Performance Insight www.FinancialForce.com 198
acquisition in favor of business development and marketing expenditures. This year independents were
superior in leadership, talent management and service delivery.
Table 166 shows the average level of maturity for each of the performance pillars by select vertical
markets. When comparing vertical markets with more than 20 surveys, professional services within
software organizations scored highest in three of the five pillars compared to IT and management
consultancies.
Table 166: Average Service Maturity by Vertical Market
Average Maturity Level
Market Count LE CR HC SE FO
Accounting 13 1.85 1.85 1.92 2.00 2.15
Advertising (Marcom) 12 2.33 2.17 2.42 2.42 2.42
Architecture/Engineering 50 2.02 1.78 2.12 1.70 2.04
IT Consulting 190 2.53 2.54 2.51 2.59 2.48
Managed Services/Hosting 17 2.35 2.00 2.35 2.12 2.00
Management Consulting 68 2.68 2.51 2.79 2.84 2.44
PS within HW & Networking 16 2.25 2.13 2.19 2.13 2.25
PS within SaaS company 43 2.49 2.67 2.44 2.28 2.19
PS within Software company 89 2.26 2.52 2.22 2.38 2.63
Research & Development 15 2.20 2.40 2.07 2.27 2.60
Staffing 9 1.89 2.00 1.89 1.56 1.78
Value-added Reseller (VAR) 14 3.21 3.21 3.07 3.14 3.43
Other PS 13 2.31 1.92 2.23 2.00 2.00
Total / Average 549 2.41 2.41 2.41 2.41 2.41
Source: Service Performance Insight, February 2016
The Financial Benefits of Moving Up Levels
The PS Maturity Model™ was developed to demonstrate the importance of organizational improvement
through the use of benchmarking. SPI Research believes that the importance of the maturity model is to
help organizations improve balanced performance across the entire organization, not just in terms of
financial performance. However, if the organization is profit-motivated (which most are), increasing
maturity levels do show up in significant bottom-line profit. Table 167 highlights some of the key
performance indicators by maturity level, and should alone be an important reason why PS executives
should looker deeper into using it to accelerate both productivity and profit.
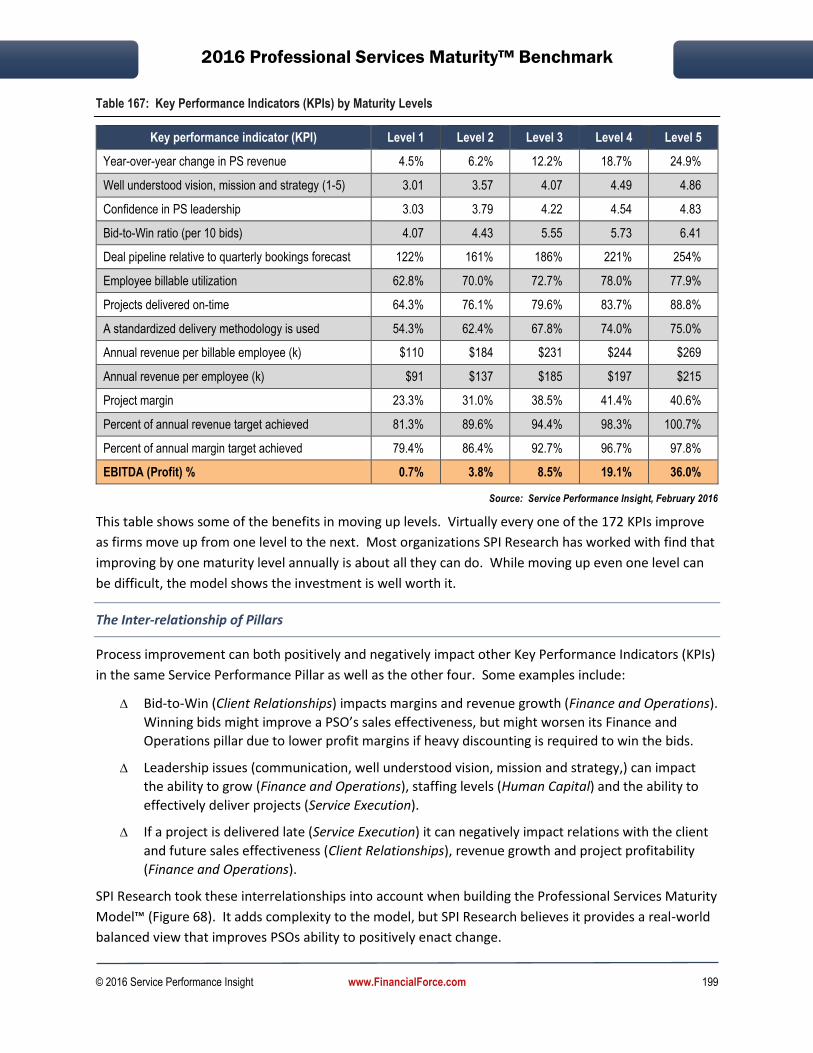
2016 Professional Services Maturity™ Benchmark
© 2016 Service Performance Insight www.FinancialForce.com 199
Table 167: Key Performance Indicators (KPIs) by Maturity Levels
Key performance indicator (KPI) Level 1 Level 2 Level 3 Level 4 Level 5
Year-over-year change in PS revenue 4.5% 6.2% 12.2% 18.7% 24.9%
Well understood vision, mission and strategy (1-5) 3.01 3.57 4.07 4.49 4.86
Confidence in PS leadership 3.03 3.79 4.22 4.54 4.83
Bid-to-Win ratio (per 10 bids) 4.07 4.43 5.55 5.73 6.41
Deal pipeline relative to quarterly bookings forecast 122% 161% 186% 221% 254%
Employee billable utilization 62.8% 70.0% 72.7% 78.0% 77.9%
Projects delivered on-time 64.3% 76.1% 79.6% 83.7% 88.8%
A standardized delivery methodology is used 54.3% 62.4% 67.8% 74.0% 75.0%
Annual revenue per billable employee (k) $110 $184 $231 $244 $269
Annual revenue per employee (k) $91 $137 $185 $197 $215
Project margin 23.3% 31.0% 38.5% 41.4% 40.6%
Percent of annual revenue target achieved 81.3% 89.6% 94.4% 98.3% 100.7%
Percent of annual margin target achieved 79.4% 86.4% 92.7% 96.7% 97.8%
EBITDA (Profit) % 0.7% 3.8% 8.5% 19.1% 36.0%
Source: Service Performance Insight, February 2016
This table shows some of the benefits in moving up levels. Virtually every one of the 172 KPIs improve
as firms move up from one level to the next. Most organizations SPI Research has worked with find that
improving by one maturity level annually is about all they can do. While moving up even one level can
be difficult, the model shows the investment is well worth it.
The Inter-relationship of Pillars
Process improvement can both positively and negatively impact other Key Performance Indicators (KPIs)
in the same Service Performance Pillar as well as the other four. Some examples include:
∆ Bid-to-Win (Client Relationships) impacts margins and revenue growth (Finance and Operations).
Winning bids might improve a PSO’s sales effectiveness, but might worsen its Finance and
Operations pillar due to lower profit margins if heavy discounting is required to win the bids.
∆ Leadership issues (communication, well understood vision, mission and strategy,) can impact
the ability to grow (Finance and Operations), staffing levels (Human Capital) and the ability to
effectively deliver projects (Service Execution).
∆ If a project is delivered late (Service Execution) it can negatively impact relations with the client
and future sales effectiveness (Client Relationships), revenue growth and project profitability
(Finance and Operations).
SPI Research took these interrelationships into account when building the Professional Services Maturity
Model™ (Figure 68). It adds complexity to the model, but SPI Research believes it provides a real-world
balanced view that improves PSOs ability to positively enact change.
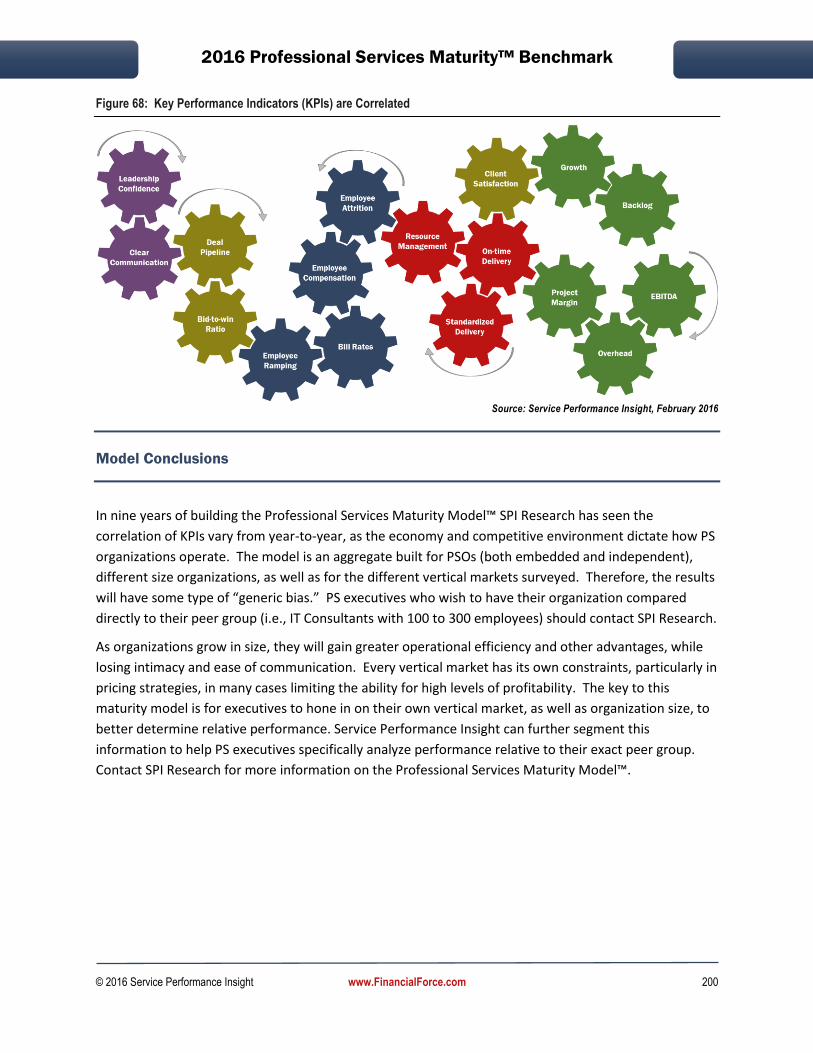
2016 Professional Services Maturity™ Benchmark
© 2016 Service Performance Insight www.FinancialForce.com 200
Figure 68: Key Performance Indicators (KPIs) are Correlated
Source: Service Performance Insight, February 2016
Model Conclusions
In nine years of building the Professional Services Maturity Model™ SPI Research has seen the
correlation of KPIs vary from year-to-year, as the economy and competitive environment dictate how PS
organizations operate. The model is an aggregate built for PSOs (both embedded and independent),
different size organizations, as well as for the different vertical markets surveyed. Therefore, the results
will have some type of “generic bias.” PS executives who wish to have their organization compared
directly to their peer group (i.e., IT Consultants with 100 to 300 employees) should contact SPI Research.
As organizations grow in size, they will gain greater operational efficiency and other advantages, while
losing intimacy and ease of communication. Every vertical market has its own constraints, particularly in
pricing strategies, in many cases limiting the ability for high levels of profitability. The key to this
maturity model is for executives to hone in on their own vertical market, as well as organization size, to
better determine relative performance. Service Performance Insight can further segment this
information to help PS executives specifically analyze performance relative to their exact peer group.
Contact SPI Research for more information on the Professional Services Maturity Model™.

2016 Professional Services Maturity™ Benchmark
© 2016 Service Performance Insight www.FinancialForce.com 201
12. Conclusions and Recommendations
This report is SPI Research’s ninth such endeavor, how time flies! Each year the benchmark reveals
fresh insights into the professional services market, and the issues impacting its growth, performance
and profitability. The significant number of responses this year shows just how much the Professional
Services Maturity™ Benchmark and Professional Services Maturity Model™ are valued by professional
service executives around the world. You can take advantage of this information in a variety of ways: to
benchmark your organization and work to “get the red out” or to use the Professional Services Maturity
Model™ to efficiently determine where you should focus and prioritize your transformational energies.
Regardless, we hope you find it beneficial in better understanding your organization and how you
compare to your peers and the industry at large.
2015 Ended in Uncertainty
2015 started off strong but ended with increased global uncertainty. Some economic analysts are even
starting to use the dreaded “R” word (recession) to describe the 2016 economic climate. Growing
competition drove lower sales pipelines, fewer winning bid percentages and decreased backlog. These
sales factors, coupled with an increased level of employee attrition (both voluntary and involuntary),
caused ripples in market growth. Although there were reductions in many key financial metrics, there
was one notable exception, the one that matters most – profitability, which actually rose to its highest
level in four years. What continues to be amazing in the professional services market is that revenue
growth is always higher than employee headcount growth, meaning professional services organizations
continually improve service delivery efficiency.
The Promise of 2016
2016 is a new year, and regardless of the volatility shown in the first two months, the promise of on-
going prosperity in professional services remains high. In each of the PS markets, there is optimism in
the air:
Technology complexity is increasing exponentially. The variety, overlap, interdependence and
pace of new technology introduction is only accelerating. IT consultants will be called upon to
make sense of it all to create greater efficiencies while containing costs through information
visibility. Most IT consultancies have already stared hitching their wagons to the cloud; this is
where growth and future revenues will come from.
Management consultancies are in higher demand as a result of a changing market dynamics,
which necessitate the need for new strategies, mergers and acquisitions, business process
improvement and transformation. As global expansion becomes increasingly prevalent in all
industries, management consultancies must be there to help navigate complex waters.

2016 Professional Services Maturity™ Benchmark
© 2016 Service Performance Insight www.FinancialForce.com 202
As top-line growth slows, embedded PS organizations within product companies are being ask to
produce more profit. Customer adoption and expansion are still top priorities but firms are
waking up to the potential of higher level services as a catalyst to drive customer value. Look for
the embedded PS organizations to offer an exciting array of unique customer insights and
accelerators. Service productizing and packaging are the key to unlocking more customer value
without wasting precious time and money. PS leaders are finally getting a seat at the executive
table. Many are assuming a new role of Chief Customer or Chief Service executive, charged
with leading and aligning support, PS and account management functions.
The world is changing, and architects and engineers look to show solid growth in the upcoming
decade as the call for new infrastructure and green technologies necessitate the need to
develop new facilities for both industrial production, retail and housing.
Digital marketing has become critical to the marketing and sales process, and advertising
agencies have made great shifts in the services offered to better pinpoint products and services
to their clients’ base. Marketing and communication firms, although still in love with glitzy ads,
are making their money from on-line advertising. Although creativity is still prized, these firms
are starting to run campaigns like projects with real metrics and measurements. This vertical is
rapidly adopting technology and PS business process maturity to wring greater productivity and
profit from talented social media wizards.
These are just a few of the changes SPI Research sees that will drive the market for professional services
in 2016.
Obviously, in the United States, the world’s largest economy, the presidential election looms, and could
impact the overall direction of the economy and the professional services market. Economic volatility,
increased deficits and reductions in government spending will no doubt continue. China is the wildcard
in the global market equation, as it fights its own issues with security, growth and government
intervention. And of course, oil, with the lowest prices in over a decade, impacts some markets
negatively, but at the same time allows consumers to put more money in their pockets from which to
spend. These issues hopefully will shake out over the next few months.
SPI Research projects moderate but consistent growth in the professional services sector in 2016. Our
clients are already reporting pipeline growth and labor shortages. Many firms are starting to revamp
their recruitment, hiring and retention plans. Undoubtedly, with time, the boom-bust-boom cycle will
sort itself out and the winners will be able to grow revenue and mature their business processes and
systems at the same time.
The Professional Services Maturity™ Model
After nine years of development and enhancement, the Professional Services Maturity™ Model has
become a proven and trusted framework. Each year thousands of organizations use it to improve
organizational productivity and profitability. SPI Research works with a number of firms globally to
ensure their business transformation projects start-off on the right foot. Our fact-based analysis helps

2016 Professional Services Maturity™ Benchmark
© 2016 Service Performance Insight www.FinancialForce.com 203
executive teams coalesce around improvement priorities backed by real metrics and standards. With
over 500 firms participating in this year’s benchmark, SPI Research was better able to analyze additional
PS markets, which will help all PS organizations understand the art of the possible. The drive to
performance improvement begins with the alignment of people, business processes and finances.
Information will continue to be a primary weapon in the quest to increase performance and profit.
SPI Research continues to improve the Professional Services Maturity™ Model, working with PS
executives on additions and enhancements, as well as further data analysis to determine new and
potentially revealing correlations that can have a positive impact on performance.
One of the key benefits of the PS Maturity Model™ and benchmark is that it provides clear metrics and
guidance on over 200 key performance measurements. SPI Research believes running a service
organization is a game of singles and doubles. Small percentage improvements in just a few key
performance areas have a compounding and dramatic impact on bottom-line results. PS executives
often feel isolated and have a limited support base within their companies to rely on for advice. The
Professional Services Maturity™ Benchmark and its associated score-carding process takes the emotion
and guesswork out of metrics. Completing the PS Maturity™ survey highlights gaps in information while
enabling PSOs to conduct their own self-assessment.
Focus on performance improvement
In the PS industry, constant change and improvement is a way of life. No firm can maintain the status
quo without anticipating and taking advantage of change. In this industry staying the same means falling
behind. Conditions and regulations change, so do client needs, technologies, and the workforce. PS
executives who embrace change can better prepare their organization for the future challenges and
opportunities that lie ahead.
SPI Research continues to advocate how PSOs should implement their performance improvement
initiatives:
1. Start with market positioning. Develop a winning strategy. A best practice is to annually revisit the organization’s market position, strengths, weaknesses and competitive threats. This benchmark has proven time and again that a rising tide floats all boats. Firms that are well-positioned in growth markets or are clearly the experts in their specialty area are always the winners. Me too organizations who don’t bring fresh new ideas and competencies quickly become irrelevant. This people-based business has in infinite capacity for too much work but becomes disenfranchised and complacent with not enough new and stimulating work.
2. Begin with Pillars that offer the greatest benefit: Establish “quick wins” and “big wins”. But not too many of them. PSOs should give the greatest attention to those pillars (functions, processes and systems) that can demonstrate the greatest value to the organization from improvement. Determine the expected impact of improving each pillar by one level of maturity, and then calculate the investment required, actions and owners to develop an action plan.
3. Develop teams to address Performance Pillars: Put someone in charge. Improvement priorities are typically assigned on top of already over-worked managers. PS executives should seriously
2016 Professional Services Maturity™ Benchmark
© 2016 Service Performance Insight www.FinancialForce.com 204
consider building teams, led by subject matter experts, and supported with funding and executive guidance to address each of the five performance pillars. Their initial focus should be to compare the organization with this benchmark, and determine ways to improve each service performance pillar to an acceptable level.
4. Startup Improvement — get clients: Start-up PSOs should concentrate on client acquisition and the successful deployment of early customers. Ensuring the success of early customers trumps all other activities including services revenue and profitability. Continue to build technical and domain knowledge as well as recruit a consulting organization and start developing an operational infrastructure.
5. Manage, report and celebrate success: Executives responsible for individual pillar improvement should carefully monitor and measure success, and report back to the organization as a whole. This will keep executive commitment from waning; showing the entire PSO the possibilities if they stay focused.
These recommendations are still as vital today as they were when we introduced the Professional
Services Maturity™ Benchmark, and SPI Research believes that 2016 could be the year to embark on a
business transformation — to position the organization for success when the market picks up.
Remember, get the red out first
A key take-away from this study is the leverage effect of concentrating on the Human Resource and
Client relationship pillars. These two pillars provide the greatest performance improvement potential
and impact on service revenue, margin and customer satisfaction. Talent continues to be a great
concern and so does sales and marketing effectiveness. Two of the most important key performance
indicators in determining the overall health of the organization are attrition (which is rising rapidly) and
bill rates (which now are under increased pressure to rise to keep up with costs). If your organization
scores low in either the Human Capital or Client Relationship pillar these should become primary focus
areas for improvement.
Implement an Information Strategy with Clear Performance Objectives and Demonstrable Results
For nearly a decade SPI Research has analyzed the impact of information-driven business solutions, and
their ability to provide value. We have seen dramatic improvements when professional services
organizations implement new technologies, but only when executives understand how applications are
used, and embrace their use. Integration of these applications is key, as greater visibility across the
organization yields significant performance improvements. Social, Mobile, Analytics and Collaboration
(SMAC) applications have become increasingly important at the executive level. They provide the
necessary information required to collaborate and make informed decisions in real time. An informed
organization armed with the skills and tools they need will be better prepared to compete in the new
decade.
Begin with the core financial management solution (ERP), then focus on client relationship management
(CRM), and then professional services automation (PSA). In the next few years’ human capital
management (HCM) solutions will become increasingly important as talent issues loom. And of course,

2016 Professional Services Maturity™ Benchmark
© 2016 Service Performance Insight www.FinancialForce.com 205
business intelligence (BI) has gained wider adoption, as executives realize the importance of deep
analysis into the success and failures of their organization.
And also don’t forget other supporting applications such as remote service delivery, knowledge
management, project portfolio management and social. These applications have become increasingly
prevalent in professional services as organizations work to improve communication and collaboration
both internally and externally.
We thank everyone who participated and contributed to this body of work. We will continue to improve
the model to help organizations around the world improve operational performance and profit.
Sincerely,
Jeanne Urich and David Hofferberth
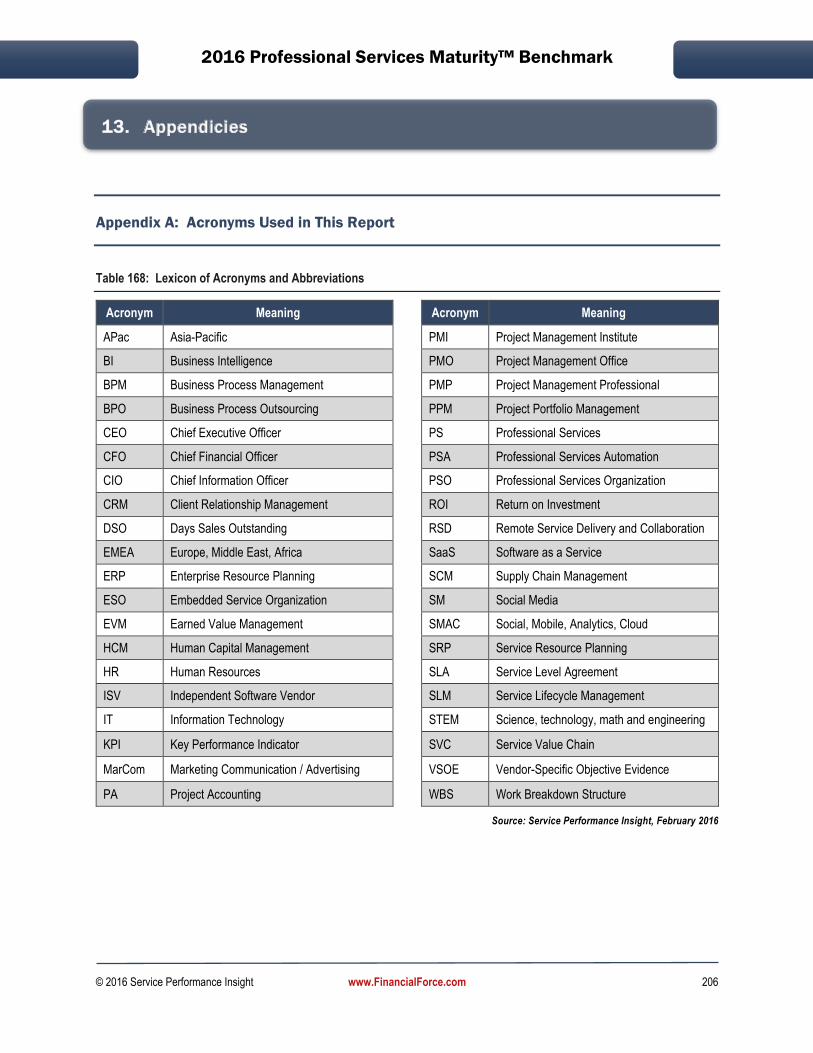
2016 Professional Services Maturity™ Benchmark
© 2016 Service Performance Insight www.FinancialForce.com 206
13. Appendicies
Appendix A: Acronyms Used in This Report
Table 168: Lexicon of Acronyms and Abbreviations
Acronym Meaning Acronym Meaning
APac Asia-Pacific PMI Project Management Institute
BI Business Intelligence PMO Project Management Office
BPM Business Process Management PMP Project Management Professional
BPO Business Process Outsourcing PPM Project Portfolio Management
CEO Chief Executive Officer PS Professional Services
CFO Chief Financial Officer PSA Professional Services Automation
CIO Chief Information Officer PSO Professional Services Organization
CRM Client Relationship Management ROI Return on Investment
DSO Days Sales Outstanding RSD Remote Service Delivery and Collaboration
EMEA Europe, Middle East, Africa SaaS Software as a Service
ERP Enterprise Resource Planning SCM Supply Chain Management
ESO Embedded Service Organization SM Social Media
EVM Earned Value Management SMAC Social, Mobile, Analytics, Cloud
HCM Human Capital Management SRP Service Resource Planning
HR Human Resources SLA Service Level Agreement
ISV Independent Software Vendor SLM Service Lifecycle Management
IT Information Technology STEM Science, technology, math and engineering
KPI Key Performance Indicator SVC Service Value Chain
MarCom Marketing Communication / Advertising VSOE Vendor-Specific Objective Evidence
PA Project Accounting WBS Work Breakdown Structure
Source: Service Performance Insight, February 2016

2016 Professional Services Maturity™ Benchmark
© 2016 Service Performance Insight www.FinancialForce.com 207
Appendix B: Financial Terminology
The following table contains a list of standard key performance measurement terms and definitions
used in the benchmark report. The terms and definitions have been compiled from our knowledge and
experience and a variety of sources including www.wikipedia.org http://www.investopedia.com and
Morris, Manning and Martin, LLP. SPI Research is interested in expanding and evolving common key
performance measurements, standards and definitions for Professional Service organizations. If you
would like to add terms or suggest changes, your comments and suggestions will be appreciated.
Table 169: Standard Key Performance Indicator (KPI) Definitions
Term Definition
70% utilization ~ 1,400 billable hours/year or 350 hours/quarter
Allocations Corporate allocations refer to a company’s policy of distributing the cost of shared resources, for example, facilities, healthcare, IT and Sales, General and Administrative (SG&A) costs to specific functions or departments.
Annual Billable Utilization %
Annual Billable Hours/(2080 hours – vacation and holidays) or
Billable days/(260 days – 10 vacation – 10 holidays ~ 240 days)
Attrition % Attrition % = (Voluntary + involuntary) / Total Beginning Employees
Backlog
Backlog = Bookings - Billings
The total value of contract commitments yet to be executed:
Total Backlog = Previous fiscal year’s contracts not yet billed
+ Latest fiscal year’s sales
- Latest fiscal year’s revenue
Bid Win Ratio The ratio of successful bids (resulting in signed contracts) divided by the total number of bids or proposals issued. Bid Win ratio is a good measure of sales and marketing effectiveness because it demonstrates the organization is pursuing appropriate types of business and is able to beat its competitors.
Billings Completed, accepted work that can been billed (T&M, Work in process, Milestone, Deliverables)
Bookings Signed Contracts (signed PS Agreement + signed SOW + PO)
Burdened Cost Typically employee burdened costs are the costs per employee for benefits (Healthcare, Pensions, 401K) and an apportioned cost for the employee’s facility and IT usage + all discretionary expense. The difference between burdened cost and fully burdened cost is that fully burdened cost includes an allocation for corporate SG&A costs.
Capitalization
Expensed computing equipment: expenses (typically less than $100k) vs. capitalized (paid for over a time period). Servers for example, are typically capitalized and depreciated over a 3 year period. Capital expenditures usually refer to expenses a company makes for property, buildings or equipment. Capitalized items typically have a useful life of several years.
Cash The value of the most liquid assets within the balance sheet. Cash equivalents are assets such as money market accounts that can be accessed quickly and are not subject to significant change. Does not include the value of accounts receivable.
Cash flow Is the balance of the amounts of cash being received and paid by a business during a defined period of time, sometimes tied to a specific project. The timing of cash flows into and out of projects is used as input to financial models such as internal rate of return, and net present value.
Cost per person Cost Per person = Base + Fringe (~25%) + Bonus

2016 Professional Services Maturity™ Benchmark
© 2016 Service Performance Insight www.FinancialForce.com 208
Term Definition
Days Sales Outstanding (DSO)
A measure of the average number of days that it takes a company to collect revenue after a sale has been made and a bill has been issued. A low DSO means that it takes a company fewer days to collect its accounts receivable. A high DSO means that a company is selling its product to slow-paying customers and it is taking longer to collect money. Days sales outstanding is calculated as:
DSO is a key performance measurement of the credit-worthiness of a company’s clients; a general indicator for client satisfaction and the effectiveness of the billing and collection process. DSO is reported either quarterly or annually.
Depreciation An expense recorded to allocate a tangible asset's cost over its useful life. Because depreciation is a non-cash expense, it increases free cash flow while decreasing reported earnings.
Direct Costs Cost incurred as a direct consequence of producing a good or service, as opposed to overhead or indirect costs.
EBITDA
Earnings Before Interest, Taxes, Depreciation and Amortization.
EBITDA is essentially net Income with interest, taxes, depreciation, and amortization added back to it. EBITDA can be used to analyze and compare profitability between companies and industries because it eliminates the effects of financing and accounting decisions. However, this is a non-GAAP measure that allows a greater amount of discretion as to what is (and is not) included in the calculation. This also means that companies often change the items included in their EBITDA calculation from one reporting period to the next.
EITF
An organization formed in 1984 by the Financial Accounting Standards Board (FASB) to provide assistance with timely financial reporting. The EITF holds public meetings in order to identify and resolve accounting issues occurring in the financial world. EITF 08-01 and EITF 09-03 are scheduled to go into effect in June, 2010. These new rulings provide revenue recognition guidelines around the value of multi-element contracts which include products and services. These new rulings will allow companies to more accurately recognize revenue as services are delivered for complex multi-element contracts. They create a hierarchy of evidence to support revenue recognition including VSOE (Vendor Specific Objective Evidence), TPE (Third Party Evidence) and ESP (Estimated Selling Price).
FASB
A seven-member independent board consisting of accounting professionals who establish and communicate standards of financial accounting and reporting in the United States. FASB standards, known as generally accepted accounting principles (GAAP), govern the preparation of corporate financial reports and are recognized as authoritative by the Securities and Exchange Commission.
Fixed Costs Fixed costs are costs that remain the same regardless of changes in the business. For example, facility lease costs remain the same for the life of the lease, regardless of the level of occupancy. If the business is expanding, the percentage of fixed costs may decrease whereas if the business is contracting, the percentage of fixed costs may increase.
Fringe Benefits
A collection of various benefits provided by an employer, which are exempt from taxation as long as certain conditions are met. Fringe benefits commonly include health insurance, group term life coverage, education reimbursement, childcare and assistance reimbursement, cafeteria plans, employee discounts, personal use of a company owned vehicle and other similar benefits.
Gross Margin
Gross Margin = (Total Services Revenue – Expense or Cost to Deliver the Services)
The gross profit generated per dollar of services delivered.
A company's total sales revenue minus its cost of goods or services sold. This dollar amount represents the gross amount of money the company generated over the cost of producing its goods or services.
Gross Margin Percentage
Gross Margin % = (Total Services Revenue – Expense or Cost of Services Delivered) / Total Services Revenue
Gross Margin %= Gross Margin / Revenue
Gross Profit Percentage
A company's total sales or service revenue minus cost of goods or services sold, divided by the total sales revenue, expressed as a percentage. Gross profit and gross margin are used interchangeably.

2016 Professional Services Maturity™ Benchmark
© 2016 Service Performance Insight www.FinancialForce.com 209
Term Definition
Income Statement or Profit and Loss Statement
A financial statement that summarizes the revenues, costs and expenses incurred during a specific period of time - usually a fiscal quarter or year. The statement of profit and loss follows a general format that begins with an entry for revenue and subtracts from revenue the costs of running the business, including cost of goods sold, operating expenses, tax expense and interest expense. The bottom line is net income (profit).
Labor Burdened Cost
Labor Burdened Cost per Productive Hour (or Fully-burdened Cost) (Labor Burdened Cost + gross payroll labor cost) ÷ the number of actual work (productive) hours
Number of actual productive hours ÷ the total additional cost of the employee = Employee labor burden cost per productive hour
Labor Multiplier
Labor multiplier = total $ amount of labor hours billed / fully loaded (burdened) labor cost
Note: a labor multiplier of 1.0 indicates a breakeven point.
Any usability cost-benefit analysis should value people's time based on their fully loaded cost and not simply on their take-home salary. The cost to a company of having a staff member work for an hour is not that person's hourly rate but also includes the cost of benefits, bonuses, vacation time, facility costs (office space, heating and cleaning, computers etc.), and the many other costs associated with having that person employed.
The simplest way to derive the average loaded cost of an employee is to add up all corporate or division expenses and divide by the total number of productive hours worked.
Commonly, the fully loaded cost of an employee is at least twice his or her salary. This is why consultants charge so much more than regular employees: their billable hours have to cover the many overhead costs that are implicit for full-time employees. In fact, looking at common consulting rates for the kind of staff you are dealing with is a shortcut for estimating the fully loaded value of your employees' time.
EXAMPLE:
base rate/hour (BR)= dollar per hour pay for the staff category
OH multiplier (OHM) = firm's overhead (OH) percentage + 100%
Profit multiplier (PM)= profit percentage + 100%
"loaded" rate/hour = BR X OHM X PM
Base rate/hour= $45.00 per hour
overhead multiplier = 135% overhead + 100% = 235% = 2.35
Profit multiplier = 10% profit + 100% = 110% = 1.1
"loaded" rate/hour = $45.00 X 2.35 X 1.1
Lagging Indicators
Investopedia explains LAGGING INDICATORS Lagging indicators confirm long-term trends, but they do not predict them. Some examples are unemployment, corporate profits and labor cost per unit of output. Interest rates are another good lagging indicator as interest rates change after severe market changes.
In services, billable utilization, revenue per person and net profits are lagging indicators because they reflect changes in market conditions after the change has already occurred.

2016 Professional Services Maturity™ Benchmark
© 2016 Service Performance Insight www.FinancialForce.com 210
Term Definition
Leading Indicators
A measurable economic factor that changes before the economy starts to follow a particular pattern or trend. Leading indicators are used to predict changes in the economy, but are not always accurate. In services, leading indicators are backlog and sales pipeline because they are predictors of future revenue.
What Does the COMPOSITE INDEX OF LEADING INDICATORS Mean? An index published monthly by the Conference Board used to predict the direction of the economy's movements in the months to come. The index is made up of 10 economic components, whose changes tend to precede changes in the overall economy. These 10 components include: 1. The average weekly hours worked by manufacturing workers 2. The average number of initial applications for unemployment insurance 3. The amount of manufacturers' new orders for consumer goods and materials 4. The speed of delivery of new merchandise to vendors from suppliers 5. The amount of new orders for capital goods unrelated to defense 6. The amount of new building permits for residential buildings 7. The S&P 500 stock index 8. The inflation-adjusted monetary supply (M2) 9. The spread between long and short interest rates
10.Consumer sentiment
Loaded Cost per Person
Base + Fringe Benefits (~25%) + Target Variable Compensation + % Corporate and Practice Overhead allocation per person. Non-billable time (bench time) must be added to calculate the actual cost per hour of productive time.
Margin % Margin % = (Revenue - Cost)/Revenue
Markup %
Markup % = (Revenue-Cost)/Cost
For example, 60% markup = 40% margin
Measurement Utilization %
Billable Hours + Approved non-billable hours (pre-sales, Customer Satisfaction, Special Projects)/(2080 hours or 260 days -vacation and holidays)
Measurement Utilization
Measurement Utilization = (Billable Hours + Approved non-billable hours)/ (2080 hours – Vacations – Holidays) Approved non-billable hours are usually associated with presales, overtime not billed to clients, customer satisfaction resolution time, internal projects or skills training.
Net Income
A company's total earnings (or profit). Net income is calculated by taking revenues and adjusting for the cost of doing business, depreciation, interest, taxes and other expenses. This number is found on a company's income statement and is an important measure of how profitable the company is over a period of time. The measure is also used to calculate earnings per share.
Often referred to as "the bottom line" since net income is listed at the bottom of the income statement.
Net income is calculated by starting with a company's total revenue. From this, the cost of sales, along with any other expenses that the company incurred during the period, is removed to reach earnings before tax. Tax is deducted from this amount to reach the net income number.
Non-billable Travel
Non-billable travel expense represents travel expense which cannot be re-billed to a client. Typically consulting non-billable travel is associated with business development or training activities.
On-Target Earnings (OTE)
The typical pay structure for a salesperson is composed of a fairly low basic salary with an additional amount of commission. The package will usually be called OTE or on-target earnings, meaning that if a salesperson hits the specified target, they will be guaranteed that amount of money. A higher commission can be paid if the person performs beyond this target.
Operating Income
Operating income would not include items such as investments in other firms, taxes or interest. In addition, nonrecurring items such as cash paid for a lawsuit settlement are often not included.
Operating income is required to calculate operating margin, which describes a company's operating efficiency.
Operating Income = Gross Income – Operating Expenses – Depreciation
Operating Margin
Operating margin is a measurement of what proportion of a company's revenue is left over after paying for variable costs of service delivery such as wages and benefits.
Operating Margin = Operating Income / Net Sales
Operating Profit = (Total Service Revenue – Total cost of service delivery – Total Operating Expense)/ Total Service Revenue
Operating Profit / Margin
The amount of profit realized from a business's own operations. A ratio used to measure a company's pricing strategy and operating efficiency.
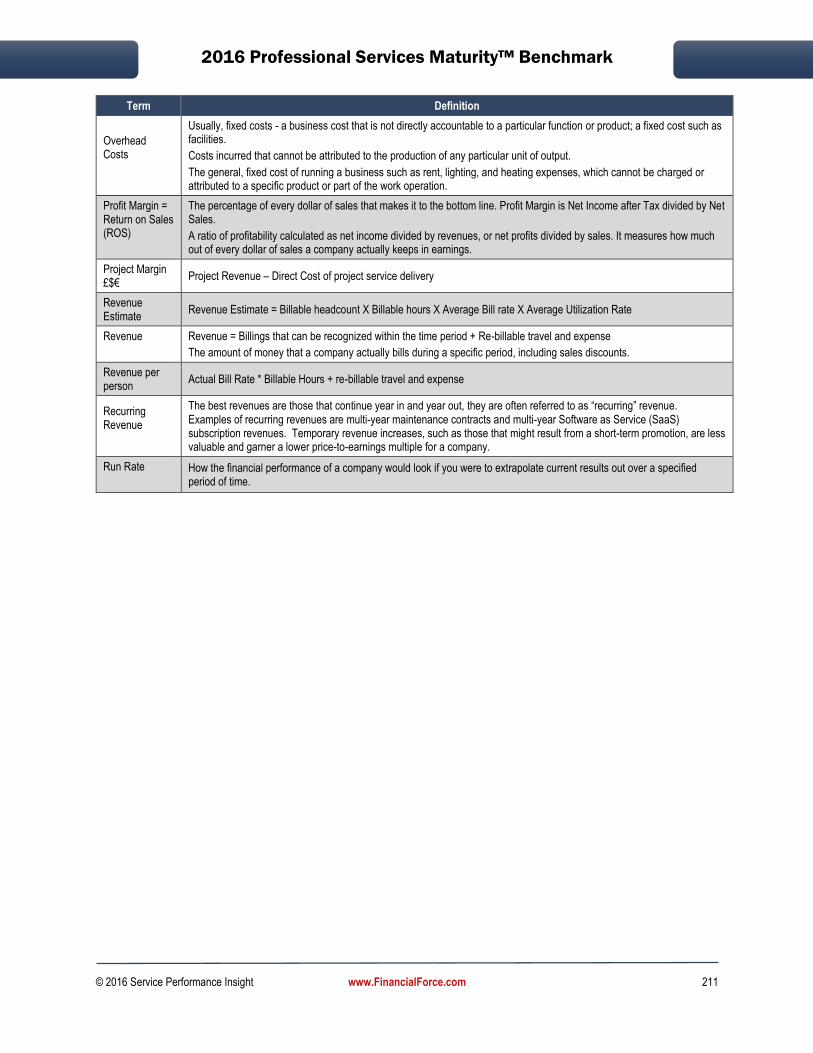
2016 Professional Services Maturity™ Benchmark
© 2016 Service Performance Insight www.FinancialForce.com 211
Term Definition
Overhead Costs
Usually, fixed costs - a business cost that is not directly accountable to a particular function or product; a fixed cost such as facilities.
Costs incurred that cannot be attributed to the production of any particular unit of output.
The general, fixed cost of running a business such as rent, lighting, and heating expenses, which cannot be charged or attributed to a specific product or part of the work operation.
Profit Margin = Return on Sales (ROS)
The percentage of every dollar of sales that makes it to the bottom line. Profit Margin is Net Income after Tax divided by Net Sales.
A ratio of profitability calculated as net income divided by revenues, or net profits divided by sales. It measures how much out of every dollar of sales a company actually keeps in earnings.
Project Margin £$€
Project Revenue – Direct Cost of project service delivery
Revenue Estimate
Revenue Estimate = Billable headcount X Billable hours X Average Bill rate X Average Utilization Rate
Revenue
Revenue = Billings that can be recognized within the time period + Re-billable travel and expense
The amount of money that a company actually bills during a specific period, including sales discounts.
Revenue per person
Actual Bill Rate * Billable Hours + re-billable travel and expense
Recurring Revenue
The best revenues are those that continue year in and year out, they are often referred to as “recurring” revenue. Examples of recurring revenues are multi-year maintenance contracts and multi-year Software as Service (SaaS) subscription revenues. Temporary revenue increases, such as those that might result from a short-term promotion, are less valuable and garner a lower price-to-earnings multiple for a company.
Run Rate
How the financial performance of a company would look if you were to extrapolate current results out over a specified period of time.

2016 Professional Services Maturity™ Benchmark
© 2016 Service Performance Insight www.FinancialForce.com 212
Term Definition
Revenue Recognition
http://www.mmmlaw.com/publications/article_detail.asp?articleid=103
(Selected excerpts from the article)
Any business generating revenue from licensing, selling, leasing or otherwise marketing software will experience serious problems from failure to recognize the significance of the New SOP. This section summarizes the importance of revenue recognition. Revenue recognition is a fundamental component of generally accepted accounting principles (GAAP) and is a key consideration in maintaining the integrity of financial statements. The central issue is one of timing and amount :
When should revenue generated in a software transaction be recognized in a software company’s income statement, and in what amounts?
In most cases, companies strive to recognize revenue as quickly as possible, thereby improving their financial performance. Even private software companies generally try to improve financial performance by accelerating revenues whenever possible. Before issuance of SOP 91-1 in December 1991, there was no specific guidance for recognizing revenue in software transactions. The ensuing lack of uniformity among software companies in their revenue recognition policies led to the inability of third parties to make meaningful comparisons among companies. Similarly, the New SOP is designed to provide even greater uniformity by addressing inconsistent applications of SOP 91-1 in software transactions. Basic Revenue Recognition Criteria. SOP 91-1 and the New SOP each define basic criteria that must be satisfied before revenue can be recognized. Under the New SOP if an arrangement to deliver software does not require significant production, modification, or customization of the software, then the New SOP specifies four criteria which must be met prior to recognizing revenue from a single-element arrangement or for individual elements in a multiple-element arrangement.1 These four criteria are:
1. persuasive evidence of an arrangement exists;
2. delivery has occurred;
3. the software vendor’s fee is fixed or determinable; and
4. Collectability is probable.
Although these basic revenue recognition criteria are substantially the same as those contained in SOP 91-1, the New SOP takes a fundamentally different approach in certain areas such as: (1) providing detailed guidelines for recognition of revenue in "multiple-element arrangements," and (2) eliminating the concept of remaining "significant vendor obligations" under SOP 91-1.
Changing Sales Behavior. A software company’s sales force will be critical to implementation of the New SOP. As a general rule, software companies tend to bundle software and services together in order to offer a turn-key software solution to the buyer. Additionally, the description of and the fees for the software and services being offered are typically combined. This bundling makes the sale easier for a sales representative because it makes the offering easier for the buyer to understand and it prevents the buyer from removing elements of the transaction that the buyer might not otherwise pay for if they knew the individual price for the element. However, the result of this bundling could be a deferral of revenue recognition. Therefore, many software companies will have to change the manner in which their sales personnel work in order to achieve their revenue recognition goals. Sales Force Compensation. From an internal perspective, many companies base compensation and bonus arrangements, at least in part, on recognized revenue within a specified time period. If revenue recognition policies are changed, bonus plans may be affected. With the adoption of the New SOP, benefit plans will require further examination to verify the suitability of these plans in achieving a company's objectives and motivating employees to complete all the requirements for revenue recognition as a basis for earning a bonus.
Subcontractor Margin
Subcontractor Margin = (Total subcontractor generated revenue – total subcontractor cost)/ Total subcontractor generated revenue
Variable Costs Variable costs are costs that vary based upon usage. Training, travel and business expenses are variable, whereas costs for facilities are treated as a “fixed” cost because they do not vary based on use. Commonly variable costs may also be termed “discretionary” because management can make decisions to make or not make the expenditure.

2016 Professional Services Maturity™ Benchmark
© 2016 Service Performance Insight www.FinancialForce.com 213
Term Definition
VSOE
VSOE = Vendor-Specific Objective Evidence (accounting/contracting)
VSOE is the price established by management having relevant authority. Once a firm has established the VSOE price and officially acknowledged it as such, that price must not be expected to change prior to the introduction of that element into the marketplace. The introduction of that deliverable into the marketplace on a separate basis ought to be within a very short period of time after the VSOE price is set. Accounting firms have differing opinions on how long is too long, so make certain you are aware of your accounting firm’s guidelines.
Vendor Specific Objective Evidence (VSOE) is an agreed-upon value for goods and services. For service organizations, VSOE is usually established by the company’s auditors based on historical bill rates or actual realized revenues from service packages. When VSOE service prices are set the effect can be very painful because the firm’s auditors review past engagements to set current VSOE rates. This means if a firm’s services were significantly discounted in the past the service organization will be penalized with “Past sins” when auditors calculate current VSOE rates. With software companies the accepted practice is to amortize each sale across the contract's lifetime and to apply all labor hours whether billable or not.
Source: Investopedia, Wikipedia, Morris, Manning and Martin, LLP, and Service Performance Insight, February 2016
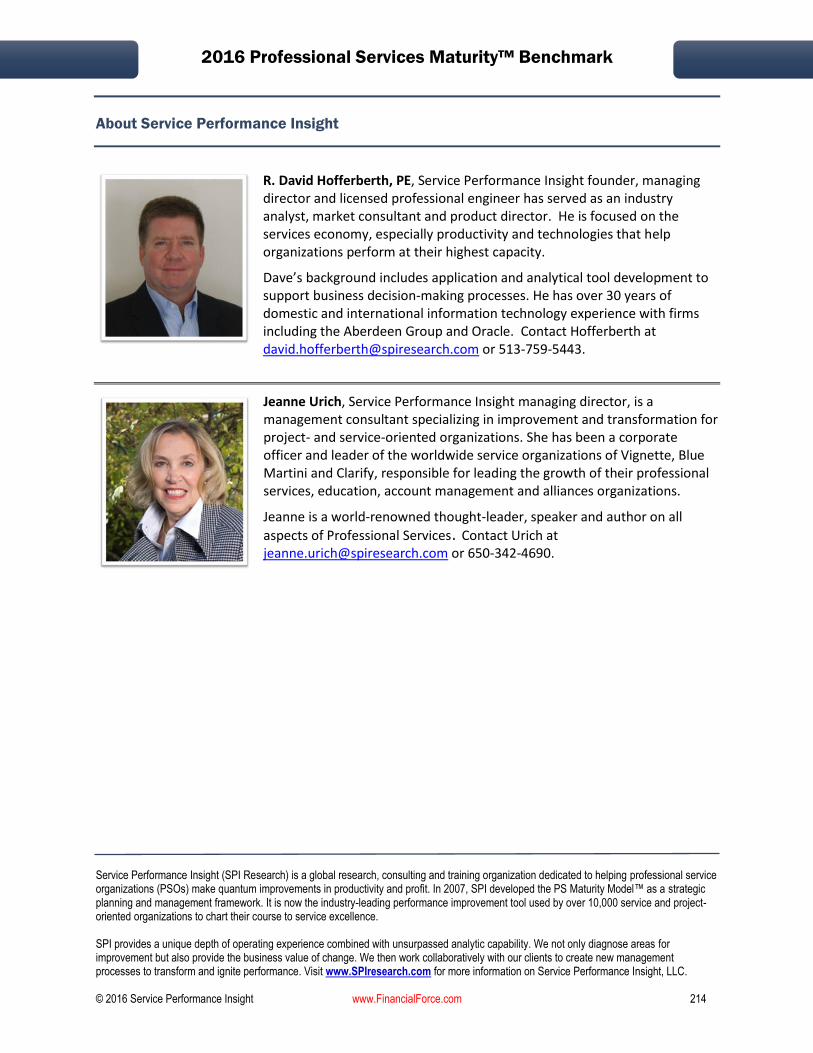
2016 Professional Services Maturity™ Benchmark
Service Performance Insight (SPI Research) is a global research, consulting and training organization dedicated to helping professional service organizations (PSOs) make quantum improvements in productivity and profit. In 2007, SPI developed the PS Maturity Model™ as a strategic planning and management framework. It is now the industry-leading performance improvement tool used by over 10,000 service and project-oriented organizations to chart their course to service excellence. SPI provides a unique depth of operating experience combined with unsurpassed analytic capability. We not only diagnose areas for improvement but also provide the business value of change. We then work collaboratively with our clients to create new management processes to transform and ignite performance. Visit www.SPIresearch.com for more information on Service Performance Insight, LLC. © 2016 Service Performance Insight www.FinancialForce.com 214
About Service Performance Insight
R. David Hofferberth, PE, Service Performance Insight founder, managing director and licensed professional engineer has served as an industry analyst, market consultant and product director. He is focused on the services economy, especially productivity and technologies that help organizations perform at their highest capacity.
Dave’s background includes application and analytical tool development to support business decision-making processes. He has over 30 years of domestic and international information technology experience with firms including the Aberdeen Group and Oracle. Contact Hofferberth at [email protected] or 513-759-5443.
Jeanne Urich, Service Performance Insight managing director, is a management consultant specializing in improvement and transformation for project- and service-oriented organizations. She has been a corporate officer and leader of the worldwide service organizations of Vignette, Blue Martini and Clarify, responsible for leading the growth of their professional services, education, account management and alliances organizations.
Jeanne is a world-renowned thought-leader, speaker and author on all
aspects of Professional Services. Contact Urich at [email protected] or 650-342-4690.