digital maturity within distribution - diva portal1143464/fulltext01.pdf · 2.4 digital maturity 10...
TRANSCRIPT
IN THE FIELD OF TECHNOLOGYDEGREE PROJECT DESIGN AND PRODUCT REALISATIONAND THE MAIN FIELD OF STUDYINDUSTRIAL MANAGEMENT,SECOND CYCLE, 30 CREDITS
, STOCKHOLM SWEDEN 2017
Digital maturity within distributionA study within the Swedish retail industry
BEHROOZ TAVAKOLI
ISMAIL MOHAMMADI
KTH ROYAL INSTITUTE OF TECHNOLOGYSCHOOL OF INDUSTRIAL ENGINEERING AND MANAGEMENT

Digital maturity within distribution A study within the Swedish retail industry
by
Behrooz Tavakoli
Ismail Mohammadi
Master of Science Thesis INDEK 2017:20
KTH Industrial Engineering and Management
Industrial Management
SE-100 44 STOCKHOLM
Digital mognad inom distribution En studie inom den svenska detaljhandeln
av
Behrooz Tavakoli
Ismail Mohammadi
Examensarbete INDEK 2017:20
KTH Industriell teknik och management
Industriell ekonomi och organisation
SE-100 44 STOCKHOLM
Master of Science Thesis INDEK 2017:20
Digital maturity within distribution A study within the Swedish retail industry
Behrooz Tavakoli
Ismail Mohammadi
Approved
2017-June-14
Examiner
Andreas Feldmann
Supervisor
Jannis Angelis
Commissioner
Tieto Sweden AB
Contact person
Laban Sörén
Abstract The digital transformation is affecting every dimension of every business while the retail industry is no exception. The changing expectations from the customer of today set increased requirements on distribution. Correspondingly, it seems that distribution is an area within which digital technologies can have major impact for retail companies. However, there is a lack of practical cases that demonstrate this impact in the Swedish market. As many retailers have started to integrate digital tools within their supply chains, different players have achieved different levels of digital maturity in their distribution.
The purpose of this research is to investigate the digital maturity level of retail companies within distribution as well as their perception of digitalization alongside its impact on distribution processes. The method for data gathering consisted of qualitative interviews in combination with a questionnaire. The collected data in combination with theoretical research was used to fulfill the research purpose.
The analysis revealed the digital maturity level within distribution for ten of Sweden’s largest retailers operating in different branches. All ten case companies were categorized as either Adopters or Collaborators. With respect to what literature have mentioned as benefits of digital distribution, the analysis further revealed the benefits that case companies have gained by digital tools. Cost efficiency, traceability, delivery accuracy, improved lead time, shelf availability, and increased free time in stores were the major benefits gained by digital tools, as described by case companies. Key-words Digital maturity, distribution in Swedish retail, digital distribution maturity, benefits of digitalization, retail distribution, digital supply chain, supply chain responsiveness, largest Swedish retailers, opportunities in distribution, digitalization
Examensarbete INDEK 2017:20
Digital mognad inom distribution En studie inom den svenska detaljhandeln
Behrooz Tavakoli
Ismail Mohammadi
Godkänt
2017-Juni-14
Examinator
Andreas Feldmann
Handledare
Jannis Angelis
Uppdragsgivare
Tieto Sweden AB
Kontaktperson
Laban Sörén
Sammanfattning Den digitala transformationen påverkar alla dimensioner av affärer idag och det gäller även detaljhandeln. I samband med detta förändras kunden förväntningar kontinuerligt vilket sätter nya krav på distributionsprocesser. Med avseende på ovannämnda faktorer kan distribution betraktas som ett område där digitala verktyg kan ha en betydande påverkan för detaljhandeln. Dock brister forskningen i praktiska fall där denna påverkan har demonstrerats i den svenska marknaden. Flera detaljhandelsbolag har börjat integrera digitala verktyg i sin värdekedja, medan olika aktörer har uppnått olika nivåer av digital mognad i sin distribution.
Syftet med denna forskning är att undersöka den digitala mognaden inom distribution för detaljhandelsbolag i samband med att förstå deras syn på digitalisering och dess påverkas på distributionsprocesser. Datainsamlingsmetoden bestod av kvalitativa intervjuer i kombination med en enkätundersökning. Dessa data i kombination med teoretisk forskning bildade grunden för att fullfylla forskningssyftet.
Genom analysen utvärderades den digitala mognaden inom distribution för tio av Sveriges största detaljhandelsbolag. Dessa bolag var verksamma inom olika grenar av detaljhandeln. Samtliga bolag föll i en av kategorierna Adopters eller Collaborators. De fördelar som dessa företag hade vunnit genom digitala verktyg analyserades med avseende på det litteraturen hade nämnt som fördelar från digital distribution. Kostnadseffektivitet, spårbarhet, leveransprecision, förbättrad ledtid, tillgänglighet, och frigjord tid för butikspersonal var de omfattande fördelarna som hade utvunnits genom digitala verktyg i distributionsprocesser.
Nyckelord Digital mognad, distribution i svensk detaljhandel, digital distribution, fördelar med digitalisering, digital värdekedja, responsiveness i värdekedja, digitalisering, möjligheter inom distribution, digitala verktyg i svenska detaljhandeln

Tableofcontents Abstract 4
Key-words 4
Sammanfattning 5
Nyckelord 5
Listoffigures 9
Listoftables 10
Foreword 11
Abbreviations 12
1 Introduction 11.1 Background 11.2 Companybackground 11.3 Problematization 21.4 Purpose 21.5 Preliminaryresearchquestions 21.6 Positionofthestudy 21.7 Contributiontothefield 31.8 Delimitations 31.9 Outlineofthestudy 4
2 Literaturereviewandtheory 52.1 Supplychain 5
2.1.1 Efficient-andResponsivesupplychain 52.2 Distributionwithinsupplychain 62.3 Opportunitiesfromdigitaltechnologies 8
2.3.1 LogisticsvisibilityandRFID 82.3.2 Bigdataforresourceoptimizationanddeterminingbestproductmixperstore 92.3.3 Automaticstorereplenishment 92.3.4 ITsystemsintransportation 10
2.4 Digitalmaturity 102.4.1 DigitalMaturityaccordingtoForrester 112.4.2 OtherDigitalMaturitymodels 132.4.3 Comparingchangemanagementtheorieswithdigitalmaturitymodel 14
3 Method 173.1 Methodsforansweringresearchquestions 173.2 Methodologicalapproach 173.3 Researchdesign 183.4 Pre-study 183.5 Literaturereview 193.6 Datacollection 20
3.6.1 Interviews 203.6.2 Questionnaire 22
3.7 Dataanalysis 233.8 Robustnessofthestudy 23
3.8.1 ConstructValidity 233.8.2 Externalvalidity 233.8.3 Reliability 24
4 Results 254.1 Resultsfromqualitativeinterviews 254.2 ResultsfromQuestionnaire 34
5 Analysis 355.1 RQ1:Howisthedigitalmaturitylevelwithindistributionprocesses? 355.2 RQ2:Howisdigitalizationanditsimpactondistributionperceivedbycompanies? 39
6 Discussion 426.1 Sustainability 43
6.1.1 Economical 446.1.2 Environmental 446.1.3 Social 45
6.2 Managerialimplications 456.3 Futureresearch 46
7 Conclusion 477.1 RQ1:Howisthedigitalmaturitylevelwithindistributionprocesses? 477.2 RQ2:Howisdigitalizationanditsimpactondistributionperceivedbycompanies? 49
Bibliography i
Appendices iAppendix1:Forrester’s28questions iAppendix2:Interviewintroductionandquestions iiAppendix3:Thedigitalmaturityquestionnaire iv
ListoffiguresFigure1.Asimpleillustrationofasupplychain.(Fromlefttoright:manufacturing,warehousing,store).......5Figure2.Efficientandresponsivesupplychains.(Fisher1997).......................................................................6Figure3.Thedistributionprocessinfocusforthestudy.................................................................................7Figure4.Thefourmaindimensionsofdigitalmaturity.(Forrester2016)......................................................11Figure5.Thefourstagesofdigitalmaturity.(Forrester2016)......................................................................12Figure6.Digitalmaturityacrossdifferentindustries.(Forrester2016)..........................................................12Figure7.MIT90'sFramework(Morton1991)................................................................................................14Figure8.Theoverallresearchdesign............................................................................................................18Figure9.Theoverallapproachfordesignofresearchquestions...................................................................19Figure10.Digitalmaturitylevelwithindistributionforallcasecompanies...................................................47Figure11.Thedispersionofdigitalmaturitywithincasecompanies.............................................................48Figure12.Benefitsofdigitaltools,asperceivedbycasecompanies.............................................................49

ListoftablesTable1.Keywordsusedinsearchforrelevantliterature..............................................................................20Table2.Thelistofinterviewedcompanies...................................................................................................21Table3.Thefourdigitalmaturitylevelsaccordingtothenewmodelmodifiedfordistribution....................22Table4.Thescoresforeachcompanybasedonthequestionnaire...............................................................34
Foreword Firstly, we would like to thank our supervisor Jannis Angelis, associate professor of Operations Strategy at the department of Industrial Engineering and Management at Royal Institute of Technology, for his guidance during this research. Moreover, we would like to thank our seminar leader Andreas Feldmann, lecturer and researcher in Supply Chain Management at the department of Industrial Engineering and Management at Royal Institute of Technology, as his help and support has been extremely valuable for us throughout the study. In addition, we would like to express our gratitude to our supervisor at Tieto Sweden, Laban Sörén for his support and collaboration during our project work in the last five months. It has been an amazing learning journey for us, where we grew both personally and professionally. Lastly, we would like to thank all the interviewees from retail companies that through their time and valuable information contributed to the fundamental of this research.
In case you have any questions, please do not hesitate to contact us at any time.
Thank you again and best regards,
Behrooz Tavakoli & Ismail Mohammadi
Stockholm, 2017-05-30
AbbreviationsIT InformationTechnologyPDA PersonalDigitalAssistantWMS WarehouseManagementSystemDC DistributionCenterRFID RadioFrequencyIdentificationGPS GlobalPositioningSystemCPG ConsumerPackagedGoodsPOS PointofSaleCRM CustomerRelationshipManagementERP EnterpriseResourcePlanning
1
1 IntroductionIn this chapter, a brief background of the research area as well as company background is described. This is further followed by the purpose, the research questions, contribution to the field, delimitations, position as well as the outline of the study.
1.1 Background
Digital interaction is constantly increasing and digital technologies are changing the way people live, communicate, and do business. The digital interconnectivity enables businesses to overcome challenges such as differences in geographical locations and helps them to reach more people (Lanzolla & Anderson 2008). The phenomenon digitalization, or digital transformation, is gaining more attention every day while it affects every dimension of the business in almost every industry (Hanifan et al. 2014). It is the process of transforming into a digital world, where traditional operations are replaced by digital technology (Gartner 2016; Hanifan et al. 2014). This is where digital technologies are deployed into the traditional business models in order to provide revenue and value producing opportunities. In this sense, taking advantage of digitalization opens new doors for business opportunities and provides competitive advantage for companies.
The digital transformation affects different sides of the business and supply chain is no exception. In most cases, digitalizing the supply chain leads to reduced costs, increased efficiency, and also greener logistics, creating a more sustainable supply chain (Hanifan et al. 2014). Furthermore, digitalization can create a more transparent and communicative supply chain (Hanifan et al. 2014). When it comes to digital, companies need to reconsider their supply chain strategy to be able to fully take advantage of their capabilities (Hanifan et al. 2014). This means, although some companies might have added digital technologies into their traditional supply chains, they are not able to experience major benefits from these actions. This creates a necessity for complete integration between digitization and supply chain, called a digital supply chain. In the long run, if companies do not digitalize their supply chain, they will fall behind their competitors who have adapted to the transformation and gained competitive advantage with help of digital supply chain. (Hanifan et al. 2014)
Distribution is a part within the supply chain. Today, customer expectations are changing faster than ever before, which sets high demand on distribution processes. Companies are continuously lowering their costs while at the same time improving their distribution responsiveness. (Fischer 1997) In this sense, distribution processes is an area where digital technologies are able to have major impact for companies.
1.2 Companybackground
Tieto is a consultancy firm that is deeply involved in the area of digital. Originally translated to “knowledge factory”, Tietotehdas Oy was founded in 1968 in Finland and operated mainly as an IT company during its beginning period. Today, the company is called Tieto and is a well established Nordic company based in Finland with an approximate annual revenue of €1,5 billion. The IT consulting firm helps other companies to take advantage of valuable information
2
and utilize it for problem solving. The company has four major key areas: cloud, big data, mobility, and social media. Tieto has a significant presence within business renewal by offering tools and services with large focus on modernization, innovation, and digitalization (Tieto.com 2016).
1.3 Problematization
Until few years ago, the preparation and delivery of an ordered product online used to take at least ten days (Kable 2016). Today, customers’ expectations have shifted dramatically and due to the rise of digitalization, they expect personalized products with even faster delivery times. Distribution has a key role in in this area with a large impact on the responsiveness level of the whole supply chain. The aspects of warehousing, logistics, and replenishment are challenges that are directly connected to costs and account for a large part of expenses in the supply chain (Chopra & Meindl 2013). Digital technologies in this sense, seem to be helpful tools that have beneficial impacts on these areas.
As a result, companies have started to embrace the digital transformation to be able to fully take advantage of its offerings. The retail industry is no exception. Many retailers have started to integrate digital technologies and solutions into their business models and processes while addressing their sales and costs challenges. (Accenture 2014) Through their investments and initiatives, different players have achieved different levels of digital maturity in their transition. Subsequently, there is clear evidence in literature of digital technologies’ benefits on distribution. However, there is a lack of practical cases to demonstrate the impact of digital tools on the distribution system in Swedish retail.
1.4 Purpose
The purpose of this research is to investigate the digital maturity level of retail companies within distribution as well as their perception of digitalization alongside its impact on distribution processes.
1.5 Preliminaryresearchquestions
The subject of supply chain is broad and contains the whole process of raw material until delivering a final product to the customer. Different parts of the chain include manufacturing, logistics, and distribution. After deeper investigation in the area and several meetings with Tieto, the focus of study was chosen as distribution processes. Accordingly, to fulfill the research purpose, two research questions were developed:
Research Question 1: How is the digital maturity level within distribution processes?
Research Question 2: How is digitalization and its impact on distribution perceived by companies?
1.6 Positionofthestudy
Due to the complexity of the problem, the investigation was carried out through a systematic approach. The systematic approach contains three different levels: the individual/organizational
3
level, the functional level, and the industrial level. As Blomkvist & Hallin (2015) describes, approaching the research problem at one level will not be enough since every change at a certain level will affect the other levels in an organization. Accordingly, the effect of the research problem on retail companies will be examined through all three levels.
The primarily focus of this research was distribution processes. This area is part of the functional level which will consequently be the main focus in this study. However, the research problem affects the two other levels as well. The industrial level has already been through change because of the digital transformation, as mentioned before. Furthermore, this transformation will have an impact on organizations' internal functions, as well as employees and management.
1.7 Contributiontothefield
Since the focus area of this research is distribution and distribution is an area within supply chains, the main contribution field in this research is supply chain. This research aims to deliver a report which examines digital technologies’ impact on distribution processes. Furthermore, this study can be used as a theoretical ground when it comes to interaction between the stated subjects, digitalization and distribution processes. Additionally, this report can be used as a guidance for retail companies within the same field who currently use traditional distribution processes to illustrate whether transformation into digital can imply benefits for their organization. The result of this research will give a better understanding to companies of why they should reconsider their distribution processes by highlighting the impacts of integrating digital tools in the distribution. When it comes to future research, this study can be used as a foundation towards further investigation in the field. Finally, a digital maturity assessment model, originally developed by Forrester, has been modified to suit the distribution processes.
1.8 Delimitations
Due to resource and time constraints, the study was restricted by various delimitations. As mentioned before, since there is a lack of practical research on digital tools’ impact on the distribution system within Swedish retail, the geographical delimitation for the study was set to Sweden. The study focuses on ten retail companies with annual revenues exceeding SEK 1 billion. Furthermore, the research targets companies that have more than ten retail stores in Sweden, with a distribution center in the country. These criteria were chosen to ensure that the distribution processes are complicated enough to be relevant for the purpose of the study.
The digital maturity level of the chosen companies in this study is delimited to their distribution processes, meaning the digital maturity model has only assessed the digital maturity within distribution. This is due to the fact that a report of this size would not able to analyze the digital maturity of the entire supply chain. Although it would be interesting to analyze the problem within different parts of the supply chain, the time limit would endanger the quality of study results.
4
1.9 Outlineofthestudy
In the next chapter, literature review and theory, the theory necessary to understand the report will also be discussed. The study will be positioned with respect to existing literature.
In the third chapter, the overall methods for carrying on the research are presented, described and motivated. It is comprised of the research design, the literature review and the interview methodology, data collection as well as data analysis methods. Finally, the methods are critically evaluated.
In the fourth chapter, the empirical material is presented. This consists of results from qualitative interviews as well as a questionnaire.
In chapter five, the analysis of the results are presented and structured with regard to each research question.
In chapter six, the conclusion is presented. This consists of the answers for both research questions.
Finally, chapter 8 contains the discussion of the findings of this research. The aspects of sustainability, managerial implications, and future research are further discussed in this chapter.
References and appendices are attached in the end of the report.
5
2 LiteraturereviewandtheoryThis chapter contains the theoretical concepts and gathered literature available in the area of digital distribution that are relevant to this study.
2.1 Supplychain
Hobbs (2001) describes supply chain as a flow of products from input through the production, processing and distribution to the customer who consumes the product. According to Chopra & Meindl (2013) supply chain consists of all parties which are directly or indirectly involved in fulfilling a customer request. Manufacturers and suppliers are not the only parties that are included in a supply chain, other functions such as transporters, warehouses, retailers and customers are also parties that a supply chain consists of (Chopra & Meindl 2013).
When talking about supply chain, the term invokes an image of product moving along a chain from suppliers to manufacturers to distributors to retailers. This link does not necessary need to be linear, but might be a network of multiple input supply or distribution links (Hobbs 2001). This makes a supply chain dynamic, involving continuous flow of products and information between different functions in both directions within the network. As mentioned before, a supply chain aims to fulfill the customer needs and at the same time generate profit along the process (Chopra & Meindl 2013). A simple illustration of a supply chain is displayed in the figure below (see figure 1).
Figure1.Asimpleillustrationofasupplychain.(Fromlefttoright:manufacturing,warehousing,store)
2.1.1 Efficient-andResponsivesupplychainThere are two main strategies that managers can choose between when deciding their supply chain strategy. The first step towards deciding which strategy that suits the firm is that managers need to know the nature of the demand for the product. Fisher (1997) explains that products can fall into two distinctive categories. He means that all products are either primarily innovative or primarily functional products. Functional products are the ones that are stable over time and can be found in grocery stores while innovative products are those with shorter product life cycle and with a unpredicted demand such as electronic products and fashion goods (Fisher 1997). Further, these two product categories require different supply chain strategies. Functional product require an efficient supply chain strategy while innovative products require a supply chain that is responsive to changed demand. If supply chain strategy and the product type do not match, a mismatch will occur as illustrated in figure 2.
6
Functional Products Innovative Products
Efficient Supply Chain Match Mismatch
Responsive Supply Chain Mismatch Match
Figure2.Efficientandresponsivesupplychains.(Fisher1997)
The primary goal of an efficient supply chain is to satisfy demand at the lowest cost as possible while the product design strategy lies in maximizing performance at a minimum product cost. The functional products customers are price sensitive resulting in low margins, meaning the selection of suppliers should be based on cost and quality. The manufacturing utilization of functional products are high which decreases the costs. The focus should be on minimizing inventory as much as possible while reducing the lead-time. However, this should not weigh on the costs and result in low margins. (Chopra & Meindl 2013)
The primary goal of a responsive supply chain is to respond as quickly as possible to demand, this put the design focus on creating modularity to allow product differentiation. The customers of innovative products are not driven by the price resulting in high margins and thus the selection of the suppliers are based on speed, flexibility, reliability and quality. The focus of manufacturing is to have capacity flexibility to buffer against demand/supply uncertainties while the inventory strategy aims to maintain buffer inventory in order to cope with demand/supply uncertainties. A responsive supply chain aims to reduce the lead-time even if the costs are significant. (Chopra & Meindl 2013) Choosing the suitable supply chain strategy from the mentioned alternatives is one of the challenges for supply chain managers (Fisher 1997). Using digital solutions, there is a possibility for organizations to seize the benefits from both strategies - being able to cut costs and at the same time respond quickly to customer requirements.
2.2 Distributionwithinsupplychain
Distribution is the process of moving a product from production or shipment site to the demand point (Serdaris et. al 2014). The aim for distribution is to deliver products in the right time, right place, right amount, and with lowest cost (Serdaris et. al 2014). In this sense, distribution has a large impact on the profitability due to its impact on the supply chain costs as well as customer value. For instance, distribution affects around 35% of the revenue in fashion industry, taking aspects such as lost sales into account. The mentioned factors - meeting customer needs as well as the cost of meeting these needs - are used to evaluate the performance of distribution processes. Firms’ revenues are affected by their ability to meet customer needs, which together with costs affect the overall profitability.
In this study, the focus is on the process from the shipment site, distribution centers (DC), to the retail stores. This process is made of three main areas: the distribution center, the transportation and logistics, and retail stores, as illustrated in the figure below (see figure 3).
7
Figure3.Thedistributionprocessinfocusforthestudy.
Three of the major cost drivers here that affect the choice of distribution systems are costs of inventory, transportation, and information. Right information allows firms to better coordinate their process flow and hence increase responsiveness and reduce costs. As information handling implies costs, companies should aim to share the minimum amount of information needed for coordination. (Chopra & Meindl 2013)
As mentioned before, distribution affects the profitability through its influence on customer value. One of the key drivers in creating customer value is product availability which is also used as a measure for supply chain responsiveness. Product availability is a retailer’s ability to sell a product when the customer desires it (Hisashi, 2014). A low level of product availability can result in a lost sale since there is no inventory on hand, called the cost of understocking. (Chopra & Meindl 2013) Additionally, this can result in low customer satisfaction and loyalty (Hisashi, 2014). A high level of product availability on the other hand, can attract customers and improve responsiveness, resulting in raised revenues. However, a high level of product availability also implies large inventories, resulting in increased costs (called the cost of overstocking). In this sense, an optimal level of product availability needs to balance between the level of availability and inventory costs and hence maximize the profitability. (Chopra & Meindl 2013)
Moreover, to improve the distribution system’s profitability, companies can aim to reduce the demand uncertainty. Through a better match between supply and demand companies are able to reduce the costs of understocking and overstocking and thus increase their profits. Two ways to reduce demand uncertainty are explained below (Chopra & Meindl 2013):
- Improved forecasting: reducing demand uncertainty through collaboration and better market intelligence
- Quick response: reducing lead times to better respond to fluctuations and increase forecast accuracy
These two factors have been essential for Zara’s success when it comes to the fashion industry. The company has reduced its forecasting risks through postponing product variations until closer to the delivery points. Moreover, it has been able to reduce the holding stock in its supply chain using quick response. (Zhelyazkov, 2011)
8
The trade-off between transportation costs and customer responsiveness
As previously mentioned, transportation is a major cost driver that influences the choice of distribution systems. Transportation costs are to a large extent influenced by the degree of supply chain responsiveness. A high responsiveness is positively related to shorter lead time and results in more frequent shipments which leads to higher transportation costs. On the other hand, gathering the orders from a longer time period to send in one shipment allows companies to benefit from the economies of scale and consequently decrease their transportation costs. Therefore, companies need to consider the trade-off between transportations costs and customer responsiveness to achieve the preferred balance. (Chopra & Meindl 2013)
2.3 Opportunitiesfromdigitaltechnologies
During the last decade, different digital tools have been developed that can help to enhance the performance of distribution systems in different ways. A brief description of these elements alongside their benefits are explained in the following chapter.
2.3.1 LogisticsvisibilityandRFIDRadio Frequency Identification (RFID) is a method to automatically store and remotely retrieve data from a transponder. The technology is already used widely for inventory tracking. (Miller, 2000) When it comes to supply chain, RFID equips the logistics items with embedded intelligence, allowing them to communicate with each other as well as the actors in the supply chain. The faster and reliable logistics information improves logistics visibility, allowing managers to have a clearer overview of what is going on in the distribution system (Strategy&, 2016). Through linking the real-time data received by transponders to the supply chain information system, managers are able to achieve updated status of the logistics system. (Choy et. al 2007) This in combination with Global Positioning System (GPS), provides real-time tracking, enabling supply chain managers to communicate with each vehicle and be aware of its content and precise location to improve the overall performance in the logistics system. (Chopra & Meindl 2013)
As mentioned before, quick response is a suitable method used to reduce demand uncertainty and lead times. The method is widely used by retail companies offering consumer packaged goods (CPG). An effective quick response system however, is in need of an effective inventory management system which in itself is dependent on the integration and analysis of collected data from different supply chain members. With help of RFID, the real-time information about products’ location in store is always at hand. This information can be used to minimize the store’s backroom inventory while the shelves are kept full. Moreover, this information enhances store security and helps to better analyze sales data. A similar process is utilized by apparel retailers, where RFID transponders are used together with information from point-of-sale (POS) to identify demand trends and patterns. This is extremely important for apparel retailers since the demand uncertainty in their industry is higher. (Zhu et. al 2012)
9
2.3.2 BigdataforresourceoptimizationanddeterminingbestproductmixperstoreBig data is data that covers large numbers of samples, or large number of details per sample. The data is rapidly under update and contains both structured as well as unstructured data. Consequently, the mentioned characteristics lead to a large database of information. (Weinman 2015 & Collins 2014) In retail, Big data can be gathered through consolidation of historical data and real-time data in store. This can then be used to improve the efficiency of internal processes and reduce costs. (Tieto 2015)
To achieve this, retailers can use Big data to improve their distribution and optimize their use of resources. The analyzed data here can contain logistics information such as routes or downtime, as well as sales information such as the volume of orders per day, product type and POS. Having this information at hand allows managers to forecast more accurately and hence optimize the logistics and assess staff requirements. As a result, retailers are able to lower their costs and create more value for their customers. (Tieto 2015)
Another use of Big data in this area is assortment optimization, which helps to determine the best product mix in the stores (Cisco 2016). By analyzing gathered information such as purchasing frequency and customer behaviour, retailers can easier understand and determine the product assortment they should have in each store. This results in inventory optimization, allowing managers to minimize stock space and product shelf time and thus reducing the economical risks. (Tieto 2015) Using Big data in this way also helps to increase revenues through out-of-stock reduction (Cisco 2016).
2.3.3 AutomaticstorereplenishmentThe profitability of a retail companies is affected by different factors. The most critical factor in distribution is the store’s replenishment system. The accuracy and efficiency of the system has an impact on shelf availability as well as handling, storage and obsolescence cost in the distribution. (Kärkkäinen 2014) Automatic store replenishment refers to “the preparation of orders by a computer integrating information about product movement (as recorded by point of sale equipment), outside factors that affect demand (such as seasonal changes), actual inventory levels, product receipts, and acceptable safety stock levels.” (Retail Economics 2012) Using computer-assisted ordering, these systems have several benefits. These are:
1. Lower out-of-stocks and higher sales 2. Lower inventory costs and higher margins 3. Lower labor costs 4. Store order leveling and truck-load optimization 5. Reduction of price markdowns
Two of the main reasons for in store out-of-stocks are the ordering mistakes made by store employees and poor demand forecasting (Kärkkäinen 2014). Automatic store replenishment allows for a more accurate forecasting and by taking lead times into account estimates the inventory level at time of delivery - reducing out-of-stocks. Moreover, these systems order automatically to fill the shelves while the stock is kept to a minimum, resulting in lower inventory. As manual ordering is replaced by automatic ordering, these systems also reduce
10
labor costs. Another benefit of automatic store replenishment is leveling the orders over the weekdays which leads to a better balanced workload at the distribution centers as well as the stores, and a better balanced truckload for better utilization of transport vehicles. Since these systems continuously monitor sales patterns it is easier to identify low and high selling products, which enhances the quick response ability of the retailer and thus reduces the leftovers. As a result, price markdowns will be reduced. (Retail Economics 2012)
Two of the major Swedish CPG retailers, ICA and Coop, have utilized Automatic store replenishment. The systems are called AOB (Automatisk Order i Butik) and CAO (Computer Assisted Ordering) respectively. In both these systems, the cash register, the inventory status, and the ordering system are connected and communicate with each other. Each product purchased by the customer is recorded in the cash register and a replacement product is automatically ordered to the store. (Gustafsson 2013) The use of these systems eliminate human errors such as forgetting to make an order, and hence increases shelf availability. This also allows the companies to keep a high level of ordering accuracy even during vacations. Furthermore, store employees will have more free time that can be spent on other organizational tasks such as customer service. (Kärkkäinen 2014)
2.3.4 ITsystemsintransportationTransportation is an area that can largely benefit from IT solutions. Currently, the most common use of IT softwares in transportation is to determine the routes. These IT softwares use factors such as customer location, size of shipment, delivery time, and transportation infrastructure to optimize the set of routes and packing solutions that decreases the costs to a minimum. Moreover, these softwares help to enhance the utilization of fleet resources. By taking container sizes as well as size and sequence of deliveries into account, the IT softwares provide a plan to pack each vehicle efficiently and enable them to load and unload along the route in the easiest way. As a result, the use of this digital technology allows to enhance transportation performance by decreasing its costs and improving its responsiveness. (Chopra & Meindl 2013)
2.4 Digitalmaturity
According to Mueller et. al (2006), the term maturity refers to “the process of judging the development status of a product as the interaction of analysis and quantification”. (Mueller et. al 2006) In this sense, digital maturity refers to the development status of a company’s digital transformation, as the interaction of analysis and quantification. There are several models developed to assess the digital maturity. The most relevant models from the literature are expressed in the following.

11
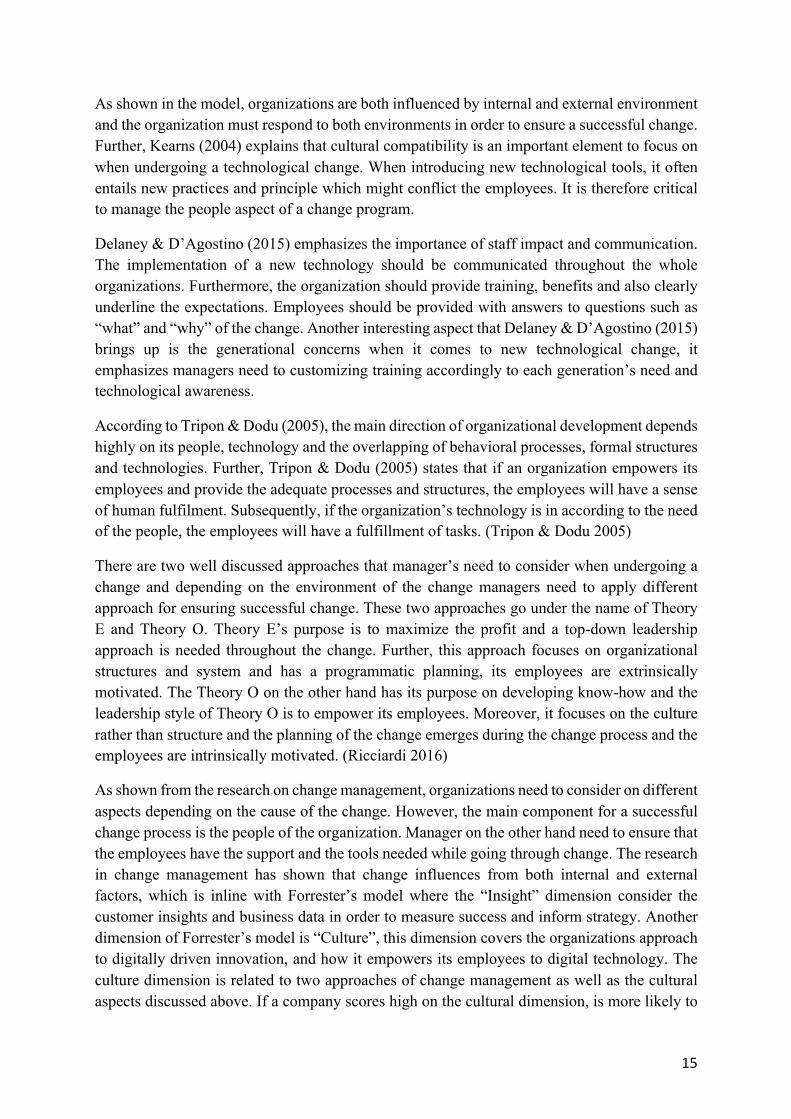
2.4.1 DigitalMaturityaccordingtoForresterForrester’s digital maturity model was developed to help organizations to assess the digital readiness of their company. The model is built upon four dimensions: culture, technology, organization, and insights (see figure 4). Seven questions are designed for each dimension in order to assess the dimension’s readiness. Total of 28 questions aim to evaluate a firm’s core capabilities and attitudes as well as the competencies that defines a mature digital operation regardless focus. (Forrester 2016)
In order to assess their digital maturity, companies need to answer each question with a score from 0-3 where:
0 indicates that the company completely disagrees with the statement,
1 indicates that the company somewhat disagrees with the statement,
2 indicates that the company somewhat agrees with the statement and,
3 indicates that the company completely agrees with the statement.
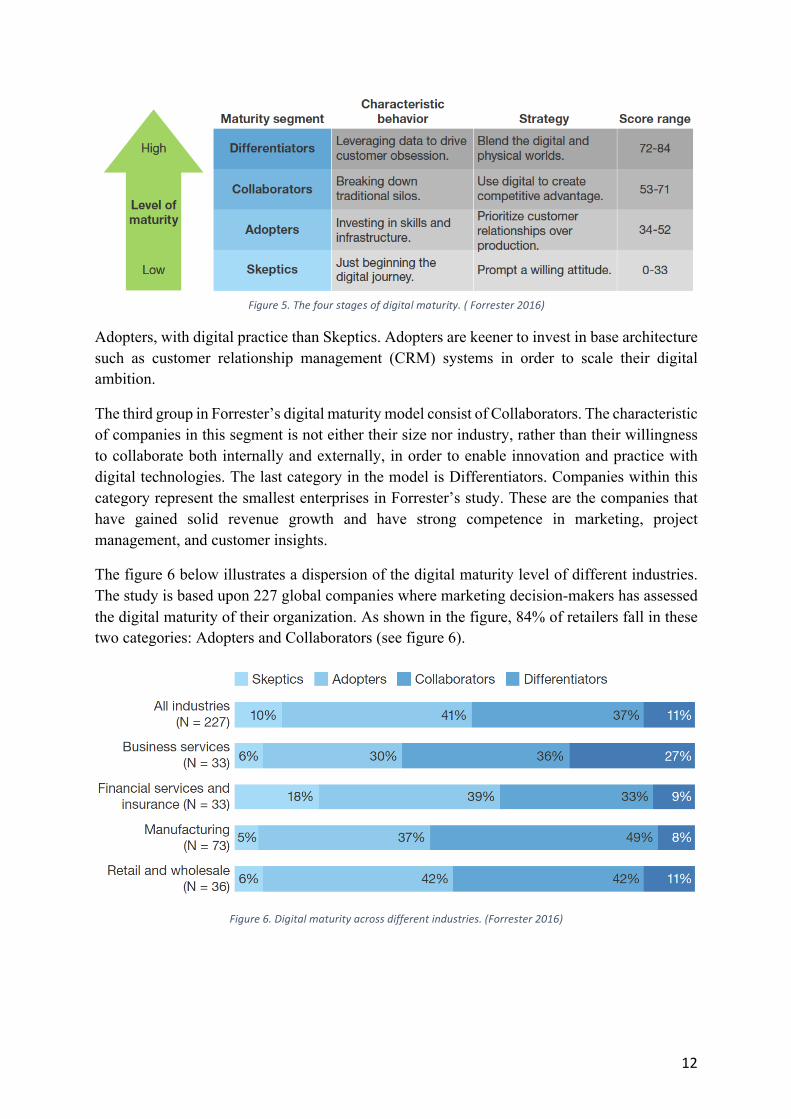
The next step in the model is to add the gained scores from all 28 questions (See Appendix 1). Based on their score range, companies can fall in four different categories, as illustrated in the figure 5. (Forrester 2016)
The first category is Skeptics. Companies within this category are usually technology slow-moving firms, large financial firms, telecom companies, and organizations in the public sector. Companies in this category have limited use of online sales channels and limited experience to apply an outside-in approach to their strategic planning. The next level in the model are
Figure4.Thefourmaindimensionsofdigitalmaturity.(Forrester2016)
12
Adopters, with digital practice than Skeptics. Adopters are keener to invest in base architecture such as customer relationship management (CRM) systems in order to scale their digital ambition.
The third group in Forrester’s digital maturity model consist of Collaborators. The characteristic of companies in this segment is not either their size nor industry, rather than their willingness to collaborate both internally and externally, in order to enable innovation and practice with digital technologies. The last category in the model is Differentiators. Companies within this category represent the smallest enterprises in Forrester’s study. These are the companies that have gained solid revenue growth and have strong competence in marketing, project management, and customer insights.
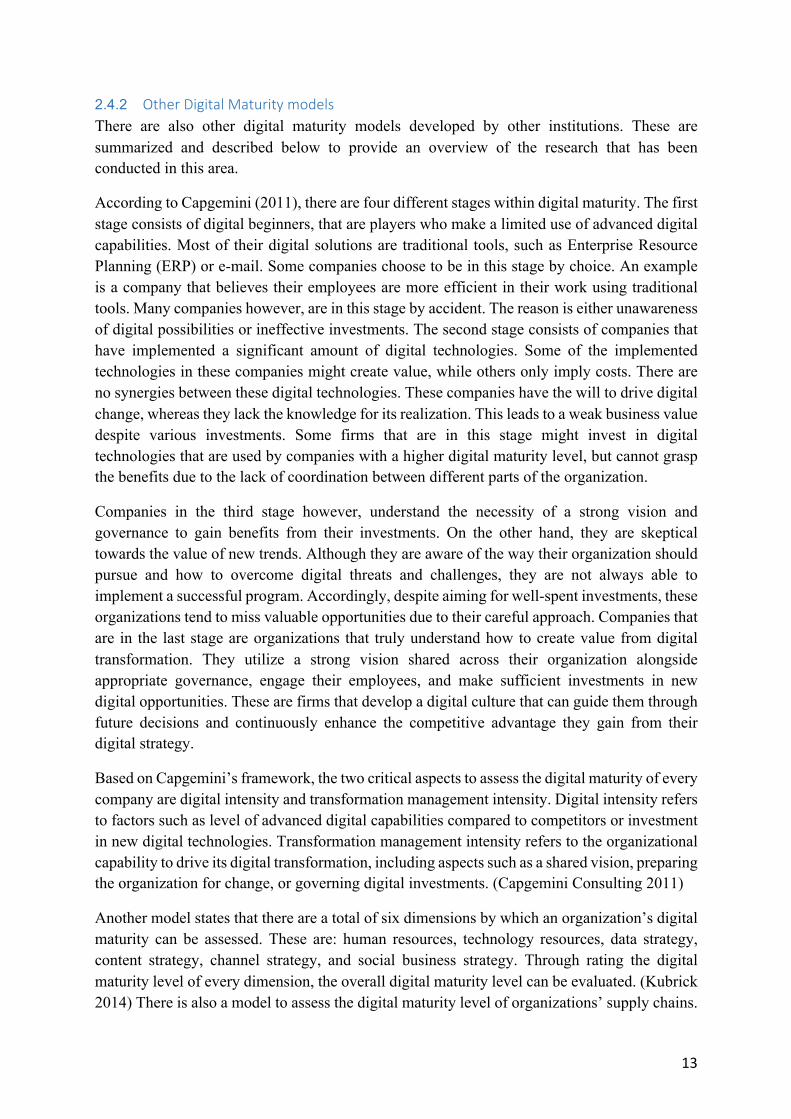
The figure 6 below illustrates a dispersion of the digital maturity level of different industries. The study is based upon 227 global companies where marketing decision-makers has assessed the digital maturity of their organization. As shown in the figure, 84% of retailers fall in these two categories: Adopters and Collaborators (see figure 6).
Figure6.Digitalmaturityacrossdifferentindustries.(Forrester2016)
Figure5.Thefourstagesofdigitalmaturity.(Forrester2016)
13
2.4.2 OtherDigitalMaturitymodels There are also other digital maturity models developed by other institutions. These are summarized and described below to provide an overview of the research that has been conducted in this area.
According to Capgemini (2011), there are four different stages within digital maturity. The first stage consists of digital beginners, that are players who make a limited use of advanced digital capabilities. Most of their digital solutions are traditional tools, such as Enterprise Resource Planning (ERP) or e-mail. Some companies choose to be in this stage by choice. An example is a company that believes their employees are more efficient in their work using traditional tools. Many companies however, are in this stage by accident. The reason is either unawareness of digital possibilities or ineffective investments. The second stage consists of companies that have implemented a significant amount of digital technologies. Some of the implemented technologies in these companies might create value, while others only imply costs. There are no synergies between these digital technologies. These companies have the will to drive digital change, whereas they lack the knowledge for its realization. This leads to a weak business value despite various investments. Some firms that are in this stage might invest in digital technologies that are used by companies with a higher digital maturity level, but cannot grasp the benefits due to the lack of coordination between different parts of the organization.
Companies in the third stage however, understand the necessity of a strong vision and governance to gain benefits from their investments. On the other hand, they are skeptical towards the value of new trends. Although they are aware of the way their organization should pursue and how to overcome digital threats and challenges, they are not always able to implement a successful program. Accordingly, despite aiming for well-spent investments, these organizations tend to miss valuable opportunities due to their careful approach. Companies that are in the last stage are organizations that truly understand how to create value from digital transformation. They utilize a strong vision shared across their organization alongside appropriate governance, engage their employees, and make sufficient investments in new digital opportunities. These are firms that develop a digital culture that can guide them through future decisions and continuously enhance the competitive advantage they gain from their digital strategy.
Based on Capgemini’s framework, the two critical aspects to assess the digital maturity of every company are digital intensity and transformation management intensity. Digital intensity refers to factors such as level of advanced digital capabilities compared to competitors or investment in new digital technologies. Transformation management intensity refers to the organizational capability to drive its digital transformation, including aspects such as a shared vision, preparing the organization for change, or governing digital investments. (Capgemini Consulting 2011)
Another model states that there are a total of six dimensions by which an organization’s digital maturity can be assessed. These are: human resources, technology resources, data strategy, content strategy, channel strategy, and social business strategy. Through rating the digital maturity level of every dimension, the overall digital maturity level can be evaluated. (Kubrick 2014) There is also a model to assess the digital maturity level of organizations’ supply chains.
14
In this model, companies are divided into four different stages of digital. The first stage is digital novice where the supply chain is run by individual and separate divisions. These firms are in the beginning phase of their digital transformation. The second stage is called vertical integrator where companies have integrated their supply chain processes across internal functions and divisions. The third stage, horizontal collaborator, consist of companies who through collaborations with supply chain partners define business goals and common processes, reaching a certain level of transparency in their supply chain. The fourth stage is digital champion. These organizations have reached the highest level of transparency and collaboration with with partners. As a result, they are able to gain mutual benefits from these processes and achieve a better optimization of their supply chain. (Strategy& 2016)
2.4.3 ComparingchangemanagementtheorieswithdigitalmaturitymodelThere has been limited research in the area of digital supply chain, meaning that this area lacks of scientific knowledge. However, consulting firms have the role as a trusted advisors and where they give advice to companies on which emerging technology to invest in. Moreover, when companies integrate and implement digital technologies in their traditional processes, the organization and its tangible and intangible resources will undergo a change. Thus, comparing change management theories with the dimensions mentioned in the digital maturity models above would increase the credibility and reliability of the models provided by the consulting firms.
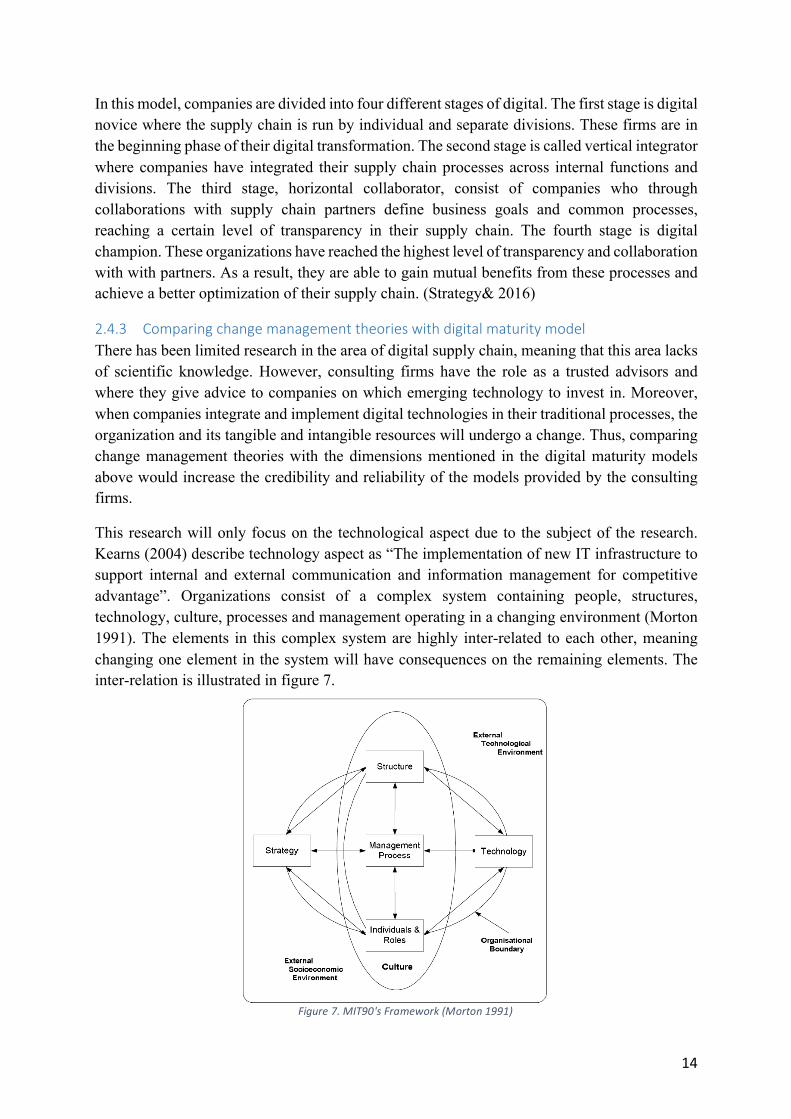
This research will only focus on the technological aspect due to the subject of the research. Kearns (2004) describe technology aspect as “The implementation of new IT infrastructure to support internal and external communication and information management for competitive advantage”. Organizations consist of a complex system containing people, structures, technology, culture, processes and management operating in a changing environment (Morton 1991). The elements in this complex system are highly inter-related to each other, meaning changing one element in the system will have consequences on the remaining elements. The inter-relation is illustrated in figure 7.
Figure7.MIT90'sFramework(Morton1991)
15
As shown in the model, organizations are both influenced by internal and external environment and the organization must respond to both environments in order to ensure a successful change. Further, Kearns (2004) explains that cultural compatibility is an important element to focus on when undergoing a technological change. When introducing new technological tools, it often entails new practices and principle which might conflict the employees. It is therefore critical to manage the people aspect of a change program.
Delaney & D’Agostino (2015) emphasizes the importance of staff impact and communication. The implementation of a new technology should be communicated throughout the whole organizations. Furthermore, the organization should provide training, benefits and also clearly underline the expectations. Employees should be provided with answers to questions such as “what” and “why” of the change. Another interesting aspect that Delaney & D’Agostino (2015) brings up is the generational concerns when it comes to new technological change, it emphasizes managers need to customizing training accordingly to each generation’s need and technological awareness.
According to Tripon & Dodu (2005), the main direction of organizational development depends highly on its people, technology and the overlapping of behavioral processes, formal structures and technologies. Further, Tripon & Dodu (2005) states that if an organization empowers its employees and provide the adequate processes and structures, the employees will have a sense of human fulfilment. Subsequently, if the organization’s technology is in according to the need of the people, the employees will have a fulfillment of tasks. (Tripon & Dodu 2005)
There are two well discussed approaches that manager’s need to consider when undergoing a change and depending on the environment of the change managers need to apply different approach for ensuring successful change. These two approaches go under the name of Theory E and Theory O. Theory E’s purpose is to maximize the profit and a top-down leadership approach is needed throughout the change. Further, this approach focuses on organizational structures and system and has a programmatic planning, its employees are extrinsically motivated. The Theory O on the other hand has its purpose on developing know-how and the leadership style of Theory O is to empower its employees. Moreover, it focuses on the culture rather than structure and the planning of the change emerges during the change process and the employees are intrinsically motivated. (Ricciardi 2016)
As shown from the research on change management, organizations need to consider on different aspects depending on the cause of the change. However, the main component for a successful change process is the people of the organization. Manager on the other hand need to ensure that the employees have the support and the tools needed while going through change. The research in change management has shown that change influences from both internal and external factors, which is inline with Forrester’s model where the “Insight” dimension consider the customer insights and business data in order to measure success and inform strategy. Another dimension of Forrester’s model is “Culture”, this dimension covers the organizations approach to digitally driven innovation, and how it empowers its employees to digital technology. The culture dimension is related to two approaches of change management as well as the cultural aspects discussed above. If a company scores high on the cultural dimension, is more likely to
16
use a Theory E approach towards change where it empowers and supports its employees towards the change. Furthermore, the two other dimensions concerns the organizations alignment to support digital technologies and its use and adoption of emerging technologies.
There are similarities when comparing the component of models provided from the consulting firms with the change management theories. The models from the consulting firms are not as described as the models from change management theories but they do cover the elements in change management theories. The dimensions provided from the consulting firms are more clustered than from change management.
17
3 MethodThe method to answer the research questions and fulfill the purpose of the study is described in the following chapter.
3.1 Methodsforansweringresearchquestions
In order to answer the first research question - How is the digital maturity level within distribution processes? - the study has conducted ten qualitative interviews with supply chain decision makers of chosen companies. In addition to the qualitative data, a structured questionnaire was used. The literature was used as foundation for the development of a digital maturity model and the result from the questionnaire revealed the digital maturity level of the chosen companies. The gathered information was analyzed with respect to literature to further draw conclusions.
The second research question was “How is digitalization and its impact on distribution perceived by companies?”. The impact of already implemented digital technologies within the distribution processes was identified through the qualitative interviews with supply chain decision makers. The interviews in combination with literature formed a solid foundation on which the conclusions were drawn on.
3.2 Methodologicalapproach
For every research, there are two main approaches: positivism and interpretivism. The positivism approach rests its assumptions on that reality is singular and objective, and the process of the research is usually a deductive process. This process provides explanatory theories in order to understand the phenomenon. On the contrary, interpretivism has its assumptions on that social reality is subjective and multiple. The process of interpretivism is an inductive process where it provides interpretive understanding of the phenomenon. (Shah & Corley 2006)
Due to the nature of this research an interpretivism approach was chosen for this study since it requires a deeper understating of the phenomenon. This approach suits this research since it aims to investigate Swedish retail companies’ view on digitalization in a particular context, in this case distribution processes. As mentioned earlier, digitalization is a rising phenomenon that is under continuous development within different industries. The concept is still new when it comes to retailers and there are no general methods for digitalizing a retail company’s distribution process. In this sense, the study will mainly use an inductive method, in which the empirical data gathered will be used as a source for drawing conclusions which might eventually lead to developing theories that can be applied to companies in the same industry. An inductive method means that the main problem will be used as a basis for searching empirical data, which later will be better understood with help of theories. (Collis & Hussey 2014)
18
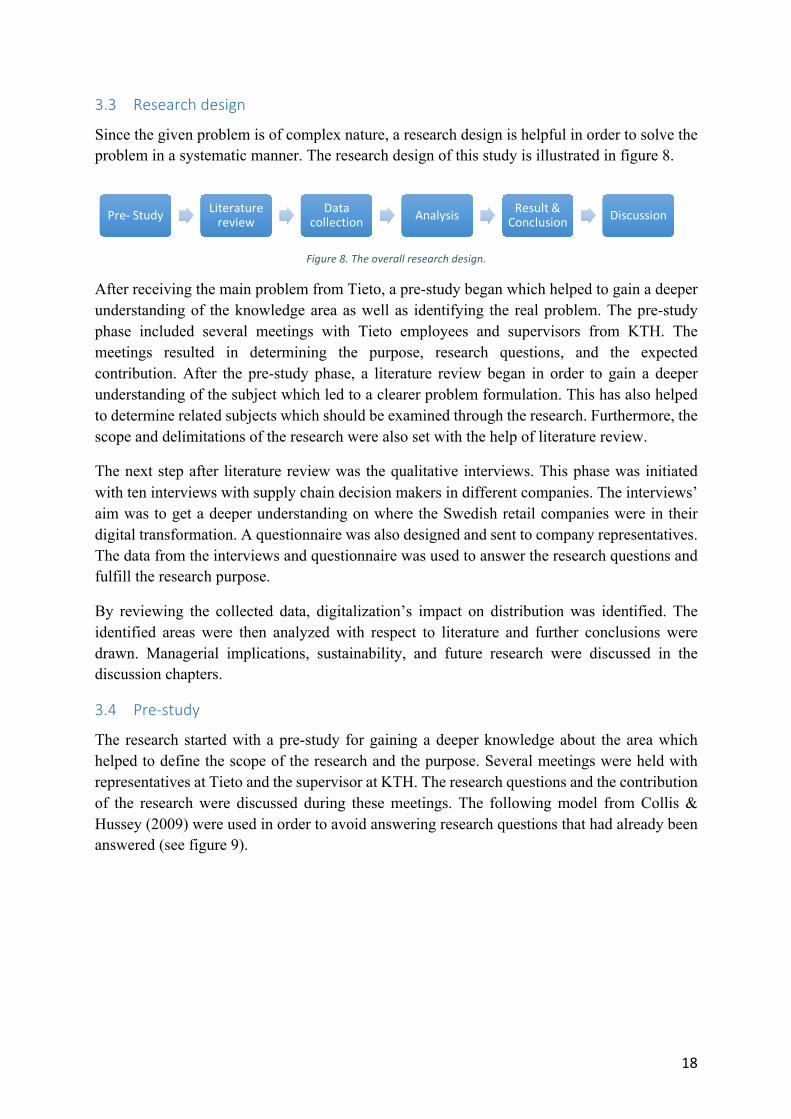
3.3 Researchdesign
Since the given problem is of complex nature, a research design is helpful in order to solve the problem in a systematic manner. The research design of this study is illustrated in figure 8.
Figure8.Theoverallresearchdesign.
After receiving the main problem from Tieto, a pre-study began which helped to gain a deeper understanding of the knowledge area as well as identifying the real problem. The pre-study phase included several meetings with Tieto employees and supervisors from KTH. The meetings resulted in determining the purpose, research questions, and the expected contribution. After the pre-study phase, a literature review began in order to gain a deeper understanding of the subject which led to a clearer problem formulation. This has also helped to determine related subjects which should be examined through the research. Furthermore, the scope and delimitations of the research were also set with the help of literature review.
The next step after literature review was the qualitative interviews. This phase was initiated with ten interviews with supply chain decision makers in different companies. The interviews’ aim was to get a deeper understanding on where the Swedish retail companies were in their digital transformation. A questionnaire was also designed and sent to company representatives. The data from the interviews and questionnaire was used to answer the research questions and fulfill the research purpose.
By reviewing the collected data, digitalization’s impact on distribution was identified. The identified areas were then analyzed with respect to literature and further conclusions were drawn. Managerial implications, sustainability, and future research were discussed in the discussion chapters.
3.4 Pre-study
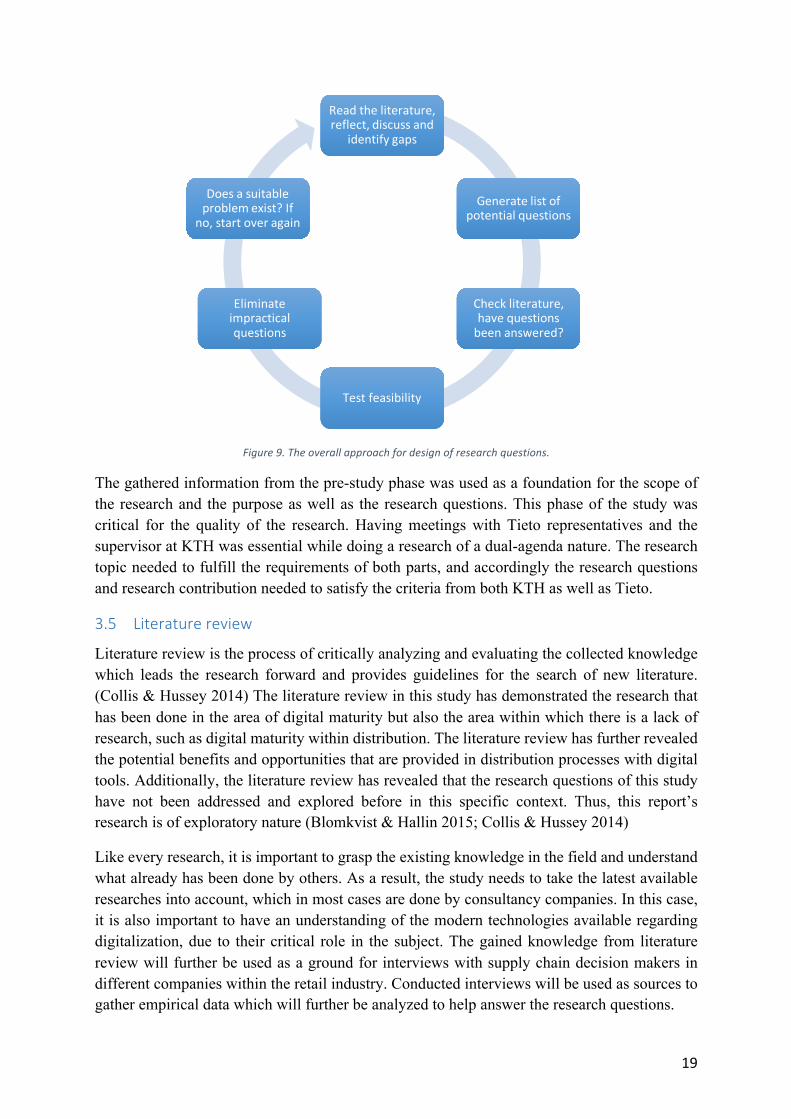
The research started with a pre-study for gaining a deeper knowledge about the area which helped to define the scope of the research and the purpose. Several meetings were held with representatives at Tieto and the supervisor at KTH. The research questions and the contribution of the research were discussed during these meetings. The following model from Collis & Hussey (2009) were used in order to avoid answering research questions that had already been answered (see figure 9).
Pre- Study Literaturereview
Datacollection Analysis Result&
Conclusion Discussion
19
Figure9.Theoverallapproachfordesignofresearchquestions.
The gathered information from the pre-study phase was used as a foundation for the scope of the research and the purpose as well as the research questions. This phase of the study was critical for the quality of the research. Having meetings with Tieto representatives and the supervisor at KTH was essential while doing a research of a dual-agenda nature. The research topic needed to fulfill the requirements of both parts, and accordingly the research questions and research contribution needed to satisfy the criteria from both KTH as well as Tieto.
3.5 Literaturereview
Literature review is the process of critically analyzing and evaluating the collected knowledge which leads the research forward and provides guidelines for the search of new literature. (Collis & Hussey 2014) The literature review in this study has demonstrated the research that has been done in the area of digital maturity but also the area within which there is a lack of research, such as digital maturity within distribution. The literature review has further revealed the potential benefits and opportunities that are provided in distribution processes with digital tools. Additionally, the literature review has revealed that the research questions of this study have not been addressed and explored before in this specific context. Thus, this report’s research is of exploratory nature (Blomkvist & Hallin 2015; Collis & Hussey 2014)
Like every research, it is important to grasp the existing knowledge in the field and understand what already has been done by others. As a result, the study needs to take the latest available researches into account, which in most cases are done by consultancy companies. In this case, it is also important to have an understanding of the modern technologies available regarding digitalization, due to their critical role in the subject. The gained knowledge from literature review will further be used as a ground for interviews with supply chain decision makers in different companies within the retail industry. Conducted interviews will be used as sources to gather empirical data which will further be analyzed to help answer the research questions.
Readtheliterature,reflect,discussand
identifygaps
Generatelistofpotentialquestions
Checkliterature,havequestionsbeenanswered?
Testfeasibility
Eliminateimpracticalquestions
Doesasuitableproblemexist?If
no,startoveragain
20
Google Scholar and KTHB Primo have been used as search engines to find scientific articles, journals, and books, related to digitalization, digital maturity, and distribution processes. Industry reports have provided knowledge for how theories have been practiced in reality and what steps have already been taken towards the research problem.
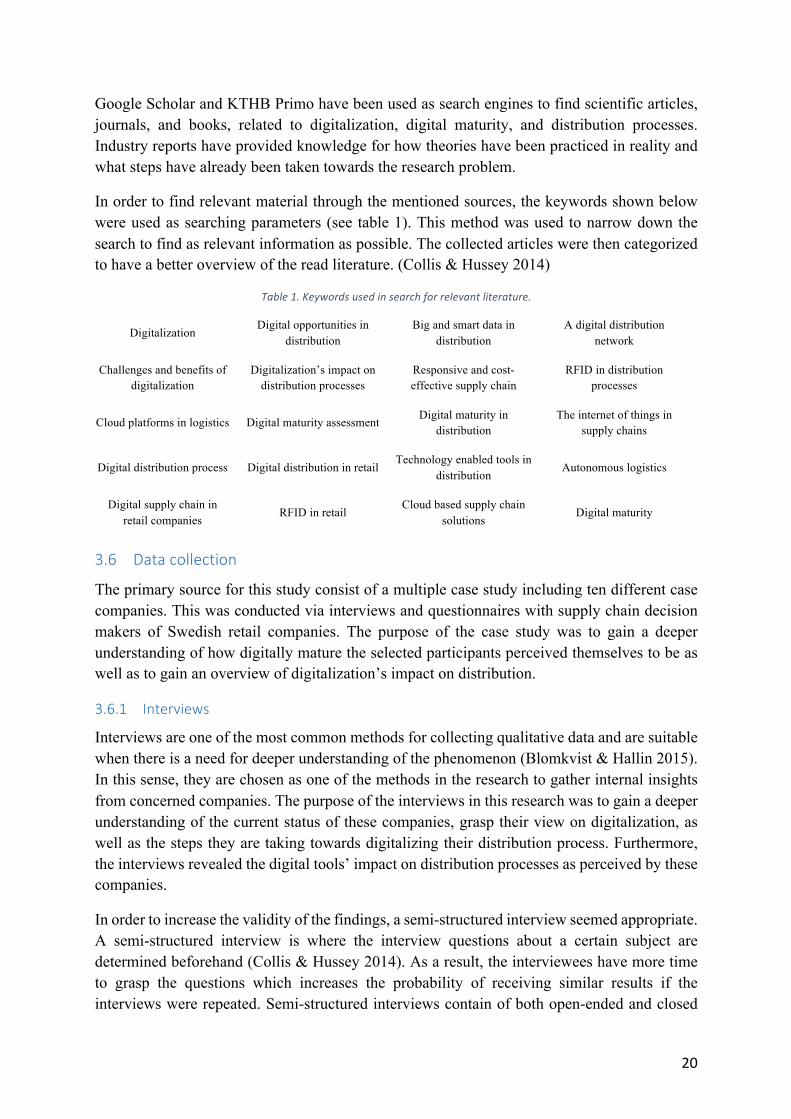
In order to find relevant material through the mentioned sources, the keywords shown below were used as searching parameters (see table 1). This method was used to narrow down the search to find as relevant information as possible. The collected articles were then categorized to have a better overview of the read literature. (Collis & Hussey 2014)
Table1.Keywordsusedinsearchforrelevantliterature.
Digitalization Digital opportunities in
distribution Big and smart data in
distribution A digital distribution
network
Challenges and benefits of digitalization
Digitalization’s impact on distribution processes
Responsive and cost-effective supply chain
RFID in distribution processes
Cloud platforms in logistics Digital maturity assessment Digital maturity in distribution
The internet of things in supply chains
Digital distribution process Digital distribution in retail Technology enabled tools in
distribution Autonomous logistics
Digital supply chain in retail companies
RFID in retail Cloud based supply chain
solutions Digital maturity
3.6 Datacollection
The primary source for this study consist of a multiple case study including ten different case companies. This was conducted via interviews and questionnaires with supply chain decision makers of Swedish retail companies. The purpose of the case study was to gain a deeper understanding of how digitally mature the selected participants perceived themselves to be as well as to gain an overview of digitalization’s impact on distribution.
3.6.1 Interviews
Interviews are one of the most common methods for collecting qualitative data and are suitable when there is a need for deeper understanding of the phenomenon (Blomkvist & Hallin 2015). In this sense, they are chosen as one of the methods in the research to gather internal insights from concerned companies. The purpose of the interviews in this research was to gain a deeper understanding of the current status of these companies, grasp their view on digitalization, as well as the steps they are taking towards digitalizing their distribution process. Furthermore, the interviews revealed the digital tools’ impact on distribution processes as perceived by these companies.
In order to increase the validity of the findings, a semi-structured interview seemed appropriate. A semi-structured interview is where the interview questions about a certain subject are determined beforehand (Collis & Hussey 2014). As a result, the interviewees have more time to grasp the questions which increases the probability of receiving similar results if the interviews were repeated. Semi-structured interviews contain of both open-ended and closed
21
questions and this suited the nature of the research, the problem was already defined and the interviews sought answers for specific areas. In this sense, semi-structured interviews are chosen as the interview method in this research.
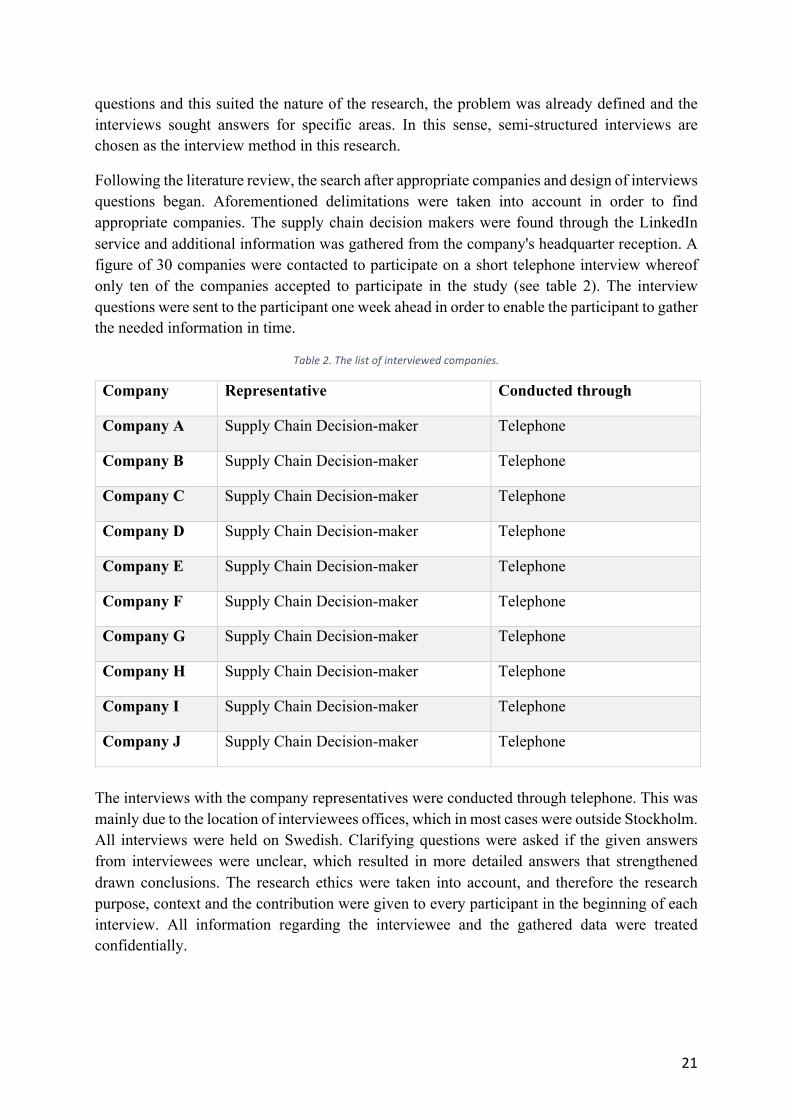
Following the literature review, the search after appropriate companies and design of interviews questions began. Aforementioned delimitations were taken into account in order to find appropriate companies. The supply chain decision makers were found through the LinkedIn service and additional information was gathered from the company's headquarter reception. A figure of 30 companies were contacted to participate on a short telephone interview whereof only ten of the companies accepted to participate in the study (see table 2). The interview questions were sent to the participant one week ahead in order to enable the participant to gather the needed information in time.
Table2.Thelistofinterviewedcompanies.
Company Representative Conducted through
Company A Supply Chain Decision-maker Telephone
Company B Supply Chain Decision-maker Telephone
Company C Supply Chain Decision-maker Telephone
Company D Supply Chain Decision-maker Telephone
Company E Supply Chain Decision-maker Telephone
Company F Supply Chain Decision-maker Telephone
Company G Supply Chain Decision-maker Telephone
Company H Supply Chain Decision-maker Telephone
Company I Supply Chain Decision-maker Telephone
Company J Supply Chain Decision-maker Telephone
The interviews with the company representatives were conducted through telephone. This was mainly due to the location of interviewees offices, which in most cases were outside Stockholm. All interviews were held on Swedish. Clarifying questions were asked if the given answers from interviewees were unclear, which resulted in more detailed answers that strengthened drawn conclusions. The research ethics were taken into account, and therefore the research purpose, context and the contribution were given to every participant in the beginning of each interview. All information regarding the interviewee and the gathered data were treated confidentially.
22
3.6.2 Questionnaire
In order to evaluate the digital maturity level of each company, a self-assessed questionnaire was selected as method. A questionnaire is a method for collecting primary data where the respondents are asked a list of carefully structured questions (Arvidsson 2016). The advantages with questionnaire are that the method is time efficient and can directly be sent to organizations or selected people through tools such as e-mail. Furthermore, the method is relatively inexpensive since there are simple tools available that make it easy to reach a greater sample. (Collis & Hussey 2014).
In order to clearly communicate the purpose of the study, the questionnaire was sent by e-mail to the interviewees alongside the interview questions (see appendix 2 for interview questions). The questionnaire was given to the interviewee after the semi-structured interview. The data was collected through the telephone interviews where the questions (statements) were read to the interviewees and they chose their answer on an scale. The scale was set from zero to three, where zero indicates that the interviewee totally disagrees with a statement and three indicates that the interviewee totally agrees with the statement. The value of zero to three scale lies in having a small span where the respondents are not able to choose a middle score. This entitled less detail, while increasing the validity of the answers. The statements were originally gained from the Forrester (2016) study mentioned in the literature chapter.
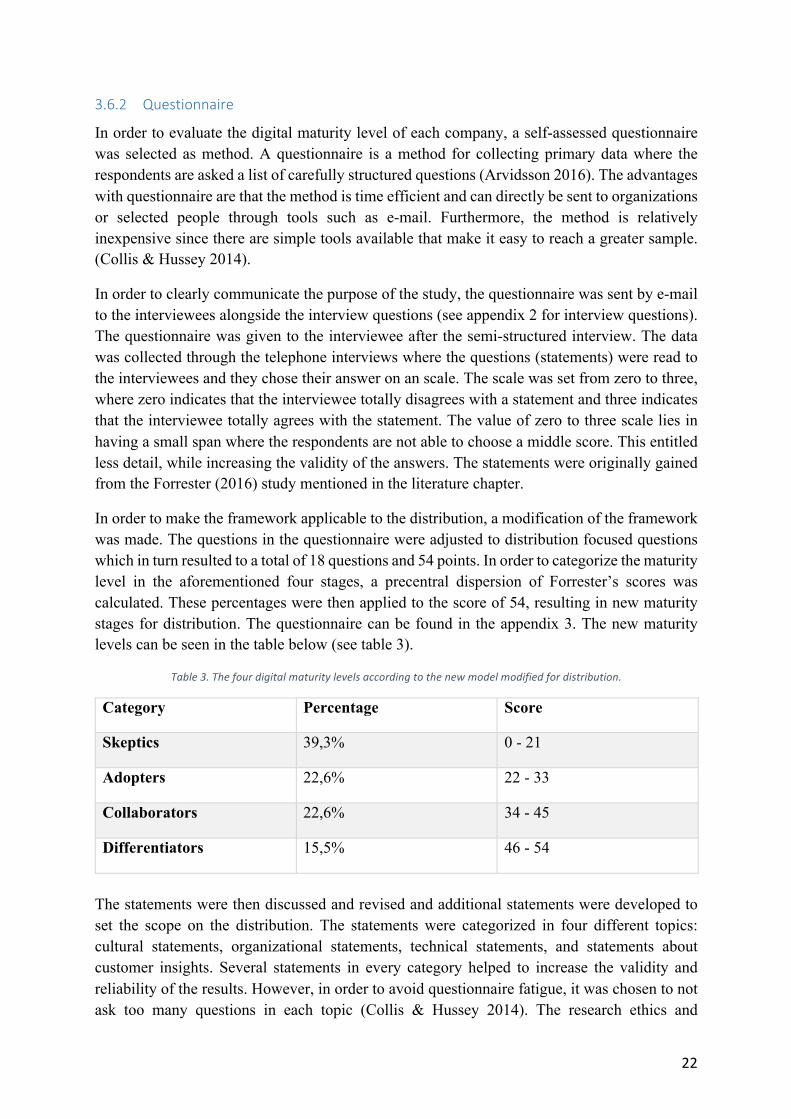
In order to make the framework applicable to the distribution, a modification of the framework was made. The questions in the questionnaire were adjusted to distribution focused questions which in turn resulted to a total of 18 questions and 54 points. In order to categorize the maturity level in the aforementioned four stages, a precentral dispersion of Forrester’s scores was calculated. These percentages were then applied to the score of 54, resulting in new maturity stages for distribution. The questionnaire can be found in the appendix 3. The new maturity levels can be seen in the table below (see table 3).
Table3.Thefourdigitalmaturitylevelsaccordingtothenewmodelmodifiedfordistribution.
Category Percentage Score
Skeptics 39,3% 0 - 21
Adopters 22,6% 22 - 33
Collaborators 22,6% 34 - 45
Differentiators 15,5% 46 - 54
The statements were then discussed and revised and additional statements were developed to set the scope on the distribution. The statements were categorized in four different topics: cultural statements, organizational statements, technical statements, and statements about customer insights. Several statements in every category helped to increase the validity and reliability of the results. However, in order to avoid questionnaire fatigue, it was chosen to not ask too many questions in each topic (Collis & Hussey 2014). The research ethics and
23
confidentiality were also in focus when designing the questionnaire and the purpose of the questionnaire was read out loud to the participants prior to start.
3.7 Dataanalysis
The data gained from the multiple case study was analyzed with respect to the literature. The results from all case companies were first analyzed to better understand the situation of the companies. A cross-case analysis was then made based on these cases. The analysis was then used as a foundation to draw conclusions and develop practical implications. The cross-case analysis led to a deeper understanding of the research topics within the case companies and enabled to identify the perceived benefits from different digital tools gained by each case company. Furthermore, the results provided deeper insights into the research questions and enabled to identify the key success factors regarding the digital maturity of each company.
A within case analysis was chosen for analyzing the qualitative data gained through the multiple case study. The advantage of within case analysis is that it provides a detailed description of the case and its setting (Boateng 2014). After transcribing the data from each case company, the analysis began to search for patterns within the cases (Voss et. al 2002).
3.8 Robustnessofthestudy
There are certain criteria that must be met in order to achieve validity in a research. To start with, the literature review should reflect the problematization, purpose and the research questions, while the theory is also in alignment with them. Furthermore, the data collection methods should cover problematization, purpose and the research questions and lastly, the discussion should answer the research questions. (Blomkvist & Hallin 2015) Using qualitative data is further a method which often results in a high degree of validity (Collis & Hussey 2014). Construct and external validity of this research are discussed more in detail in following chapter.
3.8.1 ConstructValidityAccording to Gibbert et. al (2008), construct validity refers to the accuracy of the study investigates what it was intended to investigate and how well it reflects the reality. Construct validity should be considered during the data collection phase and there are two measures that can be used in order to enhance the construct validity of the research. Firstly, the research should establish a clear chain of evidence, meaning that the researchers should provide the reader with a description of the research process. Secondly, the research should aim to triangulate, meaning it should use different data sources or data collection strategies.
This research has obtained a high degree of construct validity due to following reasons. The research has strictly followed the given measures by Gibbert et. al (2008). Moreover, the readers were given a clear and detailed description of the research process, from defining the scope of the research to the final conclusion.
3.8.2 ExternalvalidityExternal validity, or generalizability refers to degree in which the outcomes of a case are applicable to other cases (Collis & Hussey 2014; Gibbert et al., 2008). According to Eisenhardt
24
(1989), a cross analysis with four to ten case studies can be a basis for analytical generalization and a starting point for theory development. The external validity of a research should be considered during the research design phase (Voss et al. 2002).
This research obtains a high degree of external validity since it generally examines the digital technologies impact on distribution process. The outcomes of this research are not limited to a specific company since the selected companies are from different branch of industry within the retail industry. However, with increased resources in terms of time the research could be conducted on larger amount of companies to further enhance the external validity. With this said, the results are expected to be applicable for other retail companies with similar distribution processes. Finally, since almost every company selling a product in store needs to distribute their product from a center to the hands of the customer, it is believed that the outcomes can, with some customization, be applicable to other industries with similar distribution process.
3.8.3 ReliabilityAs validity means ’studying the right subject’, reliability refers to ’studying the right way’. To maintain a high degree of validity, the research needs to hold a high degree of reliability as well. (Blomkvist & Hallin 2015) High degree of reliability is achieved if results of repeated research in the future are similar to the original (Collis & Hussey 2014).
The two essential cornerstones of reliability are transparency and replicability (Gilbert et al. 2008). The transparency in this research is high since the methodology is described in detail, and the steps in the research are explained. The gathered data and tools for gathering data have been mentioned, while the questionnaire, interview questions, as well as transcripts are available at hand. If the research was to be repeated, the transparency allows researchers to repeat the study with these guidelines which would most likely result in the same findings.
As mentioned before, qualitative data was used to gain in-depth insights about the research topic. However, gaining qualitative data through conducting semi-structured interviews might also have increased the risk for lower replicability of the research to some extent. This is due to the fact that semi-structured interviews will differ in results when repeated depending on companies, positions, and people who are being interviewed. Furthermore, the follow-up questions in each interview could vary depending on the interviewee’s answer, or whether they understood the questions correctly. However, to maintain a high degree of reliability, clear guidelines were provided for the interviews and questions asked. Conducting ten interviews was another way to reinforce the arithmetic reliability, meaning whether the answers from different companies point out similar patterns after comparison. Another aspect that is expected to increase the replicability of the study is that the gathered literature and collected data were directly connected to the subject of research. Taking the two aspects into account - transparency and replicability - the overall reliability of the research’s methodology was perceived as high.
25
4 ResultsThe results from the interviews and the questionnaire are presented in this chapter. The data in this chapter are described as explained by company representatives, i.e. supply chain decision makers.
4.1 Resultsfromqualitativeinterviews
A structured approach was chosen to present the interviews in the following chapter. Firstly, a short introduction of the branch within which the case company operates in is presented. Secondly, the company’s digital tools and technologies are described, along with the outcomes of these initiatives to demonstrate the benefits each company has gained with help of these tools. Finally, the company’s view on digitalization is demonstrated. This further describes future plans, vision, ambitions and investments of each case and is followed by the future challenges as perceived by companies.
Case Company A
Company A is a pharmaceutical retailer with a distribution process that is almost fully automated. Company A has an IT-system for ordering which is based on weekly forecasting and this can be complemented with manual ordering. The system strictly follows two parameters when placing an order: a central, as well as a local minimum and maximum point of order. The central point of order is based on forecasting, while the local point of order is based on every retailer’s inventory. The ordering system prioritizes the local point of order over the central point of order. The delivery is registered via a handheld Personal Digital Assistant (PDA) upon arrival at the destination and the information is then sent to the DC.
Company A has a lead time of one day and there are five store deliveries every week. Company A are not able to track their cargos once they have left the DC. However, the company representative argues that there is no need for a track and trace technology either, since the lead time is low. Company A states that the already implemented digital technologies have had great impact on both cost efficiency and lead time. Company A argues that they have more than 400 stores and over 4000 items per store and coordination of these flows would be impossible without the help of digital technologies.
Company A believes that digitalization brings nothing except opportunity to their business. They further argue that the only threat is to not being able to take advantage of the digital transformation and develop as fast as digital technologies. Company A states that digital tools can result in competitive advantage, and ignoring the opportunities provided by digital technologies would have them fall behind their competitors.
Company A lacks a clear digital vision. However, the company aims to implement several digital technologies in their distribution. Company A thinks that there are many areas in which digitalization would have a beneficial impact. The major area is within inventory management. Company A explains that their ordering system uses forecasting that are based on historical data and the system is not able to predict future sales. Company A argues that the system should be able to predict the need by having information about the competitive landscape. By making
26
the system smarter with help of machine learning, it would increase the automation level as well as increasing the accuracy level.
Another improvement area is within the final mile, meaning delivery to stores. Company A explains that unpacking, stock taking, and expiration date check are time consuming activities, and if a system could take care these activities, in-store employees would have more free time to focus on the customers. Company A has an ambition to reduce in store logistic with one hour per day every year in each store by improving the ordering system as well as introducing new support systems. Furthermore, Company A wishes to invest in digital transformation and obtain a more automated process. Company A explains that while their invoice system is digital, matching the invoice with the order is done manually. They further state that there should be a system that matches the invoice with the order automatically.
Company A explains that resource limits in form of time and employees has been the major challenge so far. Accordingly, it has been difficult to prioritize the suitable digital development initiative. Company A mentions that their IT-systems are interconnected and a small change in one system would affect different sub systems. Developing these systems would require large resources while it would be more costly to develop the system than to replace the system with a new one. They believe that the major challenge in the future is to automate the testing phase in each development initiative. Company A explains that currently, the crucial part of testing for new system development is done manually by an employee. Company A mentions that reducing time from the testing phase plays an important role for the sake of managing all development projects.
Case Company B
Company B is a retailer operating in the pharmaceutical industry. A fairly small part of their distribution system is automated. The ordering system, both in terms of making and receiving orders are automated. Except automatic orders, there are also manual ones as complement. The ordering is done by an IT system and has three time limits for ordering. The time limits determine the point until which the stores need to place an order to receive their products in time. Company B is continuously working to have an automated warehouse that is planned to be finished in 2019. Company’s DC does not have access to store stock information and neither do the stores have access to the DC’s stock information. However, the headquarters have access to both and ensure that the DC always has every product available.
The lead time for Company B is usually one day. They possess visibility over their goods as they are scanned and registered in the logistics process. The information of the time each product has left a station as well as its destination is available at hand. The delivery accuracy is high at a rate of 98%. In addition, Company B believes that their use of digital technologies has improved their cost efficiency.
Company B aims to develop with digitalization and sees a large potential in digital tools. However, the company lacks a digital vision. They see an opportunity in a more transparent process and reaching a better balance in inventory between different stores. Currently, the product availability is too high in certain stores and too low in others, in which they see room
27
for improvement. Furthermore, they want to offer their customers the opportunity to see and follow their ordered product in the distribution process. In the coming years, they aim to make large investments in automation and be the first in the country with automated warehouse. Around 90% of the warehouse will be automated since there is always products that are not suitable for it.
The company sees the main future challenge in distributing to the consumer in an efficient way. They state that the future consumer has their own new requirements and thus the main challenge is to satisfy these requirements, whether it is home delivery or other distribution methods.
Case Company C
Company C is a retailer that distributes different types of liquid. The ordering system is automatic and can be complemented manually. In addition, the picking system in warehouse is automated. In this automatic picking system, the employee hears the order from a digital assistant through their headsets and receives information about the product’s location. When the employee arrives at the destination shelf, they need to read out the shelf code to inform the system that they are in the right location. Moreover, Company C uses handheld PDA devices for stocktaking and the process of sending an order, order receipt, and complaints is done through an Electronic Data Interchange (EDI) system. A third party logistics service takes care of the transportation.
Company C states that the use of their implemented digital technologies have improved the distribution performance and cost efficiency, although they do not have specific figures for these improvements. They further state that the overall distribution process has been streamlined thanks to these technologies. The lead time varies and the stores receive delivery between one to five times each week. Through their transportation partner, Company C is able to track and see the status of their products.
The company believes that with suitable initiatives and investments, digitalization is an opportunity. However, these investments are driven by customer demand. They see a substantial benefit in a more automated system to decrease the need for reviewing and complementing the orders with manual ones. They also believe that there is a substantial potential in efficiency, however there are no determined figures for it. As stated by company C’s representative:
“Making five minutes free from [a large amount of] stores results in a considerable sum in one day”.
Consequently, they see a huge potential in the handheld PDA devices and other uses of new technologies in stores. An example is having the dimensions of store shelves available digitally for better ordering size. They aim to have an automated process to the degree that increases customer satisfaction. For instance, if a customer makes an order, they should be able to see the arrival time in advance.
Company C states that acting mobile in stores is an existing challenge. Furthermore, the shift in focus from purchases in stores to purchases online set new requirements on the distribution.
28
Case Company D
Company D is a grocery chain within the CPG industry. A small part of their distribution process is automated which is the ordering system for the most part. Company D has an automatic replenishment system in 90% of their stores. Every store is responsible for selecting the minimum and maximum parameters themselves as well as how often they would like to have deliveries from the DC. When an item is purchased, the system subtracts the item from the stock balance. The system is built upon historical forecast, sales, and the number of deliveries. Furthermore, the system has a suggestion function that gives suggestions on various products and it uses the same parameter as the ordering system and the stores can easily order it by pushing one button. Beside these functions, the stores can manually adjust the quantity as well as selecting other items. The information is then electronically sent to DC. The stores are not able to see the DC stock information and vice versa, but the information about delivery time is available for all items that are out of stock.
Company D has a lead time of one to two days depending on the geographical location of stores. Company D uses a IT transportation system that tracks the item all the way from DC to stores as well as information about temperature during the delivery path. The replenishment system was implemented in 2009 and Company D states that stores have gained significant improvements in terms of decreasing food wastage and increasing shelf availability. Furthermore, Company D explains that stores can make more free time by setting correct and accurate parameters since the system suggests items based on the parameters.
Company D believes that digitalization is only an opportunity and they have the ambition of implementing the automatic replenishment system in all of their stores. The stores without the replenishment system scan their products manually, after which the items are registered in an order which is electronically sent to the DC. Company D has different improvement and development initiatives that they are planning to implement. Every initiative requires an extensive specification and cost accounting in order to decide which one is most profitable, and the result of the initiatives are also carefully inspected. Company D is continuously improving their replenishment system in order for it to become more accurate. Furthermore, some of the suppliers are delivering directly to the stores and Company D has the ambition to also provide the replenishment system for these suppliers. This is an issue, since as of today, there is no standard way to place an order to these suppliers.
The major challenge that Company D has faced so far is to educated the employees on how to use the system. Since Company D does not set the parameters for the system, it is crucial that employees knows how the system works. To cope with this challenge, Company D has a support team of eight people that regularly visit the stores and employees can easily get accessed to these people by calling them. The major challenge that Company D sees in future is related to resources. They explain that there are a lot of improvement and development initiatives and these are expensive to set in action. The IT-systems are interconnected with each other and some of them are too old that an improvement would be nearly impossible, or too expensive to implement.
29
Case Company E
Company E operates in the Do-It-Yourself retail branch, meaning the company sells products to customers that wish to build, modify, or do reparations without the help of professionals. As the company representative explains, they use EDI for data exchange with their transportation partners. Apart from that, the automation is fairly limited when it comes to distribution. The ordering system is centralized and utilizes a third party replenishment system that provides suggestions to central planners who determine the assortment for every store. These account for the major part of the product flow, while there are products that the stores order by themselves. The replenishment system uses historical data, trends, and forecasts to determine maximum/minimum values that are used as ordering points. These are dynamic and vary based on certain factors such as seasonal fluctuations. There are however, some central critical areas that are always controlled by central planners.
Delivery accuracy and stock balance are two dimensions Company E uses to measure distribution performance. They are able to track the cargos through their transportation partners. Their distribution center is outsourced to a third party company that does not have access to store stock information. The stores however, have access to the stock information in the distribution center while central planners have access to both figures. Company E states that their implemented digital technologies have resulted in substantial benefits such as time saving and increased quality. The lead time for the case company is between two to four days.
Digitalization is perceived as a significant opportunity by Company E. They see a substantial benefit in increased EDI connections with partners, which would in turn result in better cost and time efficiency, improved lead time as well as quality. Moreover, the company believes that with use of digital tools in transportation they could provide a better service to their customers and keep them informed about the location of their freight. They have a vision for a more digitalized distribution where the process is more visible both internally and externally and the collaboration with partners is further improved. Company E wishes to see an increase in sales with help of their investments in digitalization.
The existing challenges are that the EDI process is slow and complicated in the beginning and there are different standards, as different companies have different systems. In the future, Company E sees the challenge in visibility for all parts within distribution.
Case Company F
Company F is a retailer operating in home appliance industry without any automation in their distribution process. Company F’s stores are franchised and the store owner places an order manually or through a web portal. The order is processed if the product is available or whenever the client needs it. There are different IT-systems available utilized by company’s transportation partner, while they are not utilized by Company F. All franchisers regardless their location use the same platform and they are able to see DC stock information. Company F on the other hand, is not able to see franchisers’ stock information since the products are owned by them as soon as they leave the DC.
30
Regarding the lead time for deliveries, Company F believes that “fastest is not always the best”. The company uses “request dates”, referring to the date they aim to deliver the product to customers according to customer preference. The delivery accuracy is 98%. Company F can track the item through different checkpoint during delivery path once it has left DC. However, Company F argues that this is rarely used unless there is a deviation in the distribution process.
Company F believes that digitalization is an opportunity for their business. There is a clear vision for how digital they want to become. However, they lack a concrete goal. Company F mentions that they are halfway in an improvement initiative where they are replacing their ERP-system that was developed in 1980 with a more modern one. Company F thinks that they need to improve the visibility in their distribution process. The company further mentions that the process of registering customer delivery is done manually. They claim that this process would be easier if Company F could receive a message or a notification in an app as soon as the client signs up the delivery papers. Company F states that today, if a customer does not receive their products, they will call the franchiser who will in turn call Company F and seek the reason. The whole process is time consuming and results in customer frustration. Company F states that they are aware that the technology for tracking parcels and receiving notification is available today and that they could have it today. Despite this fact, they have not started to take advantage of this opportunity. Another improvement area that Company F mentions is having traceability throughout the delivery path. There have been times where cargos disappear and there is no information on where the products are.
The major challenge that Company F has faced is transportation costs. The company states that they are not able to deliver as promised. Moreover, they act too slow or too late in case of deviations. The major challenge in the future is perceived as availability and simplicity. The company argues that digital tools should make their business simpler. Company F states that they are there for the customer and not the other way around, thus neglecting customer requirements and poor service will result in customers going to competitors. They believe that the future is all about customer focus.
Case Company G
Company G is a retailer operating in the CPG industry. Out of their five DCs, one of them is largely digitalized where the whole process from receiving products all the way to packaging in roll containers is automated. Two of the DCs use automatic cranes to move and place pallets within the warehouse. Company G uses two IT systems to plan the transportation and see the location of every truck with help of GPS. The amount of trucks that deliver to and leave the DCs every day is high. Therefore, Company G uses a self-developed system that takes care of operational purchasing and manages the orders to stores.
Company G is also implementing a system to register the deliveries digitally instead of traditional way of using pen and paper. They further use a digital ordering system that automatically places an order when a product reaches its predetermined minimum stock balance.
31
Delivery accuracy, lost goods, in-time truck deliveries, and receipt accuracy are some of the criteria Company G uses to measure distribution performance. With help of the aforementioned systems, Company G has been able to improve the distribution performance and have a better, clearer overview of the whole process. This enables the company to be aware of the precise location of every product, which is critical in the CPG business. In case of quality concerns, Company G is able to track and trace every product and batch to identify its place, in DC or store. The stores are able to see whether the products are in stock in DCs. The lead time varies depending on store and product type and lies between half a day up to four days.
Company G sees room for improvement when it comes to lead time. They believe that digital tools can help to find optimal flows to decrease the lead time. They are able to fully track their products all the way until the point of sales. They have the ambition to decrease the operational work and focus on deviations. As a result, they would rather have digital processes that manage the standard operational work in order to make free time for tactical, strategic, long-term goals. Food safety is essential for Company G, which is an area they perceive can benefit the most from digital tools.
Digital tools are important for Company G as they aim to have control over their processes and optimize the product flows. They see large potential for improvements, especially for cooperation and collaboration between their systems to achieve a better control internally. The company sees RFID as a potential technology in their processes. However, they believe that the costs the technology currently brings makes it less suitable for their current needs.
One of the challenges Company G sees in the future is the integration of digital tools with manual processes. Transferring information from manual processes to digital ones, such as entering information by an employee in the digital system requires synchronization between the human and the machine which they believe is the main challenge in the future.
Case Company H
Company H is a retailer operating in the clothing industry. The company’s distribution process is semi-automatic. Warehouse Management System (WMS) is used as ordering system which is automatic, while the items are picked manually. Company H has a 2,5km conveyor in the DC on which boxes are transported to different checkpoints where employees put items in boxes based on category and destination, followed by the last step that is labeling. The labeling process is fully automated. Company H is currently implementing a digital picking system which is estimated to be 100% operative at the end of 2017. The ordering system follows only centrally maximum and minimum levels, meaning that stores are not able to place any orders. The replenishment system is based on each store’s performance. In-store employees can on the other hand help customers to make an order online. Furthermore, the stores are able to see DC’s stock information and vice verse but as mentioned before, they cannot place an order.
The lead time for Company H varies between one to two days depending on store’s geographical location. The company is able to track the items from DC all the way to the destination. Once items arrive the destination, store employees need to register the delivery and information is automatically sent to the WMS. Company H is not able to track their items once
32
they leave Swedish border. Company H states that digitalization and digital technologies have had great impact on their lead time, quality as well as cost efficiency.
Company H believes that digitalization brings opportunity to business and they have the ambition of giving customers the same feeling regardless of channel. They believe that the size of their stores will stay the same since the rental prices are increasing, especially in large cities. However, Company H thinks that they need to expand their online assortment and therefore, digitalization is crucial for their survival. Company H argues that real time availability is an area which digitalization would have great impact. They explain that the stock information should instantly be updated. As mentioned earlier, Company H is currently implementing a digital picking system and they are thrilled to see how other technologies such as artificial intelligence, robotics and machine learning can improve their distribution process.
The major challenges for Company H so far has been regarding resources. The company states that they have major improvement and development initiatives that are difficult to prioritize. Company H believes that their future challenge is to utilize the resources in way that maximize the benefits as well as choosing suitable digital technologies for their distribution.
Case Company I
Company I is a retailer operating in the clothing industry. As the product lifecycle is relatively short in this industry, around 70% of Company I’s products never make it to DC, rather than goes directly to the stores. The company uses third party logistics services for transportation.
Currently, they use an IT system for purchasing, product allocation between stores, and assortment planning. Handheld PDA devices are used to ensure that order picking is done correctly. An IT replenishment system is used to determine the order need for each store. All ordering is determined by this system and no store places a manual order. The first product assortment in each store is determined by a group of employees in the headquarters by use of selected parameters. Company I is also implementing a new digital WMS system that is intended to manage the overall warehouse ordering and picking.
The lead time for Swedish stores is one day. Correct order picking, picking hours, and delivery accuracy are figures used to measure distribution performance. Company I is able to track their products and when stores receive the products, the products are scanned and registered for arrival. Seven days after sending the products, Company I checks the system to find out the products that haven’t arrived to the stores. These deviations are used to investigate whether the products weren’t scanned at the store or if they were lost on the way.
Company I sees digitalization only as an opportunity for companies that are willing to adapt. For companies that lack the competence in-house however, this can be a threat. They perceive RFID as a potential technology, while they believe that the costs are still relatively high. In this sense, they believe that they don’t need to be first movers in this area and let others with stronger economical muscles take the lead and implement the technology first. They believe that RFID will be beneficial especially in stocktaking, decreasing theft in stores, and logistics visibility in
33
distribution. Furthermore, Company I sees the main benefit of digital tools in increased quality and visibility, to ensure that the right product is in the right place in anytime.
They believe that their upcoming digital initiatives will improve the internal distribution performance. The picking information and stock taking will be in real-time and it will be almost impossible to make errors in the internal system. The new system will use a unique ID for every employee which allows company I to have a better overview on Key Performance Indicators (KPIs), both in group and individually. However, this will not affect their distribution partners. Company I will still only be able to measure the logistics services’ performance.
Company I sees the main challenge in having the whole organization understand that the conversion towards digital tools is not an IT project - rather than a business project. This is needed to have all divisions appointing the resources required. In the future, they see the challenge in regularly upgrading and updating their ERP system.
Case Company J
Company J is a retailer operating in furniture industry with a DC that is outsourced to a called third party logistics service. Company J has just started with a pilot project where they have implemented an automatic replenishment system to 10-15 stores. The mentioned system eases the workload on store employees. The system follows two parameters and these are: special offers and historical data. Their logistics partner and Company J do not use the same ERP system, thus the logistics service continuously synchronizes the data so it can match the data in Company J’s ERP. The stores on the other hand use the same ERP system and they are able to see DC’s stock information. Company J argues that the replenishment system has improved the product shelf availability in stores.
The lead time is two to five days, some of the stores gets delivery once a week this due to geographical location and size. Company J is not able to track the parcels once they have left DC, rather than only receive a notification that they have left DC. There is another pilot initiative in process at Company J where all parcels are required to be scanned as soon as they are picked.
Company J believes that the furniture industry is lagging behind regarding digitalization while they mention that digitalization opens up for distinct opportunities in the furniture industry. There is no clear vision regarding digitalization in their organization, however there are different improvement and development initiatives which affected divisions are aware of. Company J explains that the most common question that is received by their customer service is: “Where is my product?”. Furthermore, they explain that delivering the product as fast as possible is not the most crucial factor for the customer, but it is traceability. Customers want to receive an update on where their product is and the information should be accurate. In that sense, Company J believes that digitalization would have a great impact on the part where products are distributed from DC to the stores. This problem can be solved by scanning the products and having a system that automatically sends a notification to the customer. In addition, the customer would be able to track the parcel through the webpage or an application
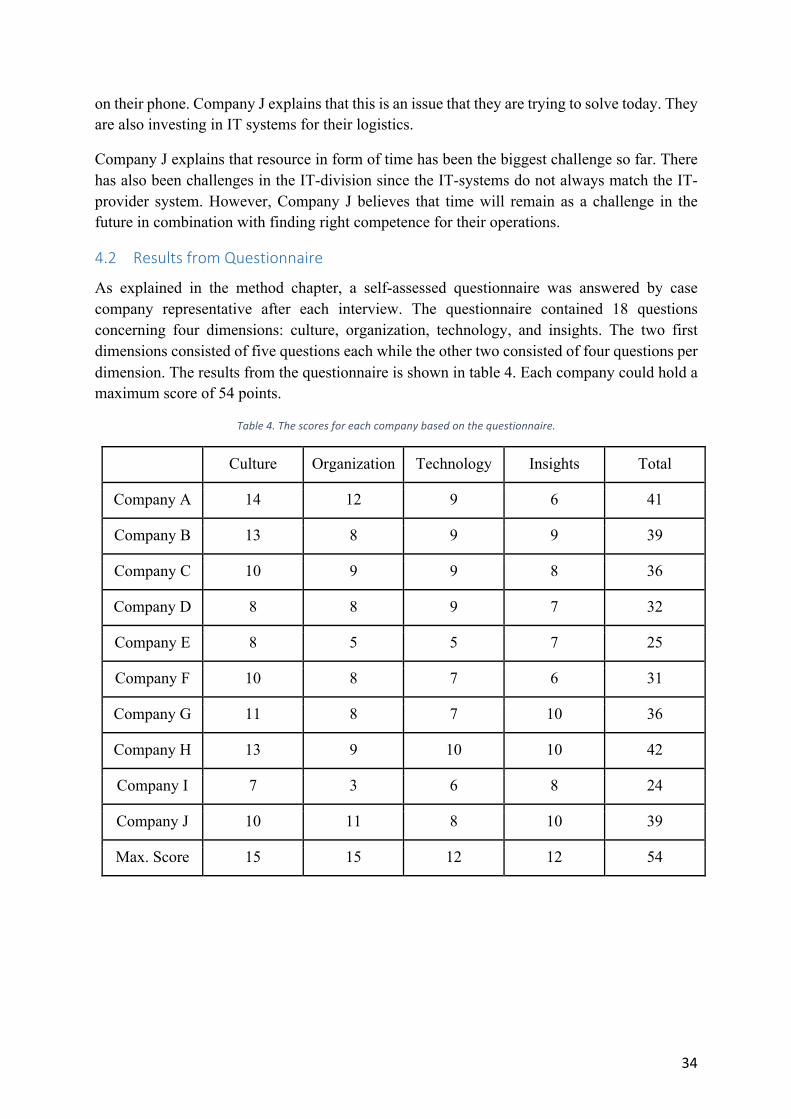
34
on their phone. Company J explains that this is an issue that they are trying to solve today. They are also investing in IT systems for their logistics.
Company J explains that resource in form of time has been the biggest challenge so far. There has also been challenges in the IT-division since the IT-systems do not always match the IT-provider system. However, Company J believes that time will remain as a challenge in the future in combination with finding right competence for their operations.
4.2 ResultsfromQuestionnaire
As explained in the method chapter, a self-assessed questionnaire was answered by case company representative after each interview. The questionnaire contained 18 questions concerning four dimensions: culture, organization, technology, and insights. The two first dimensions consisted of five questions each while the other two consisted of four questions per dimension. The results from the questionnaire is shown in table 4. Each company could hold a maximum score of 54 points.
Table4.Thescoresforeachcompanybasedonthequestionnaire.
Culture Organization Technology Insights Total
Company A 14 12 9 6 41
Company B 13 8 9 9 39
Company C 10 9 9 8 36
Company D 8 8 9 7 32
Company E 8 5 5 7 25
Company F 10 8 7 6 31
Company G 11 8 7 10 36
Company H 13 9 10 10 42
Company I 7 3 6 8 24
Company J 10 11 8 10 39
Max. Score 15 15 12 12 54
35
5 AnalysisThis chapter presents the analysis of the findings with respect to the literature and theory.
5.1 RQ1:Howisthedigitalmaturitylevelwithindistributionprocesses?
Case Company A
As shown in the table 4 in the results chapter, Company A scored fairly high in cultural, organizational, and technological dimensions while holding a lower score in insights. This indicates that Company A has a supportive and empowering approach towards digital technologies, both from organizational and cultural viewpoints. Companies that score high on technology have a higher level of adoption of emerging digital technologies. Accordingly, Company A is taking advantage of several digital tools in order to increase cost efficiency as well as to reduce lead times. Scoring low in insights indicates that there is still potential in using customer and business data to measure success and inform firm strategy. Company A explained that unpacking, stock taking and checking the expiration date are time consuming, and that in-store employees would have more time with customers if there was a system that could take care of that. Having a system that collects business data would unlock free time for in-store employees, resulting in an increase in time to serve the customers instead of managing daily routines. This would thereby allow them to focus on customer demands and include their insights in Company A’s digital strategy. Company A holds a score of 41 in the digital maturity model which places them in Collaborators. Collaborators break down traditional way of working and they use digital tools in order to create competitive advantage, which reflects Company A’s interview results.
Case Company B
Company B is the third most digitally mature case company in this study. Company B’s scores were higher in culture, technical and insight aspects while scoring fairly low in organizational aspects. Companies that score low in organizational aspect lack support for digital strategy. This is demonstrated in the study results, as Company B stated that they lack a digital vision within the organization. Despite scoring highest in culture, Company B is in need of a clear digital vision that is communicated throughout the whole organization. Only then, they would able to fully take advantage of the benefits from digital technologies. The technical and insights aspects of Company B were high. An example that reflects the strong technical dimension is that the company has a ambition of having a fully automated warehouse at the end of 2019. In addition, Company B is aware of the requirements of their customers and includes their insights in their digital strategy. They explained that they want to offer the customers the possibility to trace their products in the distribution process. Company B holds a score of 39, which places them in Collaborators. This is in line with Company B since they have an ambition to have a fully automated warehouse and thereby create competitive advantage.
Case Company C
Company C’s scores were approximately on an equal level in all four dimensions. Their strongest area, the cultural dimension, describes the company’s ability to empower their
36
employees with digital tools. This is reflected in the company’s implemented technologies, such as the automatic picking system, or the handheld PDA devices used in the warehouse. The company’s weakest area of maturity was insights. This indicates that Company C lacks the use and inclusion of customer data, which is an area the company representative mentioned that they were working on. It was further highlighted in the interview that the organization’s digital investments are driven by customer demand, through for instance providing the opportunity for their customers to see the time for which their orders will arrive.
Company C holds a score of 36 in digital maturity model which places them in Collaborators. The company’s external collaboration with the third party logistics partner that enables for the digital opportunity, in this case traceability in the distribution, is a key characteristic for Collaborators reflected in the interview.
Case Company D
Company D scores highest in technological dimension while their score is relatively low on insight aspect. This demonstrates the company’s continuous use and adoption of emerging technologies which was apparent from the interview. As an example, Company D possesses an advanced IT transport system that gives real time data on temperature as well as tracking information. Furthermore, their replenishment system has a function that give suggestion which products each store should order. However, there is still room for improvement in all dimensions, which was emphasized during the interview. For example, only 90% of their stores have the replenishment system.
Company D is categorized as Adopters since they hold a total score of 32 points. Companies that usually fall in this category are still investing in skills and infrastructure in order to unlock the true potential of digitalization. As Company D’s representative explained during the interview, they are still implementing the replenishment system to the remaining 10% of stores while at the same time continuously improving the system in order to make it more accurate. As shown from the questionnaire, Company D has still room for improvement in the insight aspect. Even though Company D are using business data in order to improve the replenishment system, they also need to include customer insights in their digital strategy and thereby scaling their business. Furthermore, Company D have understood the importance of collaborating with other parts in the supply chain since they are providing the replenishment system to their suppliers. In this sense, it appears that Company D is in transition phase towards becoming Collaborators. This is further confirmed by their score of 32, as 34 points would place the company in Collaborators.
Case Company E
Company E’s maturity level is weak when it comes to organizational and technical aspects. According to the survey, company representative expressed that the allocation of suitable resources towards digital strategies is an area that is in need of improvement, while the digital competence inside the organization is poor. Furthermore, the interview revealed that automation is limited, while there were no digital technologies mentioned except for EDI and the replenishment system. However, Company E is stronger in the area of culture and customer
37
insights. To some extent, the company empowers employees with digital tools. An example is the replenishment system that provides suggestions to determine the store assortment. They further emphasized the importance of customer insights, by declaring the ambition to provide better customer traceability with help of digital tools. As a result to their initiatives, Company E received 25 points in the digital maturity model which categorizes the company as Adopters. Through devoting suitable resources to digital investments and a stricter governance of their digital vision, they could reinforce the technical and organizational sides of their digital practice and thereby achieve a higher degree of digital maturity.
Case Company F
While Company F holds a relatively high score in the cultural dimension, their scores are lower in the other areas. This entitles that the company empowers their employees with digital tools. However, they are lagging behind in the remaining areas. To start with, the company holds a poor adoption of modern technologies. The old ERP system is one example. As emphasized in the interview, there are IT systems available through their transportation partner, while this is not utilized by Company F. Moreover, there is a poor governance of a digital vision. Despite having a digital vision, there is no concrete goal in order to fully govern and execute the digital strategy. In addition, the organization is missing on fully including customer insights in their distribution processes. The interview revealed that late delays result in customer frustration. However, the company is aware of the importance of the matter, as the company representative mentioned that the future is dependent on customer focus.
Their score of 31 places Company F in the Adopters category. This implies that they are investing in skills and infrastructure, which is in line with the findings from the interview. As Company F explained, the old ERP system is being replaced by a new one while the company plans to increase the traceability within their distribution. Moreover, they mentioned that they would like to receive a notification as soon as the delivery papers are signed by their customers. This entails that Company F have realized the importance of collaborating with other parties along the chain which is needed in order to scale the digital maturity into the next level.
Case Company G
Company G holds a higher score in the area of customer insights. Operating in the CPG industry, Company G has food safety as the main concern. The score is also high when it comes to the cultural aspects. The drive towards promoting digital innovations and empowering employees with digital tools is apparent from the interview results. Allowing employees to see the precise location of goods, the ambition to decrease the operational work for the employees, and evaluating the potential of technologies such as RFID are some of these examples. Although the company possess certain advanced technologies in place, there is still room for improvement. For instance, Company G has recently invested in a system to digitally register deliveries. Furthermore, they are seeking digital tools that can help to optimize the product flows.
Company G is categorized as Collaborator due to their score of 36 in the digital maturity level. As the company emphasized in the interview, they see significant improvement areas for
38
internal cooperation and collaboration. This willingness for collaboration enables digital practice and innovation. The company is breaking the traditional ways of distributing within the CPG industry by using innovations such as the digital system for operational purchasing.
Case Company H
With a score higher than every other case company, Company H demonstrated strong digital capabilities in the survey. The company is mostly strong in cultural areas, meaning they are able to drive digital initiatives in house and provide digital opportunities for their employees. They further use customer insights to drive success, through initiatives such as planning to provide the customer the same experience regardless of channel. In addition, Company H’s interview results fully demonstrate that their organization welcomes new digital technologies. The use of WMS and implementing a digital picking system are two examples of this kind of initiative. Moreover, as previously mentioned, the company is evaluating the opportunities brought by technologies such as machine learning. The total sum of 42 points, places the company in the Collaborator stage in the digital maturity model. This implies that Company H utilizes digital strength to create competitive advantage. This was clearly emphasized in the interview, as Company H’s representative stated that the adoption of digital opportunities is crucial for their survival.
Case Company I
Company I holds the lowest digital maturity level compared to the other case companies. The company’s weakest area was the organizational dimension with only three points. This indicates that Company I lacks adequate support from higher managerial levels towards their digital strategy. According to Forrester, companies that hold a lower score in organizational dimension lack the governance and guidelines towards executing improvement initiatives. As emphasized through the interview, there is no digital vision within the company, which in turn has a negative effect on the other dimensions as well.
Company I holds a total of 24 points which places the company in the Adopters category. As shown from the result of the questionnaire, there is room for improvement in all dimensions. However, it is currently crucial to focus on the organizational aspects. By having a short term as well as a long term vision in combination with adequate support from top management, Company I can foster the digital vision inside their organization to be able to fully take advantage of the benefits from digital technologies. After the organizational aspect, the focus should turn towards the technical dimension. This entitles that the company would need to invest in digital technologies and empower its employees with digital tools, in order to achieve a higher degree of digital maturity.
Case Company J
The area in which Company J holds the lowest score is technology. As emphasized in the interview, the company believes that their industry is lagging behind when it comes to digital technologies. The utilization of modern digital techniques are still in the pilot project phase for Company J. However, these initiatives for improvement are being developed and
39
communicated throughout the organization which supports the company’s score within organizational dimension of digital maturity. In this sense, Company J shows the drive to plan and execute digital initiative in the organization. The company holds a score of 10 both in use of customer insights and cultural matters. As mentioned in the interview, customers of the company seek to have better traceability over their orders, which Company J is aiming to solve with digital solutions such as IT system in transportation. Their score of 39 places the company as Collaborators in the digital maturity level. This is further reflected by their investments and ongoing digital initiatives, as mentioned in the interview.
Finally, the results from the case companies reflected Forrester’s statistics. As mentioned before, 84% of retail companies were either Adopters or collaborators in Forrester’s study. All case companies in this research, fell into these two categories.
5.2 RQ2:Howisdigitalizationanditsimpactondistributionperceivedbycompanies?
The case companies did not possess specific figures on how much their distribution performance had been improved by different digital technologies. However, they experienced different benefits through their implemented digital technologies. The observation of these benefits was highly dependent on their choice of KPI’s in distribution. These benefits are analyzed in the following with respect to theoretical concepts and literature.
As expressed in the results, an automatic store replenishment system is widely utilized within all case companies. However, different companies have reached different levels of utilization. While companies such as Company J have only recently started a pilot project, others have used the technology in several years and seized the benefits. These benefits were in line with the benefits found in the literature. As mentioned before in the literature chapter, some of the benefits of an automatic ordering system are lower out-of-stocks, lower inventory costs, as well as lower labor costs. Out-of-stocks create a cost when the customer is not able to buy the product. Lowering out-of-stocks in this sense, increases revenue while at the same time reduces costs. Two main reasons for out-of-stocks are the mistakes made by employees and poor demand forecasting. The automatic store replenishment that the case companies use has different parameters such as historical data, sales and forecasting. These parameters prevent out-of-stocks which in turn decreases the costs.
By having an automatic store replenishment system that places orders periodically, the stores will not be in need of a large inventory that creates additional costs. Moreover, the labor costs are decreased since the system automatically places the orders. Human errors are reduced which also has an impact on the costs. Cost is the common denominator in all of these areas which is decreased through automatic replenishment systems. This is in line with the results of the case study, which demonstrated that most of the case companies had experienced improved cost efficiency after implementing replenishment system. Below is a quotation from a case company regarding automatic replenishment system and its relation with cost efficiency.
“Yes, absolutely, the stores have gained a lot of improvements. It has reduced wastage significantly. You have better control so you do not buy a large quantity which reduce
wastage on products that are out of date” - Company D
40
Another benefit of automatic replenishment system, reduction of price markdowns, has also been seen among the results. Giving the retailer the ability of quicker response to demand and being aware of high and low selling products, there is no need for large inventories of products that cannot be sold. As a result, the retailer is not in need of reducing prices to sell the products. Below there is a quotation from a case company regarding automatic replenishment system and its relation to price markdowns.
“It has significantly reduced markdowns, i.e. discounts in stores.” - Company H
For most companies, the lead time is as short as one day. However, several case companies have gained shorter lead time through their implemented digital technologies. The ordering system places orders automatically and thus is able to calculate the time limit required for an order to meet the company’s predetermined lead time. As company G described, there are time limits every day determined for each store to help them receive their goods in one day.
Since a shorter lead time and increased responsiveness is positively related to higher transportation costs, this trade-off is an important aspect for all case companies. The automatic ordering system however, enables these companies to without delay make orders and thus more rapidly fill the cargo trucks. This in return allows for decreased transportation costs.
The use of automatic replenishment system has enabled Company D to increase shelf availability in store. Additionally, they believe that with right parameters, more time can be freed for employees in store. Below there is a quote demonstrating the mentioned outcome:
“It [the automatic replenishment system] works great if you have all the parameters correctly, this results in a large time saving for the stores” - Company D
Company G has two IT transportation systems which schedule each route as well as increase the traceability of each truck. According to literature, IT Systems in transportation enhance the utilization of fleet resources as they enable to load the trucks efficiently with regard to their delivery path. This was used by Company G whereas the company had gained the benefits of IT systems and been able to have a better overview of their logistics process, to see the location of each product. This was also utilized by Company D. Both companies were able to gain a clearer logistics visibility. In addition, having live information about their cargos enabled the companies to make smarter decision and hence lead to an enhanced responsiveness. Other organizations such as Company B, C, E, F H, and I that had tracking systems without live information, were still able to trace their cargos through different checkpoints and thus gain a re-inforced logistics visibility. Since the IT transportation systems help to schedule routes while allowing to optimize fleet resources, companies are informed about the time the trucks need to leave the DC in order to arrive at the destination point in predetermined time. As several case companies had experienced, this resulted in higher degree of delivery accuracy. Case Company J, was not able to track their cargos. However, they had realized the importance of traceability in transportation and hence, this was an improvement initiative that they aimed to implement.
Another digital technology that Company A, C, F, I, and H use is handheld PDA devices. The use of these devices is in scanning and digitally storing information about product’s location
41
and time of arrival as well as departure. With help of these devices, the aforementioned companies would be able to instantly validate the cargo content and identify deviations such as lost goods. Accordingly, the information is immediately available to the concerned people in the process, leading to a more efficient decision making. Lastly, the paper based processes will be eliminated, preventing from human errors and resulting in a more accurate and efficient information gathering.
All case companies agree that digital tools bring opportunities to their way of doing business. The case companies have realized that if they do not seize the opportunity, they would fall behind their competitors. This is demonstrated in the quote below:
“If we do not have the ability to do it, there is a risk that someone else has, and thereby we will lose competitive advantage” - Company A
Finally, another common factor for all companies was that, all case companies see room for substantial benefits with help of digital tools. As Company G’s representative described one of the potential benefits of digital tools:
“Having control over our processes and to be able to really trace our products more on batch level all the way to the stores” - Company G
42
6 DiscussionIn this chapter, the findings of the research as well as conclusions are discussed. Discussion upon choice of methods as well as its impact on the results will also be carried out.
By reviewing the findings of the research, it seems that the case companies operating in the Swedish retail industry have been developed with the digital transformation and realized the importance of digital opportunities. All case companies had a maturity level of Adopters or Collaborators, which was in line with Forrester’s statistics for digital maturity level of retailers and wholesalers. While Forrester’s maturity statistics are obtained through self-assessment of global marketing decision makers, the answers in this research were collected through self-assessment of supply chain decision makers of the retail companies. The results show that ten of Sweden’s largest retailers, have already started their digital transformation and already managed to integrated digital tools in their supply chains and grasp the benefits. While some have reached further in their transformation process than others, all agree upon the importance of digital tools and the need to quickly seize its provided opportunities. Accordingly, companies need to continuously develop and integrate new digital technologies in their business. However, there is not an obligation for every company to become a digital differentiator. Since digital investments often imply major costs, some companies aim to slowly secure the profit of their business and thus develop in a slower pace. In this sense, they avoid to take steps as first-movers and act while being ensured by other companies’ grasped benefits upon their digital investments.
Benefits such as improved lead time, increased free time in stores, and shelf availability were mentioned by only two companies. There are several aspects that might have affected these outcomes. Firstly, the case company might have reached a point in the area that does not require further improvement. An example is the lead time for Company G. Their lead times are already optimized and the trade-off between transportation costs and responsiveness is the main factor determining the lead time for the company. Secondly, the case company might lack a measure for the aforementioned areas. This implies that, although a company might have unlocked free time for store employees with help of digital tools, the increase have not been mentioned in the interviews due to the company’s lack of metric for store employees’ free time. Finally, the interview questions included only the areas within which digitalization had the largest impact on. Aspects such as shelf availability were mentioned by company representatives.
• Diskutera skillnaden mellan företagen i samma industri /Diskussion As some of the case companies operate in the same branch of the retail industry, it is interesting to magnify the similarities and differences in each branch. Company A and B, both operating in pharmaceutical retail, were categorized as Collaborators with similar scores. It seems that both companies have realized the importance of integrating digital tools in their distribution. With rise of new players who only operate with an online platform, Company A and B have understood that integrating digital tools in their distribution is not only a competitive advantage, but rather a necessity in order for them to survive. The results were almost similar for Company D and G as their utilized digital tools were needed in the CPG branch for accurate planning and logistics in distribution. However, as Company D’s economic position today is not as strong as
43
Company G, they cannot afford investments of same dimensions and thus received a lower score. The most significant contrast was seen in the clothing branch. While Company H was the most digitally mature company of the study, Company I was the least digitally mature case. The reason here seems to depend on the corporate strategy. With help and support from top management, Company H perceives digital investments and similar types of initiatives as crucial to gain competitive advantage and continuously invest in new creative solutions and promotes new ways to foster their business. Company I on the other hand, has a low cost strategy and governs investments with a cost based approach, resulting in few large investments and thus a low digital maturity.
All case companies in this study fell into the two categories Adopters and Collaborators. While 84% of retailers in Forrester’s study fell into these two categories, this study’s dispersion of companies points out for discussion of the reason behind the lack of Skeptics or Differentiators found. Generally, when it comes to scale questions, people are more likely to not choose extreme values which in this case can result in the two categories in middle. In addition, the chosen requirements for case companies entailed large corporations in Sweden and normally in these sizes, players have already taken some steps towards their digital transition which minimizes the chance for the appearance of Skeptics. Furthermore, Differentiators are companies that are most likely to be fully aware of the digital technologies available. Hence, they are more likely to not perceive themselves as most digital in the market and not give themselves higher scores, despite essentially being Differentiators.
As qualitative interviews were used as one of the main data gathering methods, there is a possibility of dishonesty or bias. Since most of case companies were located outside Stockholm, the interviews were held through telephone due to time and resource constraints. However, while conducting interviews on telephone is an efficient way to gather data, it is difficult or nearly impossible to capture other signals such as body language. If the interviews were conducted face-to-face, it would be possible to also capture body language and nonverbal signs such as feelings. There is a tradeoff between resource and quality of data.
Bias is another important aspect to discuss when it comes to interviews. The period of time the company representatives have been at the company might have affected their answers. Moreover, their knowledge within the area of digital might also have affected their responses. Digitalization and digital tools can also be perceived and interpreted differently by different individuals within an organization. In this sense, interviewing several employees in different positions would help to avoid missing on important data. Conducting interviews with several people would also increase the validity of the research. Finally, the research could be conducted at the case companies’ sites, to ensure that all important data is gathered as well as to decrease bias among the interview participants. This choice of method however, would require extensive resources.
6.1 Sustainability
The area of sustainability deals with the long-term aspects of any company’s survival. The acknowledged concept of “Triple Bottom Line” consists of three aspects: economical, environmental, and social. (Elkington 2004) The economical aspect is about economical well-
44
being and highlights figures such as cost efficiency. The environmental aspect deals with environmental footprint, in which factors such as energy consumption and impact on climate are discussed. Last but not least, the social aspect includes aspects such as human health and personal development. (Giddings et. al 2002) These three aspects - economical, environmental, and social sustainability are discussed below.
6.1.1 EconomicalContinuous improvement of traditional processes by integrating new digital technologies entails major costs both in terms of software and hardware. Most of the companies agreed on improved cost efficiency as a benefit from digital technologies. Further, the case companies approved that they could decrease costs by preventing wastage through implementation of digital technologies. In addition, the findings of the study revealed that digital technologies contribute to a range of indirect monetary benefits such as unlocking free time. As Company A stated:
“We have the ambition to reduce in store logistic, we want to improve the processes so we can save one hour each day, in each store and each year”.
Unlocking free time can have economical benefits for the company in a sense that in store employees are then able to do other tasks such as serving the customers. Additionally, by implementing digital technologies, companies can ensure themselves that important data will not evaporate. There is a possibility that important data disappears with traditional methods, since traditional processes often entail major paperwork. By having smart digital technologies, important data will be instantly stored and accessible for concerned people within an organization which in itself unlocks more free time. Other economical benefits from digital technologies are as mentioned in previous chapters: traceability, delivery accuracy, improved lead time as well as shelf availability. This implies that the case companies are aware of the long term economical benefits from digital tools.
6.1.2 EnvironmentalThere are also environmental aspects. With help of PDA devices in warehouses, the use of traditional paper diminishes which has a large impact on the environment friendliness of the retailer’s distribution system. As discussed before, digital tools can also help to optimize the lead time in the distribution, by taking the transportation costs into account.
Digital tools that can be utilized in today’s distribution provide opportunities that have been nearly impossible before. According to Kagermann (2015), the digital transformation is enabling for a more efficient and environmentally friendly logistics. The consumer of today judges transport services according to their efficiency, sustainability, and environmental and land use impact, among other aspects (Kagermann 2015). In all these areas, digital tools have a significant impact to provide a reliable and sustainable distribution system and increase the efficiency in transportation. There are also other digital tools under development that can soon be utilized in the distribution. An example is the trucks developed by Volvo, which by keeping a minimum distance between trucks driven in a convoy decrease air resistance and consequently fuel consumption. There are also external digital tools can help to provide to a more
45
environmentally sustainable transportation. Smart traffic lights and similar infrastructure that help transportation vehicles to maintain a steady speed also result in decreased fuel consumption, and thereby decrease the environmental footprint. (Blix 2015)
6.1.3 SocialWhile there has been research on how digital technologies can contribute to economical and environmental sustainability, there is still a lack of research in the field of social sustainability (Ford et. al 2016). However, digital technologies also contribute to social sustainability, which was apparent in the interviews. Two of the drivers in social sustainability is health and personal development (Atkins 2008). When it comes to health, warehouse work often involves heavy lifts due to the pallets. Using automatic cranes for relocating the warehouse pallets in this sense, is one example in which digital technologies contribute to social sustainability. Moreover, by integrating digital technologies in repetitive processes, employees would have more time to take on new tasks and thereby, learn more and develop themselves.
6.2 Managerialimplications
For companies that aim to seize the benefits that digital technologies have to offer, an organization need to address three different perspectives: individual/organizational, functional, and industrial.
On the individual level, managers need to empower their employees towards adoption of digital technologies. Furthermore, they need to ensure that the organization possesses the appropriate resources that supports digital transformation. In this sense, a clear digital vision should be incorporated and communicated throughout the whole organization. Without a common unified vision, it is difficult for employees to understand the purpose of their assigned tasks. The organization should provide their employees with a strategy on how to utilize their resources in spite of fully take advantage of digital technologies. Finally, managers should employ competent employees with suitable skills which can help the company further into their digital transformation.
On the functional level, it is important to take the efficiency of the distribution into account. As mentioned by seven of ten case companies, digital tools help to increase the efficiency of the distribution system. Visibility for different parts within distribution is another crucial aspect. This enables all parts in the distribution to act faster and make smarter decisions. Availability and simplicity are other aspects that managers should take into account, which provide the different parts in the supply chain to easier interact with each other. Finally, transforming manual data into digital and integrating digital tools with manual processes is another critical aspect on the functional level. The sooner managers are able to fully replace traditional ways of registering data with digital systems, the sooner they will be able to grasp the benefits.
On the industrial level, managers should pay attention to upcoming trends and technologies to quickly find opportunities suitable for their organization. As mentioned by Company C’s representative, there is a shift in focus from purchases in store to purchases online which sets new requirements on distribution systems. There is also a shift towards customer focus, indicating that future distribution systems will need to respond and adapt to the customer needs.
46
Managers should be aware of these changes and be able to act fast to not lag behind their competitors. Accordingly, it is vital for every manager to make their division understand that adapting to the digital transformation is a business project, and not an IT project.
6.3 Futureresearch
To continue this study, additional interviews with other large retailers could be conducted to gain a clearer overview of the digital maturity state within the Swedish retail distribution. Moreover, by conducting interviews with additional employees from each case company, such as Chief Technology Officers (CTO) or Chief Financial Officers (CFO), the results from the research could be strengthened. Furthermore, other benefits of digital tools in distribution that have not been highlighted in this study could be examined. With enough resources and time, a deeper investigation of each case company could be conducted to have a deeper understanding of the benefits. This way, there would also be a possibility to develop metrics and measure the actual level of benefits gained by the digital tools. Finally, the impact of digitalization on social sustainability is area in which there has been limited studies, which also can be improved.
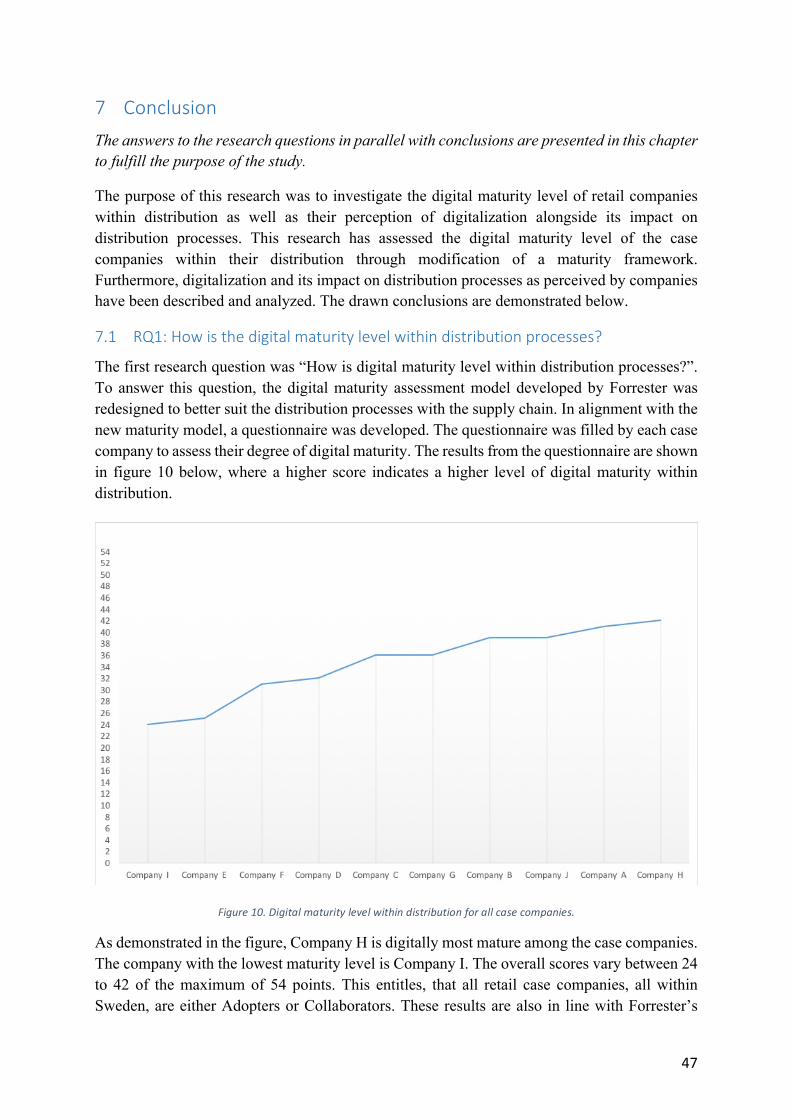
47
7 ConclusionThe answers to the research questions in parallel with conclusions are presented in this chapter to fulfill the purpose of the study.
The purpose of this research was to investigate the digital maturity level of retail companies within distribution as well as their perception of digitalization alongside its impact on distribution processes. This research has assessed the digital maturity level of the case companies within their distribution through modification of a maturity framework. Furthermore, digitalization and its impact on distribution processes as perceived by companies have been described and analyzed. The drawn conclusions are demonstrated below.
7.1 RQ1:Howisthedigitalmaturitylevelwithindistributionprocesses?
The first research question was “How is digital maturity level within distribution processes?”. To answer this question, the digital maturity assessment model developed by Forrester was redesigned to better suit the distribution processes with the supply chain. In alignment with the new maturity model, a questionnaire was developed. The questionnaire was filled by each case company to assess their degree of digital maturity. The results from the questionnaire are shown in figure 10 below, where a higher score indicates a higher level of digital maturity within distribution.
As demonstrated in the figure, Company H is digitally most mature among the case companies. The company with the lowest maturity level is Company I. The overall scores vary between 24 to 42 of the maximum of 54 points. This entitles, that all retail case companies, all within Sweden, are either Adopters or Collaborators. These results are also in line with Forrester’s
Figure10.Digitalmaturitylevelwithindistributionforallcasecompanies.
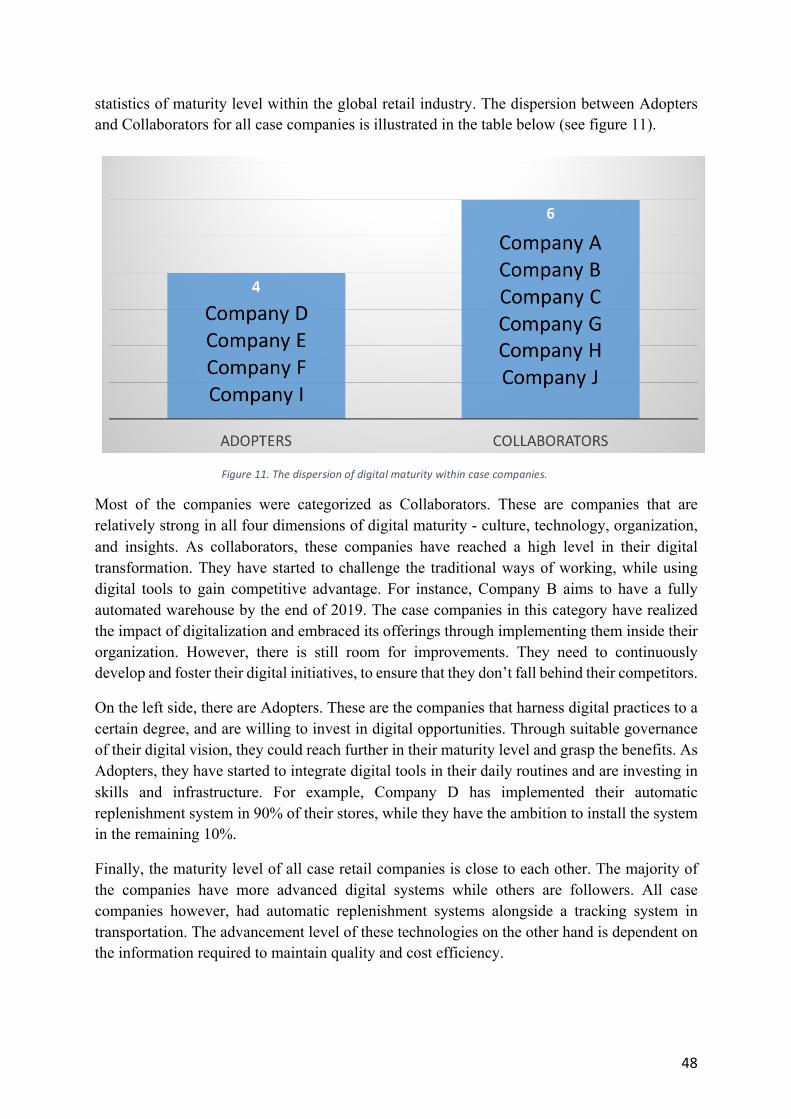
48
statistics of maturity level within the global retail industry. The dispersion between Adopters and Collaborators for all case companies is illustrated in the table below (see figure 11).
Most of the companies were categorized as Collaborators. These are companies that are relatively strong in all four dimensions of digital maturity - culture, technology, organization, and insights. As collaborators, these companies have reached a high level in their digital transformation. They have started to challenge the traditional ways of working, while using digital tools to gain competitive advantage. For instance, Company B aims to have a fully automated warehouse by the end of 2019. The case companies in this category have realized the impact of digitalization and embraced its offerings through implementing them inside their organization. However, there is still room for improvements. They need to continuously develop and foster their digital initiatives, to ensure that they don’t fall behind their competitors.
On the left side, there are Adopters. These are the companies that harness digital practices to a certain degree, and are willing to invest in digital opportunities. Through suitable governance of their digital vision, they could reach further in their maturity level and grasp the benefits. As Adopters, they have started to integrate digital tools in their daily routines and are investing in skills and infrastructure. For example, Company D has implemented their automatic replenishment system in 90% of their stores, while they have the ambition to install the system in the remaining 10%.
Finally, the maturity level of all case retail companies is close to each other. The majority of the companies have more advanced digital systems while others are followers. All case companies however, had automatic replenishment systems alongside a tracking system in transportation. The advancement level of these technologies on the other hand is dependent on the information required to maintain quality and cost efficiency.
Figure11.Thedispersionofdigitalmaturitywithincasecompanies.
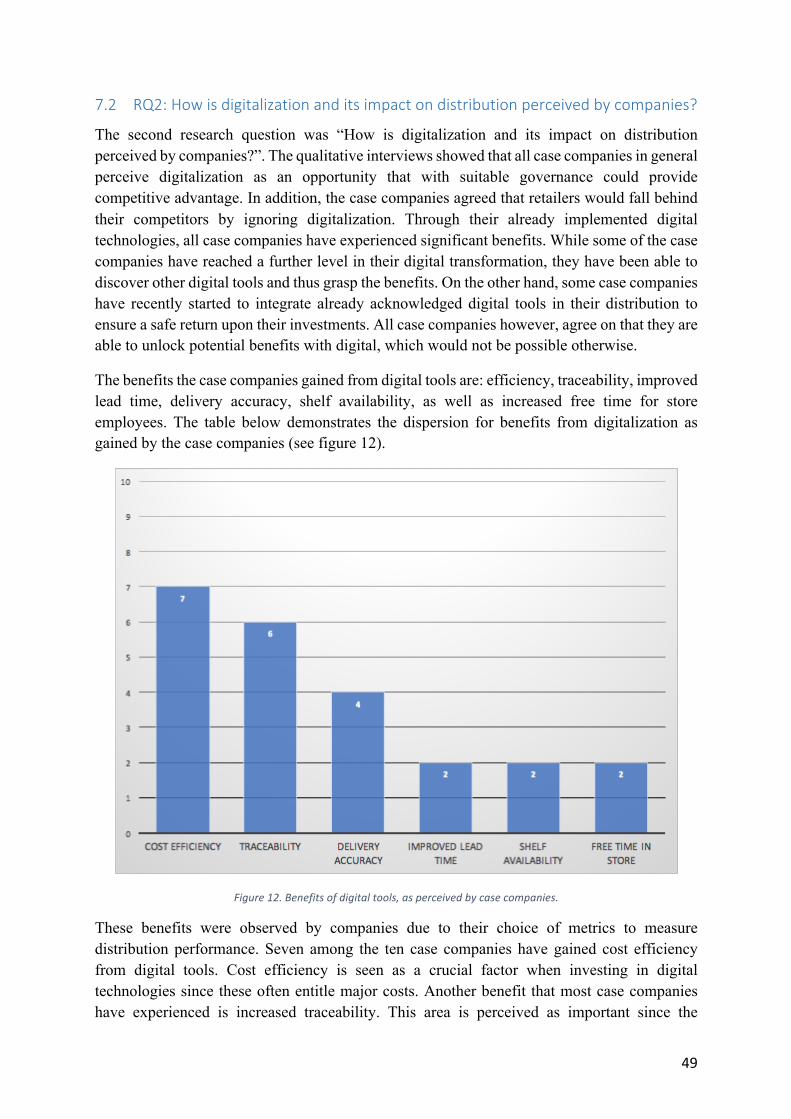
49
7.2 RQ2:Howisdigitalizationanditsimpactondistributionperceivedbycompanies?
The second research question was “How is digitalization and its impact on distribution perceived by companies?”. The qualitative interviews showed that all case companies in general perceive digitalization as an opportunity that with suitable governance could provide competitive advantage. In addition, the case companies agreed that retailers would fall behind their competitors by ignoring digitalization. Through their already implemented digital technologies, all case companies have experienced significant benefits. While some of the case companies have reached a further level in their digital transformation, they have been able to discover other digital tools and thus grasp the benefits. On the other hand, some case companies have recently started to integrate already acknowledged digital tools in their distribution to ensure a safe return upon their investments. All case companies however, agree on that they are able to unlock potential benefits with digital, which would not be possible otherwise.
The benefits the case companies gained from digital tools are: efficiency, traceability, improved lead time, delivery accuracy, shelf availability, as well as increased free time for store employees. The table below demonstrates the dispersion for benefits from digitalization as gained by the case companies (see figure 12).
Figure12.Benefitsofdigitaltools,asperceivedbycasecompanies.
These benefits were observed by companies due to their choice of metrics to measure distribution performance. Seven among the ten case companies have gained cost efficiency from digital tools. Cost efficiency is seen as a crucial factor when investing in digital technologies since these often entitle major costs. Another benefit that most case companies have experienced is increased traceability. This area is perceived as important since the
50
aforementioned companies aim to have the ability to quickly respond in case of deviations, while providing their customers with information about their products. Four companies mentioned also higher level of delivery accuracy as a benefit gained with help of digital technologies. Due to the competitive landscape of the industry, having a high level of delivery accuracy indicates that the goods will be delivered in accordance to company promises. Using digital tools, some of the companies have also improved their lead time, shelf availability, and been able to increase free time in stores.
The benefits showed in the table above are also mentioned in the literature as opportunities provided by digitalization. These findings demonstrate that with appropriate initiatives and smart investments, retail companies are able to utilize digital to scale their business into new dimensions and develop in the same pace as digitalization.
i
Bibliography
Accenture, 2014. Vision for Retail Changes in Store. Available at: https://www.accenture.com/_acnmedia/Accenture/Conversion-Assets/DotCom/Documents/Global/PDF/Dualpub_13/Accenture-Technology-Vision-for-Retail.pdf [Accessed Febrauary 15]
Atkins, S. 2008. Seminar at OUCE, Transport and Social Sustainability. Available at: http://www.tsu.ox.ac.uk/events/ht08_seminars/satkins080117.pdf [Accessed March 21]
Arvidsson, N., 2016. Quantitative Methods. KTH, ME2001 - Research Methods in Industrial Engineering and Management. Available at: https://bilda.kth.se/courseId/13935/node.do?id=25747053&ts=1473070779403&u=-1452410897 [Accessed February 24, 2017].
Blix, M. 2015. The economy and digitalization – opportunities and challenges. Svenskt Näringsliv. Available at: http://www.ifn.se/storage/ma/1c77ce47b5384acdadf960ef0c26cdeb/20032095be784cdda28aac8c6b7b25c8/pdf/6F21662B08AFB948E3D053DD9EAC209BC73A19B1/blix_digitalization_report_20151215.pdf [Accessed March 12]
Boateng, R., 2014. Qualitative Data Analysis. UGBS, Research Methods. Available at: https://vivauniversity.files.wordpress.com/2013/03/session9dataanalysis.pdf [Accessed February 27]
Blomkvist, P. & Hallin, A., 2015. Methods for engineering students First edit., Student litteratur.
Capgemini Consulting, 2011. Digital Transformation: A Roadmap for Billion-Dollar Organizations. Available at: https://www.capgemini.com/resource-file-access/resource/pdf/Digital_Transformation__A_Road-Map_for_Billion-Dollar_Organizations.pdf [Accessed March 5]
Chopra, S. & Meindl, P., 2013. Supply Chain Management; Strategy, Planning, and Operations Fifth., Pearson Education Limited.
Choy, K. L., So, S. C., Liu, J. J., Lau, H., & Kwok, S. K. 2007. Improving logistics visibility in a supply chain: an integrated approach with radio frequency identification technology. International Journal of Integrated Supply Management, 3(2), 135-155.
Cisco, 2016. A Roadmap to Digital Value in the Retail Industry. Available at: http://connectedfuturesmag.com/Research_Analysis/docs/value-at-stake-retail.pdf [Accessed Febrary 26]
Collins, E., 2014. Intersection of the Cloud and Big Data. The IEEE Computer Society. Available at: http://ieeexplore.ieee.org/document/6848687/ [Accessed April 4]
ii
Collis, J. & Hussey, R., 2014. Business Research Fourth Edi., Palgrave Macmillan Higher Education.
Delaney, R., & D’Agostino, R. 2015. The Challenges of Integrating new Technology into an Organization. La Salle University. Available at: http://digitalcommons.lasalle.edu/cgi/viewcontent.cgi?article=1024&context=mathcompcapstones [Accessed June 1, 2017]
Eisenhardt, K. 1989. Agency Theory: An Assessment and Review. The Academy of Management Review, 14(1), 57-74.
Elkington, J. 2004. Enter the triple bottom line. The triple bottom line: Does it all add up. Available at: http://www.johnelkington.com/archive/TBL-elkington-chapter.pdf [Accessed March 24]
Fisher, L., 1997. What is the right supply chain for your product? A simple framework can help you figure out the answer, The Harvard Business Review
Ford, S., & Despeisse, M. 2016. Additive manufacturing and sustainability: an exploratory study of the advantages and challenges. Journal of Cleaner Production, 137, 1573-1587.
Forrester, 2016. The Digital Maturity Model 4.0. Available at: https://forrester.nitro-digital.com/pdf/Forrester-s%20Digital%20Maturity%20Model%204.0.pdf [Accessed March 4, 2017]
Gartner, 2016. Digitalization - IT Glossary. Available at: http://www.gartner.com/it-glossary/digitalization [Accessed January 24]
Gibbert, M., Ruigrok, W., & Wicki, B. 2008. What passes as a rigorous case study?. Strategic management journal, 29(13), 1465-1474.
Giddings, B., Hopwood, B., & O'brien, G. 2002. Environment, economy and society: fitting them together into sustainable development. Sustainable development, 10(4), 187-196.
Gustafsson, N., 2013. Innovation i detaljhandeln. HUI research. Available at: http://www.hui.se/MediaBinaryLoader.axd?MediaArchive_FileID=47187cd7-018c-4518-b5d8-58f5280f8d04&FileName=Innovation+i+detaljhandeln.pdf&MediaArchive_ForceDownload=True&Time_Stamp=636295038531470594 [Accessed May 4, 2017]
Hanifan, G., Sharma, A. & Newberry, C., 2014. The Digital Supply Network; A New Paradigm for Supply Chain Management,
Hobbs, J., 2001. Developing supply chain for nutraceuticals and functional foods: opportunities and challenges. Institute of Nutraceutical and Functional Foods
Hisashi, K. 2014. How does inventory pooling work when product availability influences customers’ purchasing decisions?, International Journal of Production Research, 52:22, 6739-6759
iii
Kable Fulfillment, 2016. How to Meet Online Shoppers’ Expectations for Faster Delivery Times and Free Shipping. Available at: http://www.kablefulfillment.com/how-to-meet-online-shoppers-expectations-for-faster-delivery-times-and-free-shipping/ [Accessed April 16, 2017]
Kagermann, H. 2015. Change through digitization—Value creation in the age of Industry 4.0. In Management of permanent change (pp. 23-45). Springer Fachmedien Wiesbaden. ISO 690
Kearns, B., 2004. Technology and Change Management. Available at: http://www.comp.dit.ie/rfitzpatrick/MSc_Publications/2004_Brenda_Kearns.pdf [Accessed June 3, 2017]
Kubrick, K., 2014. Six Dimensions of Digital Maturity. Available at: https://www.onlineauthority.com/blog/six-dimensions-of-digital-maturity-introductory-review/ [Accessed March 14, 2017]
Kärkkäinen, M. 2014. Better Profitability Through Improved Store Replenishment. Available at: https://www.relexsolutions.com/better-profitability-through-improved-store-replenishment/ [Accessed April 1, 2017]
Lanzolla, G. & Anderson, J., 2008. Digital Transformation. London Business School.
Miller, S.P. 2000. What is RFID, Purdue University.
Morten, M. S., 1991. The Corporation of the 1990’s: Information Technology and organisational transformation. Sloan School of Management, Oxford University Press.
Mueller, M., Baer, T., & Weber, C. 2006. The Digital Maturity Map-Motivation For An EDM Based Validation Method. In DS 36: Proceedings DESIGN 2006, the 9th International Design Conference, Dubrovnik, Croatia.
Retail Economics, 2012. Automatic Replenishment. Available at: http://retaileconomics.com/automatic-store-replenishment/ [Accessed April 11, 2017]
Ricciardi, M., 2016. The Confessions of a Change Agent. KTH, ME2063 – Team Leadership & HRM. Available at: https://bilda.kth.se/courseId/13393/node.do?id=25207440&ts=1458201856412&u=-1452410897 [Accessed June 4, 2017].
Serdaris, P., Antoniadis, I. & Tomlekova, N., 2014. Supply Chain Management: A View of the Distribution Channel. Bulg. J. Agric. Sci., 20: 480-486
Shah, S. K., & Corley, K. G. 2006. Building better theory by bridging the quantitative–qualitative divide. Journal of management studies, 43(8), 1821-1835.
Strategy&, 2016. Industry 4.0 - How digitization makes the supply chain more e cient, agile, and customer-focused. Available at: https://www.strategyand.pwc.com/media/file/Industry4.0.pdf [Accessed February 18, 2017].
iv
Tieto, 2015. Digitaliseringens framtida implikationer för detaljhandeln. Tieto Retail Outlook. Available at: http://www.hui.se/MediaBinaryLoader.axd?MediaArchive_FileID=ccf9cf2f-243c-4283-b174-1133a18d5595&FileName=Tieto+Retail+outlook.pdf&MediaArchive_ForceDownload=True&Time_Stamp=635611521749263069 [Accessed January 11, 2017].
Tieto.com, 2016. About us. Available at: https://www.tieto.com/about-us [Accessed January 11, 2017].
Tripon, C., & Dodu, M., 2005. Change management and organizational development. Available at: http://www.apubb.ro/wp-content/uploads/2011/02/OD_Suport_de_curs_masterat.pdf [Accessed June 2, 2017]
Voss, C., Tsikriktsis, N., Frohlich, M. 2002. Case Research - Case research in operation management. London Business School 29(2), 195-219
Weinman, J., 2015. Digital Diciplines; Attaining Market Leadership Via the Cloud, Big Data, Social, Mobile, and The Internet of Things First., New Jersey: John Wiley & Sons.
Zhelyazkov, G. 2011. Agile Supply Chain: Zara's case study analysis. Design, Manufacture & Engineering Management, Strathclyde University Glasgow, Velika Britanija, 2-11.
Zhu, X., Mukhopadhyay, S. K., & Kurata, H. 2012. A review of RFID technology and its managerial applications in different industries. Journal of Engineering and Technology Management, 29(1), 152-167.
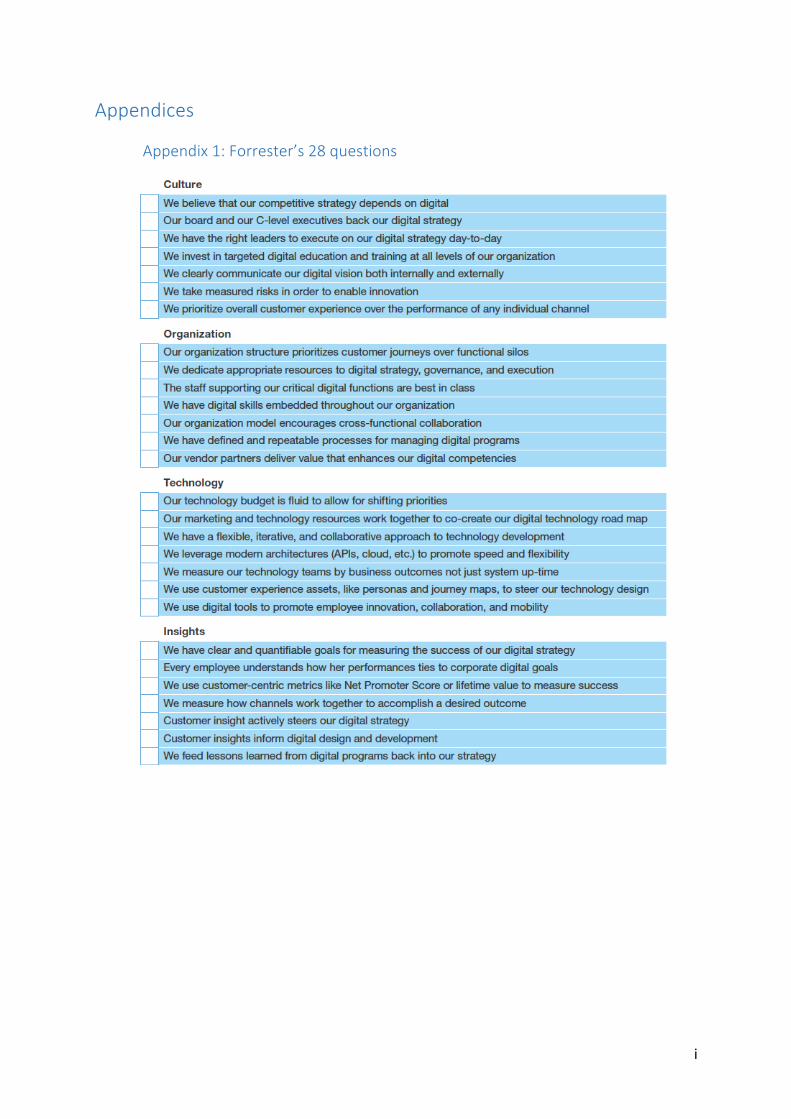
i
Appendices
Appendix1:Forrester’s28questions
ii
Appendix2:Interviewintroductionandquestions
Tack för att ni väljer att delta i denna intervju.
Vi är två studenter som läser sista året på masterprogrammet Industriell Ekonomi på KTH och under denna termin skriver vårt examensarbete. Arbetet skrivs på IT-konsultbolaget Tieto. Företaget kändes passande då Tieto ligger i framkanten gällande digitala tekniker och supply chain är ett av deras största affärsområden. Denna intervju är INTE ett säljmöte.
Examensarbetet går ut på att kartlägga företags digitala mognadsgrad i distributionsprocesser när det gäller svensk detaljhandel. Syftet med denna intervju är att öka förståelsen för digitala teknikers påverkan på distributionsprocesser. Denna intervju kommer även att användas som grund till utvärdering av er digitala mognadsgrad.
Ert deltagande är frivilligt och ni kan välja att avbryta intervjun när ni önskar. Intervjun är konfidentiell och Ert namn kommer inte att användas i någon dokumentation. Ni kommer att ha tillgång till all material om så önskas.
Är det okej för Dig att vi spelar in denna intervju?
1. Skulle du kunna beskriva din roll på företaget? Dagsläget
1. Kan du kortfattat beskriva/illustrera distributionsprocessen för ert bolag? 2. Hur många % av den totala kostnaden är era distributionskostnader? 3. Vilka delar av den processen är automatiserad? 4. Vilka digitala tekniker använder ni idag?
a. Har dessa digitala tekniker förbättrat prestanda/kostnadseffektiviteten? 5. Hur mäter ni prestandan när det gäller distributionsprocessen?
Orderläggning
1. Hur sker informationsdelning vad gäller beställning från butiker till centrallagret? 2. Hur lång är ledtiden? 3. Har ni några digitala tekniker/system som automatisk lägger en order? 4. Hur bra kan ni spåra era produkter från att dem lämnar centrallagret till butikerna? 5. Hur ofta får butikerna leverans från centrallagret? 6. Hur mycket samarbete har butikerna med centrallagret?
a. Har centrallagret tillgång till butikslager information och vice versa? Framtida planer
1. Digitalisering kan både ses som möjlighet och hot för olika företag. Vad är er syn på digitalisering?
2. Var ser du möjlighet för förbättring när det gäller digitala verktyg i dessa processer? 3. Finns det en vision/mål för hur digitala dessa processer skall vara?
a. Om ja, finns det specifika siffror för det?
iii
4. Är det någonstans i distributionsprocessen du tror har mer nytta av digitala tekniker än andra?
a. Om ja, vilka och varför? 5. Har ni något mål som era digitala investeringa ska resultera i? 6. Hur ser era investeringsplaner ut för dem kommande 5 åren?
Hur kommer ni komma dit? (Utmaningar möjligheter)
1. Vad gör Ni för att realisera dessa mål och bli mer digital? 2. Vilka utmaningar har Ni haft hittills? 3. Vad ser Ni för utmaningar i framtiden?
Questionnaire is given Wrap-up
1. Finns det något annat du skulle vilja tillägga? 2. Får vi kontakta dig för uppföljningsfrågor?
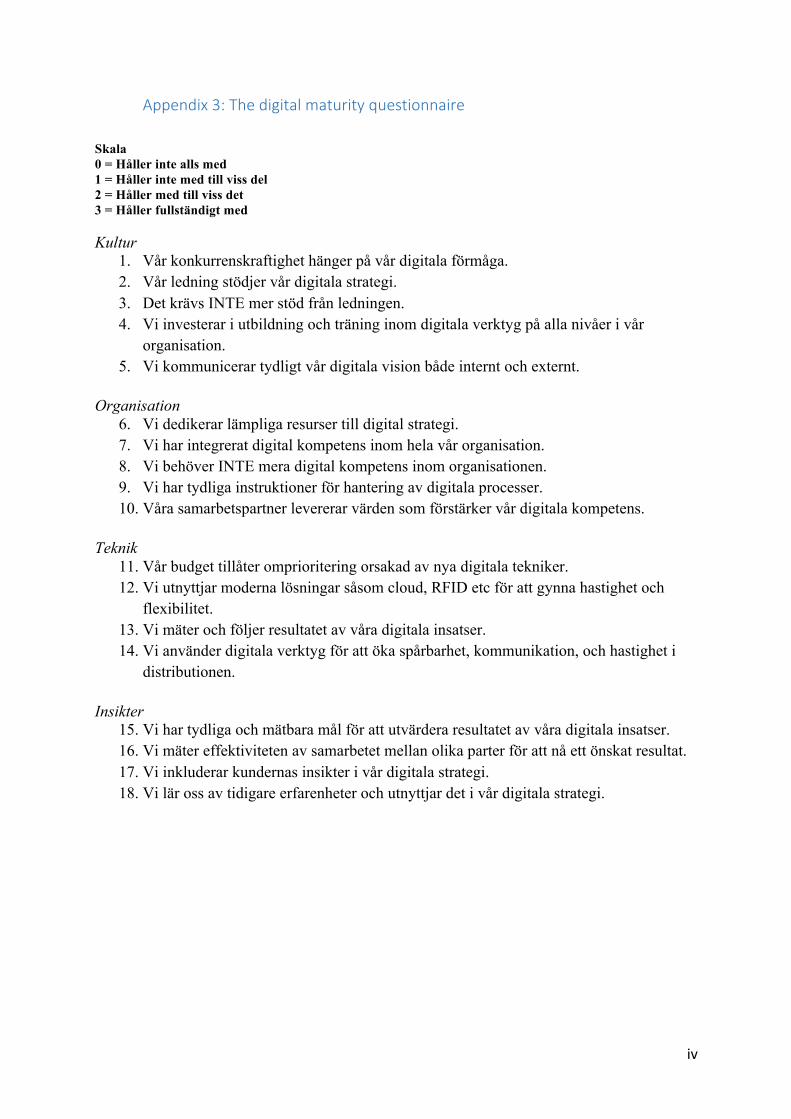
iv
Appendix3:Thedigitalmaturityquestionnaire
Skala 0 = Håller inte alls med 1 = Håller inte med till viss del 2 = Håller med till viss det 3 = Håller fullständigt med Kultur
1. Vår konkurrenskraftighet hänger på vår digitala förmåga. 2. Vår ledning stödjer vår digitala strategi. 3. Det krävs INTE mer stöd från ledningen. 4. Vi investerar i utbildning och träning inom digitala verktyg på alla nivåer i vår
organisation. 5. Vi kommunicerar tydligt vår digitala vision både internt och externt.
Organisation
6. Vi dedikerar lämpliga resurser till digital strategi. 7. Vi har integrerat digital kompetens inom hela vår organisation. 8. Vi behöver INTE mera digital kompetens inom organisationen. 9. Vi har tydliga instruktioner för hantering av digitala processer. 10. Våra samarbetspartner levererar värden som förstärker vår digitala kompetens.
Teknik
11. Vår budget tillåter omprioritering orsakad av nya digitala tekniker. 12. Vi utnyttjar moderna lösningar såsom cloud, RFID etc för att gynna hastighet och
flexibilitet. 13. Vi mäter och följer resultatet av våra digitala insatser. 14. Vi använder digitala verktyg för att öka spårbarhet, kommunikation, och hastighet i
distributionen. Insikter
15. Vi har tydliga och mätbara mål för att utvärdera resultatet av våra digitala insatser. 16. Vi mäter effektiviteten av samarbetet mellan olika parter för att nå ett önskat resultat. 17. Vi inkluderar kundernas insikter i vår digitala strategi. 18. Vi lär oss av tidigare erfarenheter och utnyttjar det i vår digitala strategi.