2016 student it survey - university of bristol · 2016 student it survey neil davey, student it...
TRANSCRIPT

1
2016 Student IT Survey Neil Davey, Student IT Experience Manager, IT Services.
3rd April 2017
1. Introduction 1.1. The Student IT Survey is an internal University of Bristol survey which is used by IT Services
to improve our understanding of student requirements and how well they are being met by
existing services and support. This is the fifth time that we have carried out this survey, the
last being in 2014. Comparisons to previous surveys help us to benchmark performance of
services and identify trends. The results are used when prioritising improvements and
developing new services. The survey also highlights the differences in requirements between
taught and research students and can be used to highlight differences between faculties and
schools.
1.2. Respondents were asked multiple choice questions about device ownership and usage,
satisfaction with University IT services and how important they felt those services are to
them, and how useful communications methods are. Two freeform questions asked what the
best thing about IT is and what one thing they would change about IT in the University.
1.3. This survey was carried out in November 2016 and promoted to students via email, the
student Newsletter, MyBristol announcements and via social media. The survey was run via
BOS (onlinesurveys.ac.uk) and was open to all students. However, BOS has a hard limit of
15,000 respondents who can be emailed with unique logins, so with almost 28,000 students
we emailed students with a link to a generic login page into which they had to enter their
email address and student number, to give a unique response. A support email address
received a small handful of contacts from confused students but generally this was
understood and people were able to complete the survey. No prize was offered to encourage
students to fill out the survey, unlike in previous surveys.
1.4. 1,510 students completed the survey, a 24% drop in responses from the 2014 survey. This
included 979 undergraduates (UG), 221 taught postgraduates (PGT) and 310 research
postgraduates (PGR). This is a slightly higher ratio of research postgraduates than are
enrolled at the University in the 2016/17 academic year. Responses were received from all
schools and departments and from all years of study. 66% of respondents originated in the
UK, 10% from the European Union and 24% from elsewhere.
2. Summary of key findings 2.1. 92% of students own a smartphone, 95% a laptop, 34% a tablet.
2.2. Uptake in tablet ownership has slowed significantly, smartphones with larger screens are
preferred. Use of smartphones in lectures has almost doubled since 2014, while tablet use
has fallen by 25%.
2.3. 89% of students use University computers, up from 70% in 2014.
2.4. Overall satisfaction with IT has increased significantly, up by 11% for undergraduates, to
81%. Up by 26% for research postgraduates, to 68%.
2.5. Student satisfaction has improved for all IT services, particularly data storage, (up by 33%,
to 95%).
2.6. Gmail scores highest, 98% of students rate it as ‘good’ or ‘excellent’.

2
2.7. The Remote Desktop scores lowest, 77% of students rate it as ‘good’ or ‘excellent’.
2.8. Taught and research students consider Gmail and Eduroam to be the most important
services.
2.9. In freeform questions, Eduroam was the most praised service with positive comments about
coverage, availability, ease of access and reliability. However, students also complained
about the same aspects - a factor of it being highly important to them.
2.10. Students praised the speed, responsiveness and approachability of IT Services, particularly
when they needed support. The IT Service Desk, Zonal teams and the Student Laptop and
Mobile Clinic were highlighted.
2.11. Many comments were also made about how easy services are to access and use, anywhere
and on any device.
2.12. The most requested change was to provide more open access computers for longer hours,
particularly in faculty-based computer rooms so that students can use course specific
software. This was particularly highlighted by taught students in Engineering and Science.
2.13. Students struggle with the lack of consistency across Blackboard courses and complained
that the site is not user-friendly.
2.14. The cost of printing was highlighted by students from across the University, though
predominantly those in Arts and Science.
2.15. The most useful sources of information about services are the IT Services website and the IT
Service Desk. However, our range of communication methods were all considered useful.
3. Student ownership of computers and mobile devices
Which of the following devices do you own and have with you in Bristol?
3.1. Most students now own a laptop and smartphone, with the latter seeing the largest increases
in ownership since 2014 (15% increase overall). Amongst all students 92% own smartphones,
whilst 95% own laptops. The 5% who don’t own laptops are spread across the University. For
instance, 55 Computer Science undergraduates responded to the survey, of which 3 do not
own laptops (5%).
3.2. Tablet ownership has increased but not by as much as expected. Ownership of tablets
amongst all students has risen from 9% in 2012 to 30% in 2014 and now 34% in 2016. There
has been no significant increase in undergraduate ownership of tablets over the last two
9% 8%
18%
12%
50%
39%
92%96%
86%
95%89% 89%
29% 30%34%
40%
29%
40%
81%
95%
69%
89%
66%
83%
0%
10%
20%
30%
40%
50%
60%
70%
80%
90%
100%
Desktop Laptop Tablet SmartphoneUG PGT PGR UG PGT PGR UG PGT PGR UG PGT PGR
2014 2016

3
years. We may be reaching the top of the curve for these devices. Resolutions of smartphone
screens have improved and they have become larger, plus they are a more portable device.
3.3. Desktop ownership amongst taught students continues to fall but for the first time since this
survey began in 2007 we are also seeing a fall in ownership by research postgraduates.
4. Device usage What do you use your personal devices for?
4.1. Respondents could choose several activities for each device that they use. We did not ask
which device is primarily used for an activity. Use of University computers was asked
separately but with the same options, so that they would not be confused with personally
owned devices. Graphs below show device usage as a percentage of the number of people
who own that type of device.
4.2. Personal desktop computers are
used for most purposes, apart from being
taken to lectures or tutorials, (though 52
people claim to do just that, including 9
undergraduates in Computer Science
alone). The percentage using them for
online collaboration, accessing course
materials and using specialist software has
increased since 2014. Otherwise usage
remains similar to the last survey.
4.3. Laptops remain the favoured device
for most tasks and usage has changed very
little since the 2014 survey. Significant
changes are that more students use
specialist course software on them, whilst
fewer use them to check timetables. There
is an increase in those taking them to
lectures or tutorials, with 48% of
undergraduates and 64% of taught
postgraduates doing so. Use by
undergraduates in lectures varies across
the University, as the graph below shows.
87%
81%
62%
78%
81%
23%85%
86%
73%
Essays,assignmentsor projects
Emails
Checkingtimetables
Accessinglibrary
resourcesAccessing
coursematerials
Taking tolectures or
tutorials
Usingspecialistsoftware
Researchingand revising
Onlinecollaboration
Desktop
95%
91%
72%
87%
92%
48%76%
96%
78%
Essays,assignmentsor projects
Emails
Checkingtimetables
Accessinglibrary
resourcesAccessing
coursematerials
Taking tolectures or
tutorials
Usingspecialistsoftware
Researchingand revising
Onlinecollaboration
Laptop

4
4.4. Laptop use in lectures and tutorials, by school
4.5. Whilst tablet ownership has
increased slightly, the percentage of owners
using them for academic purposes has
dropped considerably since 2014. Use in
lectures has fallen from 58% to 43% in two
years and students are 20% less likely to use
them to check emails or timetables. Only
use of specialist software on tablets has
increased.
4.6. Smartphones are used for the fewest
activities, though are the commonest way
to read emails and check timetables They
are also being used more for accessing
course materials (up 7%), online
collaboration (up 11%) and checking
timetables (up by 12%). 55% now take them
to lectures, compared to 30% in 2014.
82%
68%62% 61% 61% 58%
52% 48% 46%40% 39%
33% 32% 31% 31% 29% 27% 27% 26% 24% 22%
0%10%20%30%40%50%60%70%80%90%
100%
Law
Exp
Psy
cho
logy
Mo
der
n L
ang
Hu
man
itie
s
Geo
grap
hy
MV
En
gin
eeri
ng
EFIM
Art
s
Bio
logy
Po
licy
Stu
die
s
Qu
een
's E
ng
Eart
h S
cien
ces
Ph
ysic
s
Den
tal
SPA
IS
Ph
ys/P
har
m
CM
M
Ch
emis
try
Vet
Sci
ence
Bio
chem
istr
y
Mat
hem
atic
s
Per
cen
tage
use
School
20%
65%
40%
37%
51%
43%11%
46%
27%
Essays,assignments or
projects
Emails
Checkingtimetables
Accessinglibrary
resourcesAccessing
coursematerials
Taking tolectures or
tutorials
Using specialistsoftware
Researchingand revising
Onlinecollaboration
Tablet
6%
97%
86%
22%
35%
55%4%
22%
28%
Essays,assignmentsor projects
Emails
Checkingtimetables
Accessinglibrary
resourcesAccessing
coursematerials
Taking tolectures or
tutorials
Usingspecialistsoftware
Researchingand revising
Onlinecollaboration
Smartphone

5
4.7. 89% of respondents use University
computers, up from 70% in 2014. They are
used predominantly when researching and
writing assignments, revising, or using
course specific software that they cannot
access at home. Percentages for each
category are very similar to results in 2014,
only a 5% rise of use in lectures and tutorials
is significant.
4.8. With many laptops now having touchscreens and smartphones getting bigger and being easy
to carry, the market for tablets looks to have reached a peak. If the trends shown here
continue then we will see fewer tablets used on campus. Students wanting a lightweight and
portable device to give them easy online access are preferring to carry smartphones with
them. Those wanting a larger touchscreen and keyboard are using laptops, so the use of
tablets on campus will continue to fall.
5. Overall satisfaction Overall, how satisfied are you with IT at the University?
5.1. This question, first asked in the 2014 survey, enables us to benchmark the overall reputation
of IT Services with students. Five options are given (Very satisfied, Satisfied, Neutral,
Unsatisfied and Very unsatisfied), following the design of questions in the National Student
Survey. 1502 students completed this question, 8 left it blank.
5.2. The improved results are welcoming to see, particularly the 26% increase amongst research
postgraduates. There remains room for improvement in how IT is perceived as these results
are lower than results for individual IT services (as polled in the next question). For example,
Social Sciences and Law have the lowest score for undergraduates, (75%) but the same
respondents are satisfied with individual services, (92% - 3% above the average). This
suggests that student perception of IT overall doesn’t necessarily equate to experience of
services.
70%73%
42%
81%
73%68%
0%
10%
20%
30%
40%
50%
60%
70%
80%
90%
100%
UG PGT PGR2014 2016
72%
59%
42%
75%
67%
22%64%
63%
36%
Essays,assignmentsor projects
Emails
Checkingtimetables
Accessinglibrary
resourcesAccessing
coursematerials
Using inlectures or
tutorials
Usingspecialistsoftware
Researchingand revising
Onlinecollaboration
UniversityComputers

6
5.3. Across the faculties there is very little variation in satisfaction amongst undergraduates
(Science scores highest at 85%). There is larger variation within faculties. For instance, 63%
of undergraduates in Computer Science are satisfied with IT, compared to 94% in Aerospace
Engineering.
5.4. There is greater variation amongst taught postgraduates. Satisfaction fell in Arts and
Engineering, the only areas where this occurred. However, response rates were low, (only 3
Arts PGTs were unsatisfied with IT). In Engineering the dissatisfaction was mostly in Computer
Science, where 6 PGTs gave low scores. These respondents cited a lack of open access
computers as their main reason for doing so.
5.5. The result for PGTs includes a 36% increase in satisfaction for Science, (to 74%). Other
faculties scored similarly to Science, except Engineering - which scored 51% (up 29%).
6. Satisfaction with services Please rate your experiences of the following services.
6.1. Students were asked to rate IT services using the range ‘excellent’, ‘good’, ‘poor’ or ‘awful’.
The graphs show the percentage of those agreeing that a service is excellent or good. Taught
students (undergraduates and taught postgraduates) gave very similar responses to this
question and so results have been combined.
6.2. Taught students
6.3. Results from taught students show that satisfaction with services has risen on average by 7%
since 2014. The best loved service remains Gmail, with 99% of taught students rating that as
-20%
0%
20%
40%
Arts BiomedicalSciences
Engineering HealthSciences
Science SocialSciencesand Law
Changes in satisfaction, 2014 to 2016
UG PGT PGR
96%87% 86% 87% 88%
83%
62%71% 67%
90% 89%
72%
87% 86%
99%94%
89%94% 92%
85% 82%
95%
81% 80%
92% 91%
79%
92% 91% 88%
0%
10%
20%
30%
40%
50%
60%
70%
80%
90%
100%
Satisfaction with services - taught students
2014 2016Excellent/Good

7
excellent or good. Google Apps, Open Access Computers and several other services scored
over 90%. This includes data storage, where satisfaction rose by 33% to 95%. In 2014 major
problems with MyFiles just before the survey were reflected in the low score for data storage.
The wording of the question was also changed slightly, to make it clear that data storage
includes Google Drive, Microsoft OneDrive and RDSF, as well as MyFiles.
6.4. The lowest score from taught students was for IT Training but as IT Services only offer training
courses for research postgraduates then this is to be expected. The Student Remote Desktop,
Printing and Copying, and Mediasite were amongst the lowest results. Comments in freeform
questions show that students like Mediasite but want all lectures recorded. Printing and
copying is the one service where there is a significant difference in satisfaction between
undergraduates (79%), and taught postgraduates (90%).
6.5. There are only a few significant differences in undergraduate satisfaction between faculties.
The lower overall satisfaction in Engineering, and Social Sciences and Law (see previous
question), is not reflected in satisfaction with services. Students in Arts and Sciences gave
lower ratings for printing. Those in Biomedical Sciences and Health Sciences are far happier
with Mediasite.
6.6. There are more differences in taught postgraduate satisfaction, between faculties but this is
mainly due to lower sample sizes. Over half of the PGT respondents (128) were based in Social
Sciences and Law, while only 6 Biomedical Sciences PGTs completed the survey.
6.7. Research postgraduates
6.8. Results from research postgraduates all rose, with the largest improvement (41%) being with
data storage. Gmail and Google Apps scored highest again but overall the average
satisfaction with services is 5% lower than taught students gave. The lowest scores were for
the Remote Desktop service, data storage and IT Training – plus Blackboard, which is of less
relevance to research postgraduates than it is for taught students.
6.9. The average satisfaction across the 16 services is 84%, which is significantly higher than the
68% overall satisfaction given in the previous question. Engineering’s average of 82%
satisfaction with services is 31% higher than their overall satisfaction of 51%. In fact
Engineering only scored IT Training (69%) and the IT Service Desk (68%) significantly below
the results shown in the graph above. Research postgraduates in Health Sciences rated
services the highest, at an average of 92%.
94% 94%
76% 77% 77%
67%
36%
73%
62%
83%91%
70%66%
75%
96% 95%88%
84% 83%
72%
89%
77%83%
67%
86%91%
78% 81%85% 84%
0%
10%
20%
30%
40%
50%
60%
70%
80%
90%
100%
Satisfaction with services - research postgraduates
2014 2016Excellent/Good
8
6.10. Several services are less relevant to research postgraduates than for taught students. 73%
of PGRs marked Mediasite as “not applicable”, compared to only 9% of undergraduates. Also
scoring highly for “not applicable” were Open Access Computers (39%) and Find a Computer
(70%), as many PGRs in STEM subjects have offices with computers. 69% of all students
thought that the Laptop Clinic was not applicable but it is a service which is only needed
when a computer has a fault, so this is not unexpected.
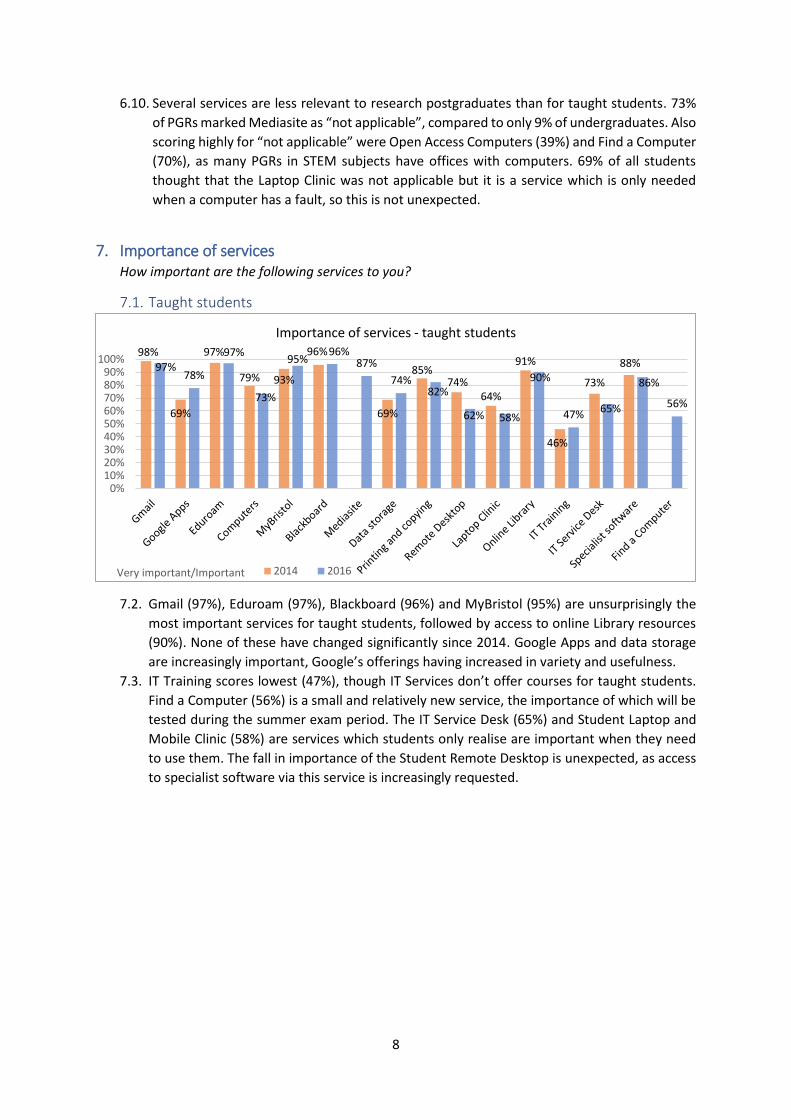
7. Importance of services How important are the following services to you?
7.1. Taught students
7.2. Gmail (97%), Eduroam (97%), Blackboard (96%) and MyBristol (95%) are unsurprisingly the
most important services for taught students, followed by access to online Library resources
(90%). None of these have changed significantly since 2014. Google Apps and data storage
are increasingly important, Google’s offerings having increased in variety and usefulness.
7.3. IT Training scores lowest (47%), though IT Services don’t offer courses for taught students.
Find a Computer (56%) is a small and relatively new service, the importance of which will be
tested during the summer exam period. The IT Service Desk (65%) and Student Laptop and
Mobile Clinic (58%) are services which students only realise are important when they need
to use them. The fall in importance of the Student Remote Desktop is unexpected, as access
to specialist software via this service is increasingly requested.
98%
69%
97%
79% 93%
96%
69%
85%74%
64%
91%
46%
73%
88%97%78%
97%
73%
95%96%
87%
74%82%
62% 58%
90%
47% 65%
86%
56%
0%10%20%30%40%50%60%70%80%90%
100%
Importance of services - taught students
2014 2016Very important/Important
9
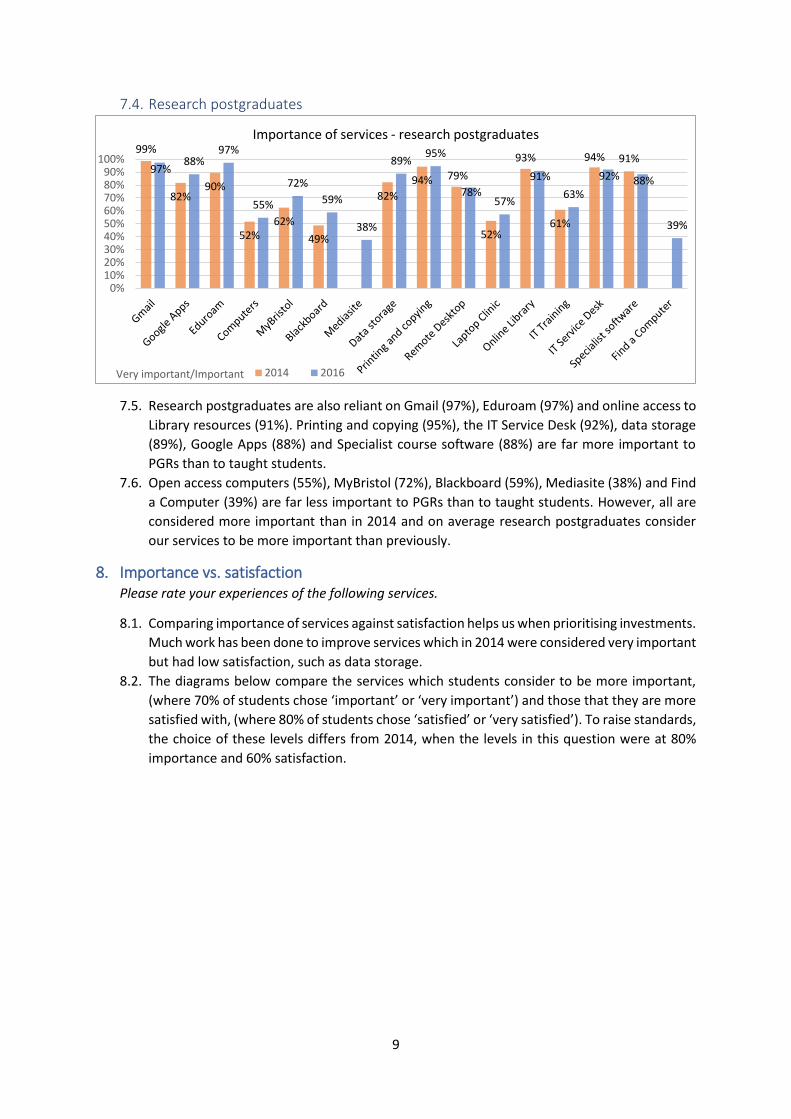
7.4. Research postgraduates
7.5. Research postgraduates are also reliant on Gmail (97%), Eduroam (97%) and online access to
Library resources (91%). Printing and copying (95%), the IT Service Desk (92%), data storage
(89%), Google Apps (88%) and Specialist course software (88%) are far more important to
PGRs than to taught students.
7.6. Open access computers (55%), MyBristol (72%), Blackboard (59%), Mediasite (38%) and Find
a Computer (39%) are far less important to PGRs than to taught students. However, all are
considered more important than in 2014 and on average research postgraduates consider
our services to be more important than previously.
8. Importance vs. satisfaction Please rate your experiences of the following services.
8.1. Comparing importance of services against satisfaction helps us when prioritising investments.
Much work has been done to improve services which in 2014 were considered very important
but had low satisfaction, such as data storage.
8.2. The diagrams below compare the services which students consider to be more important,
(where 70% of students chose ‘important’ or ‘very important’) and those that they are more
satisfied with, (where 80% of students chose ‘satisfied’ or ‘very satisfied’). To raise standards,
the choice of these levels differs from 2014, when the levels in this question were at 80%
importance and 60% satisfaction.
99%
82%90%
52%62%
49%
82%
94% 79%
52%
93%
61%
94% 91%97%
88%97%
55%
72%
59%
38%
89%95%
78%57%
91%
63%
92% 88%
39%
0%10%20%30%40%50%60%70%80%90%
100%
Importance of services - research postgraduates
2014 2016Very important/Important
10
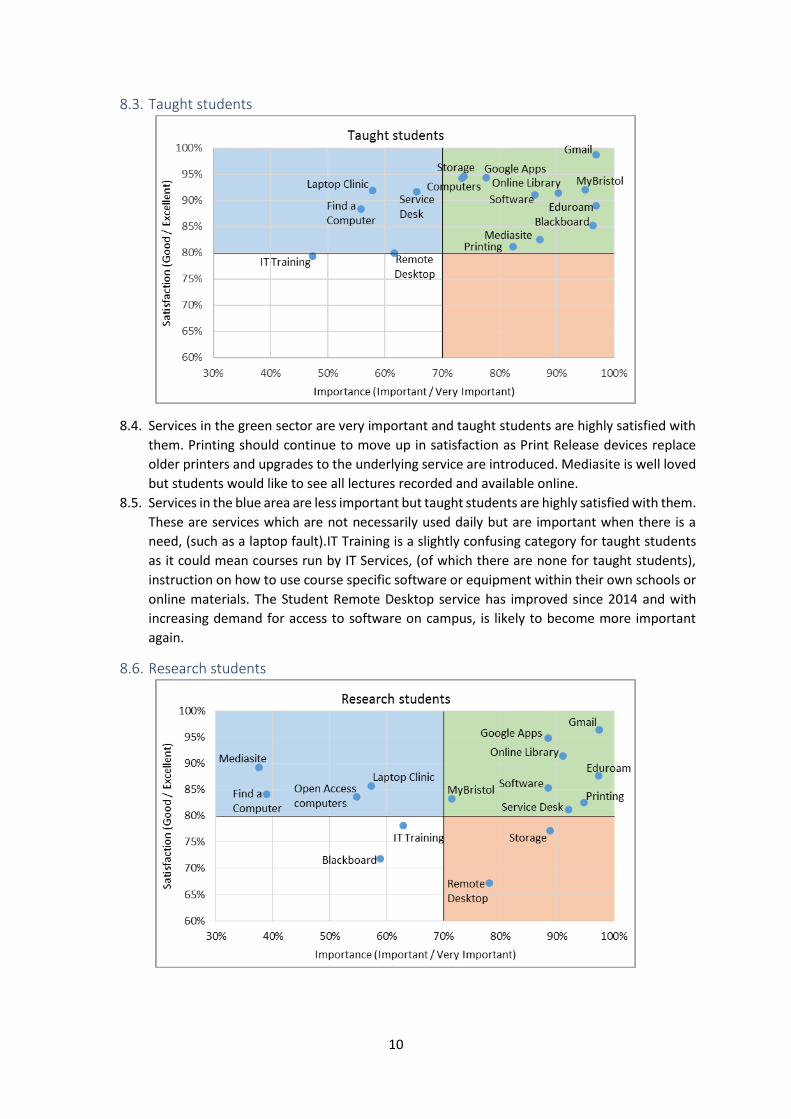
8.3. Taught students
8.4. Services in the green sector are very important and taught students are highly satisfied with
them. Printing should continue to move up in satisfaction as Print Release devices replace
older printers and upgrades to the underlying service are introduced. Mediasite is well loved
but students would like to see all lectures recorded and available online.
8.5. Services in the blue area are less important but taught students are highly satisfied with them.
These are services which are not necessarily used daily but are important when there is a
need, (such as a laptop fault).IT Training is a slightly confusing category for taught students
as it could mean courses run by IT Services, (of which there are none for taught students),
instruction on how to use course specific software or equipment within their own schools or
online materials. The Student Remote Desktop service has improved since 2014 and with
increasing demand for access to software on campus, is likely to become more important
again.
8.6. Research students

11
8.7. Services which research postgraduates consider to be very important and satisfactory are
shown in the green sector. A 15% improvement in satisfaction takes the Service Desk into
this section, after work across IT Services to improve processes and information for PGRs.
8.8. Less important services which are considered satisfactory are shown in the blue area. These
are services used more by taught students, though PGRs in some schools do rely on open
access computers.
8.9. Data storage and the Remote Desktop service fall into the red section, being services that
research students consider particularly important but which aren’t performing as well.
Satisfaction with data storage services has improved by 41% since 2014 but more work is
required to ensure that PGRs have easy and intuitive access to large data workspaces and
storage. We need to improve the Remote Desktop service over the next two years.
8.10. Blackboard and IT Training are less important to research postgraduates, so come in the
white section. IT Services do run a handful of courses for PGRs and we are looking at how
best to provide training materials in the future.
9. Communications How useful are the following sources of information about IT services?
9.1. We use several methods to publicise services to students, though all information can be
found on the IT Services website at www.bristol.ac.uk/it-services. The handbook, the
Student Guide to IT services, was given to new students until 2016/17. It has been replaced
by a pocket leaflet with the same title. Information about services has only been publicised
in the Student Newsletter and on digital signage since 2014. This is the first time that we
have asked about the effectiveness of posters.
9.2. Students from all levels of study consider all methods of communication far more useful than
in 2014. In this timespan, a concerted effort has been made to plan communications and
ensure that the right information is sent out to the right people at the right time.
9.3. The IT Services website and IT Service Desk remain the favoured methods for finding
information about services. These, and courses, are the only communication methods which
research postgraduates rate higher than taught students do. Social media are considered
the least useful.
0% 20% 40% 60% 80% 100%
Handbook
Leaflet
Website
Service Desk
Course
MyBristolannouncements
Posters
Digital Signage
Student Newsletter
2014
UG PGT PGR
0% 20% 40% 60% 80% 100%
Handbook
Leaflet
Website
Service Desk
Course
MyBristolannouncements
Posters
Digital Signage
Student Newsletter
2016
UG PGT PGR

12
10. What is the best thing about IT at the University?
10.1. Just under two-thirds of respondents (959), made comments in this freeform text field.
Responses were varied and focused either on specific services, on overall performance of
services or on support from IT Services staff. The responses have all been read and
categorised. Eduroam received the most comments, followed by support from IT Services
and accessibility of services and support. These three made up over half of all responses to
this question. The following list shows the factors most mentioned about these categories.
Eduroam - Comments praised the excellent coverage, that it is available across campus,
halls and NHS academies. It is easy to access and use. Free, fast and reliable.
IT Support - Support is fast, responsive and very efficient. Staff are approachable,
friendly and helpful – particularly the IT Service Desk. Zonal team staff are highly
knowledgeable. Information about services is good and communications, especially
updates during maintenance work, are appreciated. The Laptop Clinic was highlighted
by many students for its excellent service.
Accessibility - Students commented on how easy it is to access and use IT services,
anywhere and on different devices.
Computers - Computers are easy to find, plentiful and fast.
Availability - Good availability of computers, wifi, software, services, information and a
wide range of resources.
Software - Good access to specialist software and free software for home use, including
Microsoft Office.
Blackboard - Blackboard received a lot of comments for being the best thing about IT
but nothing specific was otherwise mentioned.
Reliability - Services “just work” and are fast.
Students also praised the Remote Desktop, printing, MyBristol, online Library resources,
Mediasite and Google services.
13
11. If you could change one thing about IT at the University, what would it be?
11.1. A similar number (961), of students responded to this freeform text question, which elicited
a wide range of comments. These have all been reviewed and categorised, and some have
been responded to separately to the survey. Issues with computers, Eduroam and
Blackboard were the ones that received most comments, totalling about a third of all
responses. The list below shows the issues most raised in the responses.
Computers - Taught students want more open access computers, better access to
course specific software and longer opening hours in faculty-based computer rooms.
Requests for more computers came from across the University but with significantly
more from Engineering and Science, who also want better access to specialist software.
Research postgraduates also want more computers and for machines to start faster.
They want Admin Rights (Elevated User Rights), as they don’t want to wait for support.
Eduroam - Respondents complained about the strength and reliability of the wifi signal,
difficulties with setting it up and issues they experienced with their personal devices.
The speed of connection in evenings was mentioned and students would like Eduroam
to be available in all student accommodation.
Blackboard - Students struggle with the lack of consistency across courses and
complained that it is not user friendly. There has been too much downtime recently and
it doesn’t integrate cleanly with MyBristol.
Accessibility – Respondents want better access to specialist software, more computers
and better access to the Remote Desktop, all of which can be linked to software needs.
Printing - The cost of printing was highlighted by students across the University, though
predominantly from those in Arts and Science. Students also want to know how to print
from personal devices and have better instructions next to printers.
Software - Respondents want better or increased access to specialist software when on
campus or at home. Engineers particularly requested this.
Availability - Some respondents said that they were unaware of some of the services
mentioned in the survey. Complaints were also made about downtime of services.
Remote Desktop – Unreliable, crashes or slow connections. Need specialist software.
MyBristol - Complaints about crashes and ease of use. Requests that MyBristol should
automatically login when using open access computers.
Mediasite - All lectures should be recorded. Videos of lectures, including chalkboards.
Faster uploads than 48 hours. The ability to vary playback speed or fast forward.

14
12. Action Plan
# Requirement Action Person Responsible
Due date
1 Improve reliability of connection to Remote Desktop services
Ensure that session brokering works, so sessions recover after connections drop
Simon Speight
Sept 2017
2 Increased numbers of open access desktop PCs, with course specific software, in Engineering and Science computer labs
Raise issue with faculty management
Neil Davey June 2017
3 Increased access to course specific software
Ensure that key software is appropriately available to students; on open access computers, remote desktop or licensed for home use.
Pete Walker
Sept 2018
4 Reasonable and fair printing costs
Implement processes related to the Transparent Costs Policy, as agreed with the Academic Registry
Neil Davey Sept 2017
5 Improved reliability of printing service
Uniflow upgrade programme Sandra Stone
Sept 2017
6 Increased availability of Print Release
Zones to replace HP printers in study spaces with Canon MFDs
Neil Davey Sept 2018
7 Improve data storage for research postgraduates
Understand requirements for working space and archiving space further, before developing solutions
Neil Davey Sept 2017
8 Improve awareness of data storage provision for research postgraduates
Zonal team leaders to publicise appropriate storage solutions to PGRs
Pete Walker
June 2017
9 Improve reliability of Blackboard
Move Blackboard to external host
Hilary Griffiths
July 2017
10 Improve consistency of Blackboard courses
Updated course template for new courses. Created online good practice rubric. Research project with students recommending how to improve consistency.
Hilary Griffiths
Completed Completed Sept 2018
11 More lectures recorded. Chalkboards recorded
Extend use of Mediasite to all large group teaching spaces
Hilary Griffiths
Sept 2017
12 Improve perception of IT Services
More positive communications about student IT (before NSS opens)
Neil Davey and James Brimble
Jan 2018
13 Improved awareness of the range of IT services
Continue regular communications to students, publicising services
Neil Davey and James Brimble
Dec 2017