2016 summer fellowship report r
TRANSCRIPT

2016 HOFSTRA SEAS SUMMER FELLOWSHIP
REPORT
Megan MurphyDr.GhorayebJuly 22nd, 2016
SUMMARYThis summer, I worked as a lab assistant in the Ultrasound Research Lab with Dr. Ghorayeb for
eight weeks. The goal of my position was to be introduced to the instrumentation and techniques used
in the Ultrasound Research Lab. This position involved the following tasks:
1) Learn how to use the instruments in the Lab
2) Learn Matlab (Mathworks, R2015b, Natick, MA.)
3) Analyze fetal cardiac scans
4) Perform literature reviews of previously performed research experiments
5) Assist in Senior Design Experiments
6) Develop a protocol for a new osteoporosis experiment
I have learned how to use the scanning acoustic microscope (SAM) systems, the biomechanical
testing system, and their associated acquisition programs. My work also involved assisting other
bioengineering students working on their Senior Design component. Before using the instruments
myself, I read about the physics of ultrasound in order to understand how the SAM systems function.
Another aspect of my fellowship included the use of Matlab to analyze fetal cardiac scans
provided by the Center of Maternal Fetal Medicine at Northwell Health Hospital.
Moreover, numerous literature reviews were part of this research fellowship. For instance, I
read and reported on previous research works such as:
1) Frequency Specific Ultrasound Attenuation is Sensitive to Trabecular Bone Structure1 by Dr. Lin
2) Ultrasonic Evaluation of Bone Quality in Cadaver Ilia2 by Dr. Ghorayeb
3) Microarchitecture, the Key to Bone Quality3 by Dr. Brandi
4) Mechanical Properties of a Single Cancellous Bone Trabeculae Taken from Bovine
Femur4 by Dr. Enoki
5) Contact Stress Distribution on the Femoral Head of the Emu5 by Dr. Troy
In addition, I wrote a new protocol regarding the osteoporosis project in preparation for future
Senior Design endeavors.
1
ULTRASOUNDThe first day in the lab, Dr. Ghorayeb taught me how to use the Sonix SAM system and software.
I took several practice scans of a piece of plexiglass containing four machine-drilled holes. I learned how
to adjust the resolution, the dimensions, and location of the transducer for the scans. It is very
important to take the scan at the focal length, which is the point where the lens is most focused and
receives the clearest return signals. Focal length is transducer specific. Another important guideline is to
be very careful with the scan window in which the data is collected (Figure 3). Depending on the size of
the window, the program may be collecting too little of the scan and missing data, or it may be
collecting too much of the scan and skewing the results.
After the practice scans, I read and took detailed notes on a packet about the terminology and
physics behind the system. Learning the terminology was very helpful because it made it easier for me
to communicate with the other students in the lab when performing ultrasound scans of bone samples.
Also, knowing about the science made it easier for me to decide what type of transducer to use in the
protocol I wrote at the end of the summer.
While working with students on their Senior Design component, I used both low-frequency and
high frequency ultrasonic SAM systems in the lab (Figure 1 and Figure 2). The systems are very similar
and relatively easy to use. Both the OKOS and SONIX machines are very delicate and are connected to
computers each set up with OKOS acquisition software which displays the A-scan wave forms, scan
specifications, transducer height adjustment arrows, and the results after the scan.
2
Figure 1: Low Frequency Ultrasonic Scanning Acoustic Microscope system.
A)
B) C)
MATLAB
I spent the first week reacquainting myself with Matlab. When analyzing medical scans, medical
ultrasonic images are analyzed using a Matlab program developed by Dr. Ghorayeb. The program
performs texture analysis and determines the homogeneity level over a specific area of the scan. Dr.
Ghorayeb wanted me to be able to understand the function and purpose of each line of the code so I
would be able to design a similar code for future experiments if necessary. I went through the file and
figured out what resulted from each line of the code.
I spent many hours trying to adjust the program to automatically input the data found in Matlab
into an excel spreadsheet. The way the file works is when the file is run, a window pops up which asks
3
Figure 2: High Frequency Ultrasonic Scanning Acoustic Microscope system.
Figure 3: Output of ODIS acquisition system. A) Wave during the A-scan. B) Arrows used to adjust the position of the transducer on the machine before the scan. C) Measurements used to adjust the size, area, and resolution of the scan.

the user to choose a picture to analyze. After a picture is selected, a separate window with the chosen
picture opens. By clicking two points on the picture, the user creates a region of interest (ROI) for the
program to collect data from. Then, the program calculates the level of homogeneity in the ROI and
displays the maximum, minimum, and average homogeneity of the region.
Currently, when data is found, the data for the average is automatically put in the computer’s
clipboard (Figure 4) and that data can be inserted into a separate excel file by pasting. This is a
convenient feature when only the average is required: however, it is sometimes helpful to look at all
data values collected. I wanted to adjust the code so the maximum, minimum, and average data would
be automatically saved in respective columns in a specific excel file. I also wanted the program to be
able to shift down a row when a new picture is chosen so the new data would be input in its own row. I
could not find a code that would keep the program from continuously writing the newest data collected
into the same row, erasing the previously collected data.
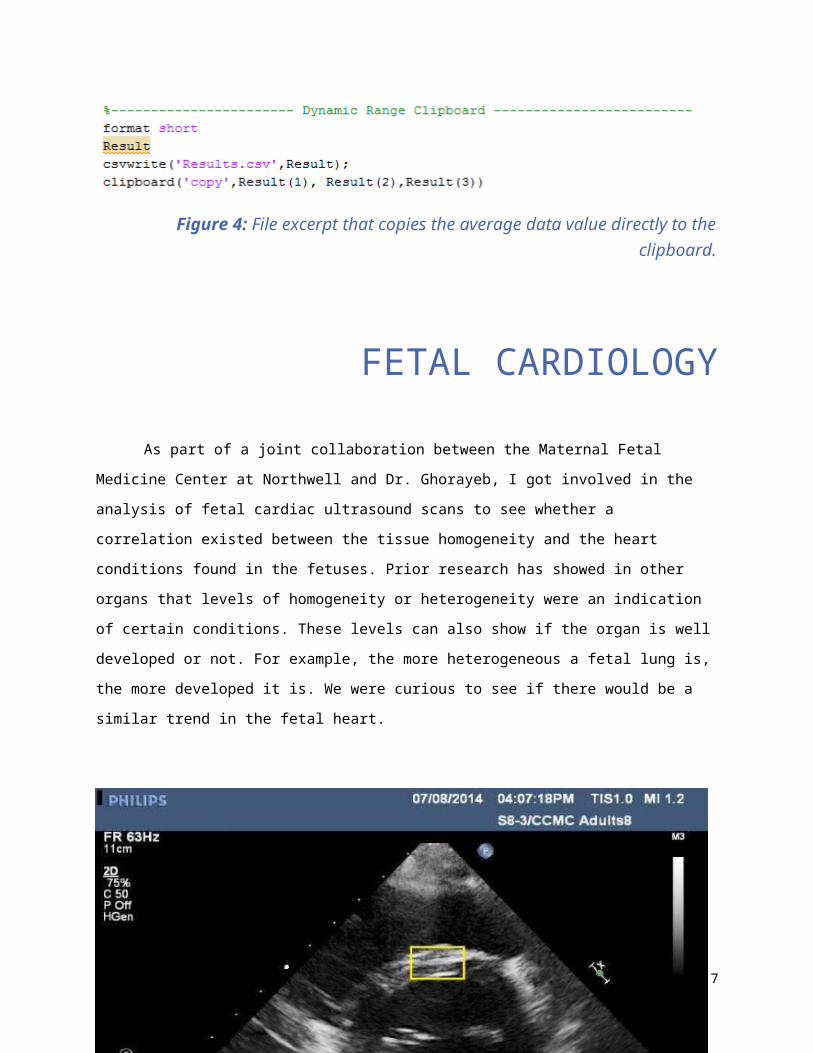
Figure 4: File excerpt that copies the average data value directly to the clipboard.
FETAL CARDIOLOGYAs part of a joint collaboration between the Maternal Fetal Medicine Center at Northwell and
Dr. Ghorayeb, I got involved in the analysis of fetal cardiac ultrasound scans to see whether a correlation
existed between the tissue homogeneity and the heart conditions found in the fetuses. Prior research
has showed in other organs that levels of homogeneity or heterogeneity were an indication of certain
conditions. These levels can also show if the organ is well developed or not. For example, the more
4

heterogeneous a fetal lung is, the more developed it is. We were curious to see if there would be a
similar trend in the fetal heart.
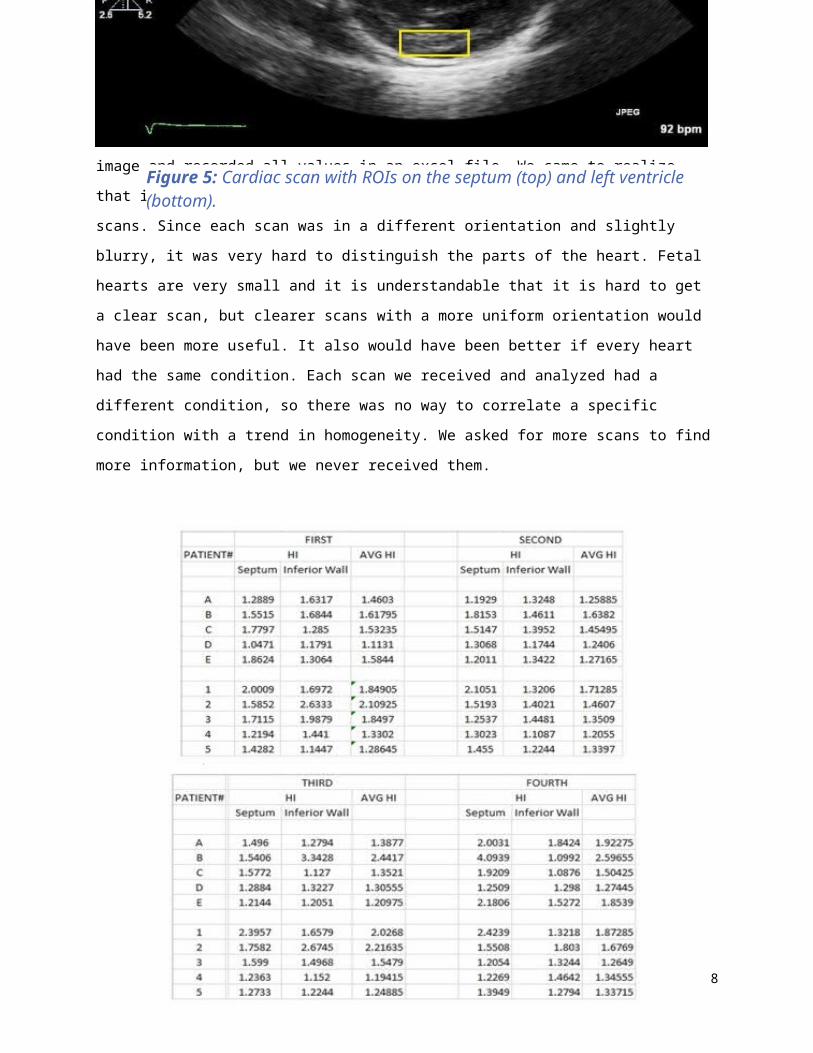
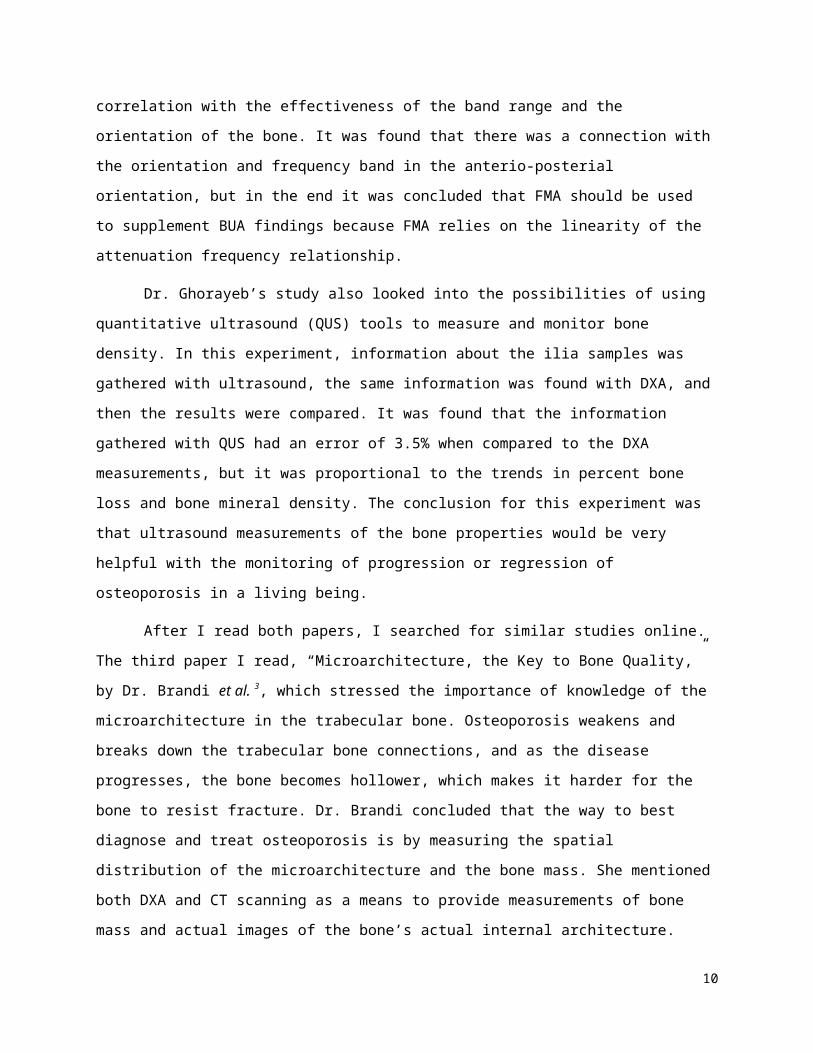
When running through the scans, I took separate homogeneity readings for the septum and the
lower left ventricular wall in each image and recorded all values in an excel file. We came to realize that
it was difficult to choose a good ROI to use to analyze the scans. Since each scan was in a different
orientation and slightly blurry, it was very hard to distinguish the parts of the heart. Fetal hearts are very
small and it is understandable that it is hard to get a clear scan, but clearer scans with a more uniform
orientation would have been more useful. It also would have been better if every heart had the same
condition. Each scan we received and analyzed had a different condition, so there was no way to
5
Figure 5: Cardiac scan with ROIs on the septum (top) and left ventricle (bottom).

correlate a specific condition with a trend in homogeneity. We asked for more scans to find more
information, but we never received them.
LITERATURE REVIEWDuring my fellowship I was given two research papers about the effects of osteoporosis in
trabecular bone. The first research paper I received was by Dr. Lin et al.1, titled “Frequency Specific
Ultrasound Attenuation is Sensitive to Trabecular Bone Structure,” and the second paper was by Dr.
Ghorayeb et al. 2, titled “Ultrasonic Evaluation of Bone Quality in Cadaver Ilia.”
Currently, the most popular way to measure bone properties is dual energy x-ray
absorptiometry (DXA), but DXA uses ionizing radiation and there are limitations on how much
6
Figure 6: Data found after scans analyzed with Matlab.
information the x-ray scan can reveal. Another system that measures bone properties is broadband
ultrasound attenuation (BUA), which is noninvasive, but it is not very sensitive because it can only work
in a frequency range between 300 and 700 kHz. Dr. Lin’s study investigated the possibility of using
another form of ultrasound called frequency modulated ultrasound attenuation (FMA) to evaluate
trabecular structural properties. FMA can function in a much wider range than BUA, so for this
experiment four different frequency bands in the range between 300 KHz and 1.9 MHz. Dr. Lin used
through transmission for the ultrasonic scans, and he was searching to see if there was a correlation
with the effectiveness of the band range and the orientation of the bone. It was found that there was a
connection with the orientation and frequency band in the anterio-posterial orientation, but in the end
it was concluded that FMA should be used to supplement BUA findings because FMA relies on the
linearity of the attenuation frequency relationship.
Dr. Ghorayeb’s study also looked into the possibilities of using quantitative ultrasound (QUS)
tools to measure and monitor bone density. In this experiment, information about the ilia samples was
gathered with ultrasound, the same information was found with DXA, and then the results were
compared. It was found that the information gathered with QUS had an error of 3.5% when compared
to the DXA measurements, but it was proportional to the trends in percent bone loss and bone mineral
density. The conclusion for this experiment was that ultrasound measurements of the bone properties
would be very helpful with the monitoring of progression or regression of osteoporosis in a living being.
After I read both papers, I searched for similar studies online. The third paper I read,
“Microarchitecture, the Key to Bone Quality,” by Dr. Brandi et al. 3, which stressed the importance of
knowledge of the microarchitecture in the trabecular bone. Osteoporosis weakens and breaks down the
trabecular bone connections, and as the disease progresses, the bone becomes hollower, which makes
it harder for the bone to resist fracture. Dr. Brandi concluded that the way to best diagnose and treat
osteoporosis is by measuring the spatial distribution of the microarchitecture and the bone mass. She
mentioned both DXA and CT scanning as a means to provide measurements of bone mass and actual
images of the bone’s actual internal architecture.
Another paper I read that focused on microarchitecture was “Mechanical Properties of a Single
Cancellous Bone Trabeculae Taken from Bovine Femur,” by Dr.Enoki et al. 4, which focused on both
cancellous and trabecular bone and elasticity in different anatomical orientations. Cancellous and
trabecular samples were obtained from the bovine femur, and all tests were performed in each
anatomical orientation. Compression tests were performed on the cancellous bone samples and three
7
point bending tests were performed on the trabecular samples. The tests lead to the conclusions that
trabecular bone structure has influence over the mechanical properties of cancellous bone, and that
orientation affects the elasticity in both types of bone.
Finally, I read a paper slightly outside of what I spent the summer researching called, “Contact
Stress Distribution on the Femoral Head of the Emu,” by Dr. Troy et al. 5 which focused on the loading at
the hip and the femoral head of the emu. The study was testing emu femurs to see if the emu was a
viable candidate for simulations of osteonecrosis in human hips. The data found that the emu would in
fact be ideal for such simulations.
SENIOR DESIGN ASSISTANCEAs mentioned previously, part of this fellowship was to be involved with assisting a student
working on the biomedical engineering Senior Design component. The aim of the project was to study
levels of osteoporosis induced in bovine femoral head samples. The study followed the protocol
described by Lin et al. 5. Seven trabecular bone samples were cut out of a bovine femur head with the
dimensions of 1 cm X 1cm X .5cm. The bone marrow was cleaned off the samples with a high pressure
washer, and the samples were then wrapped in gauze soaked in X10 phosphate buffer saline.
Seven samples were required because each sample was an example of a different degree of
osteoporosis, which was simulated by timed exposure to acid. Two samples served as controls, and five
8

samples were exposed to 1.8% formic acid at 20 minute time intervals (20 min., 40 min., 60 min., 80
min., 100 min.).
After two days of being immersed in a buffer saline solution, we demineralized the samples
were then demineralized by placing them in five beakers that were filled halfway with 1.8% formic acid
and placed on a shaker. The shaker was set to 120 rotations per minute. Each beaker was labeled to
show how long each sample was exposed to the acid. After the first twenty minutes passed, we took the
20 min. sample off the shaker, removed the sample from the beaker, and placed it in ammonia for thirty
minutes to stop the demineralization process. Every twenty minutes after that, we repeated the same
steps for the 40 min., 60 min., 80 min., and 100 min., samples. After the demineralization process was
finished for all samples, we placed the trabecular bones in new beakers filled with water and put them
in the fridge.
The following day we performed ultrasound scans of each sample with a 75 MHz transducer
using the OKOS SAM system. After we took the scans of each sample, we sent the scan pictures to Dr.
Ghorayeb. Once received, the scans were analyzed with Matlab to find the porosity in each sample. The
data was close to what we expected: however, we believe the data was being skewed bysome of the
cortical bone that was not removed in the 80 min. and 100 min. samples because both samples should
have been much more porous than what the analysis showed.
The next day, we found the wet and dry mass of each sample. The following week, we
performed mechanical testing on the samples with an Instron biomechanical testing machine. After
adjusting the settings of the machine, a sample was placed on a metal plate. Force was then applied to
each sample until the bone broke, which allowed us to find the Young’s Modulus for each sample.
PROTOCOL DEVELOPMENTAfter assisting with the Senior Design, I was asked to write a more detailed and specific protocol
of a similar experiment with a larger sample size based on Dr. Lin’s and Dr. Ghorayeb’s papers. While
working on the Senior Design, I noticed a few problems that could have altered the end results.
One issue dealt with cortical bone that was left on some of the samples. Cortical bone is much
stronger than trabecular bone and it would not be as affected by the demineralization treatment as the
trabecular bone. Since the cortical layer was still strong during the ultrasound and mechanical tests, the
results were skewed. If there was no cortical on the samples, the samples would have appeared more
porous on the ultrasound scans, and the samples might have broken faster during mechanical testing.
9
Also the presence of cortical bone did not allow ultrasound waves to fully propagate into the trabecular
layer, thereby giving rise to a more homogeneous reading of the sample.
Additionally, the acid did not uniformly demineralize all sides of the samples because of the way
they were sitting in the beakers during the demineralization process shaking. Some of the samples were
lying flat against the bottom or the side of the beaker, which protected a side from the acid. The
protected side was then stronger and less porous than the rest of the sample, which skewed the
porosity results and the mechanical testing.
Finally, when immersing the bones in X10 phosphate buffer solution, the gauze was squeezed to
remove any excess solution before wrapping the bone. This caused the samples to dry out which made
the samples not well-prepared for the rest of the experiment.
When writing out the protocol for the new osteoporosis experiment, I was very specific and
detailed about how every step is to be done to make sure that the results would not be skewed. In this
new protocol, I decided that there are to be seven trabecular samples from five separate bovine femur
heads to increase the sample size and get more information out of the experiment as a whole. It is
expected that the samples from different bones will all react similarly, but there may be some slight
variation. I specified that pre-demineralization scans will be taken of every sample in a specific
orientation. This will give us an idea of how porous the samples are before the demineralization tests.
After we perform the demineralization, we will be able to find the exact percentage of porosity and the
difference between the initial sample and sample after treatment. The orientation the scan is taken in is
also important. If post-demineralization scans are taken with the same orientation as the pre-scans, we
will hopefully be able to see the same “landmarks” within the scans as the brightness of the scans
decreases with increased time in acid.
10

After I finished writing the protocol, Dr. Ghorayeb contacted Dr. Lin at Stony Brook to see if he
would like to work with us on this experiment. Stony Brook lab has different lab equipment than
Hofstra, which would allow us to find more information from the experiment. If they used their diamond
cutter to cut out the trabecular samples from the femur heads, they would be able to be remove all
unwanted cortical bone. The diamond cutter would also expose the samples to less heat then a regular
band saw. Stony Brook also has a through transmission ultrasound machine that would allow us to find
the Young’s Modulus by finding the velocity at which the ultrasound signal passes through the samples
in each anatomical orientation. A collaboration could lead to a more accurate and informational
experiment, which has the potential to be very important and influential.
CONCLUSIONS
The Summer Research Fellowship
Program allowed me to learn many things that
I need to know to be able to contribute to the work
11
Figure 7: Outlined steps of the Experiment Protocol described in this section.

done in the Ultrasound Research Lab, and I am eager to conduct research and work on future
experiments including my Senior Design. I really appreciated the opportunity to work with Dr. Ghorayeb,
and I believe that this summer position was educational and successful, and that it will lead towards
more important research in the near future.
REFERENCES
12

1 Lin W., Serra-Hsu F., Cheng J., and Qin Y.-X., "Frequency specific ultrasound Attenuation is sensitive to
Trabecular bone structure," Ultrasound in Medicine & Biology, vol. 38, no. 12, pp. 2198–2207, Dec. 2012.
2
Ghorayeb S. R., Rooney D. M., "Ultrasonic evaluation of bone quality in cadaver Ilia," Annals of Biomedical
Engineering, vol. 41, no. 5, pp. 939–951, Jan. 2013.
3 Brandi M. L., "Microarchitecture, the key to bone quality," Rheumatology, vol. 48, no. suppl 4, pp. iv3–iv8,
Sep. 2009.
4
Enoki S., Sato M., Tanaka K., Katayama T., "Mechanical Properties of a Single Cancellous Bone Trabeculae
Taken from Bovine Femur," International Journal of Modern Physics: Conference Series, vol. 06, pp. 349–
354, Jan. 2012.
5
Troy K. L., Brown T. D., Conzemius M. G., "Contact stress distributions on the femoral head of the emu
(Dromaius novaehollandiae)," Journal of Biomechanics, vol. 42, no. 15, pp. 2495–2500, Nov. 2009.