2017 annual review of social housing - beever and struthers · 2017 annual review of social housing...
TRANSCRIPT
2017 Annual Review of Social Housing
2017 Annual Review of Social Housing

2017 Annual Review of Social Housing
Contents
Executive Summary ........................................................................................................................................................... 1
Value for money ................................................................................................................................................................. 4
Governance ...................................................................................................................................................................... 11
Risk and regulation .......................................................................................................................................................... 16
Property sales .................................................................................................................................................................. 20
Rent arrears ..................................................................................................................................................................... 21
Capital commitments ........................................................................................................................................................ 23
Non-regulated activities reporting ..................................................................................................................................... 25
Bonds, borrowing and derivatives .................................................................................................................................... 27
FRS 102 - Housing properties .......................................................................................................................................... 29
FRS 102 - Errors and other adjustments .......................................................................................................................... 32
FRS 102 - Pensions ......................................................................................................................................................... 35
FRS 102 - Financial Instruments ...................................................................................................................................... 37
Glossary .......................................................................................................................................................................... 40

2017 Annual Review of Social Housing PAGE 1
Executive Summary
Introduction Welcome to the latest Beever and Struthers’ review of social housing. We discuss the accounts and annual reports of the largest 100 Registered Providers (RPs) (Top 100) published in the 2015/16 reporting season. We also discuss a number of topical issues including taking a look at FRS 102 implementation. The headlines from each section are highlighted below: Value for money (VfM) The Accounting Direction for Private Registered Providers of Social Housing in England 2015 requires RPs to make a statement regarding VfM in their Board report or Strategic Report. We note that whilst VfM reporting is still of variable quality, VfM benchmarking is now common practice and more RPs now provide a return on assets and plans of how to deal with underperforming assets. Analysis of cost per unit data is clearly going to be high on the agenda for the sector for the coming years and Boards need to develop an understanding of where they sit in relation to their peers. Governance We have reviewed the composition of Boards once again and look at how payments to Board Members and governance have been reported. Of particular interest we note that the number of Top 100 RPs which pay non-executive board members increased from 79% in 2015 to 89% in 2016 whilst total remuneration paid to non-executive board members increased to £8.6m in 2016 from £7.6m in 2015. The NHF Code of Governance states that “Boards should have at least five members and no more than 12, including any co-optees and any executive board members.” As last year, 95% of RPs had between five and 12 Board Members. Risk and regulation The handling of risk continues to be a hot topic for the Homes and Communities Agency (HCA). Risks detailed in the Board reports within the Top 100 have significantly changed this year although welfare reform remains the most commonly identified risk with 73 of the Top 100 raising it as a risk. Brexit is a new entry in the top ten with 39 raising it as a risk and both Government policies and Regulation are raised by significantly more RPs this year. The HCA has issued 19 regulatory downgrade judgements in 2015/16 and, outside of the Top 100, failure to submit financial statements within six months was the most common reason for a regulatory notice. Property sales Total property sales by the Top 100 have increased significantly this year, amounting to £855m compared to £585m in 2015. As you would probably expect, seven of the top ten highest total surpluses from sales in the year recorded by the Top 100 were from London and South East England. We note that only four of the Top 100 made a deficit on their first-tranche sales in the year. Rent arrears Gross arrears across the Top 100 have increased in the year by 2.4%, from £694m to £711m. This is interesting, suggesting that the feared impact of welfare reform and universal credit have not fully yet materialised. In addition, the aggregate bad debt provision has fallen by 2.1%, from £325m to £318m. Capital commitments
Our review shows that capital commitments increased by 4.9% in 2015/16 compared to 7.4% in 2014/15. Once again there are large discrepancies between the levels of authorised but not contracted commitments, mirroring the differences of disclosure of units in development. As expected the larger South-East based RPs have the largest capital commitments reflecting their shared ownership and outright sales programmes.
2017 Annual Review of Social Housing PAGE 2
Executive Summary
Non-regulated activities reporting Non-regulated activities reporting remains an area of increasing focus for the HCA as the sector continues to diversify into a range of new commercial ventures and relationships, through unregulated subsidiaries, joint ventures and special purpose vehicles. Of particular interest we note that non-social housing activities contribute 13.9% of total turnover (£2.2bn) and building for sale income of £1,291m contributes 58.3% of non-social housing turnover. This increasing diversity into non-regulated activities results in regulatory concerns around the importance of not putting social housing assets at risk; and protecting the public value in those assets. Bonds, borrowings and derivatives Reported facilities for the sector have increased to £80bn, of which 18% was undrawn. The maturity profile of existing debt means that refinancing risk is low, 86% of debt being due for repayment in more than five years. The use of long term fixes, through bonds, fixed rate bank debt or interest rate swaps continues to provide the sector with a degree of certainty on forecasting the costs of borrowing. Bond issues and private placements contributed only 34% of total new finance raised, the lowest percentage of new facilities from capital market funding since 2011, primarily due to uncertainty in the sector and the need to reassess business plans following the rent cut in the July 2015 budget. FRS 102 - Housing properties The introduction of FRS 102, supported by the 2014 Housing SORP and the 2015 Accounting Direction was the biggest change to the accounting regime in a long time. Our review looks at how the Top 100 have dealt with these changes. With regards to housing properties we note that only three of the Top 100 account for housing properties at valuation, compared to 11 in 2015. In addition, the transition exemption allowing a valuation of an item of property, plant and equipment to be used as deemed cost was popular, with 25 RPs applying this. It is also interesting to note that impairment remains an important issue in the sector. FRS 102 - Errors and other adjustments FRS 102 requires that if an entity becomes aware of errors made under its previous accounting framework, the transition reconciliation note shall distinguish the correction of those errors from changes in accounting policy. Our review identified 16 RPs within the Top 100 that reported prior period adjustments in 2015/16 other than FRS 102 adjustments. FRS 102 - Pensions New requirements under FRS 102 in relation to accounting for the Social Housing Pension Scheme (SHPS) past service deficit arrangements have added significant liabilities to the balance sheets of the Top 100, amounting to £685m at 31 March 2016. Our review identified 76 of the Top 100 RPs which reported servicing a SHPS past service deficit as at 31 March 2016. In addition we note that within the Top 100, 25 RPs had a past service deficit in place greater than £10m recognised in the Statement of Financial Position. FRS 102 - Financial instruments The application of FRS 102 added an additional £2.436bn of financial liabilities to the balance sheets of the Top 100 as at 31 March 2015. 53 RPs reported complex financial instruments in the 31 March 2016 financial statements, 45 of which held derivatives and eight of which held other non-basic loans.

2017 Annual Review of Social Housing PAGE 3
Executive Summary
Key: Throughout the document we have used the following symbols to draw attention to matters of
particular interest:
= example of individual best practice.
= example of generic bad practice/failure to meet regulations.
= something to note or watch out for.
2017 Annual Review of Social Housing PAGE 4
Value for Money
Key points:
Value for Money (VfM) reporting is still of variable quality.
VfM benchmarking is now common practice.
More RPs now provide a return on assets and plans of how to deal with underperforming assets.
Introduction The Accounting Direction for Social Housing in England 2015 requires RPs to make a statement regarding VfM in their board report or Strategic Report. This is set out in paragraph 8. It provides no guidance, however, as to the form of this statement. The HCA issued a new Economic Standard with effect from 1 April 2012 which covers governance and viability, rent and VfM. RPs’ boards are required to demonstrate to stakeholders that they meet the standards. They are required to produce, on an annual basis, a robust self-assessment which sets out in a way that is transparent and accessible to stakeholders how they achieve VfM. The Accounting Direction states: ‘The private registered provider of social housing (PRP) should undertake and publish within its narrative report an assessment of the performance of the PRP for the year which sets out to stakeholders how it is achieving value for money in delivering its purpose and objectives, in accordance with the regulator’s standard on value for money.’
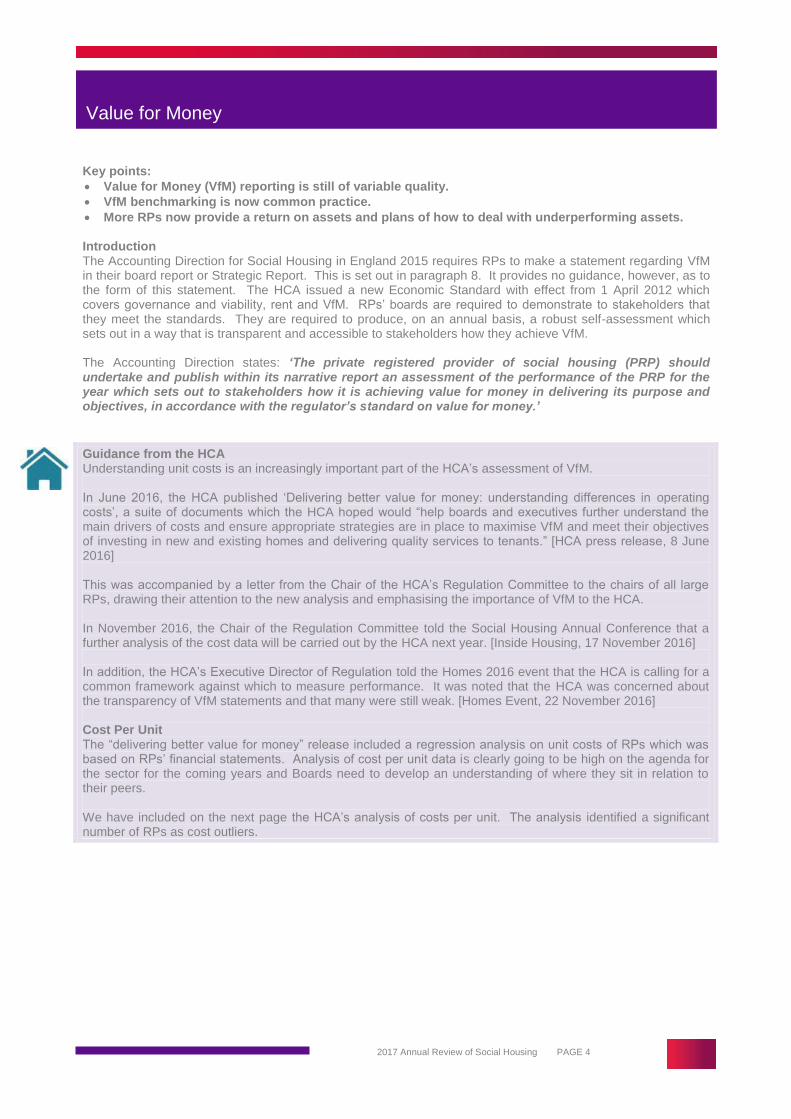
Guidance from the HCA Understanding unit costs is an increasingly important part of the HCA’s assessment of VfM. In June 2016, the HCA published ‘Delivering better value for money: understanding differences in operating costs’, a suite of documents which the HCA hoped would “help boards and executives further understand the main drivers of costs and ensure appropriate strategies are in place to maximise VfM and meet their objectives of investing in new and existing homes and delivering quality services to tenants.” [HCA press release, 8 June 2016] This was accompanied by a letter from the Chair of the HCA’s Regulation Committee to the chairs of all large RPs, drawing their attention to the new analysis and emphasising the importance of VfM to the HCA. In November 2016, the Chair of the Regulation Committee told the Social Housing Annual Conference that a further analysis of the cost data will be carried out by the HCA next year. [Inside Housing, 17 November 2016] In addition, the HCA’s Executive Director of Regulation told the Homes 2016 event that the HCA is calling for a common framework against which to measure performance. It was noted that the HCA was concerned about the transparency of VfM statements and that many were still weak. [Homes Event, 22 November 2016] Cost Per Unit The “delivering better value for money” release included a regression analysis on unit costs of RPs which was based on RPs’ financial statements. Analysis of cost per unit data is clearly going to be high on the agenda for the sector for the coming years and Boards need to develop an understanding of where they sit in relation to their peers. We have included on the next page the HCA’s analysis of costs per unit. The analysis identified a significant number of RPs as cost outliers.

2017 Annual Review of Social Housing PAGE 5
Value for Money
Introduction (continued)
The HCA did try to reflect on RPs’ possible explanations for these cost variations based on regional wage profile, stock transfer age, supported housing and housing for older people. Our view, and that of our partner i4H, which specialises in providing peer performance data, is that RPs will ultimately have to decide what cost measures and other data to use to assess their VfM. However, the HCA will want to understand how an RP can explain its unit costs, so RPs need to be prepared to be challenged if the evidence base or link between cost performance and strategy is or appears to be weak. The HCA is due to consult in the coming months on the VfM standard and this will no doubt result in cost per unit analysis being the focus of VfM reporting. This may well result in increased scrutiny of reporting of management costs in the financial statements and possible challenges for both RPs and auditors.
VfM statements Some RPs do provide a very detailed self-assessment of VfM across both operations and assets within the year. However, a number of very large RPs continue to provide descriptions of the process without analysis of their achievements. Our expectation is that in order to provide good disclosures to stakeholders, as required by the law, that RPs should at least cover the following main headings: • A definition of what value for money means to them. • Paragraph on how the value for money strategy is set and measured. • Goals and targets set in the previous years with a self-assessment of performance against them. • A peer comparison of their unit costs with a statement of efficiency objectives. • A review of the return on assets together with action plans for any remedial actions that need to be taken. • Goals for the next year. Some RPs provide a very short analysis with a reference to their website where there is a detailed technical VfM statement. Whilst this will provide a great deal of comprehensive data, we do not believe the ordinary stakeholder reading the accounts will get a good understanding of VfM under purely this approach.

2017 Annual Review of Social Housing PAGE 6
Value for Money
54
91
42
29
13
42
28
23
0 20 40 60 80 100
Mgmt Costs per Unit
Cost Savings
Margin
Surplus
Turnover
2015
2016
VfM statements (continued)
The number of RPs providing Performance Indicator (PI) information is set out below: The non-financial PIs reported on are shown in the graph below:
This year there has been a concentration on analysing rent arrears and new homes. Significant unit cost numbers such as repairs barely get a majority of the Top 100 RPs discussing this matter in the VfM statement. The financial PIs reported on are shown in the graph below:
97
88
48
80
61
36
0 20 40 60 80 100
PI Info
Comparison of PIs
Return on Assets/Invs
2015
2016
65
63
56
57
64
69
58
0 20 40 60 80
New Homes
Satisfaction
Repair Cost
Re-let Times
Rent Arrears
2015
2016

2017 Annual Review of Social Housing PAGE 7
Value for Money
VfM statements (continued) There has been an emphasis this year on cost savings as per the HCA letter to RPs in June 2016 and this has received greater prominence in the VfM statement. Benchmarking: Where RPs have produced information on their costs, many have benchmarked against the HCA Global Accounts. The Guinness Partnership goes further in providing an analysis together with detailed disclosure of target savings that have been met during the year.

2017 Annual Review of Social Housing PAGE 8
Value for Money
Benchmarking (continued) A2Dominion again gives a comprehensive analysis of its unit costs and goes on to discuss the savings that it has made and provides a trend over the past four years. In addition, it comments on its unit costs in relation to the G15.
Return on assets More RPs this year have provided a return on assets with greater details. Also, some are noting where returns are negative and, in some cases, providing explanations or action plans on how they intend to deal with this. Of those RPs that did discuss return on assets there was a wide range of results. RPs reported return on assets ranging from 2% to 11% with most in the 3-4% bracket whereas last year the majority were in the 4-5% bracket.
1 - 2% 2 -3% 3 - 4% 4 - 5% 5 - 6% 6 - 7% 7 - 8% 8 - 9% 9 - 10% 10 - 11% 11 - 12%
2016 1 7 9 7 5 2 6 2 2 0 1
2015 0 3 3 13 1 8 4 3 1 0 0
0
2
4
6
8
10
12
14

2017 Annual Review of Social Housing PAGE 9
Value for Money
Return on assets (continued) The graph below shows that almost half of the Top 100 RPs do not state a return on assets in their VfM report. 22% do state a return and give further analysis, usually broken down by tenure type, with some breaking the data down by size/age of property, or by location.
It is surprising given the emphasis that the HCA has placed on asset utilisation nearly half of the Top 100 RPs still do not provide any analysis with regards to their assets and performance. The majority are making at least some comment about the overall return on assets with a number of RPs providing a detailed analysis by asset type. Some RPs, as noted above, provide a detailed analysis by asset type of the Net Present Value (NPV). In following the NPV route, a variety of discount factors have been used. Again, London & Quadrant continues to provide a particularly detailed comprehensive analysis of its asset base giving the reader a great deal of information on the quality of those assets by type.
49
29
22
0
10
20
30
40
50
60
No Analysis Statement of return on assets Further analysis

2017 Annual Review of Social Housing PAGE 10
Value for Money
Conclusion The RPs that are committed to quality financial reporting do ensure that the information in their VfM statement complies with legal requirements and in many cases go much further in giving the reader of the accounts an insight into both their drive for efficiency by detailing their unit costs, and providing comprehensive analysis of the return that they achieve on their investments. The number of RPs with large and varied property portfolios who fail to provide any information on the return generated by those assets continues to surprise.

2017 Annual Review of Social Housing PAGE 11
Governance
Key Points:
The percentage of Top 100 RPs which pay non-executive board members increased from 79% in 2014/15 to 89% in 2015/16.
Total remuneration paid to non-executive board members increased from £7.6m in 2014/15 to £8.6m in 2015/16.
Board composition The National Housing Federation’s (NHF’s) Code of Governance 2015 states each organisation is to decide on its best Board composition, and requires “Board members who are executive staff must be in a minority”. We found that to be the case for all RPs within the Top 100. However, there were 13 RPs for whom 20% or more of the members were executive staff. The NHF Code of Governance also states the following in terms of Board size “Boards should have at least five members and no more than 12, including any co-optees and any executive board members.” There has been little movement in the year in terms of Board size:
95% of RPs had between five and 12 Board Members (95% in 2015).
The average number of Board Members as at the date of the Board Report is 10 Board Members (ten in 2015).
59% of RPs had between 10 and 12 Board Members (60% in 2015). The largest Board consisted of 14 members, whilst the smallest consisted of six. Five RPs had more than 12 Board Members at the date of the Board Report, two of which use the UK Corporate Governance Code, which does not specify a recommended Board size. Of the three remaining RPs that use the NHF Code of Governance, one, New Charter Housing Trust, acknowledges the difference in Board members in place with the Code of Governance recommendations and includes a statement in the Directors’ Report regarding this:
“The Group Board constitution allows for 11 Board Members plus three co-optee positions. As reported in 2014/15 the Board is satisfied that there is justification for non-compliance as co-opted positions are used by the Board to aid succession planning but also to ensure the Board has the appropriate skills to control the Group’s diversified areas of business and effectively manage risk.”
The other RPs, Plymouth Community Homes and Futures Housing Group Limited, do not include an explanation within their Directors’ Report.
Code of governance Whilst the majority (83%) of RPs use the NHF Code of Governance 2015, there are 17 RPs that use a different code of governance:
8 use the UK Corporate Governance Code (the UK Code).
8 use the NHF Code, but have not specified which date.
1 uses the NHF Excellence in Governance (2010).

2017 Annual Review of Social Housing PAGE 12
Governance
Code of Governance
NHF Excellence inGovernance (2015)
UK CorporateGovernance Code
NHF (no date)
NHF Excellence inGovernance (2010)
Code of governance (continued)
The UK Code is the governance benchmark for corporate entities. Whilst not specifically designed for RPs, it sets standards of good practice in relation to board leadership and effectiveness, remuneration, accountability and relations with shareholders. It is also less specific in relation to Board size than the NHF Code of Governance 2015: “The board should be of sufficient size that the requirements of the business can be met and that changes to the board’s composition and that of its committees can be managed without undue disruption, and should not be so large as to be unwieldy. The board should include an appropriate combination of executive and non-executive directors (and, in particular, independent non-executive directors) such that no individual or small group of individuals can dominate the board’s decision taking.” All of the eight RPs that use this code of governance had adopted it prior to 2015/16 and seven of the eight RPs have at least 10% of their Board made up of Executive Directors. Three RPs gave specific reasons as to why they have adopted the code:
Anchor Trust
In 2010 Anchor’s Board adopted the UK Code and each year is required to undertake a self-assessment of its compliance with the UK Code. Anchor chose to adopt the UK Code because its requirements set high standards in relation to Board leadership and effectiveness, and because of the breadth of services which Anchor operates across the housing and care sectors. Bromford Housing Group Limited The UK Code reflects our commercial outlook, focus on achieving the highest possible standards of accountability and transparency and our desire to position ourselves alongside other high-achieving organisations, regardless of sector. Aster Group Limited The Code contains broad principles and specific provisions which set out standards of good practice in relation to leadership and effectiveness

2017 Annual Review of Social Housing PAGE 13
Governance
Compliance with the Governance and Financial Viability Standard (The Standard) The HCA’s Governance and Financial Viability Standard introduced a number of formal requirements for RPs, including the requirement to maintain a register of assets and liabilities and the requirement to undertake robust stress testing of the business plan. The Standard requires that all RPs assess compliance with the Standard at least once a year and to certify in their annual accounts their compliance. All RPs with March year ends in the Top 100 included a statement in their accounts in relation to the Governance and Financial Viability Standard. Our review identified one RP that disclosed that they did not comply fully with the Governance and Financial Viability Standard because they received a governance rating of “G3”. Symphony Housing Group Limited recognised that they have had internal control difficulties and reported these concerns to the HCA. This was disclosed in their financial statements:
Symphony Housing Group Limited We have, however, encountered some operational difficulties. In particular, it has become evident that our approach to health and safety compliance and internal control needed to be radically revised. We reported our concerns to our regulator.
Transparency of HCA regulatory judgements The Housing SORP requires that narrative reports in the financial statements are fair, balanced and understandable. We would expect, therefore, that mention would be made of critical HCA governance or viability ratings. Our review identified that RPs have taken varying approaches to reporting regulatory judgements of either G2 or V2. We noted six RPs in the Top 100 received either a “G2” or “V2” rating in the year. The following two examples were seen where the RP had commented specifically on the grading and action taken:
Magna Housing Group Limited G2 V1 (Feb 2016) Our regulator carried out an in-depth assessment of Magna during the year. As a result, Magna retained its ‘V1’ rating for financial viability but was downgraded to a ‘G2’ rating from its previous ‘G1’ for governance. Both ‘V1’ and ‘G2’ ratings signify compliance with the Regulatory Framework. We are dealing with the points raised by the Regulator which led to the ‘G2’ and expect to complete this work in 2016/17. To the best of its knowledge, the Board considers that it complies with the Governance and Financial Viability Standard of the Regulatory Framework and the provisions concerning rents of the 2016 Welfare Reform and Work Act.
Plus Dane G2 V2 (16/12/2015) Over the last twelve months we have worked to further strengthen the organisation following the governance downgrade in 2013. Whilst we were placed on the grading’s under review list by the HCA for our viability in May, it was testament to the hard work and commitment of the team that we not only maintained our viability rating of V2 in the September Regulatory Judgement but were also upgraded to G2 for governance.
One of the six simply commented that a V2 rating had been received:
Plymouth Community Homes G1 V2 (17/3/2016) The Homes and Communities Agency (HCA), as our Regulator, has assessed compliance with its Governance and Viability Standard. This is expressed as grading G1 to G4 for governance and V1 to V4 for viability. The latest regulatory judgement for the Association, following a stability check, was published on 17 March 2016 and states:
G1: “the Provider meets the requirements on governance set out in the Governance and Financial Viability
standard”.
This judgement is unchanged from the previous rating of January 2013.

2017 Annual Review of Social Housing PAGE 14
Governance
Transparency of HCA regulatory judgements (continued)
V2: “The provider meets the requirements on viability set out in the Governance and Financial Viability standard but needs to manage material financial exposures to support continued compliance”. This judgement is also unchanged from the previous review (Financial Viability assessment March 2015). After consideration of reports by the Executive and other third party reports the Board certifies that to the best of its knowledge the Association complies with the HCA Governance and Financial Viability Standards in all material respects.
The remaining three RPs that received either a G2 or V2 did not comment on the grading at all, only that they were compliant with the HCA’s Governance and Financial Viability Standard. These were:
Metropolitan Housing Group - V2
Shoreline Housing Partnership - V2
East Thames Group Limited - V2 Pay The percentage of RPs within the Top 100 paying non-executive board members increased from 79% in 2015 to 89% in 2016. Of those who have started paying non-executive board members in 2015/16, only one RP’s total non-executive emoluments was above £100k (Symphony £112k). Only one RP within the Top 10 largest RPs, Together Housing Group Limited, continues not to remunerate non-executive board members. The total remuneration paid to non-executive board members increased to £8.6m in 2016 from £7.6m in 2015, representing a 13% increase. Places for People Group Limited pay non-executive Directors the most (£348,000). The board is comprised of the Group Chairman, seven non-executive directors and six executive directors. Radian Group Limited pay non-executive Directors the least (£16,000). The board is currently comprised of the Group Chairman, six non-executive directors and one executive director. The average total non-executive emoluments was £96k. Of the 89 RPs that pay non-executive board members, 73 use the “NHF Excellence in Governance 2015” as their code of governance. The remainder use the NHF Excellence in Governance 2010, the UK Corporate Governance Code and the NHF Code, without declaring which year. The 2015 Code requires that payment to non-executive board members must be fully disclosed on a named basis in the organisation’s annual financial statements. We identified 16 of the 73 users of the Code that did not fully disclose on a named basis as required. We understand that the HCA has contacted a number of the RPs failing to make this disclosure, and we would expect non-compliance in this area to be much lower next year.

2017 Annual Review of Social Housing PAGE 15
Governance
Board Approval All RPs are required to submit signed financial statements to the HCA within six months of the year end. All but one of the Top 100 have a 31 March reporting period, so accounts are required to be filed by 30 September for these entities. From a review of the Board approval dates, we note the following:
Only four RPs signed off in June this year, compared to five last year.
September was the most popular month for approval, moving from July in the previous year.
Four RPs did not report their audit sign off date within the financial statements. There is a clear move towards later sign off this year, no doubt caused by complications arising from implementation of FRS 102.
0% 10% 20% 30% 40% 50% 60%
June
July
August
September
No Date
2015
2016
2017 Annual Review of Social Housing PAGE 16
Risk and regulation
Key points: • Risks detailed in the Board reports within the Top 100 have significantly changed. • Welfare reform remains the most commonly identified risk with 73% raising it as a risk. • The HCA has issued six regulatory downgrade judgements in 2015/16 to the Top 100 and 19 to the
sector as a whole. • Outside of the Top 100, failure to submit financial statements within six months was the most
common reason for a regulatory notice. Risk analysis The top three risks identified in 2015/16 by the Top 100 are:
Welfare reform was identified by 73 RPs compared to 65 last year. In both 2014/15 and 2015/16 welfare reform was the most identified risk.
Government policy: the number of the Top 100 raising this as a risk has increased significantly. Our review identified that 37 of the Top 100 included this risk in 2014/15, increasing to 51 in 2015/16. This is unsurprising given the Government’s Welfare Reform program, including the July 2015 announcement of the four-year 1% rent reduction. The timing of this announcement meant that it was not included in the Top 100’s 2014/15 financial statements as much as might have been expected.
Regulation was identified as a key risk by 27 of the Top 100 last year, increasing to 47 this year, reflecting the HCA’s increased scrutiny of the Sector.
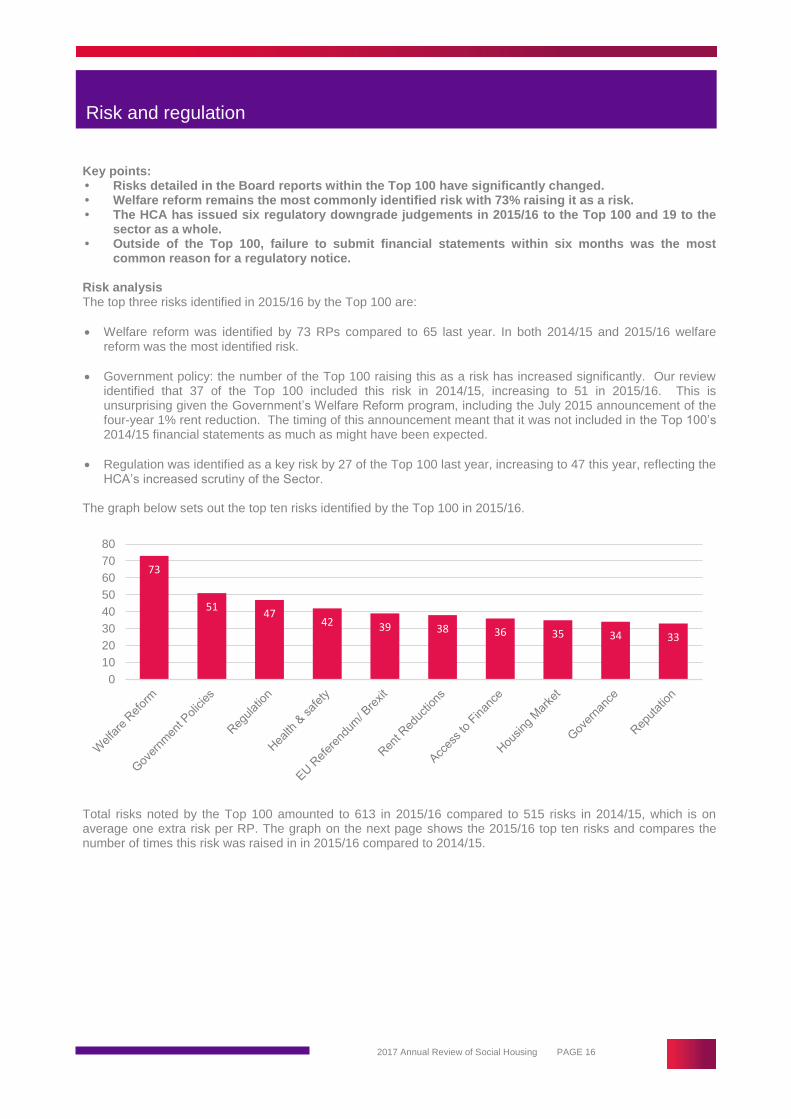
The graph below sets out the top ten risks identified by the Top 100 in 2015/16.
Total risks noted by the Top 100 amounted to 613 in 2015/16 compared to 515 risks in 2014/15, which is on average one extra risk per RP. The graph on the next page shows the 2015/16 top ten risks and compares the number of times this risk was raised in in 2015/16 compared to 2014/15.
73
51 47
42 39 38 36 35 34 33
0
10
20
30
40
50
60
70
80

2017 Annual Review of Social Housing PAGE 17
Risk and regulation
Risk analysis (continued)
Governance has steadily increased as an identified key risk over the past three years. It was included by 13 of the Top 100 in 2013/14, 26 of the Top 100 in 2014/15 to 34 of the Top 100 in 2015/16. Reputation has increased as a risk this year with 33 RPs in the Top 100 raising this issue compared to 19 in 2014/15. These two risks are perhaps linked to the increased number of governance downgrades.
Economic climate has fallen significantly as a key risk (41 in 2014/15; 19 in 2015/16). However this has been replaced by EU Referendum/Brexit which was identified as a key risk by 39 RPs in the Top 100. The Housing market has also increased with 35 RPs raising this as a risk in 2015/16 compared to 27 RPs in 2014/15.
The number of the Top 100 identifying access to finance as a key risk has reduced in the year from 55 in 2014/15 to 36 in 2015/16. This risk featured prominently 2014/15 due to the then unknown impact of the classification of RPs as a public body status.
Health and safety has also increased in the year and was identified by 42 of the Top 100 in 2015/16 compared to 35 in 2014/15. One of the main reasons for governance downgrading is due to gas safety and fire risk assessment failures and this could be linked to the increase in RPs highlighting health and safety as a key risk.
Regulatory activity - regulatory judgments Within the Top 100 there were four downgrades issued in 2014/15, all of whom were upgraded again in 2015/16.
First Wessex was downgraded to G2 from G1 following a failure to complete timely gas servicing in all properties. As a result significant changes were made to the Board and Committee structures and, after a full review by the HCA, First Wessex has now been re-graded to G1.
Yorkshire Housing was also downgraded to G2 following a failure to complete timely gas servicing. After strengthening controls around key processes including gas compliance and reviewing the Board and Committee structures and membership, the RP has been re-graded to G1.
Knightstone Housing was downgraded to G2 from G1 due to lack of board oversight and concerns over management of liquidity risk over the Group’s portfolio. By terminating three interest rate swaps and securing two new credit facilities the provider now has a G1 rating.
0
10
20
30
40
50
60
70
80
2015
2016

2017 Annual Review of Social Housing PAGE 18
Risk and regulation
Regulatory activity - regulatory judgments (continued)
Aldwyck Housing Group was downgraded to G3 from G2 after on-going concerns from a previous judgement and for ineffective risk management and ineffective internal controls framework. Aldwyck has undertaken an internal audit programme with particular focus on risk management, and was re-graded to G2 in November 2015.
There were 19 regulatory downgrade judgements issued in 2015/16, 13 relate to governance downgrades; five to viability downgrades; and one to a downgrade in both governance and viability (Derwent Housing Association). There were six regulatory downgrade judgements within the Top 100:
Symphony Housing Group downgraded to G3 from G1 over a health and safety compliance issue which was raised in a fire safety internal audit; and non-compliance with the rent standard.
One Housing Group downgraded to G2 from G1, due to insufficient assurance regarding the transparency and accountability of their governance arrangements.
The Wrekin Housing Group downgraded to G2 from G1 because of the need to improve effectiveness of management of the business at a group level as well as a need to strengthen its oversight and control of group risks.
Curo Group downgraded to G2 from G1. In their accounts they have recognised that their governance requires improvement, and explicitly state their desire to obtain G1 status. Their plan includes reducing Board size, streamlining committee structures, improving learning and development at Board level, and enhancing executive and non-executive relationships.
Magna Housing Group downgraded to G2 from G1. This downgrade was due to concerns over VfM as the board was unable to demonstrate that it fully considered the most effective strategy for delivering its objectives.
Derwent Housing Association downgraded to G3/V3 from G1/V2. This was due to the lack of evidence that there was effective risk management, internal controls or board scrutiny across the subsidiaries. The viability downgrade was due to a lack of assurance over Derwent’s ability to manage its exposures, as well as inadequate monitoring of its covenant compliance. In addition, evidence that its mitigation strategies will be effective in practice could not be obtained.
Of the five G2 judgements outside of the Top 100:
Two were in relation to weak management of controls (Colne Housing Society and St Vincent’s Housing Association.)
Two were in relation to poor governance performance leading to ineffective management (North Devon Homes, and Shepherd’s Bush Housing Association.)
One was due to a failure to publish a robust VfM assessment (Warrington Housing Association),
Of the two G3 judgements outside of the Top 100:
One is due to poor governance and inability to manage affairs with sufficient diligence and prudence (Saffron Housing Trust).
One is due to a lack of effective risk management and adequate internal controls framework (Tower Hamlets Community Housing).

2017 Annual Review of Social Housing PAGE 19
Risk and regulation
Regulatory activity - regulatory judgements (continued) Of the five V2 judgements outside of the Top 100:
One was because the VfM self-assessment showed that standards were not being met (Wandle Housing Association).
Four were due to weak financial profiles with issues such as lack of headroom in financial plans and reliance on best case scenarios such as efficiency savings and low rent decreases (Christian Action Housing Association, Four Housing Group, Joseph Rowntree Housing Trust, and Severn Vale Housing Society).
There were 12 regulatory notices issued in 2015/16 though only two relate to the Top 100. Paradigm Housing Group and Rochdale Boroughwide Housing were both issued a notice for breach of gas safety regulations. Of those outside the Top 100, six of the 10 regulatory notices issued during the year were for failure to submit financial statements within six months of the latest accounting period, one for breach of rent standard, two for inadequate fire risk assessment, and one for gas safety issues. Overall, the main themes of regulatory judgements/notices for the Top 100 are:
Breach of health and safety regulations including gas safety and fire assessments.
Governance concerns including committee structures, risk management and internal control frameworks.
VfM implementation. Outside of the Top 100 viability and adequate business plan stress testing is a main theme. With the FRS 102 changes it is unsurprising that there were six regulatory notices issued due to failure to file the accounts within six months.

2017 Annual Review of Social Housing PAGE 20
Property sales
Key points:
Total property sales by the Top 100 have increased significantly this year, with surpluses amounting to £855m compared to £585m in 2015.
Seven of the top ten highest total surpluses from sales in the year recorded by the Top 100 were from London and South East England.
Four of the Top 100 made a deficit on their first-tranche sales in the year.
Total sales Surplus from all property sales (non-social housing, other social housing and first tranche) totalled £855m in 2016 (2015: £585m) and was broken down as follows:
In terms of individual RP surpluses on property sales, London & Quadrant (£124m) have topped the list once more with Network Homes (£85m) and Peabody Trust (£69m) leapfrogging Notting Hill (£62m) to rank second and third respectively. It is interesting to note that Anchor Trust (£1.05m) and Coast & Country (£510k) fared the worst, both recognising deficits for the year. Coast & Country account for housing properties at valuation. Only one RP relied on surplus from property sales to generate an overall surplus, compared to five in 2015. First tranche sales Our review identified 86 RPs (2015: 79) made first tranche sales in 2016, generating surpluses of £350m (2015: £201m). As expected, London based RPs generated the largest surpluses on first tranche sales. Notting Hill has topped the table for the last three years, growing from £11m in 2014, £29m in 2015, to an impressive £37m in 2016. Non-social housing assets Similar to the social housing asset sales in the year, a sharp increase has been seen in surpluses on non-social housing asset sales, increasing from £288m in 2015 to £384m in 2016. Network Homes had the highest surplus on non-social housing asset sales in 2016 with £56m, generated from 239 market sales.
- 100,000 200,000 300,000 400,000 500,000
1st tranche sales
Other social housing assets sales
Non-social housing assets sales
(£'000k)
2015
2016

2017 Annual Review of Social Housing PAGE 21
Rent arrears
Key Points:
Total gross arrears across the Top 100 have increased in 2016 by 2.4% compared to 2015, from £694m to £711m.
The aggregate bad debt provision has fallen by 2.1%, from £325m to £318m.
Gross arrears across the Top 100 have increased in the year by 2.4% in monetary terms, from £694m to £711m. This is interesting, suggesting that the feared impact of welfare reform and universal credit has not yet fully materialised. Rent arrears amounted to 6% of social housing lettings income in 2016. Across the Top 100, there was a wide range of arrears due to the differing sizes of RPs. Futures Housing Association has the smallest gross arrears at £0.5m compared with Genesis Housing Association which has the largest at £31.9m. The table below sets out the RPs with the highest gross arrears and 2015 comparatives.
The aggregate bad debt provision recorded by the Top 100 has fallen by 2.1% in 2016, from £325m to £318m, averaging £3.2m per provider (2015: £3.3m). Average coverage of rent arrears was therefore 45% in 2016 (2015: 47%). The RP with the highest bad debt provision to gross rent arrears ratio is Liverpool Mutual Homes Limited where rent arrears coverage is 96% (2015 – 63%). Gross rent arrears and the corresponding provision stated in the accounts are noted as follows:
Liverpool Mutual Homes Limited: 2016 2015
Debtors: Due within one year: £’000 £’000
Rent and service charges receivable 5,932 8,065
Less: Provision for bad and doubtful debts (5,699) (5,043)
Net arrears 223 3,022
- 10,000 20,000 30,000 40,000
Hyde Housing Association Limited
Home Group Limited
Sanctuary Housing Association
Affinity Sutton Group Limited
Peabody Trust
Metropolitan Housing Trust…
The Guinness Partnership Limited
London & Quadrant Housing Trust
Circle Anglia Limited
Genesis Housing Association…
Rent Arrears £'000
2015
2016
2017 Annual Review of Social Housing PAGE 22
Rent arrears
FRS 102 introduced requirements that, where extended or payment plans exist with tenants, rent arrears should be discounted to their NPV using an appropriate rate of interest. This requirement caused interest in the sector when FRS 102 was released. However, many were able to argue that the impact of this was immaterial, especially considered in the context of a bad debt provisioning policy which would typically fully provide for these arrears in any event. It is therefore interesting to note that our Top 100 review identified only six RPs that made a NPV adjustment in relation to rent arrears. The adjustments totalled £2.2m, averaging £362k per organisation, which supports the argument that this is not a material accounting issue for the sector.

2017 Annual Review of Social Housing PAGE 23
Capital commitments
Key points:
Capital commitments increased by 4.9% in 2015/16.
There are large discrepancies between the levels of authorised but not contracted commitments, mirroring the differences of disclosure of units in development.
London & Quadrant disclose the highest level of capital commitments (£1.6bn) followed by Orbit Group (£0.9bn).
Introduction Total capital commitments increased by 4.9% across the Top 100 in 2015/16 to £15.0bn compared to £14.3bn in 2014/15. The split between ‘contracted for’ and ‘authorised but not contracted for’ commitments in 2015/16 is 53%:47%. (2015: 48%:52%). Disclosures There are some interesting variations between the ‘contacted for’ and ‘authorised but not contracted for’ commitments. Of the Top 100, 99 RPs (2015: 98) report contracted commitments ranging from £0.7m (One Manchester) to £1bn (L&Q). Only Magna Housing Group reports nil ‘contracted for’ commitments. 12 RPs (2015: 12) report no ‘authorised but not contracted for’ commitments, the most notable being Network Homes which has the sixth highest contracted commitments at £265m. The differences between the levels of authorised but not contracted commitments mirror the differences in disclosure of units in development and arise from the point at which each RP regards capital expenditure as authorised. Hence the authorised but not contracted figure is not necessarily comparable between RPs. As expected, the larger South-East based RPs have the largest capital commitments reflecting their shared ownership and outright sales programmes. Places for People has the second most ‘authorised but not contracted for’ commitments (£488m) with very little ‘contracted for’ commitments, where they place 53rd. Financing of commitments The Accounting Direction 2015 requires that RPs indicate how capital commitments are to be financed, showing the amount of grant, agreed loans, property sales and any other sources of funding. The most common types of finance and the percentage of the Top 100 who disclose such are: loans (89%), grants (60%), cash reserves (50%) and sales proceeds (34%). However, not all RPs provide the required disclosure of how they will finance their capital commitments. Our review identified six of the Top 100 do not provide this information. This included Places for People with total capital commitments of £521m, which stated that commitments would be funded in accordance with the treasury management policy.

2017 Annual Review of Social Housing PAGE 24
Capital commitments
Financing of commitments (continued) The Top 10 by value in terms of capital commitments ranked by total commitments, contracted commitments and authorised but not contracted are:
2016 2015
Registered Provider Name Contracted
for £000
Authorised but not
contracted £000
Total £000
Contracted for £000
Authorised but not
contracted £000
Total £000
London & Quadrant Housing Trust 1,027,000 595,000 1,622,000 848,000 243,000 1,091,000
Orbit Group Limited 478,015 451,955 929,970 307,444 504,730 812,174
Hyde Housing Association Limited 320,940 362,196 683,136 116,870 558,513 675,383
A2Dominion Housing Group Limited 251,500 340,300 591,800 242,100 590,000 832,100
Family Mosaic Housing 484,915 106,132 591,047 220,763 524,980 745,743
Places for People Group Limited 32,659 487,974 520,633 33,968 487,974 521,942
Home Group Limited 72,539 367,045 439,584 102,301 186,321 288,622
One Housing Group Limited 255,834 182,539 438,373 211,481 197,399 408,880
Affinity Sutton Group Limited 136,861 300,201 437,062 157,159 147,277 304,436
East Thames Group Limited 116,198 310,257 426,455 205,243 195,565 400,808
As expected, the majority of the Top 10 were made up of RPs from London and the South-East. However Orbit Group which operate across the UK had the second highest value total commitments in 2015/16 (£930m).
2017 Annual Review of Social Housing PAGE 25
Non-regulated activities reporting
Key points:
Non-social housing activities contribute 13.9% of total turnover (£2.2bn).
Building for sale income of £1.3bn contributes 58.3% of non-social housing turnover.
Introduction Non-regulated activities reporting remains an area of increasing focus for the HCA. The HCA Sector Risk Profile 2016 states:
‘The sector continues to diversify into a range of new commercial ventures and relationships, through unregulated subsidiaries, joint ventures and special purpose vehicles. It is important that Board skills and governance structures continue to evolve to match this increasing complexity and mitigate the potential risks associated with the financing and funding structures that support its non-social housing activities.’
This increasing diversity into non-regulated activities results in the following regulatory concerns, noted in the HCA’s Governance and Financial Viability Standard (the Standard):
the importance of not putting social housing assets at risk; and
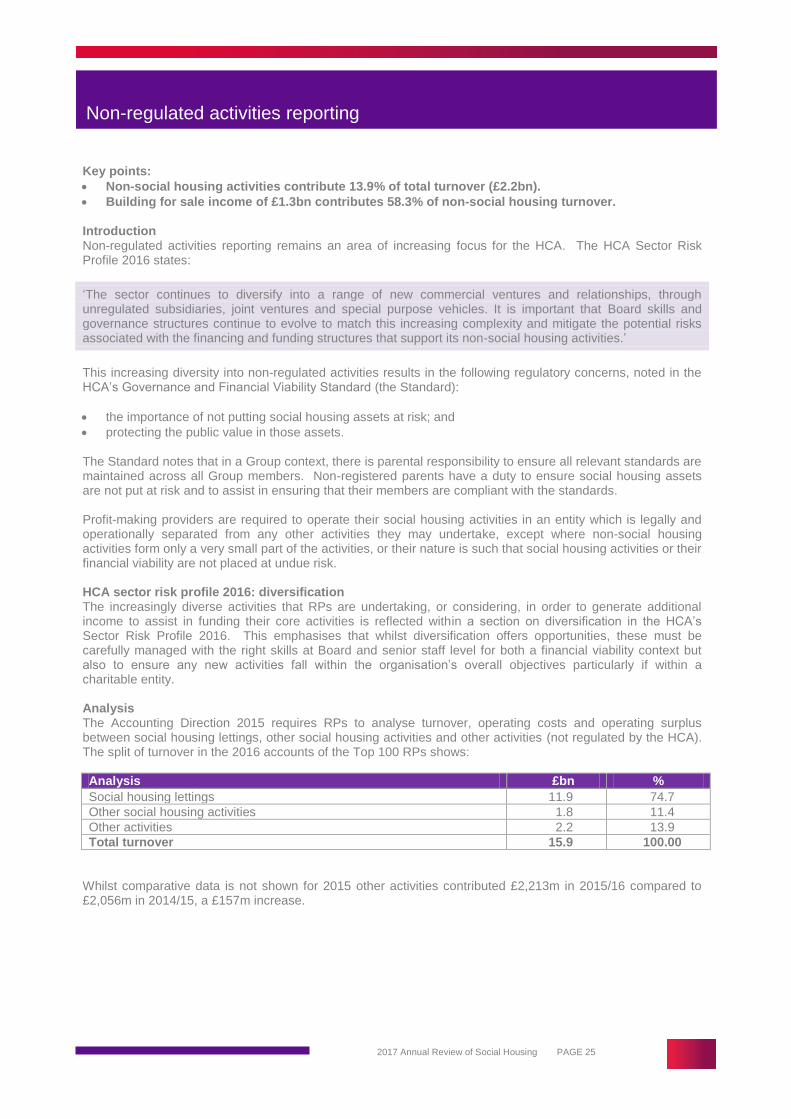
protecting the public value in those assets. The Standard notes that in a Group context, there is parental responsibility to ensure all relevant standards are maintained across all Group members. Non-registered parents have a duty to ensure social housing assets are not put at risk and to assist in ensuring that their members are compliant with the standards. Profit-making providers are required to operate their social housing activities in an entity which is legally and operationally separated from any other activities they may undertake, except where non-social housing activities form only a very small part of the activities, or their nature is such that social housing activities or their financial viability are not placed at undue risk. HCA sector risk profile 2016: diversification The increasingly diverse activities that RPs are undertaking, or considering, in order to generate additional income to assist in funding their core activities is reflected within a section on diversification in the HCA’s Sector Risk Profile 2016. This emphasises that whilst diversification offers opportunities, these must be carefully managed with the right skills at Board and senior staff level for both a financial viability context but also to ensure any new activities fall within the organisation’s overall objectives particularly if within a charitable entity. Analysis The Accounting Direction 2015 requires RPs to analyse turnover, operating costs and operating surplus between social housing lettings, other social housing activities and other activities (not regulated by the HCA). The split of turnover in the 2016 accounts of the Top 100 RPs shows:
Analysis £bn %
Social housing lettings 11.9 74.7 Other social housing activities 1.8 11.4 Other activities 2.2 13.9 Total turnover 15.9 100.00
Whilst comparative data is not shown for 2015 other activities contributed £2,213m in 2015/16 compared to £2,056m in 2014/15, a £157m increase.

2017 Annual Review of Social Housing PAGE 26
Non-regulated activities reporting
Disclosures Disclosures vary across the Top 100; 93 RPs disclose non-social housing activities within turnover, ranging in value from Shoreline Housing Partnership (£0.05m) to Places for People (£324m). There are numerous different descriptions used within other activity reporting which makes it challenging to aggregate for analysis. This reflects not only the diversity within the sector but also the lack of direction in the disclosure requirements which is not unreasonable given the nature of this area. An analysis of common headings within other activities is set out below and as we would expect, outright sale is the highest element of turnover. In 2016 it contributed a significantly greater proportion of total turnover (58.3%) compared to 2015 (46.6%).
Description £m %
Building for sale 1,290.8 58.3
Contracts 141.0 6.4
Lettings 232.5 10.5
Garages 6.3 0.3
Other 542.0 24.5
Total other activities turnover 2,212.6 100.00
The four RPs disclosing the highest level of non-social housing turnover provide analysis of their other activities over a number of headings as set out below. This again shows the diversity within the sector:
Places for People generates the majority of its other income from management services (£177.4m), followed by income from development and construction (£98.8m) and lettings (£35.8m).
L&Q generates other income predominantly from building for sale (£212m, of which £92m is via a joint venture).
Genesis’ non-social housing activities also consists mainly of building for sale (£130.9m) as does A2Dominion’s activities (£113.6m).
Whilst these disclosures reflect the increasing diversity of the social housing sector they also highlight open market sales as being the dominant feature.
Activity
Places for People Group
£m
London & Quadrant
£m
Genesis Housing
Association £m
A2Dominion Housing Group
£m
Open market sales and similar - 212.0 130.9 113.6
Management Services 177.4 - - -
Student accommodation - 2.0 - 8.0
Development and construction 98.8 - - -
Market rent - 12.0 - 8.3
Commercial - 1.0 - -
Other activities 12.0 2.0 - 0.8
Non-social homeowners - 8.0 - -
Lettings 35.8 - 7.0 0.8
Garages - 1.0 - -
Total 324.0 238.0 137.9 131.5

2017 Annual Review of Social Housing PAGE 27
Bonds, borrowings and derivatives
Key Points: • Reported borrowing facilities for the sector have risen to £80bn. • Bond issues and private placements contributed 34% of total new finance raised, the lowest
percentage of new facilities from capital markets since 2011. Borrowings At 31 March 2016 the sector had reported borrowing facilities of £80bn (2015: £75bn) of which 18% (2015: 15%) was undrawn. New facilities arranged in the year to March 2016 totalled £5.2bn (2015: £6.8bn). The maturity profile of existing debt indicated that the immediate refinancing risk of the sector remained low. Long-term debt continues to account for the majority of the sector’s borrowings, with 86% of debt being due for repayment in more than five years. The debt repayment profile shows limited refinancing risk to March 2018, with £3.3bn (5%) of debt repayable within two years (2015 £2.9bn, 4.6%), and half of this reported to be due for repayment within 12 months. Security is currently reported to be in place for £77.6bn of debt (2015: £73.9bn); this represents 97% of agreed facilities and 117% of drawn facilities, the same proportion as last year. At sector level, there appears to be sufficient security in place to cover the forecast drawdowns over the next 12 months. The sector’s exposure to interest rate fluctuations is mitigated through the use of fixed interest rates. £45.5bn (69%) of drawn debt is fixed for over one year (2015: £43.7bn, 69% of drawn debt). The analysis of the duration of fixed rates shows that 73% (2015: 71%) of total borrowing is at rates fixed for over 10 years. The use of long term fixes, through bonds, fixed rate bank debt or interest rate swaps continues to provide the sector with a degree of certainty on forecasting the costs of borrowing. The total amount of debt reported as floating, fixed for less than a year or otherwise exposed to variations in cost through inflation linking or cancellable/callable options now amounts to £20.3 billion. This represents 31% of the total drawn debt (2015: £19.7 billion, 31%). The total amount of long term debt of the Top 100 RPs is circa £56.5bn (2015: £49.5bn) of which 84% (2015:75%) is repayable more than 5 years from the year end and 3% (2015: 4%) is repayable within one year. 78% of the total borrowings of the Top 100 are through bank loans and mortgages. 13 RPs have net debt exceeding one billion pounds as follows:
2016 2015
£m £m
Sanctuary 2,706 2,482
London & Quadrant 2,208 2,300
Circle Anglia 2,090 2,128
Places for People 1,868 1,770
Hyde 1,653 1,322
Genesis 1,496 1,556
A2 Dominion 1,364 1,362
Notting Hill 1,298 1,302
Sovereign 1,274 1,235
Affinity Sutton 1,191 1,277
Peabody Trust 1,120 1,173
Metropolitan 1,095 1,075
Guinness Partnership 1,078 1,056
2017 Annual Review of Social Housing PAGE 28
Bonds, borrowings and derivatives
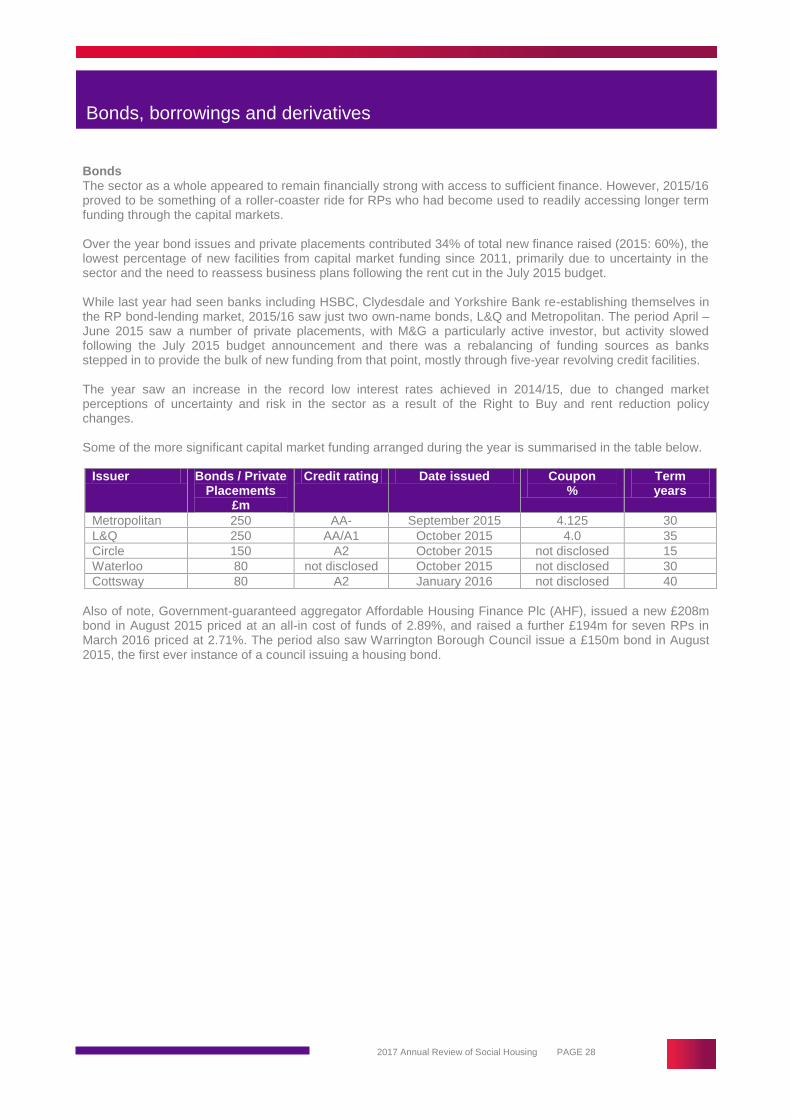
Bonds The sector as a whole appeared to remain financially strong with access to sufficient finance. However, 2015/16 proved to be something of a roller-coaster ride for RPs who had become used to readily accessing longer term funding through the capital markets. Over the year bond issues and private placements contributed 34% of total new finance raised (2015: 60%), the lowest percentage of new facilities from capital market funding since 2011, primarily due to uncertainty in the sector and the need to reassess business plans following the rent cut in the July 2015 budget. While last year had seen banks including HSBC, Clydesdale and Yorkshire Bank re-establishing themselves in the RP bond-lending market, 2015/16 saw just two own-name bonds, L&Q and Metropolitan. The period April – June 2015 saw a number of private placements, with M&G a particularly active investor, but activity slowed following the July 2015 budget announcement and there was a rebalancing of funding sources as banks stepped in to provide the bulk of new funding from that point, mostly through five-year revolving credit facilities. The year saw an increase in the record low interest rates achieved in 2014/15, due to changed market perceptions of uncertainty and risk in the sector as a result of the Right to Buy and rent reduction policy changes. Some of the more significant capital market funding arranged during the year is summarised in the table below.
Issuer Bonds / Private Placements
£m
Credit rating Date issued Coupon %
Term years
Metropolitan 250 AA- September 2015 4.125 30
L&Q 250 AA/A1 October 2015 4.0 35
Circle 150 A2 October 2015 not disclosed 15
Waterloo 80 not disclosed October 2015 not disclosed 30
Cottsway 80 A2 January 2016 not disclosed 40
Also of note, Government-guaranteed aggregator Affordable Housing Finance Plc (AHF), issued a new £208m bond in August 2015 priced at an all-in cost of funds of 2.89%, and raised a further £194m for seven RPs in March 2016 priced at 2.71%. The period also saw Warrington Borough Council issue a £150m bond in August 2015, the first ever instance of a council issuing a housing bond.

2017 Annual Review of Social Housing PAGE 29
FRS 102 – Housing properties
Introduction The biggest change to the accounting regime in a long time came into effect for accounting periods beginning on or after 1 January 2015, in the shape of FRS 102, supported by the 2014 Housing SORP and the 2015 Accounting Direction. In this and the following sections, our Top 100 review analyses the impact of these accounting changes, starting with housing properties.
Key points:
Only three of the Top 100 account for housing properties at valuation, compared to 11 in 2015.
The transition exemption allowing a valuation of an item of property, plant and equipment to be used as deemed cost was popular, with 25 RPs applying this.
Impairment remains an important issue in the sector. Transition options FRS 102, with the 2014 SORP and accounting direction alongside it, offered choices only available as a one off option at transition to the new regime. The two key exemptions were:
For those accounting at valuation, first-time adopters were permitted under FRS 102 to freeze the valuation at the date of transition and to use that value as the deemed cost going forward.
RPs accounting at cost were permitted to use a valuation as deemed cost at the transition date and to use this value as cost going forward.
This caused some excitement in the initial planning stages of FRS 102 implementation. So, were these options taken up by the sector? Transition options - valuation In last year’s Top 100 review, we identified 11 RPs that accounted for their housing properties at valuation. This year, of these 11, all but three had elected to freeze valuation at the date of transition and account for housing properties at cost going forward. Only Wakefield and District Housing, Coast & Country Housing Limited and Accent Group opted to stick with valuation in their 2016 financial statements. The move away from valuation is unsurprising, given the volatility of valuations following the July 2015 announcement of the four-year 1% rent cut. As an example of the impact of this, Wakefield and District Housing saw a £243m unrealised loss on revaluation of housing properties in the 2016 financial statements, whilst Coast & Country Housing booked a £100m unrealised loss on revaluation. Accent Group booked a £57m unrealised revaluation loss. There was also a technical issue introduced by the 2014 SORP, which required that valuation uplifts were applied to land and structure. The uplift was previously applied to land only. This would have created a headache for those sticking with valuation, as there would be an additional depreciation charge created by this new allocation methodology. Wakefield and District Housing, Coast & Country Housing and Accent Group did not explore this nuance in their transition statements, perhaps judging it not to have had a material impact.

2017 Annual Review of Social Housing PAGE 30
FRS 102 – Housing properties
Transition options - valuation uplifts The option for those accounting at cost to use a fair value valuation at transition and to use this as deemed cost going forward proved popular amongst the Top 100. We identified 25 RPs in the Top 100 that applied this one-off transition option. Our review identified some significant uplifts associated with this. Metropolitan Housing Trust, for example, noted in its financial statements that “Adoption of the deemed cost option has resulted in a net increase in fixed assets at 1 April 2014 of £268m.” Genesis Housing Association stated in relation to the deemed cost adjustment “A revaluation reserve of £413m has been established for the movement with a corresponding debit to fixed asset cost.” The transition option was mainly applied to housing properties, but was available in relation to all items of plant, property and equipment. Places for People, for example, applied the option to its office properties and consequently reduced their carrying value by £11.4m at the transition date. The transition option was particularly flexible, as first-time adopters were permitted to pick specific assets to apply the option to, rather than applying it to asset classes as a whole. Notting Hill provided an example of how flexibly this could be applied. The financial statements state in relation to the deemed cost option “The Group exercised this option for all social rented properties and shared ownership properties with the exception of the scheme in Barham Park.” Though this was solely an accounting uplift, changing nothing about the underlying business, it is clear that for many of the Top 100, being able to present a strong Statement of Financial Position is important and worth the accounting hassle of applying this option. Impairment The 2014 SORP introduced new rules in relation to the measurement of impairment. The SORP requirements on impairment are complex and worth regular re-reading, but can be summarised as: where a trigger occurs, an impairment review is undertaken which compares the carrying value of the asset to the higher of estimated value in use or fair value less costs to sell. The SORP allows that depreciated replacement cost will provide a reasonable estimate of the value in use for assets that are held for their service potential. Existing Use Value – Social Housing is allowed as a measure of fair value. An impairment trigger occurred in 2015/16 in the shape of the rent cut announced in July 2015, so we would expect that all of the Top 100 to have undertaken an impairment review. However, given the accounting rules are now different compared to the previous SORP, what was the impact of this? Our review identified that 36 of the Top 100 booked an impairment charge in 2015/16, totalling £59m, compared to 34 RPs in 2014/15 who booked impairment charges totalling £30.1m. The highest impairment charge was recorded by Notting Hill Housing Trust, amounting to £13.9m. In the accounting policies note, the financial statements record that this relates to “one of our developments to reflect the cost of our contractual obligations with the local authority; £5.5m relates to costs incurred and £8.3m as a provision for future losses.” Affinity Sutton also booked a sizeable impairment charge, amounting to £5.1m. The notes to the financial statements record that, following the rent cut, an impairment review was undertaken which identified five schemes, three of which were still under construction, which were impaired. Hanover Housing Association recorded an impairment charge of £3.7m in their 2015/16 financial statements covering four parcels of land in Group ownership, three of which had not yet commenced development and one which was nearing build completion.

2017 Annual Review of Social Housing PAGE 31
FRS 102 – Housing properties
Impairment (continued) Interestingly, Viridian Housing’s financial statements included a reversal of a previous impairment charge of £2.5m. The financial statements note that
“For our rented key worker scheme in Basingstoke void rates have improved substantially, resulting in occupancy levels that are in line with the expected performance of the scheme and this is expected to continue. At this level of occupancy the scheme produces a positive net present value over the life of the remaining lease period and so the impairment has been released.”
Clearly impairment remains an important consideration for the sector and is one of the key judgements made in relation to the financial statements. Depreciation and grant amortisation The 2014 SORP introduced new accounting requirements in relation to government grants, requiring that for those accounting at cost, these are recognised in line with the accruals model. Grants are held as deferred income to be recognised over the expected life of the housing property structure or over the expected life of structure and components. Given that grant was no longer deducted from the cost of housing properties, as required under the previous SORP, there was a consequent impact on depreciation. This was undoubtedly the most time-consuming part of the FRS 102 transition for finance teams, so it is interesting to note how this impacted the financial statements of the Top 100. Our Top 100 review compared transition adjustments associated with this change in accounting policy, comparing the additional amortisation charge to the additional depreciation charge. We excluded those organisations which had applied the transition option of using a valuation as deemed cost at the transition date. We noted that prior to the transition date (31 March 2014 for most), grant amortisation of £22.95bn was booked, compared to additional depreciation of £13.7bn, resulting in a net increase in reserves of £9.2bn. The impact on 2015’s figures was less marked, with additional amortisation of £2.3bn included, compared to £2.2bn additional depreciation, which would have resulted in an overall increase in reserves of £106m. This result was not surprising since under previous accounting rules grant was usually allocated to land (which is not depreciated) and structure, whereas under the 2014 SORP grant is usually allocated wholly against structure. This meant that it was more common than not that there was more amortisation than additional depreciation.

2017 Annual Review of Social Housing PAGE 32
FRS 102 – Errors and other adjustments
Key Points:
Our review identified 16 RPs that made a prior period adjustment in 2015/16 that did not relate to FRS 102 transition.
FRS 102 requires that if an entity becomes aware of errors made under its previous accounting framework, the transition reconciliation note shall distinguish the correction of those errors from changes in accounting policy. Our review identified 16 RPs within the Top 100 which reported prior period adjustments in 2015/16 other than FRS 102 adjustments. Some of these adjustments are detailed below. Five RPs within the Top 100 reported a prior period adjustment in relation to the MyChoice Homebuy schemes that the RPs were operating as part of a consortium. These were Metropolitan Housing Trust Limited, Catalyst Housing Limited, Moat Homes Limited, bpha Limited and Aldwyck Housing Group Limited During 2015/16, the consortium was notified that notices and loan and interest statements provided to customers did not comply with the Consumer Credit (Information Requirements and Duration of Licences and Charges) Regulations 2007. Interest charged to customers during the period that they did not comply with the Regulations had been refunded. The total refund charge to accumulated 2015 reserves across these five RPs totalled £26.8m. The disclosure in the Moat Homes Limited accounts for these adjustments was as follows:
2017 Annual Review of Social Housing PAGE 33
FRS 102 – Errors and other adjustments
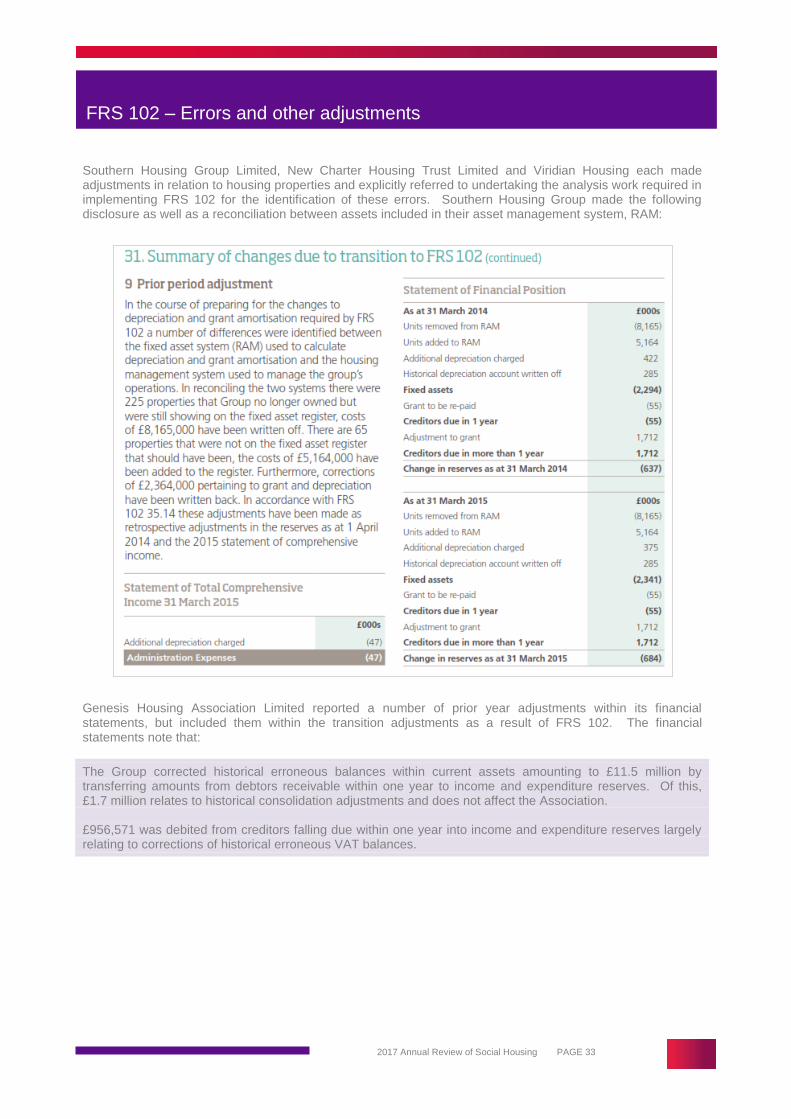
Southern Housing Group Limited, New Charter Housing Trust Limited and Viridian Housing each made adjustments in relation to housing properties and explicitly referred to undertaking the analysis work required in implementing FRS 102 for the identification of these errors. Southern Housing Group made the following disclosure as well as a reconciliation between assets included in their asset management system, RAM: Genesis Housing Association Limited reported a number of prior year adjustments within its financial statements, but included them within the transition adjustments as a result of FRS 102. The financial statements note that:
The Group corrected historical erroneous balances within current assets amounting to £11.5 million by transferring amounts from debtors receivable within one year to income and expenditure reserves. Of this, £1.7 million relates to historical consolidation adjustments and does not affect the Association. £956,571 was debited from creditors falling due within one year into income and expenditure reserves largely relating to corrections of historical erroneous VAT balances.
2017 Annual Review of Social Housing PAGE 34
FRS 102 – Errors and other adjustments
Other adjustments are noted below:
Incommunities Group reported an arithmetical error in the consolidated revenue reserves which had arisen as a result of the transfer of a subsidiary. Correction of this error resulted in a £542k reduction in reserves.
Hyde Housing Association identified an onerous lease as part of its FRS 102 transition, resulting in additional expenditure of £674k. Hyde also identified an error in relation to its Easybuy properties, which should have been recorded at fair value rather than cost. This adjustment increased reserves at 2015 by £622k.
Thirteen Housing Group made an adjustment to revaluation reserve at 2015 of £647k, relating to the disposal value of housing properties.
Network Homes made an adjustment of £3m to reserves in relation to a consolidation adjustment made in relation to subsidiaries which had already been amalgamated into another group company.
Fortis Living restated reserves at 2015 by £22.6m to reflect the amalgamation of a subsidiary’s pension scheme and staff costs in to the parent company.
Aspire Group made an adjustment to reserves at 2014 of £818k in relation to housing properties “that were understated with regard to the land element that was invested as part of the arrangement but a net value was paid to acquire the properties.”
North Hertfordshire Homes noted that £577k of grants had been reclassified, resulting in an increase in the cost of housing properties and an increase in social housing grants.

2017 Annual Review of Social Housing PAGE 35
FRS 102 - Pensions
Key Points:
New requirements under FRS 102 in relation to accounting for Social Housing Pension Scheme (SHPS) past service deficit arrangements have added significant liabilities to the balance sheets of the Top 100, amounting to £685m at 2016.
76 of the Top 100 RPs reported servicing a SHPS past service deficit recovery plan as at 31 March 2016.
25 of the Top 100 RPs had a past service deficit recovery plan in place greater than £10m recognised in the Statement of Financial Position.
New requirements under FRS 102 in relation to accounting for SHPS past service deficit arrangements have added significant liabilities to the balance sheets of the Top 100, amounting to £685m at 2016. Paragraphs 28.11 and 28.11A of FRS 102 require defined benefit multi-employer plans are accounted for as defined contribution plans where there is insufficient information available to account for the plan as defined benefit. This is the same accounting treatment as was the case under the 2010 SORP and ‘old’ UK GAAP. For year ends March 2016, The Pensions Trust maintained that SHPS was such a scheme. However, we understand the SORP Working Party is developing a methodology to understand if necessary information could be determined that could enable RPs that are members of SHPS to account for their portion of the SHPS as a defined benefit scheme, so this exemption may not be around for much longer. It is interesting to note that Genesis Housing Association operated a number of pension schemes with SHPS for the first 11 months of 2015/16, which were combined into a new Genesis Pension Scheme as at 31 March 2016. The financial statements disclose that an actuarial valuation of the SHPS assets and liabilities was undertaken for the three years to 31 March 2016, and Genesis accounted for these in the financial statements. FRS 102 and the Housing SORP 2014 did introduce a change in the accounting treatment of contractual arrangements in place to meet a past service deficit on multi-employer plans. Where there is such an agreement in place, an entity must recognise a liability for the contributions payable that arise from the agreement in the Statement of Financial Position and the resulting expense in the Statement of Comprehensive Income in accordance with paragraphs 28.13 and 28.13A of FRS 102. Where this liability is not expected to be settled wholly within 12 months after the end of the reporting period, it is measured at the present value of the contributions payable, with the unwinding of the discount recognised as a finance cost in the Statement of Comprehensive Income. The previous accounting treatment for these contributions payable was to expense these contributions in full in the financial year in which the payment was due with no liability recognised in the Statement of Financial Position for the outstanding past service deficit contractually in place. Our review identified 76 of the Top 100 RPs which reported a SHPS past service deficit recovery plan as at 31 March 2016. The total past service deficit on the Statement of Financial Position of these RPs stood at £685m as at 31 March 2016 which had increased by 21% from £564m as at 31 March 2015. The increase was largely as a result of a re-measurement of the past service deficit, which hit the 2016 year end accounts. The largest deficits in place were £49.9m in 2016 for the Guinness Partnership which had increased from £38.0m in 2015 and Metropolitan Housing Trust with a deficit of £32.7m in 2016 which had increased from £26.1m in 2015.
2017 Annual Review of Social Housing PAGE 36
FRS 102 - Pensions
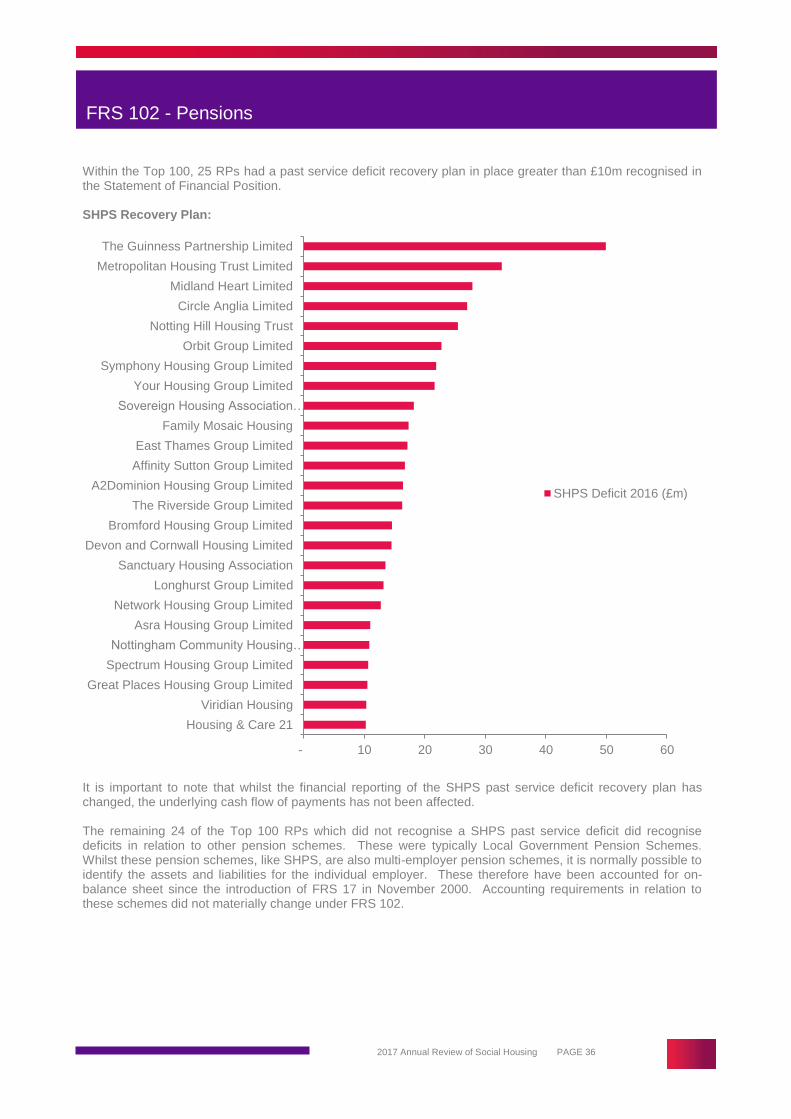
Within the Top 100, 25 RPs had a past service deficit recovery plan in place greater than £10m recognised in the Statement of Financial Position. SHPS Recovery Plan:
It is important to note that whilst the financial reporting of the SHPS past service deficit recovery plan has changed, the underlying cash flow of payments has not been affected. The remaining 24 of the Top 100 RPs which did not recognise a SHPS past service deficit did recognise deficits in relation to other pension schemes. These were typically Local Government Pension Schemes. Whilst these pension schemes, like SHPS, are also multi-employer pension schemes, it is normally possible to identify the assets and liabilities for the individual employer. These therefore have been accounted for on-balance sheet since the introduction of FRS 17 in November 2000. Accounting requirements in relation to these schemes did not materially change under FRS 102.
- 10 20 30 40 50 60
Housing & Care 21
Viridian Housing
Great Places Housing Group Limited
Spectrum Housing Group Limited
Nottingham Community Housing…
Asra Housing Group Limited
Network Housing Group Limited
Longhurst Group Limited
Sanctuary Housing Association
Devon and Cornwall Housing Limited
Bromford Housing Group Limited
The Riverside Group Limited
A2Dominion Housing Group Limited
Affinity Sutton Group Limited
East Thames Group Limited
Family Mosaic Housing
Sovereign Housing Association…
Your Housing Group Limited
Symphony Housing Group Limited
Orbit Group Limited
Notting Hill Housing Trust
Circle Anglia Limited
Midland Heart Limited
Metropolitan Housing Trust Limited
The Guinness Partnership Limited
SHPS Deficit 2016 (£m)

2017 Annual Review of Social Housing PAGE 37
FRS 102 – Financial instruments
Key Points:
The application of FRS 102 added an additional £2.436bn of financial liabilities to the balance sheets of the Top 100 as at 31 March 2015.
53 RPs reported complex financial instruments in the 31 March 2016 financial statements. FRS 102 introduced significant changes in the accounting regime for financial instruments. Under FRS 102, financial instruments are categorised as being either ‘basic’, in which case Section 11 applies; or ‘complex’, in which case Section 12 applies. Under FRS 102, basic debt instruments are accounted for at amortised cost, whereas complex debt instruments are measured at fair value. Under previous UK GAAP, most financial instruments were measured at net proceeds, adjusted for payments, finance costs and issue costs, though some entities opted to apply or were required to apply FRS 25 and 26, which required derivatives to be measured at fair value. Our review identified that changes associated with the application of the new accounting requirements added an additional £2.436bn of financial liabilities to the balance sheets of the Top 100 as at 31 March 2015. Eight RPs recognised over £100 million of additional liability as at 31 March 2015, as detailed in the table below:
Housing Association £m liability
Circle Anglia Limited 241
Affinity Sutton Group Limited 133
Stonewater Limited 119
Genesis Housing Association Limited 118
bpha Limited 115
East Thames Group Limited 109
AmicusHorizon Limited 107
Orbit Group Limited 102
Total £1,044m
We noted 53 RPs reported complex financial instruments in the 31 March 2016 financial statements. For 45 of these, the complex financial instruments were interest rate swaps and stand-alone derivatives, taken out to hedge against potential increases in interest or inflation rates on variable rate loans. Five RPs had previously applied FRS 26. Because FRS 26 also required derivatives to be measured at fair value, the impact of FRS 102 in this area for these entities was slight. Of the RPs we identified as holding derivatives, 36 applied hedge accounting. This means nine chose not to apply hedge accounting. The disclosure of financial instruments, the approach to hedging, the interest/ inflation rates applicable to the derivatives and the applicable period differed greatly. A good example of financial disclosure for derivatives was reported by Hyde Housing Group which reported the following:

2017 Annual Review of Social Housing PAGE 38
FRS 102 – Financial instruments
There were a further eight RPs which reported complex financial instruments that were not derivatives. These were primarily loans with non-basic elements which were therefore reported at fair value at year end. The most significant of these was Network Homes Limited which reported a lender option borrower option (LOBO) within its loans which resulted in a £74.602 million charge to prior period reserves as at 31 March 2015. The following was disclosed in the financial statements with regard to this:
Paragraph 12.2 of FRS 102 provided a choice of accounting policies. Entities could apply either the provisions of both Section 11 and Section 12 in full; the recognition and measurement provisions of IAS 39 and the disclosure and presentation requirements of Sections 11 and 12; or the recognition and measurement provisions of IFRS 9 Financial Instruments and/or IAS 39 and the disclosure and presentation requirements of Sections 11 and 12.

2017 Annual Review of Social Housing PAGE 39
FRS 102 – Financial instruments
The majority of RPs adopted Sections 11 and Section 12 of FRS 102 in full. However there were exceptions, such as L&Q which stated the following in its accounting policies:

2017 Annual Review of Social Housing PAGE 40
Glossary
Term Definition
Accounting Direction for Private Registered Providers of Social Housing 2015
A document issued by the HCA under powers delegated to it by sections 127 and 177(4) of the Housing and Regeneration Act 2014, giving directions to RPs about the preparation of their accounts.
Amortisation An accounting term, referring to the process of allocating the cost of an intangible asset over time.
Depreciation An accounting term, referring to the process of allocating the cost of a tangible asset or liability over time.
Derivative A financial instrument with a price that is dependent on or derived from one or more underlying assets, such as interest rate swaps.
Fair value The amount for which an asset could be exchanged, a liability settled or an equity instrument could be exchanged, between knowledgeable and willing parties in an arm’s length transaction.
Financial instrument A contract the gives rise to a financial asset of one entity and a financial liability or equity instrument of another entity.
First tranche disposal The initial portion of a shared ownership property sold to the lessee.
Fixed assets Assets of an entity which are intended for use on a continuing basis in the entity’s activities.
Governance and Financial Viability Standard
A Standard issued in April 2015 by the HCA, setting out requirements in relation to governance and financial viability.
HCA (Homes and Communities Agency)
A non-departmental public body that funds new affordable housing in England. It also acts as the Regulator of social housing in England.
Housing Statement of Recommended Practice 2014
The Housing SORP’s aim is narrow areas of difference of accounting within the social housing sector by recommending preferred accounting treatments and providing guidance in applying UK GAAP. The Housing SORP applies to all registered social housing providers.
Impairment The amount by which the carrying value of an asset exceeds its recoverable amount.
Multi-employer pension plans
Defined contribution plans (other than state plans) or defined benefit plans (other than state plans) that: a) Pool the assets contributed by various entities that are not under common control, and b) Use those assets to provide benefits to employees of more than one entity, on the basis that contribution and benefit levels are determined without regard to the identity of the entity that employs the employees concerned.
NHF (National Housing Federation)
A trade body, representing providers of affordable housing in England.
NPV (Net Present Value) A current estimate of the present discounted value of the future net cash flows in the normal course of business.
Recoverable amount The higher of an asset’s fair value less costs to sell and its value in use.
RP (Registered Provider) A social landlord that is recorded in the register maintained by the HCA under the Housing Act 1996.

2017 Annual Review of Social Housing PAGE 41
Glossary
Term Definition
Regulatory Judgement Regulatory judgements are the HCAs official view of a provider. RPs are assessed on governance and viability and rated on a scale of one to four.
Regulatory Notice Brief reports issued by the HCA. Consumer standards regulatory notices are published when the HCA judges that a RP has breached consumer standards and there is actual or potential serious harm to tenants.
Shared Ownership Housing schemes where the social landlord has granted a shared ownership lease as defined in s622 of the Housing Act 1985.
SHPS (Social Housing Pension Scheme)
A multi-employee defined benefit pension scheme.
Strategic Report
A report that helps stakeholders asses the performance of a business, providing a balanced and neutral assessment of the development and performance of the business during the year and setting out its future plans, including risks and uncertainties to be faced.
The Code A code of governance issued by the NHF.
Top 100 The 100 largest Registered Providers in England by unit numbers.

Formed more than 100 years ago, accountants and business advisors Beever and Struthers has a strong not-for-profit reputation based on the provision of high quality, tailored services to the UK social housing sector. The firm is one of the UK’s leading independent accountancy practices with offices in Manchester, London and Blackburn. Among its core strengths is a substantial not-for-profit division that ranks among the Top 5 providers of audit and assurance services with many of the leading UK Registered Providers amongst its clients. Beever and Struthers is a member of HLB International, a worldwide network of independent accounting firms and business advisors. Formed in 1969, HLB International is a global network of independent professional accounting firms and business advisers with member firms in 130 countries, employing 2,100 partners and about 19,000 staff in over 600 offices and collectively generating $1.91bn in annual revenue. If you need any advice or assistance please contact us at any of the addresses below:
Manchester
St George’s House 215-219 Chester Road
Manchester M15 4JE
London
15 Bunhill Row London
EC1Y 8LP
Blackburn
Central Buildings Richmond Terrace
Blackburn BB1 7AP
www.beeverstruthers.co.uk
Registered Auditors © Beever and Struthers – March 2017
Disclaimer: Please note that this literature is provided for your information only. Whilst every effort has been made to
ensure its accuracy, information contained in this literature may not be comprehensive and you should not act upon it without professional advice.