2017 full year results presentation - balfourbeatty.com · presentation is intended to be, or...
TRANSCRIPT
2017 full year results presentation 14 March 2018

This presentation may include certain forward-looking statements, beliefs or opinions, including statements with respect to Balfour Beatty plc’s business, financial condition and results of operations. These forward-looking statements can be identified by the use of forward-looking terminology, including the terms "believes", "estimates", "plans", "anticipates", "targets", "aims", "continues", "expects", "intends", "hopes", "may", "will", "would", "could" or "should" or, in each case, their negative or other various or comparable terminology. These statements are made by the Balfour Beatty plc Directors in good faith based on the information available to them at the date of the 2017 full-year results announcement and reflect the beliefs and expectations of Balfour Beatty plc Directors. By their nature, these statements involve risk and uncertainty because they relate to events and depend on circumstances that may or may not occur in the future. A number of factors could cause actual results and developments to differ materially from those expressed or implied by the forward-looking statements, including, without limitation, developments in the global economy, changes in UK and US government policies, spending and procurement methodologies, and failure in Balfour Beatty's health, safety or environmental policies.
No representation or warranty is made that any of these statements or forecasts will come to pass or that any forecast results will be achieved. Forward-looking statements speak only as at the date of the 2017 full-year results announcement and Balfour Beatty plc and its advisers expressly disclaim any obligations or undertaking to release any update of, or revisions to, any forward-looking statements in this presentation. No statement in the presentation is intended to be, or intended to be construed as, a profit forecast or profit estimate or to be interpreted to mean that Balfour Beatty plc’s earnings per share for the current or future financial years will necessarily match or exceed the historical earnings per share for Balfour Beatty plc. As a result, you are cautioned not to place any undue reliance on such forward-looking statements.
Forward-looking statements
1

Leo Quinn Group Chief Executive

Underlying profit from operations more than doubled to £196m (2016: £69m)
All earnings-based businesses materially improved profit from operations
Average net cash £42m (2016: £46m net debt); year end net cash £335m (2016: £173m)
M25 partial sales in line with strategy to maximise value from Investments portfolio
Directors’ valuation of Investment portfolio unchanged at £1.2bn
Rebased, higher quality order book of £11.4bn, in line with half year
Recommended final dividend of 2.4 pence per share; full year 3.6 pence per share
Build to Last highlights
3
Remain on track for industry-standard margins in second half of 2018

De-risking Balfour Beatty to improve returns
4
Simplified and refocused on chosen
markets in UK & Ireland, US and
Far East
Exited construction in Middle East,
Indonesia, Australia and Canada
Selective bidding for contracts best
aligned with Group’s infrastructure capabilities
Higher quality, lower risk order book on more favourable
commercial terms
Upgraded leadership and
governance
Short interval control via Gated Lifecycle, Digital Briefcase and
Project on a Page
Strong balance sheet; running business with
average net cash
Started to pay down gross debt in 2017
Building a culture to underpin future profitable growth
GEOGRAPHIC COMMERCIAL OPERATIONAL FINANCIAL

Phil Harrison Chief Financial Officer

Headline numbers
6
2017 2016^
Revenue* £8,234m £8,215m
Profit from operations* £196m £69m
Pre-tax profit* £165m £62m
Post-tax profit £143m £48m
Statutory profit £168m £24m
Underlying basic EPS* 20.9p 7.2p
Dividends per share 3.6p 2.7p
Order book* £11.4bn £12.4bn
Directors’ valuation £1,244m £1,220m
Year end net cash≠ £335m £173m
Average net cash/(debt)≠ £42m £(46)m
* from continuing operations, before non-underlying items ≠ excluding infrastructure concessions (non-recourse) net debt ^ re-presented to classify the Group’s 49% interests in Dutco Balfour Beatty LLC and BK Gulf LLC as discontinued operations
Strong financial performance

Underlying profit from operations
7
£m 2017* 2016*^
US Construction 41 33 UK Construction# 16 (65) Gammon 15 11 Construction Services 72 (21) Support Services 41 34 Infrastructure Investments 116 89 Corporate activities (33) (33) Total 196 69
* from continuing operations, before non-underlying items # re-presented to include Rail construction as part of UK Construction ^ re-presented to classify the Group’s 49% interests in Dutco Balfour Beatty LLC and BK Gulf LLC as discontinued operations
Improved profit from operations across all businesses

Order book
£bn FY 2017 HY 2017 FY 2016^
Construction Services
US 4.3 4.7 5.5
UK# 2.7 2.2 2.3
Gammon 1.3 1.2 1.5
8.3 8.1 9.3
Support Services
Utilities 1.3 1.5 1.5
Transportation 1.8 1.8 1.6
3.1 3.3 3.1
Total 11.4 11.4 12.4
8
£bn FY 2017 FY 2016^
0-12 months 4.9 5.9
12-24 months 3.3 3.4
24 months+ 3.2 3.1
Total 11.4 12.4
Full year 8% decrease (down 3% at CER)
Directly in line with half year 2017
Strong governance ensures selective bidding
Increased bid margin thresholds, lower risk contract portfolio
# re-presented to include Rail construction as part of UK Construction ^ re-presented to classify the Group’s 49% interests in Dutco Balfour Beatty LLC and BK Gulf LLC as discontinued operations
Higher quality order book

Construction Services
9
£m 2017* 2016*^
Revenue PFO PFO % Revenue PFO PFO %
US 3,634 41 1.1% 3,427 33 1.0%
UK# 1,998 16 0.8% 2,143 (65) (3.0)%
Gammon 1,017 15 1.5% 967 11 1.1%
Total 6,649 72 1.1% 6,537 (21) (0.3)%
Performance
Revenue increased 2% (down 2% at CER) Construction Services returned to profit Materially improved PFO in all business segments
* from continuing operations, before non-underlying items # re-presented to include Rail construction as part of UK Construction ^ re-presented to classify the Group’s 49% interests in Dutco Balfour Beatty LLC and BK Gulf LLC as discontinued operations
Remain on track for industry-standard margins in second half of 2018

Support Services
10
£m 2017 2016
Revenue
Utilities 608 590
Transportation 453 513
Total 1,061 1,103
Profit from operations* 41 34
PFO margin* 3.9% 3.1%
Performance
Revenue decreased by 4%
Power: restructure and cost removal
Gas and Water: middle of regulatory cycles
Highways: strong work winning
Rail: Network Rail operations contracts
* before non-underlying items
Support Services in middle of PFO margin range

Infrastructure Investments
11
£m 2017 2016
Pre-disposals operating profit* 30 24
Gain on disposals 86 65
Investments underlying operating profit* 116 89
Subordinated debt interest receivable 26 29
Infrastructure concessions’ net interest (2) (3)
Investments pre-tax result* 140 115
Performance
Increased profit driven by higher gains on disposals Three partial sales of Connect Plus M25:
2017 profit & cash: 12.5% sale for £54m profit on disposal, £103m cash proceeds
2017 profit, 2018 cash: 7.5% sale for £32m profit on disposal, £62m cash proceeds
2018 profit & cash: 5% sale for £21m profit on disposal, £42m cash proceeds
In total 25% sale for £107m profit on disposal, £207m cash proceeds; Group retains 15% interest in Connect Plus M25 asset
* before non-underlying items
Ongoing strategy to maximise value of the portfolio
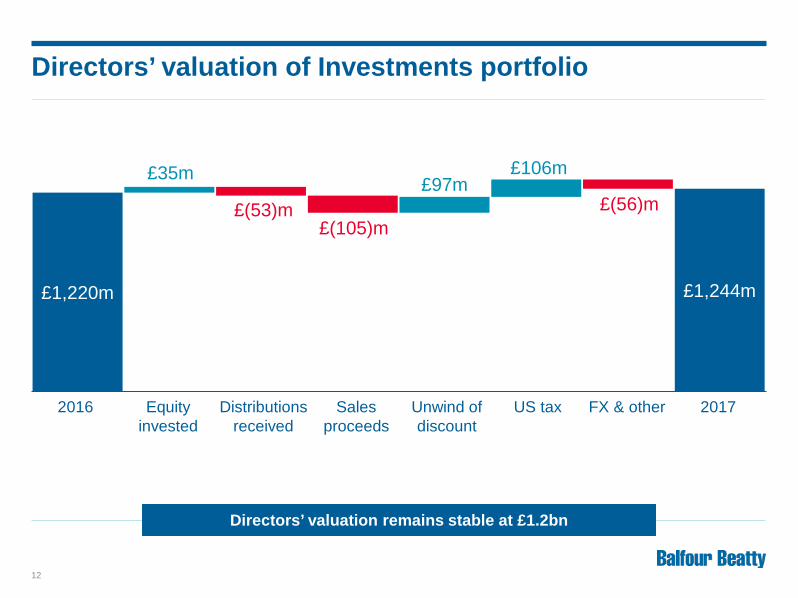
Directors’ valuation of Investments portfolio
12
£1,220m £1,220 £1,202 £1,097 £1,097 £1,194
£35m
£(53)m £(105)m
£97m £106m
£(56)m
£1,244m
Unwind of discount
FX & other 2016 Equity invested
Distributions received
Sales proceeds
2017 US tax
Directors’ valuation remains stable at £1.2bn

Bid in 2014
Delays caused by utilities and weather throughout the project
Project completion expected summer 2018
Cash outflow in the range announced 15 January 2018
– Balfour Beatty’s 50% obligation c. £105m to £120m
As a result of Carillion’s liquidation, a one-off, non-underlying charge of £44m taken in 2017
Aberdeen Western Peripheral Route (AWPR)
13
Project focus remains on completion

* excluding infrastructure concessions
Full year cash flow
14
£m 2017 2016
Operating cash flows 39 (58)
Working capital inflow/(outflow) 27 (48)
Pension deficit payments (25) (41)
Cash generated from/(used in) operations 41 (147)
Infrastructure Investments
Disposal proceeds 105 189
New investments (35) (65)
Other 51 33
Cash inflow 162 10
Opening net cash* 173 163
Closing net cash* 335 173
£m 2017 2016
Working capital
Inventories & WIP (12) 42
Construction contract balances 7 36
Trade & other payables (92) (60)
Trade & other receivables 95 (134)
Provisions 29 68
Working capital inflow/(outflow) 27 (48)
Performance
Average net cash £42m (2016: £46m net debt) Maintained strong working capital position
Cash is our compass

15
Group balance sheet
£m 2017 2016
Goodwill and intangible assets 1,155 1,162
Working capital (888) (894)
Net cash (excluding infrastructure concessions) 335 173
Investments in joint ventures and associates 531 628
PPP financial assets 163 163
Infrastructure concessions – non-recourse net debt (305) (233)
Retirement benefit assets/(liabilities) 32 (231)
Other assets & liabilities 33 (11)
Equity holders’ funds 1,056 757
One of the strongest balance sheets in the sector

Leo Quinn Group Chief Executive

Build to Last
17
Platform to underpin future profitable growth

-700
-500
-300
-100
100
300
Dec Mar Jun Sept Dec
2016
2017
2014*
2015
Build to Last
18
Capabilities to capitalise on rising infrastructure tide
Lean: Cumulative annual cash flow+
£m
* adjusting for the sale of Parsons Brinckerhoff + includes other disposals
Expert: UK voluntary attrition moving annual average
Trusted: Customer satisfaction – DWWSWWD
75%
80%
85%
90%
95%
2015 2016 2017
Safe: Lost Time Injury Rate˄
0
0.1
0.2
0.3
0.4
2014 2015 2016 2017˄ excluding international joint ventures
0% 2% 4% 6% 8% 10% 12% 14% 16% 18%
Jan-15
Jan-16
Jan-17
Jan-18

Project: M25 Orbital Road Utilise favourable construction working capital
Project finance makes return on capital employed
Enhanced returns when Investments, Construction and Services deliver as one
Optimise value through the disposal of operational assets, whilst also continuing to invest in new opportunities
Cash Out: Equity invested in new opportunities
Cash In: Distributions received and sale proceeds
Infrastructure Investments model
19
Infrastructure Investments underpins balance sheet strength
DBFO contract awarded 2009 at c.£6bn Three partial sales totalling 25% of
Connect Plus M25 for £207m Value represents 25% premium on
previous market transactions Retained 15% stake in asset and full share
of 25 year Connect Plus Services maintenance contract

First Balfour Beatty US PPP project
Project: LAX Automated People Mover 2.25 miles elevated trainlines, six stations,
30 million passengers a year
$1.95bn DBFO (30% construction & 27% equity partner)
Experienced four-way joint venture construction team
Plays to Balfour Beatty strengths:
– Project financing – Core geography – Capitalises on Building, Civils and
Rail expertise
Infrastructure Investments case study
20

Infrastructure Investments portfolio by sector
21
Directors’ valuation by geography
* excluding BBIP ^ UK includes Singapore
49% 51%
Directors’ valuation by sector (£m) 2017 2014*
Roads 290 467 Healthcare 136 225 Other PFI 28 116 Non-PFI 182 135 UK total^ 636 943 US military housing 497 322 US other 111 15 North America total 608 337 Total 1,244 1,280
Directors’ valuation by phase (£m) 2017 2014*
Operations 1,089 1,128 Construction 130 137 Preferred bidder 25 15 Total 1,244 1,280
US PPP market demand strong

Positive infrastructure markets
22
US Positive infrastructure
& buildings market
UK Positive infrastructure
market
Far East
UK
Construction revenue by geography
Fixing America’s Surface Transportation (FAST) Act
US$305bn Nationwide
transportation bonds
> US$200bn
California education bonds
US$35bn
HS2
£56bn
Hinkley Point C
£20bn
Highways England
£35bn
Heathrow third runway
£14bn
HK International airport third runway
HK$140bn
Central Kowloon Route
HK$16bn
Rail Circle Line Singapore
SG$1.5bn
US
55%
30%
15%
Bidding selectively in growing markets
Far East Positive infrastructure
market

23
£0bn
£5bn
£10bn
£15bn
£20bn
£25bn
£30bn
2018 2019 2020 2021 2022 2023 2024
Network Rail
Crossrail 1 Crossrail 2
HS2
TfL
Heathrow
Highways England
Water
Energy (incl. Nuclear)
Source: Network Rail
UK infrastructure expenditure 2018 – 2024
Significant infrastructure investment market

The Four H’s: Case study – HS2 opportunity
24
Planned HS2 phases
Decade of opportunity for which Balfour Beatty is uniquely positioned
Contract description
Total opportunity Detail
Balfour Beatty expertise
Civils Rail Power M&E
Phas
e 1
(aw
arde
d) Lot N1 main works
civils* £1.3 billion Awarded
Lot N2 main works civils* £1.2 billion Awarded
Phas
e 1
(futu
re)
Old Oak Common station
Approx. £1.3 billion
Award expected in 2018
Rail systems, Lots 1-3 and 6
Approx. £2.5 billion
Award expected in 2019
Birmingham stations
Approx. £1.3 billion
Award expected in 2020
Phas
e 2a
Birmingham to Crewe, all lots
Approx. £3.7 billion
Award expected in 2019
* published 7 July 2017

Phase One (2015-16) Targets achieved: solid foundations for sustainable, profitable growth
Phase Two (2017-18) Earnings-based businesses: reach industry-standard margins
– UK Construction: 2%-3% – US Construction: 1%-2% – Support Services: 3%-5%
Asset-based business: portfolio managed to maximise value
Phase Three (2019+) Market-leading strengths and performance
Build to Last outlook
25
On track for industry-standard margins in the second half of 2018

Strong operational controls and strong balance sheet Build to Last transforming Balfour Beatty
Proven leadership team Building bench strength in depth across the organisation
Focused strategy Sustainable profitable growth
Positive market outlook Capitalising on expert infrastructure capabilities
Balfour Beatty today
26
Strong platform for industry-leading performance
Appendix

Cash is our compass Average net cash £42m (2016: £46m net debt)
Year end net cash £335m (2016: £173m)
Cost out Build to Last Phase One: £123m cost out
2017: additional £30m cost out
Continuing to invest in technology to drive performance and efficiencies
Build to Last – LEAN
28
(700)(600)(500)(400)(300)(200)(100)
-100200300
Dec Mar Jun Sept Dec
2016
2017
2014*
2015
Cumulative annual cash flow+
* adjusting for the sale of Parsons Brinckerhoff + includes other disposals
Cash in, cost out: improve every day

Creating a great place to work Continue to strengthen leadership
– Rail, Power T&D, Gas and Water under one leader in UK & Ireland – Two executive leaders promoted for Buildings and Civils
operations in US
Continuously investing in future capabilities – Over 150 former Carillion staff with key capabilities employed – 5.3% of UK workforce in ‘earn and learn’ roles – Recruited 124 apprentices, 93 graduates and 35 trainees in 2017 – Investing in infrastructure to manage and develop our people
60% Group employee engagement score (2016: 58%)
Build to Last – EXPERT
29
.35 8%
10%
12%
14%
16%
Jan-15 Jan-16 Jan-17 Jan-18
Recruiting, training and retaining the highest calibre workforce
UK voluntary attrition (moving annual average)

.35
Build to Last – TRUSTED
30
Doing What We Say We Will Do
75%80%85%90%95%
2015 2016 2017
Customer satisfaction rate
Continuing to deliver on promises Governance and controls providing a transparent and
disciplined contracting framework
– Over 1,000 projects utilising Digital Briefcase – Project on a Page fully embedded within ERP system – Winning new business matched to capabilities with appropriate
risk-reward – Higher quality, lower risk order book
Management focused on quality of the order book
Group customer satisfaction increased to 94% (2016: 91%)

.35
Build to Last – SAFE
31
* excluding international joint ventures
00.10.20.30.4
2014 2015 2016 2017
Balfour Beatty Group Lost Time Injury Rate*
Creating a safer culture Group Lost Time Injury Rate* improved to 0.17 (2016: 0.22)
Observation rates continue to increase – sign of engagement
Making Safety Personal – a pause for thought – Over 24,000 employees and supply chain operatives attended
Making Safety Personal training – Mates in Mind mental health training courses delivered to 1,800
employees over six months
25% by 2025 – reinforcing commitment to Safety by Design
Zero Harm culture

FY 2016 FY 2017 FY 2016 FY 2017 FY 2016 FY 2017
UK Construction US Construction Gammon Support Services
£3.2bn £3.1bn £3.3bn £3.4bn
£4.9bn
32
Order book position compared with prior year
Total at FY 2017 £11.4bn Total at FY 2016 £12.4bn˄
13-24 months 0-12 months 24 months+
£5.9bn
# re-presented to include Rail construction as part of UK Construction ˄ re-presented to classify the Group’s 49% interests in Dutco Balfour Beatty LLC and BK Gulf LLC as discontinued operations
#

Pensions – balance sheet movement
33
£(128)m £(146)m £(231)m
£32m
£27m
£242m
£(6)m
2014 2015 2016 Employercontributions
Net actuarialgains
Othermovements
2017
0.7% (0.7)% 0.65% Real discount rate (0.6)%

Working capital – Group
34
(9.9)%
(13.9)% (12.8)% (13.2)% (13.1)% (13.1)% (13.2)% (16)%
(12)%
(8)%
(4)%
0
£(1,200)m
£(1,000)m
£(800)m
£(600)m
£(400)m
£(200)m
0Dec 14 Jun 15 Dec 15 Jun 16 Dec 16 Jun 17 Dec 17
Period end working capital Period end working capital as % revenue
from continuing operations, including non-underlying items ¹ debtor days include current trade receivables. Creditor days include current trade and other payables, excluding accruals
46 29
45 27
52 30 Debtor days¹
Creditor days¹ 51 34
53 28 37
53 28 46

Working capital – Construction Services
35
(12.2)%
(16.8)% (16.6)% (18.2)%
(14.4)% (14.2)% (15.3)% (20)%
(16)%
(12)%
(8)%
(4)%
0
£(1,200)m
£(1,000)m
£(800)m
£(600)m
£(400)m
£(200)m
0Dec 14 Jun 15 Dec 15 Jun 16 Dec 16 Jun 17 Dec 17
Period end working capital Period end working capital as % revenue
from continuing operations, including non-underlying items

36
Net interest cost
£m 2017 2016
Subordinated debt interest receivable 26 Interest on PPP financial assets 11 Interest on non-recourse borrowings (13) 24 26 Net finance costs – pension schemes (6) (4) Other interest receivable 4 Other interest payable (14) (10) (9) US private placement (13) (13) Gain on foreign currency deposits 1 19 Convertible bonds - finance cost (5) - accretion (7) (12) (12) Preference shares - finance cost (12) - accretion (3) (15) (14) Net interest cost (31) (7)

Non-underlying items
37
£m 2017 2016 Trading - ES & Rail Germany - (5) Impairment & amortisation - Amortisation of acquired intangibles (9) (9) - Land impairment relating to Blackpool Airport - (3) Restructuring & reorganisation - Build to Last transformation costs (12) (14) Disposals and other - Gain on disposal of Heery International Inc. 18 - - Loss on disposal of Blackpool Airport (1) - - Gains on disposal of SSL, BBIP and Rail Germany - 8 - Additional loss on the AWPR contract as a result of Carillion’s liquidation (44) - - Release of Trans4m provisions - 9 - Pension fund settlement gain - 1 - Reassessment of industrial disease related liabilities - (14) - Revised legal guidelines and settlements - (25) Tax - UK deferred tax assets 34 - - Reduced US Federal corporate income tax rate 32 - - Tax on other items 2 4 Non-underlying items after tax 20 (48) Non-underlying profit from discontinued operations 5 24 Total non-underlying items 25 (24)

Financial history
38
-£200m
-£100m
£0m
£100m
£200m
£300m
£400m
-£6bn
-£4bn
-£2bn
£0bn
£2bn
£4bn
£6bn
£8bn
£10bn
£12bn
2000 2002 2004 2006 2008 2010 2012 2014 2016
Revenue (LHS) Profit from operations (RHS) Ordinary dividend (RHS)
45 Acquisitions
450% Increase in revenue
£94m Average ordinary dividend (2011-2014)
£10m Average ordinary dividend (2015-2017)

US Regional Construction
39
Texas Florida
West
Carolinas & Georgia Mid Atlantic
